43
14-1 Copyright 2000 by H arcourt, Inc. CHAPTER 14 BANK MANAGEMENT AND PROFITABILITY
| Date post: | 29-Dec-2015 |
| Category: |
Documents |
| Upload: | walter-newton |
| View: | 220 times |
| Download: | 0 times |

14-1Copyright 2000 by Harcourt, Inc.
CHAPTER 14
BANK MANAGEMENT
AND PROFITABILITY
14-2Copyright 2000 by Harcourt, Inc.
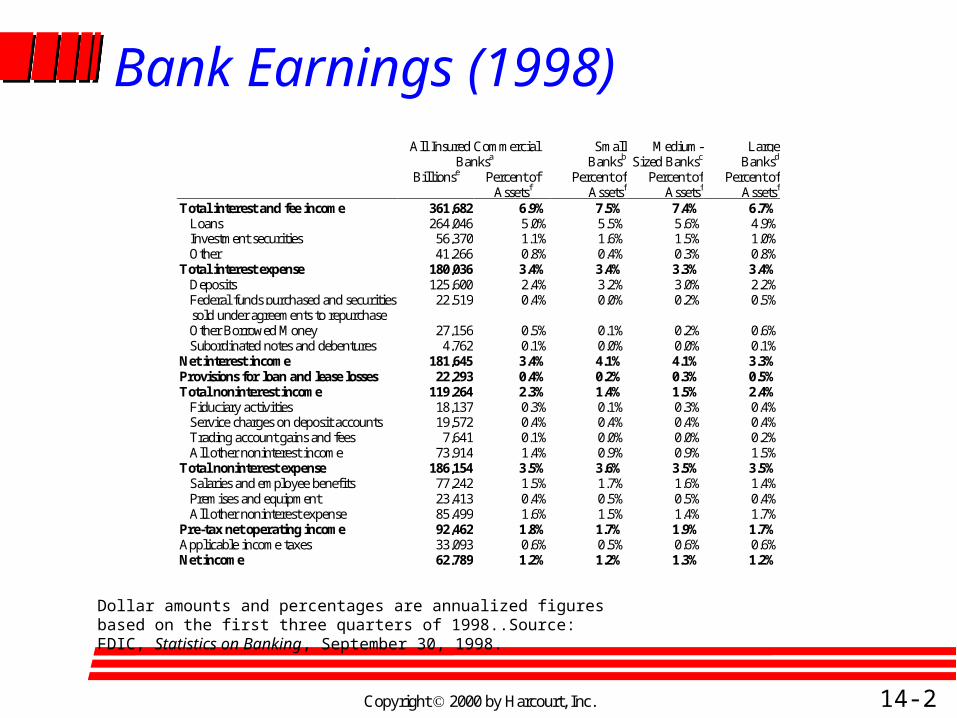
Bank Earnings (1998)All Insured Commercial
BanksaSmall
BanksbMedium-
Sized BankscLarge
Banksd
Billionse Percent ofAssetsf
Percent ofAssetsf
Percent ofAssetsf
Percent ofAssetsf
Total interest and fee income 361,682 6.9% 7.5% 7.4% 6.7% Loans 264,046 5.0% 5.5% 5.6% 4.9% Investment securities 56,370 1.1% 1.6% 1.5% 1.0% Other 41,266 0.8% 0.4% 0.3% 0.8%Total interest expense 180,036 3.4% 3.4% 3.3% 3.4% Deposits 125,600 2.4% 3.2% 3.0% 2.2% Federal funds purchased and securities
sold under agreements to repurchase22,519 0.4% 0.0% 0.2% 0.5%
Other Borrowed Money 27,156 0.5% 0.1% 0.2% 0.6% Subordinated notes and debentures 4,762 0.1% 0.0% 0.0% 0.1%Net interest income 181,645 3.4% 4.1% 4.1% 3.3%Provisions for loan and lease losses 22,293 0.4% 0.2% 0.3% 0.5%Total noninterest income 119,264 2.3% 1.4% 1.5% 2.4% Fiduciary activities 18,137 0.3% 0.1% 0.3% 0.4% Service charges on deposit accounts 19,572 0.4% 0.4% 0.4% 0.4% Trading account gains and fees 7,641 0.1% 0.0% 0.0% 0.2% All other noninterest income 73,914 1.4% 0.9% 0.9% 1.5%Total noninterest expense 186,154 3.5% 3.6% 3.5% 3.5% Salaries and employee benefits 77,242 1.5% 1.7% 1.6% 1.4% Premises and equipment 23,413 0.4% 0.5% 0.5% 0.4% All other noninterest expense 85,499 1.6% 1.5% 1.4% 1.7%Pre-tax net operating income 92,462 1.8% 1.7% 1.9% 1.7%Applicable income taxes 33,093 0.6% 0.5% 0.6% 0.6%Net income 62,789 1.2% 1.2% 1.3% 1.2%
Dollar amounts and percentages are annualized figures based on the first three quarters of 1998..Source: FDIC, Statistics on Banking, September 30, 1998.

14-3Copyright 2000 by Harcourt, Inc.
Bank Earnings
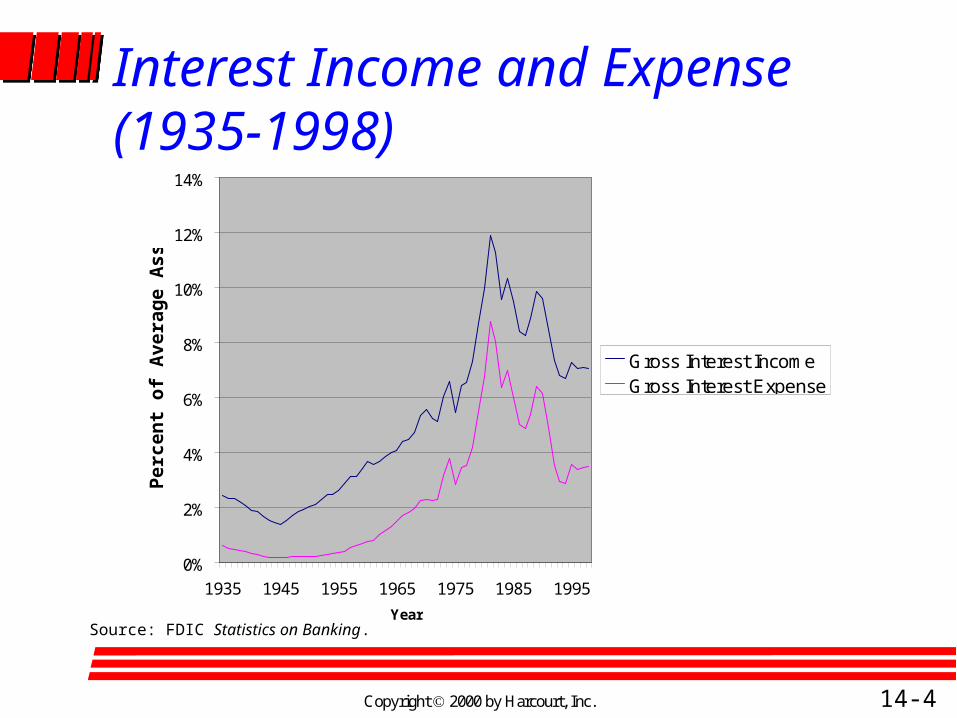
Interest and fees on loans is the major source of income for commercial banks.
Interest paid on deposits is the largest expense item.
Both of the above follow market rates of interest. Net interest income represents the difference
between gross interest income and gross interest expense.
14-4Copyright 2000 by Harcourt, Inc.
Interest Income and Expense (1935-1998)
0%
2%
4%
6%
8%
10%
12%
14%
1935 1945 1955 1965 1975 1985 1995
Year
Per
cen
t o
f Ave
rag
e A
sset
s
Gross Interest IncomeGross Interest Expense
Source: FDIC Statistics on Banking.
14-5Copyright 2000 by Harcourt, Inc.
Bank Earnings (continued)
The provision for loan losses is an expense item that adds to a bank’s loan loss reserve (a contra-asset account).
Banks increase their provision for loan losses in anticipation of credit quality problems in their loan portfolio.

14-6Copyright 2000 by Harcourt, Inc.
Provision for Loan Losses (1935-1998)
0.0%
0.5%
1.0%
1.5%
2.0%
1935 1945 1955 1965 1975 1985 1995
Per
cen
t o
f Ave
rag
e A
sset
s
Provision for LoanLosses
Source: FDIC Statistics on Banking.

14-7Copyright 2000 by Harcourt, Inc.
Bank Earnings (concluded)
Noninterest income includes fees and service charges. This source of revenue has grown significantly in importance.
Noninterest expense includes salary expenditures. These expenses have also grown in recent years.

14-8Copyright 2000 by Harcourt, Inc.
Noninterest Income and Expense (1935-1998)
0.0%
0.5%
1.0%
1.5%
2.0%
2.5%
3.0%
3.5%
4.0%
4.5%
1935 1945 1955 1965 1975 1985 1995
Per
cen
t o
f Ave
rag
e A
sset
s
Noninterest ExpenseNoninterest Income
Source: FDIC Statistics on Banking.

14-9Copyright 2000 by Harcourt, Inc.
Bank Performance
Trends in profitability can be assessed by examining return on average assets(net income / average total assets) over time.
Another measure of profitability is return on average equity.
In the mid- and late-1990s, bank profitability improved significantly.

14-10Copyright 2000 by Harcourt, Inc.
ROAA and ROAE (1935-1998)
0.0%
0.2%
0.4%
0.6%
0.8%
1.0%
1.2%
1.4%
1935 1945 1955 1965 1975 1985 1995
Ret
urn
on
Ave
rag
e A
sset
s
0.0%
2.0%
4.0%
6.0%
8.0%
10.0%
12.0%
14.0%
16.0%
18.0%
Ret
urn
on
Ave
rag
e E
qu
ity
ROAA ROAE
Source: FDIC Statistics on Banking
14-11Copyright 2000 by Harcourt, Inc.
Banking Dilemma: Profitability Versus Safety One way for a bank to increase expected profits
is to take on more risk. However, this can jeopardize bank safety.
For a bank to survive, it must balance the demands of three constituencies: shareholders, depositors, and regulators, each with their own interest in profitability and safety.
14-12Copyright 2000 by Harcourt, Inc.
Banking Dilemma: Profitability Versus Safety (continued) Bank Solvency -- Maintaining the momentum of a
going concern, attracting customers and financing in the market.– A firm is insolvent when the value of its liabilities
exceeds the value of its assets.– Banks have relatively low capital/asset positions
and high quality assets. Bank Liquidity -- the ability to accommodate
deposit withdrawals, loan requests, and pay off other liabilities as they come due.
14-13Copyright 2000 by Harcourt, Inc.
Banking Dilemma: Profitability Versus Safety (concluded) Banks supply liquidity to customers.
– Depositors store their liquidity in banks; loan customers come to the bank to borrow liquidity.
– The bank supplies liquidity from two sources: sale of assets and borrowing.

14-14Copyright 2000 by Harcourt, Inc.
The Dilemma: A bank must successfully balance profitability on one hand and liquidity and solvency on the other.
Bank failure can result from the depletion of capital caused by losses on loans or securities -- from over-aggressive profit seeking. But a bank that only invests in high-quality assets may not be profitable.
Failure can also occur if a bank cannot meet the liquidity demands of its depositors -- a run on the bank occurs. If assets are profitable, but illiquid, the bank also has a problem.
Bank insolvency very often leads to bank illiquidity.

14-15Copyright 2000 by Harcourt, Inc.
Profitability Goal VersusLiquidity and Solvency
14-16Copyright 2000 by Harcourt, Inc.
Liquidity Management
Banks rely on both asset sources of liquidity and liability sources of liquidity to meet the demands for liquidity.
The demands for liquidity include accommodating deposit withdrawals, paying other liabilities as they come due, and accommodating loan requests.
14-17Copyright 2000 by Harcourt, Inc.
Asset Management (classifies bank assets from very liquid/low profitability to very illiquid/profitable). Primary Reserves are noninterest bearing,
extremely liquid bank assets. Secondary Reserves are high-quality, short-term,
marketable earning assets. Bank Loans are made after absolute liquidity
needs are met. After loan demand is satisfied, funds are allocated
to Income Investments that provide income, reasonable safety, and some liquidity, if needed.

14-18Copyright 2000 by Harcourt, Inc.
Asset Management (concluded)
The bank must manage its assets to provide a compromise of liquidity and profitability.
The primary and secondary reserve level is related to:– deposit variability.– other sources of liquidity.– bank regulations - permissible areas of
investment.– risk posture that bank management will assume.

14-19Copyright 2000 by Harcourt, Inc.
Summary of Asset Management Strategy
CATEGORY AND TYPE
OF ASSET PURPOSE LIQUIDITY YIELD
Primary ReservesVault cashDeposits at the FedDeposits at other banks
Immediately available funds Highest None
Secondary ReservesTreasury billsFederal Funds soldShort-term agency securities
Easily marketable funds High Low
Bank LoansBusiness loansConsumer loansReal estate loansAgriculture loans
Income Lowest Highest
InvestmentsTreasury securitiesAgency securitiesMunicipal bonds
Income when safe loans areunavailable and tax advantages
Medium Medium
To maintain adequate liquidity, banks hold both primary and secondary reserves. Secondary reserves allow banks to earn someinterest income while still meeting their liquidity needs.

14-20Copyright 2000 by Harcourt, Inc.
Liability Management (LM) -- assumes that the bank can borrow its liquidity needs.
Liability levels (borrowing) may be adjusted to loan (asset) needs or deposit variability.
LM assumes that the bank may raise sufficient amounts of funds by paying the market rate.
Bank liability liquidity sources include the bank's "borrowing" liability category.
LM supplements asset management, but does not replace it.

14-21Copyright 2000 by Harcourt, Inc.
Functions of the Bank Capital
Absorb losses on assets (loans) and limit the risk of insolvency.
Maintain confidence in the banking system. Provide protection to uninsured depositors and
creditors. Act as a source of funds and serve as a leverage
base to raise depositor funds.

14-22Copyright 2000 by Harcourt, Inc.
Trends in Bank Capital
Capital levels declined in the late 1960s and early 1970s as banks’ assets grew faster than their capital levels.
The number of bank failures increased significantly in the 1980s.
Capital standards were increased in the mid and late 1980s in response to these failures.
By the late 1990s, bank capital ratios have increased substantially.

14-23Copyright 2000 by Harcourt, Inc.
Bank Capital Ratios (1934-1998)
Source: FDIC Statistics on Banking.
0.0%
2.0%
4.0%
6.0%
8.0%
10.0%
12.0%
14.0%
1935 1945 1955 1965 1975 1985 1995
Tota
l E
qu
ity
Cap
ital
to
To
tal A
sset
s

14-24Copyright 2000 by Harcourt, Inc.
A Definition of Bank Capital
As bank capital requirements were increased, regulators also implemented risk-based capital standards.
Capital levels are measured against risk-weighted assets. Risk-weighted assets is a measure of total assets that weighs high-risk assets more heavily than low-risk assets.
The purpose is to require high-risk banks to hold more capital than low-risk banks.

14-25Copyright 2000 by Harcourt, Inc.
A Definition of Bank Capital (continued) The current standards define two forms of capital:
– Tier 1 capital includes common stock, common surplus, retained earnings, noncumulative perpetual preferred stock, minority interest in consolidated subsidiaries, minus goodwill and other intangible assets.
– Tier 2 capital includes cumulative perpetual preferred stock, loan loss reserves, mandatory convertible debt, and subordinated notes and debentures.
14-26Copyright 2000 by Harcourt, Inc.
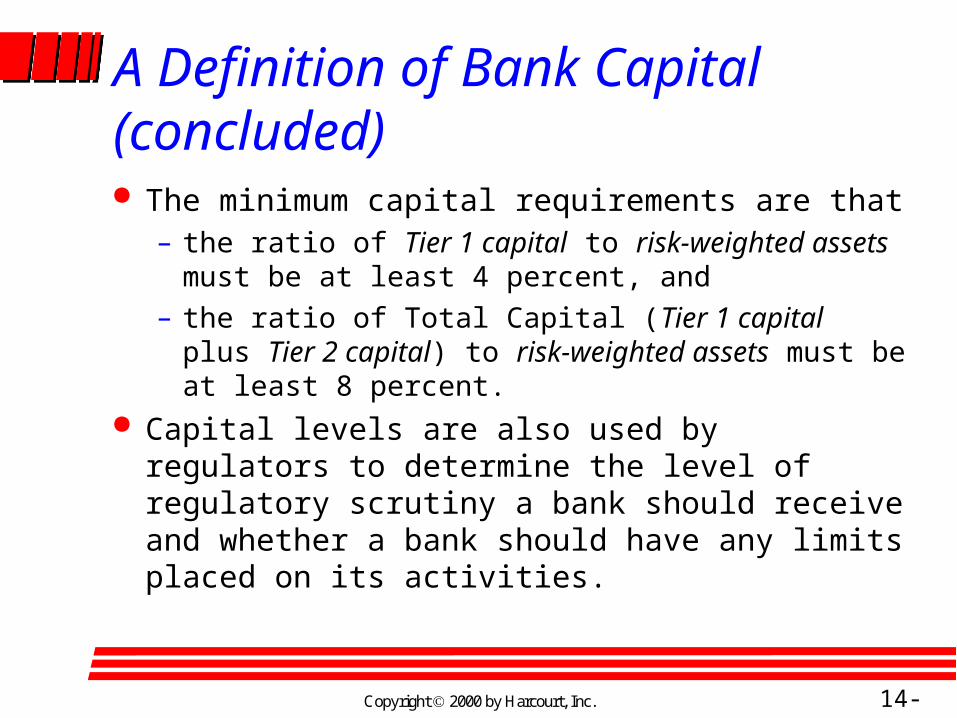
A Definition of Bank Capital (concluded) The minimum capital requirements are that
– the ratio of Tier 1 capital to risk-weighted assets must be at least 4 percent, and
– the ratio of Total Capital (Tier 1 capital plus Tier 2 capital) to risk-weighted assets must be at least 8 percent.
Capital levels are also used by regulators to determine the level of regulatory scrutiny a bank should receive and whether a bank should have any limits placed on its activities.

14-27Copyright 2000 by Harcourt, Inc.
Risk Weights Used in Calculating Risk-Weighted AssetsCategory 1--Zero Percent WeightCashBalances due from Federal Reserve Banks and claims on central banks in other OECD
countriesa
U.S. Treasury and Government agency securities and claims on or unconditionally guaranteedby OECD central governments
Federal Reserve stockClaims collateralized by cash on deposit or by securities issued or guaranteed by OECD central
governments or U.S. government agencies
Category 2--20 Percent WeightCash items in the process of collectionAll claims on or guaranteed by U.S. depository institutions and banks in OECD countriesGeneral obligation bonds of state and local governmentsPortions of claims secured by U.S. government agency securities or OECD central government
obligations that do not qualify for a zero percent weightLoans or other claims conditionally guaranteed by the U.S. governmentSecurities and other claims on U.S. government-sponsored agencies
14-28Copyright 2000 by Harcourt, Inc.
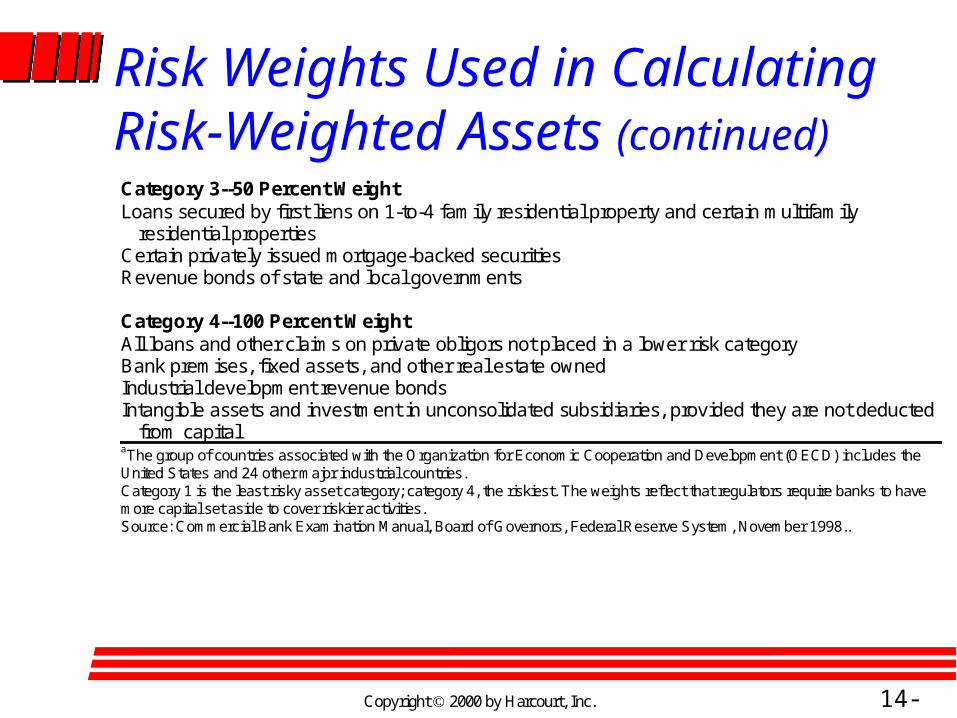
Risk Weights Used in Calculating Risk-Weighted Assets (continued)Category 3--50 Percent WeightLoans secured by first liens on 1-to-4 family residential property and certain multifamily
residential propertiesCertain privately issued mortgage-backed securitiesRevenue bonds of state and local governments
Category 4--100 Percent WeightAll loans and other claims on private obligors not placed in a lower risk categoryBank premises, fixed assets, and other real estate ownedIndustrial development revenue bondsIntangible assets and investment in unconsolidated subsidiaries, provided they are not deducted
from capitalaThe group of countries associated with the Organization for Economic Cooperation and Development (OECD) includes theUnited States and 24 other major industrial countries.Category 1 is the least risky asset category; category 4, the riskiest. The weights reflect that regulators require banks to havemore capital set aside to cover riskier activities.Source: Commercial Bank Examination Manual, Board of Governors, Federal Reserve System, November 1998..

14-29Copyright 2000 by Harcourt, Inc.
Risk Weights Used in Calculating Risk-Weighted Assets (concluded)
RISK WEIGHTS AND CONVERSION RATIOS FOR SELECTED OFF-BALANCE-SHEET ACTIVITIES
Weight Conversion Factor Off-Balance-Sheet Item0% 0 Short-term loan commitments50% 0a Short-term interest rate derivatives50% 0.005a Long-term interest rate derivatives50% 0.01a Short-term foreign exchange derivatives50% 0.05a Long-term foreign exchange derivaitves
100% 0.2 Commercial letters of credit100% 0.5 Long-term loan commitments100% 1 Standby letters of credit
Long-term off-balance-sheet activities require more capital than short-term activities. This is reflected in the weights associated with long-term activities.
aIn addition to holding capital against potential on-balance-sheet exposures as measured by conversion factors, banks must also hold capital against the current value (replacement cost) of derivative securities.
Source: Commercial Bank Examination Manual, Board of Governors, Federal Reserve System, November 1998.

14-30Copyright 2000 by Harcourt, Inc.
Capital Guidelines forRegulatory Action
CAPITAL CATEGORIES
TOTAL RISK-BASED
CAPITAL RATIO
TIER 1 RISK-BASED
CAPITAL RATIO LEVERAGE RATIO
Well capitalizeda 10 percentor greater
AND 10 percentor greater
AND 5 percentor greater
Adequately capitalized
8 percentor greater
AND 4 percentor greater
AND 4 percentor greater
Undercapitalized Less than8 percent
OR Less than4 percent
OR Less than4 percentb
Significantly undercapitalized
Less than6 percent
OR Less than3 percent
OR Less than3 percent
Critically undercapitalizedc
-- -- --
14-31Copyright 2000 by Harcourt, Inc.
Managing Credit Risk
The credit risk of an individual loan concerns the losses the bank will experience if the borrower does not repay the loan.
The credit risk of a bank’s loan portfolio concerns the aggregate credit risk of all the loans in the bank’s portfolio.
Banks must manage both dimensions effectively to be successful.
14-32Copyright 2000 by Harcourt, Inc.
Managing the Credit Risk of Individual Loans Begins with the lending decisions (and the 5 Cs
as discussed in Chapter 13). Requires close monitoring to identify problem
loans quickly. The goal is to recover as much as possible once
a problem loan is identified.
14-33Copyright 2000 by Harcourt, Inc.
Managing the Credit Risk of Loan Portfolios Internal Credit Risk Ratings assigned to
individual loans are used to– identify problem loans,– determine the adequacy of loan loss reserves, and– loan pricing and profitability analysis.
Loan Portfolio Analysis is used to ensure that banks are well diversified.– Concentration ratios measure the percentage of
loans allocated to a given geographic location, loan type, or business type.

14-34Copyright 2000 by Harcourt, Inc.
Managing Interest Rate Risk
Gross interest income and gross interest expense have become more volatile in the last 30 years. Consequently, interest rate risk has become a concern to both bank managers and bank regulators.

14-35Copyright 2000 by Harcourt, Inc.
Net Cash Flow from Funding a $1,000 Loan with a 3-Month CD and a 6-Month CD (Assuming No Change in Interest Rates)
ELAPSED TIME (MONTHS)ACTION 0 3 6 9 12Cash InflowsIssue 3-month CD $500 $506 $513 $519(Percent) (5) (5) (5) (5)Issue 6-month CD 500 515(Percent) (6) (6)1-year Loan $1,090
Total cash inflow $1,000 $506 $1,028 $519 $1,090
Cash Outflows1-year Loan 1,000(Percent) (9)Pay off 506 513 519 5253-month CDPay off 515 5306-month CD
Total cash outflow $1,000 $506 $1,028 $519 $1,055Net cash flow = $0 $0 $0 $0 $35Total cash inflow-Total cash outflow
14-36Copyright 2000 by Harcourt, Inc.
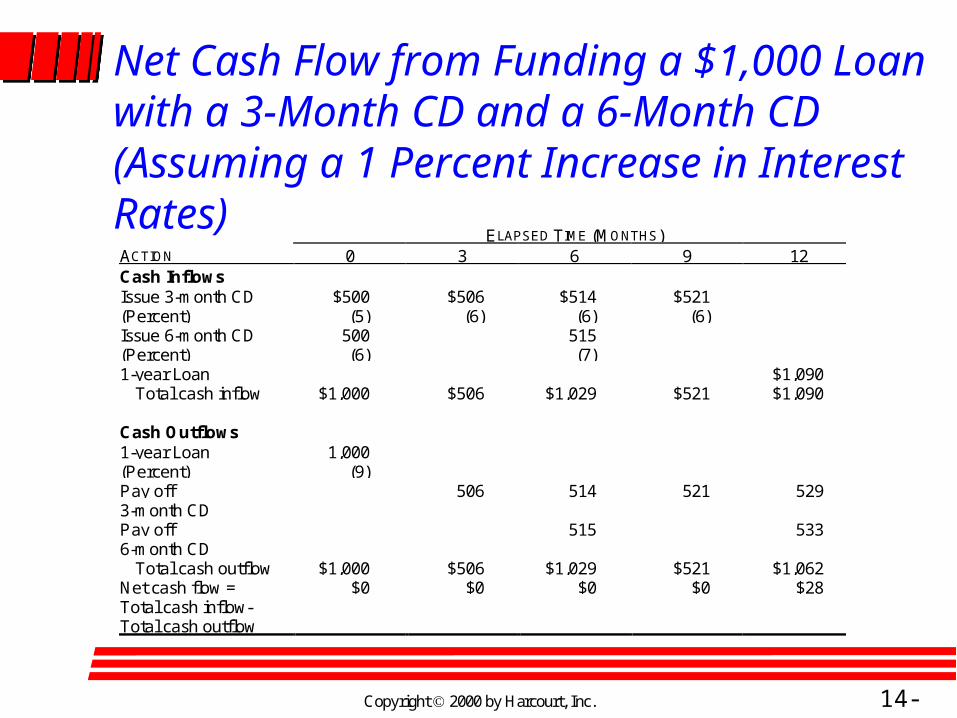
Net Cash Flow from Funding a $1,000 Loan with a 3-Month CD and a 6-Month CD (Assuming a 1 Percent Increase in Interest Rates)
ELAPSED TIME (MONTHS)ACTION 0 3 6 9 12Cash InflowsIssue 3-month CD $500 $506 $514 $521(Percent) (5) (6) (6) (6)Issue 6-month CD 500 515(Percent) (6) (7)1-year Loan $1,090
Total cash inflow $1,000 $506 $1,029 $521 $1,090
Cash Outflows1-year Loan 1,000(Percent) (9)Pay off 506 514 521 5293-month CDPay off 515 5336-month CD
Total cash outflow $1,000 $506 $1,029 $521 $1,062Net cash flow = $0 $0 $0 $0 $28Total cash inflow-Total cash outflow

14-37Copyright 2000 by Harcourt, Inc.
Measuring Interest Rate Risk: Maturity GAP Analysis Assets and liabilities which can be repriced
(change the earnings/expense rate in a specified period of time) are identified as rate sensitive.
A bank's GAP for a period of time is computed by subtracting rate sensitive liabilities (RSL) from rate sensitive assets (RSA).
14-38Copyright 2000 by Harcourt, Inc.
GAP = RSA - RSL
Positive GAP = RSA > RSL– Net interest income will decline if interest rates fall
in the GAP period.– More assets than liabilities will be repriced
downward if interest rates decline, thus reducing net interest income.
– What happens if interest rates increase?
14-39Copyright 2000 by Harcourt, Inc.
GAP = RSA - RSL (concluded)
Negative GAP = RSA < RSL– Net interest income will decline if interest rates
increase in the GAP period.– More liabilities than assets will be repriced upward
if interest rates increase, thus reducing net interest income.
14-40Copyright 2000 by Harcourt, Inc.
Managing Interest Rate Risk: Duration GAP Analysis
Simple maturity matching, discussed above, may not produce the same cash flow or repricing timing in any period.
Duration GAP analysis matches cash flows and their repricing capabilities over a period of time.
The percentage change in the value of a portfolio, given a change in interest rates, is proportional to the duration of the portfolio multiplied by the change in interest rates.

14-41Copyright 2000 by Harcourt, Inc.
Managing Interest Rate Risk: Duration GAP Analysis (concluded)
– DG = duration gap
– DA = duration of assets
– DL = duration of liabilities
– MVA = market value of assets
– MVL = market value of liabilities
Duration GAPs are opposite in sign from maturity GAPs for the same risk exposure.
D D MV MV DG A L A L ( / )
14-42Copyright 2000 by Harcourt, Inc.
Techniques For Hedging Interest Rate Risk Adjustments by asset-sensitive institutions with positive
maturity GAP, negative duration GAP--hurt by decreasing interest rates– Buy financial futures--falling rates would increase value
of futures contract, offsetting negative impact of GAP situation
– Buy call options on financial futures– Swap to increase their variable-rate cash outflows and
increase their fixed-rate (long-term) cash flows– Lengthen the repricing of assets; shorten the repricing
capability of liabilities

14-43Copyright 2000 by Harcourt, Inc.
Techniques For Hedging Interest Rate Risk (concluded) Adjustments by liability-sensitive institutions with
negative maturity GAPs or positive duration GAPs--hurt by increasing interest rates– Sell financial futures--increasing rates would increase
value of futures contracts, offsetting the negative impact of GAP situation
– Buy put options on financial futures– Swap long-term, fixed-rate payments for variable-rate
payments– Shorten the repricing of assets; lengthen the repricing
capability of liabilities


