15
MARKETS – TECHNICAL ANALYSIS October 2014 Niral Shukla
| Date post: | 15-Apr-2017 |
| Category: |
Documents |
| Upload: | niral-shukla-msta |
| View: | 73 times |
| Download: | 0 times |

MARKETS – TECHNICAL ANALYSIS
October 2014 Niral Shukla
RISK ON / RISK OFF INDICATORS 1 OUT OF OUR 3 INDICATORS HAS TRIGGERED RISK OFF
2
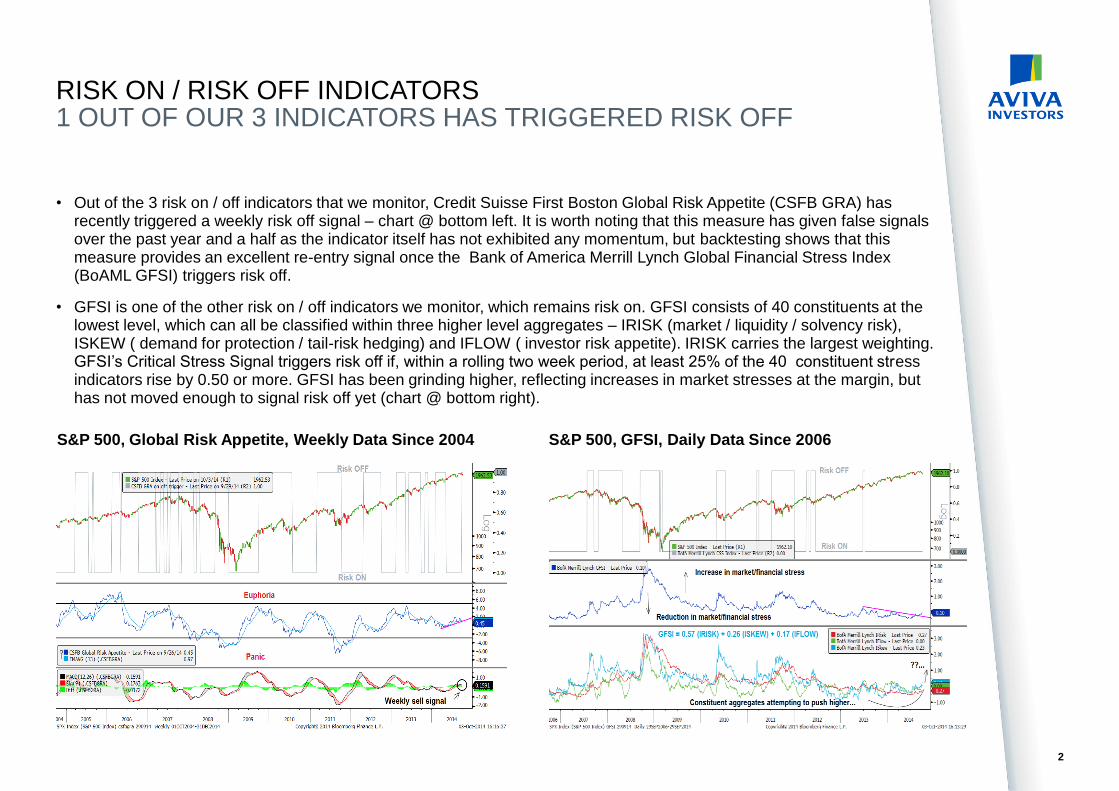
S&P 500, Global Risk Appetite, Weekly Data Since 2004 S&P 500, GFSI, Daily Data Since 2006
• Out of the 3 risk on / off indicators that we monitor, Credit Suisse First Boston Global Risk Appetite (CSFB GRA) has recently triggered a weekly risk off signal – chart @ bottom left. It is worth noting that this measure has given false signals over the past year and a half as the indicator itself has not exhibited any momentum, but backtesting shows that this measure provides an excellent re-entry signal once the Bank of America Merrill Lynch Global Financial Stress Index (BoAML GFSI) triggers risk off.
• GFSI is one of the other risk on / off indicators we monitor, which remains risk on. GFSI consists of 40 constituents at the lowest level, which can all be classified within three higher level aggregates – IRISK (market / liquidity / solvency risk), ISKEW ( demand for protection / tail-risk hedging) and IFLOW ( investor risk appetite). IRISK carries the largest weighting. GFSI’s Critical Stress Signal triggers risk off if, within a rolling two week period, at least 25% of the 40 constituent stress indicators rise by 0.50 or more. GFSI has been grinding higher, reflecting increases in market stresses at the margin, but has not moved enough to signal risk off yet (chart @ bottom right).
EQUITY COMPOSITE TREND MODELS (CTM) SUGGEST BEING NEUTRAL DM AND EM
3
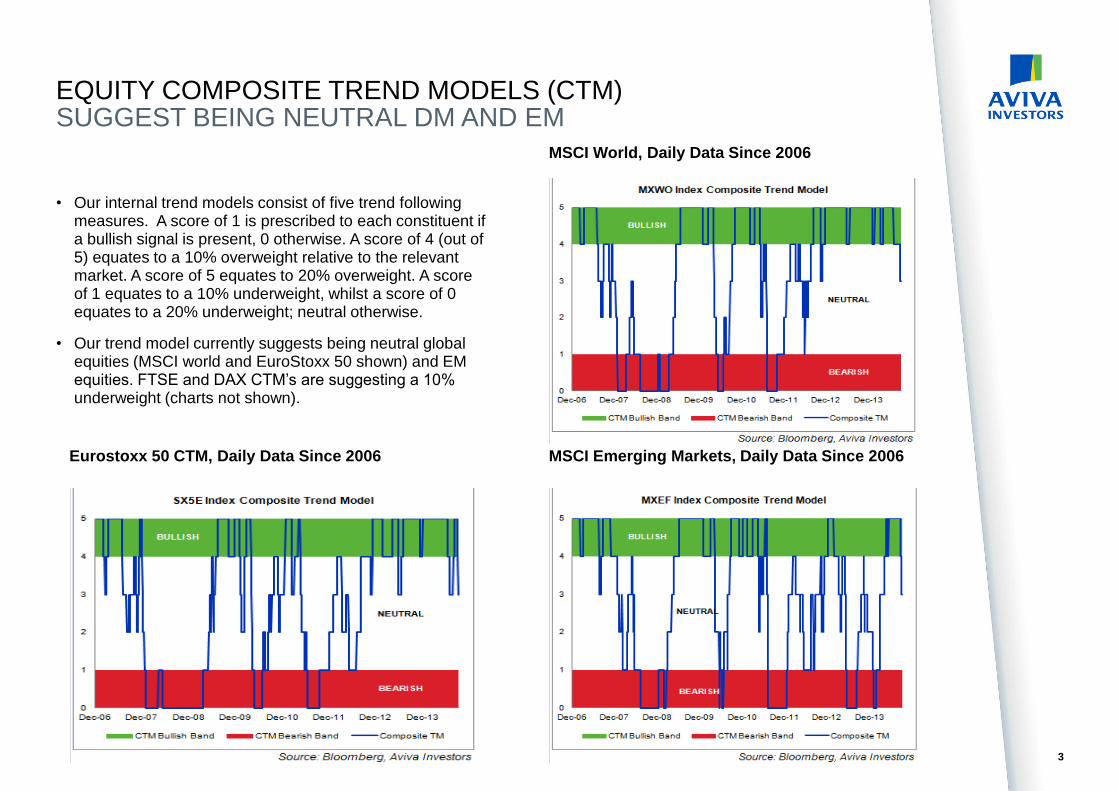
MSCI World, Daily Data Since 2006
MSCI Emerging Markets, Daily Data Since 2006
• Our internal trend models consist of five trend following measures. A score of 1 is prescribed to each constituent if a bullish signal is present, 0 otherwise. A score of 4 (out of 5) equates to a 10% overweight relative to the relevant market. A score of 5 equates to 20% overweight. A score of 1 equates to a 10% underweight, whilst a score of 0 equates to a 20% underweight; neutral otherwise.
• Our trend model currently suggests being neutral global equities (MSCI world and EuroStoxx 50 shown) and EM equities. FTSE and DAX CTM’s are suggesting a 10% underweight (charts not shown).
Eurostoxx 50 CTM, Daily Data Since 2006
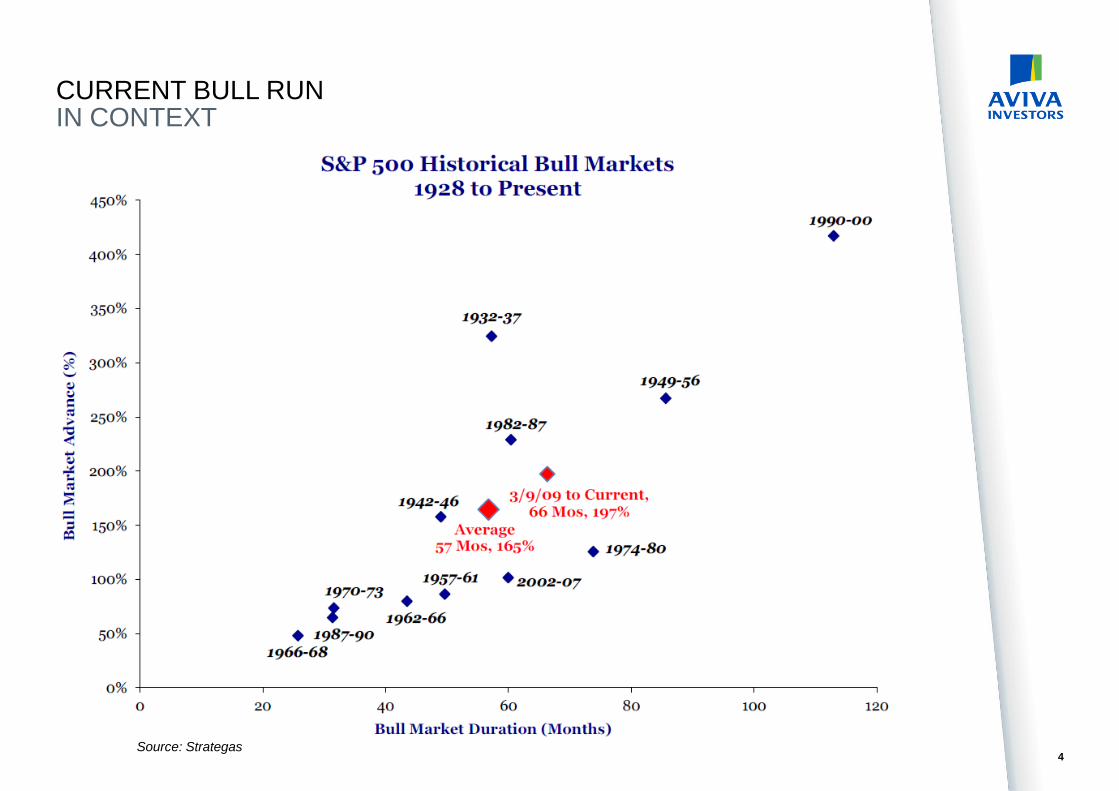
CURRENT BULL RUN IN CONTEXT
4 Source: Strategas
S&P 500 NEW HIGHS NOT CONFIRMED BY MOMENTUM AND CROSS ASSET PRICE ACTION
5
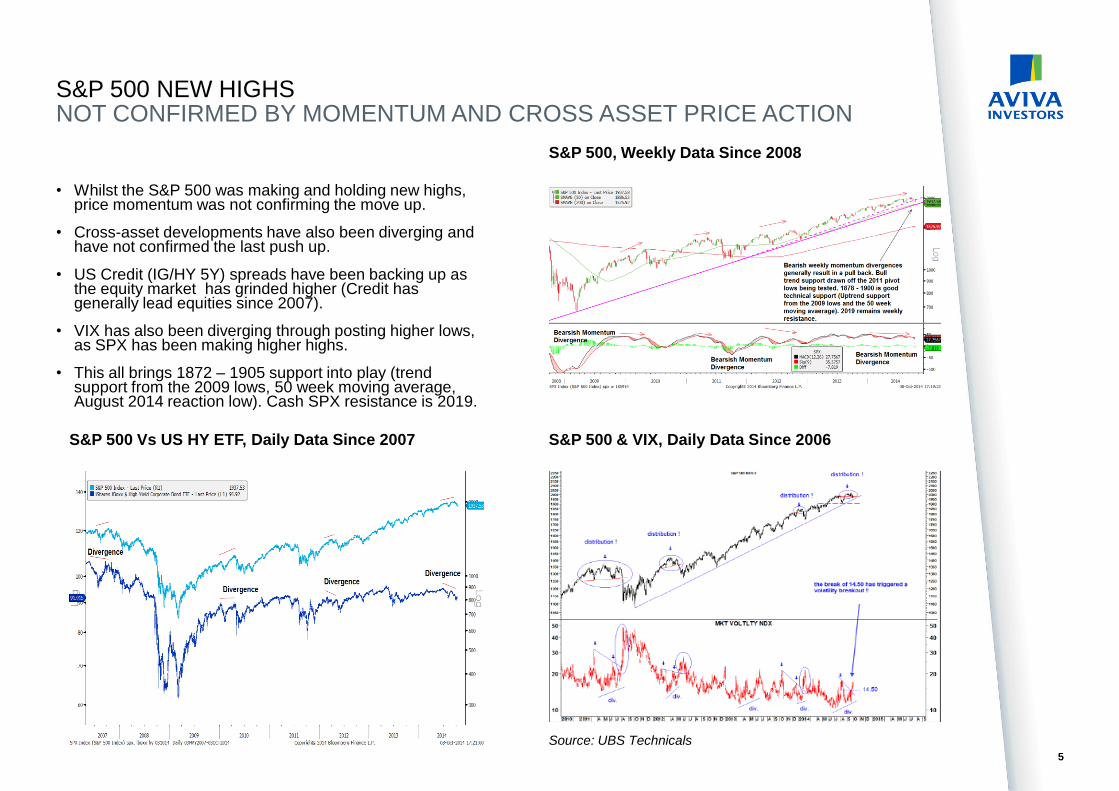
S&P 500, Weekly Data Since 2008
S&P 500 & VIX, Daily Data Since 2006
• Whilst the S&P 500 was making and holding new highs, price momentum was not confirming the move up.
• Cross-asset developments have also been diverging and have not confirmed the last push up.
• US Credit (IG/HY 5Y) spreads have been backing up as the equity market has grinded higher (Credit has generally lead equities since 2007).
• VIX has also been diverging through posting higher lows, as SPX has been making higher highs.
• This all brings 1872 – 1905 support into play (trend support from the 2009 lows, 50 week moving average, August 2014 reaction low). Cash SPX resistance is 2019.
S&P 500 Vs US HY ETF, Daily Data Since 2007
Source: UBS Technicals
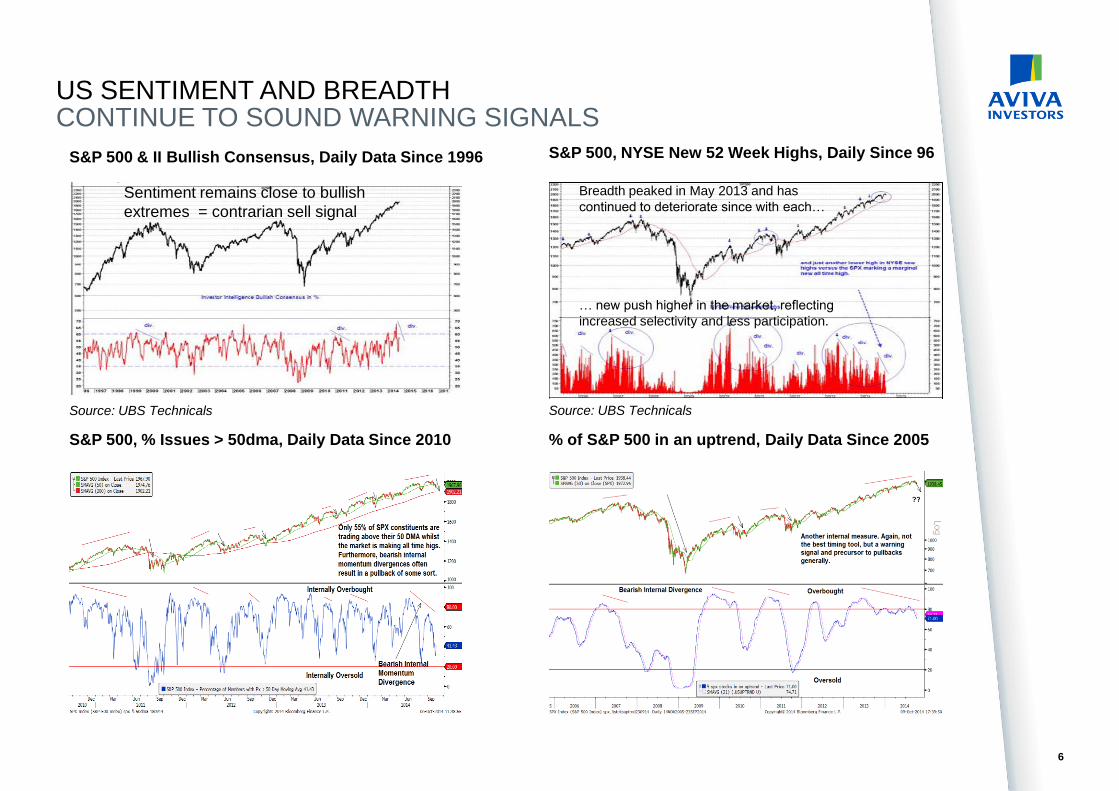
US SENTIMENT AND BREADTH CONTINUE TO SOUND WARNING SIGNALS
6
S&P 500, NYSE New 52 Week Highs, Daily Since 96
% of S&P 500 in an uptrend, Daily Data Since 2005 S&P 500, % Issues > 50dma, Daily Data Since 2010
S&P 500 & II Bullish Consensus, Daily Data Since 1996
Source: UBS Technicals
Sentiment remains close to bullish
extremes = contrarian sell signal
Source: UBS Technicals
Breadth peaked in May 2013 and has
continued to deteriorate since with each…
… new push higher in the market, reflecting
increased selectivity and less participation.
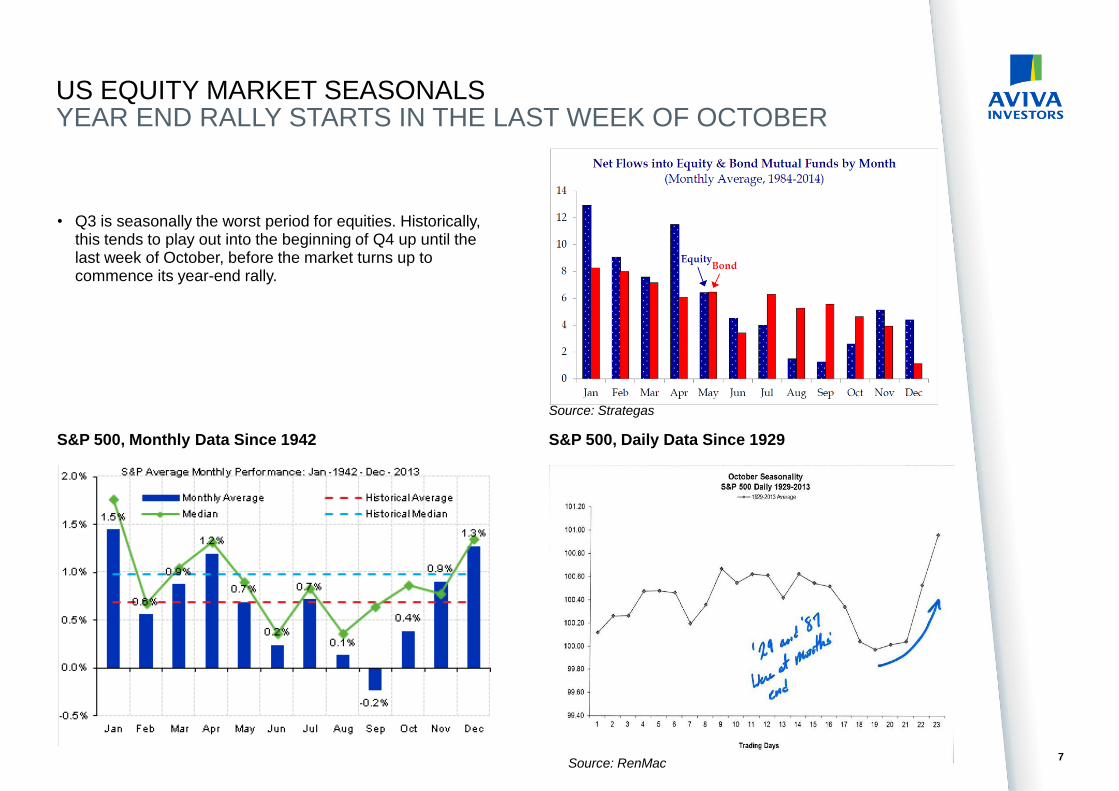
US EQUITY MARKET SEASONALS YEAR END RALLY STARTS IN THE LAST WEEK OF OCTOBER
7
S&P 500, Monthly Data Since 1942 S&P 500, Daily Data Since 1929
• Q3 is seasonally the worst period for equities. Historically, this tends to play out into the beginning of Q4 up until the last week of October, before the market turns up to commence its year-end rally.
Source: RenMac
Source: Strategas
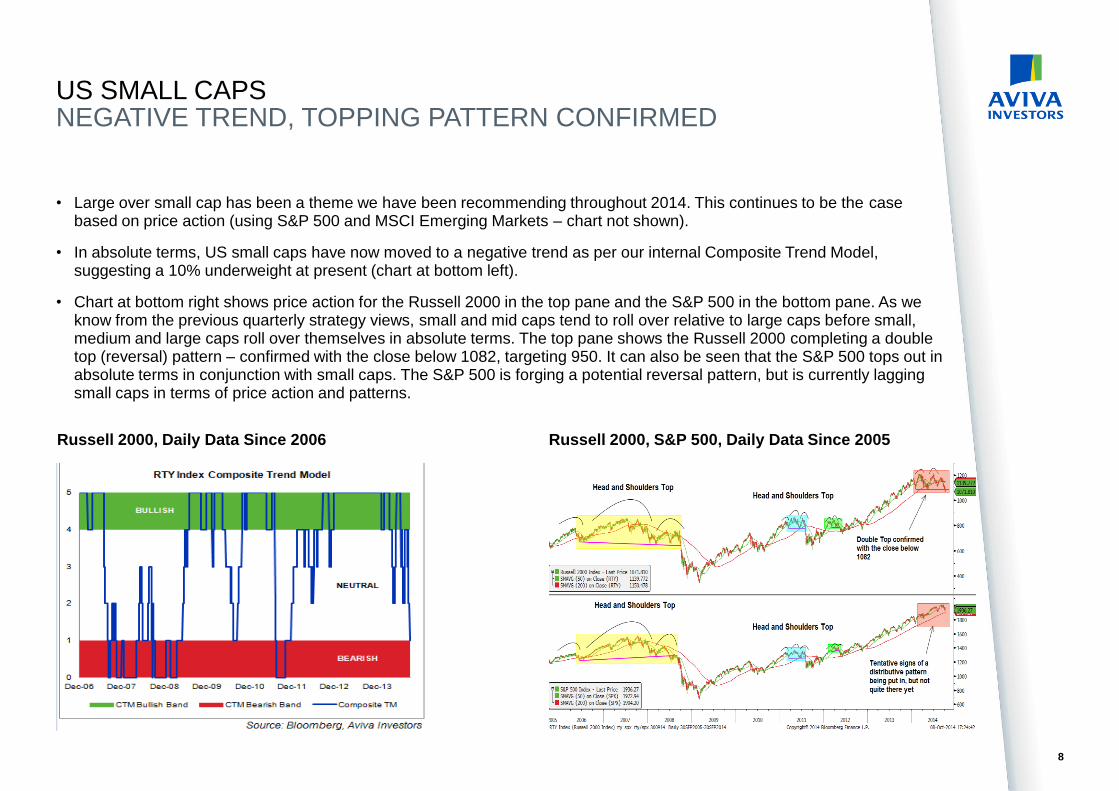
US SMALL CAPS NEGATIVE TREND, TOPPING PATTERN CONFIRMED
8
Russell 2000, Daily Data Since 2006 Russell 2000, S&P 500, Daily Data Since 2005
• Large over small cap has been a theme we have been recommending throughout 2014. This continues to be the case based on price action (using S&P 500 and MSCI Emerging Markets – chart not shown).
• In absolute terms, US small caps have now moved to a negative trend as per our internal Composite Trend Model, suggesting a 10% underweight at present (chart at bottom left).
• Chart at bottom right shows price action for the Russell 2000 in the top pane and the S&P 500 in the bottom pane. As we know from the previous quarterly strategy views, small and mid caps tend to roll over relative to large caps before small, medium and large caps roll over themselves in absolute terms. The top pane shows the Russell 2000 completing a double top (reversal) pattern – confirmed with the close below 1082, targeting 950. It can also be seen that the S&P 500 tops out in absolute terms in conjunction with small caps. The S&P 500 is forging a potential reversal pattern, but is currently lagging small caps in terms of price action and patterns.
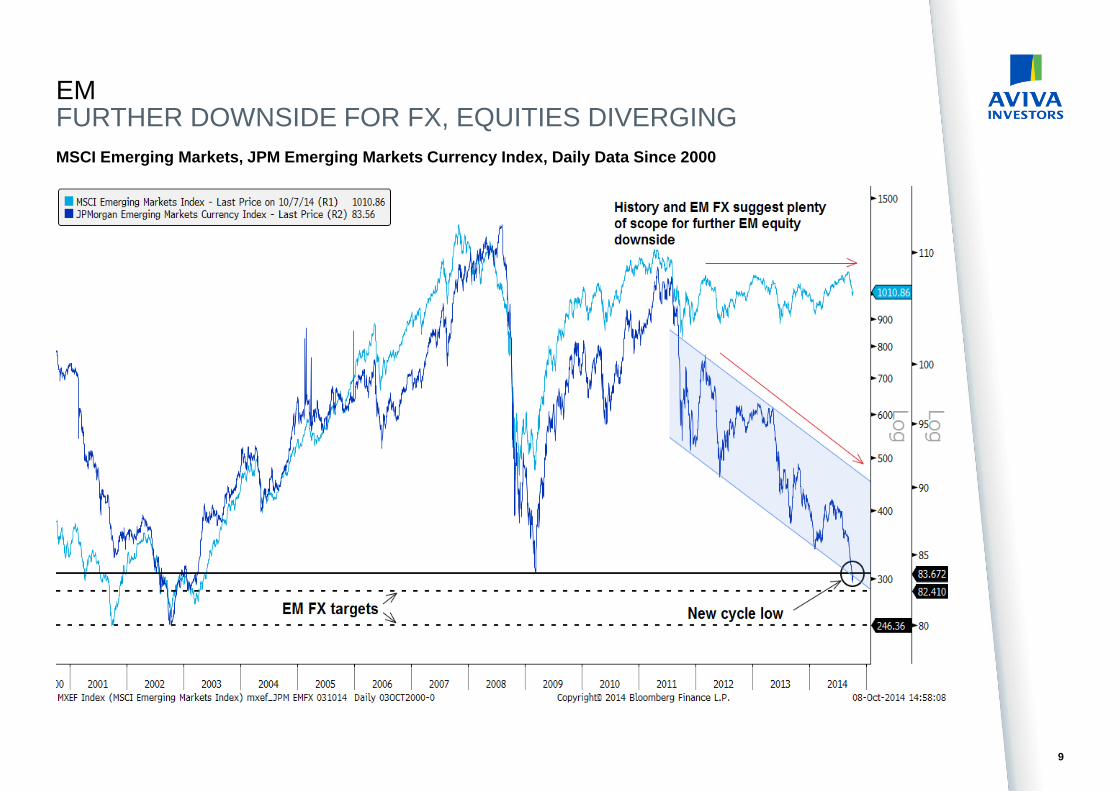
EM FURTHER DOWNSIDE FOR FX, EQUITIES DIVERGING
9
MSCI Emerging Markets, JPM Emerging Markets Currency Index, Daily Data Since 2000
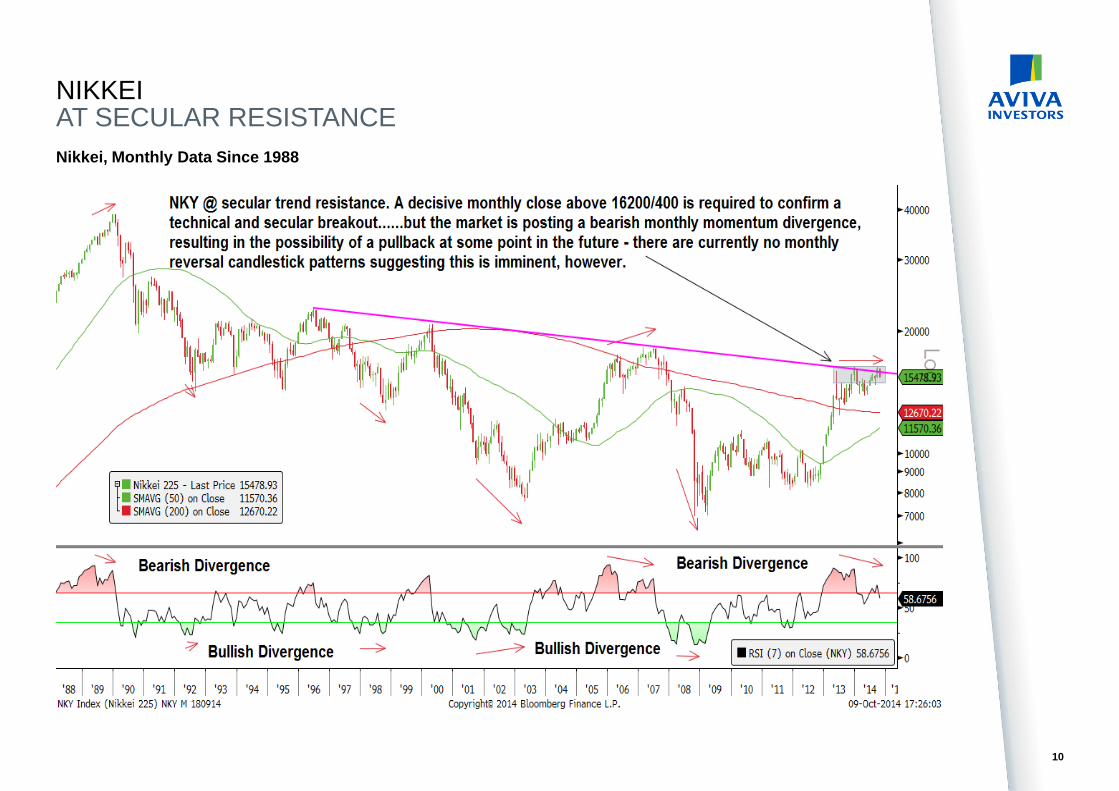
NIKKEI AT SECULAR RESISTANCE
10
Nikkei, Monthly Data Since 1988
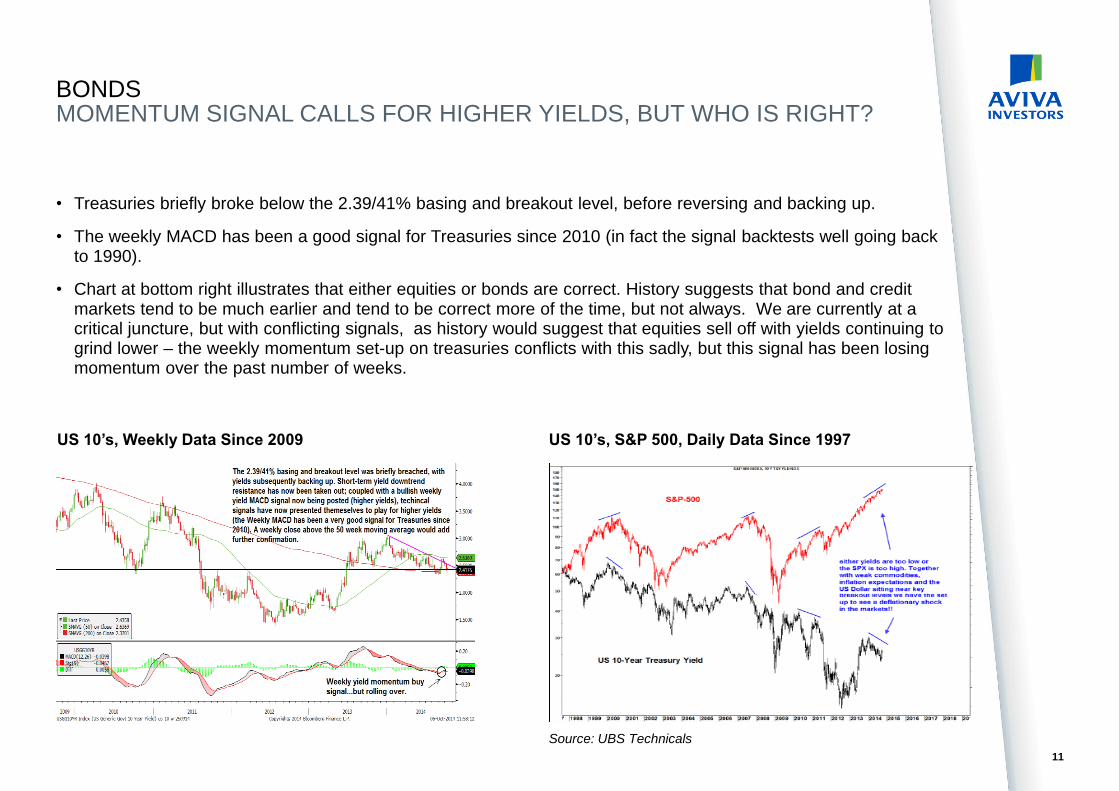
BONDS MOMENTUM SIGNAL CALLS FOR HIGHER YIELDS, BUT WHO IS RIGHT?
11
US 10’s, Weekly Data Since 2009 US 10’s, S&P 500, Daily Data Since 1997
• Treasuries briefly broke below the 2.39/41% basing and breakout level, before reversing and backing up.
• The weekly MACD has been a good signal for Treasuries since 2010 (in fact the signal backtests well going back to 1990).
• Chart at bottom right illustrates that either equities or bonds are correct. History suggests that bond and credit markets tend to be much earlier and tend to be correct more of the time, but not always. We are currently at a critical juncture, but with conflicting signals, as history would suggest that equities sell off with yields continuing to grind lower – the weekly momentum set-up on treasuries conflicts with this sadly, but this signal has been losing momentum over the past number of weeks.
Source: UBS Technicals
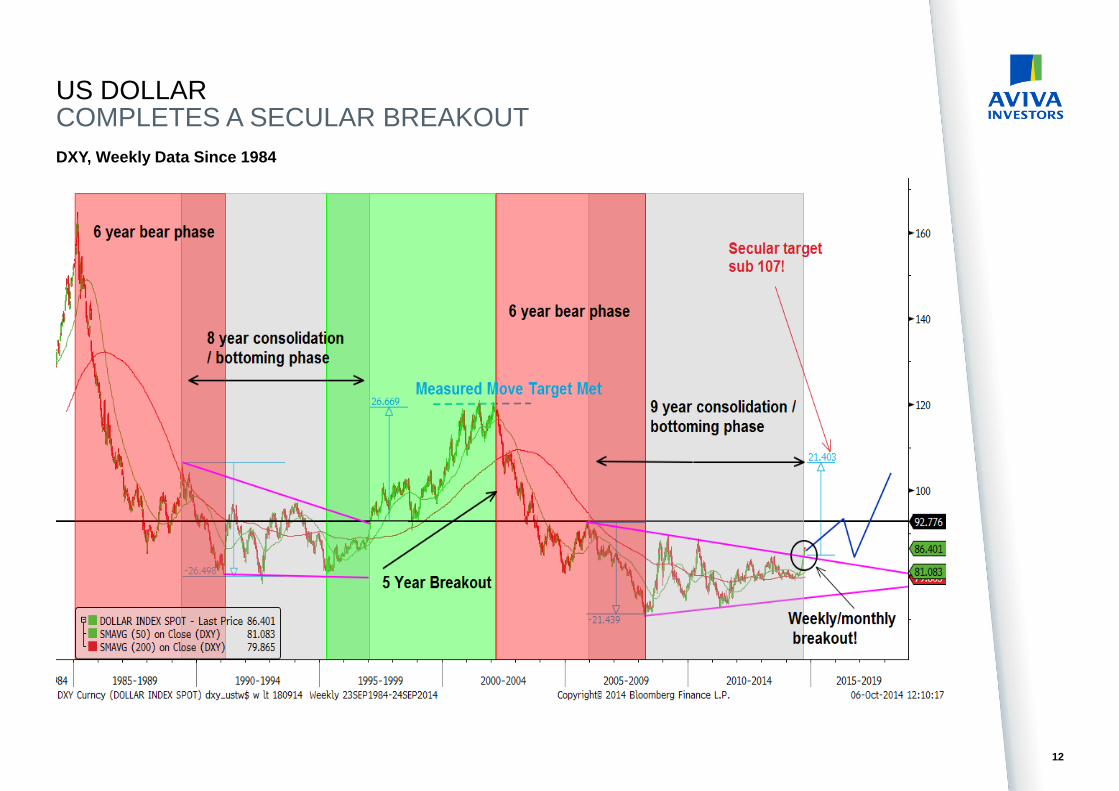
US DOLLAR COMPLETES A SECULAR BREAKOUT
12
DXY, Weekly Data Since 1984
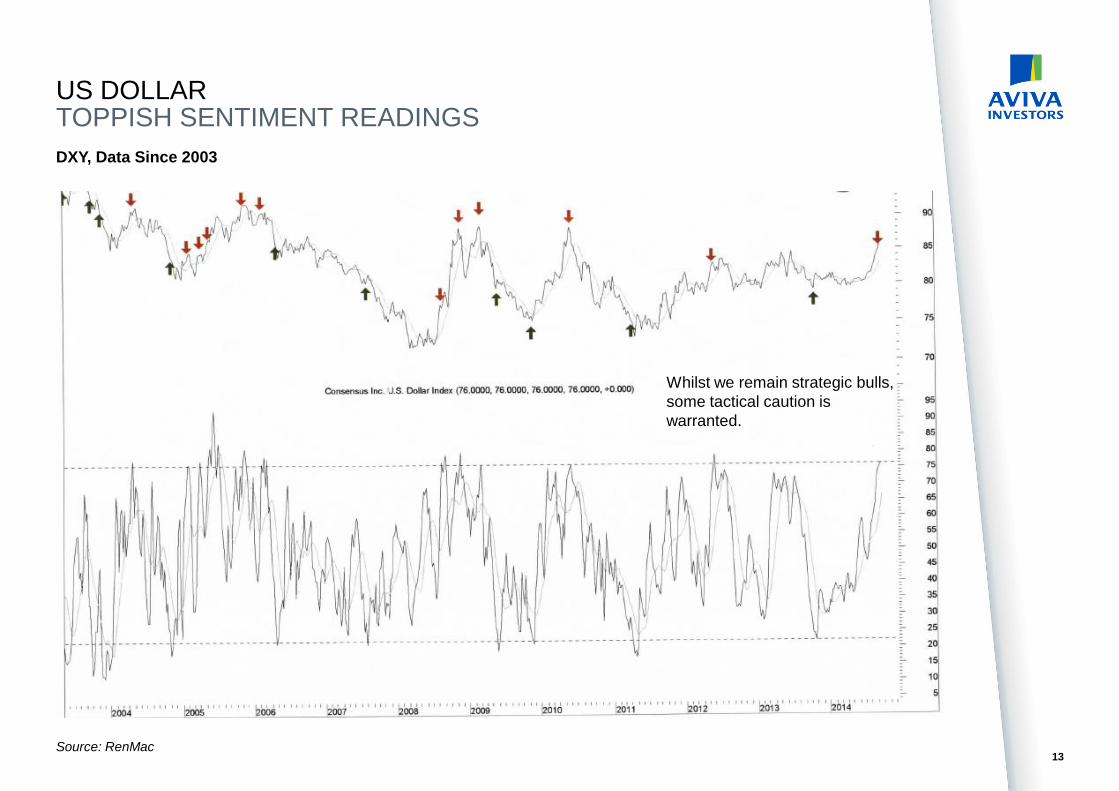
US DOLLAR TOPPISH SENTIMENT READINGS
13
DXY, Data Since 2003
Source: RenMac
Whilst we remain strategic bulls,
some tactical caution is
warranted.

GBPUSD FALSE BREAKOUT!
14
GBPUSD, Daily Data Since 2004 GBPUSD, Daily Data Since August 2013
• The close above the “line in the sand” @ 1.7049 resulted in an unsustainable move whilst trading within its bear wedge (chart at bottom left).
• This is turn resulted in a classical technical “fake out”. False breaks play out as sharp and impulsive moves in the opposite direction to the initial breakout – the idea behind this being that tight stops on long positions would have been very close to the breakout level, and these stops would have subsequently been hit one by one to exacerbate the move in the opposite direction once the market reversed. Another reason why they reverse and move in an impulsive manner is purely a reflection of the rapid change in sentiment – from bullish to bearish in this instance.
• Chart at bottom right zooms into most recent daily price action. Cable is in a clear tactical downtrend (lower highs and lower lows) and is being bounded by downtrend resistance. The market has put in short-term pauses (bear flag/pennant), but these patterns are trend-continuing by nature. 1.5855 is the next port of call whilst trading below downtrend resistance.
15
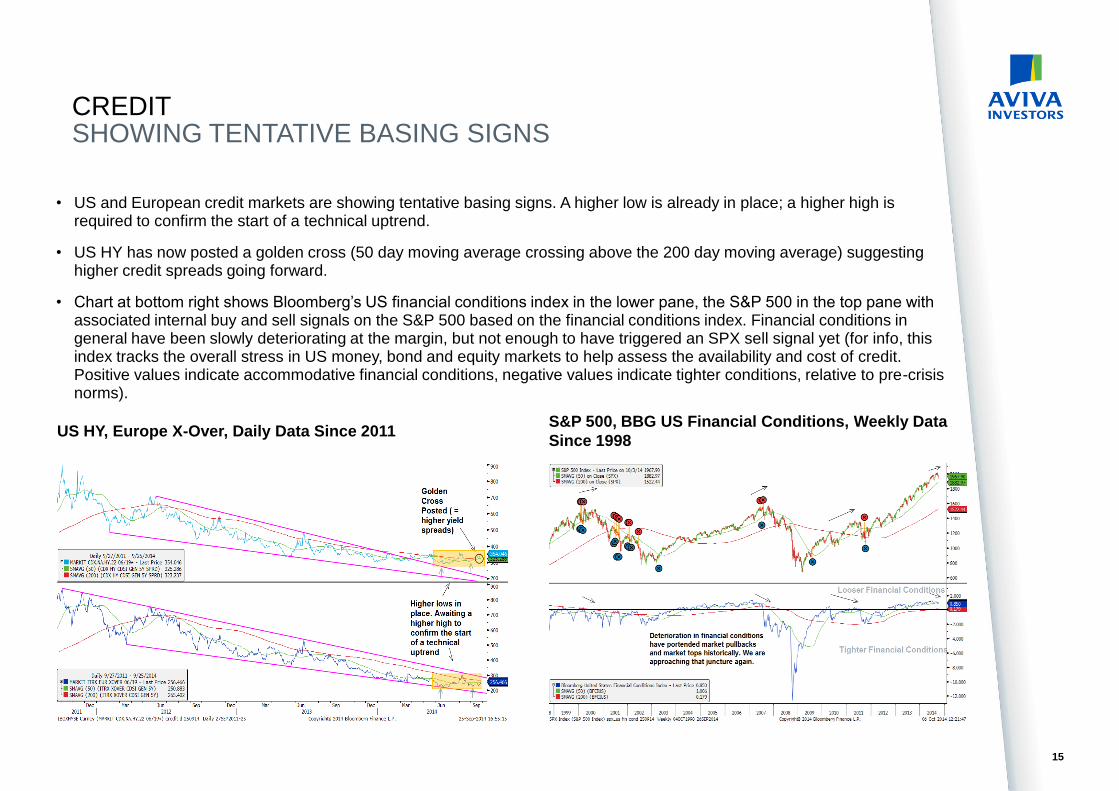
US HY, Europe X-Over, Daily Data Since 2011 S&P 500, BBG US Financial Conditions, Weekly Data
Since 1998
• US and European credit markets are showing tentative basing signs. A higher low is already in place; a higher high is required to confirm the start of a technical uptrend.
• US HY has now posted a golden cross (50 day moving average crossing above the 200 day moving average) suggesting higher credit spreads going forward.
• Chart at bottom right shows Bloomberg’s US financial conditions index in the lower pane, the S&P 500 in the top pane with associated internal buy and sell signals on the S&P 500 based on the financial conditions index. Financial conditions in general have been slowly deteriorating at the margin, but not enough to have triggered an SPX sell signal yet (for info, this index tracks the overall stress in US money, bond and equity markets to help assess the availability and cost of credit. Positive values indicate accommodative financial conditions, negative values indicate tighter conditions, relative to pre-crisis norms).
CREDIT SHOWING TENTATIVE BASING SIGNS


