14 CHAPTER ONE– A Tool for Progress Monitoring Implementation of Problem Solving/Response to Intervention Problem Solving/Response to Intervention Evaluation Tool Technical Assistance Manual Self-Assessment of Problem-Solving Implementation (SAPSI) Description & Purpose Theoretical Background The Self-Assessment of Problem-Solving Implementation (SAPSI) is a progress monitoring tool used to assess the extent to which schools are making progress toward full implementation of PS/RtI practices. Implementation of new practices such as PS/RtI is a gradual process that occurs in stages, not a one-time event (Fix- en, Naoom, Blasé, Friedman, & Wallace, 2005). Because many educational reform efforts fail due to lack of implementation (Sarason, 1990), it is critical that imple- mentation integrity be examined. Several methods for examining implementation integrity exist. These methods can be divided into three categories; self-report, permanent product reviews, and observations (Noell & Gansle, 2006). Description The SAPSI is a self-report measure organized around the same system’s change model (consensus, infrastructure and implementation) as the NASDSE (http:// www.nasdse.org) School-Based Blueprint for Implementation of RtI. Specifically, the SAPSI contains 27 items that assess the extent to which schools are (1) build- ing consensus among key stakeholders, (2) developing the infrastructure necessary to support implementation, and (3) implementing PS/RtI practices and procedures. School-Based Leadership Teams (SBLTs) complete the items collaboratively by selecting from the following response options: N= Not Started (The activity occurs less than 25% of the time); I= In Progress (The activity occurs approximately 25% to 74% of the time); A= Achieved (The activity occurs approximately 75% to 100% of the time); M= Maintaining (The activity was rated as achieved last time and continues to occur approximately 75% to 100% of the time). Only one response should be provided for each item. Self-report: Individuals responsible for implementation provide information on the extent to which the practices occurred. Permanent Product Reviews: Relevant documents (e.g., graphs, notes, worksheets) related to implementation are examined for evidence of the target practices. Observations: Individuals directly observe applications of the target practices when they are expected to occur.
Transcript
14 CHAPTER ONE– A Tool for Progress Monitoring Implementation of Problem Solving/Response to Intervention
Problem Solving/Response to Intervention Evaluation Tool Technical Assistance Manual
Self-Assessment of Problem-Solving Implementation (SAPSI)Description & Purpose
Theoretical Background
The Self-Assessment of Problem-Solving Implementation (SAPSI) is a progress monitoring tool used to assess the extent to which schools are making progress toward full implementation of PS/RtI practices. Implementation of new practices suchasPS/RtIisagradualprocessthatoccursinstages,notaone-timeevent(Fix-en, Naoom, Blasé, Friedman, & Wallace, 2005). Because many educational reform efforts fail due to lack of implementation (Sarason, 1990), it is critical that imple-mentation integrity be examined. Several methods for examining implementation integrity exist. These methods can be divided into three categories; self-report, permanent product reviews, and observations (Noell & Gansle, 2006).
Description
The SAPSI isaself-reportmeasureorganizedaroundthesamesystem’schangemodel (consensus, infrastructure and implementation) as the NASDSE (http://www.nasdse.org) School-Based Blueprint for Implementation of RtI.Specifically,the SAPSI contains 27 items that assess the extent to which schools are (1) build-ing consensus among key stakeholders, (2) developing the infrastructure necessary to support implementation, and (3) implementing PS/RtI practices and procedures. School-BasedLeadershipTeams(SBLTs)complete the itemscollaborativelybyselecting from the following response options: N= Not Started (The activity occurs less than 25% of the time); I= In Progress (The activity occurs approximately 25% to 74% of the time); A= Achieved (The activity occurs approximately 75% to 100% of the time); M= Maintaining (The activity was rated as achieved last time and continues to occur approximately 75% to 100% of the time). Only one response should be provided for each item.
Self-report: Individuals responsible for implementation provide information on the extent to which the practices occurred.
Permanent Product Reviews: Relevant documents (e.g., graphs, notes, worksheets) related to implementation are examined for evidence of the target practices.
Observations: Individuals directly observe applications of the target practices when they are expected to occur.
Self-Assessment of Problem-Solving Implementation (SAPSI) 15
Problem Solving/Response to Intervention Evaluation Tool Technical Assistance Manual
Purpose
Thepurposeoftheinstrumentistwo-fold.Thefirstpurposeistoassesscurrentlevels of consensus, infrastructure development, and implementation of a PS/RtI model. This information is used to identify areas in which schools and districts require actions to be taken to facilitate PS/RtI implementation. The second purpose is to assist educators in progress monitoring implementation of the PS/RtI mod-el. These data are used to evaluate the extent to which actions taken to facilitate implementationhavebeensuccessfulaswellasidentifyanyneedsnotidentifiedduring previous administrations.
Intended Audience
Who Should Complete the SAPSI?
School-BasedLeadershipTeam(SBLT)memberscompletetheSAPSI.SBLTsarecomprised of approximately six to eight staff members selected to take a leader-ship role in facilitating PS/RtI implementation in a school. Staff included on the SBLTshouldhavethefollowingrolesrepresented:administration,generaleduca-tion teachers, student services, special education teachers, and content specialists (e.g.,reading,math,behavior).SBLTmembersshouldreceivetrainingonthePS/RtI model including strategies for facilitating implementation (i.e., systems change principles and strategies referred to in the Introduction). Individuals on the team alsoshouldadoptrolesandresponsibilitiestoensureefficientandproductiveplan-ningandproblem-solvingmeetings.Importantresponsibilitiesincludeafacilita-tor, time-keeper, data coach, and recorder, in addition to providing expertise in the particular content areas or disciplines listed above.
Who Should Use the Results for Decision Making?
TheSBLTswhocompletetheSAPSI should receive the results for their school. District-BasedLeadershipTeam(DBLT)membersalsoshouldreceivetheresultsfor the district’s schools individually as well as aggregated at the district level. MembersoftheDBLTprovideleadershiptoschoolsimplementingPS/RtIprac-tices.ExamplesofleadershipprovidedbyDBLTmembersincludefacilitatingthecreation of policies and procedures to support implementation, providing access to professional development targeting the knowledge and skills of educators in the district, and meeting with schools to review implementation and student outcomes. Staff includedon the teammirror theSBLTin termsof representationofdisci-plines and roles and responsibilities.
Directions for Administration
The SAPSIiscompletedbySBLTmembersinthreesteps.
Step 1
Anidentifiedfacilitator(e.g.,PS/RtICoach,Principal)reviewstheSAPSI to ensure thattheformatandcontentareunderstoodbySBLTmembers.AllSBLTmembers
Facilitator: Responsibilities of facilitators tend to include preparation for meetings, ensuring participation and involvement of team members, encouraging team members to reach consensus regarding decisions being made, and keeping the conversations focused on the task being discussed (e.g., problem-solving student performance, planning for professional development).
Timekeeper: Timekeepers are responsible for providing periodic updates to team members regarding the amount of time left to complete a given task or discussion during meetings.
Data Coach: Data coaches provide assistance with interpreting data and using it to inform decisions.
Recorder: Recorders are responsible for taking notes for the purpose of capturing the important discussions and outcomes of meetings.
16 CHAPTER ONE– A Tool for Progress Monitoring Implementation of Problem Solving/Response to Intervention
Problem Solving/Response to Intervention Evaluation Tool Technical Assistance Manual
should be provided information on the SAPSI’s purpose, what the instrument mea-sures, how the information will be used, and procedures for completing it.
Step 2
EachSBLTmembercompletestheassessmentindividually.Facilitatorscanpro-vide a copy of the SAPSI to each SBLTmember prior to the scheduled SBLTmeeting at which the instrument will be completed. Disseminating copies of the instrument approximately 1 week before the meeting provides adequate time for participants to record their perspectives and to attend ready to contribute to discus-sions.
Step 3
The facilitator guides discussion until consensus is reached among the group re-gardingthescoreforeachitem.Thefacilitatorrecordsfinalresponsestobesub-mitted. Group completion of the SAPSI typically takes 30 minutes to 2 hours de-pending on the amount of discussion required to reach consensus on each item. Only the SAPSIversionthatrepresentstheconsensusoftheSBLTmembersshouldbeusedfordecision-makingpurposes.
Some teams have found it helpful to identify potential action plans to address needs identifiedwhilecompletingtheSAPSI. Although using the data derived from the SAPSI to inform implementation actions is highly recommended, facilitators will need to attend to the amount of time allocated to complete the instrument to ensure that the team completes all items.
Frequency of Use
WhendetermininghowoftenSBLTmembersshouldcompletetheSAPSI, it is im-portant to consider the resources available within schools and districts so that plans for data collection are adequately supported. Important considerations include the time needed for completion of the instrument; the time required to enter, analyze, graph, and disseminate data; the personnel available to support data collection, andotherdatacollectionactivitiesinwhichSBLTmembersandschoolstaffarerequired to participate. In other words, decisions about how often to collect SAPSI data should be made based on the capacity to administer, analyze, and use the in-formationtoinformplanstoscale-upPS/RtIimplementation.
Although schools and districts will need to make adjustments given available re-sources, general recommendations for completing the SAPSI are provided below. General recommendations are to administer the instrument:
During the beginning and end of thefirst year of PS/RtI implementation•efforts. Completing the SAPSIatthebeginningoftheyearcanassistSBLTandDBLTmembersinidentifyinginitiallevelsofconsensus,infrastructuredevelopment, and implementation of PS/RtI practices. The information ob-tainedcanbeusedtodevelopshort-andlong-termgoalsforimplementingPS/RtI practices as well as develop strategic and action plans (e.g., profes-
Self-Assessment of Problem-Solving Implementation (SAPSI) 17
Problem Solving/Response to Intervention Evaluation Tool Technical Assistance Manual
sional development activities and support to be provided). Administering the SAPSI againattheendofthefirstyearwillallowSBLTandDBLTmembersto examineprogressmadeduring theyear and to refinegoals and actionplans for the subsequent school year. During the middle and end of each subsequent school year. Completing the •SAPSI at these times provides formative data on changes in consensus, in-frastructure development, and PS/RtI implementation levels. Specifically,administering the SAPSI during the middle of the year provides information toSBLTandDBLTmembersonthepotentialimpactofanyactionstakensince the instrument was completed at the end of the previous school year. Completing the SAPSI at the end of each school year can provide data on changes since the middle of the year as well as serve as a baseline for actions to be taken the next school year.
Technical Adequacy
Content Validity Evidence
Contentvalidityevidencewasdeterminedbycarefulidentificationanddefinitionofthedomainsofspecificcontentthattheinstrumentwouldmeasureasreflectedin the literature on systems change and from review of other instruments that pur-porttomeasuretheidentifieddomains.TheProject’sversionoftheinstrumentwasadaptedfromtheIL-ASPIRESAPSI v. 1.6. The Illinois ASPIRE SAPSI included items that assessed indicators of consensus development, infrastructure building, and implementation of PS/RtI practices. Because the sections included matched the systems change model adopted by the Project, Project staff decided to make modificationstosomeitemstoalignwithspecificsofthePS/RtImodelusedintheState of Florida.
Internal Consistency Reliability
Internal consistency reliability estimates were computed for each of the three do-mainsmeasured by the instrument. Specifically, itemswithin each of the threeSAPSI sections of “Consensus,” “Infrastructure Development,” and “Implementa-tion” were examined separately. SAPSIs administered during the Winter of 2010 to 34 pilot schools were used to derive internal consistency estimates. The following Cronbach’salphacoefficientswerederivedforeachofthethreedomains:
The amount of analysis required to use the SAPSIfordecision-makingwilllikelydependontheunitofanalysis(e.g.,school,district,state).School-levelpersonnelusingtheresultsmaywanttosimplychartresponsesfromthefinalversion(s)com-
Content validity: Content-related validity evidence refers to the extent to which the sample of items on an instrument is representative of the area of interest the instrument is designed to measure. In the context of the SAPSI, content-related validity evidence is based on expert judgment that the sample of items on the SAPSI is representative of consensus, infrastructure, and implementation activities that facilitate positive implementation of PS/RtI practices.
Internal consistency reliability: Internal consistency reliability evidence is based on the degree of homogeneity of scores (i.e., the extent to which the scores cluster together) on items measuring the same domain. In the context of the SAPSI, an internal consistency reliability estimate provides a measure of the extent to which teams who responded one way to an item measuring an activity domain (or factor) tended to respond the same way to other items measuring the same domain.
18 CHAPTER ONE– A Tool for Progress Monitoring Implementation of Problem Solving/Response to Intervention
Problem Solving/Response to Intervention Evaluation Tool Technical Assistance Manual
pleted by the facilitator to identify needs and monitor progress over time. Stake-holdersexaminingotherunitsofanalysis(e.g.,district-level,schoolsservedacrossa state or geographic region) would likely need to aggregate results to inform de-cision-making.Includedbelowareways inwhichpersonnelaggregatingresultsfrom multiple schools can consider analyzing data from the SAPSI.
The Florida PS/RtI Project has primarily utilized two techniques for analyzing data for formative evaluation purposes. First, the mean rating for each item can be calculated to determine the average activity level evident across change do-mains. Second, the frequency of (i.e., frequency distribution) each response option selected (i.e., Not Started, In Progress, Achieved, Maintaining)bySBLTscanbecalculated for each item.
Calculating item means provides an overall impression of the consensus, infra-structure development, and implementation activities occurring. When calculating average implementation levels, the following values should correspond with each response option: 0 = Not Started; 1 = In Progress; 2 = Achieved; 3 = Maintaining. Calculating average activity levels can be done at the domain and/or individual item levels. Examining implementation at the domain level allows educators to ex-amine general patterns in (1) consensus building, (2) infrastructure development, and (3) implementation. A domain score for each of the three change domains measured by the instrument may be computed for SAPSIs completed by calculat-ing the sum of the ratings of the items that comprise the domain. These values can then be added together and divided by the total number of items within the domain to produce an average activity level for each domain. The items that comprise the three domains are as follows:
Average activity levels also can be examined by item. Calculating the mean rat-ing for each item within a domain allows educators to identify the extent to which educatorsareengaginginspecificactivities tofacilitatePS/RtI implementation.This informationcanbeused to identify specificactivities thatmayneed tobeaddressed systematically (through professional development, policies and proce-dures, etc.), but does not provide detailed information regarding the variability across schools for each activity.
Calculating the frequency of schools in which activities were reported as Not Start-ed, In Progress, Achieved, and Maintaining for an item, on the other hand, provides information on the range of activity levels. This information can be used to deter-minewhatpercentageofschoolsengagedinspecificactivitiestofacilitatePS/RtIimplementation. When making decisions about how to address implementation efforts, information on the number of schools engaging in a particular activity can help inform decisions regarding modifying implementation plans (e.g., profes-sional development, policy/procedure development, personnel allocation). For ex-ample, identifying the percentage of schools served who have reported achieving
For example, if a school selected I, I, N, A, I when completing Items 1-5 that comprise the “Consensus” section, the values corresponding with those responses would be added together to obtain a total value of 5 (i.e., 1+1+0+2+1 = 5). The total value of 5 would be divided by the number of items (5) to obtain the domain score (i.e., 5/5 = 1). A domain score of 1 could be interpreted as the school, on average, being in progress with consensus building.
Self-Assessment of Problem-Solving Implementation (SAPSI) 19
Problem Solving/Response to Intervention Evaluation Tool Technical Assistance Manual
or maintaining an activity can inform whether actions should be taken to address implementationacrossschoolsorwith asmallnumberofspecificschoolswhohave not yet engaged in the activity consistently. Items on which the majority of schools report achieving or maintaining an activity would likely suggest the need to target those schools not yet consistently engaging in the activity for additional assistance. Items on which less than the majority of schools report consistent en-gagement in the activity would likely suggest the need to take a broader approach to impact all schools.
It is recommended that key stakeholders analyze SAPSI data in ways that best inform the evaluation questions they are asking. The data collected from the in-strumentcanbeusedtoansweranumberofbroadandspecificquestionsregard-ingtheextenttowhichSBLTsreportengaginginactivitiestoimplementPS/RtI.Tofacilitateformativedecision-making,stakeholdersshouldconsideraligningtheanalysisanddisplayofthedatawithspecificevaluationquestions.Forexample,questions regarding general trends in consensus development across time may best be answered by calculating and displaying domain scores. Questions about spe-cificconsensusbuildingactivitiesoccurringacrossadistrictmaybestbeansweredby calculating and displaying the number of schools that report achieving or main-taining the activities. In other words, identifying which evaluation question(s) are currently being answered will guide how to analyze the data and communicate the information to facilitate decision making.
Technology Support
School personnel should consider using district supported or commercially avail-able technology resources to facilitate analyses of the data. Software andweb-based programs vary in terms of the extent to which they can support administra-tion of an instrument (e.g., online administration) and automatic analysis of data, aswell as howuser-friendly they are.Decisions aboutwhat technology to useto facilitate analysis should be made based on available resources as well as the knowledge and skills possessed by those responsible for managing and analyzing data from the survey.
Training Required
Training Recommended for Individuals Facilitating SAPSI Completion
Qualifications of the facilitator. Personnel in charge of facilitating completion of the SAPSI should have a thorough understanding of the PS/RtI model and the systems issues that must be addressed when implementing the model. Facilitators also should possess the consultation skills required to facilitate consensus among a group of individuals that may have different opinions regarding the extent to which the school is engaging in certain activities. If individuals with expertise in the aforementioned areas are not available, facilitators should receive thorough training to develop those skill sets in addition to being trained to facilitate comple-tion of the SAPSI.
20 CHAPTER ONE– A Tool for Progress Monitoring Implementation of Problem Solving/Response to Intervention
Problem Solving/Response to Intervention Evaluation Tool Technical Assistance Manual
Content of the training. A brief training on facilitating completion of the SAPSI is recommended before administering the instrument. Trainings on facilitating com-pletion of the SAPSI should include the following components:
Theoretical background on the relationship between implementation integ-•rity and desired outcomes, and the alignment between the SAPSI and a sys-tems change approach to implementing PS/RtI practicesEach item should be reviewed so that facilitators have a clear understanding •of what is being measured. The Item Scoring Description (located in SAPSI — Supplements, page 26) is a useful tool for providing facilitators with guid-ance on how to score each item Administration procedures developed and/or adopted•Common issues that arise during administration such as frequently asked •questions and how to address disagreements among team members.
Training Suggested for Analyzing, Interpreting, and Disseminating SAPSI Results
The knowledge, skills, and experience of educators in analyzing, interpreting, and usingdataforformativedecision-makingvary.Ifthestakeholdersresponsiblefortheseactivitiespossesstheknowledgeandskillsrequiredthentrainingspecifictothe SAPSI may not be necessary. However, should the stakeholders responsible for using the data lack any of the aforementioned skill sets, training and technical assistance is recommended. Topics on which support might be provided are listed below:
Appropriate use of the instrument given its purpose and technical adequacy•Guidelines for analyzing and displaying data derived from the survey•Guidelines for interpreting and disseminating the results•
Interpretation and Use of the Data
Consistent with scoring the instrument, the interpretation and use of SAPSI data will vary by the unit of analysis being examined. Key stakeholders examining SAPSIdatafrommultipleschools(e.g.,districtpersonnelexaminingdistrict-leveldata)willlikelybeinterpretingaggregateddata.School-levelpersonnelwilllikelybeexaminingdataspecifictotheirschool.Includedbelowarerecommendationsfor examining, interpreting, and using data to inform decisions for stakeholders examiningmultipleschools.School-levelpersonnelshouldconsiderfollowingthebroad recommendations included below but will not need to conduct the steps de-scribed for examining data from multiple schools.
Examination of Broad Domains
When interpreting SAPSI data, it is recommended that the three broad domains measured by the instrument (i.e., Consensus, Infrastructure Development, Imple-mentation)beexaminedfirst.Keystakeholders(e.g.,SBLTs,DBLTs)canexaminegraphically displayed data to evaluate levels of consensus, infrastructure devel-opment, and implementation. Each of the methodologies for scoring mentioned
Self-Assessment of Problem-Solving Implementation (SAPSI) 21
Problem Solving/Response to Intervention Evaluation Tool Technical Assistance Manual
above (i.e., calculating average activity levels at the domain and item levels and calculating the frequency/percent of schools who selected each response option at the item level) can be used to examine the broad domains. One methodology used frequently by Project staff when examining data from the SAPSI is to take note of the percent of schools that reported having Not Started (0), being In Progress (1), having Achieved (2), and having Maintained activities to facilitate PS/RtI imple-mentation (see Year 2 Evaluation Report, page 43). This type of visual analysis allows stakeholders to determine the extent to which schools tend to report engag-ing in a given activity. This approach can be used to examine activities designed to facilitate implementation for any given administration as well as to examine trends over time.
Identification of Specific Needs
Each item within the domains also can be graphed to examine trends in which activities tend to be engaged in more or less frequently. Key stakeholders should consider a number of factors when identifying which activities tend to be engaged in at relatively high levels versus those being engaged in at low levels. The extent to which schools should be facilitating consensus, developing infrastructure, and implementing PS/RtI practices will depend on training received; length of time since the school decided to implement the model; district, state, and national poli-ciesandprocedures;availabilityofdatasystemstosupportdata-baseddecision-making; among myriad other factors. Given the multiple interacting variables that impact school efforts to implement any initiative, it is important to consider all aspectsofthesystemthatcontributetoorimpedeengagementinspecificactivitieswhile developing plans that address needs evident in the data.
Although using self-reportmeasures such as theSAPSI can provide invaluable informationontheextenttowhichSBLTsreportengaginginactivitiestofacili-tatePS/RtIimplementation,self-reportdatatendstobepositivelybiased(Noell&Gansle, 2006). Given the potential for schools to report higher levels of activities than what other sources of data would suggest, it is recommended that data from the SAPSI be compared with other data/information on implementation integrity.
Data Dissemination to Stakeholders
It is important that a plan for disseminating data on implementation integrity and providing key stakeholders the time and support to discuss the information be includedinaplantoscale-upPS/RtIpractices.Itisrecommendedthatthesekeystakeholdersbeidentifiedanddatabesharedwiththemasquicklyandfrequentlyas possible following time periods when the SAPSI tends to be completed. This time line allows stakeholders such asSBLTmembers to discuss activity levelssuggested from the SAPSI data, develop or alter goals, and design strategies (e.g., professional development plan, access technology resources, develop procedures) to facilitate increased levelsof implementation.DBLTmembersmayalsowantaccess to data from schools to plan support provided at the district level. Addition-ally,SBLTandDBLTmembersmayfindithelpfultohaveacoachorfacilitatordiscuss the data with members participating in meetings to facilitate interpretation andproblem-solvebarrierstoimplementationefforts.Finally,SBLTmembersare
22 CHAPTER ONE– A Tool for Progress Monitoring Implementation of Problem Solving/Response to Intervention
Problem Solving/Response to Intervention Evaluation Tool Technical Assistance Manual
highly encouraged to share school SAPSI data with instructional staff members. The stakeholders are often critical to the implementation of a PS/RtI model and theirsupportandinputareimportanttoconsiderwhendevelopingandfinalizingaction plans.
To facilitate discussions about implementation efforts, one helpful strategy is to provide educators with guiding questions. The use of guiding questions is designed to facilitate discussions about each school’s data, including potential strategies for increasing the use of PS/RtI practices. Listed below are examples of guid-ing questions used by the Florida PS/RtI Project to facilitate discussions regard-ing implementation integrity. These guiding questions were designed to facilitate discussionsabouteachschool’sdata,includingcurrentlevelofproblem-solvingimplementation and consistency between SAPSI data and other implementation integrity measures (e.g., other data sources are discussed elsewhere in this manual) (see also Year 2 Evaluation Report). However, stakeholders can generate addi-tional guiding questions to better meet the needs of their school.
What are the patterns?•What patterns are evident among each of the individual items on the check- slist and across all data sources?Whatstepsoftheproblem-solvingprocessareoccurringmorefrequently? sLessfrequently?Are there any current indicators that show a zero or low level of imple- smentation? Why?
Have these been targeted in the past? -Do barriers exist with consensus or infrastructure? -Other priorities? -Meetings not happening or focusing on implementation? -
HowhaveyouprogressedinimplementingtheProblem-SolvingModelwith•fidelity?Looking across all fidelitymeasures ( s CCC, SAPSI, and Observations), what are the general levels of implementation? What are the general trends?Do the data from the s Critical Component Checklist and Observations sup-port what is evident in the SAPSIitems22a-22i?
Are there discrepancies among the different sources of data with using -theProblem-Solvingmodel?How might these discrepancies be interpreted? -
School-Level Example of SAPSI Data
The following example demonstrates how key stakeholders may use data derived from the SAPSI to inform PS/RtI implementation. Data from the SAPSI are dis-played graphically. Following the graph, background information on the school’s initiative and an explanation of what is represented on the graph is provided. Final-ly, ways in which the data were used by the school to monitor progress and identify needsisdiscussed.Importantly,althoughtheexampleoccursattheschool-level,theconceptsdiscussedcanbegeneralizedtootherunitsofanalysis(e.g.,district-level,state-level).
Self-Assessment of Problem-Solving Implementation (SAPSI) 23
Problem Solving/Response to Intervention Evaluation Tool Technical Assistance Manual
Figu
re 3
. Sch
ool-L
evel
Exa
mpl
e of
SAP
SI D
ata
(BO
Y =
Beg
inni
ng o
f Yea
r; E
OY
= E
nd o
f Yea
r).
24 CHAPTER ONE– A Tool for Progress Monitoring Implementation of Problem Solving/Response to Intervention
Problem Solving/Response to Intervention Evaluation Tool Technical Assistance Manual
Background Information and Explanation of the Graph
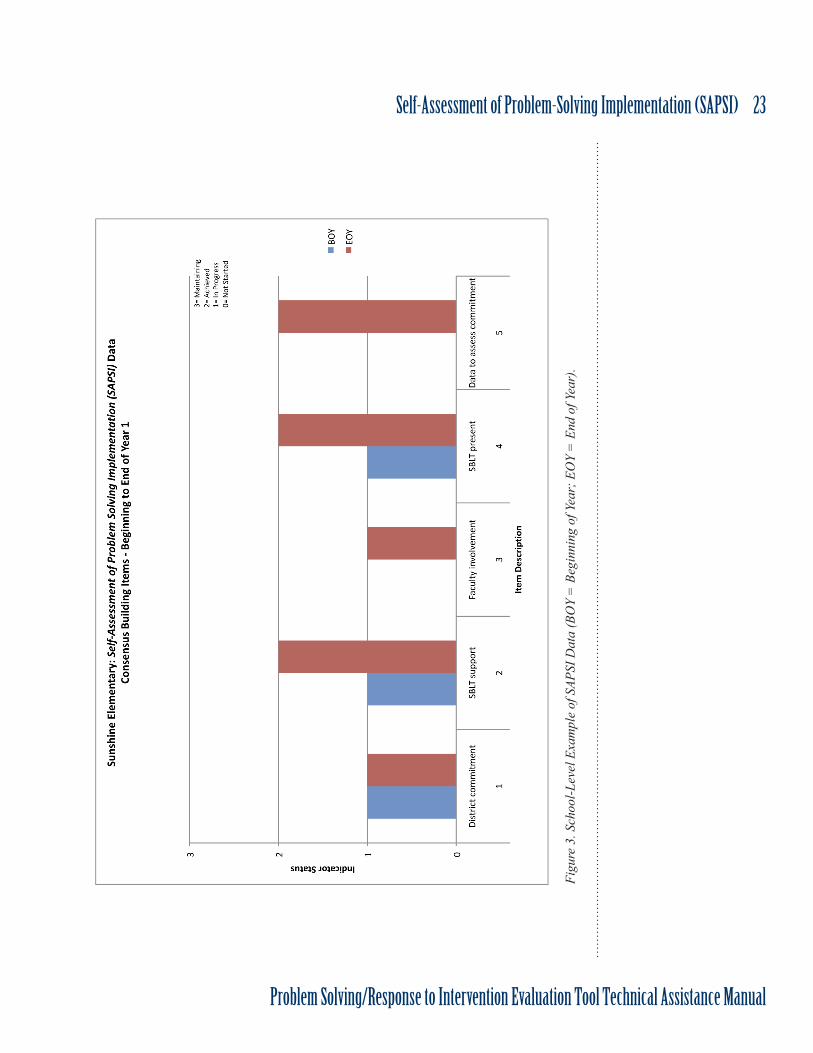
Sunshine Elementary recently committed to implementing the PS/RtI model at theschool.ThenewlyformedSBLTatSunshineElementarymetatthebeginningof the school year to plan for implementation but realized that they did not know where to begin. At the suggestion of the school’s PS/RtI Coach, the team decided to complete the SAPSI at their next meeting to inform goals and activities for the year and beyond. They also agreed to complete the instrument again at the end of the year to examine progress and identify additional needs. Given that the school was in the beginning stages of implementing PS/RtI practices, the team decided to focusfirstonconsensusdevelopment.Figure3aboveincludesresultsoftheitemsfrom the SAPSI that assess consensus activities. Notice that two bars are located above each item. For each item, these bars represent the two time points in which theSBLTcompletedtheSAPSIduringthefirstyear.Thebluebarsrepresentinitial,beginning of the year (BOY) SAPSI scores for Sunshine Elementary, while the red bars represent the end of year (EOY) SAPSI scores. For each item, the following scale was used: 0= Not Started, 1= In Progress, 2= Achieved, 3= Maintaining.
Interpretation and Use of the Data
Examination of broad SAPSI domains.Following thefirstadministrationof theSAPSIatthebeginningoftheyear,theSBLTmettodiscusstheresultsandplanforaddressingconsensuslevels.First,theSBLTtooknoteoftheinitialstatusofcon-sensusbuildingactivitiesreflectedbytheSAPSI items displayed in Figure 3. Team membersnotedthatdistrictcommitment(Item1),SBLTsupport(Item2),andhav-inganestablishedSBLT(Item4)wereallinprogressasindicatedbythevaluesofone displayed on the graph. They also noted that the school had not started involv-ing the faculty (Item 3) or using data to assess staff levels of commitment (Item 5) as noted by the value of zero displayed on the graph. Overall, these data suggested that work needed to be done to establish consensus for PS/RtI implementation at theschoolbeforeschool-wideimplementationcouldoccur.SBLTmemberspro-ceeded to plan for how to increase consensus at the school.
Identification of specific needs.BecausetheSBLTnotedthattheschoolhadnotstarted or was in progress with consensus building activities at the beginning of the school year, certain activities could be recommended. For example, to increase districtcommitment(Item1),SBLTmemberscouldattempttomeetwithdistrictleadershipstafftodiscussissues,advocateforfurtherPS/RtI-relatedprofessionaldevelopmentactivities,andfosterregularcommunicationwiththeDBLT.Addi-tionally, theSBLTcould increase faculty involvement (Item3)by creatingop-portunities to share PS/RtI updates and information with school staff, as well as encourage the input and participation of staff through a variety of strategies (e.g., discussions at staff meetings, focus groups composed of representatives from grade levelteams).TheSBLTalsocouldbegintoidentifyorcreatedatacollectiontoolstohelpassessconsensusamongthestaff(Item5).ThedecisionmadebytheSBLTwould depend on a number of factors including receptiveness of district leadership toprovidingsupport,whetherrolesandresponsibilitiesofSBLTmembershave
Self-Assessment of Problem-Solving Implementation (SAPSI) 25
Problem Solving/Response to Intervention Evaluation Tool Technical Assistance Manual
After some discussion, the SBLT decided that firmly establishingmembers ofthe SBLT (including roles and responsibilities) should be the primary focus oftheteam,atleastinitially.AlthoughtheSBLThadbeenestablished,questionsre-mained about whether any additional members needed to be added and what the individual responsibilities of team members would be. Existing team members es-tablished regular biweekly meetings for the remainder of the school year at which thefirsttaskwouldbetofinalizemembershipincludingrolesandresponsibilities.TheteamdecidedtofocusonclearlyestablishinganddefiningtheroleofSBLTmembers as a priority because they believed that focusing on the other consensus building activities required a functioning teamfirst.After issueswith the teamwereaddressed,SBLTmemberscouldmoveontootherconsensusbuildingactivi-ties that would require coordinated, systematic efforts.
Monitoring of implementation using SAPSI data over time.Afterfinalizingteammembership, and roles and responsibilities, as well as engaging in some additional consensus-buildingactivitiesthatwerederivedfromSBLTplanningefforts,Sun-shine Elementary was interested in how their school’s consensus levels changed throughout the year. Refer back to Figure 3 above to see the end of the year SAPSI results. The red bars, representing the end of year SAPSI data, demonstrated in-creases in indicatorsofconsensusdevelopmentformost items.Specifically, theschoolhadachievedtheestablishmentofafunctioningSBLT.Theteamalsodis-cussed the fact that the establishment of the team allowed them to engage in ad-ditional activities throughout the year to build consensus. For example, while the SBLTnotedthatinvolvingfacultyinPS/RtIimplementation(Item3)wasnotpres-ent at the beginning of the year, involving staff in implementation was in progress by the end of the school year. By administering the Beliefs Survey to school staff, Sunshine Elementary had achieved a data source to inform consensus development (Item 5) as well as provided a mechanism for involving staff. While this compari-son of beginning of year to end of year data shows promising changes for Sunshine Elementary, it is critical to remember that consensus building is an ongoing activ-ity.DuringYear1,SunshineElementaryestablishedanSBLTthatmetregularlyandprovidedincreasedlevelsofsupporttotheschool.Inaddition,theSBLTbegancollectingdatatoinformwhatsupportsstaffneeded.SBLTmembersagreedthatitwascriticaltocontinuetoengageintheseactivitiestoensurethatbuy-infromkeystakeholders (e.g., district leadership, school staff) continues to increase.
26 Self-Assessment of Problem-Solving Implementation (SAPSI) — Supplements
Problem Solving/Response to Intervention Evaluation Tool Technical Assistance Manual
Self-Assessment of Problem-Solving Implementation Item Scoring Description
The item scoring descriptions below were developed to help Project PS/RtI Coaches facilitate completionoftheSAPSIinFloridaschools.Thesedescriptionsmaybemodifiedtobeconsistentwith language, terms, etc. used in other areas of the nation.
Consensus: Comprehensive Commitment and Support
1. District level leadership provides active commitment and support (e.g., meets to review data and issues at least twice each year):SBLTmembersshoulddiscusstheextenttowhichdistrictlevelleadershipishelpingfacilitateschool-levelcommitmentto PS/RtI. The types of district level leadership activities that are currently occurring should be discussed and compared to activities that would indicate that the district level leadership is engaging schools to facilitate commitment and support. Examples of indicatorsincludemeetingwithSBLTmembers(e.g.,theteam,principals)todiscussissues, providing resources such as funding and professional development opportunities, and communicating with schools on a regular basis regarding district initiatives and directions regarding PS/RtI. Importantly, these examples are not exhaustive but should be thought of as common indicators of district commitment and support.
2. The school leadership provides training, support and active involvement (e.g., principal is actively involved in School-Based Leadership Team meetings): StakeholdersattheschoolidentifiedasindividualsresponsibleforfacilitatingPS/RtIimplementation should be discussed in terms of how much training, support, and involvement related to PS/RtI they are providing. Examples of indicators of leadership involvementincludetheprincipalparticipatinginSBLTmeetings,principalsand/orother school leadership engaging in activities such as presenting to staff and participating in book studies on PS/RtI, and leadership freeing up time for key staff to engage in professional development and implementation activities. Again, these indicators should not be thought of as an exhaustive list.
3. Faculty/staff support and are actively involved with problem solving/RtI (e.g., one of top 3 goals of the School Improvement Plan, 80% of faculty document support, 3-year time line for implementation available): This item assesses the extent to which staff are involved in PS/RtI at the school. A number of examples are included in the item to reference. The key issue to discuss is how much staff members receive communications regarding PS/RtI and are provided opportunities to provide input and participateindecision-making.
4. A School-Based Leadership Team is established and represents the roles of an administrator, facilitator, data mentor, content specialist, parent, and teachers from representative areas (e.g., general ed., special ed.): Although direct representation of each of these roles by an individual is one way to discuss this item, it is not necessary to have one person for each role. Common examples of roles that may be represented
SAPSI Item Scoring Description
Self-Assessment of Problem-Solving Implementation (SAPSI) — Supplements 27
Problem Solving/Response to Intervention Evaluation Tool Technical Assistance Manual
by individuals indirectly include parents and sometimes teachers (although including teachers and parents directly is highly recommended). The key discussion to have with the team in these cases is the extent to which someone with experience working as or with the role advocates from their perspectives. Regardless of whether the roles are directlyorindirectlyrepresentedontheteam,allrolesmustberepresentedforSBLTstoprovide a rating of achieved or maintained.
5. Data are collected (e.g., beliefs survey, satisfaction survey) to assess level of commitment and impact of PS/RtI on faculty/staff: Teams should discuss the extent towhichdata(e.g.,surveys)arecollectedandusedtoexaminehowmuchbuy-inandwhat needs exist among school staff. The data collected can come from Project or school developed instruments. Regardless of the source of the data, teams should ensure that data have been collected for the purpose of assessing consensus issues prior to providing a rating of achieved or maintained.
Infrastructure Development: Data Collection and Team Structure
6. School-wide data (e.g., FAIR, DIBELS, Curriculum-Based Measures, Office Discipline Referrals) are collected through an efficient and effective systematic process: School teams should discuss the extent to which data that can be used for universal screening and to summarize school outcomes are collected. How systematically andefficientlythedataarecollected(e.g.,arethedatacollectedeverytimewithinthe suggested time frame) should be discussed as well. Data that can be collected and analyzedforthepurposesofschool-widedecisionsmustbecollectedaminimumof3times per year for teams to provide a rating of achieved or maintained.
7. Statewide and other databases (e.g., Progress Monitoring and Reporting Network [PMRN], School-Wide Information System [SWIS]) are used to make data-based decisions: Databases provided by the state (e.g., PMRN), the district, or purchased/developed by the school all can be used as indicators for this item. The extent to which theyareactuallyusedtohelpmakedata-baseddecisions,notjustusedtostoredatashould be part of the discussion. Both the availability and use of the database must be present for teams to rate this item as achieved or maintained.
8. School-wide data are presented to staff after each benchmarking session (e.g., staff meetings, team meetings, grade-level meetings): The extent to which data summarizing student academic and behavioral outcomes at the school, grade, and classroom levels are presented to staff should be discussed. Data aggregated at the grade level can be used asanindicatorforthisitembutschool-levelaggregationofdatashouldbediscussedbefore deciding on a rating for the item. The critical issue for teams to agree on is how frequently the performance of students in a given content area is summarized and presented staff following a benchmarking/screening session.
9. School-wide data are used to evaluate the effectiveness of core academic programs: The difference between this item and the previous one is whether discussions occur that
28 Self-Assessment of Problem-Solving Implementation (SAPSI) — Supplements
Problem Solving/Response to Intervention Evaluation Tool Technical Assistance Manual
lead to a decision regarding the effectiveness of academic content area instruction. Thus, the data examined must actually be used (can be in conjunction with other data sources) to make a decision about the extent to which core instruction met the needs of all students for a team to rate this item as achieved or maintained.
10. School-wide data are used to evaluate the effectiveness of core behavior programs: The discussion and decisions regarding rating this item should be the same as #9. The only difference is that the focus should be on behavior rather than academic content areas.
11. Curriculum-Based Measurement (e.g., FAIR, DIBELS) data are used in conjunction with other data sources to identify students needing targeted group interventions and individualized interventions for academics: This item assesses the extent to which universal screening data (i.e., data collected on all students) are used to identify students in need of additional intervention to be successful in a given academic content area. AssessmentssuchasthosefromtheFAIRsystem,DIBELS,Benchmarkassessmentsfrom the curriculum, etc. can be counted as long as they are administered to all students andcriteriaexistthatalloweducatorstodeterminewhichstudentsareat-riskfornotmeeting standards in the content area being examined. Teams should be sure to discuss howfrequentlythedatacollectedareactuallyusedtoidentifystudentsat-riskbeforeselecting a rating.
12. Office Disciplinary Referral data are used in conjunction with other data sources to identify students needing targeted group interventions and individualized interventions for behavior: The discussion for this item should be similar to the discussion regarding #11. Although screening data and procedures may be different for behavior than academics (e.g., ODRs, teacher nomination processes), the rating decided upon by the team should be based on how systematically procedures are used to screen forstudentswhoareat-riskbehaviorally.
13. Data are used to evaluate the effectiveness (RtI) of Tier 2 intervention programs: Teams should discuss how frequently data are used to evaluate how effective Tier 2 intervention protocols/programs are in terms of improving student academic and/or behavioral performance. Importantly, a part of the discussion should be the degree to which schools evaluate individual student responses versus aggregating the responses of students who were receiving the same intervention to determine how effective the protocol/program was. Teams should not rate the activity as achieved or maintained if they do not look at the effectiveness of the program in addition to looking at how individual students receiving Tier II interventions respond.
14. Individual student data are utilized to determine response to Tier 3 interventions: This item assesses the extent to which ongoing progress monitoring data are used in decisions regarding student response to intervention. More frequent progress monitoring data than what is collected through universal screenings must be frequently included in decision-makingforteamstoratethisactivityasachievedormaintained.
Self-Assessment of Problem-Solving Implementation (SAPSI) — Supplements 29
Problem Solving/Response to Intervention Evaluation Tool Technical Assistance Manual
15. Special Education Eligibility determination is made using the RtI model for the following ESE programs:
a. Emotional/Behavioral Disabilities (EBD): Although the State of Florida requires the use of a RtI model in determining eligibility for EBD programs, a team should discuss the extent to which its school actually uses a RtI model in its decisions regarding EBD eligibility when rating this item.
b. Specific Learning Disabilities (SLD): Although the State of Florida requires the use ofaRtImodelindeterminingeligibilityforSLDprograms,ateamshoulddiscusstheextenttowhichitsschoolactuallyusesaRtImodelinitsdecisionsregardingSLDeligibility when rating this activity.
16. The school staff has a process to select evidence-based practices.
a. Tier 1: The team should discuss how it determines if its core instructional practices areevidence-basedinacademicandbehavioralcontentareas.State,district,andschool policies, plans, and procedures all can be used as indicators when addressing this item.
b. Tier 2: The same discussion should occur for supplemental practices as is referenced above for core instruction.
c. Tier 3: The same discussion should occur for intensive, individualized interventions as is referenced above for core and supplemental instructional practices.
17. The School-Based Leadership Team has a regular meeting schedule for problem-solving activities: The team should discuss whether they have structured, protected meeting times to plan for and engage in problem solving. To rate this activity as achieved or maintained, teams must have meetings that are scheduled in advance and that occur multiple times throughout the school year.
18. The School-Based Leadership Team evaluates target student’s/students’ RtI at regular meetings: How often student data are used to evaluate student RtI across tiers should be discussed. The frequency at which teams meet to discuss student RtI and how much data are actually used in the decisions that are made should be factored into the rating of this activity.
19. The School-Based Leadership Team involves parents: There are multiple ways that parents can be involved in PS/RtI planning and practices. Examples include having parents on the team, communicating to and receiving input from parent organizations (e.g., PTAs), and including a representative on the team whose job it is to advocate for parents. The rating of the item should be decided based on the extent to which the team hasevidencethatsuggestsparentsaremeaningfullyinvolvedinSchool-BasedLeadershipTeam activities.
20. The School-Based Leadership Team has regularly scheduled data day meetings
30 Self-Assessment of Problem-Solving Implementation (SAPSI) — Supplements
Problem Solving/Response to Intervention Evaluation Tool Technical Assistance Manual
to evaluate Tier 1 and Tier 2 data: The extent to which regularly scheduled meetings occur in which data are actually used to evaluate the impact of core (Tier 1) and supplemental (Tier 2) instructional practices should be used to rate this activity. The regularity with which these meetings are scheduled and actually occur as well as how frequently data are used (in conjunction with other sources) to inform effectiveness decisions should be included in the team’s discussion. Multiple (i.e., more than once) meetings in which data must occur for the team to rate this item as achieved or maintained.
21. The school has established a three-tiered system of service delivery.
a. Tier 1 Academic Core Instruction clearly identified: The key question to be addressed is does the school have or are they working on ways to communicate what constitutes Tier I Academic Instruction in the building. School, district, and state plans and other documents can be used to provide evidence when rating this item.
b. Tier 1 Behavioral Core Instruction clearly identified: The rating of this item focusing on Tier I Behavior should be based on a similar discussion as is described above for 21a.
c. Tier 2 Academic Supplemental Instruction/Programs clearly identified: The rating of this item focusing on Tier II Academic instruction should be based on a similar discussion as is described above for 21a.
d. Tier 2 Behavioral Supplemental Instruction/Programs clearly identified: The rating of this item focusing on Tier II Behavior instruction should be based on a similar discussion as is described above for 21a.
e. Tier 3 Academic Intensive Strategies/Programs are evidence-based: The team should discuss whether individualized, intensive academic interventions used at the schoolcanbeidentifiedasevidence-based.Documentssuchasthosereferencedin21a or other sources can be used as indicators for this item.
f. Tier 3 Behavioral Intensive Strategies/Programs are evidence-based: The team should discuss whether individualized, intensive behavior interventions used at the schoolcanbeidentifiedasevidence-based.Documentssuchasthosereferencedin21a or other sources can be used as indicators for this item.
22. Teams (e.g., School-Based Leadership Team, Problem-Solving Team, Intervention Assistance Team) implement effective problem solving procedures including:
a. Problem is defined as a data-based discrepancy (GAP Analysis) between what is expected and what is occurring (includes peer and benchmark data): The team should discuss the extent to which data are used to determine the performance gap between the target student(s), and (1) benchmarks/standards (i.e., expected level)
Self-Assessment of Problem-Solving Implementation (SAPSI) — Supplements 31
Problem Solving/Response to Intervention Evaluation Tool Technical Assistance Manual
and (2) peers (tends to be more applicable when problem solving small group or individual student performance). To be rated as achieved or maintained, teams must regularly calculate the size of the performance gap (e.g., subtract expected from current levels of performance, divide expected or peer levels of performance by target student current levels of performance) when identifying a problem.
b. Replacement behaviors (e.g., reading performance targets, homework completion targets) are clearly defined: The extent to which the team concretely andmeasurablydefinestheskill,strategy,orconceptthetargetstudent(s)areexpectedtodemonstrateshouldbediscussed.Howfrequentlytheteamspecifiesthetarget skill/behavior so that everyone understands and agrees on the instructional target should be factored into the rating of this item.
c. Problem analysis is conducted using available data and evidence-based hypotheses: The extent to which the team (1) generates hypotheses based on alterable variables and (2) uses available data to determine if the reasons generated are likely barriers to the target skill/behavior being performed should be discussed. Ratings of achieved or maintained require that both components of problem analysis (i.e., generating potential reasons for student struggles and using data to determine which reasons are the most likely) are completed the majority of the time.
d. Intervention plans include evidence-based (e.g., research-based, data-based) strategies: Ratings on this item should be based on the extent to which the team develops instructional/intervention plans based on (1) strategies that have been demonstrated as effective through research or (2) strategies that have locally collected data to support the impact of their use.
e. Intervention support personnel are identified and scheduled for all interventions: Teams should discuss the extent to which support plans are developed to assist educators responsible for delivering interventions to students. To receive a rating of achieved or maintained, support plans should be developed the majority of the time that include who is responsible, what supports they will provide to the educator(s) delivering the intervention, and when and where the support will be provided.
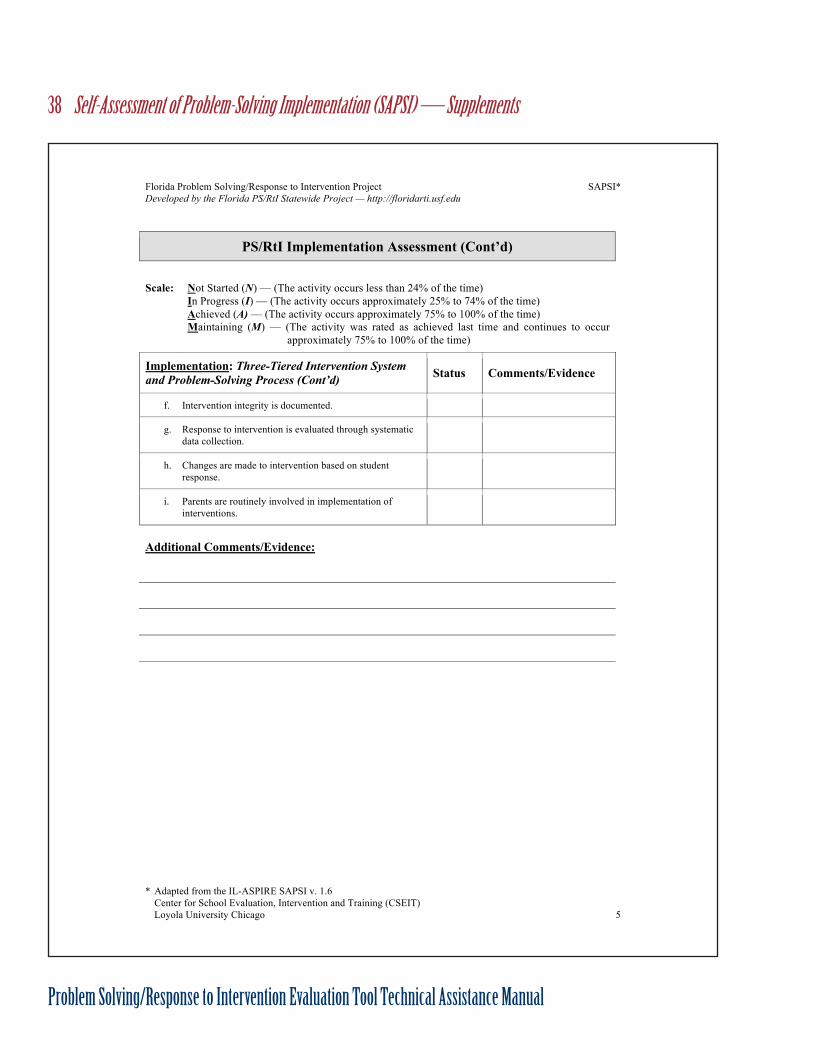
f. Intervention integrity is documented: This item assesses the extent to which evidence that the intervention plan was implemented as intended is documented. Teams should examine how frequently documentation of instructional/intervention fidelityispresentedwhenexaminingstudentRtIbeforeratingthemselvesonthisitem.
g. Response to intervention is evaluated through systematic data collection: Teams should discuss how frequently benchmark and/or ongoing progress monitoring data are used to determine how students responded to instruction/intervention. To receive ratingsofachievedormaintainedonthisitem,datareflectingstudentperformance
32 Self-Assessment of Problem-Solving Implementation (SAPSI) — Supplements
Problem Solving/Response to Intervention Evaluation Tool Technical Assistance Manual
ontheidentifiedskill/behaviorshouldbepresentedanddecisionsmaderegardingstudent RtI (e.g., good, questionable, poor) at the majority of meetings intended to discuss student progress.
h. Changes are made to intervention based on student response: The extent to which student RtI is used to adjust instruction/intervention plans should be discussed when completing this item. How frequently decisions regarding student RtI (e.g., good, questionable, poor) are directly linked to changes made (if any) in the plan for target students must be discussed prior to providing a rating.
i. Parents are routinely involved in implementation of interventions: How frequently parents are meaningfully involved in the intervention plans developed for students should be discussed. Involvement can take many forms (e.g., implementing a component of the plan, being involved in the meetings where the plan is developed, receiving frequent updates on student progress). Although taking part in the actual implementation of an intervention is one way a parent can be involved, teams should not consider it the only way that parents can be involved and still receive ratings of achieved or maintained for this item. What is important for teams to discuss is the extenttowhichparentsareprovidedtheopportunitytoparticipateintheproblem-solving process for their children.
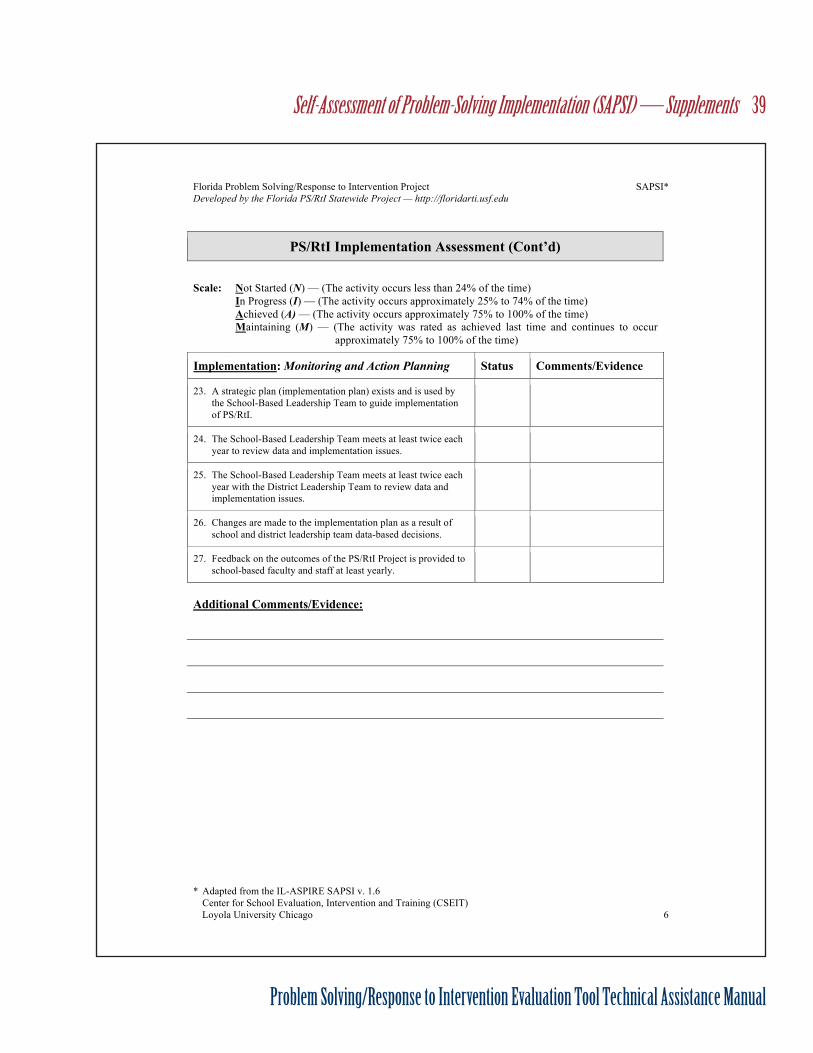
Implementation: Monitoring and Action Planning
23. A strategic plan (implementation plan) exists and is used by the School-Based Leadership Team to guide implementation of PS/RtI: Teams should discuss whether they have a written down, agreed upon plan for how PS/RtI will be implemented in their schools. In addition to whether the plan exists, how comprehensive (e.g., how far down the road does the plan cover; what consensus, infrastructure, and implementation issues are addressed) the plan is should be discussed. To provide a rating of achieved or maintainedforthisitem,amulti-yearplanthataddressesconsensus,infrastructure,andimplementation issues must be present.
24. The School-Based Leadership Team meets at least twice each year to review data and implementation issues: Teams should discuss how often they meet and review student and implementation data to address issues. To provide ratings of achieved or maintained, teams must meet a minimum of two times per year during which they examine and discuss student outcome and PS/RtI implementation data.
25. The School-Based Leadership Team meets at least twice each year with the District Leadership Team to review data and implementation issues: Teams should discuss howoftentheymeetwithmembersoftheirDistrictLeadershipTeam(thefullteamisnotrequired) to discuss the types of issues captured in the previous item. A minimum of 2 times per year is required to provide a rating of achieved or maintained.
26. Changes are made to the implementation plan as a result of school and district leadership team data-based decisions: The difference between this item and the
Self-Assessment of Problem-Solving Implementation (SAPSI) — Supplements 33
Problem Solving/Response to Intervention Evaluation Tool Technical Assistance Manual
previous two is whether the discussions regarding student and implementation data amongSchool-andDistrict-BasedLeadershipTeamsresultedinchangestotheimplementation plan at the school. The frequency that data are used to make changes to the plan at these meetings should be considered before providing a rating.
27. Feedback on the outcomes of the PS/RtI Project is provided to school-based faculty and staff at least yearly: The extent to which data (e.g., student outcomes, implementation data) are shared with faculty and staff at the school should be discussed by the team. How the outcomes are shared (e.g., presentation, newsletter) is not as important as what is shared and the frequency that the information is provided when discussing this item. A minimum of 1 time per year must be established for teams to rate this item as achieved or maintained.
34 Self-Assessment of Problem-Solving Implementation (SAPSI) — Supplements
Problem Solving/Response to Intervention Evaluation Tool Technical Assistance Manual
Florida Problem Solving/Response to Intervention Project SAPSI*
Developed by the Florida PS/RtI Statewide Project — http://floridarti.usf.edu
* Adapted from the IL-ASPIRE SAPSI v. 1.6
Center for School Evaluation, Intervention and Training (CSEIT)
Loyola University Chicago 1
Self-Assessment of Problem Solving Implementation (SAPSI)*
PS/RtI Implementation Assessment
Directions:
In responding to each item below, please use the following response scale:
Not Started (N) — (The activity occurs less than 24% of the time)
In Progress (I) — (The activity occurs approximately 25% to 74% of the time)
Achieved (A) — (The activity occurs approximately 75% to 100% of the time)
Maintaining (M) — (The activity was rated as achieved last time and continues to occur approximately
75% to 100% of the time)
For each item below, please write the letter of the option (N, I, A, M) that best represents your
School-Based Leadership Team’s response in the column labeled “Status”. In the column labeled
“Comments/Evidence”, please write any comments, explanations and/or evidence that are relevant
to your team’s response. When completing the items on the SAPSI, the team should base its
responses on the grade levels being targeted for implementation by the school.
Additional Comments/Evidence:
Consensus: Comprehensive Commitment and
Support Status Comments/Evidence
1. District level leadership provides active commitment and
support (e.g., meets to review data and issues at least
twice each year).
2. The school leadership provides training, support and
active involvement (e.g., principal is actively involved in
School-Based Leadership Team meetings).
3. Faculty/staff support and are actively involved with
problem solving/RtI (e.g., one of top 3 goals of the School
Improvement Plan, 80% of faculty document support, 3-
year timeline for implementation available).
4. A School-Based Leadership Team is established and
represents the roles of an administrator, facilitator, data
mentor, content specialist, parent, and teachers from
representative areas (e.g., general ed., special ed.)
5. Data are collected (e.g., beliefs survey, satisfaction
survey) to assess level of commitment and impact of
PS/RtI on faculty/staff.
Blank Copy of SAPSI
Self-Assessment of Problem-Solving Implementation (SAPSI) — Supplements 35
Problem Solving/Response to Intervention Evaluation Tool Technical Assistance Manual
Florida Problem Solving/Response to Intervention Project SAPSI*
Developed by the Florida PS/RtI Statewide Project — http://floridarti.usf.edu
* Adapted from the IL-ASPIRE SAPSI v. 1.6
Center for School Evaluation, Intervention and Training (CSEIT)
Loyola University Chicago 2
PS/RtI Implementation Assessment (Cont’d)
Scale: Not Started (N) — (The activity occurs less than 24% of the time)
In Progress (I) — (The activity occurs approximately 25% to 74% of the time)
Achieved (A) — (The activity occurs approximately 75% to 100% of the time)
Maintaining (M) — (The activity was rated as achieved last time and continues to occur
approximately 75% to 100% of the time)
Infrastructure Development: Data Collection and
Team Structure Status Comments/Evidence
6. School-wide data (e.g., DIBELS, Curriculum-Based
Measures, Office Discipline Referrals) are collected
through an efficient and effective systematic process.
7. Statewide and other databases (e.g., Progress Monitoring
and Reporting Network [PMRN], School-Wide
Information System [SWIS]) are used to make data-based
decisions.
8. School-wide data are presented to staff after each
benchmarking session (e.g., staff meetings, team
meetings, grade-level meetings).
9. School-wide data are used to evaluate the effectiveness of
core academic programs.
10. School-wide data are used to evaluate the effectiveness of
core behavior programs.
11. Curriculum-Based Measurement (e.g., DIBELS) data are
used in conjunction with other data sources to identify
students needing targeted group interventions and
individualized interventions for academics.
12. Office Disciplinary Referral data are used in conjunction
with other data sources to identify students needing
targeted group interventions and individualized
interventions for behavior.
13. Data are used to evaluate the effectiveness (RtI) of Tier 2
intervention programs.
14. Individual student data are utilized to determine response
to Tier 3 interventions.
15. Special Education Eligibility determination is made using
the RtI model for the following ESE programs:
a. Emotional/Behavioral Disabilities (EBD)
b. Specific Learning Disabilities (SLD)
36 Self-Assessment of Problem-Solving Implementation (SAPSI) — Supplements
Problem Solving/Response to Intervention Evaluation Tool Technical Assistance Manual
Florida Problem Solving/Response to Intervention Project SAPSI*
Developed by the Florida PS/RtI Statewide Project — http://floridarti.usf.edu
* Adapted from the IL-ASPIRE SAPSI v. 1.6
Center for School Evaluation, Intervention and Training (CSEIT)
Loyola University Chicago 3
PS/RtI Implementation Assessment (Cont’d)
Scale: Not Started (N) — (The activity occurs less than 24% of the time)
In Progress (I) — (The activity occurs approximately 25% to 74% of the time)
Achieved (A) — (The activity occurs approximately 75% to 100% of the time)
Maintaining (M) — (The activity was rated as achieved last time and continues to occur
approximately 75% to 100% of the time)
Infrastructure Development: Data Collection and
Team Structure (Cont’d) Status Comments/Evidence
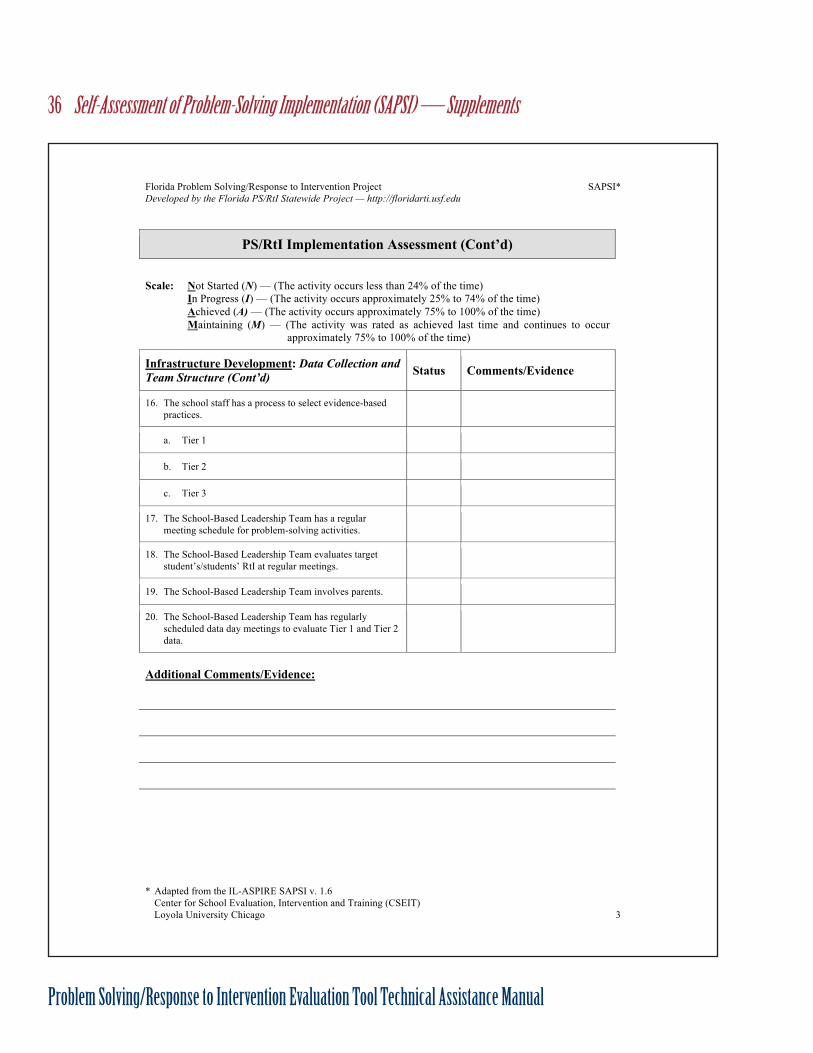
16. The school staff has a process to select evidence-based
practices.
a. Tier 1
b. Tier 2
c. Tier 3
17. The School-Based Leadership Team has a regular
meeting schedule for problem-solving activities.
18. The School-Based Leadership Team evaluates target
student’s/students’ RtI at regular meetings.
19. The School-Based Leadership Team involves parents.
20. The School-Based Leadership Team has regularly
scheduled data day meetings to evaluate Tier 1 and Tier 2
data.
Additional Comments/Evidence:
Self-Assessment of Problem-Solving Implementation (SAPSI) — Supplements 37
Problem Solving/Response to Intervention Evaluation Tool Technical Assistance Manual
Florida Problem Solving/Response to Intervention Project SAPSI*
Developed by the Florida PS/RtI Statewide Project — http://floridarti.usf.edu
* Adapted from the IL-ASPIRE SAPSI v. 1.6
Center for School Evaluation, Intervention and Training (CSEIT)
Loyola University Chicago 4
PS/RtI Implementation Assessment (Cont’d)
Scale: Not Started (N) — (The activity occurs less than 24% of the time)
In Progress (I) — (The activity occurs approximately 25% to 74% of the time)
Achieved (A) — (The activity occurs approximately 75% to 100% of the time)
Maintaining (M) — (The activity was rated as achieved last time and continues to occur
approximately 75% to 100% of the time)
Implementation: Three-Tiered Intervention System
and Problem-Solving Process Status Comments/Evidence
21. The school has established a three-tiered system of service
delivery.
a. Tier 1 Academic Core Instruction clearly identified.
b. Tier 1 Behavioral Core Instruction clearly identified.
c. Tier 2 Academic Supplemental Instruction/Programs
clearly identified.
d. Tier 2 Behavioral Supplemental Instruction/Programs
clearly identified.
e. Tier 3 Academic Intensive Strategies/Programs are
evidence-based.
f. Tier 3 Behavioral Intensive Strategies/Programs are
evidence-based.
22. Teams (e.g., School-Based Leadership Team, Problem-Solving