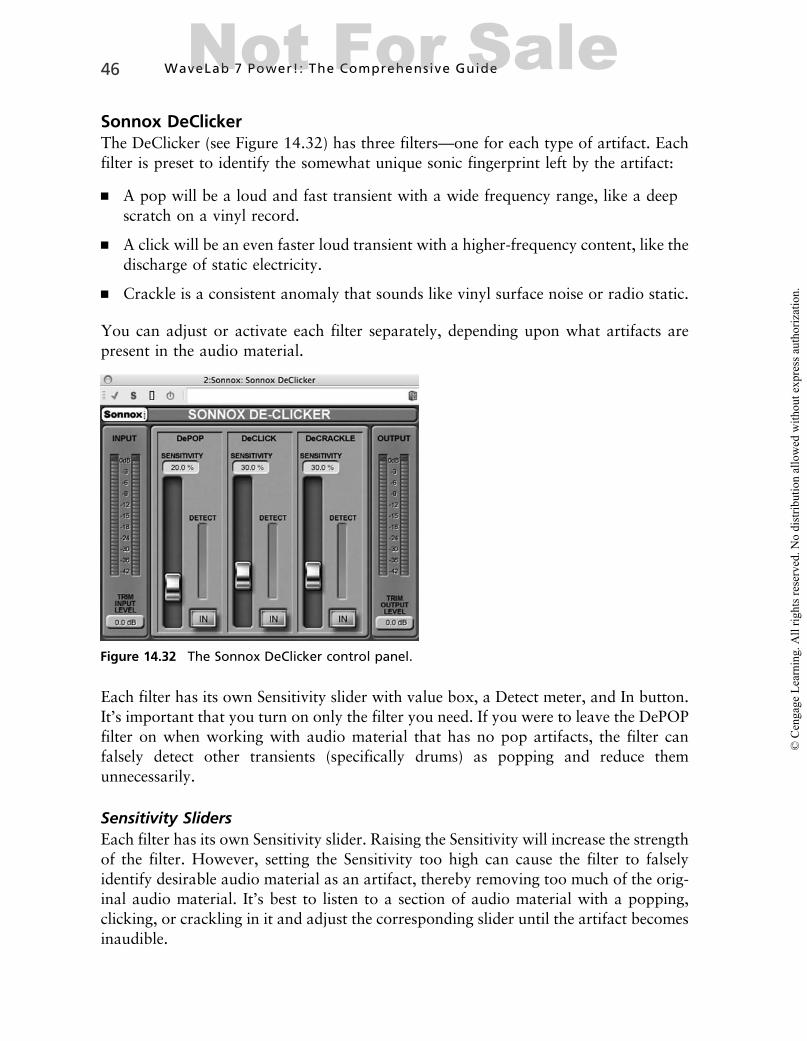
DelayDelay effects usually simulate an acoustic environment. A grand example of a naturaldelay would be the Grand Canyon (or any canyon, for that matter). When you standinside a canyon and clap your hands, it will take a moment for that sound to travel at1,126 feet per second (343 meters per second) from your hands to the canyon wall andback to your ears. In nature, this is usually referred to an echo. In the electronics world,the terms echo and delay are synonymous.
Some natural environments (such as canyons) create very long delays, while others pro-duce shorter delays, sometimes only a few milliseconds apart. If you sing in the shower,you’ll probably enjoy a little delay during your aria.
Common Delay ParametersAll three of the WaveLab Delay plug-ins have the following settings.
DelayThis controls the time interval of the echoes. Large settings sound like canyons, whilesmall settings sound more like your shower. The values range from 0.1 to 5,000 milli-seconds (5 seconds).
FeedbackThis sets how many subsequent echoes you will hear following the first echo. It simu-lates how many canyon walls there are or how many reflective surfaces there are inyour shower. A large value would increase the subsequent echoes, or a value of 0 wouldallow only the first echo to be heard. Be careful when setting the Feedback higher than50%, because the number of repeats can start to feed back on themselves, eventuallybecoming endless.
Lo FilterThis controls how many low frequencies will be contained in the echoes. The valuesrange from 10 to 800 Hz. The lowest setting will ensure that the echoes will have thesame low-frequency content as the dry signal. Higher settings will make the echoessound thinner. Below the knob is a Lo Filter on/off button.
High FilterThis functions the same as the Lo Filter but will attenuate the high-frequency content ofthe echoes. The values range from 1.2 to 20 kHz. The highest setting will ensure thatthe echoes will have the same high-frequency content as the dry signal. Lower settingswill make the echoes sound darker. Below the knob is a Hi Filter on/off button.
MonoDelayAll of the parameters of the MonoDelay (see Figure 14.1) are defined above.
StereoDelayWhat could possibly make a Delay effect more fun? When there are two of them. TheStereoDelay (see Figure 14.2) is two independent delay effects in one plug-in. Eachdelay has the same parameters as the MonoDelay and is individually programmable.
PanThe left and right control panels don’t necessarily correspond to the left and right audiochannels. Rather, each delay can be distributed to both channels equally by setting thePan control to the center position. Fully counterclockwise will make the echoes fromthat delay appear only in the left channel, while fully clockwise will send the echoes tothe right channel.
PingPongDelayThis is a delay that will produce echoes that will alternate between the left and rightaudio channels. For example, if the Delay is set to 300 milliseconds, the first echo willappear 300 milliseconds later in the left channel and 600 milliseconds later in the right
Figure 14.1 The MonoDelay control panel.
Figure 14.2 The StereoDelay control panel.
2 WaveLab 7 Power!: The Comprehensive GuideNot For Sale
channel. It gets its name from watching table tennis if you were seated parallel to thenet. See Figure 14.3.
SpatialThis will control the width of the echoes between the left and right channels. Turningthe Spatial control fully counterclockwise will make the PingPongDelay function iden-tically to the MonoDelay. Fully clockwise will send the echoes hard left and then hardright, again and again, depending on the Feedback setting.
DitheringDithering is a very easy, yet very specialized process. Please refer to the “Intern” and“The Apogee UV22HR” sections at the end of this chapter for detailed descriptions.
DynamicsDynamics processors, like compressors and limiters, are designed to narrow thedynamic range of the audio material. Basically, they make the louds quieter while mak-ing the quiets louder. Dynamics processors usually have controls such as Threshold,Ratio, and Make-Up Gain. The easiest way for me to describe how a compressor worksis by asking you to go get a rubber band. It doesn’t have to be anything special, and youcan use your imagination if you don’t have a rubber band nearby.
Understanding ThresholdBegin by touching the sides of your extended index fingers together and place the rub-ber band around both fingers. The band should now be loose around your fingers.Now pull your fingers apart, but not far enough to make the rubber band taut. Itshould still be loose around your fingers.
Now pull your fingers apart so that the band becomes taut but offers no resistance. Ifyou try to increase the distance between your fingers now, the band will start to offeran increasing amount of resistance.
How does this relate to audio? Let’s complete the metaphor. The distance between yourfingers is the audio volume. The taut rubber band offering no resistance is the com-pressor threshold. The resistance offered by the rubber band when you pull your fingersfarther apart is the compressor in action.
In this example, as long as the volume didn’t become too loud, the compressor didn’tdo anything. In other words, it offered no resistance below a certain threshold. Oncethe volume increased, the compressor offered an increasing amount of resistance.
The Threshold value is expressed in dB from �60 to 0 dB.
Understanding RatioThe other parameter you’ll find on a dynamic processor is Ratio. Let’s use the rubberband metaphor to understand how it works. Pretend the rubber band isn’t rubber, butmade of air. (Yes, I know you can’t make a rubber band out of air, but indulge me for amoment.) Because it’s made of air, it can offer no resistance even when it becomes taut.
Now, magically return the band to its original rubber material. (You didn’t know youwere magic—or maybe you did!) Now the band offers resistance past the point where itbecame taut. But now double the rubber band around itself, and you’ll have to usemore force to move your fingers as far apart as you could before. The more timesyou double up the rubber band, the more force will be required to separate yourfingers.
Using your magic powers again, make the rubber band out of titanium. Now when youpull the band taut (unless you have a big red S on your blue leotard), you cannot moveyour fingers beyond that point.
The degree of resistance that is offered by the band is the ratio. When it’s made of air,it’s a ratio of 1:1 (one-to-one). When it’s rubber, the two stretching sides of the bandmake it 2:1. When the band is doubled over, it has four sides, therefore 4:1. When it’smade of titanium, the ratio is set so high that it becomes a limiter.
To put this in audio terms, the first number of the ratio is the amount of volume in dBthe volume will have to exceed the Threshold to add 1 dB of volume, which is thesecond number in the ratio. So, let’s say your Threshold is set to �20 dB, and yourRatio is set to 2:1. If you exceed the Threshold by 2 dB, the compressor will restrain thelevel so that only 1 dB of that volume is allowed through. If you increase the volumelevel 4 dB past the Threshold, the compressor will allow 2 dB of volume through.Increase the volume 16 dB past the Threshold, and your compressor will allow only8 dB through. That’s a 2:1 ratio.
Let’s increase the ratio 4:1. Now if you exceed the Threshold by 16 dB, the compressorwill allow only 4 dB through. If you set it to 8:1, the compressor gives you only 2 dB.
The Ratio value is expressed in dB from 1:1 to 8:1 dB.
Understanding Make-Up GainThis is not to be confused with the positive advantage of reconciling an argument withyour significant other. Rather, because a compressor is restraining the output of theaudio material, there needs to be a way to restore the level to an appropriate listening
4 WaveLab 7 Power!: The Comprehensive GuideNot For Sale
level. After you’ve added a compressor to the signal flow, you cannot use the (channel)volume fader to increase the level. To do so would be sending more signal into thecompressor, where it would get restrained even more. So the volume adjustmentmust be made on the output of the compressor. In other words, you’re making upthe overall volume (gain) you lost by using the compressor. So while the Thresholdand Ratio make the louds quieter, it’s the Make-Up Gain that makes the quiets louder,thereby narrowing the dynamic range of the audio material.
Make-Up Gain is expressed in dB and has a range of 0 to +24 dB. Most of the Make-UpGain controls on the WaveLab plug-ins will have an Auto button that will have theplug-in automatically adjust the amount of Make-Up Gain based on how much volumeis being restrained. If the Auto control is enabled, the knob will be grayed out and non-adjustable.
Common Dynamics ParametersWe’ve already talked about Threshold, Ratio, and Make-Up Gain. These are controlsfound mainly on compressors and limiters. But there are some other parameters thatare common to most Dynamics processors.
KneeSome Dynamics processors have a Soft Knee or Hard Knee setting. This determines theshape of the dynamic curve. That curve is known as a knee because it looks like ahuman knee. (This will be more apparent when looking at a compressor controlpanel.) A Hard Knee setting makes the Dynamic control abrupt. Most limiters use aHard Knee setting by default. A Soft Knee makes the Dynamic control smoother andmore natural-sounding.
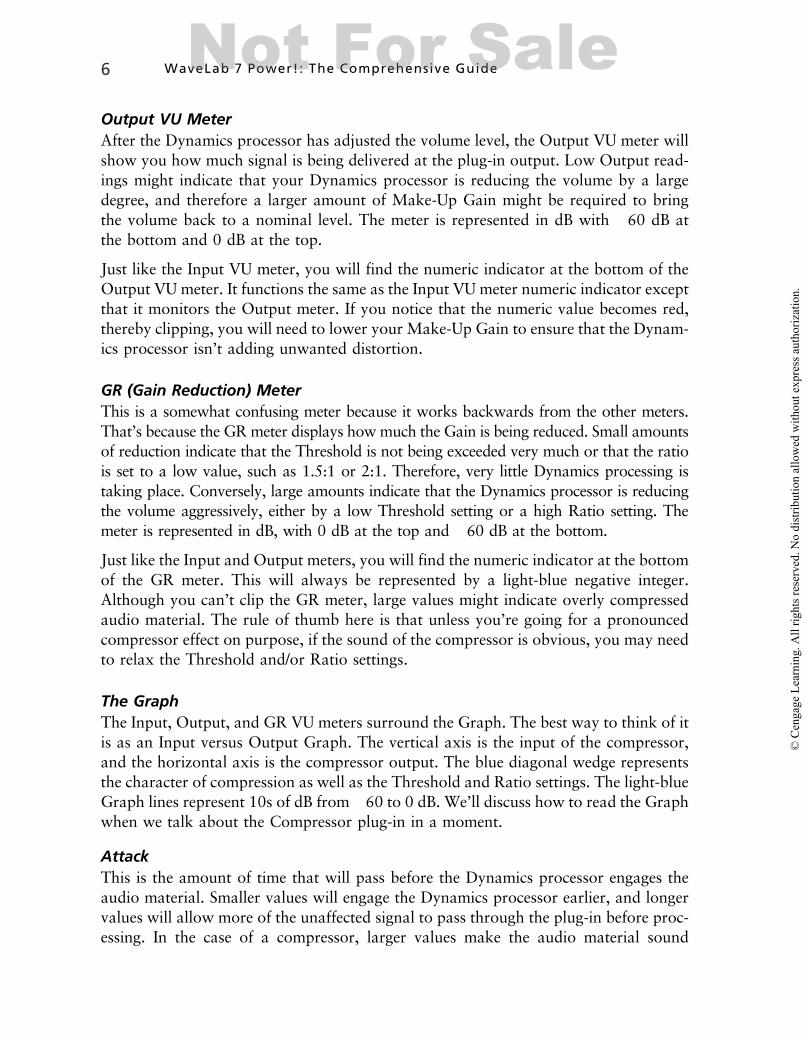
Input VU MeterThe Input VU meter will allow you to monitor the volume of the audio material as itenters the plug-in during playback. Low levels might indicate quiet passages but couldalso inform you that the audio material might be too quiet for a Dynamics processor tofunction properly. The meter is represented in dB, with �60 dB at the bottom and 0 dBat the top.
At the bottom of the meter is a numeric indicator of the loudest volume received at theplug-in’s input. Normally, the value will be a negative number in light blue. If younotice that the numeric value becomes red (thereby becoming a positive number),that indicates that the maximum input level of the plug-in has been exceeded andwill be adding unwanted distortion to your audio material. If this happens, you shouldadjust the audio material volume level. The values will hold their values even after youstop playback, but they will be reset the instant you restart the playback. You can alsoreset the indicator at any time by clicking on it.
Output VU MeterAfter the Dynamics processor has adjusted the volume level, the Output VU meter willshow you how much signal is being delivered at the plug-in output. Low Output read-ings might indicate that your Dynamics processor is reducing the volume by a largedegree, and therefore a larger amount of Make-Up Gain might be required to bringthe volume back to a nominal level. The meter is represented in dB with �60 dB atthe bottom and 0 dB at the top.
Just like the Input VU meter, you will find the numeric indicator at the bottom of theOutput VU meter. It functions the same as the Input VU meter numeric indicator exceptthat it monitors the Output meter. If you notice that the numeric value becomes red,thereby clipping, you will need to lower your Make-Up Gain to ensure that the Dynam-ics processor isn’t adding unwanted distortion.
GR (Gain Reduction) MeterThis is a somewhat confusing meter because it works backwards from the other meters.That’s because the GRmeter displays how much the Gain is being reduced. Small amountsof reduction indicate that the Threshold is not being exceeded very much or that the ratiois set to a low value, such as 1.5:1 or 2:1. Therefore, very little Dynamics processing istaking place. Conversely, large amounts indicate that the Dynamics processor is reducingthe volume aggressively, either by a low Threshold setting or a high Ratio setting. Themeter is represented in dB, with 0 dB at the top and �60 dB at the bottom.
Just like the Input and Output meters, you will find the numeric indicator at the bottomof the GR meter. This will always be represented by a light-blue negative integer.Although you can’t clip the GR meter, large values might indicate overly compressedaudio material. The rule of thumb here is that unless you’re going for a pronouncedcompressor effect on purpose, if the sound of the compressor is obvious, you may needto relax the Threshold and/or Ratio settings.
The GraphThe Input, Output, and GR VU meters surround the Graph. The best way to think of itis as an Input versus Output Graph. The vertical axis is the input of the compressor,and the horizontal axis is the compressor output. The blue diagonal wedge representsthe character of compression as well as the Threshold and Ratio settings. The light-blueGraph lines represent 10s of dB from �60 to 0 dB. We’ll discuss how to read the Graphwhen we talk about the Compressor plug-in in a moment.
AttackThis is the amount of time that will pass before the Dynamics processor engages theaudio material. Smaller values will engage the Dynamics processor earlier, and longervalues will allow more of the unaffected signal to pass through the plug-in before proc-essing. In the case of a compressor, larger values make the audio material sound
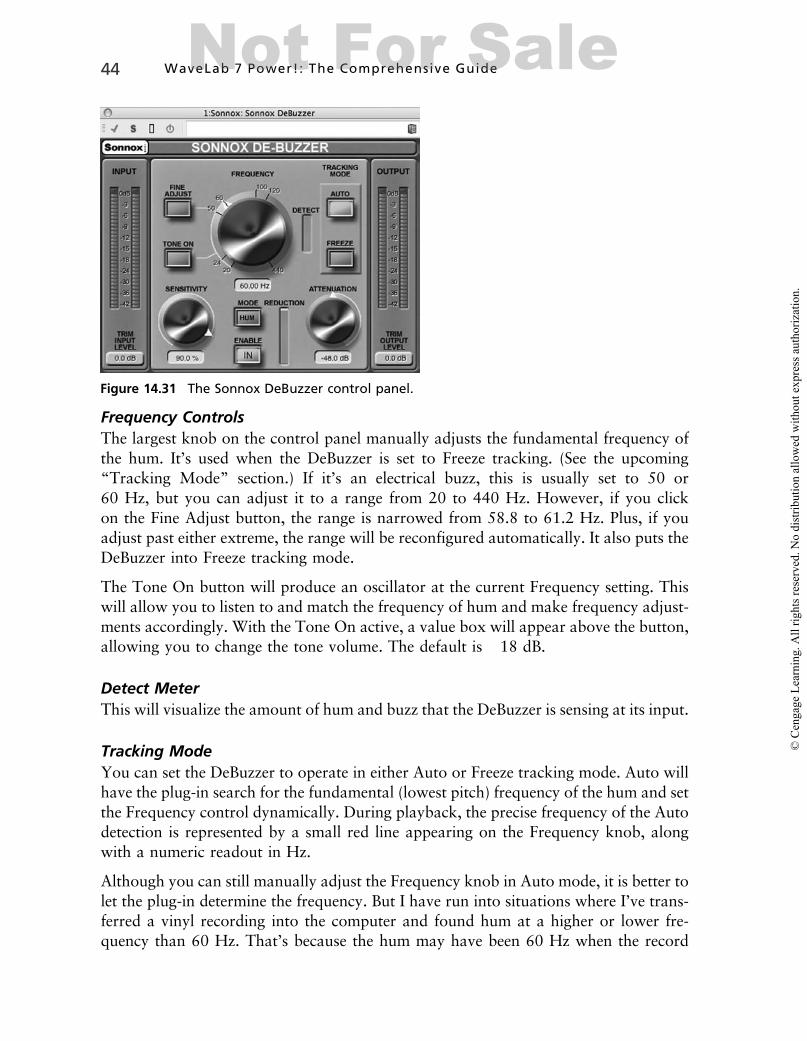
6 WaveLab 7 Power!: The Comprehensive GuideNot For Sale
punchier, while larger values will make a Gate allow signal to pass more gradually. Thevalue is measured in milliseconds and usually ranges from 0.1 to 100 ms. The Gateplug-in has an extended Attack range of up to 1,000 ms (1 second).
HoldThis is how long after the Threshold has been exceeded that the Dynamics processorwill continue to effect the audio material. Short values can make the Dynamics pro-cessor sound bumpy, because the Hold will be processing the signal above the Thresh-old more often. Longer values will smooth the sound by processing the signal lessfrequently. The value is measured in milliseconds and usually ranges from 0.1 to2,000 ms (2 seconds); however, the Compressor plug-in has an extended range of5,000 ms (5 seconds).
ReleaseThis is how long the Dynamics processor continues to affect the audio material oncethe volume drops below the Threshold. Short values will return the volume to its pre-processed level more quickly but can make the audio material sound as if it’s beingturned up quickly during quiet passages. This is an effect referred to as breathing. Lon-ger values will leave the Dynamics processor engaged for a longer time when the vol-ume drops below the Threshold. That will make the introduction of any abrupt audiomaterial pre-processed, because the Dynamics processor will still be engaged. In otherwords, the rubber band will still be stretched.
Most of the Release controls will have an Auto button that will adjust the Releaseconstantly by analyzing the downward taper of the audio material as it drops pastthe Threshold. This is a set-it-and-forget-it control and usually provides very musicaland natural-sounding results.
Live (Rhymes with Five) ButtonSome Dynamics processors have this button. One of the biggest advantages to plug-inDynamics processors is that they can look ahead to the oncoming audio material andbe prepared for it when it finally arrives. Hardware processors cannot make a look-ahead calculation because they cannot read the future, as plug-ins can. The Live buttonis disabled on the plug-in by default to exploit this advantage. The disadvantage is thatthe processor will introduce a larger degree of latency into the signal path. This usuallyisn’t a problem unless you’re recording into WaveLab and through a Dynamics pro-cessor. (See Chapter 15.) In that case, you’d want to disable the look-ahead capabilityof a Dynamics processor by turning on the Live button.
CompressorThe Compressor plug-in (see Figure 14.4) has all of the parameters we’ve already dis-cussed. However, you will need to learn about a few other features of this and otherDynamic processors—specifically, the Graph.
Reading the GraphAs I mentioned earlier in this section, this is the Input versus Output Graph, with Inputon the vertical axis and Output on the horizontal axis. Figure 14.4 shows a Thresholdsetting of �20 dB. That is represented on the Graph by the lower white dot on the bluewedge. You’ll notice that white dot is positioned on the second blue Graph line, alsoindicating a Threshold of �20 dB. Adjusting the Threshold will move that dot on theGraph. (You can also click and drag the dot itself to adjust the Threshold.)
At the top of the blue wedge is another dot that represents the Ratio setting. Youcan alter the Ratio by turning the knob or clicking and dragging the Ratio dot. InFigure 14.4, the Ratio is set to 2:1, so with a Threshold of �20 dB, the Ratio dot islocated at the �10 dB Graph line. Adjusting the Threshold will also adjust the positionof the Ratio dot but not the ratio itself.
Here’s how to use the Graph most effectively. The Input VU meter relates to the Graphlines. If the Compressor is configured as it is in Figure 14.4, watching the Input meterwill help you determine where the Threshold should be set. If the Input meter is bounc-ing past the �20 dB Graph line frequently, then �15 or �20 dB would be appropriateplaces to set the Threshold. Lower input levels would require a lower Threshold for thecompressor to be effective.
The Output meter also relates to the Graph lines. Using Figure 14.4 as an example, ifthe Output meter is getting clipped, you might need to increase the ratio so that morevolume above the Threshold is being reduced. It might also mean you need to adjustyour Make-Up Gain.
Finally, GR meter also relates to the Graph lines. If you see a large amount of GainReduction (from the top of the Graph down) in the �15 to �30 dB range, it meansyour compressor is working really hard and reducing a lot of volume. You’ll also prob-ably be able to hear the over-processing being created by the compressor. In that case,you should refine your compressor Threshold and Ratio settings.
Figure 14.4 The Compressor control panel.
8 WaveLab 7 Power!: The Comprehensive GuideNot For Sale
AnalysisAdjusting the Analysis will determine whether the Compressor will process the audiomaterial based on its Peak volume or Average (RMS) volume, or anywhere in between.Underneath the knob you can see Peak – RMS listed on the control panel. Turning theknob fully counterclockwise will set the Compressor to process peak volume, whilefully clockwise will process only RMS (Average) volume. But you can set the controlanywhere in between for a less stringent analysis. Basically, a peak-leaning analysisworks better for audio material with strong attack transients, such as drums orpiano, while an RMS-leaning analysis will work better for audio material with moregentle attacks, such as vocals, horns, or bowed string instruments.
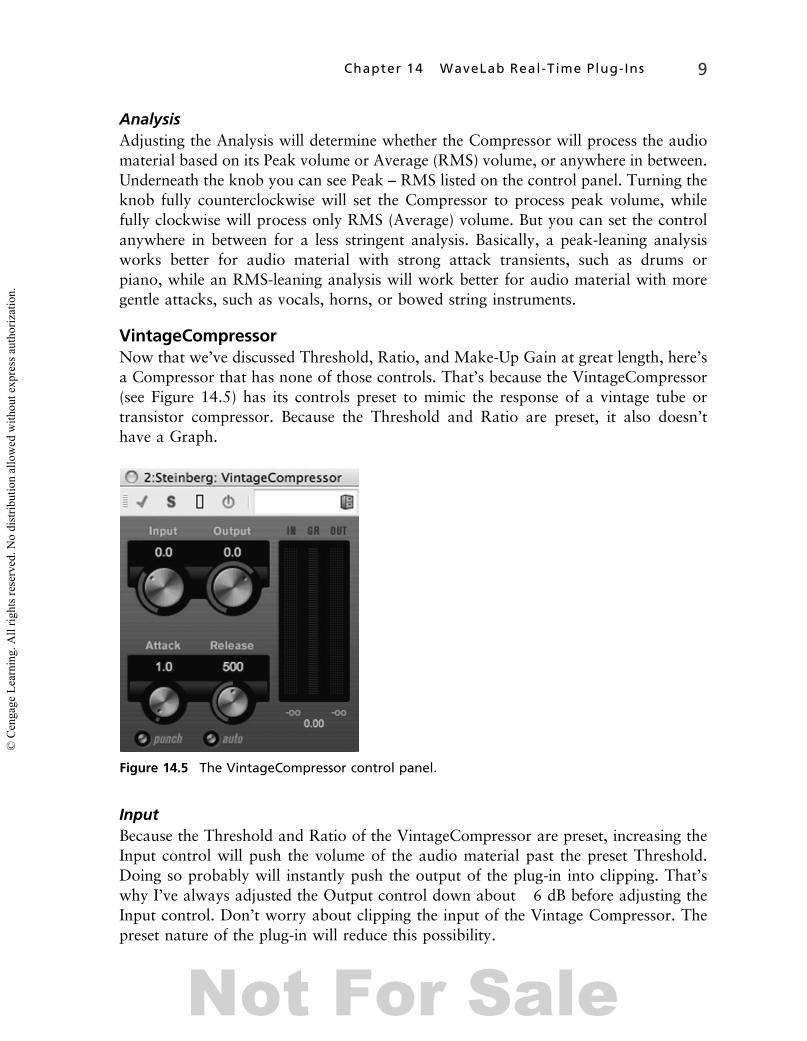
VintageCompressorNow that we’ve discussed Threshold, Ratio, and Make-Up Gain at great length, here’sa Compressor that has none of those controls. That’s because the VintageCompressor(see Figure 14.5) has its controls preset to mimic the response of a vintage tube ortransistor compressor. Because the Threshold and Ratio are preset, it also doesn’thave a Graph.
InputBecause the Threshold and Ratio of the VintageCompressor are preset, increasing theInput control will push the volume of the audio material past the preset Threshold.Doing so probably will instantly push the output of the plug-in into clipping. That’swhy I’ve always adjusted the Output control down about �6 dB before adjusting theInput control. Don’t worry about clipping the input of the Vintage Compressor. Thepreset nature of the plug-in will reduce this possibility.
OutputThis is the Output of the VintageCompressor. Because the Make-Up Gain is preset, thiscontrol simply sets the plug-in output. Lowering the output will allow you to set theInput control higher to introduce more compression. You should take care to set it sothat the Output of the plug-in is never clipped (the red numeric indicator at the bottomof the Output VU meter).
Punch ButtonTube and transistor compressors are not known for having lightning-fast responses toaudio material with fast attack transients. The old vintage models like this plug-in ismodeled after were known for having very musical qualities when processing fast, loudtransients. So even though the VintageCompressor has an adjustable attack, turning onthe Punch will mimic the musical quality of a vintage hardware compressor.
MultibandCompressorOne of the limitations of a standard or single-band compressor is that full-range audiomaterial can confuse the Threshold to be triggered at an inappropriate time. Forinstance, if there was a sudden increase in low frequencies, the Threshold would betriggered, and the compressor would start reducing all of the volume, regardless ofthe frequency range. That’s why a MultibandCompressor (see Figure 14.6) becomesthe most powerful processor in your mastering toolbox.
Make-Up Gain(1 Per Band)
Lo Controls Lo-Mid Controls Hi-Mid Controls Hi Controls
Output VUMeter
Frequency RangeAdjustment
Level Ruler
Output
Frequency Range(20 Hz to 20 kHz)Input VU Meter
(1 Per Band)
Mute BandButton
Solo BandButton
GR Meter(1 Per Band)
Figure 14.6 The MultibandCompressor control panel.
10 WaveLab 7 Power!: The Comprehensive GuideNot For Sale
The MultibandCompressor is made up of four independent compressors with definablefrequency bands (ranges). Each compressor has its own Threshold, Ratio, Attack, andRelease settings. This will allow you to process each frequency band with its own cus-tomized compression settings. That way, the lo compressor won’t affect any of the othercompressors. The bands are divided into lo, lo-mid, hi-mid, and hi frequency ranges.
The MultibandCompressor was also discussed in Chapter 6. So for now, I’m going todescribe only the controls we haven’t learned about to this point.
Mute Band ButtonEach of the bands has a Mute Band button. Clicking this button will disable the bandcompressor. When muted, the band controls will be grayed out, and the button will beyellow. Signal will still pass through the rest of the band compressors normally. Youcan have multiple bands muted simultaneously.
Solo Band ButtonEach band has its own Solo Band button. Clicking this button will prevent signal frompassing through the other band compressors, allowing you to listen to the processing ofan individual band compressor. The Solo Band button will be red when activated, andonly one Solo button can be engaged at a time. (The appearance of the other bands willnot be altered in any way when a Solo Band button is activated.)
Frequency Range AdjustmentBetween the frequency bands is a small white dot. Clicking and dragging this dot to theleft or right will alter the bandwidth between compressors. This will allow you toadjust each compressor to work most appropriately with the ranges of audio material.
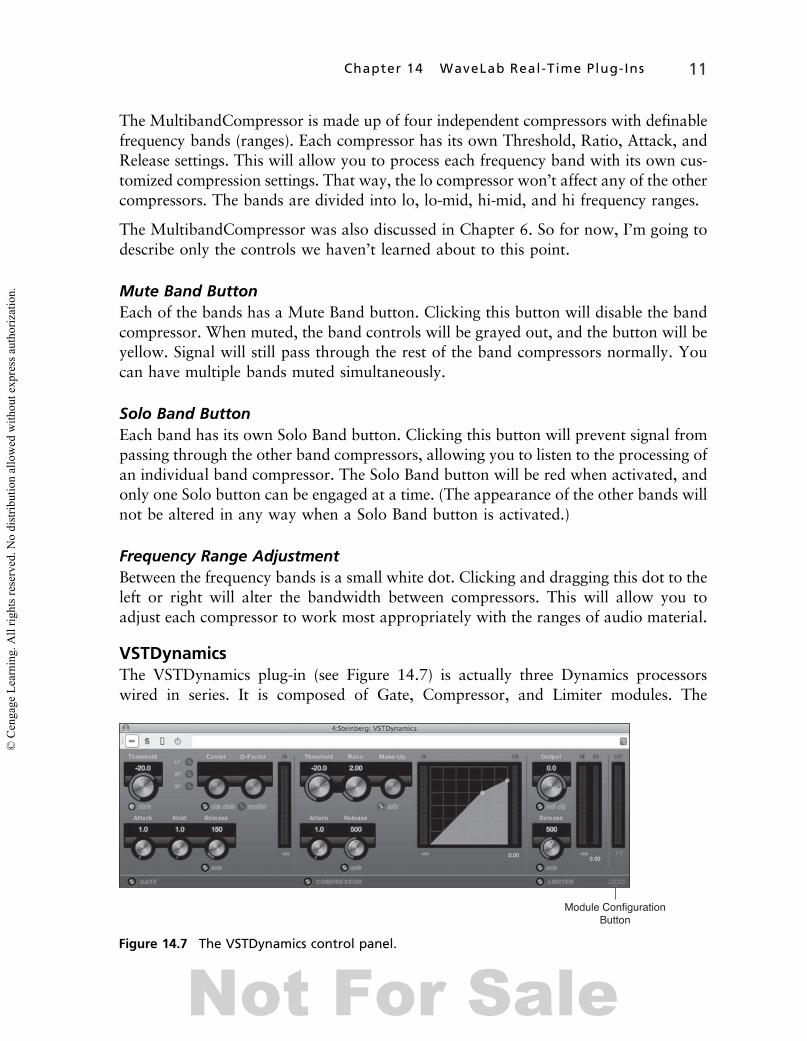
VSTDynamicsThe VSTDynamics plug-in (see Figure 14.7) is actually three Dynamics processorswired in series. It is composed of Gate, Compressor, and Limiter modules. The
advantage to this plug-in is that the modules can interact with one another. Anotheradvantage is that all three modules can exist inside of one Master Section effects slot.
Because most of the controls on the VSTDynamics plug-in are identical to the individ-ual components from which this plug-in is built, please refer to the Gate, Compressor,and Limiter plug-ins in the chapter for more detail. However, this plug-in does notinclude Analysis and Live buttons for the Gate and Compressor. Also, because theLimiter Input is controlled from the Output level of the Compressor, there is no LimiterInput knob.
Module Configuration ButtonIn the lower-right corner of the plug-in is the Module Configuration button. Repeatedlyclicking this button will rearrange the order of the modules. Because they’re wired inseries (one into the next, into the next), different orders can produce a variety of results.The possible orders are the default of Gate > Compressor > Limiter, Compressor >Limiter > Gate, and Compressor > Gate > Limiter.
DeEsserThe DeEsser (see Figure 14.8) is a specialized type of compressor designed to removevocal sibilance. That’s the S sound in human speech. For example, the word Mississippihas three S sounds. Sometimes the S sound can be overbearing. You could use an EQ tonotch out those frequencies, but the constant muting of those frequencies would com-promise the sound of the recording when no S sounds exist. Instead, the DeEsser mon-itors the frequencies where excess sibilance usually occurs and compresses thosenarrow frequency bands.
Figure 14.8 The DeEsser control panel.
12 WaveLab 7 Power!: The Comprehensive GuideNot For Sale
ReductionThis is the amount of S attenuation offered by the DeEsser. The values are depicted indB. Higher values will reduce the S sound more aggressively.
Auto ThresholdThis is the only WaveLab Dynamics processor that has an Auto button for Threshold.When activated, the processor will constantly monitor the audio material for theS sound and set the Threshold automatically.
Other Uses for the DeEsserEvery so often, a client will bring me a mastering project in which the hi-hat cymbalshave been mixed inappropriately loudly. Because the S sound and hi-hats share asimilar frequency band, I’ve actually had really good luck using the DeEsser to reducehi-hat and other cymbal volumes.
LimiterA limiter (see Figure 14.9) is similar to a compressor except that the Ratio is usually setextremely high. This is known as a brick wall. In other words, a limiter will radicallyclamp the volume of the audio material as if it ran into a brick wall and never let thevolume exceed the Limiter Output setting. Or, to use my rubber band metaphor, this iswhen you turn the band into titanium. (Or remember the old guy guarding the bridgein Monty Python and the Holy Grail? His famous line was, “None shall pass.” Well, ifKing Arthur is the audio material, the old guy is the limiter.)
Note: If you want a true brick-wall limiter, use the Maximizer or Peak Masterinstead.
The Input and Output controls work identically to those on the VintageCompressorplug-in. But in the Limiter, the preset Threshold and Ratio are much more extreme.
Overcooking a LimiterIf you use a limiter to raise the average volume level beyond a certain level, you’ll reallystart to hear the limiter. That’s not a good thing. It’s commonly known as overcooking.There’s only so loud you can raise the average volume before it starts to fall apart. Keepthat in mind when a client continually pesters you for “More volume! MORE volume!MORE, MORE VOLUME!”
MaximizerThe Maximizer (see Figure 14.10) is another type of limiter, but it is more adept atraising the average volume levels of audio material, thereby increasing the perceivedvolume. Another term for the Maximizer is a mastering limiter. Like a limiter, it willalso prevent volumes from exceeding the output setting.
The Maximizer was also discussed in Chapter 6. So for now, I’m going to be describingonly the controls we haven’t learned about to this point.
OptimizeThis is an arbitrary value, but raising this value will increase the average volume levelof the audio material. Just like any limiter, setting the volume too loud will overcookthe sound, even when the level is guaranteed not to exceed 0 dB.
Figure 14.10 The Maximizer control panel.
14 WaveLab 7 Power!: The Comprehensive GuideNot For Sale
Soft Clip ButtonWhen enabled, the Soft Clip will relax the limiting of the peaks. It results in a morevintage or tube-like response from the Maximizer. I usually have Soft Clip enabled.However, if my client is asking for more volume, I’ll turn this off so that the Maximizeroffers a more mathematically strict increase in perceived volume.
GateA Gate (see Figure 14.11) is similar to a compressor, except that instead of reducing thevolume that crosses the Threshold, a Gate will not allow sound to pass through until itcrosses the Threshold. This is a great tool for automatically reducing background noise.
The Threshold control is at the upper-left corner of the control panel. You would setthe Threshold right above the level of the background noise so that only signal louderthan the background noise will be allowed through.
State LightThe State light has three colors, similar to a traffic-control light. Red indicates that theGate is closed and not letting any audio through. Green indicates that the Gate is wideopen and not impeding the flow of audio material. Yellow indicates that the Gate ispartially open. This occurs when the audio level is hovering around the Threshold level.
Side Chain ControlsEnabling the Side Chain will install a filter into Gate. That filter will prevent theThreshold from being triggered by non-essential frequencies. You’d start by choosinga filter type: LP (Low Pass), BP (Band Pass), or HP (High Pass). The Center control setsthe frequency of the filter and is variable between 50 Hz and 20 kHz. The Q-Factor setsthe bandwidth of the Center frequency. The Monitor button allows you to hear theaudio material as the filter is affecting it.
A practical example of using the Side Chain controls would be recording a keynotespeaker in a hotel that happens to be under renovation. The large trucks outsidemight be making loud rumbling noises that falsely trigger the Gate Threshold. Iwould select an HP filter and set the Center to 250 Hz and the bandwidth to 1.0.That way, only frequencies above 250 Hz (such as human speech) would trigger theThreshold.
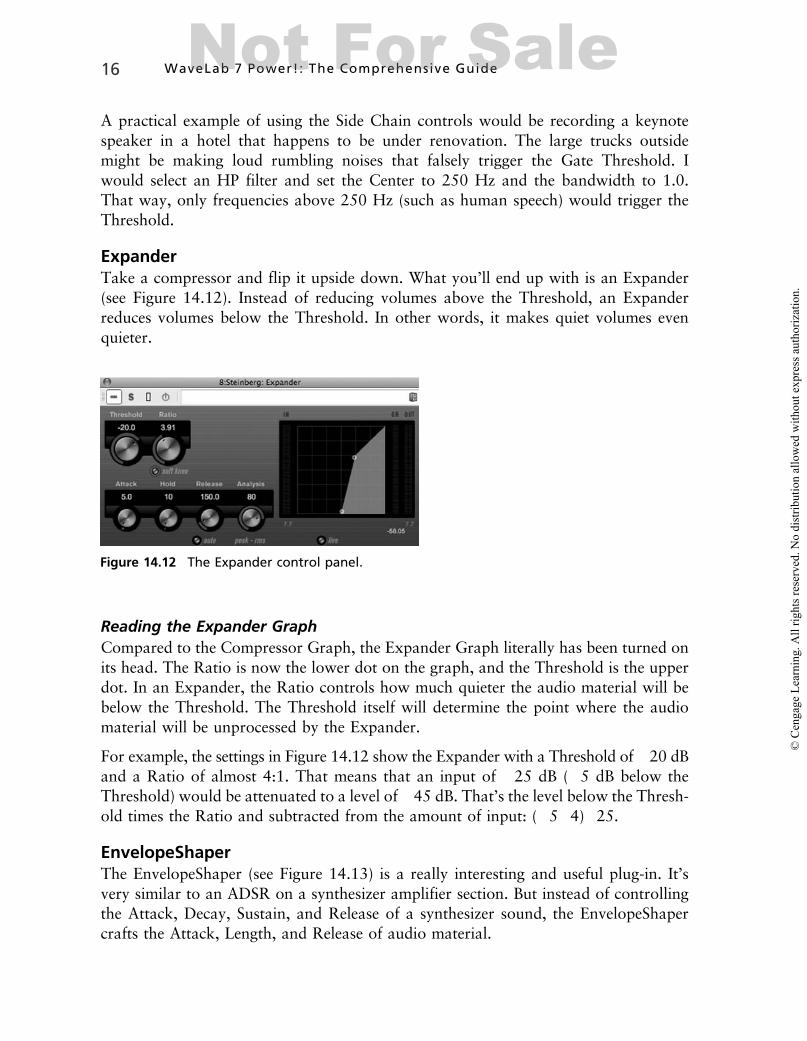
ExpanderTake a compressor and flip it upside down. What you’ll end up with is an Expander(see Figure 14.12). Instead of reducing volumes above the Threshold, an Expanderreduces volumes below the Threshold. In other words, it makes quiet volumes evenquieter.
Reading the Expander GraphCompared to the Compressor Graph, the Expander Graph literally has been turned onits head. The Ratio is now the lower dot on the graph, and the Threshold is the upperdot. In an Expander, the Ratio controls how much quieter the audio material will bebelow the Threshold. The Threshold itself will determine the point where the audiomaterial will be unprocessed by the Expander.
For example, the settings in Figure 14.12 show the Expander with a Threshold of �20 dBand a Ratio of almost 4:1. That means that an input of �25 dB (�5 dB below theThreshold) would be attenuated to a level of �45 dB. That’s the level below the Thresh-old times the Ratio and subtracted from the amount of input: (�5�4)�25.
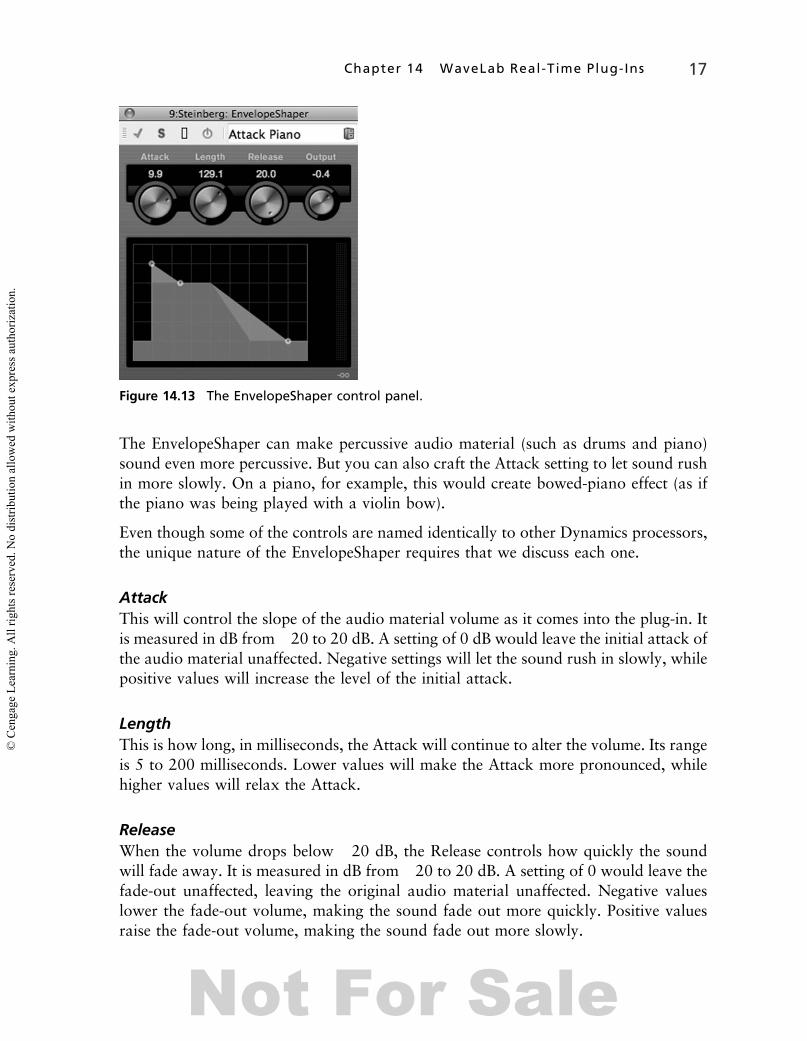
EnvelopeShaperThe EnvelopeShaper (see Figure 14.13) is a really interesting and useful plug-in. It’svery similar to an ADSR on a synthesizer amplifier section. But instead of controllingthe Attack, Decay, Sustain, and Release of a synthesizer sound, the EnvelopeShapercrafts the Attack, Length, and Release of audio material.
Figure 14.12 The Expander control panel.
16 WaveLab 7 Power!: The Comprehensive GuideNot For Sale
The EnvelopeShaper can make percussive audio material (such as drums and piano)sound even more percussive. But you can also craft the Attack setting to let sound rushin more slowly. On a piano, for example, this would create bowed-piano effect (as ifthe piano was being played with a violin bow).
Even though some of the controls are named identically to other Dynamics processors,the unique nature of the EnvelopeShaper requires that we discuss each one.
AttackThis will control the slope of the audio material volume as it comes into the plug-in. Itis measured in dB from �20 to 20 dB. A setting of 0 dB would leave the initial attack ofthe audio material unaffected. Negative settings will let the sound rush in slowly, whilepositive values will increase the level of the initial attack.
LengthThis is how long, in milliseconds, the Attack will continue to alter the volume. Its rangeis 5 to 200 milliseconds. Lower values will make the Attack more pronounced, whilehigher values will relax the Attack.
ReleaseWhen the volume drops below �20 dB, the Release controls how quickly the soundwill fade away. It is measured in dB from �20 to 20 dB. A setting of 0 would leave thefade-out unaffected, leaving the original audio material unaffected. Negative valueslower the fade-out volume, making the sound fade out more quickly. Positive valuesraise the fade-out volume, making the sound fade out more slowly.
OutputThis is the Output level of the plug-in. Because the EnvelopeShaper is capable of addingas much as 20 dB to the Attack of the audio material, it’s easy to clip the Output. Keepyour eye on the numeric indicator at the bottom of the Output VU meter to make sureit never turns red. If the does, the Output of the plug-in has been clipped, and youshould lower the Output so that it does not introduce unwanted distortion.
Reading the EnvelopeShaper GraphThe Attack, Length, and Release controls are also represented by the small white dotson the Graph. You can adjust their values by clicking and dragging the dots.
The graph itself is a representation of the shape of the EnvelopeShaper. But underneaththe bright-blue Envelope Graph is a darker-blue Graph that indicates the natural enve-lope of the audio material. This will help you to visualize the effect of the Envelope-Shaper versus the original envelope.
DistortionNow that we have inexpensive digital audio editors that can provide us withpristine sonic quality and character, here’s a plug-in that can take all that away (seeFigure 14.14). I always thought it was odd that grunge music came into vogue duringthe birth of the digital recording revolution. All of a sudden, every grunge band wanteddistortion effects on their vocals. After spending a lifetime dreaming of having a digitalrecording studio, void of unwanted distortion, I was getting paid to add distortion tovocal tracks.
BoostThis is the amount of distortion that will be added to the audio material. It’s an arbi-trary value from 0 to 10. (What, no 11?)
FeedbackThis will route some processed signal back into the Boost control, creating more dis-tortion. It’s another arbitrary value from 1 to 10.
Figure 14.14 The Distortion control panel.
18 WaveLab 7 Power!: The Comprehensive GuideNot For Sale
ToneThis will craft the tonal characteristic of the distortion. Lower values will darken thedistortion, giving it a warmer tube-like quality. Higher values will boost the high fre-quencies, making the distortion fuzzier.
SpatialIf you’re working with stereo audio material, the Spatial control will add separationbetween the left and right audio channels, creating a wider stereo effect. When you’reworking with mono material, the control will not add any Spatial effect. If you want toadd the effect to a mono file, copy the mono channel into both channels of a new stereofile.
EQ (Equalization or Tone Control)EQ is a tool for crafting the tonal characteristics of audio material. Most of the adjec-tives used to describe a sound relate to its tone. For example, if someone describes asound as boomy, that means it has a lot of low-frequency energy. Rich means an abun-dance of lo-mid frequencies. Bright means a lot of hi-mids. Airy means a lot of highs. Bycrafting the tone during the mastering of audio material, you can make it have asmoother and more even tone.
Understanding EQ will involve a little discussion of emphasis/de-emphasis and psycho-acoustics. When increasing the volume of a frequency range, you are increasing itsemphasis. Conversely, when you decrease the volume of a frequency range, you aredecreasing the emphasis. This is known as de-emphasis.
The way the human ear perceives emphasis/de-emphasis is related to psychoacoustics.For example, if you emphasize the high frequencies, the listener might perceive thechange as a de-emphasis of low frequencies. When a client asks me to make the master-ing sound warmer, I don’t necessarily emphasize the lows and lo-mids. Rather, I’llde-emphasize the hi-mids and highs. For that reason, EQ should always be consideredan emphasis/de-emphasis tool. In the other words, the controls can be turned up anddown. Because we’ve grown up with the concept of more is better, new users tend toonly turn things up, up, and up.
Visualizing EQ Emphasis/De-EmphasisOne of the best ways to see what any of the WaveLab EQs are doing to the sound is touse the Signal Generator (refer to Chapter 12) to create a white noise file. I recommendsetting the Single Generator Global Gain control to �12 dB before creating thefile. Then put that file in loop playback by pressing / (forward slash). Next, load theGEQ-10 into Master Section Effects Slot 1, the GEQ-30 into Slot 2, and the StudioEQinto Slot 3. With the Spectroscope Meter visible (refer to Chapter 9), start playback andturn down a slider on the GEQ-10. Watch what happens on the Spectroscope, andyou’ll get an idea of how an equalizer works. You can do the same thing with theGEQ-30, StudioEQ, PostFilter, and DualFilter.
GEQ-10GEQ refers to Graphic Equalizer, while 10 refers to the number of adjustable frequencybands. Using a Graphic EQ is a little like having volume controls for differentfrequencies.
The GEQ-10, shown in Figure 14.15, has 10 frequency bands, starting at 31.5 Hz andending at 16 kHz. Even though the frequency range isn’t listed as 20 Hz to 20 kHz, theGEQ-10 is full-range.
The GEQ-10 has an Output VU meter and an Output control. Because an EQ will beadding and subtracting from the overall volume, it is important to monitor the OutputVU meter to make sure you haven’t clipped the Output of the plug-in. Conversely, ifyou’re de-emphasizing several frequencies, you might have to raise the Output controlto make up the gain.
Frequency SlidersThese are volume controls for each frequency range. The center frequency of each islocated directly below the slider, while the slider position is displayed directly above thefader. The values are represented in positive and negative dB. Positive values will indi-cate the slider is emphasized, while negative values will indicate de-emphasis.
Clicking and dragging the slider up and down will adjust the amount of emphasis/de-emphasis. You can also draw across multiple sliders by clicking and dragging one sliderand then moving your pointer up and/or down while dragging left and/or right. If youknow the value you want to input, double-click on the slider’s Value indicator atthe top of the control panel and type in the desired value. The maximum value willbe constrained by the Range control. (See the upcoming “Range” section.)
Filter ModeButton
Figure 14.15 The GEQ-10 control panel.
20 WaveLab 7 Power!: The Comprehensive GuideNot For Sale
Ctrl/Command-click on a slider, and it will return to the 0-dB position. You can use thesame method to draw multiple sliders back to 0 dB.
The bandwidth (Q-Factor) of each slider is preset but can be determined by looking atthe frequencies of the surrounding sliders. In other words, if you’re adjusting the 1-kHzslider, the slider to the left is 500 Hz, and the slider to the right is 2 kHz. So the band-width of the 1-kHz slider is 750 Hz to 1.5 kHz. Determining bandwidth in this manneris accurate only when using the default Filter mode of True Resp (True Response; seethe “Filter Mode Button” section).
Flatten ButtonClicking the Flatten button will reset all the sliders to their 0-dB position.
RangeThis will control the GEQ-10 dB Range. The value is represented in dB, and the defaultsetting of 12 will offer +/� 12 dB of slider movement. For finer control, you can lowerthe Range as low as 0 dB, but that Range would render the EQ disabled. A more sen-sible setting of 6 would allow each slider to be moved +/� 6 dB.
Invert ButtonActivating the Invert button will flip the EQ on its head. Any emphasized frequencieswould be de-emphasized and vice versa. When the EQ is inverted, you can monitor theantithesis of your EQ curve. Bear in mind that the visual positions of the frequencyfaders themselves will not invert.
Filter Mode ButtonClicking this button will allow you to select from one of six filter modes. Some modesare serial, where the signal flows from one slider into the next, whereas other modes areparallel, where the signal flows through each slider simultaneously. The rule of thumbis that using parallel filters will work better with complex audio material. That’s whyparallel filter modes usually offer a more musical response when mastering. I’ll do mybest to accurately describe how the Filter modes work, but I recommend doing somecritical listening with your audio material to really hear the sonic personalities of eachmode.
True Resp (True Response) is a serial mode and will keep the slider bandwidths atmathematically accurate distances. (See the “Frequency Sliders” section.)
Digi Stand (Digital Standard) will allow the highest frequency slider (the slider farthestto the right) to extend its high-frequency curve to the limit of the audio material sam-pling frequency. In other words, in the case of the GEQ-10, if the audio material samplefrequency is 96 kHz, the 16-kHz slider will extend its high curve to 48 kHz. (Refer toChapter 1 for an explanation of sampling frequency and the Nyquist theorem.)
Classic puts all the sliders into parallel. In this mode, the filters work more efficientlybecause they all work on the same input. That’s how Classic mode works so well oncomplex audio material. Interestingly, the tone will be altered even when the sliders areall set to 0 dB. Although I can’t explain why, I can tell you that Classic mode worksreally well for mastering. But it’s a good idea to audition the EQ using the Bypass but-ton so that you can hear how the Classic mode is crafting the tone even when the slidersare flat.
ConstQ U (Constant Q-Factor, Unsymmetrical) is a parallel mode where the first andlast sliders will extend their frequency ranges in relation to the sampling frequency ofthe audio material. In other words, the bandwidth of the first and last slider will bemuch wider and therefore will affect more frequencies.
ConstQ S (Constant Q-Factor, Symmetrical) is a parallel mode where the bandwidthincreases with the gain of the slider. The more you move the slider, the wider the band-width becomes.
Resonant is a serial mode where moving one slider will result in a simultaneous yetsmaller opposite movement of the adjacent frequency bands. The sliders won’t actuallymove, but if you emphasize 1 kHz, then the 500-Hz and 2-kHz frequency ranges willbe de-emphasized.
GEQ-30The GEQ-30 (see Figure 14.16) is a graphic EQ with 30 frequency bands.
All of the operations and controls are identical to the GEQ-10. The GEQ-30 simply hasmore faders and therefore narrower frequency ranges.
StudioEQThe StudioEQ (see Figure 14.17) is a parametric EQ. It has four bands with selectableemphasis/de-emphasis, center frequency, and Q-Factor. While a graphic equalizer hasmore bands than the StudioEQ, the frequency is adjustable within 1 Hz unit. Thatmakes a parametric EQ much pickier than a graphic EQ.
Figure 14.16 The GEQ-30 control panel.
22 WaveLab 7 Power!: The Comprehensive GuideNot For Sale
The four bands have their individual controls on the left-hand side of the control panel.On the right-hand side, there is a graph. You can program the EQ from either theknobs or the Graph. The bottom-to-top orientation of the bands might lead you tobelieve they are designed to be lo, lo-mid, hi-mid, and hi EQ filters, but that’s notthe case. The four bands are arbitrarily named: Band 1, Band 2, and so on. That’sbecause the center position of each band is selectable between 20 Hz and 20 kHz.So it’s possible that, for example, the center frequency of Band 4 could be lowerthan that of Band 3. However, Bands 1 and 4 have features that make them betterfor lo and hi EQ.
Band On/Off ButtonTo the left of control panel are four Band On/Off buttons. These will allow you toaudition each filter separately. When you click one of the filters on, its correspondingdot will appear on the Graph.
GainThis is the amount of emphasis/de-emphasis for each band. Gain is represented in dBand is variable +/� 24 dB.
Inv (Invert) ButtonEach band can be flipped on its head to audition the antithesis of the band. This isuseful when you’ve emphasized a frequency and swept across the frequency range tofind a specific frequency you’d like to de-emphasize. When you’ve found it, clicking theInv button will turn the emphasis into a de-emphasis.
Freq (Frequency)This will define the center frequency of the band. Each frequency has a range of 20 Hzto 20 kHz.
Q-FactorThis will control the bandwidth of each frequency band. A setting of 0.5 will set thebandwidth as wide as possible, while a setting of 10 will make the filter into a verynarrow notch.
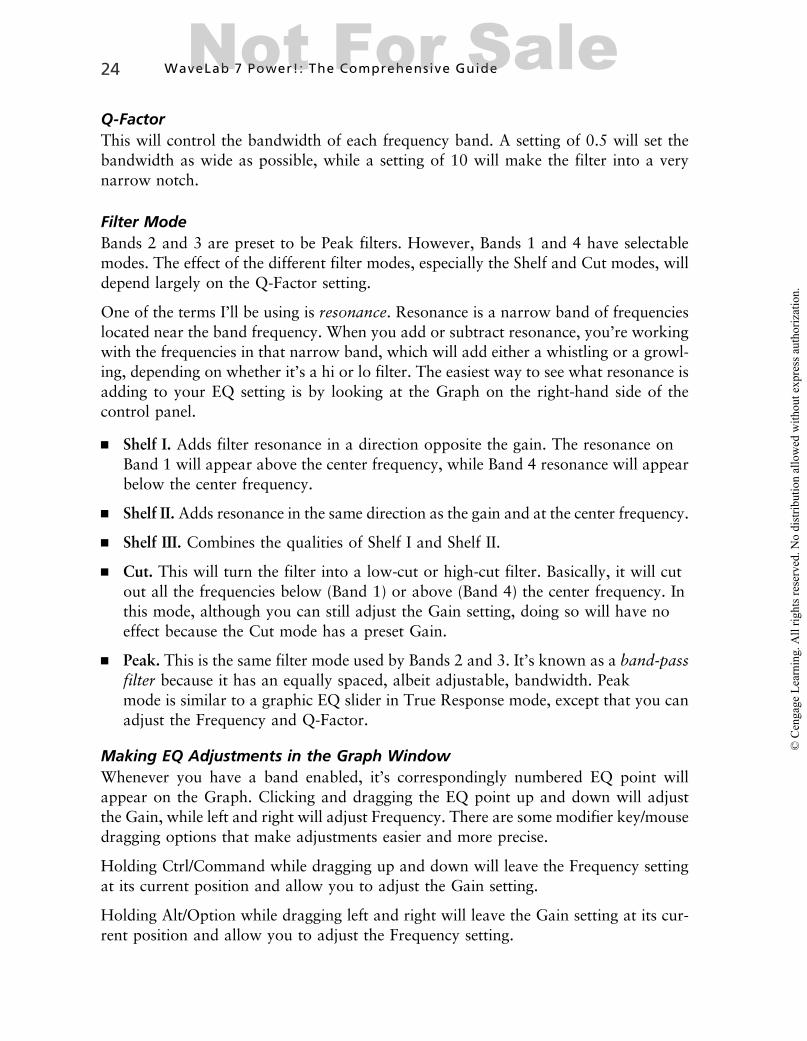
Filter ModeBands 2 and 3 are preset to be Peak filters. However, Bands 1 and 4 have selectablemodes. The effect of the different filter modes, especially the Shelf and Cut modes, willdepend largely on the Q-Factor setting.
One of the terms I’ll be using is resonance. Resonance is a narrow band of frequencieslocated near the band frequency. When you add or subtract resonance, you’re workingwith the frequencies in that narrow band, which will add either a whistling or a growl-ing, depending on whether it’s a hi or lo filter. The easiest way to see what resonance isadding to your EQ setting is by looking at the Graph on the right-hand side of thecontrol panel.
n Shelf I. Adds filter resonance in a direction opposite the gain. The resonance onBand 1 will appear above the center frequency, while Band 4 resonance will appearbelow the center frequency.
n Shelf II. Adds resonance in the same direction as the gain and at the center frequency.
n Shelf III. Combines the qualities of Shelf I and Shelf II.
n Cut. This will turn the filter into a low-cut or high-cut filter. Basically, it will cutout all the frequencies below (Band 1) or above (Band 4) the center frequency. Inthis mode, although you can still adjust the Gain setting, doing so will have noeffect because the Cut mode has a preset Gain.
n Peak. This is the same filter mode used by Bands 2 and 3. It’s known as a band-passfilter because it has an equally spaced, albeit adjustable, bandwidth. Peakmode is similar to a graphic EQ slider in True Response mode, except that you canadjust the Frequency and Q-Factor.
Making EQ Adjustments in the Graph WindowWhenever you have a band enabled, it’s correspondingly numbered EQ point willappear on the Graph. Clicking and dragging the EQ point up and down will adjustthe Gain, while left and right will adjust Frequency. There are some modifier key/mousedragging options that make adjustments easier and more precise.
Holding Ctrl/Command while dragging up and down will leave the Frequency settingat its current position and allow you to adjust the Gain setting.
Holding Alt/Option while dragging left and right will leave the Gain setting at its cur-rent position and allow you to adjust the Frequency setting.
24 WaveLab 7 Power!: The Comprehensive GuideNot For Sale
Shift-dragging up/down or left/right will adjust the Q-Factor setting while leaving theFrequency and Gain settings unchanged.
Being able to drag the EQ points inside of the Graph will make it much easier to zero inon certain frequencies. You’ll need to be listening to the audio while you do this, butbear in mind that some audio editors (even to this day) don’t allow you to monitor theaudio while making adjustments. (How silly is that?)
Note: Even though the Graph Level ruler ranges from +/� 30 dB, the Gain con-trols have a maximum range of +/� 24 dB. However, when you’re using Shelffilter modes on Bands 1 and/or 4, it is possible to push the EQ curve beyond thevisual limit of the Graph. Don’t worry, because the audio is still there. In otherwords, even though you can’t see it, you can still hear it.
Auto Gain ButtonBecause the StudioEQ (like any EQ) will be adding volume to or subtracting volumefrom the audio material, you will need to monitor the Output VU meter and the Outputknob to make sure you don’t clip the StudioEQ. However, the Auto Gain button willallow the plug-in to set its optimum output automatically.
FilterWaveLab comes with two specialized filters. These filters are similar to EQ, but theyoffer some specialized capabilities (specifically the PostFilter) that a normal EQ cannotoffer.
DualFilterThis is essentially a low-pass or high-pass filter with optional resonance. See Figure 14.18.
In its default (off) state, the DualFilter has a green Graph that indicates only the low-and high-pass filter positions. Because there are no points that appear on the Graph, theadjustments must be made with the two knobs.
PositionAt the default position of 0, the DualFilter will leave the signal unprocessed. Increasingthe Position value will slide the high-pass filter to the right and filter out low frequen-cies. The higher the Position value, the wider the range of low frequencies that will befiltered. Conversely, decreasing the Position value will slide the low-pass filter to the leftand filter out high frequencies. The lower the Position value, the wider the range ofhigh frequencies that will be filtered.
ResonanceThis will increase the Resonance curve of the high or low filter. Resonance is a narrowband of frequencies located near the band frequency. When you add or subtract reso-nance, you’re working with the frequencies in that narrow band, which will add eithera whistling or a growling, depending on whether it’s a high- or low-pass filter.
PostFilterThe PostFilter (see Figure 14.19) is a combination of a low-cut filter, a notch filter, anda high-cut filter. This is a very powerful tool when you need to filter out very discrete ornarrow frequency bands.
The PostFilter has both knobs and buttons on the bottom, as well as a Graph on thetop. The most unique feature of the PostFilter is the Notch filter. A Notch filter is
PreviewButtons
Figure 14.19 The PostFilter control panel.
26 WaveLab 7 Power!: The Comprehensive GuideNot For Sale
normally used to correct AC noise, buzz, and hum that has made its way into audiorecordings. That noise is usually caused by ground loops, bad cables, or overhead flu-orescent-light tubes. You could try to remove the noise with EQ, but the frequencybandwidth of even a parametric EQ is usually too wide to be effective.
Low-Cut FrequencyThis control is found in the lower-left corner of the control panel. This is the frequencyof the Low Cut filter. Any low frequencies below this setting will be reduceddramatically.
Low Cut SlopeThis defines the slope of the Low Cut filter. A setting of 12 dB (per octave) will makethe slope very gentle, while a higher setting of 24, 36, or 48 dB (per octave) will set amuch steeper slope.
The settings of the Low Cut filter in Figure 14.19 would be effective for reducing rum-ble below 40 Hz.
Notch FrequencyThis will set the fundamental (lowest) frequency of the Notch filter. If you’re experi-encing an electrical hum, the frequency is usually 60 Hz (50 Hz in the UK). Or, if youdon’t know the fundamental frequency, you can turn the Gain control (see below) to ahigh setting (above 10 dB) and then sweep the Frequency knob across the frequencyspectrum until you pinpoint the offending hum. Then, pressing the Invert button (seethe upcoming “Invert Button” section) will reverse the direction of the notch from pos-itive to negative, thereby reducing the hum.
GainThis will be the amount of volume that the Notch filter reduces (or adds if the Invertbutton is off). Louder hum and buzz will require higher Gain settings.
Q-FactorThis is the bandwidth of the Notch filter. Higher values will make the filter more nar-row and selective. You will want to use as high a setting as possible so that adjacentfrequencies are not affect by the Notch filter. However, setting the level too high mightnot cover enough of a frequency range to be effective.
Activate ButtonThis turns the Notch filter on and off. The Low Cut and High Cut filters will remainactive even if the Notch filter is deactivated.
Invert ButtonThis will flip the Notch filter upside down. If the Notch has positive Gain, pressing theInvert button will make it negative, and vice versa. The Invert button is typically usedafter the frequency has been determined, to quickly reverse the direction of the notchGain.
Notches ButtonsThese buttons let you enable more notches at harmonic locations based on the fre-quency. Hums are often accompanied by buzzing above the fundamental frequency.Activating more notches (up to eight) can reduce the volumes of the buzzing. Trynot to use more notches than you need to attenuate the buzzing, because extra notchesmight remove frequencies that aren’t associated with the buzz.
High Cut SlopeThis defines the slope of the High Cut filter. A setting of 12 dB (per octave) will makethe slope very gentle, while a higher setting of 24, 36, or 48 dB (per octave) will set amuch steeper slope.
High Cut FrequencyThis control is found in the lower-right corner of the control panel. This is the fre-quency of the High Cut filter. Any high frequencies above this setting will be reduceddramatically.
The settings of the High Cut filter in Figure 14.19 would be effective for reducing hissabove 15,491 Hz.
Preview ButtonsThe Low Cut, Notch, and High Cut sections all have a Preview button. This will alloweach section to be auditioned for the frequencies that are being filtered. Only one Pre-view button can be active at one time. When a Preview button is activated, the Graphwill turn red and black. The red area is a representation of the frequency spectrumunaltered by the filter, while the black area represents the frequencies that are beingfiltered.
Reading the PostFilter GraphAt the upper part of the control panel is the PostFilter graph. Each filter you haveactivated will appear on the Graph with a frequency adjustment point. You canmove the Low Cut and High Cut points to the left and right to adjust the correspondingfilter frequency. You can manipulate the Notch frequency point by clicking and drag-ging in the same way as you did for the StudioEQ plug-in. (See earlier.) If you havemore than one notch activated, they will appear on the Graph as well.
28 WaveLab 7 Power!: The Comprehensive GuideNot For Sale
ModulationModulation effects get their name by taking the audio material and splitting it into twoseparate signal paths. One path remains unaltered, but the other has an LFO (low-fre-quency oscillator) and a short delay applied to it. The frequency of the LFO is usuallywell below the limit of human perception, so the effect doesn’t add any sound. Rather,the pitch (or volume) is altered based on the frequency and amplitude of the LFO.
Common Modulation ParametersAll of the Modulation effects that come with WaveLab will have some of the followingparameters.
RateThis is the frequency of the LFO and is measured in Hz units. The setting ranges from0.01 Hz to 5 Hz (or 10 Hz for the AutoPan). Lower settings will provide a gentle mod-ulation, while higher values will make the modulation faster.
WidthThis is the amplitude of the LFO and is measured in percent from 0 to 100%. Lowervalues will make the modulation less audible, while higher values will increase the mod-ulation effect.
SpatialThis will adjust the stereo image of the modulation effect. At 0, the modulation effectwill still be audible, but present equally between the left and right audio channels.Increasing the Spatial amount will modulate the effect between the left and rightaudio channels and provide a more pronounced stereo image. If you’re using monoaudio material, the Spatial control will have no effect.
MixThis will control how much dry (unaffected) signal will be mixed with the wet (effect)signal. A setting of 0 will allow only dry signal through, whereas a setting of 100 willallow only wet signal through. Usually, a middle setting (between 30 and 60) will pro-duce a good balance.
DelayThis controls how long the second (effect) signal is delayed. It is measured in millisec-onds and ranges from 10 to 30 milliseconds. Increasing the delay will make for a richer-sounding modulation but might also make the delay overly audible.
Wave ShapeThis is the LFO waveform type. You have the choice of sine or triangle waveformshapes. A sine waveform has a smoother up and down motion, similar to the serpentine
movements of a snake. The triangle waveform shape will bounce back and forth moresharply, like a billiard ball bouncing off a pool-table cushion.
Lo and Hi FilterThese are low- and hi-cut filters on the wet (effect) signal only. The values are repre-sented in Hz from 10 to 1,000 Hz and 1,200 to 20 kHz, respectively. These are usefulwhen a full-range setting might reduce the clarity of the audio material. For example,an electric bass guitar would benefit from setting the lo filter to a value of 150 to 250,thereby keeping the low frequencies out of the effect signal.
ChorusThe Chorus plug-in (see Figure 14.20) is pitch-based and has all of the parameterswe’ve discussed.
StudioChorusThe StudioChorus plug-in (see Figure 14.21) is pitch-based and has all the parameterswe’ve discussed, but it also has two identical Chorus effects. The audio material will
Figure 14.20 The Chorus control panel.
Figure 14.21 The StudioChorus control panel.
30 WaveLab 7 Power!: The Comprehensive GuideNot For Sale
enter the left Chorus first and then feed directly into the right Chorus. This will allowyou to make some very rich and deep-sounding modulation effects.
AutoPanThe AutoPan (see Figure 14.22) is volume-based and will modulate the amplitude ofthe audio material.
There are fewer controls on the AutoPan, but they function in the same way as theother modulation effects. The only difference is that instead of modulating the pitchlike a chorus effect, the AutoPan will modulate the volume.
Unlike the Spatial control of the Chorus and the StudioChorus, the AutoPan will createa stereo effect even with mono audio material.
PitchPitch effects alter the pitch of the audio material but usually don’t offer modulationcapabilities. Rather, they alter the pitch by a much wider margin.
OctaverThe Octaver (see Figure 14.23) creates octaves of the audio material from one octave ortwo octaves lower than the audio material. The effect will work properly only on
monophonic audio material, such as a solo vocal, woodwind, or brass instrument.Because the processed signals are lower than the source material, the effect works betterwhen the fundamental frequencies of the audio material are higher than 250 Hz(middle C).
DirectThis controls how much of the original audio material will be present in the processedsignal.
Octave 1 and Octave 2These controls allow you to change the level of the first octave and the second octavebelow the fundamental frequency of the direct signal. By combining the Direct signalwith the Octave signals, you can deepen the frequency content of audio material.
ReverbReverb is another type of spatial effect used to simulate an acoustic environment. Theoriginal uses for early reverbs were to mix the direct studio-recorded sound of musicwith the environmental ambiance of a performance venue. Whether it was a concerthall, a church, or a recital room, a reverb made it possible to record an ensemble in astudio and add the ambience in post-production. These early reverbs were based onsprings or metal plates. In fact, a well-told story of one early reverb relates back tomy hometown.
I grew up in Salt Lake City, Utah. One of the most famous downtown buildings isknown as the Tabernacle. It was built in the 1860s by the Church of Jesus Christ ofLatter-Day Saints and was used for many purposes, including as a performance venuefor the Mormon Tabernacle Choir and an early venue for the Utah Symphony. Thebuilding offers some truly outstanding acoustical properties even to this day.
Back in the mid-1960s, the LDS Church owned a recording studio across the streetfrom the Tabernacle. One ingenious engineer realized that by running cables throughthe underground tunnel from the studio to the Tabernacle, they could pipe recordingsinto the venue through speakers and then record the natural reverb of the room with amicrophone. That signal could then be returned to the recording studio, and that fan-tastic sound could be mixed into studio recordings.
Spring tanks and plate reverbs were later invented and offered a more feasible way ofproviding reverb effects. But it wasn’t until the digital reverbs hit the market that trulyworldclass acoustic simulation became available to everyone.
Common Reverb ParametersWaveLab comes with two reverb processors, one of which is a smaller, less CPU-inten-sive version of the other. Therefore, the basics of the Reverb effects are identical.
32 WaveLab 7 Power!: The Comprehensive GuideNot For Sale
Pre-DelayThis basically controls how far away the audio material is from the venue’sopposite wall. In other words, if you’re standing on the stage of a symphony halland you clap your hands, the sound travels at 1,100 feet per second (343 metersper second) from your hands to the back wall (the cheap seats) and then bouncesoff of that wall and back into your ears. The bigger the room, the more delay therewill be. So, setting a larger Pre-Delay will simulate a larger environment moreaccurately.
The Pre-Delay amount relates to time and is adjustable from 0 to 500 milliseconds (1/2of a second).
Reverb TimeThis is the duration of the reverb from the beginning to the end of its audibility. It isalso a measure of time and is variable from 0.10 to 20 seconds. Larger values will beused to simulate concert halls and traffic tunnels, while smaller values will simulate thegarage we’ve all rehearsed in or even the shower we sing in.
This is another setting that you should adjust carefully. Setting the Reverb Time toohigh will make for a very cloudy and confusing effect. Typically, a pop vocal reverb willhave no more than one or two seconds of Reverb Time. But ensemble recordings ofsymphony orchestras or choirs might have as many as four to six seconds. Anythinghigher than that can quickly create a cacophony of sound that will become difficult tocontrol.
DiffusionThis will control how many sonically reflective surfaces you have in your simulatedenvironment. More surfaces will create more reflections of the reverb. For example,a school gymnasium has only six reflective surfaces, made up of four walls, one ceiling,and one floor. However, a typical Christian church has columns, pews, tables, statues,and taller multi-angled ceilings. Therefore, there are more surfaces that create morediffusion. So, larger diffusion settings make for more surfaces for the sound to bounceoff of.
Lo LevelThis controls the decay time of the low frequencies in the reverb effect. It’s measured ina percentage from 10 to 400 percent, with 100% being the baseline. Lower settings willreduce the amount of low frequencies in the reverb and will sound as if you’ve putpeople in the church pews. The clothing the people are wearing (depending on thekind of church you attend) will absorb more bass frequencies. But if you want to sim-ulate an empty church, you may need to raise the Lo Level above 100% so that thosebass frequencies will be unencumbered by absorbent surfaces.
Hi LevelThis works identically to the Lo Level but affects the high-frequency decay of thereverb. If the room you’re simulating has more glass, mirrors, or metal, the high fre-quencies in the reverb will get absorbed less. High percentages will make the reverbsound glassier, while lower settings will make the room sound as if it has been acous-tically treated to dampen the acoustic liveliness.
MixOnce again, the Mix control manages the wet to dry level. (See earlier in this chapter.)
RoomWorksRoomWorks (see Figure 14.24) is the highest quality reverb that comes with WaveLab.It’s also the more programmable and better-sounding reverb of the two. However, itdoes take more processing power to run RoomWorks than it does the SE version.
RoomWorks is surround-sound compatible, and there are several presets that capitalizeon this functionality. So, if you’re working in a mono or stereo environment, try toavoid the presets that have a name starting with Surr., or else you may end up withsome strange-sounding results.
Lo and Hi Frequency and GainThese are the four controls on the far-left side of the control panel. These allow you tocraft the audio-material frequency content as it enters the plug-in. It’s similar to the Lo andHi levels except that instead of altering the frequency content of the reverb, the Lo and HiFrequency and Gain can limit the frequencies that get into RoomWorks in the first place.
The Lo Frequencies range from 25 to 6 kHz, while the Hi Frequencies range from 250to 22 kHz. The Gains of each frequency are variable from �18 to 6 dB.
Variation ButtonThis is the roulette wheel of RoomWorks. Clicking on this button will alter the reverbcharacteristics ever so slightly and offer gentle variations to the same reverb settings.There are 1,000 variations.
Figure 14.24 The RoomWorks control panel.
34 WaveLab 7 Power!: The Comprehensive GuideNot For Sale
Hold ButtonPressing this button will make the reverb signal repeat in an infinite loop. The loop issmooth and without pops or clicks. Although not a very musically useful option, theHold button does offer some very interesting sound-effect possibilities.
SizeThe sound in an acoustic environment can bounce off of sonically reflective surfaces thatare located closer to the listener than the back wall. Therefore, that reverb signal will beheard before the big back-wall reverb. These are known as early reflections, and the Sizecontrol allows you to adjust how many early reflections you’ll hear. From what I can tell,it’s an arbitrary number from 20 to 250. Larger values will simulate more reflectivesurfaces located closer to the listener. Usually, larger rooms have more early reflections.
Damping Lo and Hi FrequencyWhile the Lo and Hi Level work as described earlier in this section, the Hi and LoFrequencies are also adjustable. The Lo is adjustable from 25 Hz to 1 kHz, and theHi is adjustable from 500 Hz to 22 kHz.
Envelope Amount, Attack, and ReleaseThe envelope allows you to customize the Attack time and Release time of the reverbeffect. The Amount control adjusts the strength of the envelope, or, in other words,how much the envelope will affect the reverb signal. You’ll notice that the 50%mark of the Amount is at almost the 3 o’clock position. Settings above 50% canmake the envelope stronger than required to be audible. Therefore, settings below50% will get you better results.
The Attack and Release are both measured in time and adjustable from 10 to 1,500milliseconds. The Attack controls how long it will take for the envelope to engage,while the Release controls how long the reverb will last. Shorter release times will createwhat is known as aGated Reverb. If you listen to any Phil Collins drum tracks from the’80s or ’90s, you’ll get a good idea of what this effect sounds like.
Wet Only ButtonChances are that you won’t be using this button very often, at least not in WaveLab.This button allows only the wet (reverb) signal to pass through to the RoomWorksoutput. In a DAW program like Cubase, a reverb effect is usually set up to be a sendeffect where the dry signal comes through the track, but only the reverb (or any othertime-based effect) should be allowed to come back into the signal path. But becauseWaveLab runs all of its plug-ins in series (out of one into the next, and so on), clickingthis button will remove all of the original audio material from the signal path. There-fore, unless you’re making your audio sound as if it’s coming from a faraway distance(as if you’re standing backstage), you’ll never turn on the Wet Only button.
Note: Turning the Mix control fully clockwise is the same as turning on the WetOnly button.
EfficiencyThis control determines how much computer processing power will be used by theplug-in. Reverbs use a larger volume of computer processing than other plug-ins, soit’s nice to be able to set the Efficiency to work properly with your computer. Lowervalues will be less efficient and will take more processing power. If you start to hearpops and clicks during playback, you may need to raise the Efficiency.
Export ButtonChances are, you’ll always want this button on. This will set the Efficiency control to 0during rendering. Because you’ll probably want the highest-quality reverb signal inyour rendered files, just leave this button on.
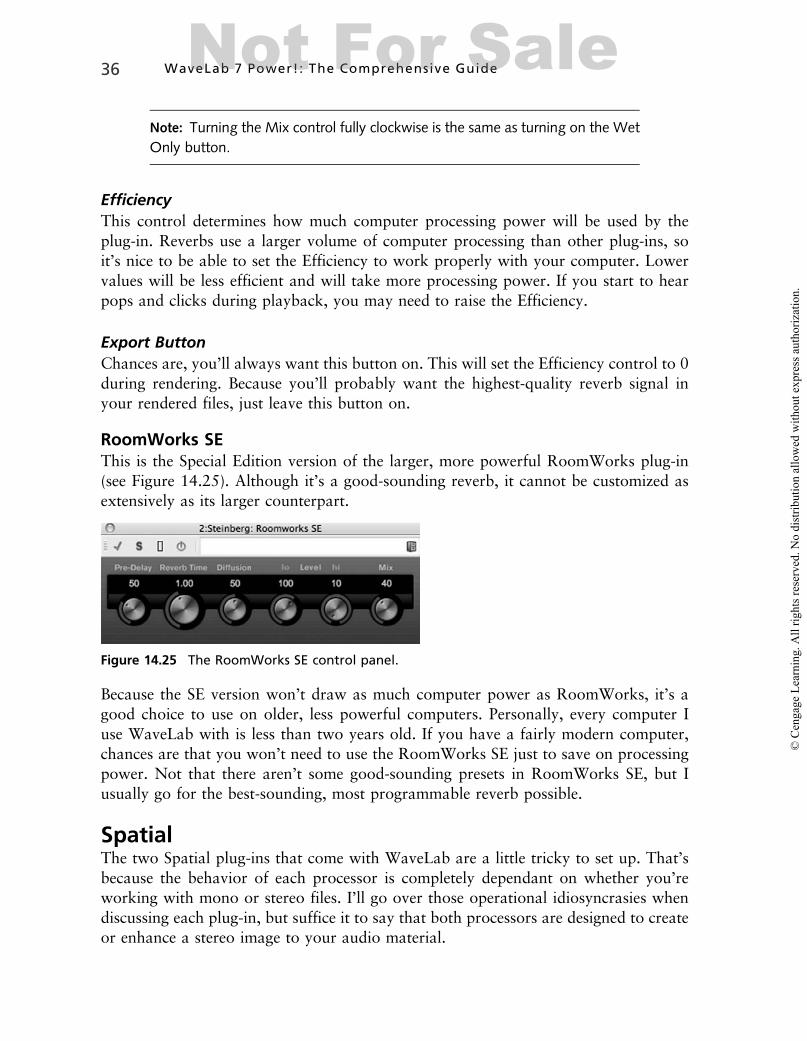
RoomWorks SEThis is the Special Edition version of the larger, more powerful RoomWorks plug-in(see Figure 14.25). Although it’s a good-sounding reverb, it cannot be customized asextensively as its larger counterpart.
Because the SE version won’t draw as much computer power as RoomWorks, it’s agood choice to use on older, less powerful computers. Personally, every computer Iuse WaveLab with is less than two years old. If you have a fairly modern computer,chances are that you won’t need to use the RoomWorks SE just to save on processingpower. Not that there aren’t some good-sounding presets in RoomWorks SE, but Iusually go for the best-sounding, most programmable reverb possible.
SpatialThe two Spatial plug-ins that come with WaveLab are a little tricky to set up. That’sbecause the behavior of each processor is completely dependant on whether you’reworking with mono or stereo files. I’ll go over those operational idiosyncrasies whendiscussing each plug-in, but suffice it to say that both processors are designed to createor enhance a stereo image to your audio material.
Figure 14.25 The RoomWorks SE control panel.
36 WaveLab 7 Power!: The Comprehensive GuideNot For Sale
Common Spatial ParametersThe MonoToStereo and StereoEnhancer plug-ins are virtually identical to each other,so they both have the exact same parameters.
WidthThis controls how wide the stereo effect will be. It’s represented in an arbitrary valuefrom 0 to 200. Increasing the value will increase the left-to-right stereo image of theaudio material. A horizontal bar at the bottom of the plug-in control panel will alsorepresent the Width. (See Figures 14.26 and 14.27.)
DelayAdding Delay will further augment the stereo image. Delay is a time value that rangesfrom 1 to 30 milliseconds. Even though the Delay times are very short, it is possible toinduce a sort of stuttering effect when the values are near the maximum position. Uselower values to avoid stuttering.
ColorAdjusting the Color control will offer a wide range of stereo imaging. From what I cantell, the Color control uses phase shifts and EQ filters to further separate the stereo image.It’s an arbitrary value that ranges from 0 to 100. Adjustment of the Color control requiresa delicate touch, because there are subtle differences from one integer to the next.
Mono ButtonBecause a Spatial plug-in is altering the stereo image, it’s possible for phase problems tocreep in. Pressing the Mono button will virtually sum the left and right audio channelsof the Master Section to mono by placing the effect equally in each channel. That way,you can listen for phase problems, such as cancellation.
MonoToStereoThe MonoToStereo plug-in (see Figure 14.26) is designed to create a stereo image inmono audio material.
All of the parameters of the MonoToStereo plug-in were discussed already. However,getting the plug-in to work properly can be a little baffling.
Getting MonoToStereo to Work ProperlyThis plug-in has one input because it’s designed to work with mono audio material.The Master Section, on the other hand, is stereo (two Master Level faders) by default.So if you try to add the MonoToStereo plug-in while the Master Section is in stereo,you will get an error warning:
Error reported by plug-in Steinberg: MonoToStereo:
Cannot handle the required number of input channels. Plug-in is switched off.
Plus, the MonoToStereo plug-in works only with mono audio material. But it’s possibleto get the error message even when a mono audio file is all you have loaded into Wave-Lab. (This situation made me swear a few times while researching the Spatial plug-ins.)
Here are the steps to make sure the MonoToStereo plug-in works properly for you:
1. Load only mono audio material into WaveLab.
2. Right after you load the mono file, start playback so that the MasterSection gets configured into a mono channel (single Master Level fader)configuration.
3. Add the MonoToStereo plug-in to the first Master Section effects slot. Doing sowill keep the Master Section input as mono but will reconfigure the output tostereo.
4. If you need to add additional stereo plug-ins, they must be placed in an effectsslot after the MonoToStereo.
5. Avoid loading and/or playing back stereo audio material after you’ve loaded theMonoToStereo plug-in. Otherwise, you may get the error warning when youstart playback on a mono file. The only way to get the plug-in to work properlywithout the error message is to reset the Master Section (refer to Chapter 5) andrepeat Steps 1 through 4.
StereoEnhancerThe StereoEnhancer (see Figure 14.27) is virtually identical to the MonoToStereo plug-in. The only difference is that the StereoEnhancer is designed to work with stereo audiomaterial.
All of the controls of the StereoEnhancer are identical to those on the MonoToStereoplug-in except for two buttons. The Delay and Color controls each have their ownOn/Off button.
38 WaveLab 7 Power!: The Comprehensive GuideNot For Sale
Because the StereoEnhancer has two inputs, you probably won’t get the channel warn-ing message when using it. If you do, make sure you’ve loaded only stereo audio filesinto WaveLab and started playback on a stereo file to configure it for stereo operation(two Master Level faders).
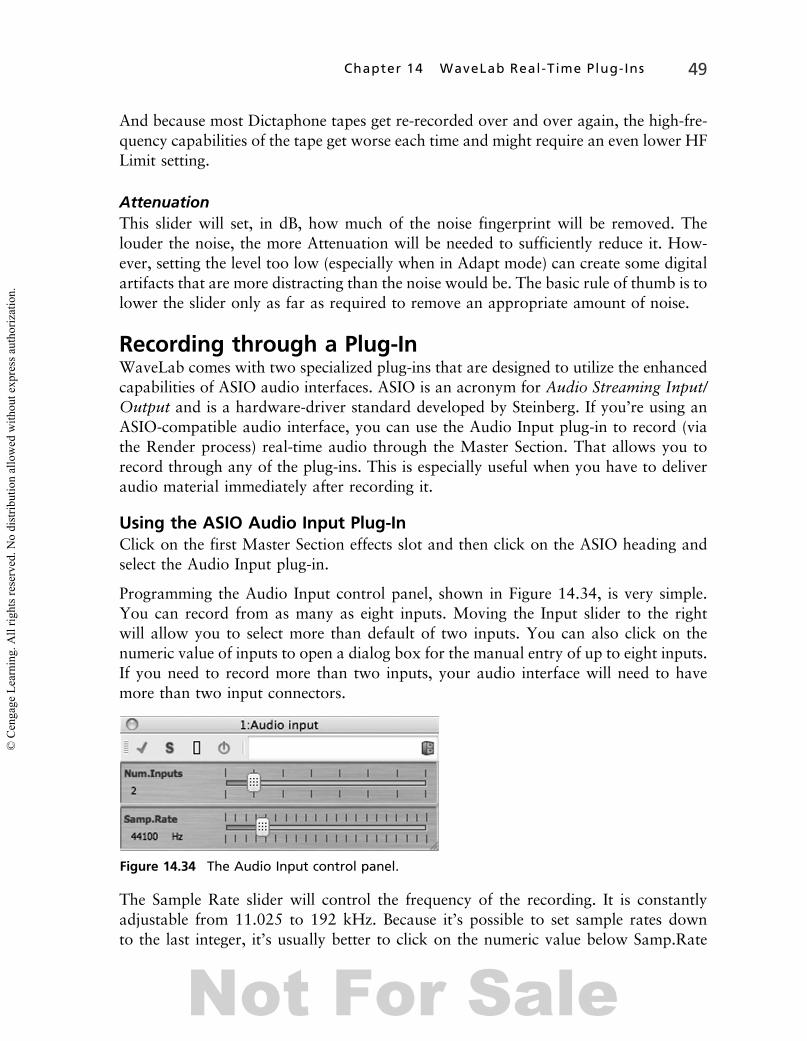
ToolsThe Tools plug-ins are highly specialized processors. Although they are highly capable,chances are you’ll never use them unless you’re recording through a plug-in (later inthis chapter) or working in a surround-sound environment. All the Tools plug-insshould be placed in the last effects slot.
TestGeneratorThis is a simpler plug-in version of the Signal Generator (refer to Chapter 12). It isdesigned to create test tones that can be used to test the performance or configurationof audio equipment. See Figure 14.28.
There are a few situations where I’ve used the TestGenerator plug-in rather than theSignal Generator. Because the TestGenerator works in real time, it has the advantage ofworking in live recording situations.
I’ve used the TestGenerator when recording through a plug-in and needing a slate tone.A slate tone is used to identify locations in an audio recording either audibly or due totheir unique appearance in audio editing software, visually. For example, if I’m
recording a long dialog session, it’s much easier to record one long audio file instead ofrecording new files for every new take. With the TestGenerator loaded into an effectsslot, I can leave it bypassed until I need to mark a new location. Then when I need thetone, I can click the Bypass button momentarily to record some tone onto the track.That tone will identify to any other audio editor who might be working on this materialthat some sort of edit is required at that location. (If I were the editor, I’d be droppingmarkers onto the track while I’m recording. But not all programs read markers in thesame way. For that reason, sometimes it’s better to use markers and a slate tone so thatyou become the audio editor’s new best friend.)
I’ve also used the TestGenerator to test other audio equipment that might be connectedto my audio interface. For example, I’ve recorded audio for film into WaveLab but sentthe audio to the cameras for review and sync purposes. I’ll use the TestGenerator tosend a �12-dB tone to the cameras so the camera operators can set a matching inputlevel of �12 dB.
Note: Even�12 will create very loud test tones. If you want to win the friendshipof the camera operators, producers, and directors alike, make sure none of themis wearing headphones when you match up the audio levels of the equipment.
Waveform ButtonsThe Waveform buttons are located across the top of the control panel. By clicking onthe Sine, Triangle, Square, Sawtooth, White, Pink, or Brownian buttons, you can definewhat type of waveform you’d like to use.
Frequency SettingsThere are four common waveform frequencies you can select by pressing the 100, 440,1,000, or 10,000 Hz button. For different frequencies or fine-tuning, you can use theslider to the right of the frequency buttons, or you can double-click the value at the farright for manual entry. When selecting custom frequencies, the values range from 1 to20 kHz. Because noise waveforms contain broad ranges of many frequencies, the fre-quency controls are dimmed out and not necessary.
Output Volume SettingsThere are four common output level buttons of �12, �6, �3, and 0 dB. For differentlevels or fine-tuning, you can use the slider to the right of the level buttons, or you candouble-click the value at the far right for manual entry.
Mix6To2This plug-in (see Figure 14.29) is designed to work in a DVD-audio-compatible sur-round-sound Audio Montage. If you’re using WaveLab in a surround-sound
40 WaveLab 7 Power!: The Comprehensive GuideNot For Sale
environment, the Mix6To2 plug-in can take six audio channels and create a stereoversion of the surround mix. A 5.1 surround-sound configuration consists of six dis-crete audio channels: Left Front, Center, Right Front, Left Surround, Right Surround,and the .1 is a LFE (low-frequency effects) or subwoofer channel.
Each of the audio channels has a fader to send the signal to the left output, the rightoutput, or a combination of the two. There are also Inv (Invert Phase) buttons on eachchannel and a LINK button that connects both channel faders together. The LFE chan-nel also has a drop-down box (the black triangle in the channel name) that allows youto set the gain of the channel to 0, 6, 10, or 20 dB. The Master Output fader includes aNormalize button that will adjust the output automatically to 0 dB without clipping.
Mix8To2This plug-in (see Figure 14.30) is identical to the Mix6To2, but as its name implies, itcan mix eight audio channels into a two-channel stereo mix. It is designed for use in amultichannel Audio Montage.
The controls of the Mix8To2 plug-in are the same as those of the Mix6To2 plug-in.(See the preceding section.)
Sonnox Restoration ToolsWaveLab comes with the three world-class restoration plug-ins from Sonnox Ltd.These plug-ins can clean up audible anomalies, such as pops, clicks, crackles, hum,buzz, and hiss. Although most of those anomalies are associated with analog record-ings, such as tape and vinyl records, there are sonically similar artifacts that can creepinto the most sophisticated digital recording studios. Using these plug-ins can removethose artifacts with a minimum of fuss.
Online Quick Start GuidesEach Sonnox tool has a quick-start guide you can find in the online WaveLab manual.While you’re in WaveLab, click on the Help About Active Window button on the Com-mand Bar or press F1 (Mac users press Shift+Command+/). Then search for Sonnox, selectthe desired plug-in, and then scroll to the bottom of the page for the quick-start guide.
Common Sonnox ParametersThe Sonnox tools share some common parameters, and they’re all located in the samespots on each control panel.
Sonnox BoxIn the upper-left corner of each control panel is the Sonnox logo. By clicking on thatlogo, you can customize the response of the Input and Output meter clip lights. TheClip Lights Hold Indefinitely setting will leave the clip lights on forever or until youclick on the light to turn it off. You can also choose a two-second or five-second hold.
On the DeBuzzer, there’s also a setting for Default to 50 Hz. Because Sonnox Ltd. is inthe UK, and electricity there operates at 50 Hz, the plug-in loads with that frequency asthe default. If you’re in a country where the electrical frequency is 60 Hz (such as theUSA), uncheck the setting so that the DeBuzzer loads with 60 Hz as the default.
Input/Output MetersOn the left and right sides of each control panel are vertical meters that show you theInput and Output levels of the plug-in. At the top of each meter is a red Clip indicatorthat will warn you when the input or output level of the plug-in has been exceeded andhas induced clipping. To reset the Clip indicator, click on the Clip light.
Trim Input/Output LevelBelow each meter is a value button that shows the Input and Output level. Clicking anddragging up and down on the corresponding button will raise or lower the input, whilethe output can only be lowered from 0 dB.
42 WaveLab 7 Power!: The Comprehensive GuideNot For Sale
Knob, Slider, and Value Box AdjustmentsAll of the variable controls on the Sonnox plug-ins consist of a knob, a slider, and avalue box. Operating the knobs is a little different from with the other WaveLab plug-ins. The Sonnox knobs all work in circular mode, where you click and drag your mouseon the knob in a circular motion. While you’re holding down the mouse button, youcan increase the pointer radius away from the knob for a finer level of adjustment. (Theother plug-ins we’ve talked about all operate in linear mode, where you can makeadjustments by clicking and dragging up and down or left and right, and holdingShift will make finer adjustments.) But if you’d rather the knobs work in linearmode, hold down Alt/Option while dragging.
Although you can make adjustments by clicking and dragging on the value boxes, youcan also right-click and drag on a value box for a finer degree of adjustment. This right-click/left-click method works on the sliders, too.
You can also double-click the value boxes to make manual entries, and you can Ctrl/Command-click any control to set it to the default value.
Enable ButtonWhile the DeClicker has In buttons to enable or disable each of its three processes, theDeBuzzer and DeNoiser have an Enable button for turning the entire plug-in on andoff. However, the standard Bypass and effect On/Off buttons across the top of thecontrol panel will perform the same function.
Be Patient and Make Small AdjustmentsBecause the Sonnox tools all track the audio material dynamically, the adjustments youmake on the control panel may not be apparent immediately. It’s better to make theadjustment and then let the plug-in reanalyze the audio material with the new settings.
Also, I’ve found that very slight adjustments can make big differences in the quality ofeach plug-in. For that reason, making gross control panel adjustments may not allowyou to find the best possible settings. Making smaller adjustments usually garners bet-ter results.
Sonnox DeBuzzerThe DeBuzzer (see Figure 14.31) is used to remove hum and buzz from your audiomaterial. These types of anomalies are usually caused by noisy electricity, bad cables,or ground loops (multiple sources of electrical ground or earth). Things such as fluo-rescent and neon light tubes or any device that uses an AC adapter or external trans-former can also cause hum and buzz.
Sometimes the default settings will do a fantastic job of reducing hum, but makingsome gentle adjustments, especially when it comes to removing buzz, can make a bigdifference.
Frequency ControlsThe largest knob on the control panel manually adjusts the fundamental frequency ofthe hum. It’s used when the DeBuzzer is set to Freeze tracking. (See the upcoming“Tracking Mode” section.) If it’s an electrical buzz, this is usually set to 50 or60 Hz, but you can adjust it to a range from 20 to 440 Hz. However, if you clickon the Fine Adjust button, the range is narrowed from 58.8 to 61.2 Hz. Plus, if youadjust past either extreme, the range will be reconfigured automatically. It also puts theDeBuzzer into Freeze tracking mode.
The Tone On button will produce an oscillator at the current Frequency setting. Thiswill allow you to listen to and match the frequency of hum and make frequency adjust-ments accordingly. With the Tone On active, a value box will appear above the button,allowing you to change the tone volume. The default is �18 dB.
Detect MeterThis will visualize the amount of hum and buzz that the DeBuzzer is sensing at its input.
Tracking ModeYou can set the DeBuzzer to operate in either Auto or Freeze tracking mode. Auto willhave the plug-in search for the fundamental (lowest pitch) frequency of the hum and setthe Frequency control dynamically. During playback, the precise frequency of the Autodetection is represented by a small red line appearing on the Frequency knob, alongwith a numeric readout in Hz.
Although you can still manually adjust the Frequency knob in Auto mode, it is better tolet the plug-in determine the frequency. But I have run into situations where I’ve trans-ferred a vinyl recording into the computer and found hum at a higher or lower fre-quency than 60 Hz. That’s because the hum may have been 60 Hz when the record
Figure 14.31 The Sonnox DeBuzzer control panel.
44 WaveLab 7 Power!: The Comprehensive GuideNot For Sale
was cut, but when played back on my phonograph, even through great care was takento set a precise 33 or 45 RPM speed, the frequency of the hum was altered by the speedof the phonograph.
In Freeze mode, the DeBuzzer is in full manual mode. The frequency is set by you and isnot automatically detected. The Fine Adjust and Tone On controls will become veryuseful in Freeze mode.
A good practice for proper hum removal is to loop a silent section of audio material,such as the space in between each song. That silent section will contain an easily detect-able hum frequency. I’ll usually set WaveLab to play that silent section in a loop, andwhen the DeBuzzer detects the Frequency in Auto mode, I’ll flip it to Freeze mode sothat the Frequency doesn’t shift. However, if your turntable doesn’t maintain a con-stant speed very well, leave the DeBuzzer in Auto mode.
SensitivityThis will control how sensitive the DeBuzzer is to hum and buzz. If the hum is loud, youcan set the Sensitivity lower. If the hum is apparent but not very loud, you may need toset the Sensitivity higher. However, high Sensitivity settings might remove too much ofthe hum frequencies and take a larger amount of the audio material with them.
Mode ButtonYou can set the DeBuzzer to Hum mode or Buzz mode; however, Buzz mode still hasthe hum-removal component. In Hum mode, the fundamental and harmonic frequencyrange is 0 to 800 Hz. In Buzz mode, the range increases to 4 kHz, making it moreeffective at removing high-frequency buzzing. However, the widened frequencyresponse will remove more high frequencies and therefore might remove too large aportion of audio material. The rule of thumb is to leave it in Hum mode unless there’san accompanying high-frequency buzz.
Reduction MeterThis will visualize the amount of hum and buzz that is being removed from the audiomaterial. If the hum is loud, it is not unusual to see a large amount of Reduction. How-ever, if the hum is somewhat quiet, and the meter is still showing a large amount ofReduction, you may need to adjust the Attenuation (see the next section) or Sensitivity.
AttenuationThis is how much detected hum will be removed. It has a very wide range from 0 to�96 dB, so if it’s set too high, it can remove not only hum, but also other non-humfrequencies from the audio material. For that reason, it’s best to listen to a loop of asilent section (see the earlier “Tracking Mode” section) and adjust the Attenuationdownward until the hum is reduced just below the point of audibility.
Sonnox DeClickerThe DeClicker (see Figure 14.32) has three filters—one for each type of artifact. Eachfilter is preset to identify the somewhat unique sonic fingerprint left by the artifact:
n A pop will be a loud and fast transient with a wide frequency range, like a deepscratch on a vinyl record.
n A click will be an even faster loud transient with a higher-frequency content, like thedischarge of static electricity.
n Crackle is a consistent anomaly that sounds like vinyl surface noise or radio static.
You can adjust or activate each filter separately, depending upon what artifacts arepresent in the audio material.
Each filter has its own Sensitivity slider with value box, a Detect meter, and In button.It’s important that you turn on only the filter you need. If you were to leave the DePOPfilter on when working with audio material that has no pop artifacts, the filter canfalsely detect other transients (specifically drums) as popping and reduce themunnecessarily.
Sensitivity SlidersEach filter has its own Sensitivity slider. Raising the Sensitivity will increase the strengthof the filter. However, setting the Sensitivity too high can cause the filter to falselyidentify desirable audio material as an artifact, thereby removing too much of the orig-inal audio material. It’s best to listen to a section of audio material with a popping,clicking, or crackling in it and adjust the corresponding slider until the artifact becomesinaudible.
Figure 14.32 The Sonnox DeClicker control panel.
46 WaveLab 7 Power!: The Comprehensive GuideNot For Sale
Detect MetersEach filter has its own Detect meter. At the bottom of every meter is a red light that willindicate that the filter has detected a sonic artifact. The strength of the meter above thered light will indicate the volume of the artifact. The Detect meters always represent theinput of the plug-in and won’t be affected by higher sensitivity settings.
Sonnox DeNoiserThe DeNoiser (see Figure 14.33) looks for the kinds of hiss inherent in analog tape andvinyl recordings. However, other electronic devices can add noise. For example, theTrim (Gain) control set too high on a mic preamp can induce noise very similar totape hiss. Therefore, the DeNoiser would be effective at removing that type of noise,too. The noise is usually in the higher frequency band, from 1 to 20 kHz.
Reading the GraphUnlike the other Sonnox tools, the DeNoiser has a graph at the top of the control panel.The graph visually represents the audio material, noise, Sensitivity control, and HFLimit control all at the same time. The 20 Hz to 20 kHz frequency range is depictedfrom left to right, but because noise is usually found above 1 kHz, the frequency rangehas been compressed to a smaller portion of the graph. The volume scale of �144 to0 dB is depicted from top to bottom.
During playback, the audio material will appear as a blue waveform. TheSensitivity control will be represented by a yellow vertical line extending from left toright. The HF (High Frequency) Limit will appear as a magenta area extending fromright to left.
SensitivityThe Sensitivity slider is adjustable from +/�18 dB with 0 dB as the default. At 0 dB, thefilter will set the Sensitivity at about the same volume as the audio material. This settingis useful for removing a very small amount of noise. Adjusting the Sensitivity higherwill increase the noise detection, while lower settings will move the Sensitivity furtherinto the audio material. Basically, if the noise is loud, you should set the Sensitivityabove 0 dB, but if the noise is quiet, then you should set the Sensitivity below 0 dB.
Tracking ModeThe DeNoiser has two tracking modes. Adapt (Adaptive) will dynamically analyze theaudio material for noise. This mode works best when the noise level is inconsistent.When using Adapt mode, the settings of the Sensitivity and Attenuation will requiregreat care. Large settings can create metallic, swirly artifacts that are usually more dis-tracting than the noise would be.
The Freeze mode will make an analysis of the noise and use that as the noise finger-print. Freeze mode works best when you have a portion of audio material that is voidof all other sound except the noise (such as the quiet area in between song tracks on avinyl record). During playback of that quiet section, switch from Adapt to Freezemode. The DeNoiser will do an analysis of the noise and create a noise fingerprintthat will appear in the graph as a red horizontal line. With the Sensitivity set to0 dB, adjusting the Attenuation slider (see the upcoming “Attenuation” section) down-wards will remove frequencies that resemble the noise fingerprint. In Freeze mode, youcan increase the Attenuation more dramatically than in Adapt mode.
HF LimitThe HF (High Frequency) Limit is basically a high-cut filter that will remove all fre-quencies above a certain setting. It’s measured in Hz units and is adjustable from 1 to22 kHz. The default setting of 22 kHz will work best for most full-range audio. How-ever, some audio is not full-range, and any noise might be outside the frequency rangeof the audio material.
Let’s use a tape-based Dictaphone as an example. Dictaphones are the pocket-sizedtape recorders used to dictate speech for later transcription into text. Compared todigital recorders, these small, slow-moving tapes are designed to capture only the fre-quency range of human speech. However, the tape hiss they create can extend farbeyond the upper frequency range of speech. You’ll never really notice the hiss whenyou’re playing the tape back through the Dictaphone’s built-in speaker. But that hissbecomes very noticeable and distracting when played back on a full-range audio sys-tem, such as studio monitors or high-quality headphones.
Because the sibilance of human speech usually tops out around 8 to 12 kHz, adjustingthe HF Limit to an equal amount will remove any high frequencies above that setting.
48 WaveLab 7 Power!: The Comprehensive GuideNot For Sale
And because most Dictaphone tapes get re-recorded over and over again, the high-fre-quency capabilities of the tape get worse each time and might require an even lower HFLimit setting.
AttenuationThis slider will set, in dB, how much of the noise fingerprint will be removed. Thelouder the noise, the more Attenuation will be needed to sufficiently reduce it. How-ever, setting the level too low (especially when in Adapt mode) can create some digitalartifacts that are more distracting than the noise would be. The basic rule of thumb is tolower the slider only as far as required to remove an appropriate amount of noise.
Recording through a Plug-InWaveLab comes with two specialized plug-ins that are designed to utilize the enhancedcapabilities of ASIO audio interfaces. ASIO is an acronym for Audio Streaming Input/Output and is a hardware-driver standard developed by Steinberg. If you’re using anASIO-compatible audio interface, you can use the Audio Input plug-in to record (viathe Render process) real-time audio through the Master Section. That allows you torecord through any of the plug-ins. This is especially useful when you have to deliveraudio material immediately after recording it.
Using the ASIO Audio Input Plug-InClick on the first Master Section effects slot and then click on the ASIO heading andselect the Audio Input plug-in.
Programming the Audio Input control panel, shown in Figure 14.34, is very simple.You can record from as many as eight inputs. Moving the Input slider to the rightwill allow you to select more than default of two inputs. You can also click on thenumeric value of inputs to open a dialog box for the manual entry of up to eight inputs.If you need to record more than two inputs, your audio interface will need to havemore than two input connectors.
The Sample Rate slider will control the frequency of the recording. It is constantlyadjustable from 11.025 to 192 kHz. Because it’s possible to set sample rates downto the last integer, it’s usually better to click on the numeric value below Samp.Rate
and type in the exact value. For example, to set the sample rate to 48 kHz, click on thevalue, then type 48000 into the dialog box that will appear on the left-hand side of thecontrol panel, and then press Enter. If you’re using settings below 44.1 kHz or above48 kHz, make sure your audio interface is capable of lower or higher sample rates.
The Audio Input plug-in works in conjunction with the settings on the ASIO Plug-Instab of the Audio Streaming Settings dialog box. Go to the Options menu and selectAudio Streaming Settings or press Shift+Ctrl/Command+P. Then click on the ASIOPlug-Ins tab. See Figure 14.35.
The ASIO Plug-Ins tab is divided into two columns. The left column is the Device Out-put (to Gear) column, and the right is the Device Input (from Gear) column. We’re onlygoing to use the Device Input column for the Audio Input plug-in.
Properly programming this dialog box has everything to do with using the Audio Inputplug-in. Input 1 of the Audio Input plug-in corresponds to the first Device Input setting.Input 2 corresponds to the second Device Input setting, and so on. You’ll notice that inFigure 14.35, I have the first and second devices set to MR816CSX(2) Analog 5 andMR816CSX(2) Analog 6. That routes the fifth and sixth inputs of my audio interfaceto the Audio Input plug-in’s first and second input. This allows you to freely configurewhich hardware device goes into which input of the Audio Input plug-in without hav-ing to physically plug and unplug the cables from your audio interface.
Adding Plug-Ins to Record ThroughWith the Audio Input plug-in installed in the first Master Section effects slot, any plug-ins you add will become part of the recording signal path. For example, if I added theLimiter plug-in to Effects Slot 2, then the audio would flow from the Audio Input plug-in to the Limiter. Any effect you add will become part of the recorded file.
Figure 14.35 The Audio Streaming Settings ASIO Plug-Ins tab for the Audio Input plug-in.
50 WaveLab 7 Power!: The Comprehensive GuideNot For Sale
Monitoring the InputWhen you’re using the Audio Input plug-in, clicking the WaveLab Play button or press-ing your spacebar will turn on the recording monitor. That way, you can make adjust-ments to the plug-ins and hear what the audio will sound like before it gets recorded.That will allow you to make any customizations to the plug-ins before committingthem to the recording.
Note: Normally, pressing your spacebar would start playback of the currentlyloaded audio file. But when the Audio Input plug-in is being used, you cannotplay back an audio file, because the playback operation is now the monitor-enable operation.
Recording the FileClick the Render button at the bottom of the Master Section or press A. Becauseyou’re using the Audio Input plug-in, the Render dialog box will look different (seeFigure 14.36).
At the top of the dialog box is a check box for Create Named File. If you don’t checkthis box, WaveLab will create a temporary file named Untitled X. (X is the number ofthe currently loaded Untitled file.) I recommend that you check this box so that you cansave a permanent file as you’re recording. You’ll also be able to set the destinationfolder and audio file properties in the bottom of the dialog box.
When you click OK, the recording will begin. You won’t actually see a waveform beingdrawn, but you will notice that all of your meters will be operating. When you’re readyto stop the recording, click the Stop button on the Command Bar or press the spacebar.The recording will then appear in the Document window, complete with a waveform.
When you’re finished using the Audio Input plug-in, make sure to remove it from theMaster Section so that WaveLab will operate normally.
Figure 14.36 The Render ASIO Input to File dialog box.
Note: Because the computer takes time to process the incoming audio signalthrough the Master Section, there will be some latency. The more plug-insyou load, the more latency there will be. This usually won’t be a problem,because WaveLab will be the final destination for the audio signal.
Using External Hardware ProcessorsIf you have a hardware processor that you’d like to include in WaveLab, you can do sosimply by connecting the device to your audio interface and using the External GearASIO plug-in. Your audio interface will need to have more than two inputs and outputsto make using this plug-in possible. You can use only one External Gear plug-in in theMaster Section, but by daisy-chaining the ins and outs of your external hardware devi-ces, you can run as many devices together as you’d like. Click on the Master Sectioneffects slot where you’d like to install the plug-in, click on ASIO plug-ins, and selectExternal Gear. See Figure 14.37.
Normally, the Num.Outputs slider is set to As Inputs. This setting will work in mostsituations. However, it is possible to set it to 1 for mono or 2 for stereo.
Latency SliderThe Latency slider is set to Auto by default. Because the External Gear plug-in willprobably introduce some latency into the audio path, the Auto setting will compensateautomatically for the latency. (The latency is corrected only during the rendering pro-cess, not during monitoring.) If you need to, you can manually adjust for up to 2,000milliseconds (2 seconds) of Latency.
Send Level SliderThe default setting of 0 dB should work well most of the time. However, because mosthardware devices have their own input and output volume controls, you might need tomake sure to balance them first and then adjust the Send Level slider to make any finalcorrections.
Figure 14.37 The External Gear control panel.
52 WaveLab 7 Power!: The Comprehensive GuideNot For Sale
Configuring the ASIO Plug-Ins TabAs with the Audio Input plug-in, the Input and Output settings for the External Gearplug-in are programmed in the ASIO Plug-Ins tab. Click on the Options menu, click onAudio Streaming Settings, and click the ASIO Plug-Ins tab. See Figure 14.38.
The ASIO Plug-Ins tab has two columns, with Device Output (to Gear) on the left andDevice Input (from Gear) on the right. The left-to-right orientation of the ins and outs iscritical. The topmost output flows to the topmost input, and so on. For example, let’ssay I had a Neve Portico 5042 tape saturation emulator I wanted to use in my MasterSection. I would connect a pair of outputs from my audio interface to the inputs of the5042 and then the outputs of the 5042 back into a pair of my audio interface inputs. InFigure 14.38, I’ve used the third and fourth analog ins and outs of my SteinbergMR816CSX to connect the 5042 ins and outs.
Now let’s take a moment to consider the signal flow. The audio file you have loadedwill play back into the Master Section. The signal will flow through the effects slotsfrom top to bottom. When the signal hits the External Gear plug-in, it will get sentout of the Device Outputs (to Gear) ports defined in the ASIO Plug-Ins tab (refer toFigure 14.38). That puts the signal flow into your hardware processor. Then, when thesignal flows from your processor’s audio output, it will arrive at the Device Input (fromGear) ports defined in the ASIO Plug-Ins tab. If there are additional Master Sectionplug-ins below the External Gear plug-in, the signal will flow through those as well.Finally, the entire signal flow will arrive at the Master Level faders and the DitheringSlot, waiting to be rendered.
Figure 14.38 The Audio Streaming Settings ASIO Plug-Ins tab for the External Gear plug-in.
Monitoring and Rendering with the External Gear Plug-InWhen you’re playing back your audio material through the External Gear plug-in,you’ll be able to monitor the sound of all your plug-ins, including the External Gearplug-in. However, during rendering, the process will change from the proceduredescribed in Chapter 6. When you’re using software plug-ins, the rendering is doneat much faster than real time. Because of that, you won’t be able to monitor the play-back of the rendering. But when you’re using the External Gear plug-in, the renderingprocess must be done in real time. In other words, if your audio material is five minuteslong, then the render will take five minutes. That’s because your hardware processorsoperate in real time, not in the accelerated world of software plug-ins. You also won’tbe able to monitor the playback during rendering.
Tips on Using Hardware ProcessorsIf your hardware processor is volume-based (such as a compressor or an EQ), then youwill have to worry only about the input and output levels. Make sure you never clip thesignal flow of any hardware processor, or else you will be adding unwanted distortionto the rendered file.
If you’re using a hardware processor that is time-based (such as a delay or reverb),you’ll need to watch the input/output levels and the wet-to-dry mix control of the pro-cessor. Most time-based hardware devices have a knob to control wet-to-dry levels, butsome might have that control in software (accessible from a menu) or might also be setto pass only wet signal. Because passing some of the dry signal will be paramount whenusing time-based devices with the External Gear plug-in, make sure you know how toset the hardware processor wet/dry balance.
Using Legacy, VST, and Third-Party Plug-InsThe layout of your plug-in folders might look very different from mine. Because I’musing the Mac version while writing this book, the three main folders I see when I clickon an effects slot are ASIO Plug-Ins, VST, and VST-3. However if you’re working on aPC and/or you have third-party plug-ins installed, there will be more plug-ins fromwhich to choose.
Figure 14.39 shows one of my Windows-based mastering computers. You can see thatthere’s a Legacy folder and a UAD folder. (There’s also a DirectX folder, but becausethis plug-in standard is all but dead, I won’t go over it.)
Legacy Plug-InsBecause WaveLab has been available on the Windows platform since the mid-1990s,and some of you have upgraded from a previous version of WaveLab, you can accessall of the older plug-ins from the Legacy folder. This will allow you to access the olderversions of the more modern VST3 plug-ins. (There are no Legacy plug-ins for the Mac,because WaveLab 7 is the first version that runs on the Mac platform.)
54 WaveLab 7 Power!: The Comprehensive GuideNot For Sale
VST and Third-Party Plug-InsThe Steinberg VST plug-in standard stimulated a lot of third-party plug-in develop-ment. Because of that, there are some fantastic plug-ins you can add to WaveLab.When you run the installer for the third-party plug-ins, they’ll usually be placed intoa folder that WaveLab can see. So the next time you launch WaveLab, it will detectthose plug-ins so that you can use them in the Master Section.
I’m a big fan of the Universal Audio UAD series of plug-ins. Currently, they areall VST2 compatible, not VST3. For that reason, I need to find them in the VSTfolder (refer to Figure 14.39), not the VST-3 folder. Finding out what VST standardyour plug-ins are based on will help you find them in WaveLab after you’ve installedthem.
VST Folder
UAD Folder
Legacy Folder
Figure 14.39 Additional folders on a PC with third-party plug-ins.
VST Plug-In SettingsWaveLab allows you to customize where your plug-ins are located, which ones areloaded and ignored, and how the knobs on the plug-in control panels will react tomouse editing. Go to the Options pull-down menu and select VST Plug-In Settings.
At the top of the Plug-In Settings dialog box, shown in Figure 14.40, is a check box forSearch Standard VST Plug-In Shared Folder. On a PC, that’s usually C:\Program Files\Steinberg\VSTPlugins. On a Mac, it’s usually /Library/Audio/Plug-Ins/, and then thereare folders for both VST and VST3. If you don’t want WaveLab to look in those fold-ers, uncheck this box.
The next setting allows you to define the location of your Optional Extra VST Plug-InFolder (Wavelab Specific). Sometimes, a third-party developer will have their installerput the plug-ins into a different VSTPlugins (Windows) folder. If you’d like to use thoseplug-ins in WaveLab, you might need to define the folder in this field. Or you can copyand paste them into the standard VST plug-ins folder by using Windows Explorer orthe Mac Finder.
If you’re doing your own customized plug-in folder management, and you’ve definedthat location as your Optional Extra VST Plug-In Folder (WaveLab Specific), you canalso tell WaveLab to ignore the subfolders that you list in the Ignore Plug-Ins Located
Figure 14.40 Plug-In Settings dialog box.
56 WaveLab 7 Power!: The Comprehensive GuideNot For Sale
in the Following Subfolders (Separate Folder Names with a Semicolon) field. As thefield name implies, the names of the folders will need to be separated with a semicolon(Folder 1; Folder 2; Folder 3; and so on).
If you know that there are some plug-ins in the standard VST plug-ins folder that youdon’t want to load, you can type the plug-in name(s) into the Do Not Load the Fol-lowing Plug-Ins list. Each plug-in name will need to be typed verbatim and separated bya carriage return (Enter key). Because WaveLab detects and analyzes all the plug-ins forcompatibility, your list should resemble Figure 14.40. You can see that, because VSTinstrument and synthesizer plug-ins are not compatible with an audio editing programlike WaveLab, all of my synthesizer plug-ins are already added to that list and willtherefore be ignored. However, if there’s a problematic plug-in that is crashing or caus-ing other problems but is supposed to be WaveLab-compatible, you can enter its namehere so that WaveLab will ignore it until the developer can update the plug-in.
The Keep Plug-Ins in Memory until WaveLab Ends option will keep plug-ins loaded inmemory even when they have been removed from the Master Section effects slots. Ifyou’re loading and unloading plug-ins a lot, this might be a good check box to enable.However, because the memory required to keep unused plug-ins can cause performanceissues, especially on RAM-starved computers (2 GB or less), you should probably leavethis at the default setting of unchecked.
The Faster Graphics Refreshing (Consumes More Computer Power) option is checkedby default. This allows the visual meters and graphs on the plug-in control panels torespond more quickly. Usually, you’d want more accurate metering. But if you’re rely-ing on batteries for power or the increased fan noise of your computer is distracting,you might need to disable this setting.
Force Plug-In Detection at Next Launch ButtonClicking this button will require WaveLab to re-detect and reanalyze the plug-infolder(s) the next time you launch WaveLab. If you’ve installed new plug-ins orupdated plug-ins that were deemed incompatible (therefore, not loaded), you canclick this button and then quit and re-launch WaveLab. Your plug-ins should appearthe next time you look for them in the Master Section.
VST Plug-In Knobs SettingsAt the bottom of the dialog box are three different VST knob behaviors. Circular modewill require you to make circular mouse movements when turning a knob clockwise orcounterclockwise. Circular mode will snap the position of the knob to where thepointer is clicked. But in Circular Mode (Relative Movement), you can make adjust-ments to the knob from anywhere on it, and it won’t snap to the pointer position. (It’ssimilar to turning a knob with your fingers and then moving your fingers and movingthe knob again.) Linear mode is the default knob behavior and was described earlier inthis chapter.
Note: When you change the VST knob settings, the new behavior won’t workon plug-ins that were already loaded into an effects slot. You can engagethe new knob setting by unloading and reloading the plug-in(s) or by closingand re-launching WaveLab.
Plug-In OrganizationYou can customize how and where different plug-ins will appear in the Master Sectioneffects slots. Go to the Options menu and select Plug-In Organization.
The Plug-In Organization dialog box, shown in Figure 14.41, is divided into six col-umns with some command buttons on the right-hand side. The plug-in names willappear in the first column and inside their default group folder.
The Effect check box will allow a plug-in to appear either in Master Section or AudioMontage effects slots. The Post check box will allow a plug-in to appear in the MasterSection Dithering slot (post-fader).
Then Gen check box will enable the plug-in to be displayed in its Generic Editor stylecontrol panel. This will reduce the plug-in’s fancy control panel to a series of horizontalsliders.
The Shortcut column allows you to define keyboard shortcuts or MIDI commandsfrom a MIDI controller to load plug-ins into a highlighted effects slot. In
Figure 14.41 Plug-In Organization dialog box.
58 WaveLab 7 Power!: The Comprehensive GuideNot For Sale
Figure 14.41, you’ll notice that the MultibandCompressor, the GEQ-30, and the Max-imizer have ` , 1; ` , 2; and ` , 3 as their respective shortcuts. ( ` is the tilde key located tothe left of the number 1 key on the top row of numeric keys.) With those shortcuts, Ican click on a Master Section effects slot, type the shortcut, and load the plug-in. Dou-ble-clicking in the plug-in Shortcut column will open a dialog box for programming thekeys and MIDI commands.
Note: The shortcuts work only with the Master Section and not the AudioMontage effects slots.
The File Name column shows you where the plug-in is located on your computer.
Adding a New GroupSometimes it’s nice to have your plug-ins show up by their nature, not in alphanumericorder. For example, in Figure 14.41, you’ll notice a group folder named Compressors. Iadded that group folder by clicking the New Group button on the right-hand side ofthe dialog box. Then I named the group Compressors. If I wanted to arrange all of mycompressor plug-ins into that folder, I would click and drag each plug-in from the othergroups into the Compressors group. The next time I clicked on an effects slot, a Com-pressors folder would be visible along with the ASIO Plug-Ins, VST, and VST-3 folders.You could do the same thing with limiters, chorus, EQs, and so on.
WaveLab-Specific Plug-InsThe following six WaveLab-specific plug-ins will not appear in any other VST3-com-patible program. Although most of them fall into an aforementioned category, I willdescribe them here individually.
Crystal ResamplerThe Crystal Resampler is a high-quality plug-in that will convert the sample frequencyof an audio file. One common situation would be to take files that were originallyrecorded at 44.1 kHz and convert them to the video-compatible frequency of48 kHz, or vice versa. Another example is to take audio files recorded at ultra-highsample frequencies (such as 96, 192, and 384 kHz) and resample them to an audio CD–
compatible frequency of 44.1 kHz.
Because you’ll be using the Crystal Resampler in the Master Section, the processinghappens in real time.
The appearance of the control panel (see Figure 14.42) varies depending on whetheryou’re using WaveLab 7.0 (left) or 7.1 (right). But the functionality and processing areidentical. The difference is merely cosmetic.
Sample RateThis sets the desired sample frequency to which you’d like the file to be resampled. Thechoices range from 6 kHz to 384 kHz.
QualityThis will allow you to customize the quality of the resampling. The settings includePreview (fast), Standard, High, and Ultra (slow). A modern computer usually can pro-cess at the Ultra setting, and that is the setting I recommend. However, if you’re using alot of other plug-ins that are drawing a lot of power, and the Ultra setting is causingdropouts, pops, or clicks, you can use a lower setting. But when it comes time to renderthe results, make sure you move the setting back to Ultra.
LevelerThe Leveler (see Figure 14.43) is a dynamic processor in that it affects the audio vol-ume. However, it does not provide any compression or limiting, as other dynamic pro-cessors do. Instead, it allows you to adjust the volume on the left and right channelsseparately. That’s very useful if your audio file is louder or quieter on one channel thanon the other.
Volume LeftThis is the output level fader for the left channel. It is adjustable from �48 dB to 12 dB.
Figure 14.42 The Crystal Resampler control panels.
Figure 14.43 The Leveler control panel.
60 WaveLab 7 Power!: The Comprehensive GuideNot For Sale
Volume RightThis is the output level fader for the right channel and is also adjustable from �48 dBto 12 dB.
Stereo LinkWith this setting enabled, the Volume Right fader is linked to the Volume Left fader.However, the visible position of the Volume Right fader will not reflect the VolumeLeft fader position.
Mix to MonoWhen enabled, both the left and right audio channels are mixed together to create amonophonic output.
Leveler MultiThe Leveler Multi (see Figure 14.44) basically is a simpler version of the Leveler; how-ever, it has more than two inputs. Therefore, it can be used on a multichannel AudioMontage like a 5.1 surround-sound configuration. It also can be used on mono andstereo audio files or Montages.
VolumeThis is the output level fader for the entire plug-in. It is adjustable from �48 dB to12 dB.
Peak MasterThe Peak Master (see Figure 14.45) is basically a limiter. As its name implies, it isdesigned to limit the peak volume, thereby allowing more overall gain to be appliedto the audio without clipping. Because it is a limiter, it’s best to place the Peak Masterin the last effects slot.
Input GainThis controls how much signal comes into the plug-in. The setting is variable from�12 dB to 24 dB.
Out CeilingThis sets the maximum level allowed at the output of the plug-in. The setting is variablefrom �18 dB to 0 dB.
SoftnessThis controls how softly the peaks are rounded. It has arbitrary values from +/�5.Increasing the Softness will make the peaks more tube- or tape-like, while loweringthe Softness will create fewer audible limiting artifacts.
SilenceThe Silence plug-in (see Figure 14.46) is a dynamic processor, but its job is to add avery precise amount of absolute silence (�∞ dB) at the beginning and/or end of anaudio file. Although you can use it as a real-time plug-in, the silence will not be appar-ent during playback; the silence will be added only during the rendering process.
The Silence plug-in is commonly used in the Batch Processor Workspace (see Chapter 19,“The Batch Processor Workspace”) for adding silence to a series of audio files.
StartThis controls the amount of silence that will be added to the start or beginning ofthe audio file. It is adjustable from 0.00 milliseconds to 60,000.00 milliseconds(60 seconds).
Figure 14.45 The Peak Master control panel.
Figure 14.46 The Silence control panel.
62 WaveLab 7 Power!: The Comprehensive GuideNot For Sale
EndThis control is identical to the Start control, but the silence will be added to the end ofthe audio file.
StereoExpanderStereoExpander (see Figure 14.47) is basically a modulation effect. It works best onaudio files that have very similar left- and right-channel data (which would make itsound monophonic) and adds more stereo separation.
WidthThis control defines how much artificial stereo separation is added to the sound from0% to 100%. Values below 25% will usually create a pleasant stereo effect. Valuesabove 25% will increase the stereo separation but can introduce more audible process-ing artifacts.
DitheringDithering is a process by which bits are removed from an audio file, thereby making itcompatible with audio devices that require a lower bit depth. For example, an audioCD requires a 16-bit audio file format. Therefore, you cannot burn 20-, 24-, or 32-bit(or higher) audio files onto an audio CD unless you dither them down to 16-bit.
InternThe name of this plug-in is an abbreviation of Internal (see Figure 14.48). Basically, it’sWaveLab’s built-in dithering plug-in. Unlike other plug-ins, Intern does not have a sep-arate control panel. Rather, it simply enables the Noise Type, Noise Shaping, and Out-put Bit Resolution settings in the Dithering slot (located in the Master Section).
Noise TypeThe term “noise” is a little misleading. It’s not the kind of noise you would associatewith hiss or buzz. Dithering noise is the process by which bits are removed from thequiet sections of the original audio file. So when you are selecting different noise types,the audible difference is hardly discernable unless you’re auditioning the quiet (levelsbelow �18 dB) parts of the audio file.
There are three different noise types: No Noise, Noise Type 1, and Noise Type 2.
Noise ShapingThere are four different noise shapes: No Noise Shaping and Noise Shaping 1 through 3.Different settings will have different results depending on the frequency content of thequiet part of the audio file.
Output Bit ResolutionThis setting allows you to define the bit depth of the rendered audio file. It is variablefrom 8-, 16-, 20-, and 24-bit depths.
The Apogee UV22HRThe UV22HR (see Figure 14.49) was developed by Apogee and is one of the mostwidely used and well-respected dithering processes in the industry. Steinberg haslicensed the Apogee technology and includes the UV22HR in WaveLab.
The UV22HR is not only a state-of-the-art dithering plug-in, but it’s also one of theeasiest plug-ins to use.
Output BitsThis is where you click on the desired bit depth of the rendered file. For example, ifyou’re converting 32-bit audio files to 24-bit, click on the 24 button. If you’re convert-ing 24-bit audio files to 16-bit, click on the 16 button.
Dither LevelThis setting is a little trickier. But frankly, I’ve never used any setting other than Hi,which is the default setting. The Lo setting applies the lowest level of dithering noise,
Figure 14.49 The Apogee UV22 High-Resolution dithering plug-in.
64 WaveLab 7 Power!: The Comprehensive GuideNot For Sale
while the Auto Black setting basically disables the dithering process whenever the play-back volume reaches �∞.
New WaveLab 7.1 Plug-InsOne of the most wonderful things about software is that when a manufacturer updatesthe software, they usually include new functionality. WaveLab 7.1 is no exception.There is a new Stereo Tools plug-in, along with two simplified versions of the StereoTools functionality.
Stereo ToolsThe Stereo Tools plug-in (see Figure 14.50) provides real-time phase inversion, channelswapping, and M/S (mid/side) decoding. (For more information about inverting phase,refer to Chapter 7.) M/S audio files are created by recording with two microphones thathave specific characteristics. The mid microphone (usually a cardioid, directional mic)is pointed directly at the sound source, while a microphone with a figure-eight pickuppattern is turned 90 degrees and placed so that the diaphragms are oriented at the samedistance from the sound source. Because the equal distance from the source is critical,the mics usually are positioned with the mid mic directly over the side mic.
For a more detailed description of M/S and other microphone techniques, check out BigStudio Secrets for Home Recording and Production (Course Technology PTR, 2010).
As its name implies, the Stereo Tools plug-in is functional only when used on stereoaudio files.
Invert Left Phase and Invert Right PhaseThese settings allow you to invert the phase of the left, right, or both audio channels.
Swap ChannelsThis setting will reroute the audio file’s left channel to the right output, while simulta-neously rerouting the right channel to the left output.
TransformThe Transform setting should be changed from the default setting of Nothingonly when using the Stereo Tools plug-in to decode M/S stereo files. Left/Right ->Mid/Side will decode a stereo file to M/S, while Mid/Side -> Left/Right will decodean M/S file to stereo.
Left/Mid GainThis controls the volume of the left or mid channel volume, depending on the Trans-form setting (see above).
Right/Side GainThis controls the volume of the right or side channel volume, depending on the Trans-form setting (see above).
Left/Mid PanningOne of the advantages of M/S recording is being able to virtually reposition the micro-phone after the recording. Therefore, this controls the placement of the left or midchannel in the stereo field.
Right/Side PanningThis controls the placement of the right or side channel in the stereo field.
The Two Additional M/S Plug-InsWaveLab 7.1 also includes two M/S plug-ins that are basically simpler versions of theM/S functions found in the Stereo Tools plug-in. These are the LR -> M/S and M/S ->LR plug-ins. They offer the M/S and left/right decoding of the Stereo Tools plug-ins,but that’s all they do. They’re so basic, in fact, that they don’t have a control panel oftheir own. Therefore, the Control Panel button on the Master Section will be grayedout.
66 WaveLab 7 Power!: The Comprehensive GuideNot For Sale