32

14008_Cover.indd 114008_Cover.indd 1 11/5/2003 5:19:29 AM11/5/2003 5:19:29 AM

2 LETTER TO SHAREHOLDERS
6 AT A GLANCE
8 A DECADE OF TRANSFORMATION
14 FINANCIAL REVIEW
27DIRECTORS & OFFICERS OF THE COMPANY
28 SHAREHOLDER INFORMATION
14008_insidecovers.indd 114008_insidecovers.indd 1 11/2/2003 9:41:43 AM11/2/2003 9:41:43 AM

1AMETEK 2009 ANNUAL REPORT
Financial Highlights
Net Sales
10-year CAGR is 9%
$2,600
2,200
1,800
1,400
1,00000 01 02 03 04 05 06 07 08 09
(in millions)
Diluted Earnings per Share
10-year CAGR is 12%
$2.50
2.10
1.70
1.30
0.90
0.5000 01 02 03 04 05 06 07 08 09
(in millions, except per share data and number of employees)
For the Year 2009 2008 2007 2006 2005
Net sales $ 2,098.4 $ 2,531.1 $ 2,136.9 $ 1,819.3 $ 1,434.5
Operating income (1) 366.1 432.7 386.6 309.0 233.5
Net income (1) 205.8 247.0 228.0 181.9 136.4
EBITDA (1) (2) 428.0 489.4 433.9 351.4 269.9
Free cash fl ow (3) 331.6 203.1 240.9 196.8 132.4
Capital expenditures 33.1 44.2 37.6 29.2 23.3
Diluted earnings per share (1) 1.91 2.30 2.12 1.71 1.29
Cash dividends paid per share 0.24 0.24 0.24 0.18 0.16
At Year End
Total debt $ 1,041.7 $ 1,111.7 $ 903.0 $ 681.9 $ 631.4
Net debt (4) 795.3 1,024.7 732.9 632.8 595.9
Stockholders’ equity (5) 1,567.0 1,287.8 1,240.7 966.7 809.5
Shares outstanding 107.9 106.7 107.4 106.1 105.7
Number of employees 10,100 11,700 11,300 10,400 9,800
(1) Amounts for 2005 refl ect the retrospective application of Financial Accounting Standards Board (“FASB”) Accounting Standards Codifi cation (“ASC”)
Compensation–Stock Compensation Topic 718 to expense stock options effective January 1, 2006.
(2) EBITDA represents income before interest, income taxes, depreciation and amortization. (See table on page 25 for a reconciliation of net income
reported in accordance with U.S. generally accepted accounting principles (“U.S. GAAP”) to EBITDA.)
(3) Free cash fl ow represents cash fl ow from operating activities, less capital expenditures. (See table on page 25 for a reconciliation of cash fl ow from
operating activities reported in accordance with U.S. GAAP to free cash fl ow.)
(4) Net debt represents total debt minus cash and cash equivalents. (See table on page 25 for a reconciliation of debt reported in accordance with U.S.
GAAP to net debt.)
(5) The adoption of certain provisions in FASB ASC Compensation–Retirement Benefi ts Topic 715 for our defi ned benefi t pension plans, which were
effective December 31, 2006, resulted in a reduction of $32.7 million to stockholders’ equity. The adoption of provisions in FASB ASC Income Taxes
Topic 740, as of January 1, 2007, resulted in a $5.9 million charge to the opening balance of stockholders’ equity.
CAGR=Compound Annual Growth Rate
14008_text.indd 114008_text.indd 1 11/7/2003 12:36:31 AM11/7/2003 12:36:31 AM

2 AMETEK 2009 ANNUAL REPORT2222222222222222222222222222222222222222222222222222222 AAAMMMMEEEAMAA TTTTTEEEKKKT 22202 09 ANNUAL REPORT2 AMETEK 2009 ANNUAL REPORT
Frank S. HermanceChairman and Chief Executive Offi cer
Letter to Shareholders
and our commitment to invest in new
products, new markets and global
expansion.
Outlook for 2010We are seeing improvements in many
of our markets. Our fourth quarter
2009 results refl ected sequentially
higher sales, improved profi tability
and excellent cash fl ow. Order rates
from our customers increased 20%
from the prior quarter and were up
4% year over year. Also, the order
rate improvement has carried into the
fi rst quarter of 2010.
For the year, we expect our
businesses overall to show modest
growth and for this growth to
become more evident as we move
through the year. We believe our
strong portfolio of businesses,
proven operational capabilities and
lower cost structure, along with our
continued focus on strategic acquisi-
tions and internal development, will
be refl ected in our results for 2010.
Decade of Transformation2009 was a single year in a decade
of dramatic change for AMETEK.
Over the course of that decade,
we used acquisitions and internal
development to transform AMETEK
into a global manufacturer of highly
differentiated electronic instruments
and electromechanical devices.
We acquired dozens of businesses,
added new growth platforms,
expanded lean manufacturing
facilities, and increased sales and
marketing worldwide. The results
were signifi cant.
Our sales topped $1 billion for the
fi rst time in 2000 and $2 billion in
We enter 2010 fi nancially strong. We have outstanding businesses
and a solid growth plan.
20
09
2
00
8 2
00
7 2
00
6 2
00
5 2
00
4 2
00
3 2
00
2 2
00
1 2
00
0 19
99
14008_text.indd 214008_text.indd 2 11/7/2003 12:36:33 AM11/7/2003 12:36:33 AM

3AMETEK 2009 ANNUAL REPORT
2007. At the start of the decade, less
than a third of our sales were interna-
tional. Today, it’s half. We expanded
our global footprint from 15 countries
in 1999 to nearly 40 today.
We saw similarly dramatic
improvement in our operating results.
Group operating margins improved
from 15% in 1999 to 19% in 2009.
Despite a diffi cult economy, our
businesses generated $365 million
in operating cash fl ow in 2009,
compared with $87 million in 1999.
Those results are refl ected in our
strong stock price performance. Over
the past decade, our stock price has
increased more than sixfold, signifi -
cantly outpacing the returns of our
benchmark indexes (the Russell 1000
and the Dow Jones U.S. Electronic
Equipment Indexes), each of which is
below the level it was a decade ago.
The driving force behind our
transformation was the solid execu-
tion of our Four Growth Strategies:
Operational Excellence, Strategic
Acquisitions & Alliances, Global &
Market Expansion and New Product
Development. Guiding the ap-
plication of those strategies was an
emphasis on growing the differenti-
ated portion of AMETEK’s business
portfolio.
Our differentiated businesses
compete on the basis of product
capability, rather than price, and offer
higher margins and better overall
returns. Today, they account for 90%
of our business. We have managed
our cost-driven businesses, which
make up the remaining 10%, to
ensure maximum operating effi ciency
and strong cash generation.
Our Vision of the FutureAs we enter the second decade of
this century, we remain committed
to achieving our vision of doubling
the size and profi tability of AMETEK
over the next fi ve years and our goal
of double-digit percentage growth in
earnings per share over the business
cycle.
To achieve our vision and goal, we
will continue to focus on acquiring
differentiated businesses, pursuing
opportunities in new and emerging
technologies, and establishing
additional growth platforms for the
Company.
Building on a Solid FoundationOur Four Growth Strategies serve
as the foundation for our Corporate
Growth Plan. Supporting those
strategies is a proven management
team that utilizes a disciplined busi-
ness approach and adheres to a set
of strong core corporate values.
Operational ExcellenceMuch of our success is due to the
Operational Excellence culture that
exists within AMETEK. Operational
Excellence serves as the cornerstone
for our Corporate Growth Plan. It is
an essential factor in our ability to
leverage our business model and
bring higher sales to the bottom line.
It allows us to achieve synergies
from newly acquired businesses and
consistently deliver quality and value
to our customers.
Operational Excellence drives
our focus on cost reduction and
asset management. It allowed us to
quickly implement our cost reduction
initiatives and to maintain group
operating margins at a healthy 19%
in 2009, despite the economic and
competitive pressures faced by our
businesses.
Operational Excellence has been
pivotal in achieving superior working
capital and asset management
results. We continue to rank above
many of our peers in terms of work-
ing capital performance and see
opportunities to further reduce our
working capital requirements going
forward, helping to drive the cash
fl ows that support our growth plan.
Operational Excellence is the key
to achieving improved operating
effi ciencies. It allowed us to establish
a lean manufacturing platform for
our fl oor care motors—our most
cost-driven business—and smoothly
expand our low-cost manufacturing
at plants in China, the Czech Repub-
lic and Mexico.
Throughout 2009, we were proac-
tive about reducing costs, and, as we
move through 2010, we will continue
to aggressively pursue productivity
improvements and cost reductions.
Supporting those cost reductions are
several Companywide initiatives such
as our Global Sourcing and Stra-
tegic Procurement Initiative, which
generated $22 million in incremental
Total Return to Shareholders$900
800
700
600
500
400
300
200
100
012/311999
12/312000
12/312001
12/312002
12/312003
12/312004
12/312005
12/312006
12/312007
12/312008
12/312009
AMETEK, Inc. Russell 1000 Dow Jones U.S. Electronic Equipment
The chart depicts the performance of $100 invested in AMETEK, Inc. versus the Russell 1000 and the Dow Jones U.S. Electronic Equipment Indexes on December 31, 1999, including reinvestment of dividends.
14008_text.indd 314008_text.indd 3 11/7/2003 12:36:41 AM11/7/2003 12:36:41 AM

4 AMETEK 2009 ANNUAL REPORT
savings in 2009 with additional sav-
ings expected in 2010.
Strategic AcquisitionsAcquisitions will continue to play an
important role as we look to grow
in existing and adjacent markets.
We remain an active and disciplined
acquirer with strict acquisition
criteria, seeking businesses in niche
markets that complement our exist-
ing businesses or offer opportunities
in higher-growth markets.
We conduct a thorough due
diligence process to ensure that
the business to be acquired meets
our strategic and fi nancial criteria.
And, once it’s acquired, we quickly
integrate it to capitalize on synergies
with existing businesses, paying
close attention to cost and asset
management opportunities.
Since the beginning of 2000, we
have completed more than three
dozen such acquisitions, represent-
ing about $1.5 billion in annualized
revenue, and despite deploying $1.9
billion in capital for acquisitions since
2000, we cut our net debt-to-capital
ratio from 60% at year-end 1999 to
34% at year-end 2009.
As we have executed our acquisi-
tion strategy, we have shifted our
mix of businesses toward those that
are differentiated and therefore offer
better opportunities for growth and
profi tability. Recent acquisitions
have strengthened our position
in instrumentation for elemental
analysis, nanotechnology, oil and
gas production and distribution, and
nuclear spectroscopy. All fi t well with
our core competency in measuring
physical phenomena and, equally
important, provide growth opportuni-
ties in new and emerging markets.
We’ve also used acquisitions
to establish a global network of
maintenance, repair and overhaul
(MRO) facilities to serve the aviation
aftermarket, to broaden the scope of
our power instruments into electronic
test and measurement equipment,
and to pursue opportunities in highly
engineered technical motors, motion
control products and specialty
metals.
Our most recent acquisitions
include:
High Standard Aviation, a Miami- +based provider of aerospace
MRO services that strengthens
our capabilities and broadens our
global MRO footprint
Unispec Marketing and Thelsha +Technical Services, Mumbai-based
businesses that sell, distribute
and service electronic instruments
throughout India
Ameron Global, a California-based +maker of pressurized gas systems
for commercial and military aircraft
and an MRO provider for aircraft
fi re suppression and oxygen sup-
ply systems
Sterling Ultra Precision, a Tampa- +based reseller of machine tools
used to make lenses and molds for
the niche ophthalmic lens market
Global and Market ExpansionWith half of our 2009 sales outside
the United States, we intend for
international sales to account for an
even greater share of our total sales
going forward. We have expanded
our global presence with a growing
network of plants, service centers
and sales operations. We currently
operate 37 manufacturing plants
outside the United States and have
more than 100 sales and service fa-
cilities in nearly 40 countries around
the world.
John J. MolinelliExecutive Vice President–
Chief Financial Offi cer
Timothy N. JonesPresident, Electromechanical Group
John Wesley HardinPresident, Electronic Instruments
David A. ZapicoPresident, Electronic Instruments
14008_text.indd 414008_text.indd 4 11/7/2003 12:36:41 AM11/7/2003 12:36:41 AM

5AMETEK 2009 ANNUAL REPORT
In 2009, we established our fi rst
direct sales presence in India with
AMETEK Instruments India Private
Limited to better support our grow-
ing Indian customer base, and we
acquired two businesses in India that
provide us with a national sales and
distribution network for our electronic
instruments. In the Americas, our
recently acquired High Standard
Aviation business provides us with
a key aerospace MRO hub for Latin
America as well as the southeastern
United States.
New ProductsWe enjoy an excellent reputation for
technical leadership and product
innovation and have maintained our
new product development initia-
tives despite the global economic
slowdown, investing more than $100
million in 2009.
Over the past fi ve years, we have
invested nearly $500 million to
successfully launch a wide range of
products across our lines of busi-
ness. Sales of products introduced
over the last three years accounted
for 19% of our total revenues in
2009, refl ecting both our ability to
anticipate the needs of customers
with the right products and improve-
ments in the pace and quality of our
innovation.
Among our recent product
introductions are state-of-the-art
metal analyzers, multicomponent
emissions monitors, advanced
microanalysis systems, ultra-
lightweight radiation detectors,
high-performance technical motors
and motion control products, and
ultraprecise surface analysis and
machining systems.
Strong Core ValuesEmbedded within our Four Growth
Strategies is the disciplined
management approach that allowed
us to quickly streamline our cost
structure, accelerate the movement
of manufacturing to low-cost facili-
ties, and continuously improve our
operating processes. It also guided
our investment in new products
and helped us identify, acquire and
integrate new businesses.
At the heart of this management
approach is a set of core values.
Among them is a commitment to
the highest standards of business
behavior and ethical responsibility.
We require all colleagues to adhere
to a written Code of Ethics and have
a Financial Code of Ethics for the
Chief Executive Offi cer and senior
fi nancial managers.
Additionally, we maintain a strong
system of fi nancial controls that
are actively monitored by senior
management, and have implemented
safeguards to further ensure the
integrity and compliance of our busi-
nesses and fi nancial systems.
We also are committed to a culture
that values diversity and fosters a
work environment that allows our
colleagues to develop meaningful
and rewarding careers. We actively
challenge senior managers to recruit,
train and develop individuals with
diverse backgrounds and experience.
We recognize the importance of
our shareholders and customers as
well as the communities in which
we operate. We are focused on
providing our shareholders with
consistent and superior returns. We
strive to provide our customers with
world-class products and services
on time, and at a fair price. And, we
are sensitive to the needs of our local
communities and actively support
programs that foster good corporate
citizenship.
Challenges and OpportunitiesWhile we are cautiously optimistic
about the near-term economic
outlook, we are extremely confi dent
about our future. We base our
confi dence on our proven record of
success as well as the strength and
experience of our management team.
We enter 2010 fi nancially strong.
We have outstanding businesses and
a solid Corporate Growth Plan built
around our Four Growth Strategies.
Our disciplined approach to business
has yielded consistent results. Our
strategy of investing in new product
development and acquiring differenti-
ated businesses has transformed the
Company.
Our greatest strength remains the
commitment of AMETEK colleagues
worldwide to the success of our
Company. Their dedicated efforts will
make our vision for AMETEK a reality.
We are confi dent our strategies
will create additional value for our
shareholders and appreciate your
continued confi dence.
On behalf of my colleagues, I thank
you for your support.
Frank S. Hermance Chairman and Chief Executive Offi cer
March 10, 2010
14008_text.indd 514008_text.indd 5 11/7/2003 12:36:45 AM11/7/2003 12:36:45 AM

6 AMETEK 2009 ANNUAL REPORT
At a GlanceAMETEK is a global leader in highly
differentiated electronic instruments and electromechanical devices.
20
09
2
00
8 2
00
7 2
00
6 2
00
5 2
00
4 2
00
3 2
00
2 2
00
1 2
00
0 19
99
Group Operating Results
$1,450
1,200
950
700
450
$350
275
200
125
5000 01 02 03 04 05 06 07 08 0900 01 02 03 04 05 06 07 08 09
$1,450
1,200
950
700
450
$350
275
200
125
5000 01 02 03 04 05 06 07 08 0900 01 02 03 04 05 06 07 08 09
EMG Sales(in millions)
EIG Sales(in millions)
EMG Income(in millions)
EIG Income(in millions)
14008_text.indd 614008_text.indd 6 11/7/2003 12:36:45 AM11/7/2003 12:36:45 AM

7AMETEK 2009 ANNUAL REPORT
AMETEK is a global leader in
electronic instruments and
electromechanical devices with
approximately 10,000 colleagues
at more than 80 manufacturing
locations around the world.
Supporting those operations are
more than 100 sales and service
locations in the United States
and 37 other countries.
AMETEK consists of two busi-
ness groups: Electronic Instru-
ments and Electromechanical.
Electronic Instruments is a
leader in advanced instru-
ments for process, aerospace,
power and industrial markets.
Electromechanical is a dif-
ferentiated supplier of electrical
interconnects, specialty metals,
technical motors and systems,
and fl oor care and specialty
motors.
Electronic Instruments Group (EIG)
EIG is a global leader in +process and analytical
instrumentation for the
chemical/petrochemical, oil
and gas, pharmaceutical,
semiconductor, and factory
automation markets.
EIG also provides a growing +range of analytical instru-
ments for the research
and laboratory equipment
and the ultraprecision
manufacturing markets.
In aerospace, EIG supplies +engine sensors, aircraft
sensors, monitoring systems,
power supplies, data
acquisition units, fuel and
fl uid measurement systems,
and cable assemblies.
EIG is a leader in power qual- +ity monitoring and metering,
sensors for gas turbine gen-
erators, uninterruptible pow-
er supplies, and program-
mable power equipment.
EIG also is a leader in dash- +board instruments for heavy
trucks, military vehicles and
construction equipment
as well as timing controls
and cooking computers for
the food service industry.
EIG additionally pro- +duces heat exchangers
and custom-compounded
engineered plastics.
Electromechanical Group (EMG)
EMG is a leader in highly +engineered electrical con-
nectors and packaging used
to protect sensitive devices
in aerospace, defense and
industrial applications.
EMG provides high-purity +powdered metals, precision
strip and foil, specialty
clad metals, shaped wire,
and advanced metal
matrix composites.
EMG is a leader in technical +motors, blowers and precise
motion control products for
data storage, medical devic-
es, business equipment, fac-
tory automation, mass transit
and other applications.
EMG blowers and heat ex- +changers provide electronic
cooling and environmental
control for aerospace and
defense. EMG also operates
a global network of aviation
maintenance, repair and
overhaul facilities.
EMG vacuum and specialty +motors are widely used in
vacuum cleaners and other
consumer appliances and
industrial equipment.
EMG also supplies industrial +battery chargers, contactors,
solenoids and switches.
Sales by Region: 2009 versus 1999
Half of AMETEK’s $2.1 billion in 2009 sales was from markets outside the United States—a dramatic change from the start of the decade. In 1999, less than a third of AMETEK’s sales were to international markets. Since then, AMETEK has signifi cantly expanded sales and marketing in key global regions and acquired businesses with a signifi cant presence in overseas markets.
Other countries Asia Europe United States
2009Total=$2.1 billion
1999Total=$925 million
14008_text.indd 714008_text.indd 7 11/7/2003 12:36:50 AM11/7/2003 12:36:50 AM

8 AMETEK 2009 ANNUAL REPORT8888888888888888888888888888888888888888888888888888888 AAAMMMMEEEAMAA TTTTTEEEKKKT 22202 09 ANNUAL REPORT8 AMETEK 2009 ANNUAL REPORT
Over the past 10 years, AMETEK has undergone a dramatic transformation
thanks to solid execution of its Four Growth Strategies.
A Decade of Transformation
AMETEK’s businesses are more
profi table today than they were
at the start of the decade. Group
operating margins have increased
from below 15% in 1999 to 19% in
2009, and cash fl ow from operations
increased from $87 million in 1999
to $365 million in 2009. As a result,
AMETEK stock has increased more
than sixfold since the end of 1999,
while AMETEK’s benchmark indexes
(the Russell 1000 and the Dow Jones
U.S. Electronic Equipment Indexes)
have declined in value over that same
time frame.
AMETEK started in 1999 with a
well-established position in industrial
process instrumentation and has
developed into a global leader in
high-end instruments for oil and
gas, laboratory research, advanced
microanalysis and nanotechnol-
ogy markets. These sophisticated,
higher-technology products fi t well
with AMETEK’s core competency in
measuring physical phenom-
ena, while providing growth
opportunities in several new
and emerging markets.
Additionally, AMETEK
leveraged a leading position
in aerospace instruments and
components in establish-
ing a global network of
maintenance, repair and
overhaul facilities serving the
aviation aftermarket. It also
broadened the scope of its
power instruments business
to include instruments that
monitor electricity transmis-
sion and distribution and,
more recently, instruments
20
09
2
00
8 2
00
7 2
00
6 2
00
5 2
00
4 2
00
3 2
00
2 2
00
1 2
00
0 19
99
AMETEK’s Model 880 NSL process analyzer is designed for highly demanding sulfur recovery applications.
with A
signedns.
14008_text.indd 814008_text.indd 8 11/7/2003 12:36:53 AM11/7/2003 12:36:53 AM

9AMETEK 2009 ANNUAL REPORT
that serve the electronic test and
measurement equipment market.
Within its electromechanical busi-
nesses, AMETEK moved beyond its
leading position in air-moving electric
motors and blowers and specialty
metals into a number of completely
new markets such as highly engi-
neered connectors and packaging
for sensitive electronic devices, and
environmental integrity systems for
aircraft and military vehicles.
AMETEK undertook its business
portfolio shift incrementally, using
its excellent cash fl ow to fuel the
transition to a more differentiated
business model. These differenti-
ated businesses compete on the
basis of product capability, have
higher growth rates and generate
superior returns to shareholders. By
the end of 2009, these differentiated
businesses accounted for 90% of
AMETEK’s revenues.
At the same time, AMETEK
carefully managed its cost-driven
businesses, which typically have
lower margins and higher capital
requirements but remain strong cash
generators. Within these businesses,
AMETEK focused on Operational Ex-
cellence and a best-cost manufactur-
ing strategy to ensure their continued
operating effi ciency, while selectively
pursuing growth opportunities that
leverage these businesses’ global
size and scope.
Advancing InnovationOne key to AMETEK’s transformation
has been the ability to develop
innovative new products and bring
them successfully
to market. Since
1999, AMETEK
has more than
doubled its annu-
al expenditures
for new product
development,
which totaled
nearly $500
million over the
last fi ve years.
To further leverage its investment
in new product development, in
2004, AMETEK introduced Design
for Six Sigma, a proven methodology
for improving the pace and quality
of innovation. In 2009 alone, sales
from AMETEK products introduced
in the last three years accounted for
19% of total revenue, demonstrating
AMETEK’s ability to develop the right
products for its customers.
Among the most recent introduc-
tions are advanced process mass
spectrometers for monitoring
pharmaceutical manufacture;
high-resolution radiation identi-
fi ers used by Homeland Security;
ultraprecise measurement tools used
in semiconductor manufacture and
nanotechnology research; highly
sensitive multicomponent emissions
monitors and infrared imaging
systems for process control; and ad-
vanced microanalysis systems used
in leading-edge materials science.
High-End Analytical InstrumentsAMETEK has long enjoyed an excel-
lent position in process analyzers,
mass spectrometers, gauges and
Group Operating Income
$500
400
300
200
10000 01 02 03 04 05 06 07 08 09
(in millions)
ge its investment
elopment in
The SPECTRO XEPOS elemental analyzer combines sophisticated performance capabilities with a compact design.
14008_text.indd 914008_text.indd 9 11/7/2003 12:37:00 AM11/7/2003 12:37:00 AM

10 AMETEK 2009 ANNUAL REPORT
transducers. Today, it has a sizable
position in the expanding market
for high-end analytical instruments.
AMETEK now offers sophisticated
laboratory research equipment,
advanced microanalysis and nano-
technology devices, highly sensitive
emissions monitors, lightweight
radiation detectors, and ultrahigh-
speed digital cameras.
Its high-end instruments now
include EDAX microanalysis systems
for electron microscopes; SPECTRO
optical emission and X-ray spec-
trometers for elemental analysis and
environmental testing; CAMECA
elemental analysis systems used
by researchers engaged in leading-
edge materials science; and Vision
Research high-speed digital imaging
systems used for motion capture and
analysis.
Energy AMETEK has responded to
the growing global demand for
energy by broadening the range of
products and services it offers the
energy production and electric power
industries.
In oil and gas, AMETEK instru-
ments monitor well production,
reservoir development and pipeline
transmission. AMETEK also offers
fl ow meters, temperature and pres-
sure transmitters and other instru-
ments designed for high-pressure
and ultradeep-sea oil and gas
production. Further downstream,
its instruments monitor gas quality,
processing and distribution.
AMETEK also supplies uninter-
ruptible power supply systems to
offshore platforms and advanced
cathodic protection systems that
protect vital energy pipelines and
structures from corrosion. In the
rapidly emerging biofuels market,
AMETEK instruments are used to
determine the properties of fuels
made from various feedstocks and
refi ning processes.
AMETEK emissions monitors
help improve operating effi ciencies
and reduce the production of
such pollutants as carbon dioxide,
nitrogen oxides, sulfur dioxide and
particulates. Its ambient air monitors
help detect potentially hazardous
airborne emissions.
Long a leader in control room
displays and event monitors for the
electric power industry, AMETEK
more recently has expanded into
power transmission and distribution
with power measurement, quality
monitoring and event recorders.
It also provides electric utilities
with uninterruptible power supply
systems, multifunction electric
meters and highly specialized com-
munications equipment for smart
grid applications.
AMETEK has promising op-
portunities in the development and
application of solar energy. In the
lab, its high-end spectrometers,
elemental analyzers, and surface and
electrochemical measurement sys-
tems are used to identify materials
and designs for more-effi cient solar
cells, while its programmable power
systems accurately model the power
generated by solar arrays.
Recognizing LeadershipAMETEK’s Materials Analysis
Division received the 2010 Helmut
Friedlaender Business Leadership
Award for building a solid manage-
ment team at each of its busi-
nesses, while maintaining a policy
of promoting from within whenever
possible and focusing on qualifi ed
women and minorities in fi lling open
positions.
Established in 2007 to honor
the late Helmut Friedlaender, who
served on AMETEK’s Board for
more than 50 years, the award
is presented annually to
an AMETEK divisional
management team that has
demonstrated outstanding
performance against
specifi c leadership
objectives. In addition
to the award, a $25,000
donation is made in honor
of Helmut Friedlaender on
behalf of the winning division to the
college or university of its choice.
transducers Today it has a s
Programmable power systems from AMETEK,
such as the TerraSAS, accurately model the power
generation characteristics of solar arrays.
A
rup
off
14008_text.indd 1014008_text.indd 10 11/7/2003 12:37:01 AM11/7/2003 12:37:01 AM

11AMETEK 2009 ANNUAL REPORT
In the fi eld, AMETEK’s highly
engineered metal strip is used as a
substrate for the latest thin-fi lm solar
panels, and its ruggedized power
inverters are integral components
for solar power systems deployed in
remote locations or under extreme
operating conditions.
Aerospace and DefenseAMETEK has served the aviation
and aerospace market for more than
50 years with aircraft and engine
monitoring systems, data acquisition
units, fuel and fl uid measurement
systems, cockpit instruments and
displays. More recently, it has added
thermal management systems,
power monitoring and control, and
environmental cooling and integrity
systems. At the same time, it has sig-
nifi cantly expanded its independent
maintenance, repair and overhaul
(MRO) services worldwide.
Coupling its expertise in
high-performance blowers and
fans with its heat exchanger and
thermal management products,
AMETEK now provides a variety of
environmental control and electronic
cooling systems to the aerospace
industry. These include advanced
nuclear, biological and chemical
fi ltration systems for military aircraft,
armored vehicles and naval vessels.
In addition, these advanced cooling
systems have been adapted to dissi-
pate the heat generated by computer
servers, routers, electronics and
telecom equipment.
Among AMETEK’s recent aero-
space innovations is the AMPHION
solid-state power controller, which
serves as the building block for an
entirely new
aircraft power
control and
distribution
architecture.
AMPHION’s
patented circuitry prevents aircraft
equipment from failing from a short
circuit and acts as a power controller
and monitor for a host of onboard
devices.
With airline operators and
equipment manufacturers increas-
ingly outsourcing MRO tasks to
independent providers, AMETEK
saw an opportunity to build on its
well-established position within the
aerospace industry and expanded
its presence in the attractive aviation
aftermarket. It added to both its
range of services and its global
footprint. Now, as industry trends
continue, AMETEK is well positioned
to capture a greater share of global
MRO activity.
AMETEK selectively acquired
and opened new MRO operations
beginning in 2006. It acquired
fi ve MRO operations in the United
States and three in Europe. In 2008,
it broadened its MRO capabilities
beyond the United States and Europe
and gained greater access to the
Asian aerospace market by opening
a new MRO facility near Singapore’s
Changi Airport.
AMETEK acquired two MRO op-
erations in 2009: Miami-based High
Standard Aviation, which provides a
key MRO hub for the southeastern
United States and Latin America, and
Ameron Global, which offers MRO
services for aircraft oxygen supply
and fi re suppression systems.
Revenue from New Products
$500
400
300
200
100
000 01 02 03 04 05 06 07 08 09
(in millions)
ry prevents aircraft
With its Singapore facility, AMETEK extended its global aviation MRO footprint into Asia.
14008_text.indd 1114008_text.indd 11 11/7/2003 12:37:05 AM11/7/2003 12:37:05 AM

12 AMETEK 2009 ANNUAL REPORT
Differentiated Electromechanical ProductsAdvanced electrical interconnects
and packaging, technical motors and
sophisticated metal alloys offer ex-
cellent opportunities for growth in a
number of highly attractive markets.
AMETEK established an entirely
new growth platform in 2005 with
the acquisition of HCC Industries,
a maker of hermetically sealed
connectors and packaging used to
protect sensitive electronic devices
from environmental damage in aero-
space, industrial, petrochemical and
telecommunications applications.
AMETEK added to that position
in 2007 with custom interconnect
subsystems found on many of the
world’s submarines and used in other
demanding environments such as
offshore oil and gas applications.
Already a leader in air-moving
electric motors and blowers and
specialty metal products, AMETEK
targeted growth opportunities in
highly engineered technical motors,
motion control products and special-
ized metal alloys.
AMETEK added technical motors
and motion control products for such
niche applications as electronic data
storage, factory automation and
medical instruments. It bolstered its
specialty metals portfolio with the
addition of precision metal strip and
foil, titanium master alloys and spe-
cialty metal powders used in surgical
implants, electronic components and
aerospace.
Expanding Internationally Over the course of the past decade,
AMETEK has been reshaped into a
global company. As recently as 2001,
AMETEK’s international sales ac-
counted for less than a third of total
sales. In 2007, those sales topped
$1 billion for the fi rst time, and today,
half of AMETEK’s revenues and more
than half of its market opportunities
are outside the United States.
AMETEK continues to focus on
building its international presence.
As part of a best-cost manufacturing
strategy, it expanded the lean manu-
facturing platforms for its cost-driven
motor business into China, Mexico
and the Czech Republic. These
modern manufacturing facilities also
provide growth and cost reduction
opportunities for its differentiated
businesses.
Acquisitions have played a key role
in AMETEK’s international growth. A
quarter of the acquisitions completed
2009 Dr. John H. Lux Total Quality Accomplishment AwardAMETEK Motors Shanghai (AMS)
was chosen as the winner of the
2009 Dr. John H. Lux Total Qual-
ity Accomplishment Award for its
“Mount Everest” lean manufacturing
initiative. The initiative focused
on reducing waste and inventory,
and eliminating non-value-added
processes. The result was an 80%
reduction in the time to build a
motor, a 90% reduction in work in
process inventory and signifi cant
cost savings.
The AMETEK Motors Shanghai
“Mount Everest” Team: (Front row
from left to right) Stone Luo, John
Tan, Ping Chen, Yanping Lu, Lin Liu,
Jim You, Catherine Tan; (Back row
from left to right) Sean Wu, Joyce
Cai, Kevin Liu, Eugina Yu, Anna
Zhang, Sam Zhao, Jack Ren, Brett
Qiu; (Not pictured) Scott Lord.
The AMETEK Motors Shanghai “Mount Everest” Team
14008_text.indd 1214008_text.indd 12 11/7/2003 12:37:06 AM11/7/2003 12:37:06 AM

13AMETEK 2009 ANNUAL REPORT
by AMETEK since 1999 are located
outside the United States. Among
them are a German leader in optical
emission and X-ray spectrometers,
a French manufacturer of advanced
analytical instruments used in the
elemental sciences and nanotechnol-
ogy, and a U.K. leader in aerospace
environmental control systems.
Many of AMETEK’s businesses
have sizable overseas markets.
AMETEK has greatly expanded its
international sales and marketing and
has more than tripled its sales and
service presence in Europe, Asia and
the Middle East since 1999.
In 2006, AMETEK opened a
marketing offi ce in Moscow for
its customers in Russia and the
independent republics of the former
Soviet Union and, in 2007, completed
an expansion of a nanotechnology
and metrology center of excellence in
England, funded in part by the U.K.
government.
While Europe remains AMETEK’s
largest overseas market, account-
ing for more than half of its total
international sales, Asia is its fastest-
growing region, with sales up more
than fi vefold since 1999.
To better serve customers in China
and India, AMETEK opened a sales
and service offi ce and instrument
demonstration facility in Shanghai
in 2008 and a similar facility in
Bangalore in 2009. With a 2009 ac-
quisition in India, AMETEK now has a
dozen offi ces across India serving its
electronic instruments markets.
The Next DecadeAs it readies to enter the second
decade of the 21st century, AMETEK
stands poised to benefi t from its
transformation, especially as the
economy improves. AMETEK’s
success in the past decade demon-
strates the soundness of the Com-
pany’s strategy. As the new decade
progresses, AMETEK will continue
to grow its differentiated business
portfolio, invest in new products,
acquire businesses in related niche
markets, add new growth platforms
and expand globally. What is past is
prologue.
y AMETEK since 1999 are located
AMETEK’s U.K. Center of Excellence for Micro- and Nanotechnology features an advanced clean room equipped
with the latest instruments from AMETEK Taylor Hobson.
Research, Development & Engineering Expense
$130
115
100
85
70
55
4000 01 02 03 04 05 06 07 08 09
(in millions)
International Sales$1,300
1,100
900
700
500
30000 01 02 03 04 05 06 07 08 09
(in millions)
14008_text.indd 1314008_text.indd 13 11/7/2003 12:37:09 AM11/7/2003 12:37:09 AM

14 AMETEK 2009 ANNUAL REPORT
fin
ancia
l revie
w
Management’s Discussion and Analysis
This 2009 summary annual report contains abbreviated fi nancial information. The complete text of Management’s Discussion and Analysis of Financial Condition and Results of Operations, and the consolidated fi nancial statements and footnotes are presented in AMETEK’s 2009 Form 10-K, and in Appendix A to the Company’s Proxy Statement for its 2010 Annual Meeting.
OverviewAs a global business, AMETEK’s
operations are affected by global,
regional and industry economic
factors. However, the Company’s
strategic geographic and industry
diversifi cation, and its mix of
products and services, have
helped to limit the potential adverse
impact of any unfavorable develop-
ments in any one industry or the
economy of any single country on
its consolidated operating results.
Beginning in the fourth quarter
of 2008 and throughout most of
2009, the Company experienced
lower order rates as a result of
the global economic recession.
However, order rates stabilized
in the third quarter of 2009 and
began to increase in the fourth
quarter of 2009, compared with the
previous quarters of 2009. In 2009,
the Company posted solid sales,
operating income, net income and
diluted earnings per share given
the global economic recession.
The impact of contributions from
recent acquisitions combined with
successful Operational Excellence
initiatives had a positive impact on
2009 results.
On January 28, 2010, the Board
of Directors authorized an increase
of $75 million in the authorization
for the repurchase of AMETEK’s
common stock. This increase
was added to the $68.5 million
that remained available as of
December 31, 2009 from an exist-
ing $100 million in authorizations
approved in 2008, for a total of
$143.5 million available for repur-
chases of the Company’s common
stock. Subsequent to December 31,
2009, the Company repurchased
1,128,200 shares of its common
stock for approximately $41.8
million through February 25, 2010.
The remaining balance available
for repurchases of the Company’s
common stock is $101.7 million as
of February 25, 2010.
The table on the opposite
page sets forth net sales and
operating income for the Company
by business segment and on a
consolidated basis for the years
ended December 31, 2009, 2008,
and 2007. The discussion that fol-
lows should be read in conjunction
with the condensed consolidated
fi nancial statements appearing
elsewhere in this summary annual
report.
Review of OperationsAMETEK reported net sales of
$2,098.4 million in 2009, a decrease
of $432.7 million or 17.1% when
compared with net sales of $2,531.1
million in 2008. The decline in net
sales was primarily attributable to
lower order rates as a result of the
global economic recession, partially
offset by the impact of the acquisi-
tions completed in 2009 and 2008.
Net sales for Electronic Instruments
Group (“EIG”) were $1,146.6 million
in 2009, a decrease of 18.3% from
sales of $1,402.7 million in 2008.
The sales decrease was due to an
internal sales decline of approxi-
mately 20%, excluding an unfavor-
able 2% effect of foreign currency
translation, driven primarily by EIG’s
process and industrial products
businesses. Partially offsetting
the sales decrease were the 2008
acquisitions of Vision Research
and Xantrex Programmable. Net
sales for Electromechanical Group
(“EMG”) were $951.8 million in
2009, a decrease of 15.7% from
sales of $1,128.5 million in 2008.
The sales decrease was due to an
internal sales decline of approxi-
mately 21%, excluding an unfavor-
able 3% effect of foreign currency
translation, driven primarily by the
engineered materials, interconnects
and packaging products and cost-
driven motors businesses. Partially
offsetting the sales decrease were
the 2009 acquisition of High
Standard Aviation and the 2008 ac-
quisitions of Drake, MCG, Reading
Alloys and Muirhead Aerospace.
Total international sales for 2009
were $1,031.7 million or 49.2% of
consolidated net sales, a decrease
of $193.8 million or 15.8% when
compared with international sales
of $1,225.5 million or 48.4% of
consolidated net sales in 2008. The
decline in international sales re-
sulted from decreased international
sales from base businesses of
$272.5 million, which includes the
effect of foreign currency transla-
tion, partially offset by the impact of
the acquisitions completed in 2009
and 2008. The Company maintains
a strong international sales
presence in Europe and Asia by
both reportable segments. Export
shipments from the United States,
which are included in total interna-
tional sales, were $400.6 million in
2009, a decrease of $77.9 million
or 16.3%, compared with $478.5
million in 2008. Export shipments
declined primarily due to decreased
exports from the base businesses,
partially offset by the acquisitions
noted above.
14008_text.indd 1414008_text.indd 14 11/7/2003 12:37:11 AM11/7/2003 12:37:11 AM

15AMETEK 2009 ANNUAL REPORT
New orders for 2009 were $2,028.1
million, a decrease of $533.4 million
or 20.8% when compared with
$2,561.5 million in 2008. Throughout
most of 2009, the Company experi-
enced lower order rates as a result
of the global economic recession.
However, order rates stabilized in
the third quarter of 2009 and began
to increase in the fourth quarter of
2009, compared with the previous
quarters of 2009 and the fourth
quarter of 2008. As a result, the
Company’s backlog of unfi lled orders
at December 31, 2009 was $648.4
million, a decrease of $70.2 million
or 9.8% when compared with $718.6
million at December 31, 2008.
Segment operating income for
2009 was $399.5 million, a decrease
of $82.4 million or 17.1% when
compared with segment operating
income of $481.9 million in 2008.
Segment operating income, as a
percentage of sales, was 19.0% in
both 2009 and 2008. The decrease
in segment operating income
resulted primarily from the decrease
in sales noted above and higher
defi ned benefi t pension expense,
partially offset by profi t contributions
made by the acquisitions and cost
reduction initiatives, including $135
million of cost savings achieved in
2009 primarily from the restructuring
activities related to fourth quarter
of 2008 restructuring charges. The
fourth quarter of 2008 restructuring
resulted in pretax charges totaling
$40.0 million, which had the effect of
reducing net income by $27.3 million
($0.25 per diluted share). These
charges include restructuring costs
for employee reductions and facility
closures ($32.6 million), as well as
asset write-downs ($7.4 million). Of
the $40.0 million in charges, $32.9
million of the restructuring charges
and asset write-downs were re-
corded in cost of sales and $7.1 mil-
lion of the restructuring charges and
asset write-downs were recorded in
Selling, General and Administrative
(“SG&A”) expenses. As a result of
defi ned benefi t pension plan contri-
butions in 2009 and 2008, as well as
overall stock market performance in
2009, the Company expects defi ned
benefi t pension expense to be lower
in 2010 than in 2009.
SG&A expenses for 2009 were
$254.1 million, a decrease of $68.5
million or 21.2% when compared
with $322.6 million in 2008. As
a percentage of sales, SG&A
expenses were 12.1% for 2009,
compared with 12.7% in 2008. The
decrease in SG&A expenses was
primarily the result of lower sales
and the Company’s cost savings
initiatives. Additionally, 2008 SG&A
expenses include both a $7.1 million
charge, recorded in corporate
administrative expenses, related to
the accelerated vesting of an April
2005 restricted stock grant in the
second quarter of 2008 and $7.1
million of SG&A expense related to
fourth quarter of 2008 restructuring
charges and asset write-downs.
Base business selling expenses
decreased approximately 22%,
which was in line with the Com-
pany’s 2009 sales decline. Selling
expenses, as a percentage of sales,
decreased to 10.5% for 2009,
compared with 10.8% in 2008 due
to the previously mentioned cost
savings initiatives.
Corporate administrative expens-
es for 2009 were $33.2 million, a
decrease of $16.0 million or 32.5%
when compared with $49.2 million
in 2008. As a percentage of sales,
corporate administrative expenses
were 1.6% for 2009, compared
with 1.9% in 2008. The decrease in
corporate administrative expenses
was driven by the equity-based
compensation associated with the
accelerated vesting of restricted
stock in the second quarter of
2008, lower short-term incentive
compensation in 2009 and the
Company’s cost savings initiatives,
including the restructuring activi-
ties, noted above.
(in thousands)
Year Ended December 31,
2009 2008 2007
Net sales (1):
Electronic Instruments $ 1,146,578 $ 1,402,653 $ 1,199,757
Electromechanical 951,777 1,128,482 937,093
Consolidated net sales $ 2,098,355 $ 2,531,135 $ 2,136,850
% of % of % of Sales Sales Sales
Operating income (2):
Segment operating income:
Electronic Instruments $ 232,875 20.3 $ 306,764 21.9 $ 260,338 21.7
Electromechanical 166,582 17.5 175,181 15.5 167,166 17.8
Total segment operating income 399,457 19.0 481,945 19.0 427,504 20.0
Corporate administrative and other expenses (33,407) (1.6) (49,291) (1.9) (40,930) (1.9)
Consolidated operating income $ 366,050 17.4 $ 432,654 17.1 $ 386,574 18.1
(1) After elimination of intra- and intersegment sales, which are not signifi cant in amount.
(2) Segment operating income represents sales less all direct costs and expenses (including certain administrative and other expenses) applicable to each
segment, but does not include interest expense.
14008_text.indd 1514008_text.indd 15 11/7/2003 12:37:11 AM11/7/2003 12:37:11 AM

16 AMETEK 2009 ANNUAL REPORT
fin
ancia
l revie
w
Consolidated operating income
was $366.1 million or 17.4% of
sales for 2009, a decrease of $66.6
million or 15.4% when compared
with $432.7 million or 17.1% of sales
in 2008.
Interest expense was $68.8
million for 2009, an increase of $5.1
million or 8.0% when compared
with $63.7 million in 2008. The
increase was due to the full-year
impact of the funding of the long-
term private placement senior notes
in the third and fourth quarters of
2008, partially offset by the repay-
ment of a 40 million British pound
($62.0 million) borrowing under
a revolving credit facility in the
second quarter of 2009.
The effective tax rate for 2009
was 30.2%, compared with 32.6%
in 2008. The lower effective tax
rate for 2009 primarily refl ects the
impact of settlements of income tax
examinations and benefi ts obtained
from state and international income
tax planning initiatives. The ef-
fective tax rate for 2008 includes
the impact of accelerated vesting
of nondeductible restricted stock
amortization, offset by the impact
of settlements of various income
tax issues with U.S. taxing authori-
ties and a favorable agreement in
the United Kingdom related to
deductible interest expense for
which previously unrecognized tax
benefi ts were recognized.
Net income for 2009 was $205.8
million, a decrease of $41.2 million
or 16.7% when compared with
$247.0 million in 2008. Diluted earn-
ings per share for 2009 was $1.91,
a decrease of $0.39 or 17.0% when
compared with $2.30 per diluted
share in 2008. Diluted earnings
per share for 2008 includes the
impact of the fourth quarter of 2008
restructuring charges and asset
write-downs, which negatively
impacted earnings by $0.25 per
diluted share.
Review of Cash Flow and Financial PositionCash provided by operating activi-
ties totaled $364.7 million in 2009,
an increase of $117.4 million or
47.5% when compared with $247.3
million in 2008. The increase in
operating cash fl ow was primarily
the result of lower overall operating
working capital levels, which
includes the impact of a tax refund
received in 2009 that resulted from
the Company’s higher year-end
2008 defi ned benefi t pension
contributions and $21.1 million in
defi ned benefi t pension contribu-
tions paid in 2009, compared with
$79.9 million in defi ned benefi t
pension contributions paid in 2008.
As a result of the 2009 and 2008
defi ned benefi t pension plan con-
tributions, as well as overall stock
market performance in 2009, the
Company’s overall defi ned benefi t
pension plans were overfunded at
December 31, 2009. The increase
in cash provided by lower overall
operating working capital was
partially offset by the $41.2 million
decrease in net income. Free
cash fl ow (operating cash fl ow
less capital spending) was $331.6
million in 2009, compared to $203.1
million in 2008. EBITDA (earnings
before interest, income taxes,
depreciation and amortization) was
$428.0 million in 2009, compared
with $489.4 million in 2008, which
includes the fourth quarter of 2008
pretax restructuring charges and
asset write-downs of $40.0 million.
Free cash fl ow and EBITDA are
presented because the Company is
aware that they are measures used
by third parties in evaluating the
Company. (See table on page 25
for a reconciliation of U.S. generally
accepted accounting principles
(“GAAP”) measures to comparable
non-GAAP measures).
Cash used for investing activities
totaled $106.3 million in 2009,
compared with $496.6 million in
2008. In 2009, the Company paid
$72.9 million for three business
acquisitions, net of cash received,
compared with $463.0 million paid
for six business acquisitions and
one technology line acquisition, net
of cash received, in 2008. Additions
to property, plant and equipment
totaled $33.1 million in 2009, com-
pared with $44.2 million in 2008.
Cash used for fi nancing activities
totaled $102.5 million in 2009, com-
pared with $173.5 million of cash
provided by fi nancing activities in
2008. In 2009, net total borrowings
decreased by $92.4 million, com-
pared with a net total borrowings
increase of $266.9 million in 2008.
Short-term borrowings decreased
$13.0 million in 2009, compared
with an increase of $69.7 million
in 2008. Long-term borrowings
decreased $79.4 million in 2009,
compared to an increase of $197.2
million in 2008.
During the second quarter of
2009, the Company paid in full a 40
million British pound ($62.0 million)
borrowing under a revolving credit
facility. During the fourth quarter
of 2009, the Company paid in full
a 10.5 million British pound ($16.9
million) fl oating-rate term note.
In May 2009, the Company
chose not to renew its $100 million
accounts receivable securitization
facility. There were no borrowings
under this facility at December 31,
2008.
In July 2008, the Company paid
in full the $225 million 7.20% senior
notes due July 2008 using the
proceeds from borrowings under its
existing revolving credit facility.
The second funding of the third
quarter of 2007 private placement
agreement to sell $450 million
in senior notes occurred in July
2008 for $80 million in aggregate
principal amount of 6.35% senior
notes due July 2018. The 2007
14008_text.indd 1614008_text.indd 16 11/7/2003 12:37:11 AM11/7/2003 12:37:11 AM

17AMETEK 2009 ANNUAL REPORT
private placement carries a weighted
average interest rate of 6.25%. The
proceeds from the second funding of
the notes were used to pay down a
portion of the borrowings outstand-
ing under the Company’s revolving
credit facility.
In the third quarter of 2008, the
Company completed a private
placement agreement to sell $350
million in senior notes to a group of
institutional investors. There were
two funding dates for the senior
notes. The fi rst funding occurred in
September 2008 for $250 million,
consisting of $90 million in aggregate
principal amount of 6.59% senior
notes due September 2015 and $160
million in aggregate principal amount
of 7.08% senior notes due Septem-
ber 2018. The second funding date
occurred in December 2008 for $100
million, consisting of $35 million in
aggregate principal amount of 6.69%
senior notes due December 2015 and
$65 million in aggregate principal
amount of 7.18% senior notes due
December 2018. The senior notes
carry a weighted average interest
rate of 6.93%. The senior notes
are subject to certain customary
covenants, including fi nancial
covenants that, among other things,
require the Company to maintain
certain debt-to-EBITDA and interest
coverage ratios. The proceeds from
the senior notes were used to pay
down a portion of the borrowings
outstanding under the Company’s
revolving credit facility.
The Company’s revolving credit
facility’s total borrowing capacity
is $550 million, which includes an
accordion feature that permits
the Company to request up to an
additional $100 million in revolving
credit commitments at any time
during the life of the revolving credit
agreement under certain conditions.
The facility matures in June 2012. At
December 31, 2009, the Company
had $532.2 million available under
its revolving credit facility, including
the $100 million accordion feature.
At December 31, 2009, no amounts
were drawn under the revolving
credit facility.
At December 31, 2009, total debt
outstanding was $1,041.7 million,
compared with $1,111.7 million
at December 31, 2008, with no
signifi cant maturities until 2012. The
debt-to-capital ratio was 39.9%
at December 31, 2009, compared
with 46.3% at December 31, 2008.
The net debt-to-capital ratio (total
debt less cash and cash equivalents
divided by the sum of net debt and
stockholders’ equity) was 33.7% at
December 31, 2009, compared with
44.3% at December 31, 2008. The
net debt-to-capital ratio is presented
because the Company is aware that
this measure is used by third parties
in evaluating the Company. (See
table on page 25 for a reconciliation
of U.S. GAAP measures to compa-
rable non-GAAP measures).
Additional fi nancing activities
for 2009 include the receipt of net
cash proceeds from the exercise
of employee stock options of $11.6
million compared with $7.5 million
in 2008. Cash dividends paid were
$25.6 million in 2009, compared with
$25.7 million in 2008. In 2008, the
Company repaid $21.4 million in life
insurance policy loans.
Repurchases of 1.3 million shares
of the Company’s common stock
in 2008 totaled $57.4 million. No
shares were repurchased in 2009.
At December 31, 2009, $68.5 million
was available under the current
Board authorization for future share
repurchases. On January 28, 2010,
the Board of Directors authorized
an increase of $75 million in the
authorization for the repurchase of
its common stock. This increase
was added to the $68.5 million that
remained available from existing
authorizations approved in 2008,
for a total of $143.5 million available
for repurchases of the Company’s
common stock. Subsequent to
December 31, 2009, the Company
repurchased 1,128,200 shares of its
common stock for approximately
$41.8 million through February 25,
2010. The remaining balance
available for repurchases of the
Company’s common stock is $101.7
million as of February 25, 2010.
As a result of the Company’s cash
fl ow activities in 2009, cash and cash
equivalents at December 31, 2009
totaled $246.4 million, compared
with $87.0 million at December 31,
2008. Additionally, the Company is in
compliance with all of its debt cov-
enants, which includes its fi nancial
covenants, for all of its debt agree-
ments. The Company believes it has
suffi cient cash-generating capabili-
ties from domestic and unrestricted
foreign sources, available credit
facilities and access to long-term
capital funds to enable it to meet
its operating needs and contractual
obligations in the foreseeable future.
Forward-Looking Information and Risk FactorsExcept for historical information
contained in this summary annual
report, certain statements made
herein, which state the Company’s
prediction for the future, are forward-
looking statements, which involve
risks and uncertainties that exist in
the Company’s operations and busi-
ness environment and are subject to
change based on various important
factors. Actual results may differ
materially from those expressed in
any forward-looking statement made
by, or on behalf of, the Company.
Additional information concerning
risk and other factors that could have
a material adverse effect on our busi-
ness, or cause actual results to differ
from projections, is contained in the
Company’s Form 10-K for the year
ended December 31, 2009, fi led with
the U.S. Securities and Exchange
Commission.
14008_text.indd 1714008_text.indd 17 11/7/2003 12:37:12 AM11/7/2003 12:37:12 AM

18 AMETEK 2009 ANNUAL REPORT
fin
ancia
l revie
w
Reportsof Management
Management’s Responsibility for Financial StatementsManagement has prepared and is
responsible for the integrity of the
consolidated fi nancial statements
and related information. The state-
ments are prepared in conformity
with U.S. generally accepted ac-
counting principles consistently ap-
plied and include certain amounts
based on management’s best
estimates and judgments. Historical
fi nancial information elsewhere in
this report is consistent with that in
the fi nancial statements.
In meeting its responsibility
for the reliability of the fi nancial
information, management maintains
a system of internal accounting and
disclosure controls, including an
internal audit program. The system
of controls provides for appropriate
division of responsibility and the
application of written policies and
procedures. That system, which
undergoes continual reevaluation,
is designed to provide reasonable
assurance that assets are safe-
guarded and records are adequate
for the preparation of reliable
fi nancial data.
Management is responsible
for establishing and maintaining
adequate controls over fi nancial
reporting. We maintain a system of
internal controls that is designed to
provide reasonable assurance as to
the fair and reliable preparation and
presentation of the consolidated
fi nancial statements; however,
there are inherent limitations in
the effectiveness of any system of
internal controls.
Management recognizes its
responsibility for conducting the
Company’s activities according
to the highest standards of
personal and corporate conduct.
That responsibility is characterized
and refl ected in a code of business
conduct for all employees, and in a
fi nancial code of ethics for the Chief
Executive Offi cer and Senior Fi-
nancial Offi cers, as well as in other
key policy statements publicized
throughout the Company.
The Audit Committee of the
Board of Directors, which is
composed solely of independent
directors who are not employees
of the Company, meets with the
independent registered public ac-
counting fi rm, the internal auditors
and management to satisfy itself
that each is properly discharging its
responsibilities. The report of the
Audit Committee is included in the
Proxy Statement of the Company
for its 2010 Annual Meeting. Both
the independent registered public
accounting fi rm and the internal
auditors have direct access to the
Audit Committee.
The Company’s independent
registered public accounting fi rm,
Ernst & Young LLP, is engaged to
render an opinion as to whether
management’s fi nancial state-
ments present fairly, in all material
respects, the Company’s fi nancial
position and operating results. This
report is included on page 20.
Management’s Report on Internal Control over Financial ReportingManagement of the Company is
responsible for establishing and
maintaining adequate internal con-
trol over fi nancial reporting, as such
term is defi ned in the Exchange
Act Rules 13a-15(f) and 15d-15(f).
Under the supervision and with the
participation of our management,
including our Chief Executive
Offi cer and Chief Financial Offi cer,
we conducted an evaluation of the
effectiveness of the Company’s
internal control over fi nancial
reporting as of December 31, 2009,
based on the framework in Internal
Control – Integrated Framework
issued by the Committee of
Sponsoring Organizations of the
Treadway Commission (COSO).
Based on that evaluation, our
management concluded that the
Company’s internal control over
fi nancial reporting was effective as
of December 31, 2009.
The Company’s internal control
over fi nancial reporting as of
December 31, 2009, has been
audited by Ernst & Young LLP,
an independent registered public
accounting fi rm, as stated in their
report, which appears on page 19.
Frank S. HermanceChairman and Chief Executive Offi cer
John J. MolinelliExecutive Vice President–
Chief Financial Offi cer
February 25, 2010
14008_text.indd 1814008_text.indd 18 11/7/2003 12:37:13 AM11/7/2003 12:37:13 AM

19AMETEK 2009 ANNUAL REPORT
Reportof Independent Registered Public Accounting Firm on Internal Control Over Financial Reporting
To the Board of Directors and Stockholders of AMETEK, Inc.:We have audited AMETEK, Inc.’s in-
ternal control over fi nancial reporting
as of December 31, 2009, based on
criteria established in Internal Control
– Integrated Framework issued by the
Committee of Sponsoring Organiza-
tions of the Treadway Commission
(the COSO criteria). AMETEK, Inc.’s
management is responsible for
maintaining effective internal control
over fi nancial reporting, and for its
assessment of the effectiveness of
internal control over fi nancial report-
ing included in the accompanying
Management’s Report on Internal
Control Over Financial Reporting.
Our responsibility is to express an
opinion on the company’s internal
control over fi nancial reporting based
on our audit.
We conducted our audit in
accordance with the standards of
the Public Company Accounting
Oversight Board (United States).
Those standards require that we
plan and perform the audit to obtain
reasonable assurance about whether
effective internal control over
fi nancial reporting was maintained
in all material respects. Our audit
included obtaining an understanding
of internal control over fi nancial
reporting, assessing the risk that a
material weakness exists, testing and
evaluating the design and operating
effectiveness of internal control
based on the assessed risk, and
performing such other procedures
as we considered necessary in the
circumstances. We believe that our
audit provides a reasonable basis for
our opinion.
A company’s internal control over
fi nancial reporting is a process
designed to provide reasonable
assurance regarding the reliability of
fi nancial reporting and the prepara-
tion of fi nancial statements for
external purposes in accordance
with generally accepted accounting
principles. A company’s internal con-
trol over fi nancial reporting includes
those policies and procedures that
(1) pertain to the maintenance of
records that, in reasonable detail,
accurately and fairly refl ect the
transactions and dispositions of the
assets of the company; (2) provide
reasonable assurance that transac-
tions are recorded as necessary to
permit preparation of fi nancial state-
ments in accordance with generally
accepted accounting principles, and
that receipts and expenditures of
the company are being made only
in accordance with authorizations
of management and directors of the
company; and (3) provide reasonable
assurance regarding prevention or
timely detection of unauthorized
acquisition, use, or disposition of the
company’s assets that could have
a material effect on the fi nancial
statements.
Because of its inherent limitations,
internal control over fi nancial report-
ing may not prevent or detect mis-
statements. Also, projections of any
evaluation of effectiveness to future
periods are subject to the risk that
controls may become inadequate
because of changes in conditions,
or that the degree of compliance
with the policies or procedures may
deteriorate.
In our opinion, AMETEK, Inc.
maintained, in all material respects,
effective internal control over fi nan-
cial reporting as of December 31,
2009, based on the COSO criteria.
We also have audited, in ac-
cordance with the standards of
the Public Company Accounting
Oversight Board (United States),
the consolidated balance sheets of
AMETEK, Inc. as of December 31,
2009 and 2008, and the related
consolidated statements of income,
cash fl ows, and stockholders’ equity
for each of the three years in the
period ended December 31, 2009,
and our report dated February 25,
2010 expressed an unqualifi ed
opinion thereon.
Philadelphia, Pennsylvania
February 25, 2010
14008_text.indd 1914008_text.indd 19 11/7/2003 12:37:14 AM11/7/2003 12:37:14 AM

20 AMETEK 2009 ANNUAL REPORT
fin
ancia
l revie
w
Reportof Independent Registered Public Accounting Firm on Condensed Consolidated Financial Statements
To the Board of Directors and Stockholders of AMETEK, Inc.: We have audited, in accordance
with the standards of the Public
Company Accounting Oversight
Board (United States), the consoli-
dated balance sheets of AMETEK,
Inc. at December 31, 2009 and
2008, and the related consolidated
statements of income, cash fl ows,
and stockholders’ equity for each of
the three years in the period ended
December 31, 2009 (not presented
separately herein) and in our report
dated February 25, 2010, we
expressed an unqualifi ed opinion
on those consolidated fi nancial
statements.
In our opinion, the information
set forth in the accompanying
condensed consolidated fi nancial
statements (on pages 21 through
23) is fairly stated in all material
respects in relation to the con-
solidated fi nancial statements from
which it has been derived.
We also have audited, in ac-
cordance with the standards of
the Public Company Accounting
Oversight Board (United States),
AMETEK, Inc.’s internal control
over fi nancial reporting as of De-
cember 31, 2009, based on criteria
established in Internal Control
— Integrated Framework issued
by the Committee of Sponsoring
Organizations of the Treadway
Commission and our report dated
February 25, 2010, expressed an
unqualifi ed opinion thereon.
Philadelphia, Pennsylvania
February 25, 2010
14008_text.indd 2014008_text.indd 20 11/7/2003 12:37:14 AM11/7/2003 12:37:14 AM

21AMETEK 2009 ANNUAL REPORT
Condensed Consolidated Statement of Income
(in thousands, except per share amounts)
Year Ended December 31,
2009 2008 2007
Net sales $ 2,098,355 $ 2,531,135 $ 2,136,850
Operating expenses:
Cost of sales, excluding depreciation 1,435,953 1,730,086 1,444,514
Selling, general and administrative 254,143 322,552 263,472
Depreciation 42,209 45,843 42,290
Total operating expenses 1,732,305 2,098,481 1,750,276
Operating income 366,050 432,654 386,574
Other expenses:
Interest expense (68,750) (63,652) (46,866)
Other, net (2,667) (2,786) (3,264)
Income before income taxes 294,633 366,216 336,444
Provision for income taxes 88,863 119,264 108,424
Net income $ 205,770 $ 246,952 $ 228,020
Basic earnings per share $ 1.93 $ 2.33 $ 2.15
Diluted earnings per share $ 1.91 $ 2.30 $ 2.12
Weighted average common shares outstanding:
Basic shares 106,788 106,148 105,832
Diluted shares 107,850 107,443 107,580
These condensed consolidated fi nancial statements should be read in conjunction with the full fi nancial statements and the notes presented in Appendix A
to the Proxy Statement for the 2010 Annual Meeting.
14008_text.indd 2114008_text.indd 21 11/7/2003 12:37:15 AM11/7/2003 12:37:15 AM

22 AMETEK 2009 ANNUAL REPORT
Condensed Consolidated Balance Sheet
(in thousands, except share amounts)
December 31,
2009 2008
ASSETS
Current assets:
Cash and cash equivalents $ 246,356 $ 86,980
Marketable securities 4,994 4,230
Receivables, less allowance for possible losses 331,383 406,012
Inventories 311,542 349,509
Deferred income taxes 30,669 30,919
Other current assets 44,486 76,936
Total current assets 969,430 954,586
Property, plant and equipment, net 310,053 307,908
Goodwill 1,277,291 1,240,052
Other intangibles, net of accumulated amortization 521,888 441,785
Investments and other assets 167,370 111,211
Total assets $ 3,246,032 $ 3,055,542
LIABILITIES AND STOCKHOLDERS’ EQUITY
Current liabilities:
Short-term borrowings and current portion of long-term debt $ 85,801 $ 18,438
Accounts payable 191,779 203,742
Income taxes payable 13,345 31,649
Accrued liabilities 133,357 193,684
Total current liabilities 424,282 447,513
Long-term debt 955,880 1,093,243
Deferred income taxes 206,354 144,941
Other long-term liabilities 92,492 82,073
Total liabilities 1,679,008 1,767,770
Stockholders’ equity:
Preferred stock, $ 0.01 par value; authorized: 5,000,000 shares; none issued — —
Common stock, $0.01 par value; authorized: 400,000,000 shares; issued:
2009 - 111,000,578 shares; 2008 - 110,188,937 shares 1,110 1,102
Capital in excess of par value 224,057 203,000
Retained earnings 1,500,471 1,320,470
Accumulated other comprehensive loss (75,281) (144,767)
Treasury stock: 2009 - 3,116,579 shares; 2008 - 3,461,541 shares (83,333) (92,033)
Total stockholders’ equity 1,567,024 1,287,772
Total liabilities and stockholders’ equity $ 3,246,032 $ 3,055,542
These condensed consolidated fi nancial statements should be read in conjunction with the full fi nancial statements and the notes presented in Appendix A
to the Proxy Statement for the 2010 Annual Meeting.
14008_text.indd 2214008_text.indd 22 11/7/2003 12:37:15 AM11/7/2003 12:37:15 AM

23AMETEK 2009 ANNUAL REPORT
Condensed Consolidated Statement of Cash Flows
(in thousands)
Year Ended December 31,
2009 2008 2007
Cash provided by (used for):
Operating activities:
Net income $ 205,770 $ 246,952 $ 228,020
Adjustments to reconcile net income to total operating activities:
Depreciation and amortization 65,500 63,261 52,665
Deferred income tax expense 5,768 29,742 4,769
Share-based compensation expense 13,502 20,186 15,530
Changes in assets and liabilities, net of acquisitions:
Decrease (increase) in receivables, inventories, and other
current assets 170,768 (28,544) (26,750)
(Decrease) increase in payables, accruals, and income taxes (91,622) 3,161 13,421
Increase (decrease) in other long-term liabilities 3,345 (1,907) (7,153)
Pension contribution (21,127) (79,905) (5,162)
Other 12,767 (5,681) 3,183
Total operating activities 364,671 247,265 278,523
Investing activities:
Additions to property, plant and equipment (33,062) (44,215) (37,620)
Purchase of businesses, net of cash acquired (72,919) (463,012) (300,569)
(Increase) decrease in marketable securities (638) 6,323 (1,700)
Other 275 4,282 5,228
Total investing activities (106,344) (496,622) (334,661)
Financing activities:
Net change in short-term borrowings (13,013) 69,693 (162,589)
Additional long-term borrowings 1,466 430,000 370,000
Reduction in long-term borrowings (80,817) (232,835) (26,553)
Repayment of life insurance policy loans — (21,394) —
Repurchases of common stock — (57,444) (5,437)
Cash dividends paid (25,579) (25,685) (25,748)
Excess tax benefi ts from share-based payments 4,096 4,890 9,464
Proceeds from employee stock plans and other 11,328 6,238 14,961
Total fi nancing activities (102,519) 173,463 174,098
Effect of exchange rate changes on cash and cash equivalents 3,568 (7,265) 3,088
Increase (decrease) in cash and cash equivalents 159,376 (83,159) 121,048
Cash and cash equivalents:
Beginning of year 86,980 170,139 49,091
End of year $ 246,356 $ 86,980 $ 170,139
These condensed consolidated fi nancial statements should be read in conjunction with the full fi nancial statements and the notes presented in Appendix A
to the Proxy Statement for the 2010 Annual Meeting.
14008_text.indd 2314008_text.indd 23 11/7/2003 12:37:15 AM11/7/2003 12:37:15 AM

24 AMETEK 2009 ANNUAL REPORT
Selected Financial Data
(in millions, except per share amounts)
2009 2008 2007 2006 2005
Consolidated Operating Results (Year ended December 31):
Net sales $ 2,098.4 $ 2,531.1 $ 2,136.9 $ 1,819.3 $ 1,434.5
Operating income (1) $ 366.1 $ 432.7 $ 386.6 $ 309.0 $ 233.5
Interest expense $ (68.8) $ (63.7) $ (46.9) $ (42.2) $ (32.9)
Net income (1) $ 205.8 $ 247.0 $ 228.0 $ 181.9 $ 136.4
Diluted earnings per share (1) $ 1.91 $ 2.30 $ 2.12 $ 1.71 $ 1.29
Dividends declared and paid per share $ 0.24 $ 0.24 $ 0.24 $ 0.18 $ 0.16
Diluted weighted average common shares outstanding 107.9 107.4 107.6 106.6 105.6
Other Data:
Operating income - Return on sales (1) 17.4% 17.1% 18.1% 17.0% 16.3%
EBITDA (1) (2) $ 428.0 $ 489.4 $ 433.9 $ 351.4 $ 269.9
Ratio of EBITDA to interest expense (1) (2) 6.3x 7.7x 9.3x 8.3x 8.2x
Depreciation and amortization $ 65.5 $ 63.3 $ 52.7 $ 45.9 $ 39.4
Capital expenditures $ 33.1 $ 44.2 $ 37.6 $ 29.2 $ 23.3
Cash provided by operating activities $ 364.7 $ 247.3 $ 278.5 $ 226.0 $ 155.7
Free cash fl ow (3) $ 331.6 $ 203.1 $ 240.9 $ 196.8 $ 132.4
Ratio of earnings to fi xed charges 4.8x 6.1x 7.3x 6.6x 6.2x
Net income - Return on average total capital (1) (5) 8.2% 10.9% 12.0% 11.8% 10.7%
Net income - Return on average stockholders’ equity (1) (5) 14.4% 19.5% 20.7% 20.5% 18.5%
Consolidated Financial Position at December 31:
Current assets $ 969.4 $ 954.6 $ 952.2 $ 684.1 $ 556.3
Current liabilities $ 424.3 $ 447.5 $ 640.8 $ 480.9 $ 405.8
Property, plant, and equipment, net $ 310.1 $ 307.9 $ 293.1 $ 258.0 $ 228.5
Total assets $ 3,246.0 $ 3,055.5 $ 2,745.7 $ 2,130.9 $ 1,780.6
Long-term debt $ 955.9 $ 1,093.2 $ 667.0 $ 518.3 $ 475.3
Total debt $ 1,041.7 $ 1,111.7 $ 903.0 $ 681.9 $ 631.4
Stockholders’ equity (5) $ 1,567.0 $ 1,287.8 $ 1,240.7 $ 966.7 $ 809.5
Total debt as a percentage of capitalization (5) 39.9% 46.3% 42.1% 41.4% 43.8%
Net debt as a percentage of capitalization (4) (5) 33.7% 44.3% 37.1% 39.6% 42.4%
Stockholders’ equity per share (5) $ 14.53 $ 12.07 $ 11.56 $ 9.11 $ 7.66
14008_text.indd 2414008_text.indd 24 11/7/2003 12:37:15 AM11/7/2003 12:37:15 AM

25AMETEK 2009 ANNUAL REPORT
(1) Amounts for 2005 refl ect the retrospective application of Financial Accounting Standards Board (“FASB”) Accounting Standards Codifi cation (“ASC”)
Compensation–Stock Compensation Topic 718,(“ASC 718”) to expense stock options. The adoption of ASC 718 reduced operating income, net income
and diluted earnings per share by the following amounts:
(2) EBITDA represents income before interest, income taxes, depreciation and amortization. EBITDA is presented because the Company is aware that
it is used by rating agencies, securities analysts, investors and other parties in evaluating the Company. It should not be considered, however, as an
alternative to operating income as an indicator of the Company’s operating performance or as an alternative to cash fl ows as a measure of the Company’s
overall liquidity as presented in the Company’s fi nancial statements. Furthermore, EBITDA measures shown for the Company may not be comparable
to similarly titled measures used by other companies. The following table presents the reconciliation of net income reported in accordance with U.S.
generally accepted accounting principles (“GAAP”) to EBITDA:
(3) Free cash fl ow represents cash fl ow from operating activities less capital expenditures. Free cash fl ow is presented because the Company is aware that
it is used by rating agencies, securities analysts, investors and other parties in evaluating the Company. (Also see note 2 above). The following table
presents the reconciliation of cash fl ow from operating activities reported in accordance with U.S. GAAP to free cash fl ow:
(4) Net debt represents total debt minus cash and cash equivalents. Net debt is presented because the Company is aware that it is used by securities
analysts, investors and other parties in evaluating the Company. (Also see note 2 above). The following table presents the reconciliation of total debt
reported in accordance with U.S. GAAP to net debt:
(5) The adoption of certain provisions in FASB ASC Compensation–Retirement Benefi ts Topic 715, for our defi ned benefi t pension plans, which were
effective December 31, 2006, resulted in a reduction of $32.7 million to stockholders’ equity. The adoption of provisions in FASB ASC Income Taxes
Topic 740, as of January 1, 2007, resulted in a $5.9 million charge to the opening balance of stockholders’ equity.
(in millions, except per share amounts)
Reduction of amounts originally reported:
Impact of Adopting ASC 718 Operating Income Net Income Diluted Earnings Per Share
2005 $5.9 $4.3 $0.04
(in millions)
Year Ended December 31,
2009 2008 2007 2006 2005
Net income $ 205.8 $ 247.0 $ 228.0 $ 181.9 $ 136.4
Add (deduct):
Interest expense 68.8 63.7 46.9 42.2 32.9
Interest income (1.0) (3.9) (2.1) (0.4) (0.7)
Income taxes 88.9 119.3 108.4 81.8 61.9
Depreciation 42.2 45.8 42.3 38.9 35.0
Amortization 23.3 17.5 10.4 7.0 4.4
Total adjustments 222.2 242.4 205.9 169.5 133.5
EBITDA $ 428.0 $ 489.4 $ 433.9 $ 351.4 $ 269.9
(in millions)
December 31,
2009 2008 2007 2006 2005
Total debt $ 1,041.7 $ 1,111.7 $ 903.0 $ 681.9 $ 631.4
Less: Cash and cash equivalents (246.4) (87.0) (170.1) (49.1) (35.5)
Net debt 795.3 1,024.7 732.9 632.8 595.9
Stockholders’ equity 1,567.0 1,287.8 1,240.7 966.7 809.5
Capitalization (net debt plus stockholders’ equity) $ 2,362.3 $ 2,312.5 $ 1,973.6 $ 1,599.5 $ 1,405.4
Net debt as a percentage of capitalization 33.7% 44.3% 37.1% 39.6% 42.4%
(in millions)
Year Ended December 31,
2009 2008 2007 2006 2005
Cash provided by operating activities $ 364.7 $ 247.3 $ 278.5 $ 226.0 $ 155.7
Deduct: Capital expenditures (33.1) (44.2) (37.6) (29.2) (23.3)
Free cash fl ow $ 331.6 $ 203.1 $ 240.9 $ 196.8 $ 132.4
14008_text.indd 2514008_text.indd 25 11/7/2003 12:37:16 AM11/7/2003 12:37:16 AM
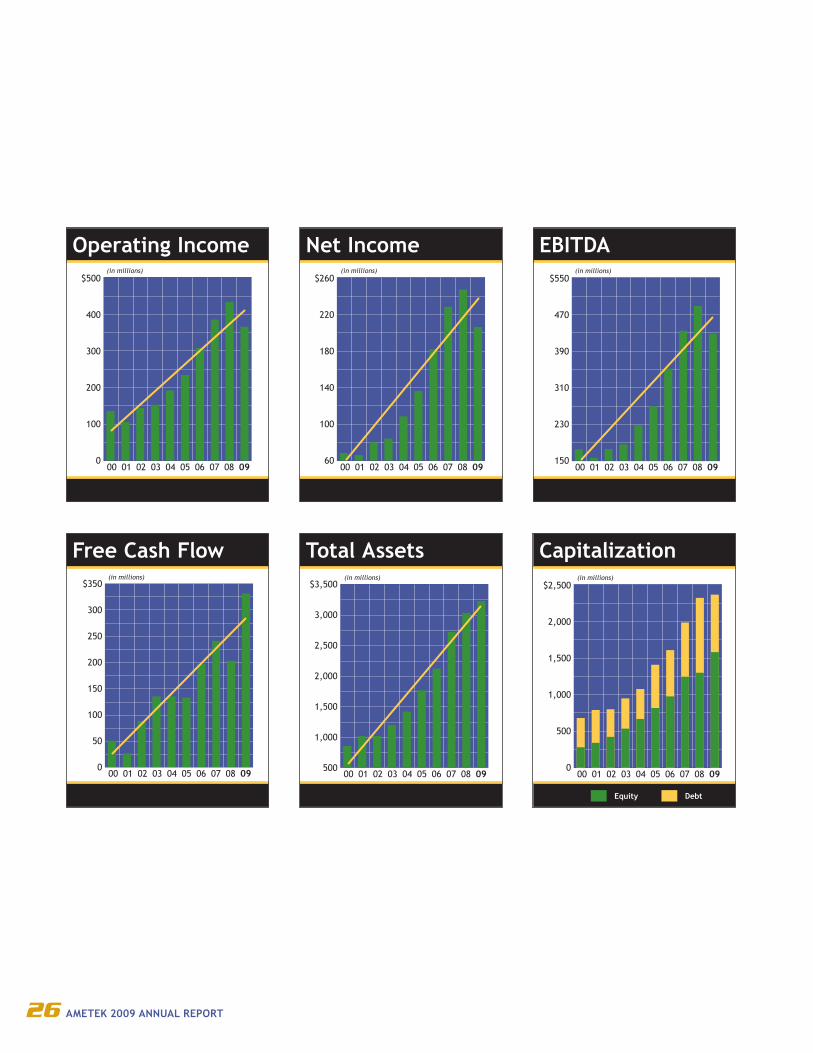
26 AMETEK 2009 ANNUAL REPORT
Net Income$260
220
180
140
100
6000 01 02 03 04 05 06 07 08 09
(in millions)
Total Assets$3,500
3,000
2,500
2,000
1,500
1,000
50000 01 02 03 04 05 06 07 08 09
(in millions)
EBITDA$550
470
390
310
230
15000 01 02 03 04 05 06 07 08 09
(in millions)
Operating Income$500
400
300
200
100
000 01 02 03 04 05 06 07 08 09
(in millions)
Free Cash Flow$350
300
250
200
150
100
50
000 01 02 03 04 05 06 07 08 09
(in millions)
Capitalization$2,500
2,000
1,500
1,000
500
000 01 02 03 04 05 06 07 08 09
Debt Equity
(in millions)
14008_text.indd 2614008_text.indd 26 11/7/2003 1:00:48 AM11/7/2003 1:00:48 AM

27AMETEK 2009 ANNUAL REPORT
Directors & Offi cers of the Company
Tiziano M. BarniVice President and Managing Director, AMETEK Italia and AMETEK Elektromotory
Preben CarøeVice President, Measurement and Calibration Technologies
Tony J. CiampittiVice President, Power Systems and Instruments
Matthew J. ColeVice President, Advanced Measurement Technology
Timothy F. CroalVice President, Programmable Power
Peter C. de JongVice President, Operations, Electromechanical Group, Reynosa
Neil J. DesmondVice President, Instrumentation and Specialty Controls
Alan H. DevenishVice President, Materials Analysis
Matthew C. FrenchVice President, Technical and Industrial Products
Allan ImrieVice President, Precision Instruments–Europe
Lim Meng KeeVice President, Asia
Charles E. LohwasserVice President, Thermal Management Systems, Aerospace and Defense
Richard A. MadambaVice President, Maintenance, Repair and Overhaul, Aerospace and Defense
Thomas C. MarecicVice President, Process and Analytical Instruments
H. Ian McGaviskVice President, Engineered Materials, Interconnects and Packaging
Patrick J. McGeehanVice President, Specialty Metal Products
Gregory MyersVice President, HCC Industries
Denise M. SchierVice President, Floorcare and Specialty Motors
Roger A. SmithVice President, Sales and Marketing, Floorcare and Specialty Motors
James E. VisnicVice President, Chemical Products
Bruce P. WilsonVice President, Ultra Precision Technologies
Operating Offi cers
Sheldon S. GordonChairman of Union Bancaire Privée International Holdings, Inc.
Frank S. HermanceChairman and Chief Executive Offi cer
Charles D. KleinA Managing Director of American Securities LLC and an Executive Offi cer of several affi liated entities
Steven W. KohlhagenRetired Financial Executive
James R. MaloneFounder and Managing Partner, Qorval LLC
David P. SteinmannA Managing Director of American Securities Management L.P.
Elizabeth R. VaretPrivate Investor; a Managing Director of American Securities Management L.P.
Dennis K. WilliamsRetired Executive
Board of Directors Corporate Executive Offi ceFrank S. HermanceChairman and Chief Executive Offi cer
John J. MolinelliExecutive Vice President–Chief Financial Offi cer
John Wesley HardinPresident, Electronic Instruments
Timothy N. JonesPresident, Electromechanical Group
David A. ZapicoPresident, Electronic Instruments
William D. EgintonSenior Vice President, Corporate Development
Robert S. FeitSenior Vice President and General Counsel
Robert R. Mandos, Jr.Senior Vice President and Comptroller
William J. BurkeVice President, Investor Relations, and Treasurer
Donald W. CarlsonVice President, Strategic Procurement
Thomas A. DeeneyVice President, Corporate Compliance and Auditing
Corporate Offi cersDavid A. FrankVice President, Taxation
Elaine M. GormanVice President, Shared Services
William P. LawsonVice President and Chief Information Offi cer
14008_text.indd 2714008_text.indd 27 11/7/2003 12:37:17 AM11/7/2003 12:37:17 AM

28 AMETEK 2009 ANNUAL REPORT
Shareholder Information
Corporate Offi ceAMETEK, Inc.
37 North Valley Road, Building 4
Paoli, PA 19301-0801
610-647-2121 or 800-473-1286
The Corporate Offi ce is located in
suburban Philadelphia.
Investor CommunicationsInvestors seeking the Form 10-K
and additional information about the
Company may call or write to Inves-
tor Relations at the Corporate Offi ce.
AMETEK earnings announcements,
press releases, SEC fi lings, and other
investor information are available at
Investors on AMETEK’s Web site:
www.ametek.com.
Annual MeetingWednesday, April 28, 2010, 3 p.m.
The New York Helmsley Hotel
Turtle Bay Meeting Room
212 East 42nd Street
New York, NY 10017
All shareholders are invited to
attend.
Stock Exchange ListingNew York Stock Exchange
Symbol: AME
Shareholder ServicesAmerican Stock Transfer & Trust Co.
59 Maiden Lane
New York, NY 10038
Attn: Shareholder Services
718-921-8124 or 800-937-5449
www.amstock.com
AMETEK’s transfer agent responds
to inquiries regarding dividend pay-
ments, direct deposit of dividends,
stock transfers, address changes,
and replacement of lost dividend
payments and lost stock certifi cates.
Independent Registered Public Accounting FirmErnst & Young LLP
Philadelphia, Pennsylvania
Corporate CounselStroock & Stroock & Lavan LLP
New York, New York
AMETEK is an equal opportunity employer.
14008_text.indd 2814008_text.indd 28 11/7/2003 12:37:17 AM11/7/2003 12:37:17 AM

14008_insidecovers.indd 214008_insidecovers.indd 2 11/2/2003 9:41:44 AM11/2/2003 9:41:44 AM

14008_Cover.indd 214008_Cover.indd 2 11/5/2003 3:33:25 AM11/5/2003 3:33:25 AM


![WORKORDER:[ WO #14008 (ALT#:2007-5946) (CL#:) ] Overview … · 2020-07-29 · 1581540092741397.JPG WORKORDER:[ WO #14008 (ALT#:2007-5946) (CL#:) ] Pressure wash clean front lower](https://static.documents.pub/doc/80x56/5f88e4c27741b158a219326d/workorder-wo-14008-alt2007-5946-cl-overview-2020-07-29-workorder.jpg)


