t 303.561.3333 | f 303.561.3339 | 45 West 2nd Avenue, Denver, Colorado 80223 | www.jansenstrawn.com
FINAL DRAINAGE REPORT
FALLBROOK FILING NO. 3 Thornton, CO
May 6, 2016
JN: 14053
Prepared for:
Carlson Associates CalAtlantic Homes PO Box 247 6161 S. Syracuse Way, Suite 200 Eastlake, CO 80614 Greenwood Village, CO 80111 P: 303.457.2966 P: 303.486.5000
Prepared by:
Jansen Strawn Consulting Engineers 45 W. 2nd Avenue Denver, CO 80223 P: 303.561.3333 F: 303.561.3339
Thomas C. Jansen, PE No. 35942
Principal
Fallbrook Filing No. 3 February 15, 2016 Page 2
t 303.561.3333 | f 303.561.3339 | 45 West 2nd Avenue, Denver, Colorado 80223 | www.jansenstrawn.com
CERTIFICATION I hereby affirm that this report and plan for the Fallbrook Filing No. 3 Subdivision was
prepared by me, or under my direct supervision, for the owners thereof, in accordance with
the provisions of the City of Thornton Standards and Specifications for the Design and
Construction of Public and Private Improvements for the Responsible Parties thereof. I
understand that the City of Thornton does not and will not assume liability for drainage
facilities designed by others.
Thomas C. Jansen, PE Date
State of Colorado Registration No. 35942
For and on behalf of Jansen Strawn
Consulting Engineers, Inc.
Fallbrook Filing No. 3 February 15, 2016 Page 3
t 303.561.3333 | f 303.561.3339 | 45 West 2nd Avenue, Denver, Colorado 80223 | www.jansenstrawn.com
T A B L E O F C O N T E N T S
I. GENERAL LOCATION AND DESCRIPTION .............................................................................................. 4
II. DRAINAGE BASINS AND SUB‐BASINS .................................................................................................... 5
III. DRAINAGE FACILITY DESIGN ................................................................................................................. 6
IV. STORMWATER MANAGEMENT FACILITY DESIGN ................................................................................. 8
V. CONCLUSION ....................................................................................................................................... 11
VI. REFERENCES ........................................................................................................................................ 11
A P P E N D I C E S
APPENDIX A – Basin Hydrology
% Impervious Calculations
“C” Values Calculations
SF2 & SF3 Rational Method Calculations
APPENDIX B ‐ Hydraulics
Detention Pond Analysis
Street Capacity Calculations
Inlet Calculations
Storm Sewer Design
APPENDIX C – Reference Materials
Effective FEMA Map Panels
NRCS Soil Information
APPENDIX D ‐ Maps
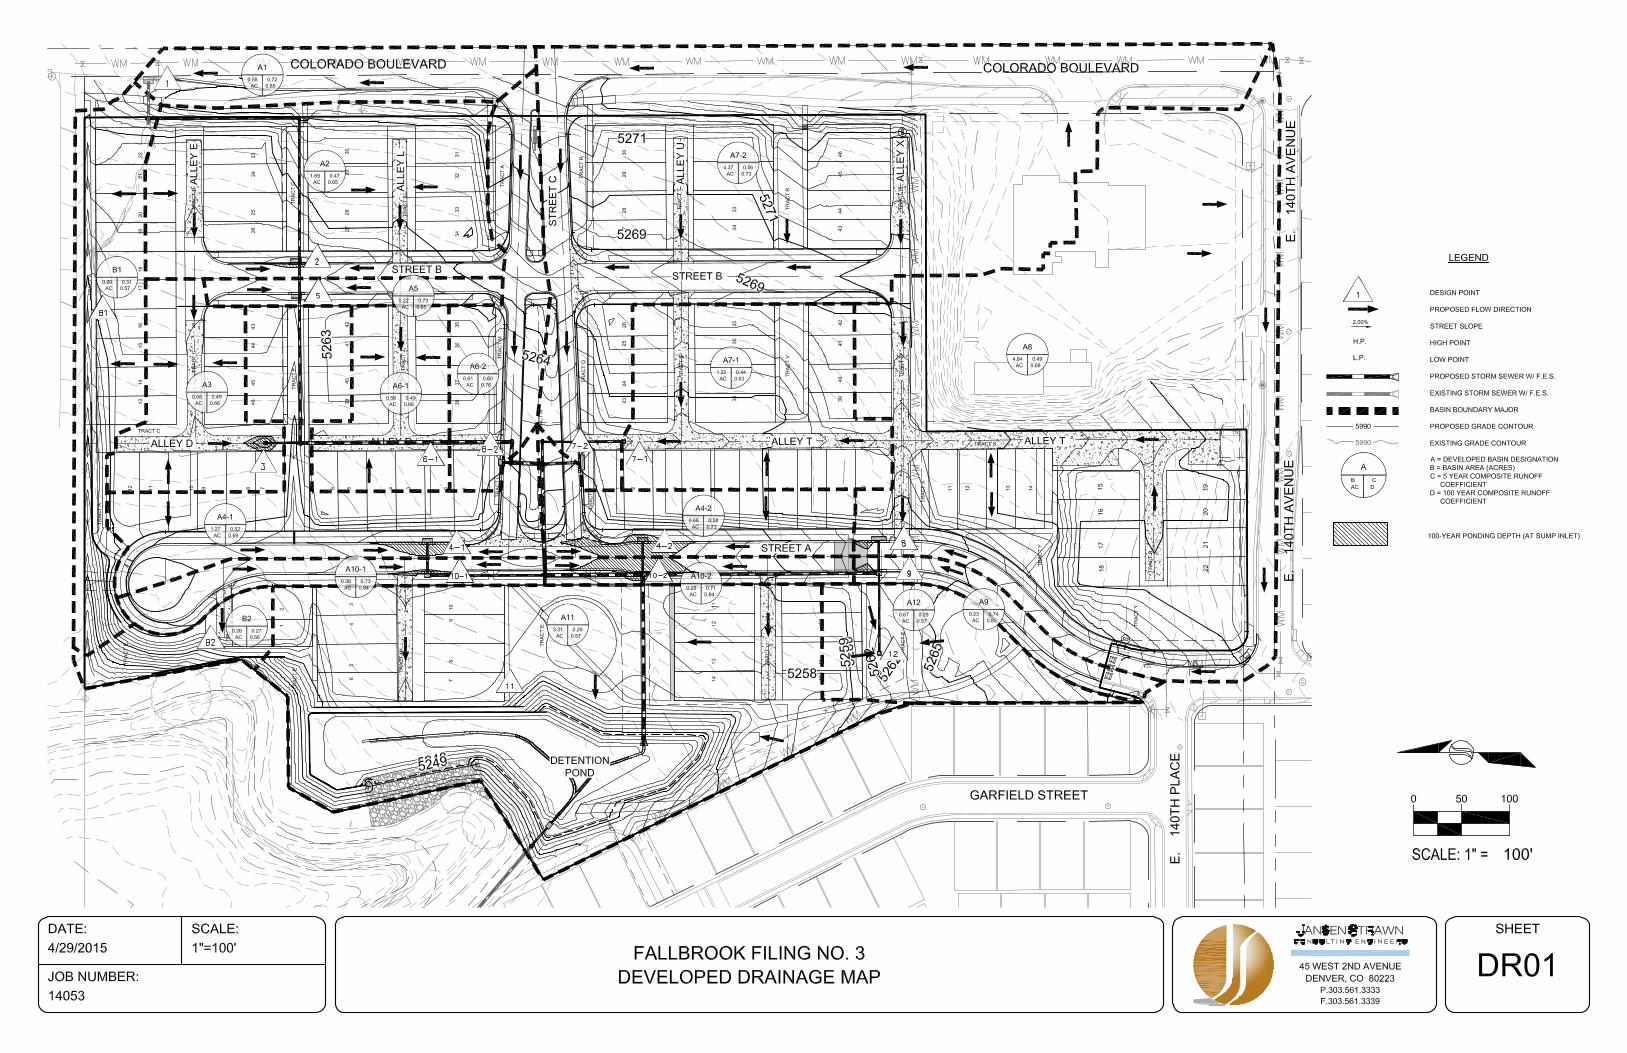
Historic Basin Map
Developed Basin Map
Fallbrook Filing No. 3 February 15, 2016 Page 4
t 303.561.3333 | f 303.561.3339 | 45 West 2nd Avenue, Denver, Colorado 80223 | www.jansenstrawn.com
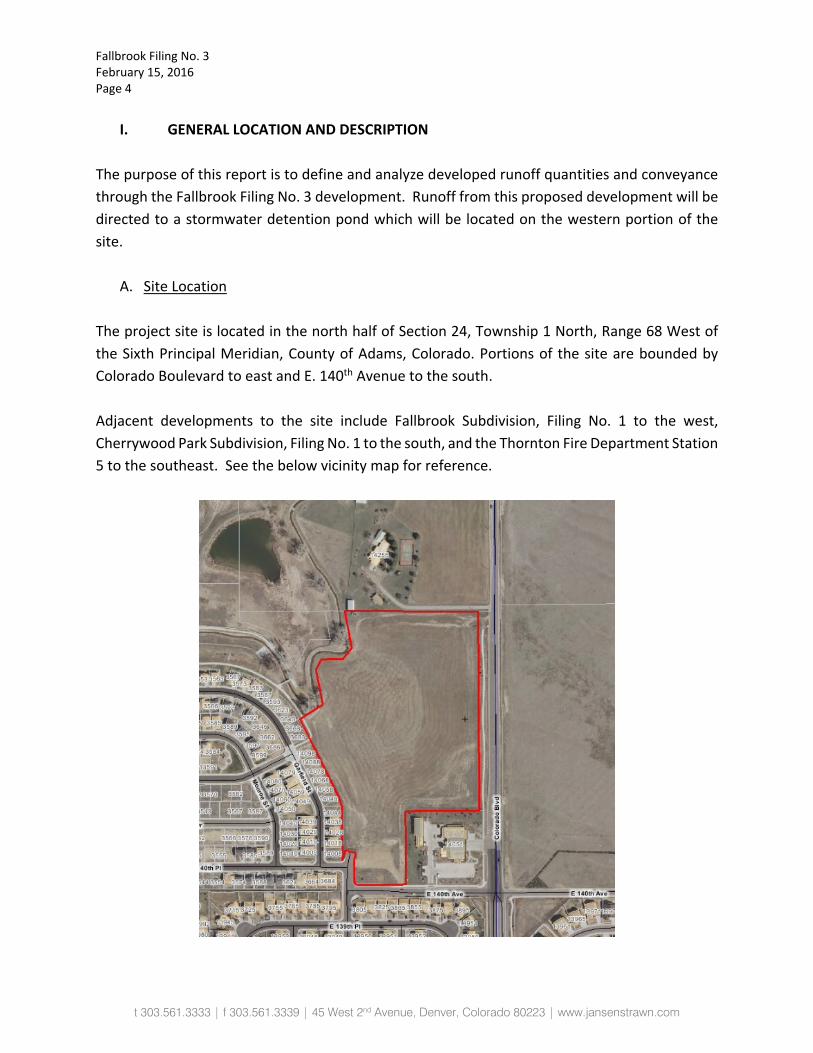
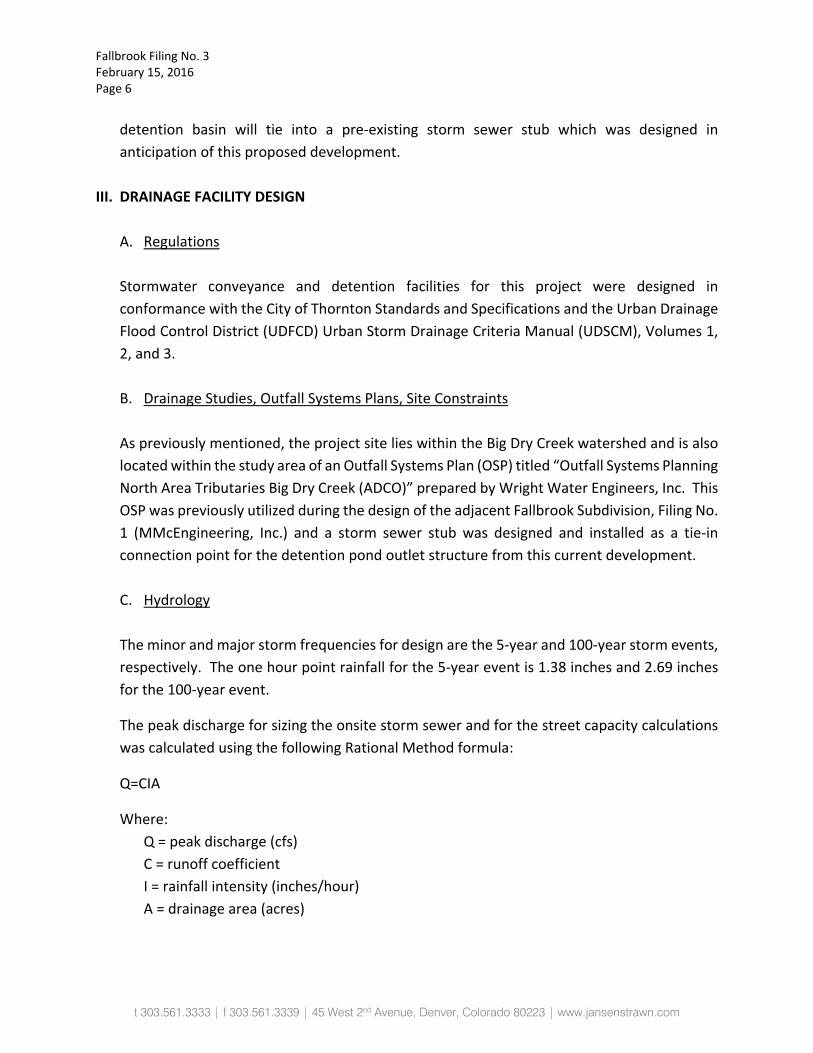
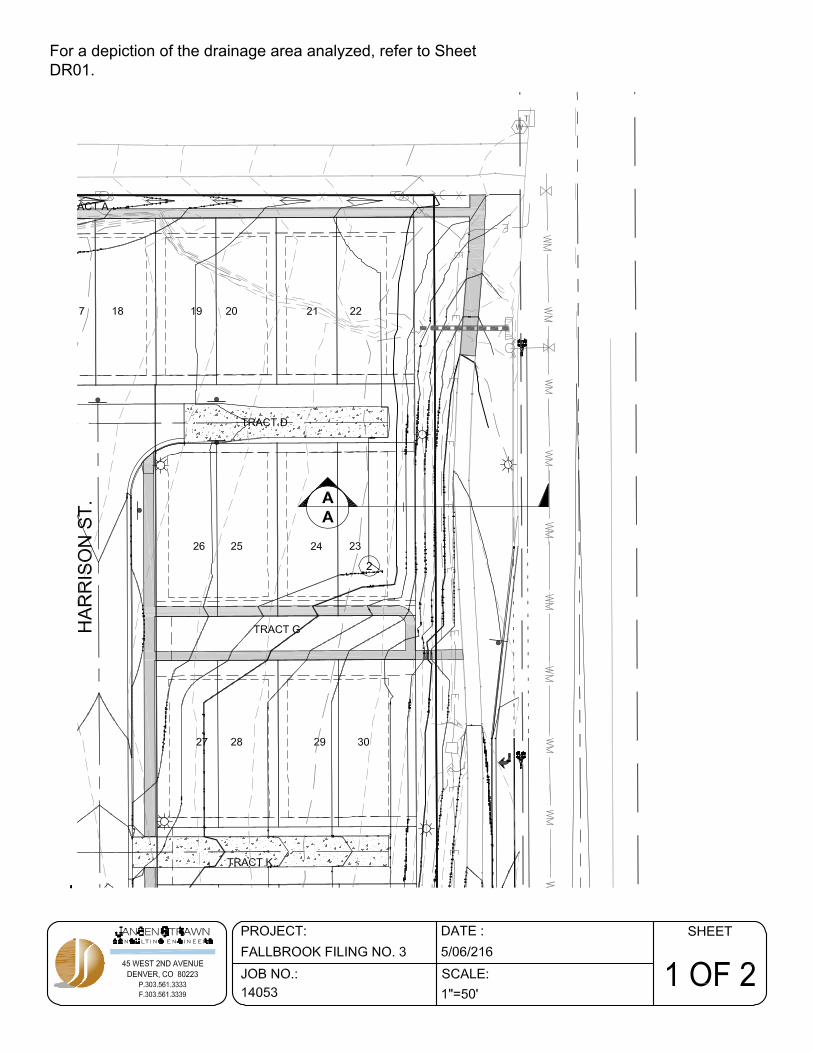
I. GENERAL LOCATION AND DESCRIPTION The purpose of this report is to define and analyze developed runoff quantities and conveyance through the Fallbrook Filing No. 3 development. Runoff from this proposed development will be directed to a stormwater detention pond which will be located on the western portion of the site.
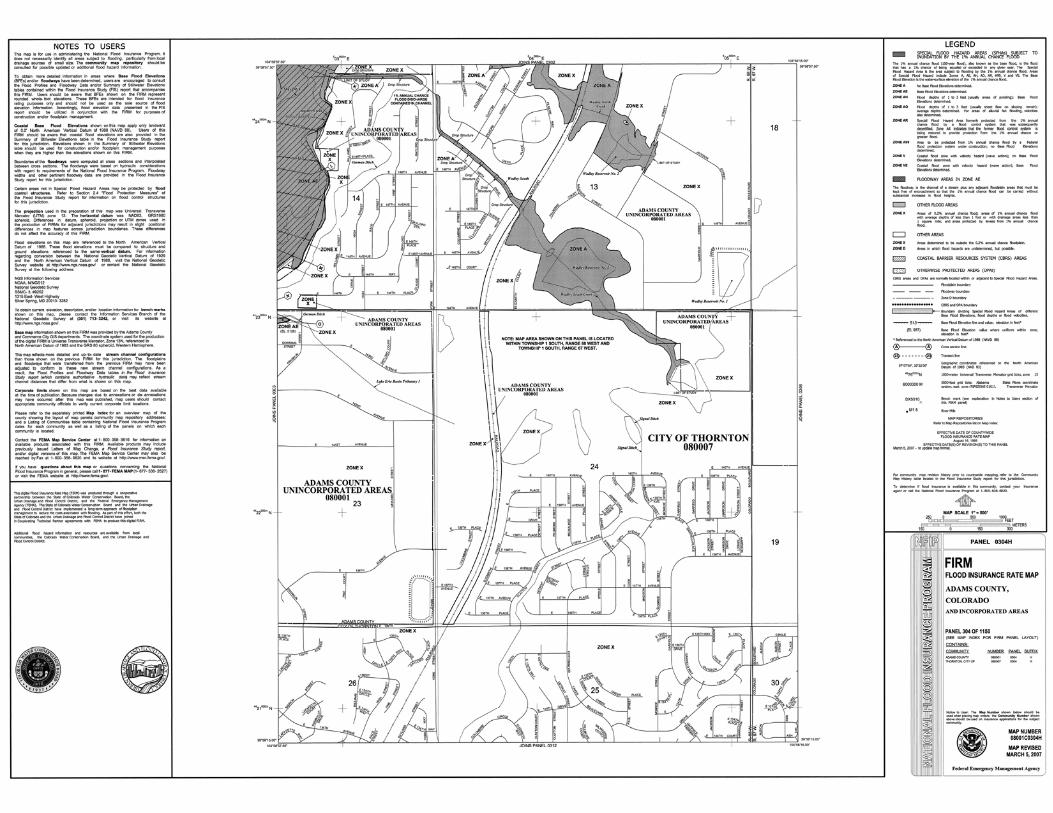
A. Site Location The project site is located in the north half of Section 24, Township 1 North, Range 68 West of the Sixth Principal Meridian, County of Adams, Colorado. Portions of the site are bounded by Colorado Boulevard to east and E. 140th Avenue to the south. Adjacent developments to the site include Fallbrook Subdivision, Filing No. 1 to the west, Cherrywood Park Subdivision, Filing No. 1 to the south, and the Thornton Fire Department Station 5 to the southeast. See the below vicinity map for reference.
Fallbrook Filing No. 3 February 15, 2016 Page 5
t 303.561.3333 | f 303.561.3339 | 45 West 2nd Avenue, Denver, Colorado 80223 | www.jansenstrawn.com
There are no major drainageways/floodplains, wetlands or irrigation ditches located on the site,
although Signal Ditch (irrigation ditch) does pass by just outside the property boundary to the
northwest.
B. Description of Property
The Fallbrook Filing No. 3 was platted as Tract K of Fallbrook Filing No. 1 for 140th and Colorado,
LLC.
II. DRAINAGE BASINS AND SUB‐BASINS
A. Major Drainage Basins
The project site lies within the Big Dry Creek watershed and is also located within the study
area of an Outfall Systems Plan (OSP) titled “Outfall Systems Planning North Area Tributaries
Big Dry Creek (ADCO)” prepared by Wright Water Engineers, Inc. This OSP was previously
utilized during the design of the adjacent Fallbrook Subdivision, Filing No. 1
(MMcEngineering, Inc.) and a storm sewer stub was designed and installed as a tie‐in
connection point for the detention pond outlet structure from this current development.
As mentioned previously, there are no FEMA floodplains on the site. According to the Flood
Insurance Rate Map 08001C0304H, the entire site is within Zone X, which is an area that is
determined to be outside of the 500‐year floodplain. Refer to Appendix C for the appropriate
Flood Insurance Rate Map panel.
The USCS Soil Survey indicates that the site is underlain by soils which are part of the
hydrologic soil group C. Hydrologic soil group C soils are identified as soils having a slow
infiltration rate when thoroughly wetted and consisting mostly of soils with a layer that
impedes downward movement of water or soils with moderately‐fine to fine texture. Refer
to Appendix C for an excerpt from the NRCS Soils Report for the site.
B. Sub‐Basin Description
The site, which lies within the Big Dry Creek watershed, will drain to the proposed detention
pond located on the western portion of the site. The outlet structure for the proposed
Fallbrook Filing No. 3 February 15, 2016 Page 6
t 303.561.3333 | f 303.561.3339 | 45 West 2nd Avenue, Denver, Colorado 80223 | www.jansenstrawn.com
detention basin will tie into a pre‐existing storm sewer stub which was designed in
anticipation of this proposed development.
III. DRAINAGE FACILITY DESIGN
A. Regulations
Stormwater conveyance and detention facilities for this project were designed in
conformance with the City of Thornton Standards and Specifications and the Urban Drainage
Flood Control District (UDFCD) Urban Storm Drainage Criteria Manual (UDSCM), Volumes 1,
2, and 3.
B. Drainage Studies, Outfall Systems Plans, Site Constraints
As previously mentioned, the project site lies within the Big Dry Creek watershed and is also
located within the study area of an Outfall Systems Plan (OSP) titled “Outfall Systems Planning
North Area Tributaries Big Dry Creek (ADCO)” prepared by Wright Water Engineers, Inc. This
OSP was previously utilized during the design of the adjacent Fallbrook Subdivision, Filing No.
1 (MMcEngineering, Inc.) and a storm sewer stub was designed and installed as a tie‐in
connection point for the detention pond outlet structure from this current development.
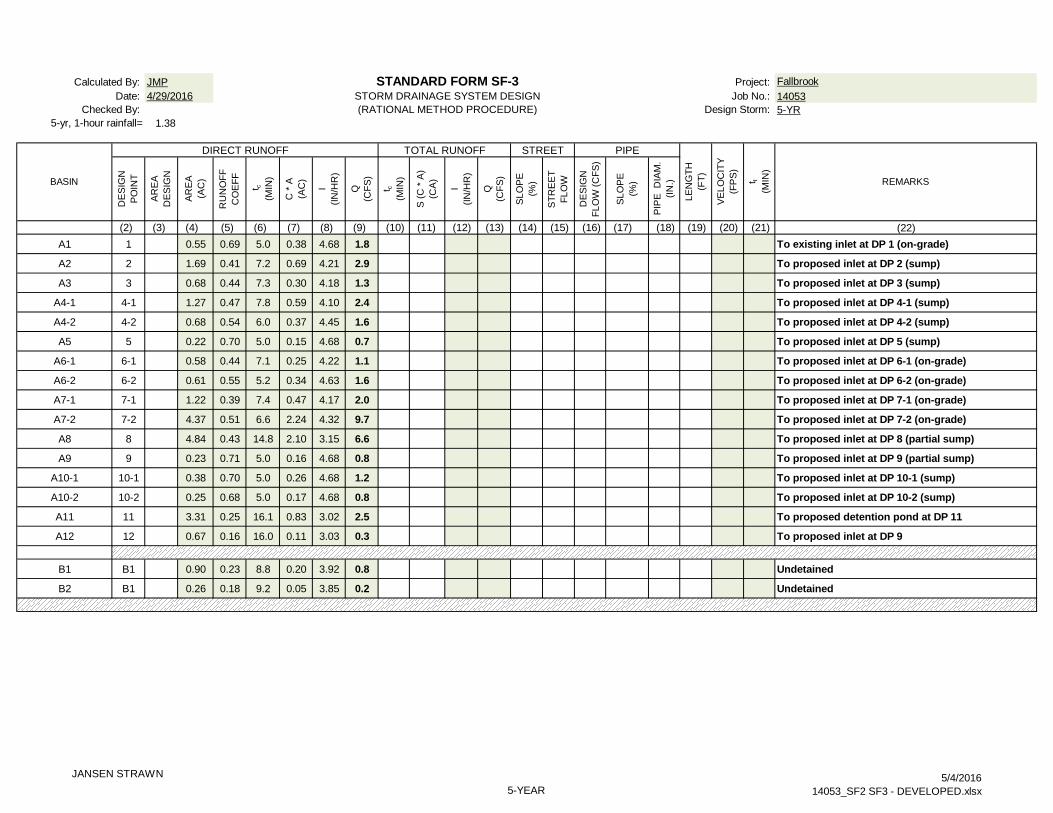
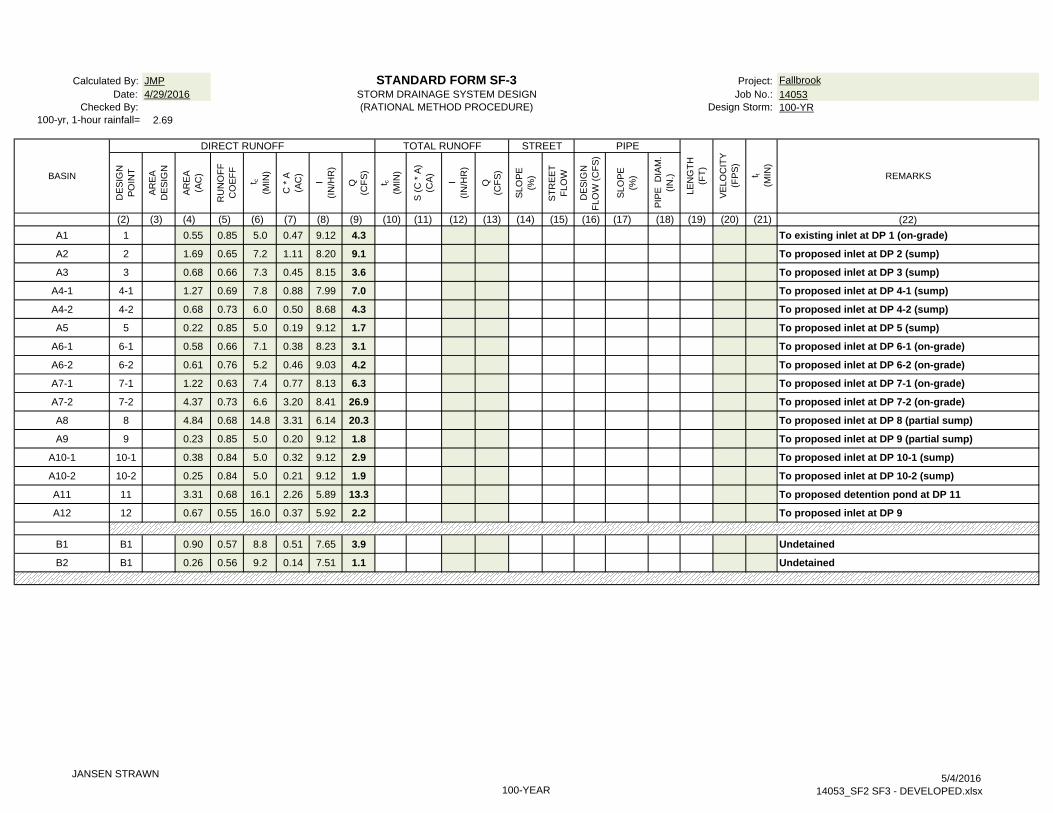
C. Hydrology
The minor and major storm frequencies for design are the 5‐year and 100‐year storm events,
respectively. The one hour point rainfall for the 5‐year event is 1.38 inches and 2.69 inches
for the 100‐year event.
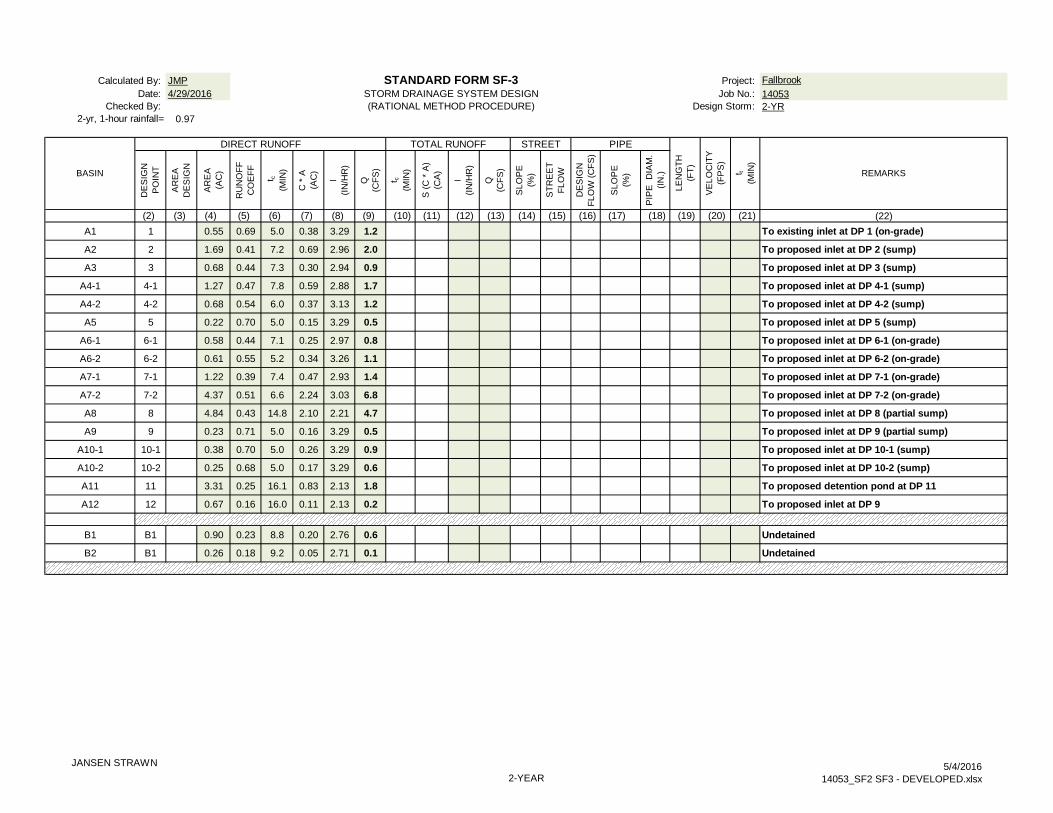
The peak discharge for sizing the onsite storm sewer and for the street capacity calculations
was calculated using the following Rational Method formula:
Q=CIA
Where:
Q = peak discharge (cfs)
C = runoff coefficient
I = rainfall intensity (inches/hour)
A = drainage area (acres)
Fallbrook Filing No. 3 February 15, 2016 Page 7
t 303.561.3333 | f 303.561.3339 | 45 West 2nd Avenue, Denver, Colorado 80223 | www.jansenstrawn.com
See Appendix A for Rational Method flow calculations. The UDFCD SF‐3 form was used to
determine peak flows at respective design points.
D. Hydraulics
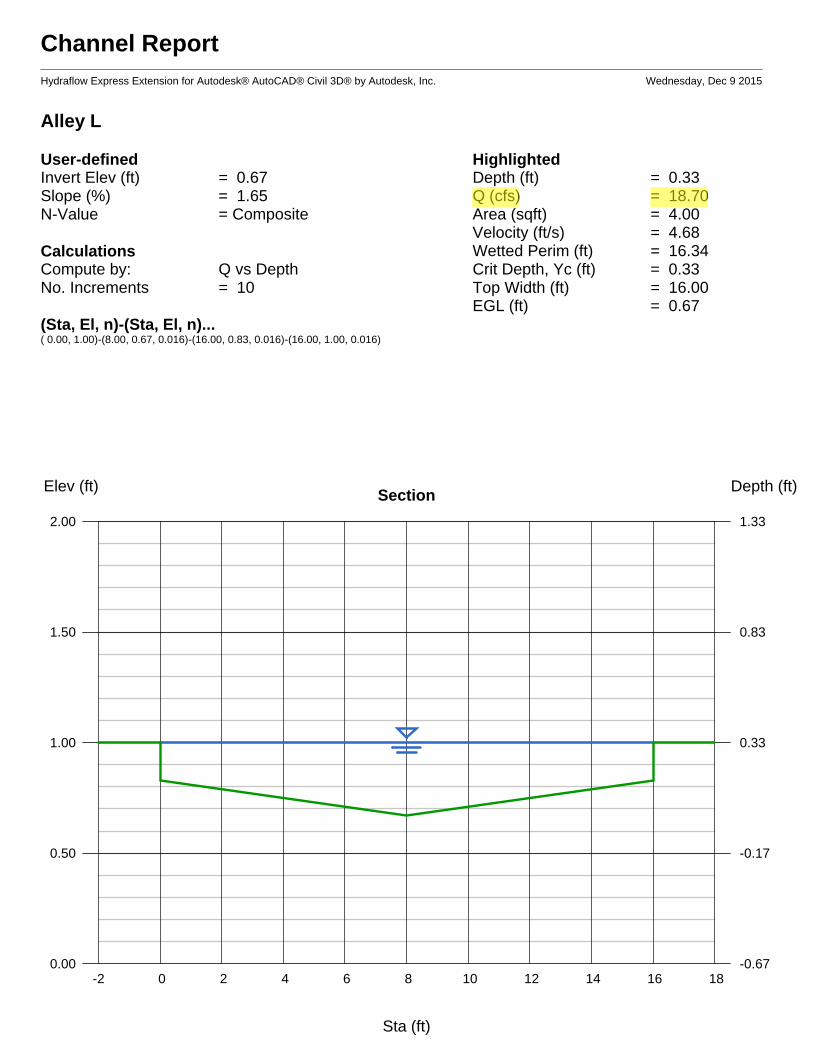
Street and alleys for the proposed development have been designed in accordance with City
of Thornton Standards. Street and alley capacity calculations for the proposed development
are provided in Appendix B of this report.
Inlets have been designed throughout the site to capture runoff from the streets before
maximum allowable street and alley capacities are exceeded and at sump locations. Inlet
calculations have been prepared for the site using the Urban Drainage and Flood Control
District UD‐Inlet_V2.03.xls spreadsheet. Inlet capture calculations are provided in Appendix
B of this report.
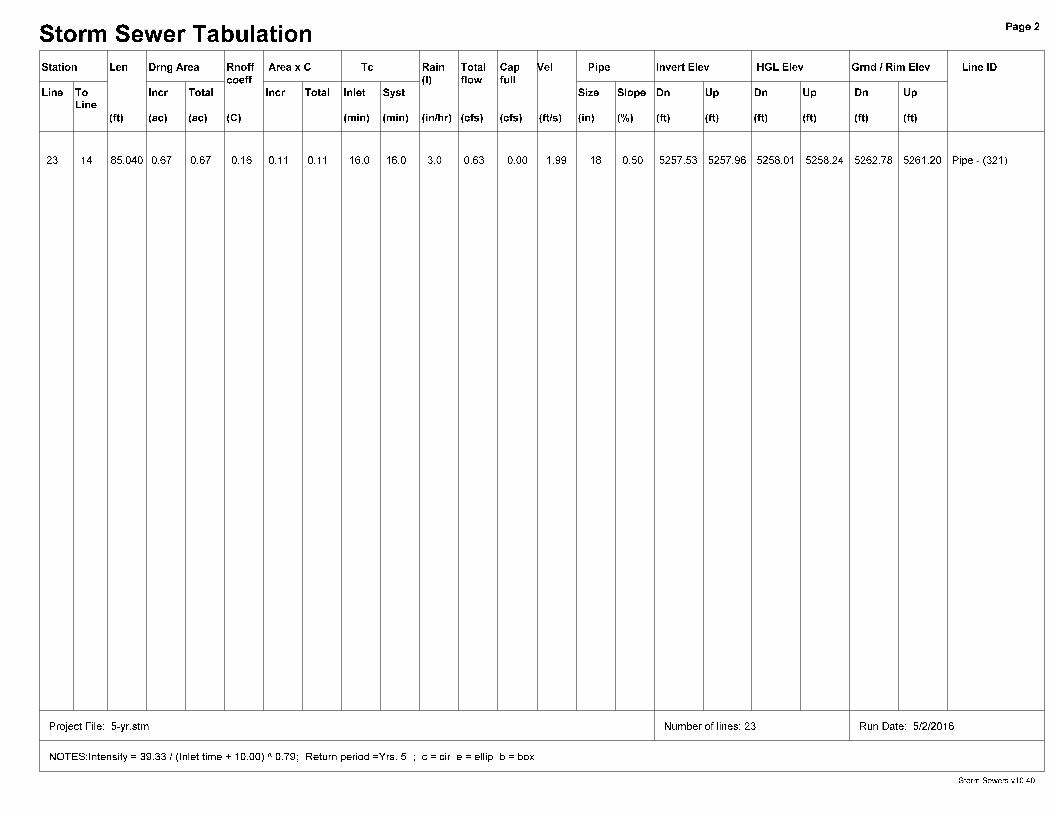
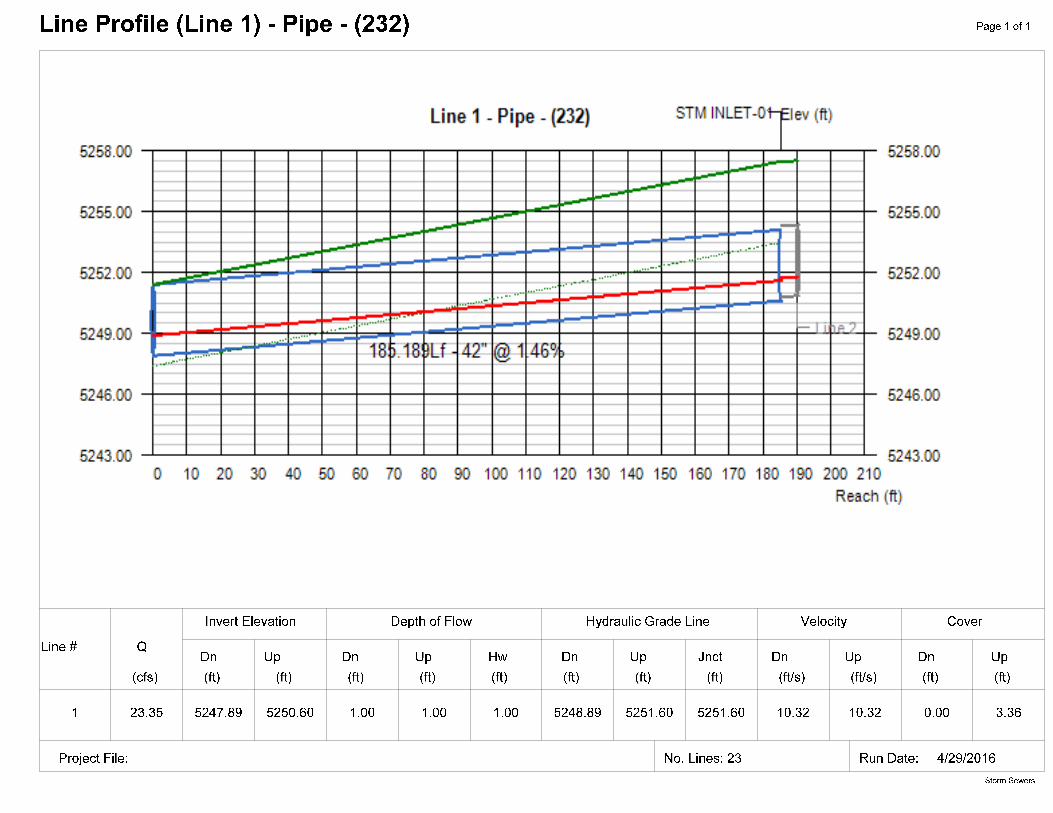
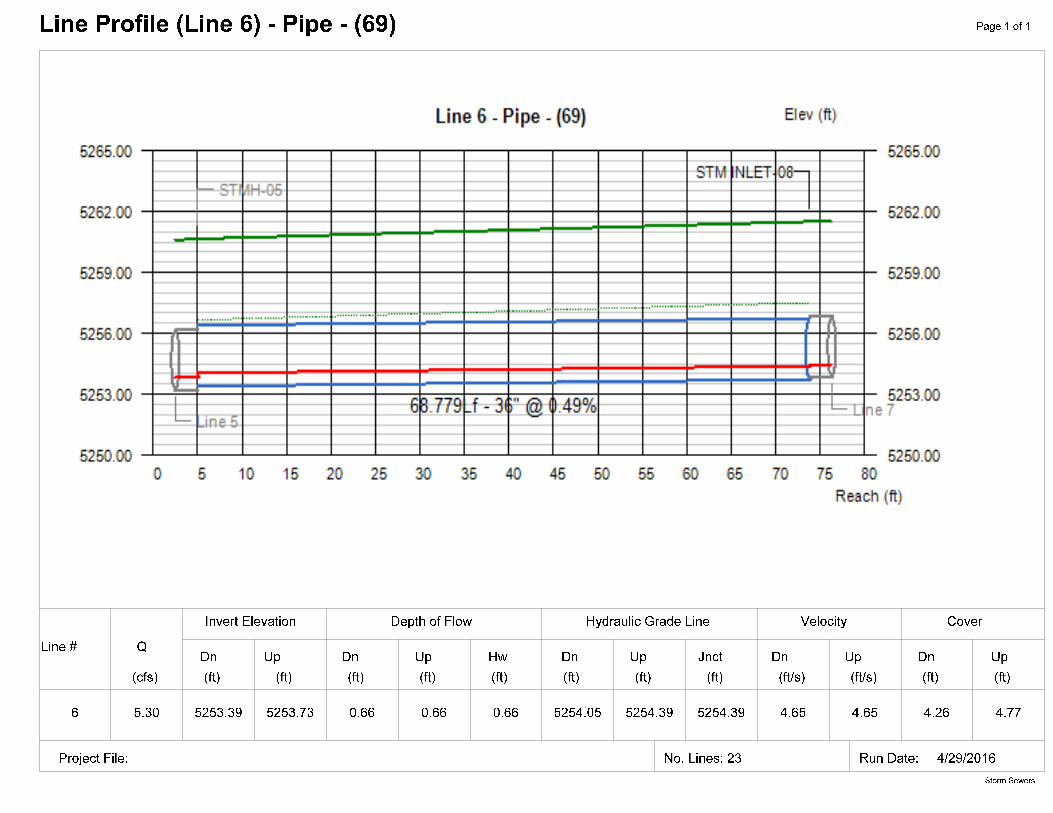
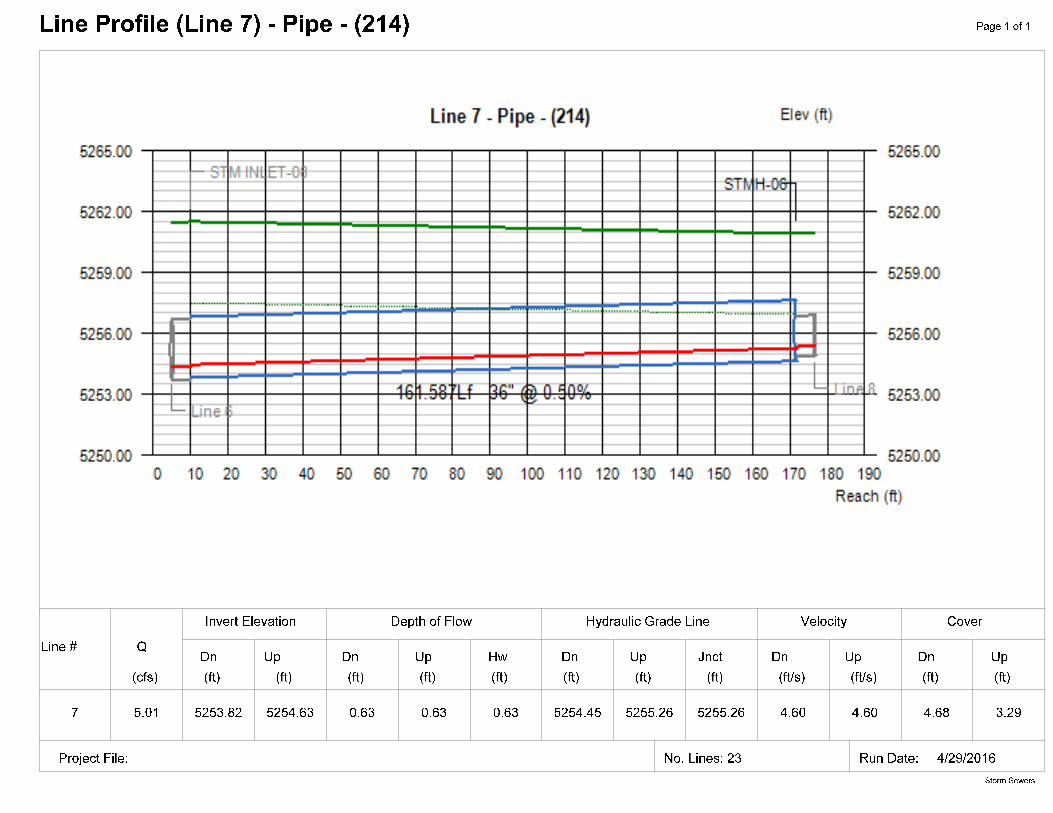
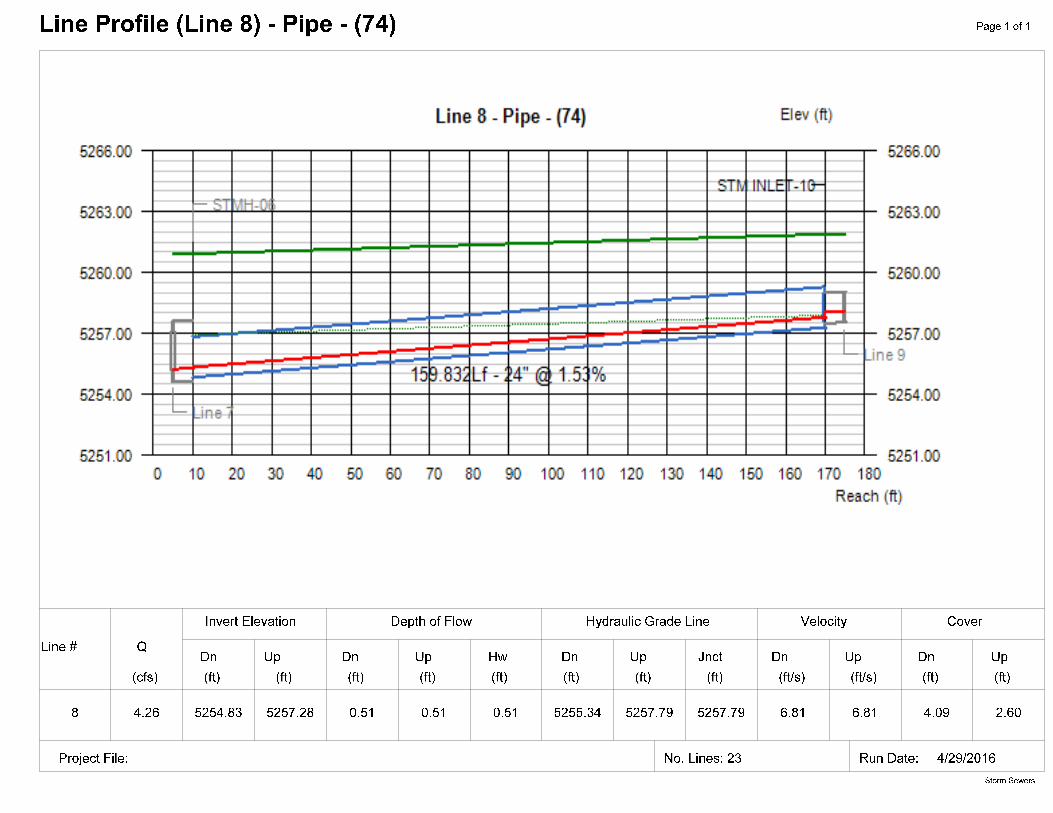
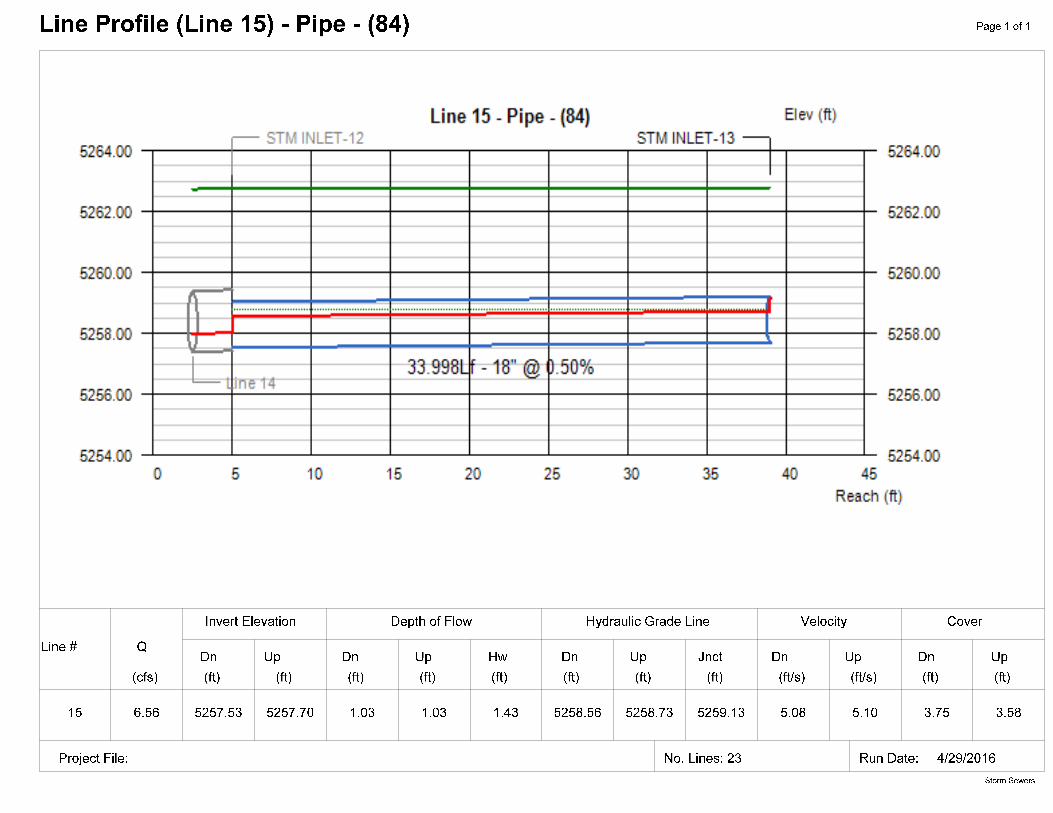
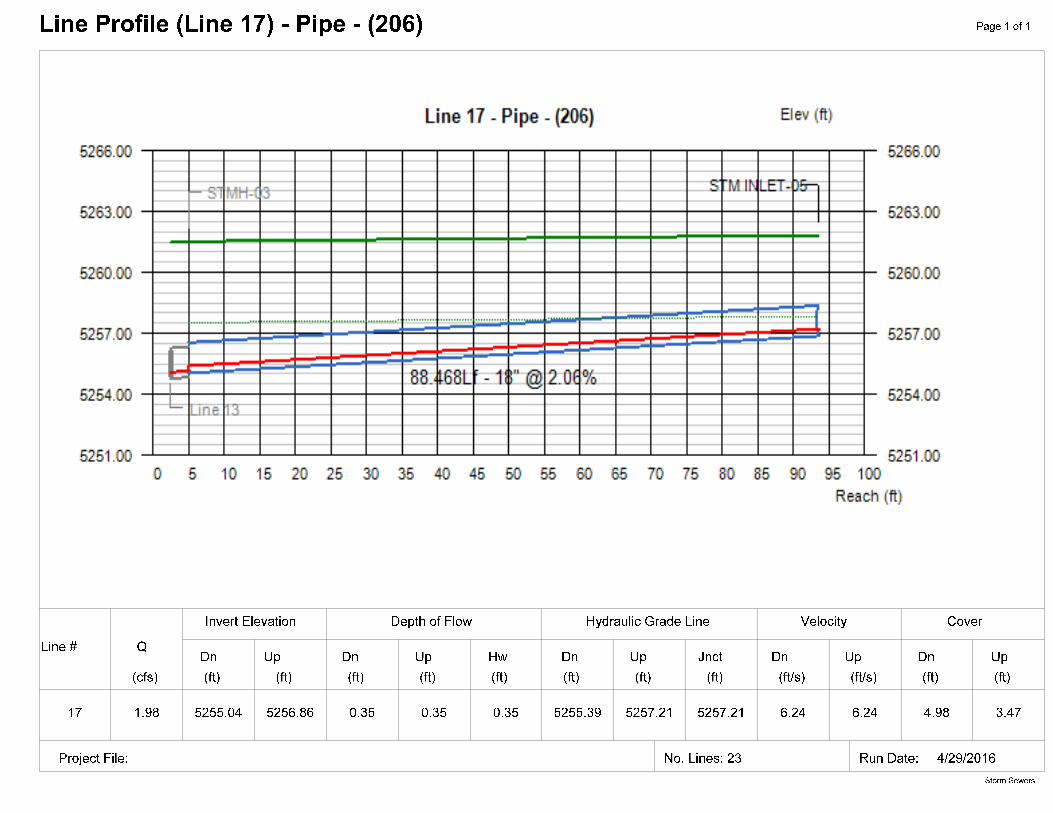
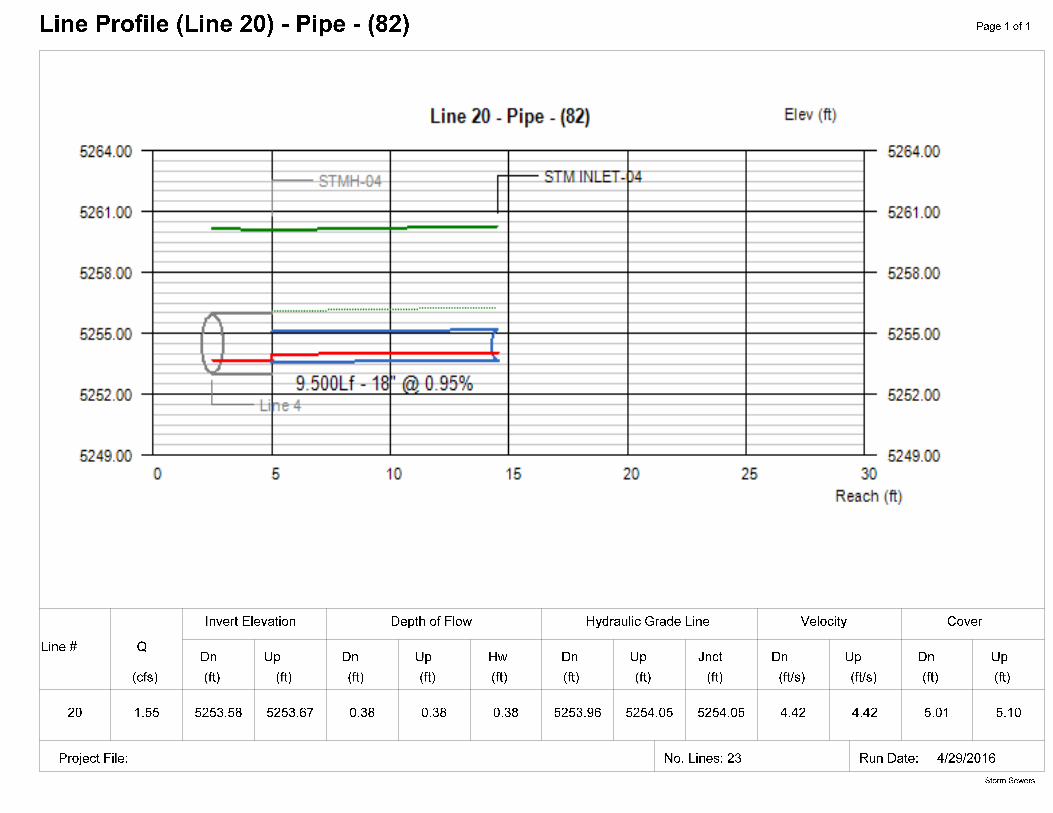
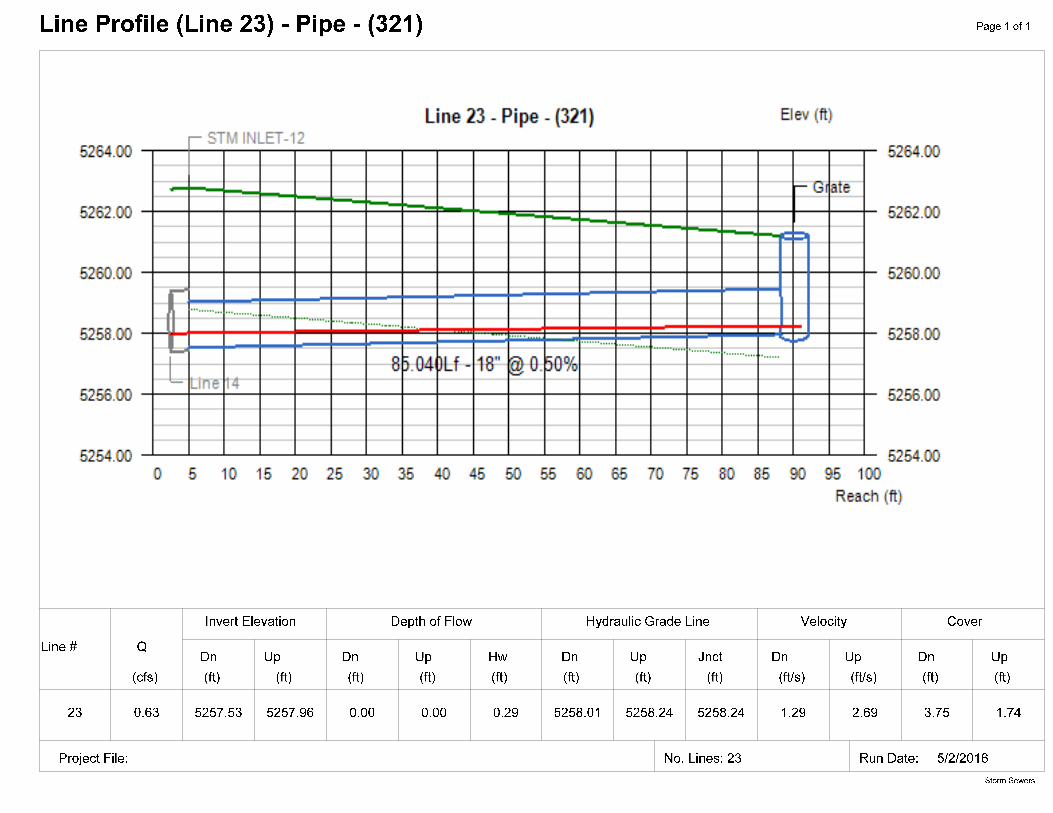
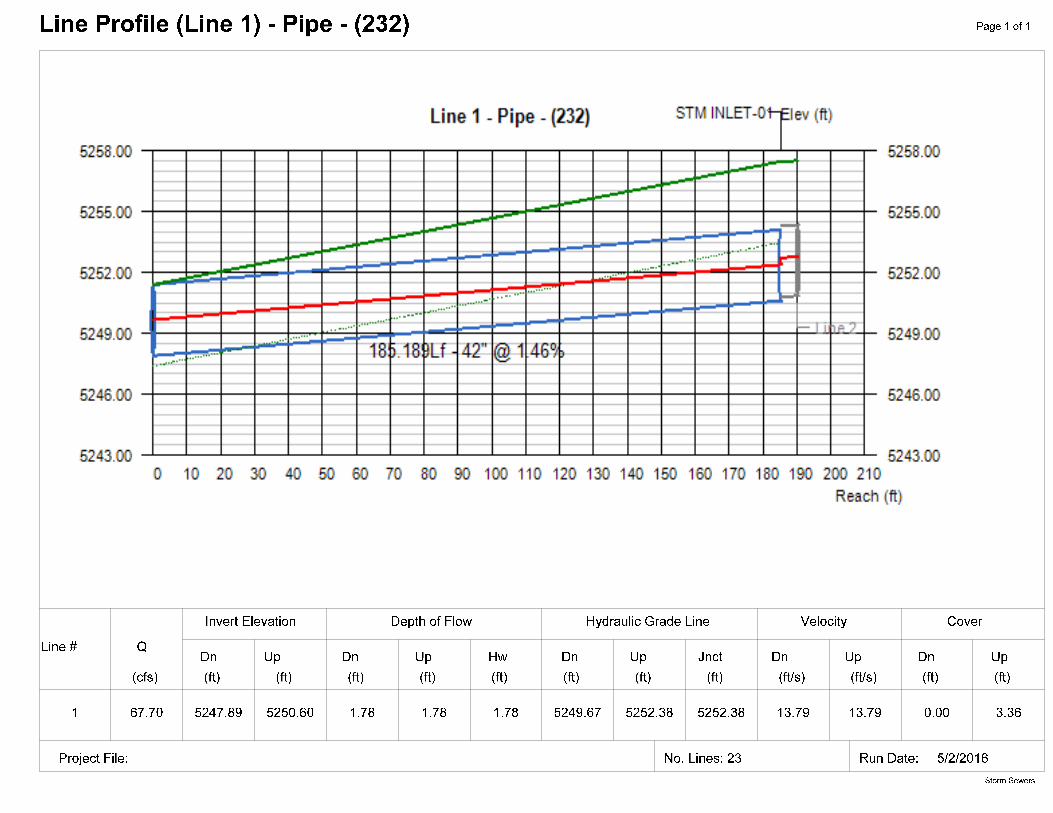
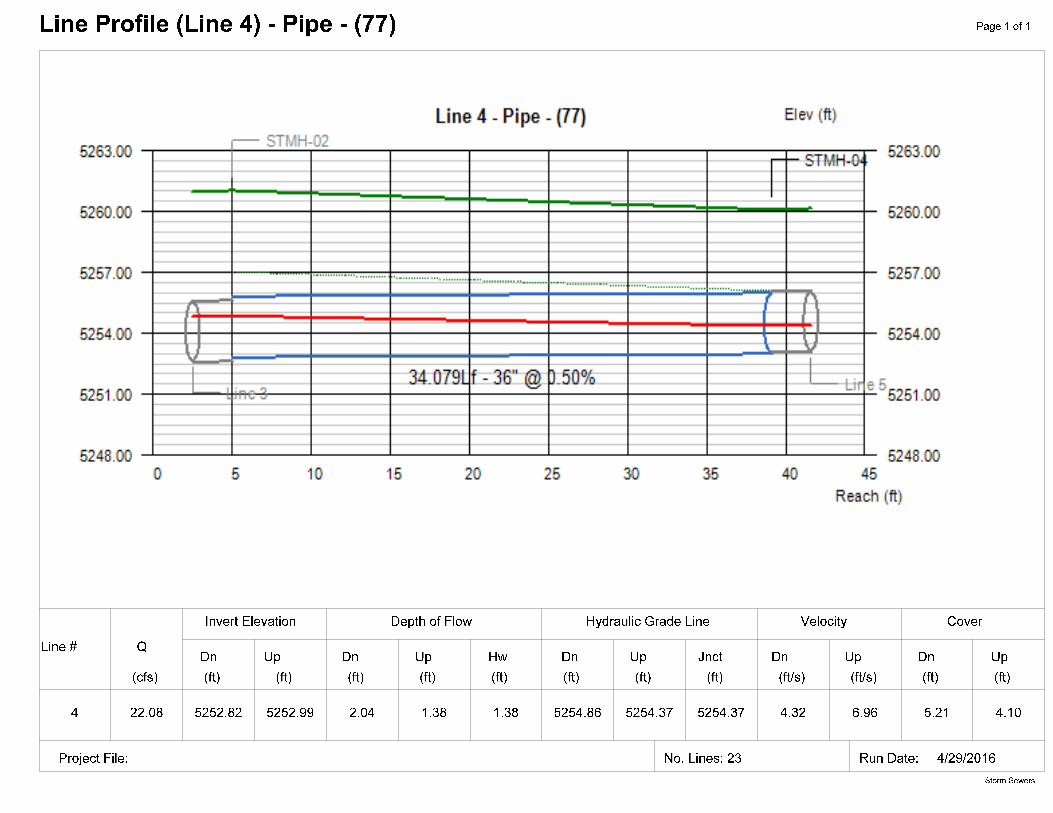
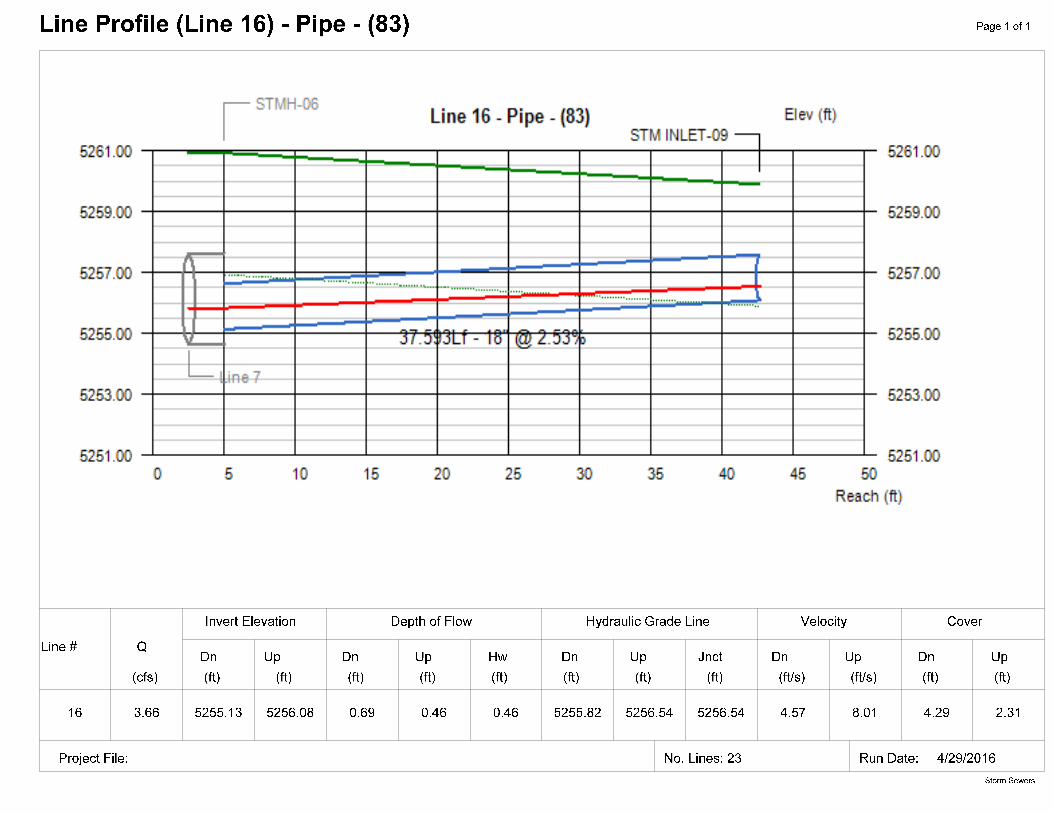
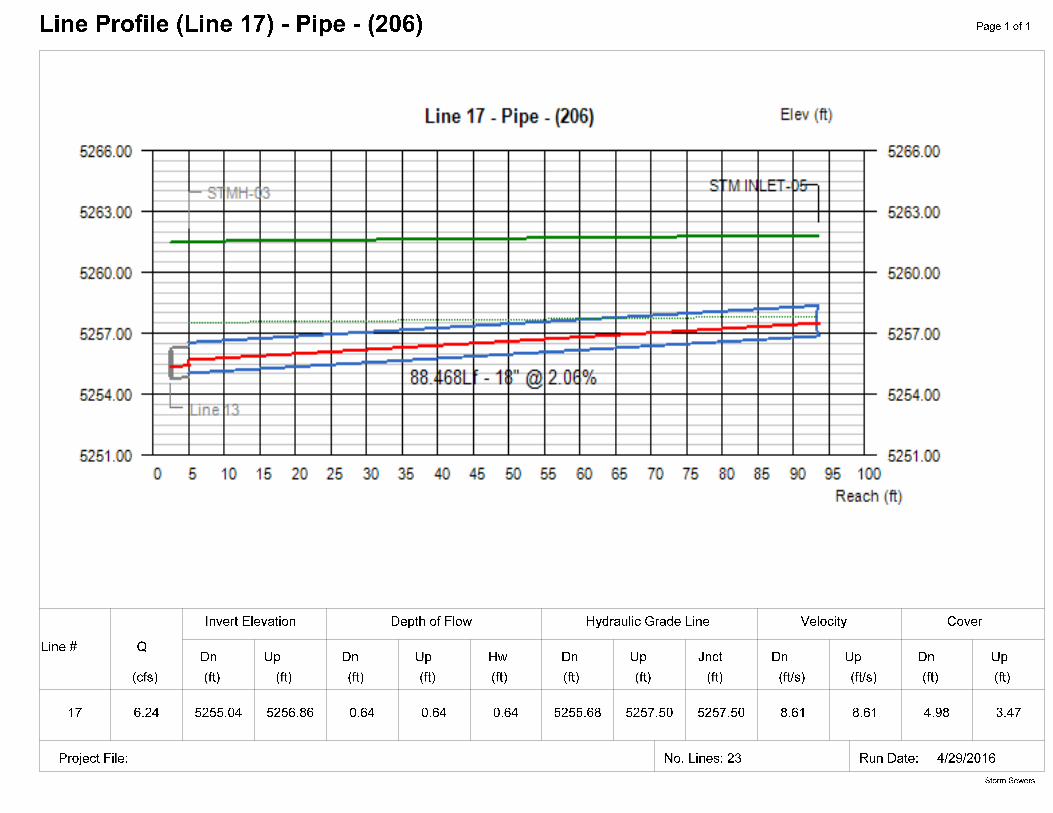
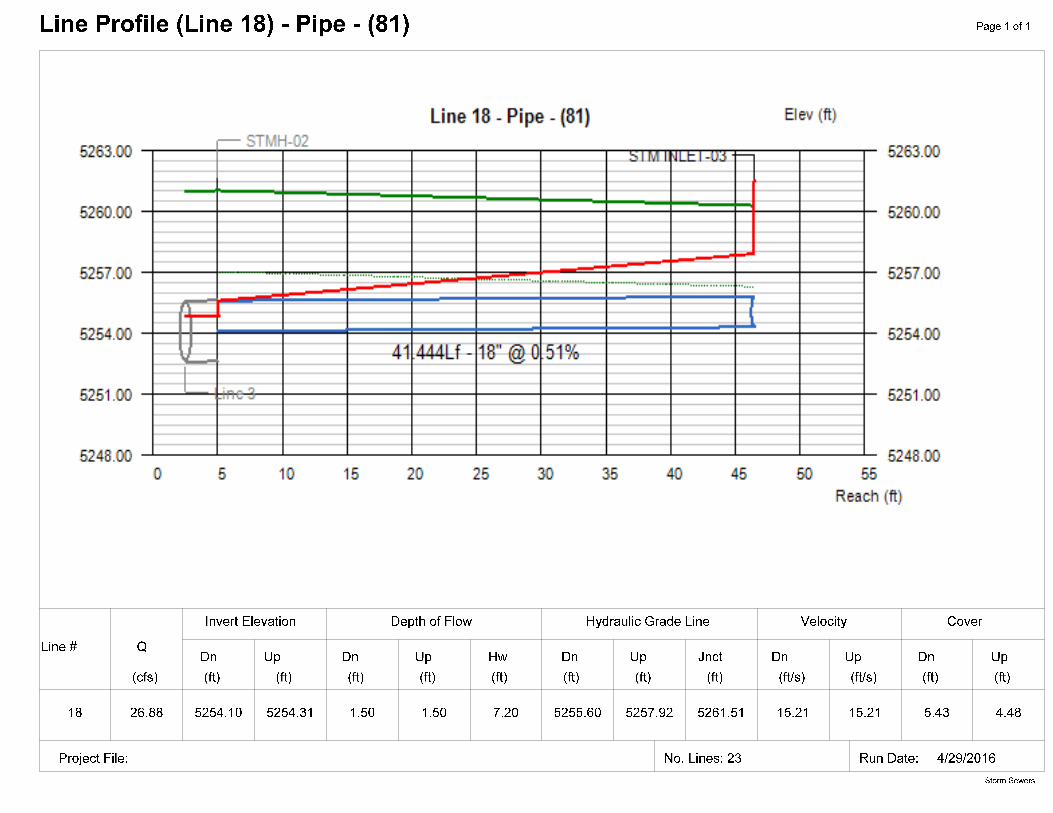
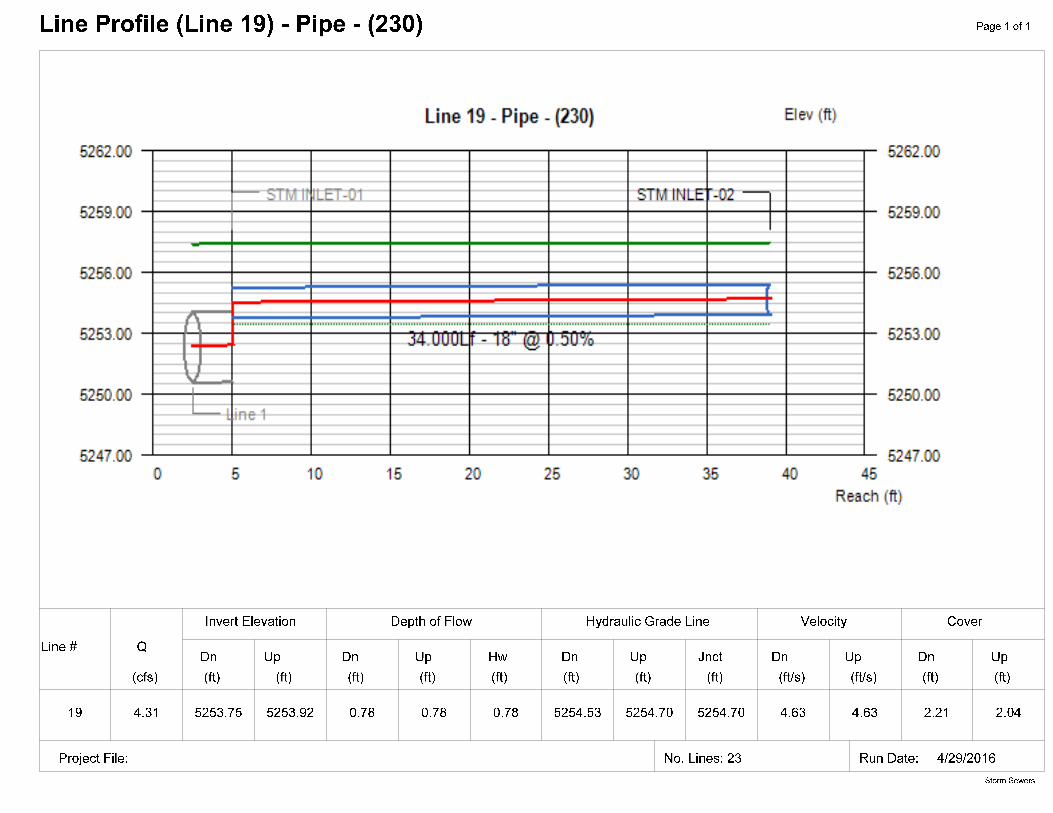
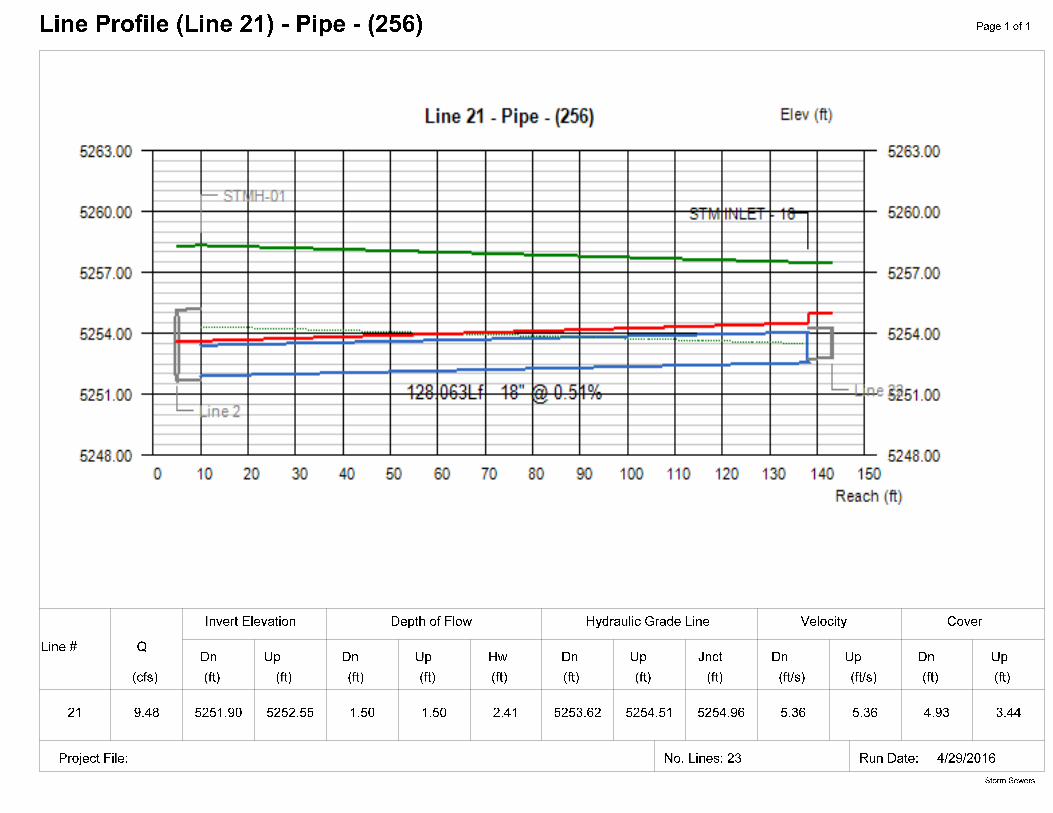
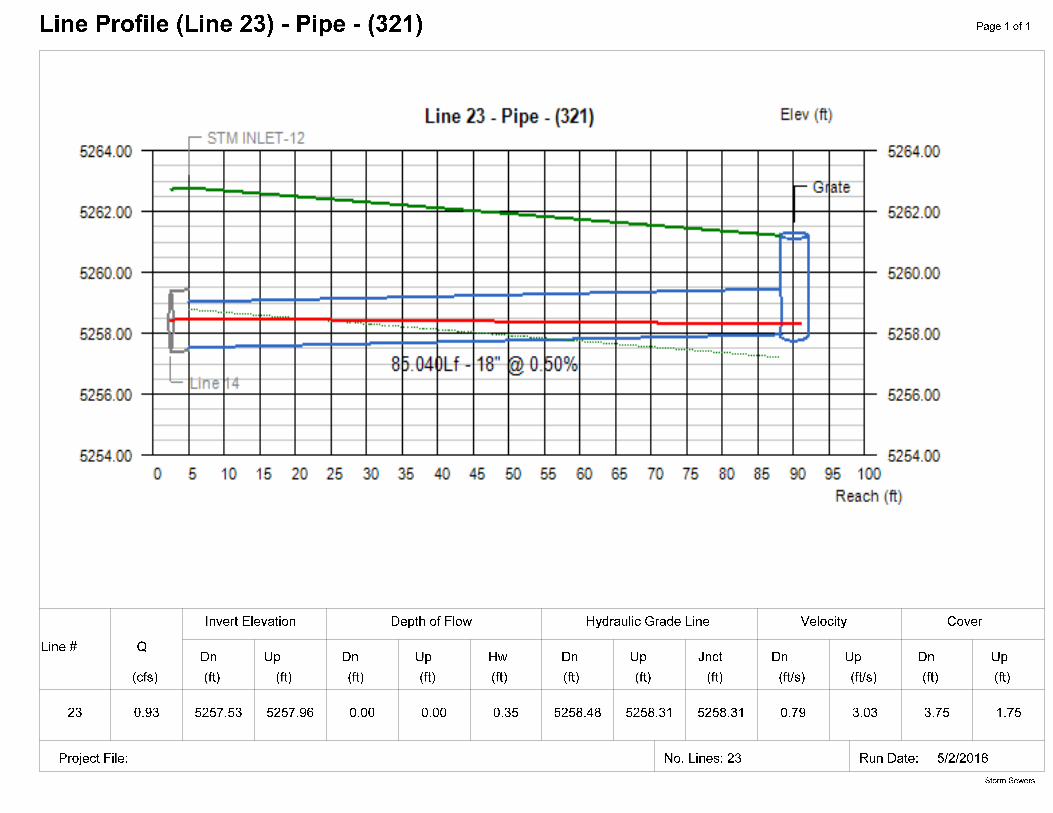
Proposed storm sewers have been designed in accordance with the City of Thornton
Standards. Hydraflow Storm Sewers extension for Autodesk AutoCAD Civil 3D was utilized to
perform hydraulic computations on the proposed storm sewer, including the calculation of
hydraulic grade lines. Hydraflow Storm Sewers output for the proposed storm sewer,
including profiles with hydraulic grade lines, is included in Appendix B.
Riprap for the pipe outlet into the proposed detention pond was sized and designed in
t 303.561.3333 | f 303.561.3339 | 45 West 2nd Avenue, Denver, Colorado 80223 | www.jansenstrawn.com
APPENDIX B – Hydraulics
Detention Pond Analysis
Street Capacity Calculations
Inlet Calculations
Storm Sewer Design
Project:Basin ID:
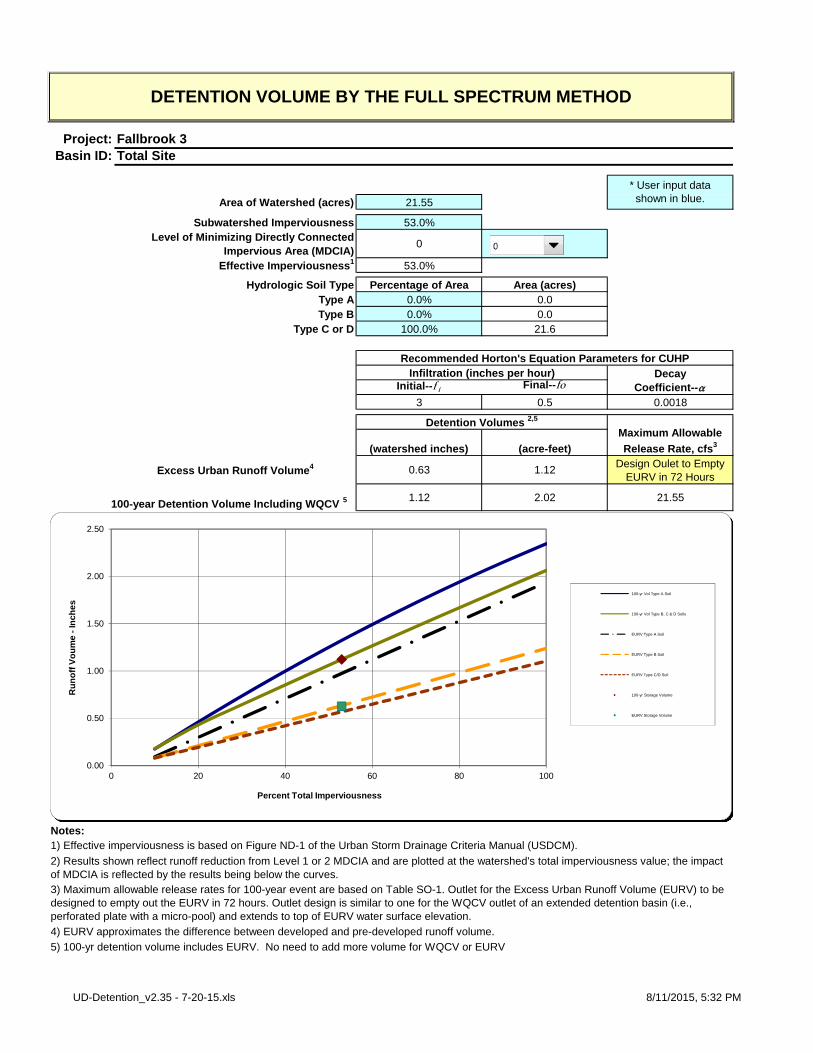
21.55
53.0%
0
53.0%
Percentage of Area Area (acres)0.0% 0.00.0% 0.0
100.0% 21.6
Initial--f i Final--fo
3 0.5 0.0018
(watershed inches) (acre-feet)
0.63 1.12Design Oulet to Empty
EURV in 72 Hours
100-year Detention Volume Including WQCV 5 1.12 2.02 21.55
Notes:
Hydrologic Soil TypeType AType B
Excess Urban Runoff Volume4
Infiltration (inches per hour)
Maximum Allowable
Release Rate, cfs3
4) EURV approximates the difference between developed and pre-developed runoff volume.
5) 100-yr detention volume includes EURV. No need to add more volume for WQCV or EURV
Detention Volumes 2,5
DETENTION VOLUME BY THE FULL SPECTRUM METHOD
Fallbrook 3Total Site
1) Effective imperviousness is based on Figure ND-1 of the Urban Storm Drainage Criteria Manual (USDCM).
Area of Watershed (acres)
Subwatershed ImperviousnessLevel of Minimizing Directly Connected
Impervious Area (MDCIA)
* User input data shown in blue.
2) Results shown reflect runoff reduction from Level 1 or 2 MDCIA and are plotted at the watershed's total imperviousness value; the impact of MDCIA is reflected by the results being below the curves.3) Maximum allowable release rates for 100-year event are based on Table SO-1. Outlet for the Excess Urban Runoff Volume (EURV) to be designed to empty out the EURV in 72 hours. Outlet design is similar to one for the WQCV outlet of an extended detention basin (i.e., perforated plate with a micro-pool) and extends to top of EURV water surface elevation.
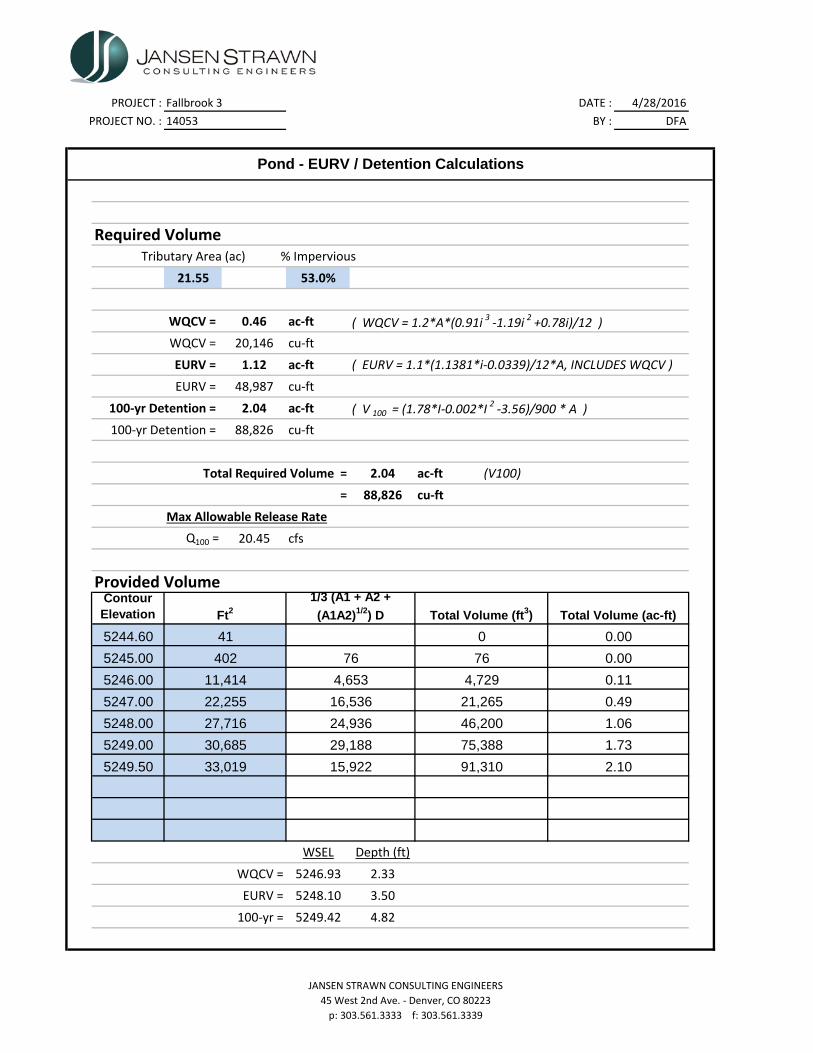
100-yr Detention = 2.04 ac-ft ( V 100 = (1.78*I-0.002*I 2 -3.56)/900 * A )100-yr Detention = 88,826 cu-ft
Total Required Volume = 2.04 ac-ft (V100)= 88,826 cu-ft
Max Allowable Release RateQ100 = 20.45 cfs
Provided VolumeContour Elevation
5244.60
5245.00
5246.00
5247.00
5248.00
5249.00
5249.50
WSEL Depth (ft)
WQCV = 5246.93 2.33
EURV = 5248.10 3.50
100-yr = 5249.42 4.82
41 0 0.00
30,685
27,716
22,255
11,414
402
4,653 4,729 0.11
76 76 0.00
24,936
Pond - EURV / Detention Calculations
Ft2
1/3 (A1 + A2 +
(A1A2)1/2) D Total Volume (ft3) Total Volume (ac-ft)
46,200 1.06
16,536 21,265 0.49
33,019 15,922 91,310 2.10
29,188 75,388 1.73
PROJECT : Fallbrook 3 DATE : 2/9/2016
PROJECT NO. : 14053 BY : JMP
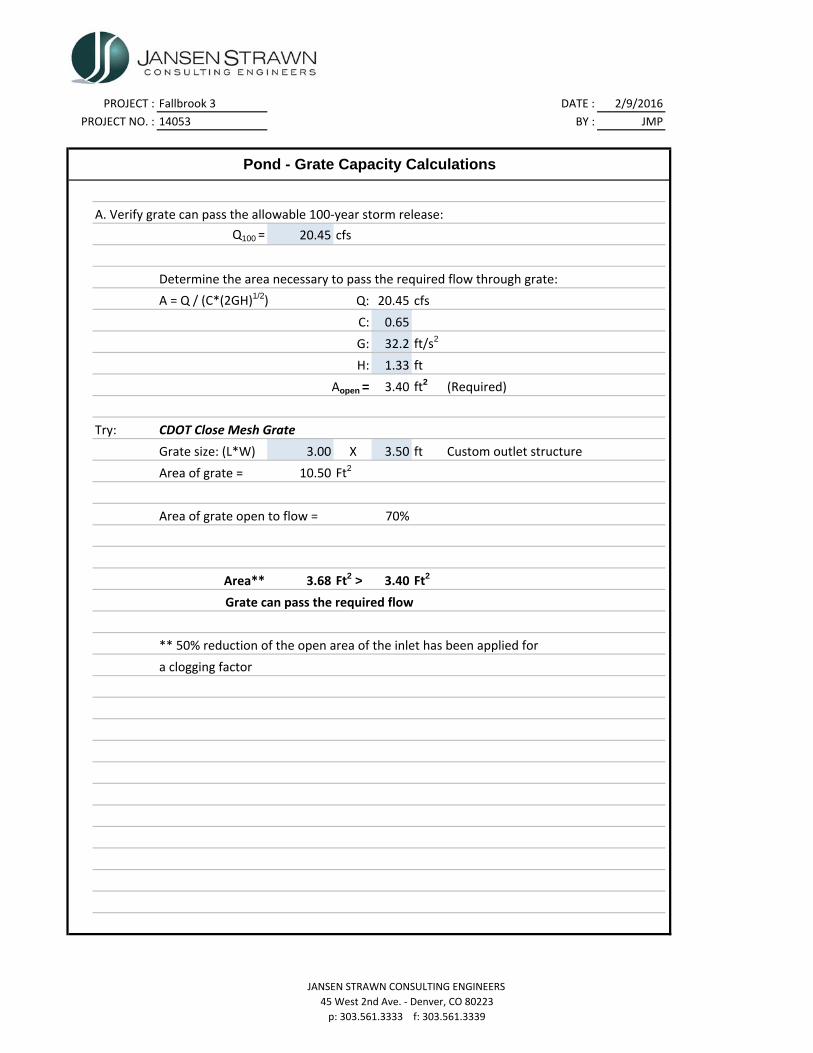
A. Verify grate can pass the allowable 100‐year storm release:
Q100 = 20.45 cfs
Determine the area necessary to pass the required flow through grate:
A = Q / (C*(2GH)1/2) Q: 20.45 cfs
C: 0.65
G: 32.2 ft/s2
H: 1.33 ft
Aopen = 3.40 ft2 (Required)
Try: CDOT Close Mesh Grate
Grate size: (L*W) 3.00 X 3.50 ft Custom outlet structure
Area of grate = 10.50 Ft2
Area of grate open to flow = 70%
Area** 3.68 Ft2 > 3.40 Ft2
Grate can pass the required flow
** 50% reduction of the open area of the inlet has been applied for
a clogging factor
Pond - Grate Capacity Calculations
JANSEN STRAWN CONSULTING ENGINEERS
45 West 2nd Ave. ‐ Denver, CO 80223
p: 303.561.3333 f: 303.561.3339
PROJECT : Fallbrook 3 DATE : 2/9/2016
PROJECT NO. : 14053 BY : JMP
100‐yr WSEL = 5249.47
18" INV OUT = 5244.31
Try Orifice Release:
Orifice Equation => Q=Cd*A*(2*g*h)0.5
Q100 = 20.45 cfs
Cd = 0.82
D = 16.250 in (orifice Diameter)
D = 1.35 ft (orifice Diameter)
A = 1.44
g = 32.20
h = 4.48
Q Release = 19.94 cfs
USE: 16.25 in orifice
Pond - 100-Year Outlet Box Control
JANSEN STRAWN CONSULTING ENGINEERS
45 West 2nd Ave. ‐ Denver, CO 80223
p: 303.561.3333 f: 303.561.3339
UD-Detention_v2.35 - 2-12-16.xls, WQCV 6/20/2016, 8:36 AM
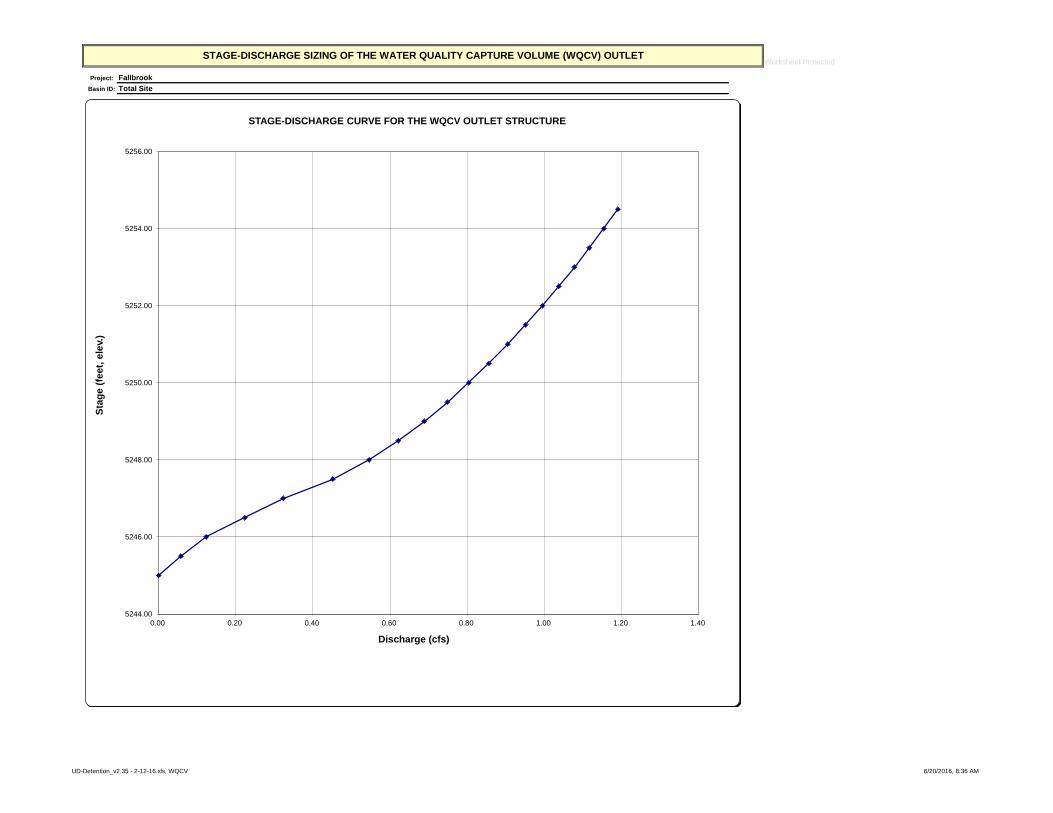
Project:
Basin ID:
WQCV Design Volume (Input):Catchment Imperviousness, Ia = 53.0 percent
Catchment Area, A = 21.55 acres Diameter of holes, D = 1.402 inchesDepth at WQCV outlet above lowest perforation, H = 1.93 feet Number of holes per row, N = 1
Vertical distance between rows, h = 4.00 inches ORNumber of rows, NL = 8.00
Orifice discharge coefficient, Co = 0.60 Height of slot, H = inchesSlope of Basin Trickle Channel, S = 0.005 ft / ft Width of slot, W = inches
Time to Drain the Pond = 72 hours
Watershed Design Information (Input): 1.93Percent Soil Type A = 0 %Percent Soil Type B = 0 %
Percent Soil Type C/D = 100 %
Outlet Design Information (Output):Excess Urban Runoff Volume (From 'Full-Spectrum Sheet') 0.626 watershed inches X
Outlet area per row, Ao = 1.54 square inchesTotal opening area at each row based on user-input above, Ao = 1.54 square inchesTotal opening area at each row based on user-input above, Ao = 0.011 square feet
Note: All riprap calculations determined from Urban Drainage and Flood Control District Drainage Criteria Manual Volume 2(1) - determined from Figure HS-20a(2) - determined from Figure HS-20c - Min. 12-inch riprap will be utilized
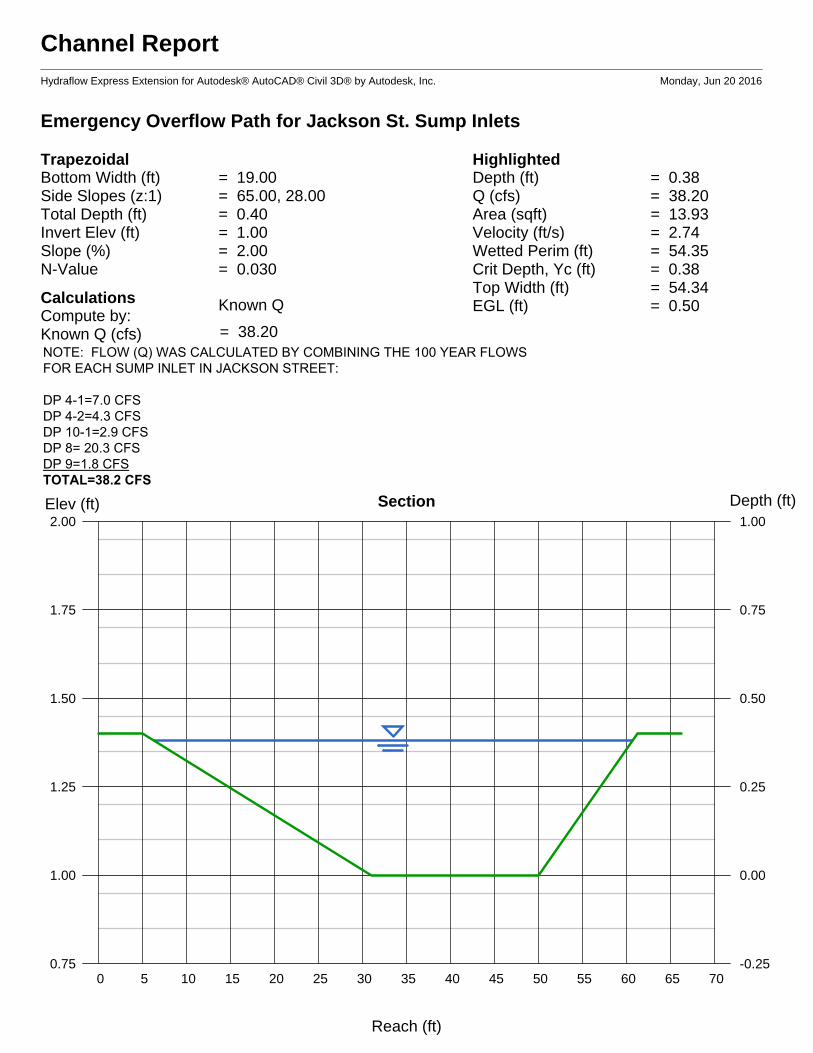
Overflow Analysis Notes:The emergency overflow was evaluated using a total flow of 162.0 cfs. This number was derived by adding the 100 year peak flow rate from pipe Line 1 (67.7 cfs, Refer to Storm Drain Calculations) to the direct runoff rate at Design Point 11 (13.3 cfs, Refer to Form SF-3). Then the peak flow was multiplied by 2.0.
Worksheet Protected
Project:Inlet ID:
Design Flow: ONLY if already determined through other methods: Minor Storm Major Storm (local peak flow for 1/2 of street OR grass-lined channel): *QKnown = 1.8 4.3 cfs
* If you enter values in Row 14, skip the rest of this sheet and proceed to sheet Q-Allow or Area Inlet. Geographic Information: (Enter data in the blue cells):
Subcatchment Area = Acres
Percent Imperviousness = %
NRCS Soil Type = A, B, C, or D
Slope (ft/ft) Length (ft)
Overland Flow =
Channel Flow =
Rainfall Information: Intensity I (inch/hr) = C1 * P1 / ( C2 + Tc ) ^ C3 Minor Storm Major StormDesign Storm Return Period, Tr = years
Return Period One-Hour Precipitation, P1 = inchesC1 =
C2 =
C3 =
User-Defined Storm Runoff Coefficient (leave this blank to accept a calculated value), C =User-Defined 5-yr. Runoff Coefficient (leave this blank to accept a calculated value), C5 =
Maximum Allowable Width for Spread Behind Curb TBACK = 20.0 ft
Side Slope Behind Curb (leave blank for no conveyance credit behind curb) SBACK = 0.040 ft/ft
Manning's Roughness Behind Curb (typically between 0.012 and 0.020) nBACK = 0.020
Height of Curb at Gutter Flow Line HCURB = 6.00 inches
Distance from Curb Face to Street Crown TCROWN = 30.0 ft
Gutter Width W = 2.00 ft
Street Transverse Slope SX = 0.020 ft/ft
Gutter Cross Slope (typically 2 inches over 24 inches or 0.083 ft/ft) SW = 0.083 ft/ft
Street Longitudinal Slope - Enter 0 for sump condition SO = 0.013 ft/ft
Manning's Roughness for Street Section (typically between 0.012 and 0.020) nSTREET = 0.016
Minor Storm Major Storm
Max. Allowable Spread for Minor & Major Storm TMAX = 20.0 20.0 ft
Max. Allowable Depth at Gutter Flowline for Minor & Major Storm dMAX = 6.0 9.0 inches
Allow Flow Depth at Street Crown (leave blank for no) check = yes
Maximum Capacity for 1/2 Street based On Allowable Spread Minor Storm Major Storm
Water Depth without Gutter Depression (Eq. ST-2) y = 4.80 4.80 inches
Vertical Depth between Gutter Lip and Gutter Flowline (usually 2") dC = 2.0 2.0 inches
Gutter Depression (dC - (W * Sx * 12)) a = 1.51 1.51 inches
Water Depth at Gutter Flowline d = 6.31 6.31 inches
Allowable Spread for Discharge outside the Gutter Section W (T - W) TX = 18.0 18.0 ft
Gutter Flow to Design Flow Ratio by FHWA HEC-22 method (Eq. ST-7) EO = 0.296 0.296Discharge outside the Gutter Section W, carried in Section TX QX = 12.8 12.8 cfs
Discharge within the Gutter Section W (QT - QX) QW = 5.4 5.4 cfs
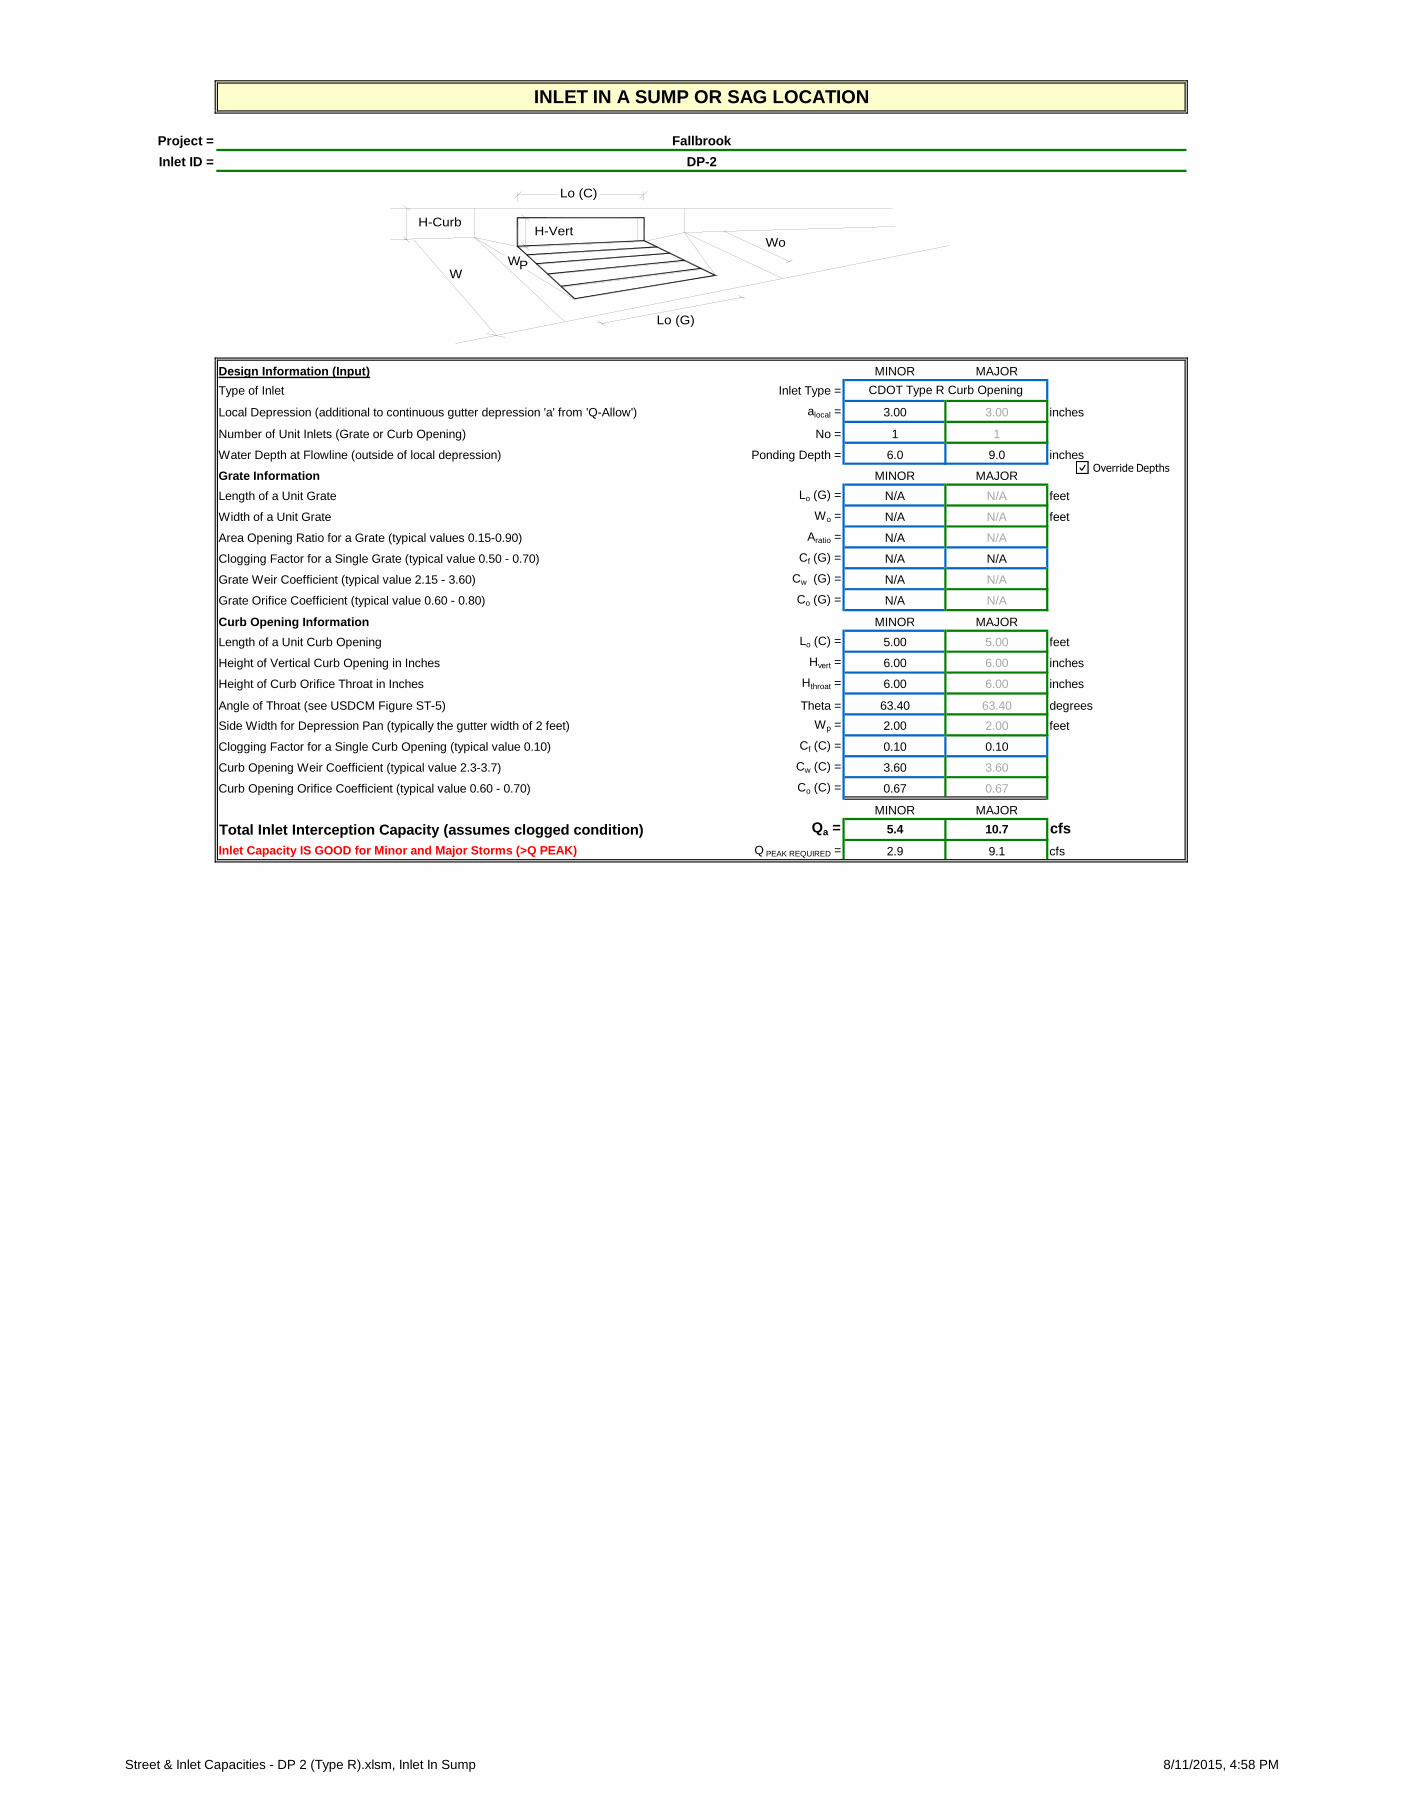
Inlet Capacity IS GOOD for Minor and Major Storms (>Q PEAK) Q PEAK REQUIRED = 2.9 9.1 cfs
INLET IN A SUMP OR SAG LOCATION
Fallbrook
DP-2
CDOT Type R Curb Opening
H-VertH-Curb
W
Lo (C)
Lo (G)
Wo
WP
Override Depths
Street & Inlet Capacities - DP 2 (Type R).xlsm, Inlet In Sump 8/11/2015, 4:58 PM
Worksheet Protected
Project:Inlet ID:
Design Flow: ONLY if already determined through other methods: Minor Storm Major Storm (local peak flow for 1/2 of street OR grass-lined channel): *QKnown = 1.3 3.6 cfs
* If you enter values in Row 14, skip the rest of this sheet and proceed to sheet Q-Allow or Area Inlet. Geographic Information: (Enter data in the blue cells):
Subcatchment Area = Acres
Percent Imperviousness = %
NRCS Soil Type = A, B, C, or D
Slope (ft/ft) Length (ft)
Overland Flow =
Channel Flow =
Rainfall Information: Intensity I (inch/hr) = C1 * P1 / ( C2 + Tc ) ^ C3 Minor Storm Major StormDesign Storm Return Period, Tr = years
Return Period One-Hour Precipitation, P1 = inchesC1 =
C2 =
C3 =
User-Defined Storm Runoff Coefficient (leave this blank to accept a calculated value), C =User-Defined 5-yr. Runoff Coefficient (leave this blank to accept a calculated value), C5 =
Inlet Capacity IS GOOD for Minor and Major Storms (>Q PEAK) Q PEAK REQUIRED = 1.3 3.6 cfs
INLET IN A SUMP OR SAG LOCATION
Fallbrook
DP 3
CDOT/Denver 13 Valley Grate
H-VertH-Curb
W
Lo (C)
Lo (G)
Wo
WP
Override Depths
Street & Inlet Capacities - DP 3 (13 Valley).xlsm, Inlet In Sump 12/8/2015, 3:13 PM
Worksheet Protected
Project:Inlet ID:
Design Flow: ONLY if already determined through other methods: Minor Storm Major Storm (local peak flow for 1/2 of street OR grass-lined channel): *QKnown = 2.4 7.0 cfs
* If you enter values in Row 14, skip the rest of this sheet and proceed to sheet Q-Allow or Area Inlet. Geographic Information: (Enter data in the blue cells):
Subcatchment Area = Acres
Percent Imperviousness = %
NRCS Soil Type = A, B, C, or D
Slope (ft/ft) Length (ft)
Overland Flow =
Channel Flow =
Rainfall Information: Intensity I (inch/hr) = C1 * P1 / ( C2 + Tc ) ^ C3 Minor Storm Major StormDesign Storm Return Period, Tr = years
Return Period One-Hour Precipitation, P1 = inchesC1 =
C2 =
C3 =
User-Defined Storm Runoff Coefficient (leave this blank to accept a calculated value), C =User-Defined 5-yr. Runoff Coefficient (leave this blank to accept a calculated value), C5 =
Maximum Allowable Width for Spread Behind Curb TBACK = 12.5 ft
Side Slope Behind Curb (leave blank for no conveyance credit behind curb) SBACK = 0.020 ft/ft
Manning's Roughness Behind Curb (typically between 0.012 and 0.020) nBACK = 0.020
Height of Curb at Gutter Flow Line HCURB = 6.00 inches
Distance from Curb Face to Street Crown TCROWN = 17.0 ft
Gutter Width W = 2.00 ft
Street Transverse Slope SX = 0.020 ft/ft
Gutter Cross Slope (typically 2 inches over 24 inches or 0.083 ft/ft) SW = 0.083 ft/ft
Street Longitudinal Slope - Enter 0 for sump condition SO = 0.000 ft/ft
Manning's Roughness for Street Section (typically between 0.012 and 0.020) nSTREET = 0.016
Minor Storm Major Storm
Max. Allowable Spread for Minor & Major Storm TMAX = 17.0 17.0 ft
Max. Allowable Depth at Gutter Flowline for Minor & Major Storm dMAX = 6.0 9.0 inches
Allow Flow Depth at Street Crown (leave blank for no) check = yes
Maximum Capacity for 1/2 Street based On Allowable Spread Minor Storm Major Storm
Water Depth without Gutter Depression (Eq. ST-2) y = 4.08 4.08 inches
Vertical Depth between Gutter Lip and Gutter Flowline (usually 2") dC = 2.0 2.0 inches
Gutter Depression (dC - (W * Sx * 12)) a = 1.51 1.51 inches
Water Depth at Gutter Flowline d = 5.59 5.59 inches
Allowable Spread for Discharge outside the Gutter Section W (T - W) TX = 15.0 15.0 ft
Gutter Flow to Design Flow Ratio by FHWA HEC-22 method (Eq. ST-7) EO = 0.350 0.350Discharge outside the Gutter Section W, carried in Section TX QX = 0.0 0.0 cfs
Discharge within the Gutter Section W (QT - QX) QW = 0.0 0.0 cfs
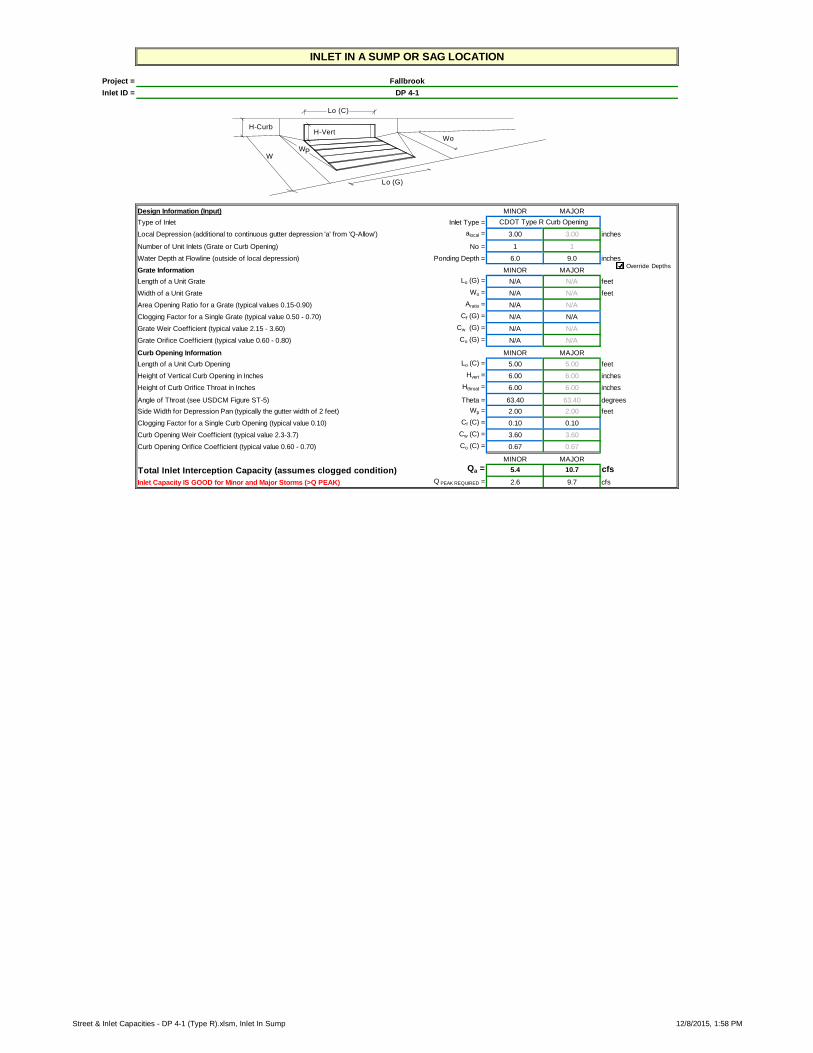
Inlet Capacity IS GOOD for Minor and Major Storms (>Q PEAK) Q PEAK REQUIRED = 2.6 9.7 cfs
INLET IN A SUMP OR SAG LOCATION
Fallbrook
DP 4-1
CDOT Type R Curb Opening
H-VertH-Curb
W
Lo (C)
Lo (G)
Wo
WP
Override Depths
Street & Inlet Capacities - DP 4-1 (Type R).xlsm, Inlet In Sump 12/8/2015, 1:58 PM
Worksheet Protected
Project:Inlet ID:
Design Flow: ONLY if already determined through other methods: Minor Storm Major Storm (local peak flow for 1/2 of street OR grass-lined channel): *QKnown = 1.7 4.3 cfs
* If you enter values in Row 14, skip the rest of this sheet and proceed to sheet Q-Allow or Area Inlet. Geographic Information: (Enter data in the blue cells):
Subcatchment Area = Acres
Percent Imperviousness = %
NRCS Soil Type = A, B, C, or D
Slope (ft/ft) Length (ft)
Overland Flow =
Channel Flow =
Rainfall Information: Intensity I (inch/hr) = C1 * P1 / ( C2 + Tc ) ^ C3 Minor Storm Major StormDesign Storm Return Period, Tr = years
Return Period One-Hour Precipitation, P1 = inchesC1 =
C2 =
C3 =
User-Defined Storm Runoff Coefficient (leave this blank to accept a calculated value), C =User-Defined 5-yr. Runoff Coefficient (leave this blank to accept a calculated value), C5 =
DESIGN PEAK FLOW FOR ONE-HALF OF STREET OR GRASS-LINED CHANNEL BY THE RATIONAL METHOD
FallbrookDP 4-2
Site is Urban
Site is Non-Urban
Show Details
Site Type:
Street Inlets
Area Inlets in a Median
Flows Developed For:
Street & Inlet Capacities - DP 4-2 (Type R).xlsm, Q-Peak 2/11/2016, 9:27 AM
Project:Inlet ID:
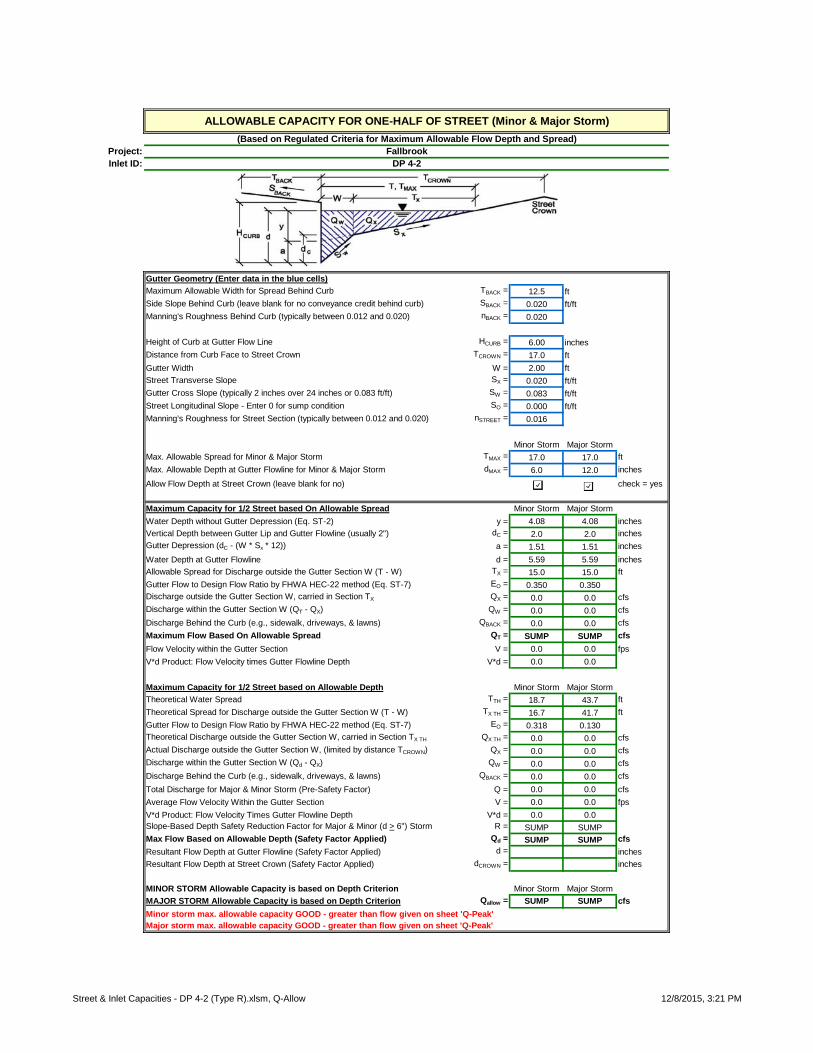
Gutter Geometry (Enter data in the blue cells)
Maximum Allowable Width for Spread Behind Curb TBACK = 12.5 ft
Side Slope Behind Curb (leave blank for no conveyance credit behind curb) SBACK = 0.020 ft/ft
Manning's Roughness Behind Curb (typically between 0.012 and 0.020) nBACK = 0.020
Height of Curb at Gutter Flow Line HCURB = 6.00 inches
Distance from Curb Face to Street Crown TCROWN = 17.0 ft
Gutter Width W = 2.00 ft
Street Transverse Slope SX = 0.020 ft/ft
Gutter Cross Slope (typically 2 inches over 24 inches or 0.083 ft/ft) SW = 0.083 ft/ft
Street Longitudinal Slope - Enter 0 for sump condition SO = 0.000 ft/ft
Manning's Roughness for Street Section (typically between 0.012 and 0.020) nSTREET = 0.016
Minor Storm Major Storm
Max. Allowable Spread for Minor & Major Storm TMAX = 17.0 17.0 ft
Max. Allowable Depth at Gutter Flowline for Minor & Major Storm dMAX = 6.0 12.0 inches
Allow Flow Depth at Street Crown (leave blank for no) check = yes
Maximum Capacity for 1/2 Street based On Allowable Spread Minor Storm Major Storm
Water Depth without Gutter Depression (Eq. ST-2) y = 4.08 4.08 inches
Vertical Depth between Gutter Lip and Gutter Flowline (usually 2") dC = 2.0 2.0 inches
Gutter Depression (dC - (W * Sx * 12)) a = 1.51 1.51 inches
Water Depth at Gutter Flowline d = 5.59 5.59 inches
Allowable Spread for Discharge outside the Gutter Section W (T - W) TX = 15.0 15.0 ft
Gutter Flow to Design Flow Ratio by FHWA HEC-22 method (Eq. ST-7) EO = 0.350 0.350Discharge outside the Gutter Section W, carried in Section TX QX = 0.0 0.0 cfs
Discharge within the Gutter Section W (QT - QX) QW = 0.0 0.0 cfs
Inlet Capacity IS GOOD for Minor and Major Storms (>Q PEAK) Q PEAK REQUIRED = 0.7 1.7 cfs
INLET IN A SUMP OR SAG LOCATION
Fallbrook
DP-5
CDOT Type R Curb Opening
H-VertH-Curb
W
Lo (C)
Lo (G)
Wo
WP
Override Depths
Street & Inlet Capacities - DP 5 (Type R).xlsm, Inlet In Sump 8/11/2015, 5:01 PM
Worksheet Protected
Project:Inlet ID:
Design Flow: ONLY if already determined through other methods: Minor Storm Major Storm (local peak flow for 1/2 of street OR grass-lined channel): *QKnown = 1.1 3.1 cfs
* If you enter values in Row 14, skip the rest of this sheet and proceed to sheet Q-Allow or Area Inlet. Geographic Information: (Enter data in the blue cells):
Subcatchment Area = Acres
Percent Imperviousness = %
NRCS Soil Type = A, B, C, or D
Slope (ft/ft) Length (ft)
Overland Flow =
Channel Flow =
Rainfall Information: Intensity I (inch/hr) = C1 * P1 / ( C2 + Tc ) ^ C3 Minor Storm Major StormDesign Storm Return Period, Tr = years
Return Period One-Hour Precipitation, P1 = inchesC1 =
C2 =
C3 =
User-Defined Storm Runoff Coefficient (leave this blank to accept a calculated value), C =User-Defined 5-yr. Runoff Coefficient (leave this blank to accept a calculated value), C5 =
Street & Inlet Capacities - DP 6-1 (13 Valley).xlsm, Inlet On Grade 12/8/2015, 12:56 PM
Worksheet Protected
Project:Inlet ID:
Design Flow: ONLY if already determined through other methods: Minor Storm Major Storm (local peak flow for 1/2 of street OR grass-lined channel): *QKnown = 1.6 4.2 cfs
* If you enter values in Row 14, skip the rest of this sheet and proceed to sheet Q-Allow or Area Inlet. Geographic Information: (Enter data in the blue cells):
Subcatchment Area = Acres
Percent Imperviousness = %
NRCS Soil Type = A, B, C, or D
Slope (ft/ft) Length (ft)
Overland Flow =
Channel Flow =
Rainfall Information: Intensity I (inch/hr) = C1 * P1 / ( C2 + Tc ) ^ C3 Minor Storm Major StormDesign Storm Return Period, Tr = years
Return Period One-Hour Precipitation, P1 = inchesC1 =
C2 =
C3 =
User-Defined Storm Runoff Coefficient (leave this blank to accept a calculated value), C =User-Defined 5-yr. Runoff Coefficient (leave this blank to accept a calculated value), C5 =
Street & Inlet Capacities - DP 6-2 (Type R).xlsm, Inlet On Grade 12/8/2015, 12:54 PM
Worksheet Protected
Project:Inlet ID:
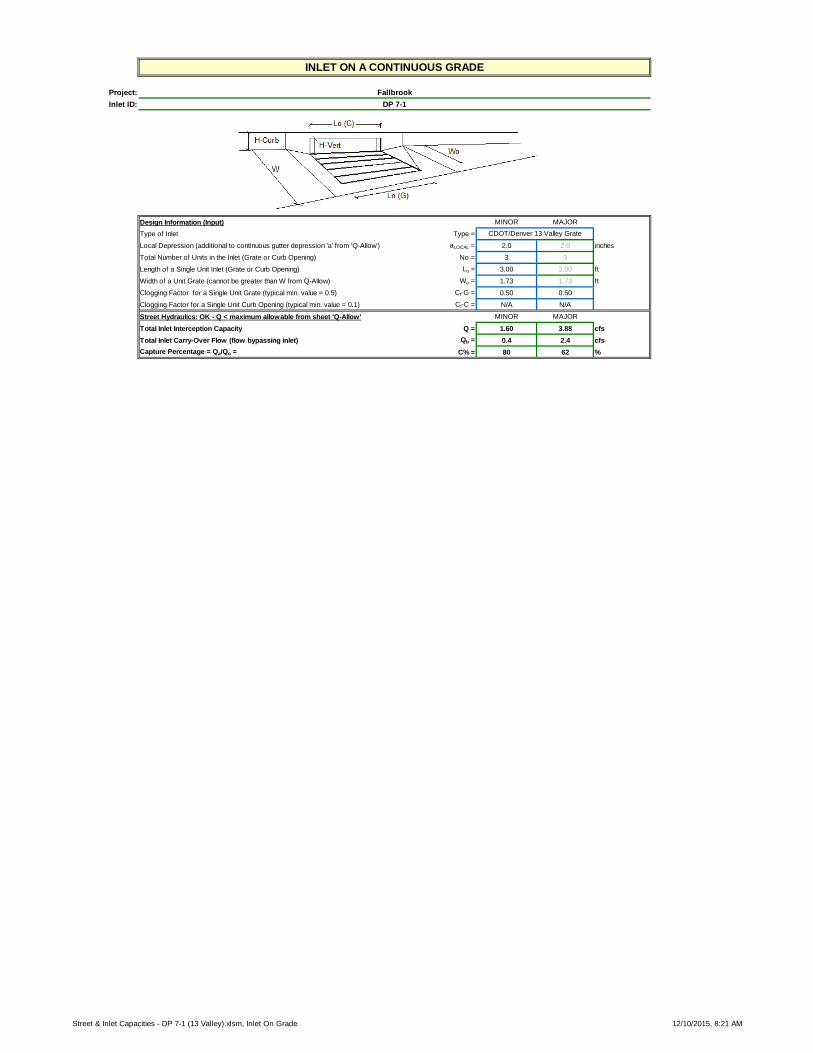
Design Flow: ONLY if already determined through other methods: Minor Storm Major Storm (local peak flow for 1/2 of street OR grass-lined channel): *QKnown = 2.0 6.3 cfs
* If you enter values in Row 14, skip the rest of this sheet and proceed to sheet Q-Allow or Area Inlet. Geographic Information: (Enter data in the blue cells):
Subcatchment Area = Acres
Percent Imperviousness = %
NRCS Soil Type = A, B, C, or D
Slope (ft/ft) Length (ft)
Overland Flow =
Channel Flow =
Rainfall Information: Intensity I (inch/hr) = C1 * P1 / ( C2 + Tc ) ^ C3 Minor Storm Major StormDesign Storm Return Period, Tr = years
Return Period One-Hour Precipitation, P1 = inchesC1 =
C2 =
C3 =
User-Defined Storm Runoff Coefficient (leave this blank to accept a calculated value), C =User-Defined 5-yr. Runoff Coefficient (leave this blank to accept a calculated value), C5 =
Street & Inlet Capacities - DP 7-1 (13 Valley).xlsm, Inlet On Grade 12/10/2015, 8:21 AM
Worksheet Protected
Project:Inlet ID:
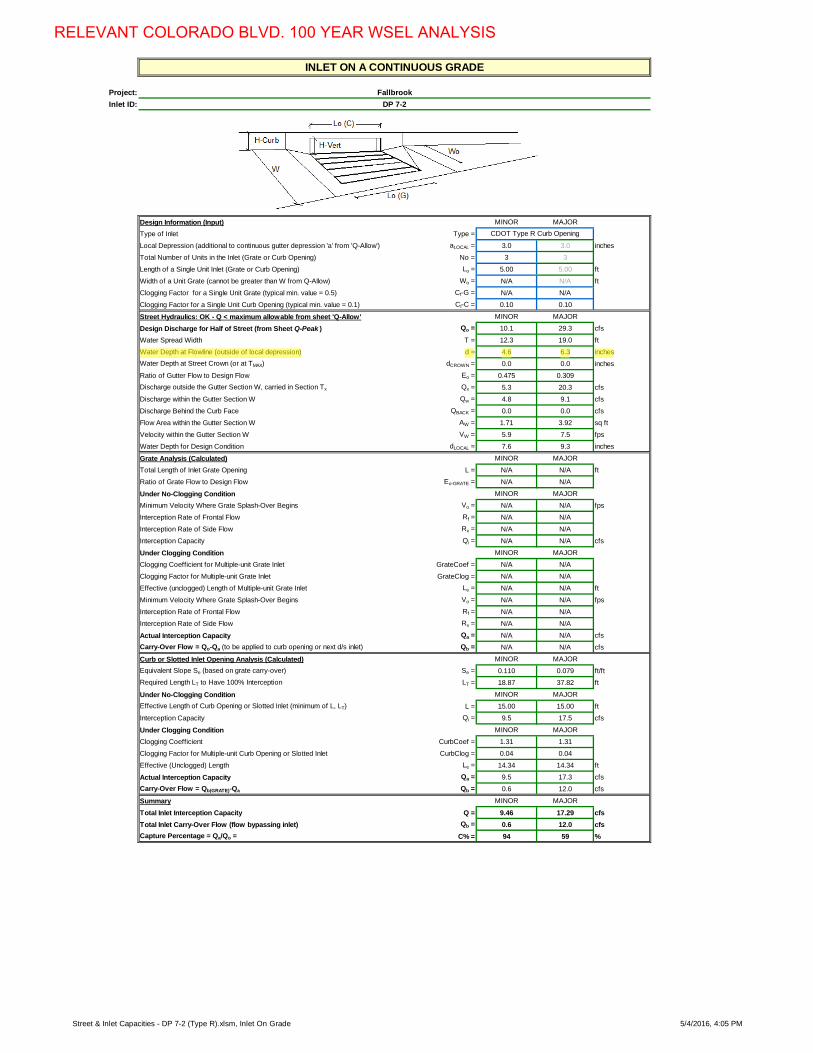
Design Flow: ONLY if already determined through other methods: Minor Storm Major Storm (local peak flow for 1/2 of street OR grass-lined channel): *QKnown = 9.7 26.9 cfs
* If you enter values in Row 14, skip the rest of this sheet and proceed to sheet Q-Allow or Area Inlet. Geographic Information: (Enter data in the blue cells):
Subcatchment Area = Acres
Percent Imperviousness = %
NRCS Soil Type = A, B, C, or D
Slope (ft/ft) Length (ft)
Overland Flow =
Channel Flow =
Rainfall Information: Intensity I (inch/hr) = C1 * P1 / ( C2 + Tc ) ^ C3 Minor Storm Major StormDesign Storm Return Period, Tr = years
Return Period One-Hour Precipitation, P1 = inchesC1 =
C2 =
C3 =
User-Defined Storm Runoff Coefficient (leave this blank to accept a calculated value), C =User-Defined 5-yr. Runoff Coefficient (leave this blank to accept a calculated value), C5 =
Street & Inlet Capacities - DP 7-2 (Type R).xlsm, Inlet On Grade 5/4/2016, 4:05 PM
RELEVANT COLORADO BLVD. 100 YEAR WSEL ANALYSIS
dallen
Highlight
Worksheet Protected
Project:Inlet ID:
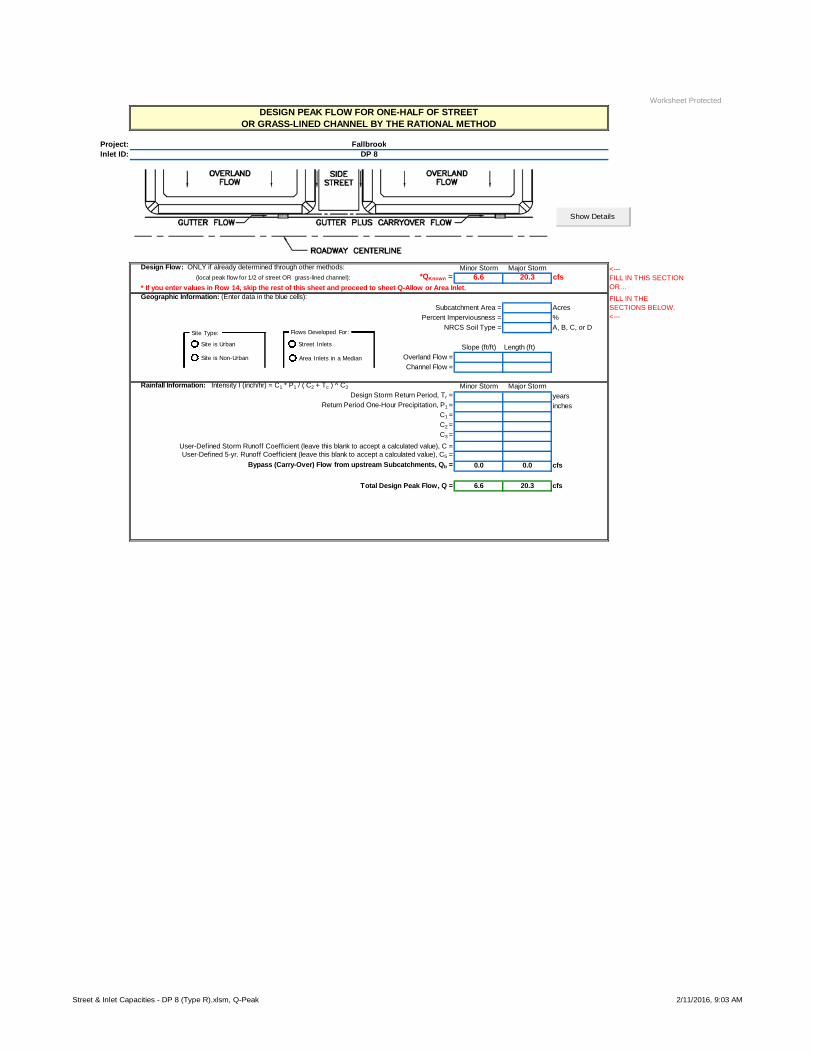
Design Flow: ONLY if already determined through other methods: Minor Storm Major Storm (local peak flow for 1/2 of street OR grass-lined channel): *QKnown = 6.6 20.3 cfs
* If you enter values in Row 14, skip the rest of this sheet and proceed to sheet Q-Allow or Area Inlet. Geographic Information: (Enter data in the blue cells):
Subcatchment Area = Acres
Percent Imperviousness = %
NRCS Soil Type = A, B, C, or D
Slope (ft/ft) Length (ft)
Overland Flow =
Channel Flow =
Rainfall Information: Intensity I (inch/hr) = C1 * P1 / ( C2 + Tc ) ^ C3 Minor Storm Major StormDesign Storm Return Period, Tr = years
Return Period One-Hour Precipitation, P1 = inchesC1 =
C2 =
C3 =
User-Defined Storm Runoff Coefficient (leave this blank to accept a calculated value), C =User-Defined 5-yr. Runoff Coefficient (leave this blank to accept a calculated value), C5 =
WARNING: Inlet Capacity less than Q Peak for MAJOR Storm Q PEAK REQUIRED = 6.6 20.3 cfs
INLET IN A SUMP OR SAG LOCATION
Fallbrook
DP 8
CDOT Type R Curb Opening
H-VertH-Curb
W
Lo (C)
Lo (G)
Wo
WP
Override Depths
Street & Inlet Capacities - DP 8 (Type R).xlsm, Inlet In Sump 2/11/2016, 9:04 AM
Worksheet Protected
Project:Inlet ID:
Design Flow: ONLY if already determined through other methods: Minor Storm Major Storm (local peak flow for 1/2 of street OR grass-lined channel): *QKnown = 0.8 1.8 cfs
* If you enter values in Row 14, skip the rest of this sheet and proceed to sheet Q-Allow or Area Inlet. Geographic Information: (Enter data in the blue cells):
Subcatchment Area = Acres
Percent Imperviousness = %
NRCS Soil Type = A, B, C, or D
Slope (ft/ft) Length (ft)
Overland Flow =
Channel Flow =
Rainfall Information: Intensity I (inch/hr) = C1 * P1 / ( C2 + Tc ) ^ C3 Minor Storm Major StormDesign Storm Return Period, Tr = years
Return Period One-Hour Precipitation, P1 = inchesC1 =
C2 =
C3 =
User-Defined Storm Runoff Coefficient (leave this blank to accept a calculated value), C =User-Defined 5-yr. Runoff Coefficient (leave this blank to accept a calculated value), C5 =
Inlet Capacity IS GOOD for Minor and Major Storms (>Q PEAK) Q PEAK REQUIRED = 0.8 1.8 cfs
INLET IN A SUMP OR SAG LOCATION
Fallbrook
DP 9
CDOT Type R Curb Opening
H-VertH-Curb
W
Lo (C)
Lo (G)
Wo
WP
Override Depths
Street & Inlet Capacities - DP 9 (Type R).xlsm, Inlet In Sump 2/11/2016, 9:16 AM
Worksheet Protected
Project:Inlet ID:
Design Flow: ONLY if already determined through other methods: Minor Storm Major Storm (local peak flow for 1/2 of street OR grass-lined channel): *QKnown = 1.2 2.9 cfs
* If you enter values in Row 14, skip the rest of this sheet and proceed to sheet Q-Allow or Area Inlet. Geographic Information: (Enter data in the blue cells):
Subcatchment Area = Acres
Percent Imperviousness = %
NRCS Soil Type = A, B, C, or D
Slope (ft/ft) Length (ft)
Overland Flow =
Channel Flow =
Rainfall Information: Intensity I (inch/hr) = C1 * P1 / ( C2 + Tc ) ^ C3 Minor Storm Major StormDesign Storm Return Period, Tr = years
Return Period One-Hour Precipitation, P1 = inchesC1 =
C2 =
C3 =
User-Defined Storm Runoff Coefficient (leave this blank to accept a calculated value), C =User-Defined 5-yr. Runoff Coefficient (leave this blank to accept a calculated value), C5 =
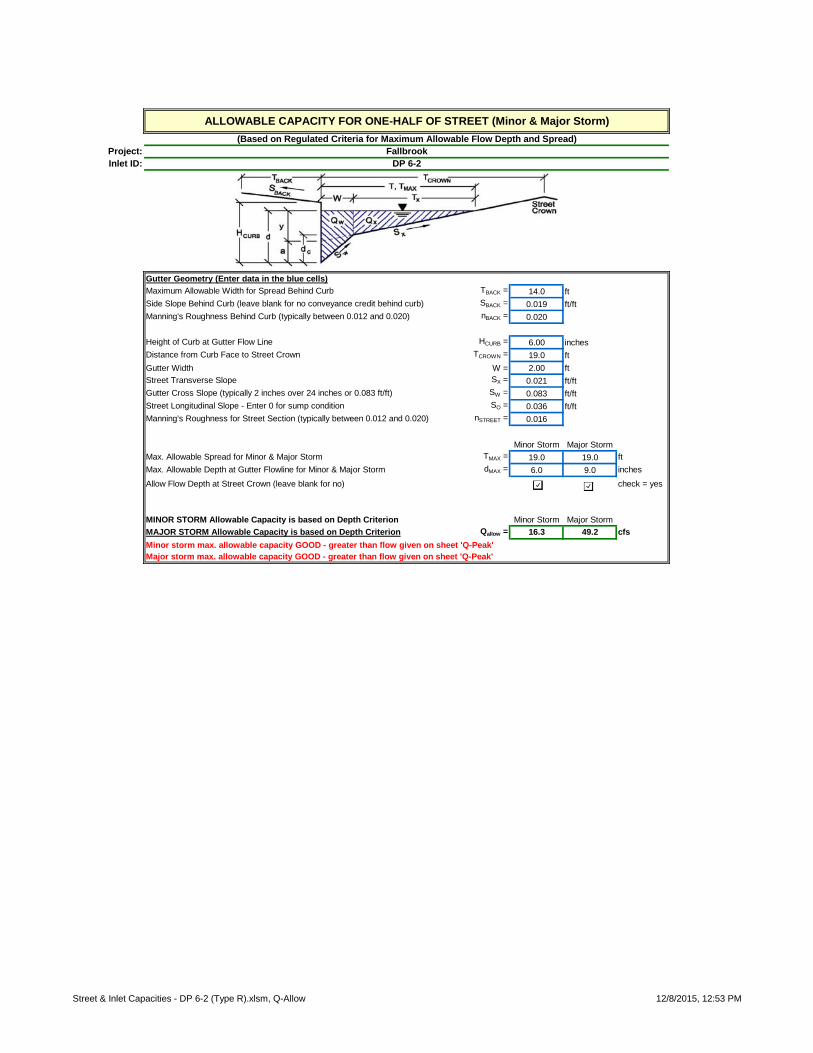
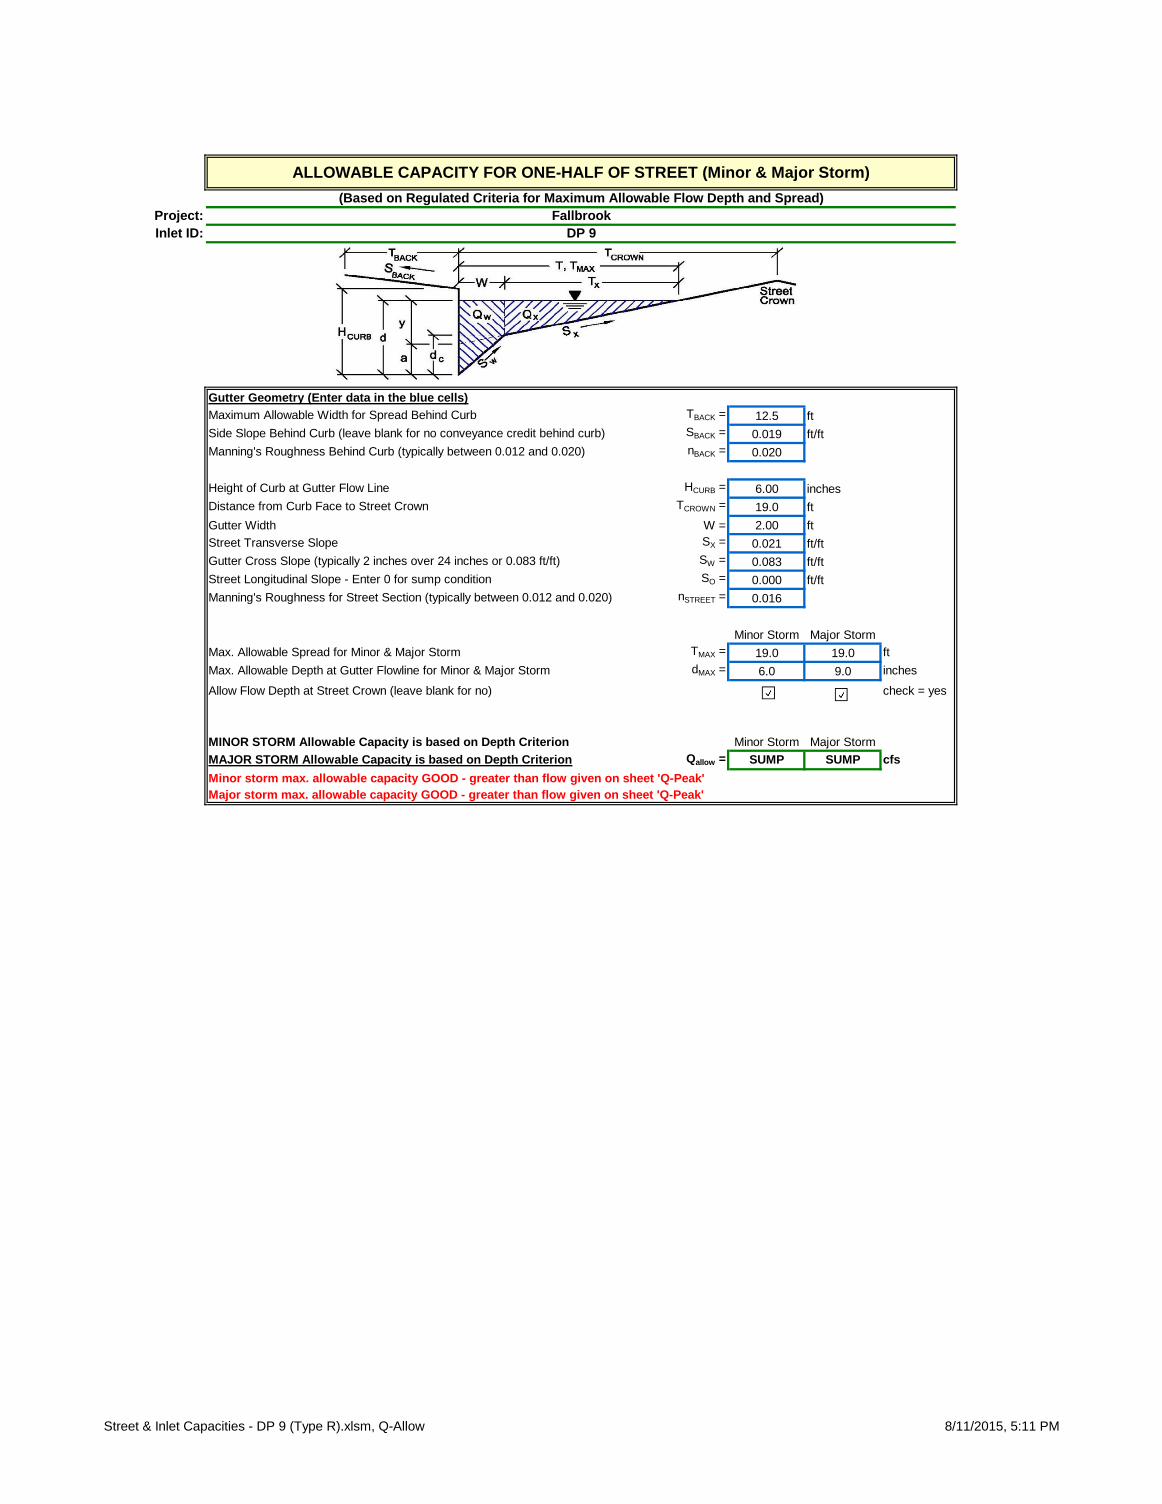
Maximum Allowable Width for Spread Behind Curb TBACK = 12.5 ft
Side Slope Behind Curb (leave blank for no conveyance credit behind curb) SBACK = 0.020 ft/ft
Manning's Roughness Behind Curb (typically between 0.012 and 0.020) nBACK = 0.020
Height of Curb at Gutter Flow Line HCURB = 6.00 inches
Distance from Curb Face to Street Crown TCROWN = 17.0 ft
Gutter Width W = 2.00 ft
Street Transverse Slope SX = 0.020 ft/ft
Gutter Cross Slope (typically 2 inches over 24 inches or 0.083 ft/ft) SW = 0.083 ft/ft
Street Longitudinal Slope - Enter 0 for sump condition SO = 0.000 ft/ft
Manning's Roughness for Street Section (typically between 0.012 and 0.020) nSTREET = 0.016
Minor Storm Major Storm
Max. Allowable Spread for Minor & Major Storm TMAX = 17.0 17.0 ft
Max. Allowable Depth at Gutter Flowline for Minor & Major Storm dMAX = 6.0 12.0 inches
Allow Flow Depth at Street Crown (leave blank for no) check = yes
Maximum Capacity for 1/2 Street based On Allowable Spread Minor Storm Major Storm
Water Depth without Gutter Depression (Eq. ST-2) y = 4.08 4.08 inches
Vertical Depth between Gutter Lip and Gutter Flowline (usually 2") dC = 2.0 2.0 inches
Gutter Depression (dC - (W * Sx * 12)) a = 1.51 1.51 inches
Water Depth at Gutter Flowline d = 5.59 5.59 inches
Allowable Spread for Discharge outside the Gutter Section W (T - W) TX = 15.0 15.0 ft
Gutter Flow to Design Flow Ratio by FHWA HEC-22 method (Eq. ST-7) EO = 0.350 0.350Discharge outside the Gutter Section W, carried in Section TX QX = 0.0 0.0 cfs
Discharge within the Gutter Section W (QT - QX) QW = 0.0 0.0 cfs
Inlet Capacity IS GOOD for Minor and Major Storms (>Q PEAK) Q PEAK REQUIRED = 1.2 2.9 cfs
INLET IN A SUMP OR SAG LOCATION
Fallbrook
DP 10-1
CDOT Type R Curb Opening
H-VertH-Curb
W
Lo (C)
Lo (G)
Wo
WP
Override Depths
Street & Inlet Capacities - DP 10-1 (Type R).xlsm, Inlet In Sump 12/8/2015, 3:26 PM
Worksheet Protected
Project:Inlet ID:
Design Flow: ONLY if already determined through other methods: Minor Storm Major Storm (local peak flow for 1/2 of street OR grass-lined channel): *QKnown = 0.8 1.9 cfs
* If you enter values in Row 14, skip the rest of this sheet and proceed to sheet Q-Allow or Area Inlet. Geographic Information: (Enter data in the blue cells):
Subcatchment Area = Acres
Percent Imperviousness = %
NRCS Soil Type = A, B, C, or D
Slope (ft/ft) Length (ft)
Overland Flow =
Channel Flow =
Rainfall Information: Intensity I (inch/hr) = C1 * P1 / ( C2 + Tc ) ^ C3 Minor Storm Major StormDesign Storm Return Period, Tr = years
Return Period One-Hour Precipitation, P1 = inchesC1 =
C2 =
C3 =
User-Defined Storm Runoff Coefficient (leave this blank to accept a calculated value), C =User-Defined 5-yr. Runoff Coefficient (leave this blank to accept a calculated value), C5 =
DESIGN PEAK FLOW FOR ONE-HALF OF STREET OR GRASS-LINED CHANNEL BY THE RATIONAL METHOD
FallbrookDP 10-2
Site is Urban
Site is Non-Urban
Show Details
Site Type:
Street Inlets
Area Inlets in a Median
Flows Developed For:
Street & Inlet Capacities - DP 10-2 (Type R).xlsm, Q-Peak 2/11/2016, 9:30 AM
Project:Inlet ID:
Gutter Geometry (Enter data in the blue cells)
Maximum Allowable Width for Spread Behind Curb TBACK = 12.5 ft
Side Slope Behind Curb (leave blank for no conveyance credit behind curb) SBACK = 0.020 ft/ft
Manning's Roughness Behind Curb (typically between 0.012 and 0.020) nBACK = 0.020
Height of Curb at Gutter Flow Line HCURB = 6.00 inches
Distance from Curb Face to Street Crown TCROWN = 17.0 ft
Gutter Width W = 2.00 ft
Street Transverse Slope SX = 0.020 ft/ft
Gutter Cross Slope (typically 2 inches over 24 inches or 0.083 ft/ft) SW = 0.083 ft/ft
Street Longitudinal Slope - Enter 0 for sump condition SO = 0.000 ft/ft
Manning's Roughness for Street Section (typically between 0.012 and 0.020) nSTREET = 0.016
Minor Storm Major Storm
Max. Allowable Spread for Minor & Major Storm TMAX = 17.0 17.0 ft
Max. Allowable Depth at Gutter Flowline for Minor & Major Storm dMAX = 6.0 12.0 inches
Allow Flow Depth at Street Crown (leave blank for no) check = yes
Maximum Capacity for 1/2 Street based On Allowable Spread Minor Storm Major Storm
Water Depth without Gutter Depression (Eq. ST-2) y = 4.08 4.08 inches
Vertical Depth between Gutter Lip and Gutter Flowline (usually 2") dC = 2.0 2.0 inches
Gutter Depression (dC - (W * Sx * 12)) a = 1.51 1.51 inches
Water Depth at Gutter Flowline d = 5.59 5.59 inches
Allowable Spread for Discharge outside the Gutter Section W (T - W) TX = 15.0 15.0 ft
Gutter Flow to Design Flow Ratio by FHWA HEC-22 method (Eq. ST-7) EO = 0.350 0.350Discharge outside the Gutter Section W, carried in Section TX QX = 0.0 0.0 cfs
Discharge within the Gutter Section W (QT - QX) QW = 0.0 0.0 cfs
t 303.561.3333 | f 303.561.3339 | 45 West 2nd Avenue, Denver, Colorado 80223 | www.jansenstrawn.com
APPENDIX C – Reference Materials
Effective FEMA Map Panels
NRCS Soil Information
17
Custom Soil Resource ReportMap—Hydrologic Soil Group
4422
210
4422
270
4422
330
4422
390
4422
450
4422
510
4422
570
4422
630
4422
210
4422
270
4422
330
4422
390
4422
450
4422
510
4422
570
4422
630
504810 504870 504930 504990 505050 505110
504810 504870 504930 504990 505050 505110
39° 57' 14'' N10
4° 5
6' 3
8'' W
39° 57' 14'' N
104°
56'
23'
' W
39° 56' 59'' N
104°
56'
38'
' W
39° 56' 59'' N
104°
56'
23'
' W
N
Map projection: Web Mercator Corner coordinates: WGS84 Edge tics: UTM Zone 13N WGS840 100 200 400 600
Feet0 30 60 120 180
MetersMap Scale: 1:2,340 if printed on A portrait (8.5" x 11") sheet.
MAP LEGEND MAP INFORMATION
Area of Interest (AOI)Area of Interest (AOI)
SoilsSoil Rating Polygons
A
A/D
B
B/D
C
C/D
D
Not rated or not available
Soil Rating LinesA
A/D
B
B/D
C
C/D
D
Not rated or not available
Soil Rating PointsA
A/D
B
B/D
C
C/D
D
Not rated or not available
Water FeaturesStreams and Canals
TransportationRails
Interstate Highways
US Routes
Major Roads
Local Roads
BackgroundAerial Photography
The soil surveys that comprise your AOI were mapped at 1:20,000.
Warning: Soil Map may not be valid at this scale.
Enlargement of maps beyond the scale of mapping can causemisunderstanding of the detail of mapping and accuracy of soil lineplacement. The maps do not show the small areas of contrastingsoils that could have been shown at a more detailed scale.
Please rely on the bar scale on each map sheet for mapmeasurements.
Source of Map: Natural Resources Conservation ServiceWeb Soil Survey URL: http://websoilsurvey.nrcs.usda.govCoordinate System: Web Mercator (EPSG:3857)
Maps from the Web Soil Survey are based on the Web Mercatorprojection, which preserves direction and shape but distortsdistance and area. A projection that preserves area, such as theAlbers equal-area conic projection, should be used if more accuratecalculations of distance or area are required.
This product is generated from the USDA-NRCS certified data as ofthe version date(s) listed below.
Soil Survey Area: Adams County Area, Parts of Adams andDenver Counties, ColoradoSurvey Area Data: Version 11, Sep 23, 2014
Soil map units are labeled (as space allows) for map scales 1:50,000or larger.
Date(s) aerial images were photographed: Mar 16, 2012—Sep18, 2014
The orthophoto or other base map on which the soil lines werecompiled and digitized probably differs from the backgroundimagery displayed on these maps. As a result, some minor shiftingof map unit boundaries may be evident.
Custom Soil Resource Report
18
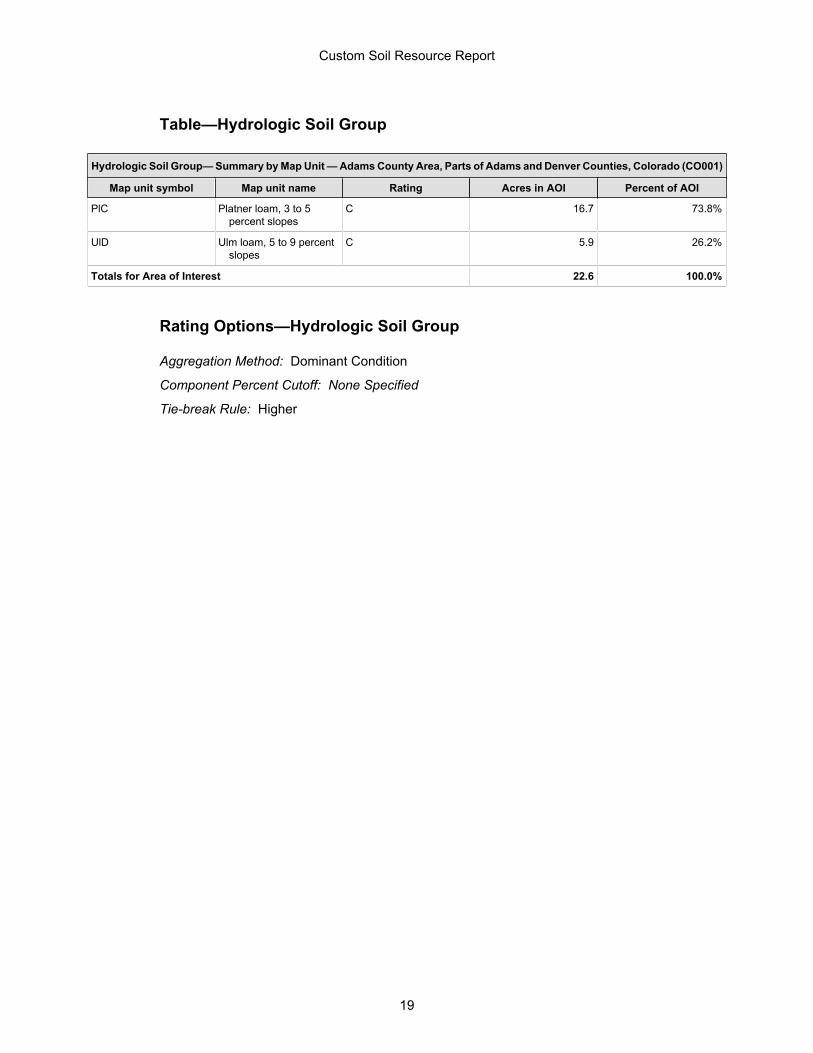
Table—Hydrologic Soil Group
Hydrologic Soil Group— Summary by Map Unit — Adams County Area, Parts of Adams and Denver Counties, Colorado (CO001)
Map unit symbol Map unit name Rating Acres in AOI Percent of AOI
PlC Platner loam, 3 to 5percent slopes
C 16.7 73.8%
UlD Ulm loam, 5 to 9 percentslopes
C 5.9 26.2%
Totals for Area of Interest 22.6 100.0%
Rating Options—Hydrologic Soil Group
Aggregation Method: Dominant Condition
Component Percent Cutoff: None Specified
Tie-break Rule: Higher
Custom Soil Resource Report
19
t 303.561.3333 | f 303.561.3339 | 45 West 2nd Avenue, Denver, Colorado 80223 | www.jansenstrawn.com