Journal of Intellectual Capital The intellectual capital performance of the Indian banking sector G. Barathi Kamath Article information: To cite this document: G. Barathi Kamath, (2007),"The intellectual capital performance of the Indian banking sector", Journal of Intellectual Capital, Vol. 8 Iss 1 pp. 96 - 123 Permanent link to this document: http://dx.doi.org/10.1108/14691930710715088 Downloaded on: 04 February 2015, At: 20:44 (PT) References: this document contains references to 32 other documents. To copy this document: [email protected]The fulltext of this document has been downloaded 3971 times since 2007* Users who downloaded this article also downloaded: Pek Chen Goh, (2005),"Intellectual capital performance of commercial banks in Malaysia", Journal of Intellectual Capital, Vol. 6 Iss 3 pp. 385-396 http://dx.doi.org/10.1108/14691930510611120 Steven Firer, S. Mitchell Williams, (2003),"Intellectual capital and traditional measures of corporate performance", Journal of Intellectual Capital, Vol. 4 Iss 3 pp. 348-360 http:// dx.doi.org/10.1108/14691930310487806 Dimitrios G. Mavridis, (2004),"The intellectual capital performance of the Japanese banking sector", Journal of Intellectual Capital, Vol. 5 Iss 1 pp. 92-115 http://dx.doi.org/10.1108/14691930410512941 Access to this document was granted through an Emerald subscription provided by 568066 [] For Authors If you would like to write for this, or any other Emerald publication, then please use our Emerald for Authors service information about how to choose which publication to write for and submission guidelines are available for all. Please visit www.emeraldinsight.com/authors for more information. About Emerald www.emeraldinsight.com Emerald is a global publisher linking research and practice to the benefit of society. The company manages a portfolio of more than 290 journals and over 2,350 books and book series volumes, as well as providing an extensive range of online products and additional customer resources and services. Emerald is both COUNTER 4 and TRANSFER compliant. The organization is a partner of the Committee on Publication Ethics (COPE) and also works with Portico and the LOCKSS initiative for digital archive preservation. *Related content and download information correct at time of download. Downloaded by PUNJAB TECHNICAL UNIVERSITY At 20:44 04 February 2015 (PT)
Transcript
Journal of Intellectual CapitalThe intellectual capital performance of the Indian banking sectorG. Barathi Kamath
Article information:To cite this document:G. Barathi Kamath, (2007),"The intellectual capital performance of the Indian banking sector", Journal ofIntellectual Capital, Vol. 8 Iss 1 pp. 96 - 123Permanent link to this document:http://dx.doi.org/10.1108/14691930710715088
Downloaded on: 04 February 2015, At: 20:44 (PT)References: this document contains references to 32 other documents.To copy this document: [email protected] fulltext of this document has been downloaded 3971 times since 2007*
Users who downloaded this article also downloaded:Pek Chen Goh, (2005),"Intellectual capital performance of commercial banks in Malaysia", Journal ofIntellectual Capital, Vol. 6 Iss 3 pp. 385-396 http://dx.doi.org/10.1108/14691930510611120Steven Firer, S. Mitchell Williams, (2003),"Intellectual capital and traditional measuresof corporate performance", Journal of Intellectual Capital, Vol. 4 Iss 3 pp. 348-360 http://dx.doi.org/10.1108/14691930310487806Dimitrios G. Mavridis, (2004),"The intellectual capital performance of the Japanese banking sector", Journalof Intellectual Capital, Vol. 5 Iss 1 pp. 92-115 http://dx.doi.org/10.1108/14691930410512941
Access to this document was granted through an Emerald subscription provided by 568066 []
For AuthorsIf you would like to write for this, or any other Emerald publication, then please use our Emerald forAuthors service information about how to choose which publication to write for and submission guidelinesare available for all. Please visit www.emeraldinsight.com/authors for more information.
About Emerald www.emeraldinsight.comEmerald is a global publisher linking research and practice to the benefit of society. The companymanages a portfolio of more than 290 journals and over 2,350 books and book series volumes, as well asproviding an extensive range of online products and additional customer resources and services.
Emerald is both COUNTER 4 and TRANSFER compliant. The organization is a partner of the Committeeon Publication Ethics (COPE) and also works with Portico and the LOCKSS initiative for digital archivepreservation.
*Related content and download information correct at time of download.
The intellectual capitalperformance of Indian banking
sectorG. Barathi Kamath
ICFAI Business School, Nirlon Complex, Goregaon, Mumbai, India
Abstract
Purpose – The paper seeks to estimate and analyze the Value Added Intellectual Coefficient(VAICe) for measuring the value-based performance of the Indian banking sector for a period of fiveyears from 2000 to 2004.
Design/methodology/approach – Annual reports, especially the profit/loss account andbalance-sheet of the banks concerned for the relevant years, were used to obtain the data. A reviewis conducted of the international literature on intellectual capital with specific reference to literaturethat reviews measurement techniques and tools, and the VAICe method is applied in order to analyzethe data of Indian banks for the five-year period. The intellectual or human capital (HC) and physicalcapital (CA) of the Indian banking sector is analysed and their impact on the banks’ value-basedperformance is discussed.
Findings – The study confirms the existence of vast differences in the performance of Indian banksin different segments, and there is also an improvement in the overall performance over the studyperiod. There is an evident bias in favour of the performance of foreign banks compared with domesticbanks.
Research limitations/implications – All 98 scheduled commercial banks are studied as per theinformation provided by the Reserve Bank of India (RBI)/India’s Apex bank. Regional rural banks(RRBs), a segment of the indian banking sector, are not dealt with in the study since their number islarge (more than 200), but they contribute only 3 percent of the market of Indian banks. This paper is alandmark in Indian banking history as it approaches performance measurement with a newdimension.
Practical implications – The paper has strong theoretical foundations, which have a proven recordand applications. The methodology adopted has been research tested. Domestic banks in India areprovided with a new dimension to understand and evaluate their performance and benchmark it withglobal standards. The paper also has policy implications, as it reflects the lop-sided growth of a fewsections in the Indian banking segment.
Originality/value – The paper represents a pioneering and seminal attempt to understand theimplications of the business performance of the Indian banking sector from an intellectual resourceperspective.
Keywords Human capital, Intellectual capital, Business performance, Banks, India
Paper type Research paper
Development of a research propositionThe term “intellectual capital” has been widely used in recent times by the researchcommunity in the developed world; however, there have been very few studies thathave used emerging economies as a case for evaluating the implications of IC forspecific industries. The implications of IC are more prominent in these economies asthey have abundant human capital at their disposal. Therefore, it becomes necessary to
The current issue and full text archive of this journal is available at
www.emeraldinsight.com/1469-1930.htm
JIC8,1
96
Journal of Intellectual CapitalVol. 8 No. 1, 2007pp. 96-123q Emerald Group Publishing Limited1469-1930DOI 10.1108/14691930710715088
Dow
nloa
ded
by P
UN
JAB
TE
CH
NIC
AL
UN
IVE
RSI
TY
At 2
0:44
04
Febr
uary
201
5 (P
T)
understand whether this resource is being efficiently utilized by specific sectors to theiradvantage in creating value over a period of time.
On the one hand, service sectors are playing a dominant, important role in thegrowth of economies, and on the other, these economies are moving towards moreliberalization and globalization. In the changing context of an environment wherecompetitiveness becomes key to survival, are domestic industries geared up to meet thecompetition? Answers to these questions raise an important issue: in the emergingknowledge economy the role of traditional accounting and measurement systems toevaluate performance appears to be diluted and there is a need to look at the wholescenario from a different dimension of evaluating the business performance of firmsthat use IC as an important resource for growth. Using novel methods of measurementand reporting tools becomes imperative.
Banks happen to be one service sector that uses a huge amount of human capitaland customer capital for its survival. Thus, this paper evaluates the businessperformance of the Indian banking system over a period of five years using the ValueAdded Intellectual Coefficiente (VAICe).
Intellectual capitalIn general parlance, intellectual capital (IC) is defined as any creation of the humanintellect or mind. However, several researchers across globe have defined anddelineated specific concepts of IC in their own way (Roos et al., 1997; Stewart, 1997).However, there has been no consensus as to the specific constituents of IC. Intellectualcapital has been defined and classified in several ways by several researchers since theconcept gained importance.
Edvinsson and Malone (1997) defined it as “Knowledge that can be converted tovalue”. Sveiby (1997) first proposed a classification for intellectual capital into threebroad areas of intangibles:
(1) human capital;
(2) structural capital; and
(3) customer capital.
This classification was accepted most and was later modified and extended by Bontis(1996), who replaced customer capital with relational capital.
The next logical aspect is to determine why is it imperative to measure the IC of afirm. The answer is quite simple: it is because both tangible and intangible assets areperceived as potential strategic assets. This resource-based view of the firm, includingthe benefits of both tangible and intangible assets, is gaining acceptance in theaccounting, economic and strategic management literature, following positive resultsof linkages between firms’ resources and measures of performance (Canibano et al.,2000). The inclusion of intangible assets derives from their ability to possess all of thecharacteristics of strategic assets (Godfrey and Hill, 1995).
Various methods have been devised to measure the valuation of IC, ranging fromthe traditional Tobin’s Q method to the Balanced Scorecard approach (Kaplan andNorton, 1996) to the Intangible Asset Score Sheet (Sveiby, 1989) and the latest ValueAdded Intellectual Coefficiente (Pulic, 1998), since the traditional accounting systemwas insufficient to incorporate the new developments. The implementation ofintellectual capital management requires the building a model to function correctly.
The Indianbanking sector
97
Dow
nloa
ded
by P
UN
JAB
TE
CH
NIC
AL
UN
IVE
RSI
TY
At 2
0:44
04
Febr
uary
201
5 (P
T)
There are three different ways of moving ahead to develop a model:
(1) adjusting the conventional methods of accounting to accommodate the newparameters and variables;
(2) retaining traditional accounting and adding new measures to account forintellectual capital; and
(3) abandoning old methods completely and creating a new method.
Today’s discerning investors take a critical look at not only the financial parametersbut also the non-financial parameters that determine the long-term success of acompany. These new non-financial parameters challenge the usefulness of evaluatingcompanies solely on traditional measures as they appear in the financial reports of acompany. Thus, the intangible assets of the company have been receiving considerableattention from all corners of the industry. Besides simply reporting the IC statements italso becomes essential to show the relation between the IC investments made by thefirm with its performance in the long run. Therefore, the absolute increase in value maybe as insufficient as reporting the financial ratios.
The VAICe is a new management and control tool that is designed to enable theorganization to monitor and measure the intellectual capital performance and potentialof the firm. This measurement is necessary as these are considered to be an importantresource in firms in which knowledge or human capital is dominant. Generally,traditional measures of accounting are used to evaluate the business performance ofthese firms. This results in partial or biased communication to stakeholders, who aremore interested in finding the true value and performance of the firm. The wrongconclusions may also result in wrong decisions. Thus, if the intellectual capital beingcreated in the process of business functions is ignored, it may be disastrous for the firmin the long run. The VAICe is considered appropriate for an organization that isintellectually inclined. It can be used within the organization to measure the intellectualperformance over a period of time without much change in the existing business setup.The VAIC method enables the firm to measure its value creation efficiency (Pulic, 2001,2002).
Thus, summarizing the above, the main logic for using VAICe as a tool forperformance measurement is as follows:
. intellectual potential is the most important resource of corporate success,especially in a knowledge economy;
. raising the efficiency of intellectual potential is the simplest, cheapest and mostsecure way to ensure sustainable business success;
. VAICe has proved its suitability as a tool for the measurement of IC; and
. the fact that companies have higher expenditures for intellectual potential thanfor physical capital, and that with VAICe we have found a reliable indicator forIP, are very good reasons to pay higher attention to intellectual potential.
Value creation is considered key to every business activity. However, in recenttimes the efficiency of value creation is more important for success than theabsolute value addition. Intellectual capital is an important resource in this valuecreation process. Thus, measuring it enables the firm to increase its marketperformance.
JIC8,1
98
Dow
nloa
ded
by P
UN
JAB
TE
CH
NIC
AL
UN
IVE
RSI
TY
At 2
0:44
04
Febr
uary
201
5 (P
T)
The banking sector in general is an ideal area for IC research because:. there are reliable data available in the form of published accounts (balance
sheets, P/L);. the business nature of the banking sector is “intellectually” intensive; and. the whole staff is (intellectually) more homogeneous than in other economy
sectors (Kubo and Saka, 2002).
There have been much research on the Indian banking system to evaluate itsperformance on financial parameters as it entered into a new phase of liberalization.However, there have been no studies looking at the intellectual performance of Indianbanks. This paper is therefore a contribution to the existing literature on Indian banksand intellectual capital as its objective is two-fold:
(1) to add a new dimension to measure and evaluate value-based performanceefficiency of firms in service sector, especially banks in India; and
(2) to evaluate the significance of IC in the different economic environment of anemerging economy.
VAICe measurement and performance in the banking sector – a survey ofthe relevant literatureVery few research papers in recent times have aimed at the measurement of IC withspecific reference to the banking sector. Pioneering and exhaustive research by Pulic(2001, 2002) discusses the value creation efficiency analysis of 20 banks in the Croatianeconomy, for a period of five years and comes out with a VAICe ranking of the same.Pulic argues that intellectual capital is still not treated as a resource equal to physicaland financial capital in many service firms, and there is a strong incompatibility of newmeasuring models and the existing accounting system.
The efficiency of the banks is measured using the performance of the capitalemployed and the intellectual capital using VAICe as a tool of measurement. Theefficiency of each bank is measured and then compared with the average performance ofall of the banks. The analysis provides a strong case for reporting of the value creationthrough intellectual capital in the annual reports. The reporting would be a useful tool forbenchmarking the performance of the banks across various countries, besides serving asan absolute measure of performance for each bank within the economy.
An evaluation of the efficiency of the physical capital and intellectual potential ofthe major European banks for the year 1996 was another work that can be noted in thiscontext (Pulic, 1998). The results of the study indicate that intellectual potential is ofcrucial importance for corporate success, and therefore the obvious conclusion arisesthat increasing the efficiency of intellectual potential is the simplest, cheapest and mostsecure way to ensure sustainable business success. A similar study was conductedfocusing on how New Zealand banks incur a cost in acquiring IC (human capital) andtheir need to recognise the important cost drivers. The study produced a model inaccounting for IC in New Zealand banks (Sahrawat, 2001).
The Indianbanking sector
99
Dow
nloa
ded
by P
UN
JAB
TE
CH
NIC
AL
UN
IVE
RSI
TY
At 2
0:44
04
Febr
uary
201
5 (P
T)
Indian bankingStructureThe banking system in India has three tiers (see Figure 1). These are:
(1) the scheduled commercial banks;
(2) the regional rural banks (RRBs), which operate in rural areas not covered by thescheduled banks; and
(3) the cooperative and special purpose rural banks.
The present study deals only with the first set of banks, which number 98. A detailedbreak-down of these banks is shown in Table I. Also see Appendix, Table AI.
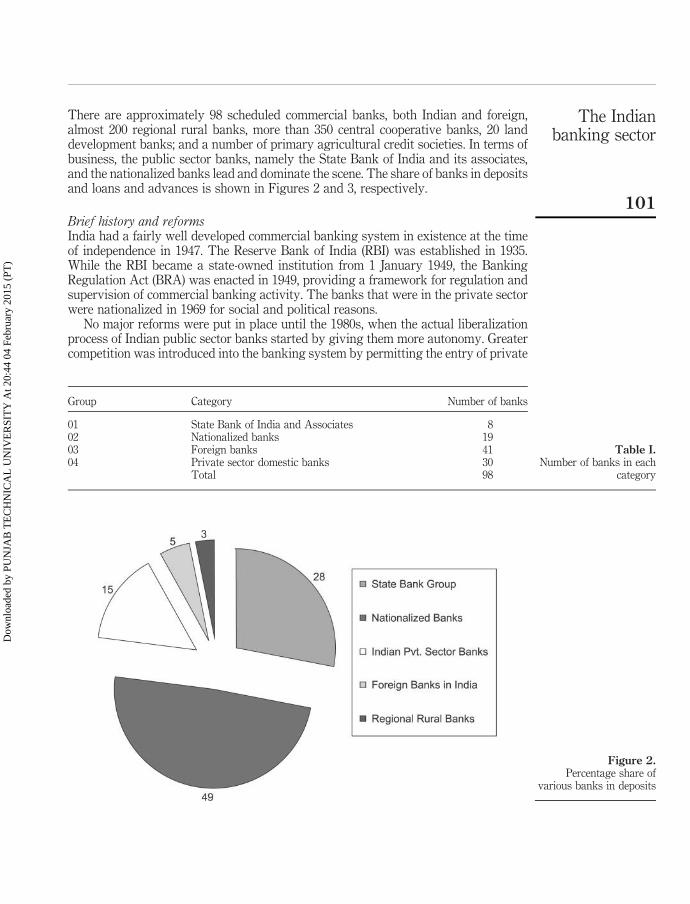
There are approximately 98 scheduled commercial banks, both Indian and foreign,almost 200 regional rural banks, more than 350 central cooperative banks, 20 landdevelopment banks; and a number of primary agricultural credit societies. In terms ofbusiness, the public sector banks, namely the State Bank of India and its associates,and the nationalized banks lead and dominate the scene. The share of banks in depositsand loans and advances is shown in Figures 2 and 3, respectively.
Brief history and reformsIndia had a fairly well developed commercial banking system in existence at the timeof independence in 1947. The Reserve Bank of India (RBI) was established in 1935.While the RBI became a state-owned institution from 1 January 1949, the BankingRegulation Act (BRA) was enacted in 1949, providing a framework for regulation andsupervision of commercial banking activity. The banks that were in the private sectorwere nationalized in 1969 for social and political reasons.
No major reforms were put in place until the 1980s, when the actual liberalizationprocess of Indian public sector banks started by giving them more autonomy. Greatercompetition was introduced into the banking system by permitting the entry of private
Figure 2.Percentage share of
various banks in deposits
Group Category Number of banks
01 State Bank of India and Associates 802 Nationalized banks 1903 Foreign banks 4104 Private sector domestic banks 30
sector banks, liberal licensing of more branches by foreign banks, and the entry of newforeign banks. With the development of a multi-institutional structure in the financialsector, the emphasis is on efficiency through competition, irrespective of ownership.Since non-bank intermediation has increased, banks have had to improve theirefficiency to ensure their survival.
Regulatory aspectsIndian banks were completely under the regulation of the BRA 1949, which was quiterestrictive in several aspects of growth and performance is concerned. One aspect wasthat there were social obligations such as the generation of employment and setting upbranch networks in financially unviable and rural areas, which the public sector bankstook up over a period for the faster growth of banking over the period afterindependence. This led to unsustainable development of banks in the long run,especially in today’s competitive economy. Another aspect is the domination of publicsector banks over private sector banks in the pre-liberalization phase. The controlledand protected economic environment had its costs for the Indian banking structureover a period (see www.iba.org).
However, prudent regulation and supervision have formed a critical component ofthe financial sector reform programme since its inception, and India has endeavouredtowards international prudent norms and practices. These norms have beenprogressively tightened over the years, particularly against the backdrop of theAsian crisis. Banks’ exposure to sensitive sectors such as equity and real estate havebeen curtailed.
The system of Annual Financial Inspection was introduced in 1992, in place of theearlier system of Annual Financial Review/Financial Inspections. The inspectionobjectives and procedures have been redefined to evaluate the bank’s safety andsoundness, to appraise the quality of the board and management, to ensure compliancewith banking laws and regulations, to provide an appraisal of soundness of the bank’s
Figure 3.Percentage share ofvarious banks in loans andadvances
assets, to analyze the financial factors that determine a bank’s solvency and to identifyareas where corrective action is needed to strengthen the institution and improve itsperformance.
India has had the distinction of experimenting with Self Regulatory Organizations(SROs) in the financial system since pre-independence days. At present, there are fourSROs in the financial system:
(1) the Indian Banks’ Association (IBA);
(2) the Foreign Exchange Dealers Association of India (FEDAI);
(3) the Primary Dealers Association of India (PDAI); and
(4) the Fixed Income Money Market Dealers Association of India (FIMMDAI).
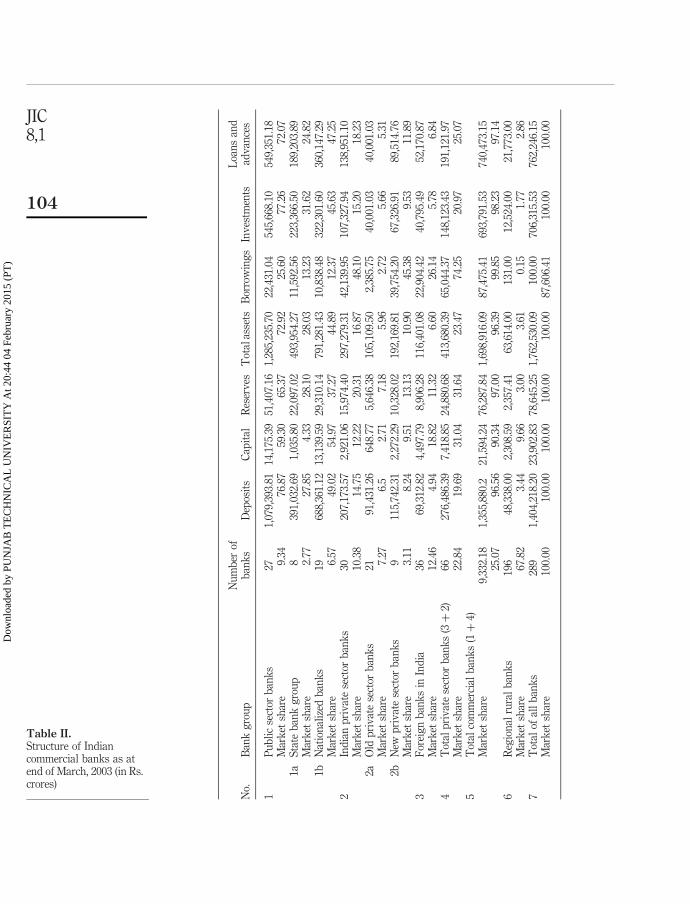
Present and future scenarioThe structure of the banking sector in India, using broad parameters, the classificationand contribution of each group of banks towards loans and advances, assets, liabilities,profits, income, expenditure and the respective market share of each section is shownin Table II. Indian banks have seen a huge growth over the years, especially after theopening up of the sector to external participation. The Indian Banks’ Association (IBA)has set up a proposal about how they visualize the Indian banking sector at the end ofthis decade. The vision statement in summary is presented in Table III.
Since the liberalization phase of the Indian economy began in the mid-1980s, thebanking sector has also seen growth along with the economy. There have been severalchanges in the banking policies and regulatory environment, which has led banks toperform better than before. There was marked stability and a positive rate of growtheven during the East Asian financial crisis. In the present scenario, banks are gearingup well to adapt to the norms of BASEL-II set up by the Basel Committee on BankingSupervision. Banks in India are more prone to the market now than ever before. Thus,looking at performance efficiency becomes even more compelling.
Looking at all the above aspects, and the fact that India is an emerging economy, theimportance of utilizing limited financial and physical resources becomes even morepressing than in a developed economy. Although there is a surplus of human capital interms of absolute numbers, skilled and professional human capital are limited inrelative terms. Therefore, efficiency analysis becomes important to evaluate theperformance of the key resources of the economy. An efficient economy is a collectionof efficient sectors, industry and firms. This boils the argument down to the fact that ifeach sector/industry/firm performs efficiently then economic resources would be usedeconomically. Such efficiency analysis would also enable efficient allocation andutilization of resources over long run; this implies that it would have policyimplications for the policy-makers. Being resource rich gets a new meaning whenknowledge of people turns into value for the organization (Sveiby, 2002).
Survey descriptionObjective of the studyThe major objective of this paper is to estimate and evaluate the VAICe for Indianbanks for a five-year period from 2000 to 2005. The evaluation is done on the basis ofthe ranking obtained by each bank in the VAICe index estimated and then on thebasis of the regression analysis conducted in the paper.
The Indianbanking sector
103
Dow
nloa
ded
by P
UN
JAB
TE
CH
NIC
AL
UN
IVE
RSI
TY
At 2
0:44
04
Febr
uary
201
5 (P
T)
No.
Ban
kg
rou
pN
um
ber
ofb
ank
sD
epos
its
Cap
ital
Res
erv
esT
otal
asse
tsB
orro
win
gs
Inv
estm
ents
Loa
ns
and
adv
ance
s
1P
ub
lic
sect
orb
ank
s27
1,07
9,39
3.81
14,1
75.3
951
,407
.16
1,28
5,23
5.70
22,4
31.0
454
5,66
8.10
549,
351.
18M
ark
etsh
are
9.34
76.8
759
.30
65.3
772
.92
25.6
077
.26
72.0
71a
Sta
teb
ank
gro
up
839
1,03
2.69
1,03
5.80
22,0
97.0
249
3,95
4.27
11,5
92.5
622
3,36
6.50
189,
203.
89M
ark
etsh
are
2.77
27.8
54.
3328
.10
28.0
313
.23
31.6
224
.82
1bN
atio
nal
ized
ban
ks
1968
8,36
1.12
13,1
39.5
929
,310
.14
791,
281.
4310
,838
.48
322,
301.
6036
0,14
7.29
Mar
ket
shar
e6.
5749
.02
54.9
737
.27
44.8
912
.37
45.6
347
.25
2In
dia
np
riv
ate
sect
orb
ank
s30
207,
173.
572,
921.
0615
,974
.40
297,
279.
3142
,139
.95
107,
327.
9413
8,95
1.10
Mar
ket
shar
e10
.38
14.7
512
.22
20.3
116
.87
48.1
015
.20
18.2
32a
Old
pri
vat
ese
ctor
ban
ks
2191
,431
.26
648.
775,
646.
3810
5,10
9.50
2,38
5.75
40,0
01.0
340
,001
.03
Mar
ket
shar
e7.
276.
52.
717.
185.
962.
725.
665.
312b
New
pri
vat
ese
ctor
ban
ks
911
5,74
2.31
2,27
2.29
10,3
28.0
219
2,16
9.81
39,7
54.2
067
,326
.91
89,5
14.7
6M
ark
etsh
are
3.11
8.24
9.51
13.1
310
.90
45.3
89.
5311
.89
3F
orei
gn
ban
ks
inIn
dia
3669
,312
.82
4,49
7.79
8,90
6.28
116,
401.
0822
,904
.42
40,7
95.4
952
,170
.87
Mar
ket
shar
e12
.46
4.94
18.8
211
.32
6.60
26.1
45.
786.
844
Tot
alp
riv
ate
sect
orb
ank
s(3þ
2)66
276,
486.
397,
418.
8524
,880
.68
413,
680.
3965
,044
.37
148,
123.
4319
1,12
1.97
Mar
ket
shar
e22
.84
19.6
931
.04
31.6
423
.47
74.2
520
.97
25.0
75
Tot
alco
mm
erci
alb
ank
s(1þ
4)M
ark
etsh
are
9,33
2.18
1,35
5,88
0.2
21,5
94.2
476
,287
.84
1,69
8,91
6.09
87,4
75.4
169
3,79
1.53
740,
473.
1525
.07
96.5
690
.34
97.0
096
.39
99.8
598
.23
97.1
46
Reg
ion
alru
ral
ban
ks
196
48,3
38.0
02,
308.
592,
357.
4163
,614
.00
131.
0012
,524
.00
21,7
73.0
0M
ark
etsh
are
67.8
23.
449.
663.
003.
610.
151.
772.
867
Tot
alof
all
ban
ks
289
1,40
4,21
8.20
23,9
02.8
378
,645
.25
1,76
2,53
0.09
100.
0070
6,31
5.53
762,
246.
15M
ark
etsh
are
100.
0010
0.00
100.
0010
0.00
100.
0087
,606
.41
100.
0010
0.00
Table II.Structure of Indiancommercial banks as atend of March, 2003 (in Rs.crores)
JIC8,1
104
Dow
nloa
ded
by P
UN
JAB
TE
CH
NIC
AL
UN
IVE
RSI
TY
At 2
0:44
04
Febr
uary
201
5 (P
T)
Data sourcesThe data for the paper is mainly collected from secondary sources. The data isavailable in the balance sheets and profit/loss accounts of the banks concerned; thisdata is compiled and published by the Reserve Bank of India (RBI) in a consolidatedmanner in its annual statistics on Indian banking. Thus, the data for the paper wascollected from the RBI website (see www.rbi.org.in) directly.
MethodologyThe data collected from the secondary sources is treated to derive the VAICe for allbanks’ average, the group average, and each bank separately. Besides this a regressionis run to find the coefficients and also to find the linear best fit.
Phase I: deriving VAICe – steps involved.
. Output (OUT) – The total of all income/revenue generated during the fiscal yearby an organization by selling its goods or services.
. Input (IN) – All the costs that is incurred by the organization towards purchaseof inputs for operating and continuing the business. Here, the employees’compensation and other costs incurred on them for training and development
Notes: GDP at factor cost 2001-2002: Rs. 20,80,255 crores; GDP at market price 2001-2002: Rs.22,88,281 crores; GDP (2001-2002 prices) 2006-2007: Rs. 30,47,183 crores; Market prices 2006-2007: Rs.33,73,879 crores; GDP at current market prices in 2009-2010: Rs. 61,40,000 crores; 1 crores ¼ 10million; aIndian Banks’ Association (1987/8); bReserve Bank of India (2003)
Table III.Macro magnitudes of
Indian banking sectorvisualized for the year
2010 (In Rs. “000 crores)
The Indianbanking sector
105
Dow
nloa
ded
by P
UN
JAB
TE
CH
NIC
AL
UN
IVE
RSI
TY
At 2
0:44
04
Febr
uary
201
5 (P
T)
would be deducted from total expenses for the simple reason that they would betreated as investment and not expenditure.
. Value Added (VA) – The difference between the Output and Input is the valuecreated by the organization during the particular financial year:
VA ¼ OUT 2 IN:
. Human Capital (HC) – All the expenses on compensation and development ofemployees.
. Capital Employed (CE) – All the physical and material assets of theorganization.
. Capital Employed Efficiency (CEE) – Ratio of VA to CE. This ratio gives thecontribution made by every unit of capital employed to the value added in theorganization:
CEE ¼ VA=CE:
. Human Capital Efficiency (HCE) – Ratio of VA to HC. This ratio gives thecontribution made by every unit of money invested in human capital to the valueadded in the organization:
HCE ¼ VA=HC:
. Value Added Intellectual Coefficient (VAIC) – Indicates the intellectual ability ofthe organization. It is the sum of the HCE and the CEE, and this also measuresthe intellectual capability of the organization. It can also be denoted as BPI or theBusiness Performance Indicator.
VAIC ðBPIÞ ¼ HCE þ CEE:
Phase II. Since the value added in any organization would be a function of the capitalemployed and also the intellectual capital invested, two regressions are run using theVA as the dependent variable in both and CE as the independent variable in one andHC as the independent variable in the other:
VA ¼ f ðCEÞ; ð1Þ
VA ¼ f ðHCÞ: ð2Þ
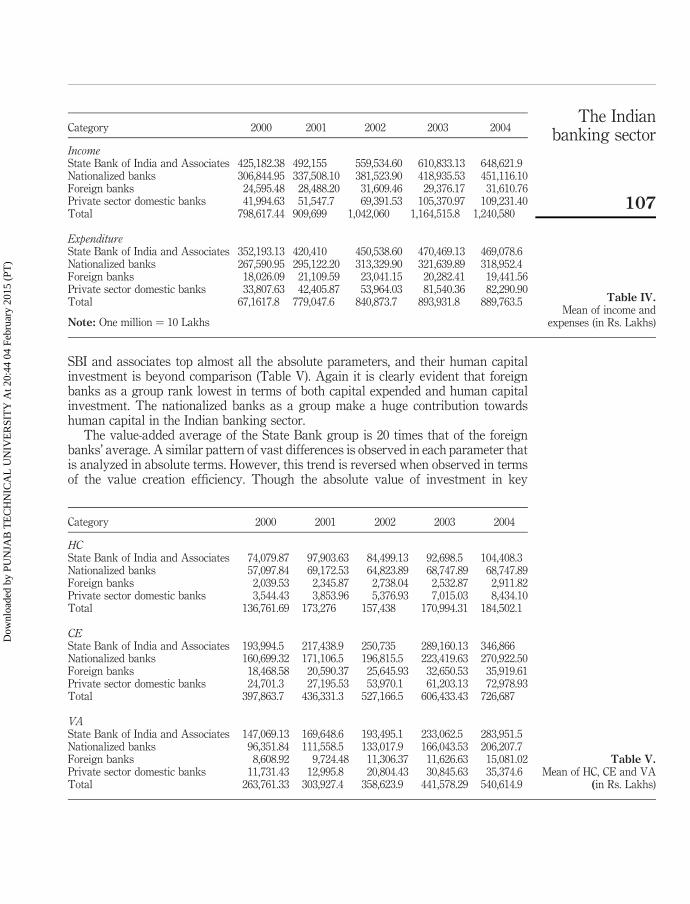
Survey resultsDescriptive statisticsThe mean for each bank group of each variable is analyzed regarding which groupdominates in which area (Table IV). As far as income and expenditure is concerned, theState Bank group dominates, and it can be clearly seen that the nationalized andforeign banks follow SBI. However, one evident aspect is that in terms of theexpenditure of the foreign banks, this group, though huge in number, makes the leastexpenditure of all.
JIC8,1
106
Dow
nloa
ded
by P
UN
JAB
TE
CH
NIC
AL
UN
IVE
RSI
TY
At 2
0:44
04
Febr
uary
201
5 (P
T)
SBI and associates top almost all the absolute parameters, and their human capitalinvestment is beyond comparison (Table V). Again it is clearly evident that foreignbanks as a group rank lowest in terms of both capital expended and human capitalinvestment. The nationalized banks as a group make a huge contribution towardshuman capital in the Indian banking sector.
The value-added average of the State Bank group is 20 times that of the foreignbanks’ average. A similar pattern of vast differences is observed in each parameter thatis analyzed in absolute terms. However, this trend is reversed when observed in termsof the value creation efficiency. Though the absolute value of investment in key
Category 2000 2001 2002 2003 2004
IncomeState Bank of India and Associates 425,182.38 492,155 559,534.60 610,833.13 648,621.9Nationalized banks 306,844.95 337,508.10 381,523.90 418,935.53 451,116.10Foreign banks 24,595.48 28,488.20 31,609.46 29,376.17 31,610.76Private sector domestic banks 41,994.63 51,547.7 69,391.53 105,370.97 109,231.40Total 798,617.44 909,699 1,042,060 1,164,515.8 1,240,580
ExpenditureState Bank of India and Associates 352,193.13 420,410 450,538.60 470,469.13 469,078.6Nationalized banks 267,590.95 295,122.20 313,329.90 321,639.89 318,952.4Foreign banks 18,026.09 21,109.59 23,041.15 20,282.41 19,441.56Private sector domestic banks 33,807.63 42,405.87 53,964.03 81,540.36 82,290.90Total 67,1617.8 779,047.6 840,873.7 893,931.8 889,763.5
Note: One million ¼ 10 Lakhs
Table IV.Mean of income and
expenses (in Rs. Lakhs)
Category 2000 2001 2002 2003 2004
HCState Bank of India and Associates 74,079.87 97,903.63 84,499.13 92,698.5 104,408.3Nationalized banks 57,097.84 69,172.53 64,823.89 68,747.89 68,747.89Foreign banks 2,039.53 2,345.87 2,738.04 2,532.87 2,911.82Private sector domestic banks 3,544.43 3,853.96 5,376.93 7,015.03 8,434.10Total 136,761.69 173,276 157,438 170,994.31 184,502.1
CEState Bank of India and Associates 193,994.5 217,438.9 250,735 289,160.13 346,866Nationalized banks 160,699.32 171,106.5 196,815.5 223,419.63 270,922.50Foreign banks 18,468.58 20,590.37 25,645.93 32,650.53 35,919.61Private sector domestic banks 24,701.3 27,195.53 53,970.1 61,203.13 72,978.93Total 397,863.7 436,331.3 527,166.5 606,433.43 726,687
VAState Bank of India and Associates 147,069.13 169,648.6 193,495.1 233,062.5 283,951.5Nationalized banks 96,351.84 111,558.5 133,017.9 166,043.53 206,207.7Foreign banks 8,608.92 9,724.48 11,306.37 11,626.63 15,081.02Private sector domestic banks 11,731.43 12,995.8 20,804.43 30,845.63 35,374.6Total 263,761.33 303,927.4 358,623.9 441,578.29 540,614.9
Table V.Mean of HC, CE and VA
(in Rs. Lakhs)
The Indianbanking sector
107
Dow
nloa
ded
by P
UN
JAB
TE
CH
NIC
AL
UN
IVE
RSI
TY
At 2
0:44
04
Febr
uary
201
5 (P
T)
resources is much lower in foreign banks as compared with public sector banks, theefficiency of utilization (Table VI) of these resources is much higher on average inforeign banks, especially in the case of Human Capital Efficiency. In the case of CapitalEmployed Efficiency, the average figures of public sector banks are much higher,indicating a performance that is better than foreign banks on this front. Thus it canclearly be concluded that to meet the social obligations of employment generation forthe Indian population, these banks invested a huge amount in Human Capital, whichcould not increase or contribute much to value creation efficiency.
It is necessary to determine whether the variables used in the survey are reliable forinferences. Therefore, the regression results are analyzed first. The results are shownin Tables VII-XI separately for each group of banks and all banks. The variables ValueAdded (VA), Capital Employed (CE) and Human Capital (HC) are taken for analysis.
Category 2000 2001 2002 2003 2004
VACEState Bank of India and Associates 0.9378131 0.937591 0.921024 0.9116591 0.91089Nationalized banks 0.6954162 0.717644 0.753147 0.8375467 0.82608Foreign banks 0.2521022 0.23859 0.234448 0.1862473 0.190258Private sector domestic banks 0.5734892 0.549013 0.655596 0.5907278 0.534706Mean 0.614705 0.61071 0.641054 0.631545 0.615484
VAHCState Bank of India and Associates 2.0990422 1.921955 2.617717 2.9416885 3.439101Nationalized banks 1.7812175 1.679487 2.156315 2.5002188 2.891638Foreign banks 3.9874596 3.74986 3.728277 3.8283093 4.014788Private sector domestic banks 4.3813746 3.604235 4.000491 3.7759414 3.644457Mean 3.062273 2.738884 3.1257 3.26154 3.497496
VAICState Bank of India and Associates 3.0368553 2.859547 3.538742 3.8533476 4.349991Nationalized banks 2.4766338 2.397131 2.909462 3.3377655 3.717718Foreign banks 4.2395618 3.98845 3.962726 4.0145566 4.205046Private sector domestic banks 4.9548638 4.153247 4.656087 4.3666692 4.179163Mean 3.676979 3.349594 3.766754 3.893085 4.11298
Table VI.Mean of VACE, VAHCand VAIC
2000 2001 2002 2003 2004
CE and VASlope 0.67 0.71 0.63 0.71 0.72Intercept 23,744.69 24,826.21 21,681.89 24,584.29 25,271.72R 2 0.94 0.95 0.86 0.92 0.93
HC and VASlope 1.85 1.64 2.12 2.37 2.53Intercept 2,536.05 4,960.07 5,437.66 8,472.65 12,722.00R 2 0.98 0.98 0.98 0.96 0.97
The coefficient of determination (R 2) is seen to be very strong in all cases except in thecase of nationalized banks and private sector domestic banks. In the case ofnationalized banks there seems to be a weak link between capital employed and valueadded. The same is true of capital employed and human capital in the case of privatedomestic sector banks. The fit is seen to be good for all the years of analysis.
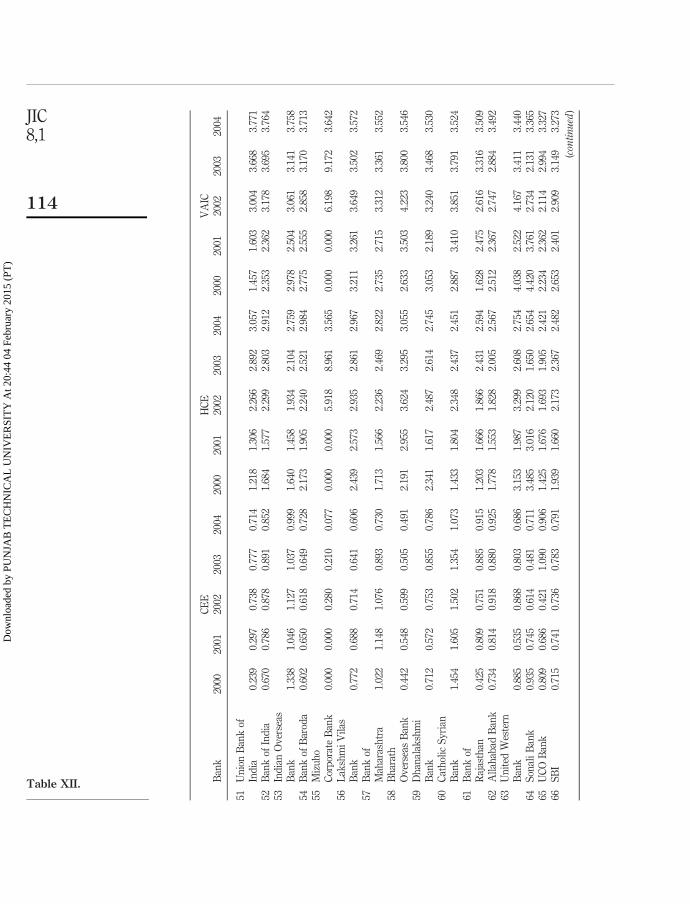
Survey analysisThe ranking of the banks on the basis of VAICe for the year 2004 is given in Table XII.
2000 2001 2002 2003 2004
CE and VASlope 0.39 0.52 0.46 0.49 0.60Intercept 33,320.08 21,854.77 42,236.67 56,829.66 43,171.39R 2 0.42 0.54 0.49 0.53 0.65
HC and VASlope 1.60 1.63 1.98 2.34 2.71Intercept 4,819.08 21,209.17 4,723.19 5,392.47 5,243.84R 2 0.86 0.90 0.83 0.84 0.86
Table IX.Regression results –
nationalized banks
2000 2001 2002 2003 2004
CE and VASlope 0.71 0.73 0.73 0.78 0.78Intercept 10091.63 10149.69 10984.07 8327.02 11778.48R 2 1.00 1.00 1.00 1.00 1.00
HC and VASlope 1.93 1.65 2.15 2.34 2.44Intercept 4,130.388017 8,477.7576 11,778.646 16,298.68599 29,591.793R 2 1.00 1.00 1.00 1.00 1.00
Table VIII.Regression results – SBI
and Associates
2000 2001 2002 2003 2004
CE and VASlope 0.58 0.59 0.58 0.43 0.53Intercept 22,067.06461 22,326.2026 23,586.7859 22,416.29155 23,824.0818R 2 0.98 0.97 0.97 0.95 0.96
HC and VASlope 4.29 4.01 4.23 4.75 5.53Intercept 2136.78 315.44 2288.52 2400.93 21,019.65R 2 0.91 0.86 0.81 0.83 0.92
Table X.Regression results –
foreign banks
The Indianbanking sector
109
Dow
nloa
ded
by P
UN
JAB
TE
CH
NIC
AL
UN
IVE
RSI
TY
At 2
0:44
04
Febr
uary
201
5 (P
T)
Each bank’s results are sorted on the basis of VAICe performance, classified asfollows:
. top performers – VAICe score of above 5;
. good performers – VAICe score of between 4 and 5;
. common performers – VAICe score of between 2.5 and 4; and
. bad performers – VAICe score of below 2.5.
It can be seen that there are very few BANKS from THE Indian private sector amongthe top performers.
Foreign banks claim the top slots, the main reason being their low penetration in themarket and meagre investments and high-technology intensity. This can also be seenfrom the nation’s perspective that foreign banks are low employment generators.
Best performers in the surveyThe best performers in the survey are as follows:
(1) State Bank of Mauritius;
(2) Arab Bangladesh Bank;
(3) Indusind Bank;
(4) State Bank of Ceylon;
(5) SBI Commercial and International Bank;
(6) Deutsche Bank;
(7) Cho Hung Bank;
(8) Standard Chartered Bank;
(9) Barclay’s Bank; and
(10) UEJ Bank.
Best domestic performersThe best performers in the survey are as follows:
(1) UTI Bank;
(2) Bank of Punjab;
2000 2001 2002 2003 2004
CE and VASlope 0.30 0.35 0.11 0.40 0.36Intercept 4,352.65 3,527.77 14,844.88 6,149.85 9,402.90R 2 0.70 0.78 0.48 0.98 0.95
HC and VASlope 1.83 2.83 3.76 6.43 5.22Intercept 5,259.61 2,090.85 581.22 214,263.54 28,690.36R 2 0.37 0.55 0.72 0.87 0.93
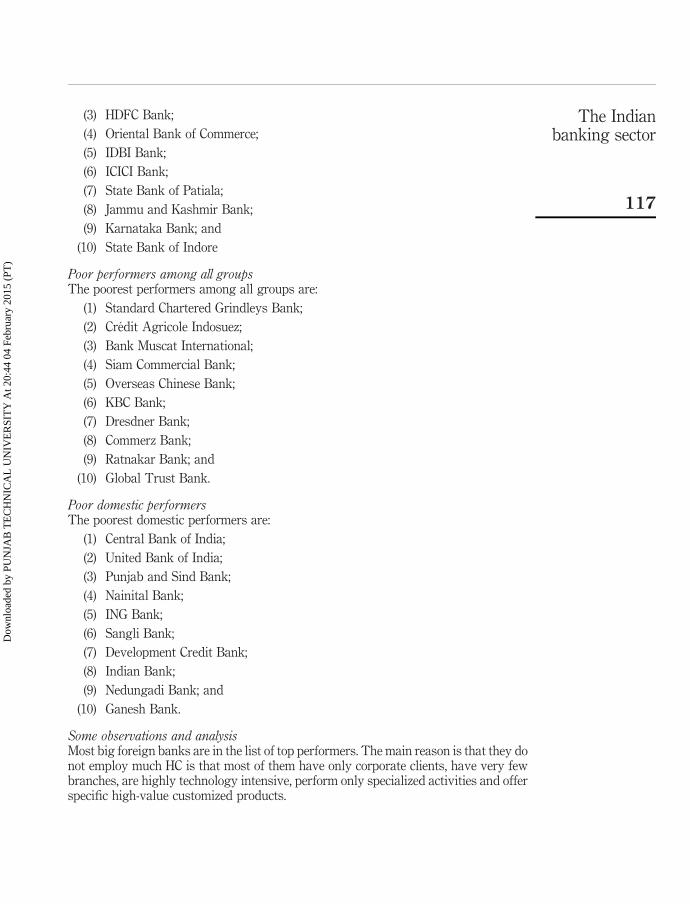
Some observations and analysisMost big foreign banks are in the list of top performers. The main reason is that they donot employ much HC is that most of them have only corporate clients, have very fewbranches, are highly technology intensive, perform only specialized activities and offerspecific high-value customized products.
The Indianbanking sector
117
Dow
nloa
ded
by P
UN
JAB
TE
CH
NIC
AL
UN
IVE
RSI
TY
At 2
0:44
04
Febr
uary
201
5 (P
T)
Only one public sector bank is in the top domestic performers list. Some importantreasons for the poor performance of the public sector are high infrastructure costs, highsocial obligations, a huge work force, poor image, low efficiency, and poor usage oftechnology.
Among the poor performers, most are foreign banks, indicating that long-termsustainability for them is difficult. There are clear indications of poor performanceduring the period of study, and most of them are no longer functional now, havingmerged or been liquidated or closed down.
Most of the poor domestic performers are public sector and weak private sectorbanks. The reasons for this are a poor customer base, huge non-performing assets,incorrect allocation of resources, huge employee costs, unplanned growth and badinvestment decisions.
It can be clearly observed that most public sector banks are average performers onthe intellectual scale, mainly because of their heavy investment in HC over a period.
Justifications/limitationsThe findings of the present study are subject to some limitations that provideinitiatives for future research. The present study, for example, focuses on scheduledcommercial banks only from one single domestic setting of India. Banking in anyeconomy is underpinned by cultural concerns and the legal system and practices.Therefore, the findings may not be generalizable. Further research in this area could beextended to alternative domestic settings and also to alternate industries in bothmanufacturing and service-oriented settings. Also, the parameters for evaluatingintellectual capital performance are not exhaustive. Future research should fullyexplore the impact of other characteristics of IC and their association with performanceand market behaviour to gather a complete picture of the impact of this dimension.This study is cross-sectional and also time series in nature, but in a limited way as itdeals with only data from only six years. Future research may wish to focus onexamining the association of independent variables covered in this study andperformance for a detailed analysis across a longer time period, dividing it into variousphases and also analyzing trends across industries. Finally, the findings areconstrained by the validity and reliability of the method and data used. Future studiesshould seek to re-test the instrument across alternative socio-political and economicsettings both to test its validity and/or make refinements. In addition, the methodologyused in this study may also be refined in future research to provide further insights.
Need/importance of this paperDespite its limitations, the present study makes several unique contributions. This isthe first attempt of its kind to analyze the performance of Indian banks from thealtogether different perspective of intellectual capital. Second, empirical analysisprovides one of the initial frameworks for analyzing the factors of IC that mayinfluence the business performance of banks in a competitive environment. This isagain a fresh contribution to the existing literature on IC. Finally, the present studyextends the IC practices of the developed world to an emerging economy context andvalidates their importance in the current globalized, scenario thus exploring a newemerging area of interest.
Overall, the findings from the present study have implications for numerous partiessuch as policy makers, regulators, shareholders and management of those specific
JIC8,1
118
Dow
nloa
ded
by P
UN
JAB
TE
CH
NIC
AL
UN
IVE
RSI
TY
At 2
0:44
04
Febr
uary
201
5 (P
T)
banks that in general find their performance of IC below par. This may result in abetter allocation of resources in those organizations. Such features are importantconcerns that need to be factored into in decision-making processes and setting policiesat both national and international levels.
Concluding remarksThe Reserve Bank of India, which is the apex bank, heads the Indian commercialbanks. The largest group of banks is the State Bank group: it dominates in the marketon several parameters discussed in the paper. Other banks, such as foreign banks,domestic private sector banks and regional rural banks, form the broad structure ofIndian banking.
The paper uses VAICe as a tool to measure the IC performance of Indian banks fora five-year period. This is taken as the basic methodology adopted in the paper.Besides this, a simple regression is run to find the adequacy of the variables for theirpredictive powers. The results indicated a perfect fit of both the independent variableswith the dependent variable over the period of study.
The survey results showed that the overall top performers in HCE are clearly theforeign banks. However, the top performers in CEE were the public sector banks. Theoverall top performers in the value creation efficiency analysis were the foreign banks.The public sector banks in India seem to have created the huge baggage of a large andinefficient work force, which is not contributing anything to overall value creation.
Thus, it can be concluded that there are vast differences in the intellectual and valuecreation performance of the Indian banking sector. This paper can be used as abenchmark for evaluating the true performance of banks in India in the emergingcompetitive environment. The paper looks at the performance of Indian banks from aninnovative perspective. This can be taken as a base for further such research in thesame or other service sectors.
References
Bontis, N. (1996), “There’s a price on your head: managing intellectual capital strategically”,Business Quarterly, Vol. Summer, pp. 40-7.
Canibano, L., Garcia-Ayuso, M. and Sanchez, P. (2000), “Accounting for intangibles: a literaturereview”, Journal of Accounting Literature, Vol. 19, pp. 102-30.
Edvinsson, L. and Malone, M. (1997), Intellectual Capital, HarperBusiness, New York, NY.
Godfrey, P.C. and Hill, C.W.L. (1995), “The problem with unobservables in strategic managementresearch”, Strategic Management Journal, Vol. 13 No. 2, pp. 135-44.
Indian Banks’ Association (1987/8), Data Base on Indian Banking, Mumbai.
Kaplan, R.S. and Norton, D.P. (1996), “Using the Balanced Scorecard as a strategic managementsystem”, Harvard Business Review, January/February, pp. 75-85.
Kubo, I. and Saka, A. (2002), “An inquiry into the motivations of knowledge workers in theJapanese financial industry”, Journal of Knowledge Management, Vol. 6 No. 3, pp. 262-71.
Pulic, A. (1998), “Measuring the performance of intellectual potential in the knowledge economy”,available at: www.measuring-ip.at
Pulic, A. (2001), “Value creation efficiency analysis of Croatian banks, 1996-2000”, available at:www.vaic-on.net
Pulic, A. (2002), “Are we creating or destroying value?”, available at: www.vaic-on.net
Reserve Bank of India (2003), Report on Trend and Progress of Banking in India 2002-03,Reserve Bank of India, Mumbai.
Roos, G., Roos, J., Edvinsson, L. and Dragonetti, N.C. (1997), Intellectual Capital – Navigating inthe New Business Landscape, New York University Press, New York, NY.
Sahrawat, K. (2001), “Estimating the value of intellectual capital in the service industry – NewZealand Banks”, available at: http://aux.zicklin.baruch.cuny.edu/critical/html2/8037sahrawat.html.
Stewart, T.A. (1997), Intellectual Capital: The New Wealth of Organizations, Doubleday, NewYork, NY.
Sveiby, K.-E. (1989), The Invisible Balance Sheet, Ledarskap, Stockholm.
Sveiby, K.-E. (1997), “The Intangible Assets Monitor”, Journal of Human Resource Costing andAccounting, Vol. 2 No. 1, pp. 73-97.
Sveiby, K.-E. (2002), “Efficiency of Croatian economy”, International Business EfficiencyConsulting, LLC.
Further reading
Bontis, N. (1998), “Intellectual capital: an exploratory study that develops measures and models”,Management Decision, Vol. 36 No. 2, pp. 63-76.
Bontis, N. (2001), “Assessing knowledge assets: a review of the models used to measureintellectual capital”, International Journal of Management Reviews, Vol. 3 No. 1, pp. 41-60.
Bontis, N., Dragonetti, N.C., Jacobsen, K. and Roos, G. (1999), “The knowledge toolbox: a reviewof the tools available to measure and manage intangible resources”, EuropeanManagement Journal, Vol. 17 No. 4, pp. 391-401.
Celemi Monitor (1999), “Celemi’s Annual Report”, available at: www.celemi.com
Cooper, R. and Kaplan, R.S. (1988), “Measure cost right: make the right decisions”, HarvardBusiness Review, September/October, pp. 96-102.
Harrison, S. and Sullivan, P. (2000), “Profiting from intellectual capital: learning from leadingcompanies”, Journal of Intellectual Capital, Vol. 1 No. 1, pp. 33-46.
Huseman, R. and Goodman, J. (1999), Leading with Knowledge, Sage Publications, London.
Indian Banks’ Association (2005), IBA Monthly Bulletin, June, available at: www.iba.org
Intellectual Capital Research Centre (2005), available at: www.measuring-ip.at (accessed May2005).
International Federation of Accountants (1998), Measurement and Management of IntellectualCapital, International Federation of Accountants, New York, NY.
Lev, B. (2001), Intangibles: Management, Measurement and Reporting, Brookings InstitutionPress, San Francisco, CA.
Lev, B. and Schwartz, A. (1971), “On the use of the economic concept of human capital infinancial statements”, The Accounting Review, Vol. 44, pp. 103-10.
Luthy, D.H. (1998), “Intellectual capital and its measurement”, available at: www3.bus.osaka-cu.ac.jp/apira98/archives/htmls/25.htm (accessed May 2005).
Skandia (1994), Intellectual Capital Report, Skandia, Stockholm.
Williams, S.M. (2000), “Is intellectual capital performance and disclosure practice related?”,Journal of Intellectual Capital, Vol. 2 No. 3, pp. 192-203.
1 State Bank of India 12 State Bank of Bikaner 13 State Bank of Hyderabad 14 State Bank of Indore 15 State Bank of Mysore 16 State Bank of Patiala 17 State Bank of Saurashtra 18 State Bank of Travancore 19 Allahabad Bank 2
10 Andhra Bank 211 Bank of Baroda 212 Bank of India 213 Bank of Maharashtra 214 Canara Bank 215 Central Bank of India 216 Corporation Bank 217 Dena Bank 218 Indian Bank 219 Indian Overseas Bank 220 Oriental Bank of Commerce 221 Punjab & Sind Bank 222 Punjab National Bank 223 Syndicate Bank 224 UCO Bank 225 Union Bank of India 226 United Bank of India 227 Vijaya Bank 228 ABN Amro Bank 329 Abu-Dhabi Commercial Bank 330 American Express Bank 331 Antwerp Diamond Bank 332 Arab Bangladesh Bank 333 Bank International Indonesia 334 Bank Muscat International 335 Bank of America 336 Bank of Bahrain & Kuwait 337 Bank of Ceylon 338 Bank of Nova Scotia 339 Bank of Tokyo Mitsubishi 340 Barclays Bank 341 BNP Paribas 342 Chinatrust Commercial Bank 343 Cho Hung Bank 344 Citibank 345 Commerz Bank 346 Credit Agricole Indosuez 347 Credit Lyonnais 348 DBS Bank 3
(continued )
Table AI.List of banks and their
group number
The Indianbanking sector
121
Dow
nloa
ded
by P
UN
JAB
TE
CH
NIC
AL
UN
IVE
RSI
TY
At 2
0:44
04
Febr
uary
201
5 (P
T)
No. Bank Group
49 Deutsche Bank 350 Dresdner Bank 351 Hong Kong & Shanghai Bank 352 ING Bank 353 J.P. Morgan Chase Bank 354 KBC Bank 355 Krug Thai Bank 356 Mizuho Corporate Bank 357 Mashreq Bank 358 Oman International Bank 359 Overseas Chinese Bank 360 Siam Commercial Bank 361 Societe Generale 362 Sonali Bank 363 Standard Chartered Bank 364 Standard Chartered Grindleys Bank 365 State Bank of Mauritius 366 Sumitomo Mitsui Bank 367 Toronto Dominion Bank 368 UFJ Bank 369 Bank of Punjab 470 Bank of Rajasthan 471 Bharath Overseas Bank 472 Catholic Syrian Bank 473 Centurion Bank 474 City Union Bank 475 Development Credit Bank 476 Dhanalakshmi Bank 477 Federal Bank 478 Ganesh Bank of Kurundwad 479 Global Trust Bank 480 HDFC Bank 481 ICICI Bank 482 IDBI Bank 483 IndusInd Bank 484 ING Vysya Bank 485 Jammu & Kashmir Bank 486 Karnataka Bank 487 Karur Vysya Bank 488 Lakshmi Vilas Bank 489 Lord Krishna Bank 490 Nainital Bank 491 Nedungadi Bank 492 Ratnakar Bank 493 Sangli Bank 494 SBI Commercial & International Bank 495 South Indian Bank 496 Tamilnad Mercantile Bank 497 United Western Bank 498 UTI Bank 4Table AI.
JIC8,1
122
Dow
nloa
ded
by P
UN
JAB
TE
CH
NIC
AL
UN
IVE
RSI
TY
At 2
0:44
04
Febr
uary
201
5 (P
T)
About the authorG. Barathi Kamath (PhD, Osmania University, Hyderabad) is currently an Assistant Professor ofEconomics at the ICFAI Business School, Mumbai, India. She has a decade’s experience inteaching, and her research interests are in the area of foreign trade and international business,specializing at present in the area of intellectual capital and intellectual property rights with afocus on industry-specific issues. G. Barathi Kamath can be contacted at: [email protected]
The Indianbanking sector
123
To purchase reprints of this article please e-mail: [email protected] visit our web site for further details: www.emeraldinsight.com/reprints
Dow
nloa
ded
by P
UN
JAB
TE
CH
NIC
AL
UN
IVE
RSI
TY
At 2
0:44
04
Febr
uary
201
5 (P
T)
This article has been cited by:
1. Falconer Mitchell, Hanne Nørreklit, Francesca Francioli, Lino Cinquini. 2014. Exploring the blurrednature of strategic linkages across the BSC. Journal of Accounting & Organizational Change 10:4, 486-515.[Abstract] [Full Text] [PDF]
2. Sampath Kehelwalatenna, Gamini Premaratne. 2014. Intellectual capital performance and its long-runbehavior: The US banking industry case. New Zealand Economic Papers 1-21. [CrossRef]
3. Arun Kumar Agariya, Deepali Singh. 2014. CRM Index Development and Validation in IndianBanking Sector. International Journal of Customer Relationship Marketing and Management 3:10.4018/IJCRMM.20120401, 10-32. [CrossRef]
4. Dr Antonio Lerro, Dr Roberto Linzalone and Professor Giovanni Schiuma, Sladjana Cabrilo, LeposavaGrubic Nesic, Slavica Mitrovic. 2014. Study on human capital gaps for effective innovation strategies inthe knowledge era. Journal of Intellectual Capital 15:3, 411-429. [Abstract] [Full Text] [PDF]
5. Carla Curado, Maria João Guedes, Nick Bontis. 2014. The Financial Crisis of Banks (Before, During andAfter): An Intellectual Capital Perspective. Knowledge and Process Management 21:10.1002/kpm.v21.2,103-111. [CrossRef]
6. Vishnu Sriranga, Kumar Gupta Vijay. 2014. Intellectual capital and performance of pharmaceutical firmsin India. Journal of Intellectual Capital 15:1, 83-99. [Abstract] [Full Text] [PDF]
7. Dumay John. 2014. 15 years of the Journal of Intellectual Capital and counting. Journal of IntellectualCapital 15:1, 2-37. [Abstract] [Full Text] [PDF]
10. Eirini Manolopoulou, Sotiris Kotsiantis, Dimitris Tzelepis. 2013. Application of association and decisionrules on intellectual capital. Knowledge Management Research & Practice . [CrossRef]
11. Karam Pal, Sushila Soriya. 2013. Financial Reporting of Intellectual Capital and Company’s Performancein Indian Information Technology Industry. International Journal of Asian Business and InformationManagement 2:10.4018/jabim.20110401, 34-49. [CrossRef]
12. Mahesh Joshi, Daryll Cahill, Jasvinder Sidhu, Monika Kansal. 2013. Intellectual capital and financialperformance: an evaluation of the Australian financial sector. Journal of Intellectual Capital 14:2, 264-285.[Abstract] [Full Text] [PDF]
13. I-Shuo Chen, Jui-Kuei Chen. 2013. Present and future: a trend forecasting and ranking of universitytypes for innovative development from an intellectual capital perspective. Quality & Quantity 47, 335-352.[CrossRef]
14. Stevo Janošević, Vladimir Dženopoljac, Nick Bontis. 2013. Intellectual Capital and Financial Performancein Serbia. Knowledge and Process Management 20, 1-11. [CrossRef]
16. Sonia Jindal, Manoj Kumar. 2012. The determinants of HC disclosures of Indian firms. Journal ofIntellectual Capital 13:2, 221-247. [Abstract] [Full Text] [PDF]
17. Magdi El‐Bannany. 2012. Global financial crisis and the intellectual capital performance of UAE banks.Journal of Human Resource Costing & Accounting 16:1, 20-36. [Abstract] [Full Text] [PDF]
18. Gholamhossein Mehralian, Ali Rajabzadeh, Mohammad Reza Sadeh, Hamid Reza Rasekh. 2012.Intellectual capital and corporate performance in Iranian pharmaceutical industry. Journal of IntellectualCapital 13:1, 138-158. [Abstract] [Full Text] [PDF]
19. Mahfoudh Abdul Karem Al-Musalli, Ku Nor Izah Ku Ismail. 2012. Intellectual Capital Performance andBoard Characteristics of GCC Banks. Procedia Economics and Finance 2, 219-226. [CrossRef]
20. Stefania Veltri, Antonella Silvestri. 2011. Direct and indirect effects of human capital on firm value:evidence from Italian companies. Journal of Human Resource Costing & Accounting 15:3, 232-254.[Abstract] [Full Text] [PDF]
21. Kongkiti Phusavat, Narongsak Comepa, Agnieszka Sitko‐Lutek, Keng‐Boon Ooi. 2011. Interrelationshipsbetween intellectual capital and performance. Industrial Management & Data Systems 111:6, 810-829.[Abstract] [Full Text] [PDF]
22. Samuel Kai Wah Chu, Kin Hang Chan, Wendy W.Y. Wu. 2011. Charting intellectual capital performanceof the gateway to China. Journal of Intellectual Capital 12:2, 249-276. [Abstract] [Full Text] [PDF]
23. Samuel Kai Wah Chu, Kin Hang Chan, Ka Yin Yu, Hing Tai Ng, Wai Kwan Wong. 2011. An EmpiricalStudy of the Impact of Intellectual Capital on Business Performance. Journal of Information & KnowledgeManagement 10, 11-21. [CrossRef]
24. Meng‐Yuh Cheng, Jer‐Yan Lin, Tzy‐Yih Hsiao, Thomas W. Lin. 2010. Invested resource, competitiveintellectual capital, and corporate performance. Journal of Intellectual Capital 11:4, 433-450. [Abstract][Full Text] [PDF]
25. Fethi Calisir, Cigdem Altin Gumussoy, A. Elvan Bayraktaroğlu, Ece Deniz. 2010. Intellectual capital in thequoted Turkish ITC sector. Journal of Intellectual Capital 11:4, 538-554. [Abstract] [Full Text] [PDF]
26. An Yi, Howard Davey. 2010. Intellectual capital disclosure in Chinese (mainland) companies. Journal ofIntellectual Capital 11:3, 326-347. [Abstract] [Full Text] [PDF]
27. Mahesh Joshi, Daryll Cahill, Jasvinder Sidhu. 2010. Intellectual capital performance in the banking sector.Journal of Human Resource Costing & Accounting 14:2, 151-170. [Abstract] [Full Text] [PDF]
28. Md Habib‐Uz‐Zaman Khan, Md Mohobbot Ali. 2010. An empirical investigation and users' perceptionson intellectual capital reporting in banks. Journal of Human Resource Costing & Accounting 14:1, 48-69.[Abstract] [Full Text] [PDF]
29. Hung-Yi Wu, Jui-Kuei Chen, I-Shuo Chen. 2010. Innovation capital indicator assessment of TaiwaneseUniversities: A hybrid fuzzy model application. Expert Systems with Applications 37, 1635-1642. [CrossRef]
30. Daniel Zéghal, Anis Maaloul. 2010. Analysing value added as an indicator of intellectual capital and itsconsequences on company performance. Journal of Intellectual Capital 11:1, 39-60. [Abstract] [Full Text][PDF]
31. Irene Wei Kiong Ting, Hooi Hooi Lean. 2009. Intellectual capital performance of financial institutionsin Malaysia. Journal of Intellectual Capital 10:4, 588-599. [Abstract] [Full Text] [PDF]
32. Santanu Ghosh, Amitava Mondal. 2009. Indian software and pharmaceutical sector IC and financialperformance. Journal of Intellectual Capital 10:3, 369-388. [Abstract] [Full Text] [PDF]
33. Nick Bontis, Christopher Bart, Harjinder Singh Deol. 2009. Strategic environment and intellectual capitalof Indian banks. Journal of Intellectual Capital 10:1, 109-120. [Abstract] [Full Text] [PDF]
34. G. Bharathi Kamath. 2008. Intellectual capital and corporate performance in Indian pharmaceuticalindustry. Journal of Intellectual Capital 9:4, 684-704. [Abstract] [Full Text] [PDF]
35. Hong Pew Tan, David Plowman, Phil Hancock. 2008. The evolving research on intellectual capital.Journal of Intellectual Capital 9:4, 585-608. [Abstract] [Full Text] [PDF]
36. Karam Pal, Sushila SoriyaFinancial Reporting of Intellectual Capital and Company’s Performance inIndian Information Technology Industry 1-17. [CrossRef]
37. Karam Pal Narwal, Sushila SoriyaRelationship between Company's Intellectual Capital and Performance:190-209. [CrossRef]