34
1 Collection & Analysis of Rate Data Dicky Dermawan www.dickydermawan.net78.net [email protected] ITK-329 Kinetika & Katalisis
| Date post: | 14-Dec-2015 |
| Category: |
Documents |
| Upload: | erik-spong |
| View: | 222 times |
| Download: | 0 times |

1
Collection & Analysis of Rate Data
Dicky Dermawanwww.dickydermawan.net78.net
ITK-329 Kinetika & Katalisis
2
Types of Reactors for obtaining Rate Data
Batch, primarily for homogeneous reactions:Measured: C(t), P((t) and/or V(t)
Unsteady-state operation
Differential reactor, for heterogeneous reactionsMeasured: Product concentration @ different
feed condition Steady-state operation

3
Methods for Analyzing Rate Data
Differential Method Integral Method Half-lives Method Method of Initial Rates Linear and Nonlinear Regression (Least-
Square Analysis

4
Differential Method
Applicable when reaction condition are such that the rate is essentially a function of the concentration of only one reactant
Can be used coupled with method of excess
Outline of the procedure: combining the definition of rate reaction with the assumed
AA Ckr- productA
BAA CCkr- productBA
dt
)V/N(d
dt
dN
V
1r AAA
dt
dCr AA
AA Ckr- AA
AA
Cln)kln(dt
dCln
Ckdt
dC

5
Determining The Derivative
Graphical Differentiation
Differentiation of a polynomial fit to the data
Numerical differentiation
y = 0.4781x - 1.5944R2 = 0.9974
-3
-3
-2
-2
-1
-1
0
-3 -2 -1 0 1 2
ln CA
ln (
-DC
A/D
t)

6
Graphical Differential
-
0.05
0.10
0.15
0.20
0.25
0.30
0.35
0.40
0.45
0.50
0 5 10 15 20
t, menit
- d
C A/d
t
1nn
1n,An,An
1n
A
tt
CC
dt
dC
t, min CA, mol/L
0 4.00 3 2.89 5 2.25 8 1.45 10 1.00 12 0.65 15 0.25
17.5 0.07

7
Differentiation of a Polynomial Fit to The Data
y = 0.01x2 - 0.3992x + 3.999R2 = 1
-
0.50
1.00
1.50
2.00
2.50
3.00
3.50
4.00
4.50
0 5 10 15 20
t, min
CA
, m
ol/L
399,0t02,0dt
dC
999,3t399,0t01,0C
A
2A
Thus….

8
Numerical Method
t, min CA, mol/L
0 4.00 3 2.89 5 2.25 8 1.45 10 1.00 12 0.65 15 0.25
17.5 0.07
t2
C3C4C
dt
dC point Last
t2
CC
dt
dCpoint t Intermedia
t2
CC4C3-
dt
dC point Initial
5A4AA3
t
A
)1i(A1)A(i
t
A
2A1AA0
t
A
5
i
0
D
D
D
Only applicable for uniform sampling interval
9
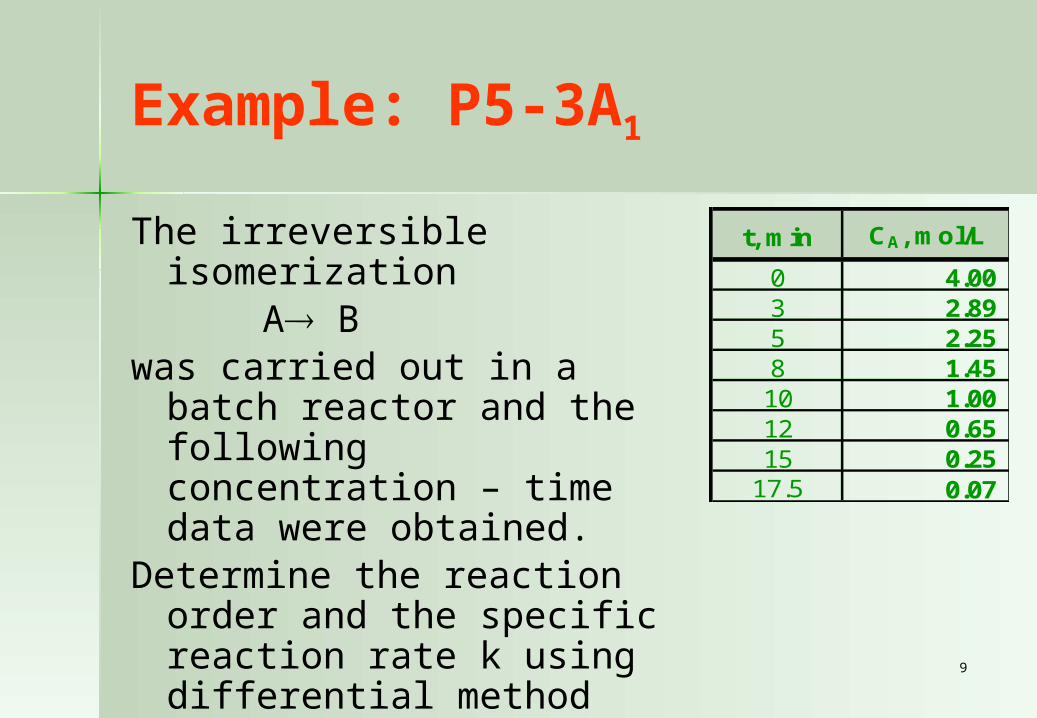
Example: P5-3A1
The irreversible isomerizationA B
was carried out in a batch reactor and the following concentration – time data were obtained.
Determine the reaction order and the specific reaction rate k using differential method
Check the goodness of the fit.
t, min CA, mol/L
0 4.00 3 2.89 5 2.25 8 1.45 10 1.00 12 0.65 15 0.25
17.5 0.07
10
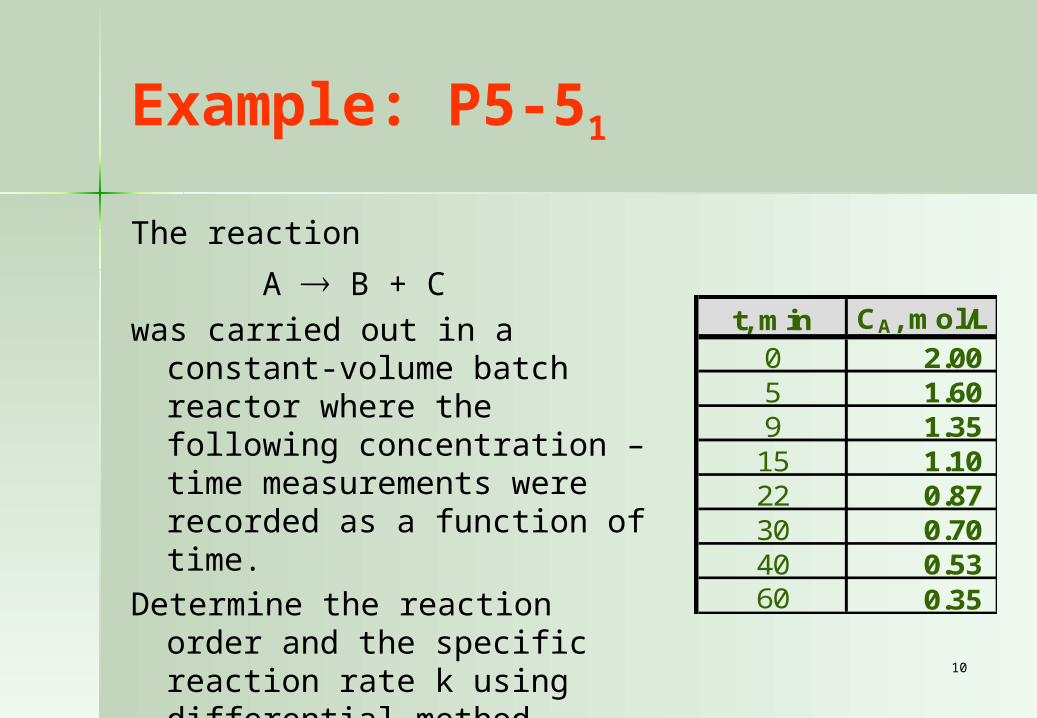
Example: P5-51
The reaction
A B + C
was carried out in a constant-volume batch reactor where the following concentration – time measurements were recorded as a function of time.
Determine the reaction order and the specific reaction rate k using differential method
Check the goodness of the fit.
t, min CA, mol/L
0 2.00 5 1.60 9 1.35 15 1.10 22 0.87 30 0.70 40 0.53 60 0.35

11
Integral Method
Most often used when the reaction order is known
Outline of the procedure:– Guess the reaction order, then integral data
the combining differential concentration-time equation; find the appropriate linear plot
– (Essen’s Method) If the assumed rate law is correct, the plot should be linear; otherwise assume other rate equation and repeat the procedure

12
Intagral Metode of van’t Hoff
Pada aplikasi metode integral oleh Essen, tidak dibuat kurva dari hasil integrasi, melainkan………
Dihitung harga k dari setiap data point; bila hasilnya kira-kira konstan, maka dapat disimpulkan bahwa orde reaksi yang dipostulasikan sudah tepat.

13
Example: P5-3A2
The irreversible isomerizationA B
was carried out in a batch reactor and the following concentration – time data were obtained.
Determine the reaction order and the specific reaction rate k using integral method
Check the goodness of the fit.
t, min CA, mol/L
0 4.00 3 2.89 5 2.25 8 1.45 10 1.00 12 0.65 15 0.25
17.5 0.07
14
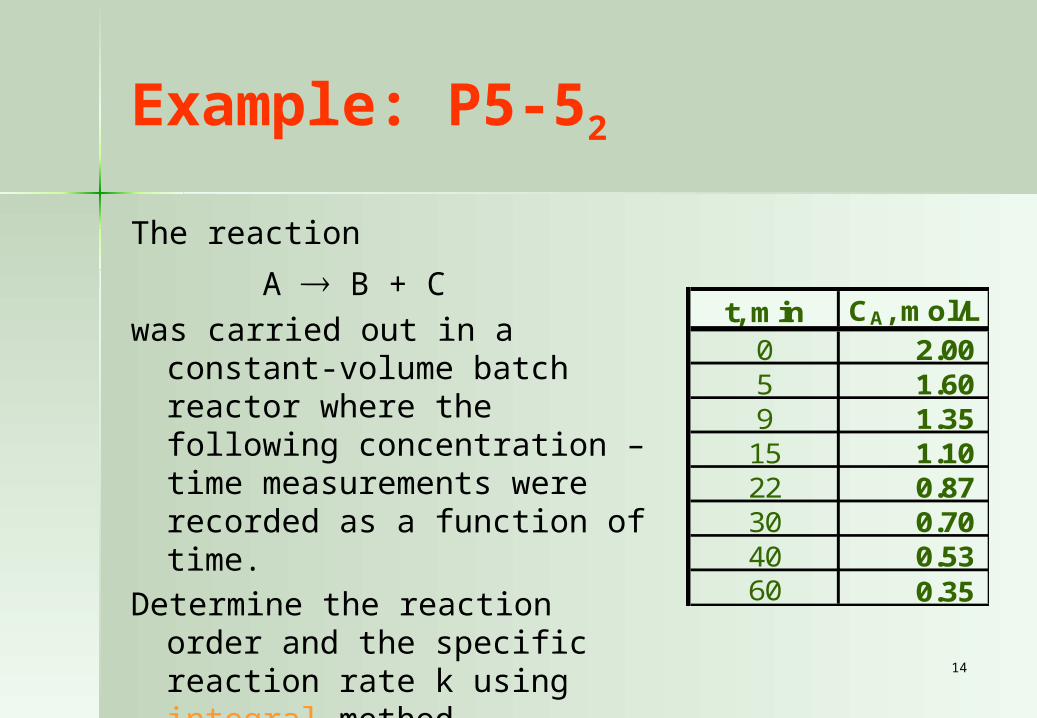
Example: P5-52
The reaction
A B + C
was carried out in a constant-volume batch reactor where the following concentration – time measurements were recorded as a function of time.
Determine the reaction order and the specific reaction rate k using integral method
Check the goodness of the fit.
t, min CA, mol/L
0 2.00 5 1.60 9 1.35 15 1.10 22 0.87 30 0.70 40 0.53 60 0.35

15
Process your data in terms of measured variable
Look for simplifications!
Unfortunately,The problem is not that easy….

16
L3-14Constant Volume Batch Reactor
A small reaction bomb fitted with a sensitive pressure-measuring device is flushed out at 25oC, a temperature low enough that the reaction does not proceed to any appreciable extent. The temperature is then raised as rapidly as possible to 100oC by plunging the bomb into boiling water, and the readings in Table P14 are obtained.
The stoichiometry of the reaction is2 A B
After leaving the bomb in the bath over the weekend the contents are analyzed for A; none can be found.
Find a rate equation in units of moles, liters, and minutes which will satisfactorily fit the data.
t, min P, atm1 1.1402 1.0403 0.9824 0.9405 0.9056 0.8707 0.8508 0.8329 0.815
10 0.80015 0.75420 0.728
17
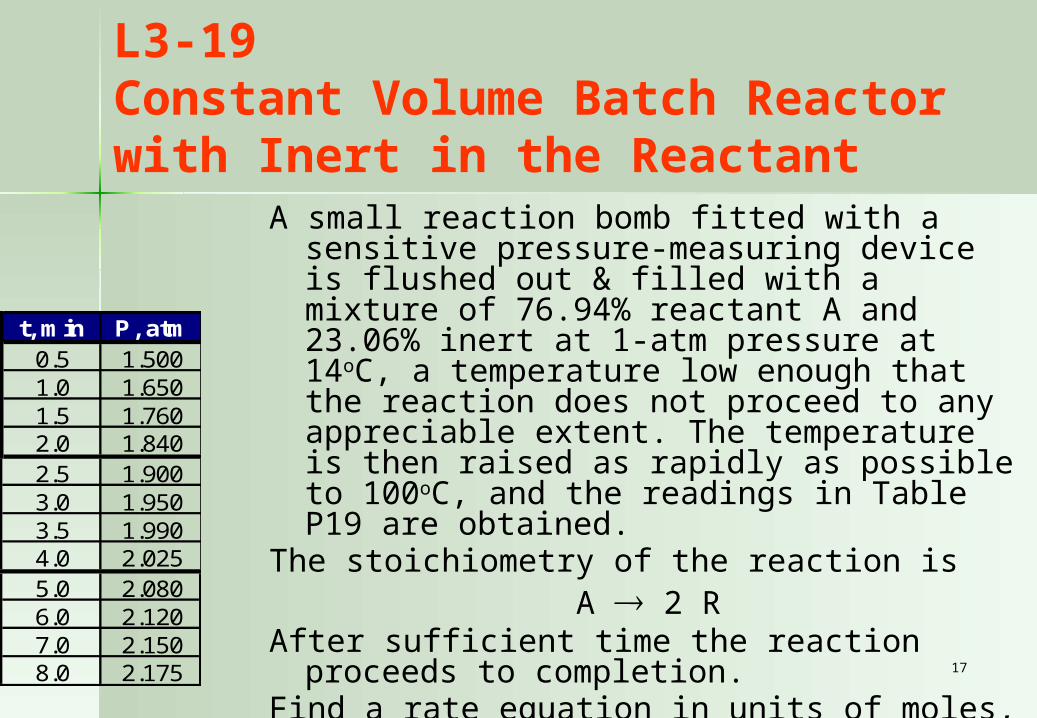
L3-19Constant Volume Batch Reactor with Inert in the Reactant
A small reaction bomb fitted with a sensitive pressure-measuring device is flushed out & filled with a mixture of 76.94% reactant A and 23.06% inert at 1-atm pressure at 14oC, a temperature low enough that the reaction does not proceed to any appreciable extent. The temperature is then raised as rapidly as possible to 100oC, and the readings in Table P19 are obtained.
The stoichiometry of the reaction isA 2 R
After sufficient time the reaction proceeds to completion.
Find a rate equation in units of moles, liters, and minutes which will satisfactorily fit the data.
t, min P, atm0.5 1.5001.0 1.6501.5 1.7602.0 1.8402.5 1.9003.0 1.9503.5 1.9904.0 2.0255.0 2.0806.0 2.1207.0 2.1508.0 2.175
18
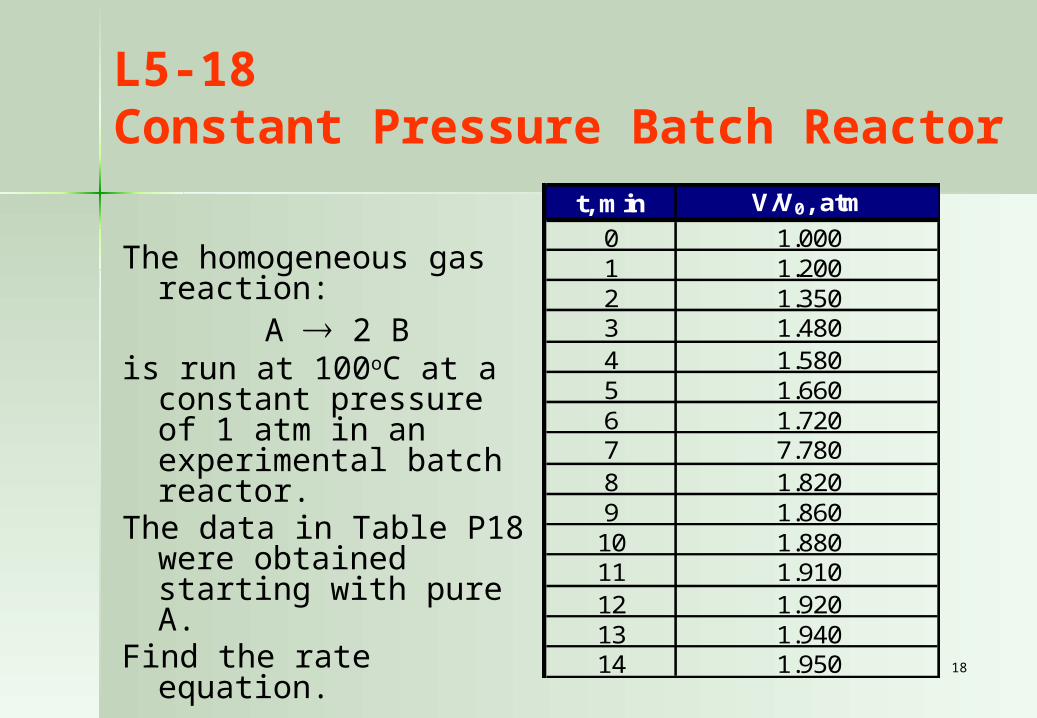
L5-18Constant Pressure Batch Reactor
The homogeneous gas reaction:
A 2 Bis run at 100oC at a
constant pressure of 1 atm in an experimental batch reactor.
The data in Table P18 were obtained starting with pure A.
Find the rate equation.
t, min V/V0, atm
0 1.0001 1.2002 1.3503 1.4804 1.5805 1.6606 1.7207 7.7808 1.8209 1.86010 1.88011 1.91012 1.92013 1.94014 1.950

19
Quiz 1Basic Concept
Selasa, 10 Oktober 2006
20
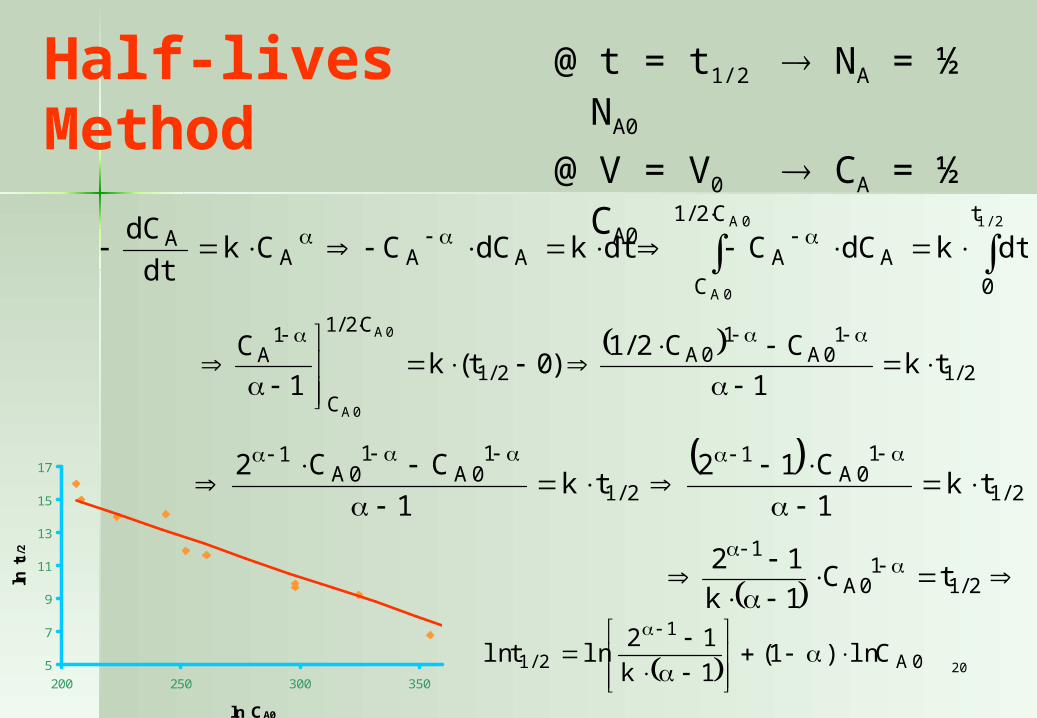
Half-lives Method@ t = t1/2 NA = ½ NA0
@ V = V0 CA = ½ CA0
2/10A
0A
t
0
C2/1
CAAAAA
A dtkdCCdtkdCCCkdt
dC
2/1
10A
10A
2/1
C2/1
C
1A tk
1
CC2/1)0t(k
1
C0A
0A
2/1
10A
1
2/1
10A
10A
1
tk1
C12tk
1
CC2
2/11
0A
1
tC1k
12
0A
1
2/1 Cln)1(1k
12lntln
5
7
9
11
13
15
17
200 250 300 350
ln CA0
ln t
1/2
21
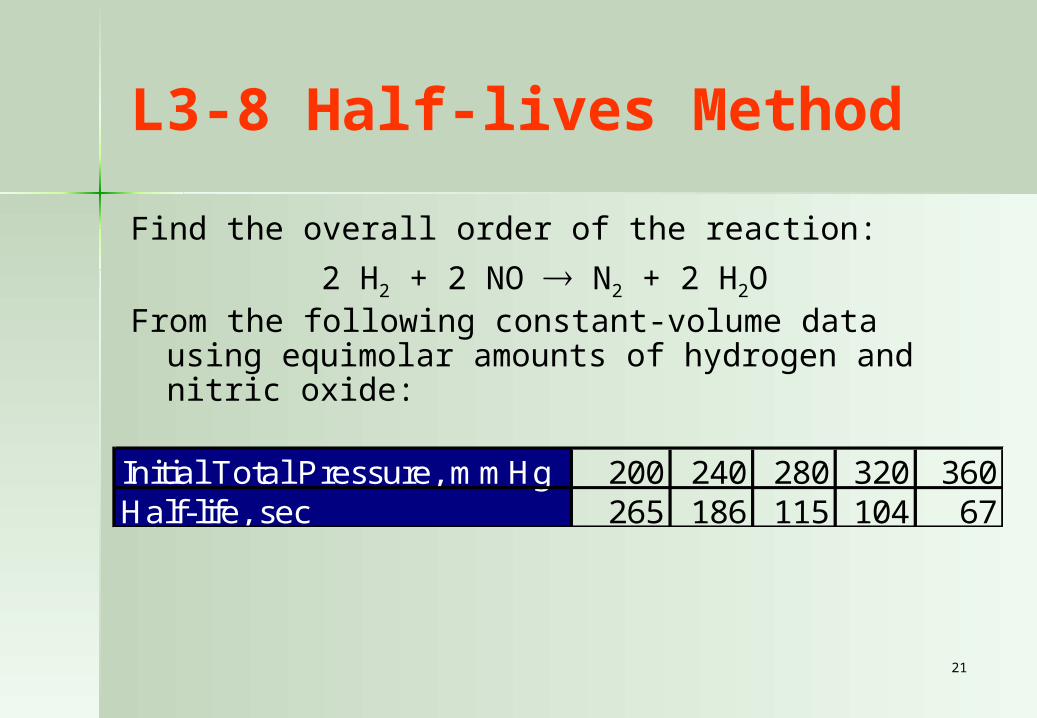
L3-8 Half-lives Method
Find the overall order of the reaction:
2 H2 + 2 NO N2 + 2 H2OFrom the following constant-volume data using
equimolar amounts of hydrogen and nitric oxide:
Initial Total Pressure, mmHg 200 240 280 320 360Half-life, sec 265 186 115 104 67

22
U2-Half-lives Method
The thermal decomposition of nitrous oxide (N2O) in the gas phase at 1030 K is studied in a constant-volume vessel at various initial pressures of N2O. The half-life data so obtained are as follows:
p0, mmHg 52,5 139 290 360 t½ , s 860 470 255 212
Determine a rate equation that fits these data

23
L3-29 Half-lives Method
Determine the complete rate equation in units of moles, liters, and seconds for the thermal decomposition of tetrahydrofuran from the half-life data in Table P29
Initial Total Pressure, mmHg Half-life, sec Temp. oC214 14.5 569204 67 530280 17.3 560130 39 550206 47 539
24
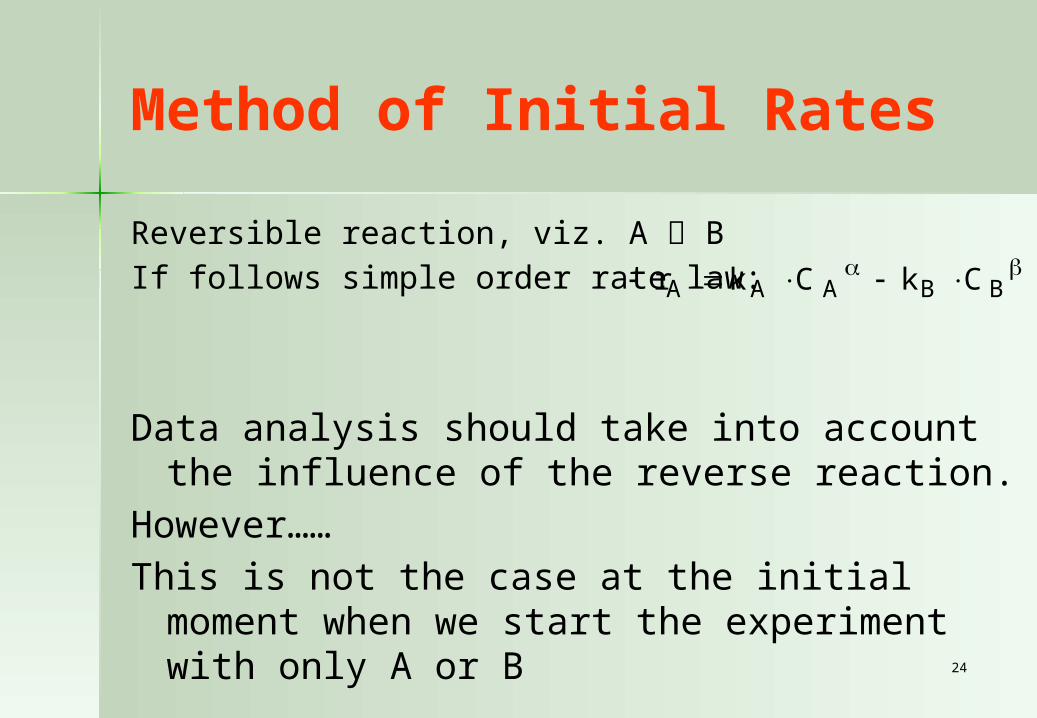
Method of Initial Rates
Reversible reaction, viz. A BIf follows simple order rate law:
Data analysis should take into account the influence of the reverse reaction.
However……This is not the case at the initial moment when
we start the experiment with only A or B
BBAAA CkCkr

25
H3-7. Metode laju awal
Data laju awal, , berikut ini dilaporkan untuk reaksi fasa gas antara diborana dengan aseton pada suhu 114oC:
B2H6 + 4 Me2CO 2(Me2CHO)2BH
Bila dipostulasikan persamaan laju reaksi berbentuk
tentukan n, m, dan k.
Tekanan awal (torr) Tempuhan
B2H6 Me2CO Laju awal x1000,
torr/sec 1 6,0 20,0 0,5 2 8,0 20,0 0,63 3 10,0 20,0 0,83 4 12,0 20,0 1,00 5 16,0 20,0 1,28 6 10,0 10,0 0,33 7 10,0 20,0 0,80 8 10,0 40,0 1,50 9 10,0 60,0 2,21
10 10,0 100,0 3,33
nmCO2Me6H2B
PPkLaju
26
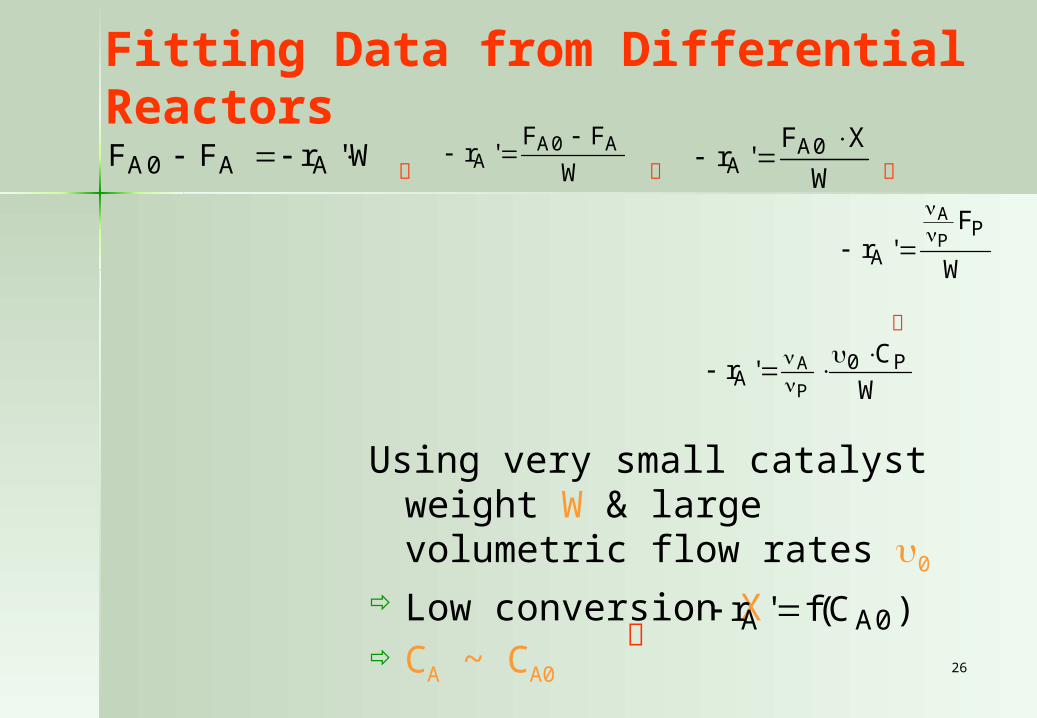
Fitting Data from Differential Reactors
Using very small catalyst weight W & large volumetric flow rates 0
Low conversion X CA ~ CA0
W'rFF AA0A W
FF'r A0A
A
W
XF'r 0A
A
W
F'r
P
AP
A
W
C'r P0
AP
A
)C(f'r 0AA
27
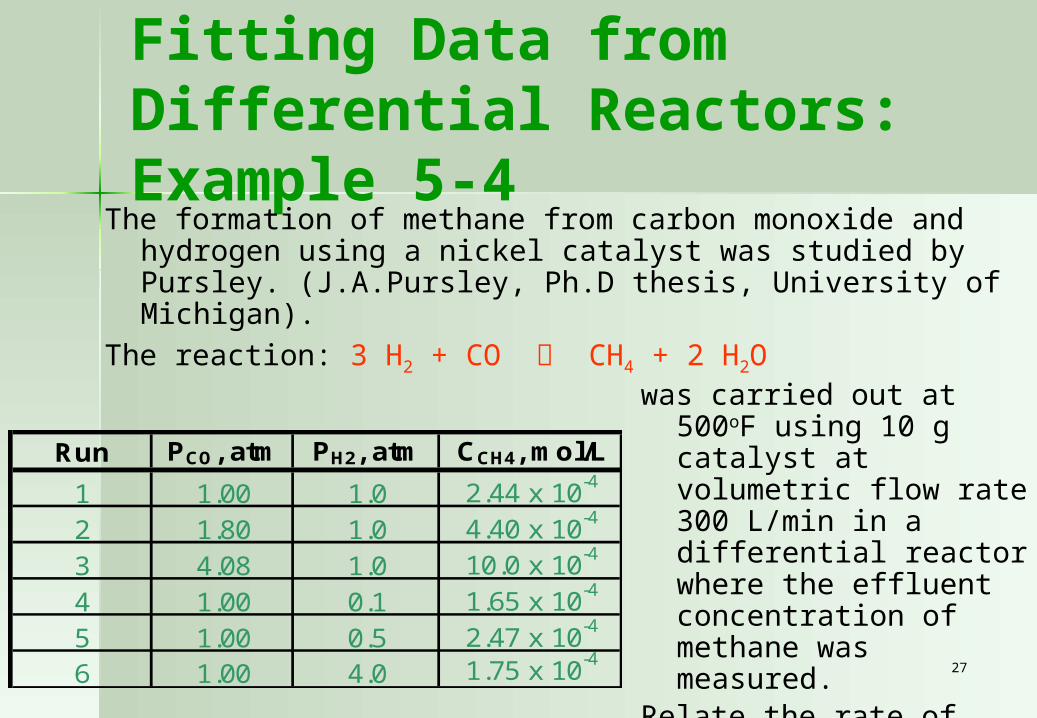
Fitting Data from Differential Reactors: Example 5-4
Run PCO, atm PH2, atm CCH4, mol/L
1 1.00 1.0 2.44 x 10⁻⁴
2 1.80 1.0 4.40 x 10⁻⁴
3 4.08 1.0 10.0 x 10⁻⁴
4 1.00 0.1 1.65 x 10⁻⁴
5 1.00 0.5 2.47 x 10⁻⁴
6 1.00 4.0 1.75 x 10⁻⁴
The formation of methane from carbon monoxide and hydrogen using a nickel catalyst was studied by Pursley. (J.A.Pursley, Ph.D thesis, University of Michigan).
The reaction: 3 H2 + CO CH4 + 2 H2O
was carried out at 500oF using 10 g catalyst at volumetric flow rate 300 L/min in a differential reactor where the effluent concentration of methane was measured.
Relate the rate of reaction to the exit methane concentration
28
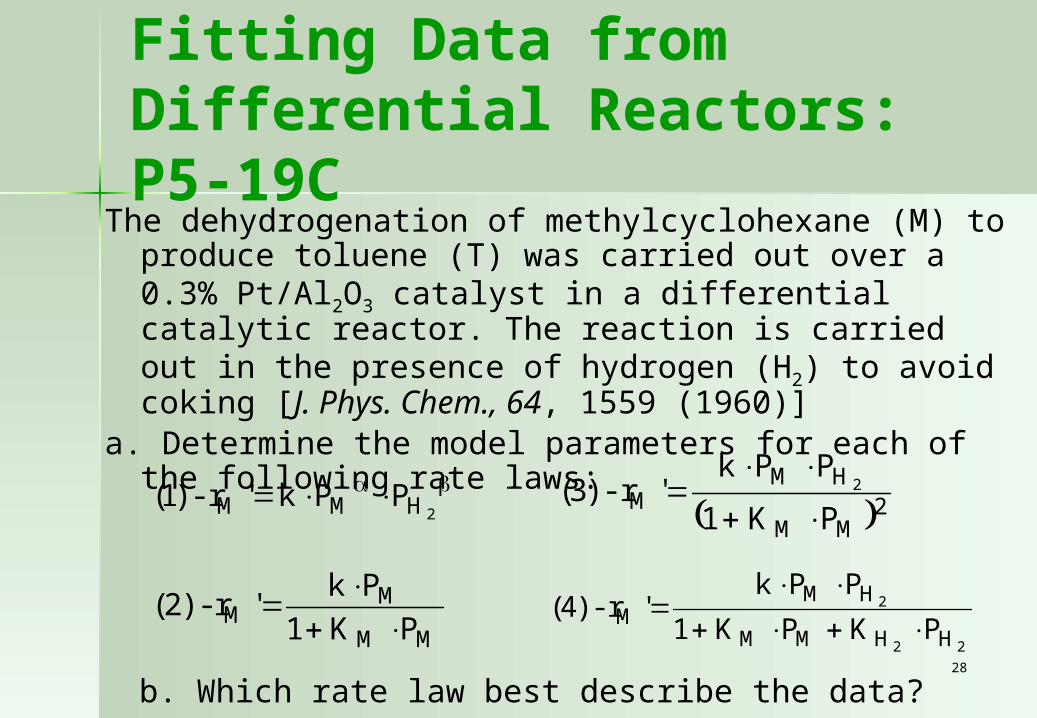
Fitting Data from Differential Reactors: P5-19C
The dehydrogenation of methylcyclohexane (M) to produce toluene (T) was carried out over a 0.3% Pt/Al2O3 catalyst in a differential catalytic reactor. The reaction is carried out in the presence of hydrogen (H2) to avoid coking [J. Phys. Chem., 64, 1559 (1960)]
a. Determine the model parameters for each of the following rate laws:
2HMM PPk'r- )1(
MM
MM PK1
Pk'r- )2(
2MM
HMM
PK1
PPk'r- )3( 2
22
2
HHMM
HMM PKPK1
PPk'r- )4(
b. Which rate law best describe the data?

29
Fitting Data from Differential Reactors: P5-19C (cont’)
PH2 [atm] PM [atm] rT' [mol toluene.(s-1).(kg cat)-1
1 1 1.21.5 1 1.250.5 1 1.30.5 0.5 1.11 0.25 0.92
0.5 0.1 0.643 3 1.271 4 1.283 2 1.254 1 1.3
0.5 0.25 0.942 0.05 0.41

30
Linear & Nonlinear Regression:Goodness of Fit
R square
data
2data
2
2
YY
)X(fY
1R
Variance
dof
SSEV
F test
model the in parameters of no. - point data of no.dof
model better in iancevar
model weakerin iancevarFinvers
model) worsefor dof model, better for dof,F(FDIST1confidence% inverse
31
Nonlinear Regression for Example P5-3A1

32
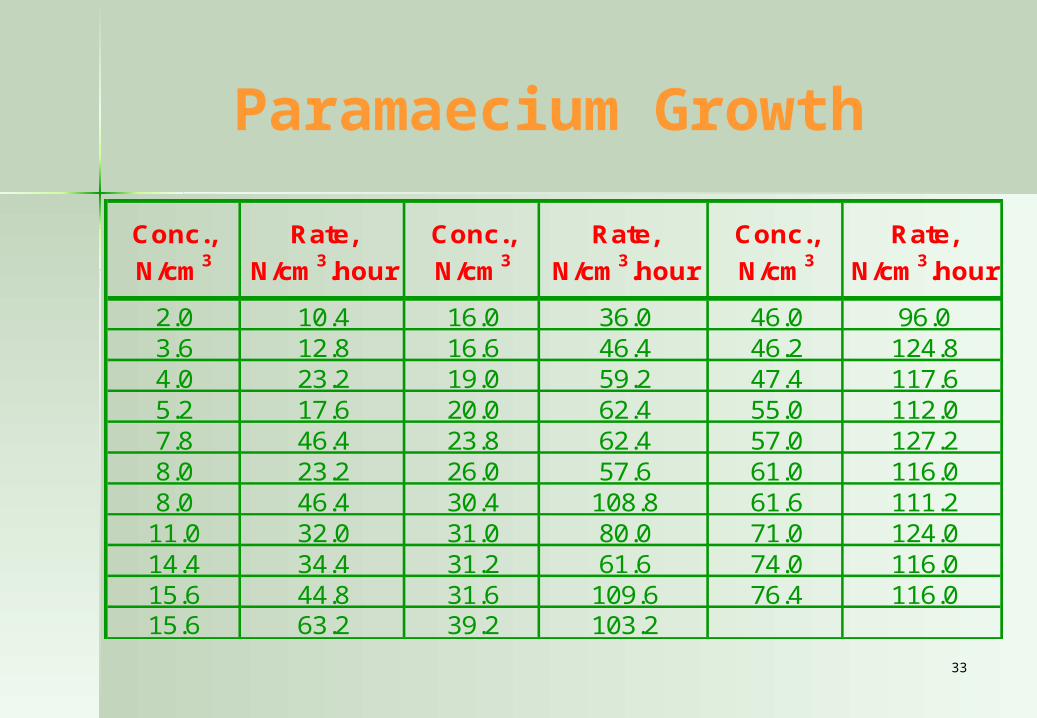
Case: Paramaecium Growth
The following table shows some data for the growth rate of paramaecium as a function of the paramaecium concentration.
Fit the data to Monod’s law (Monod, 1942)
Using:Linear least square:
Lineweaver – Burke Plot(reciprocal)difficulty in low
concentrationEadie – Hofstee Plot (rearragement)
Nonlinear least square
]par[K1
]par[Kkr
2
21P
33
Paramaecium Growth
Conc.,
N/cm3
Rate,
N/cm3.hour
Conc.,
N/cm3
Rate,
N/cm3.hour
Conc.,
N/cm3
Rate,
N/cm3.hour
2.0 10.4 16.0 36.0 46.0 96.03.6 12.8 16.6 46.4 46.2 124.84.0 23.2 19.0 59.2 47.4 117.65.2 17.6 20.0 62.4 55.0 112.07.8 46.4 23.8 62.4 57.0 127.28.0 23.2 26.0 57.6 61.0 116.08.0 46.4 30.4 108.8 61.6 111.2
11.0 32.0 31.0 80.0 71.0 124.014.4 34.4 31.2 61.6 74.0 116.015.6 44.8 31.6 109.6 76.4 116.015.6 63.2 39.2 103.2

34
Assignment
Analyze the previous data to fit kinetic model:
Using linear & nonlinear least square
Compare the variance of your results
5.12
21P
]par[K1
]par[Kkr


