81
July 22, 2012 Footer text here 1 05 Marzo 2015 Dr. Funda Atun The transportation system in Istanbul prone to earthquake
| Date post: | 15-Jul-2015 |
| Category: |
Education |
| Upload: | luca-marescotti |
| View: | 89 times |
| Download: | 2 times |

July 22, 2012 Footer text here1
05 Marzo 2015Dr. Funda Atun
The transportation system in Istanbul prone to earthquake
2
Definitions
Systemic vulnerability
Focus on transportation system
Istanbul Case Study: Hazard
Istanbul Case Study: Vulnerability in general
Istanbul Case Study: Social vulnerability
Current awareness and preparedness of earthquake risk
Istanbul Case Study: Systemic vulnerability - Transportation
system in Istanbul prone to earthquake risk

PART 1:DEFINITIONS
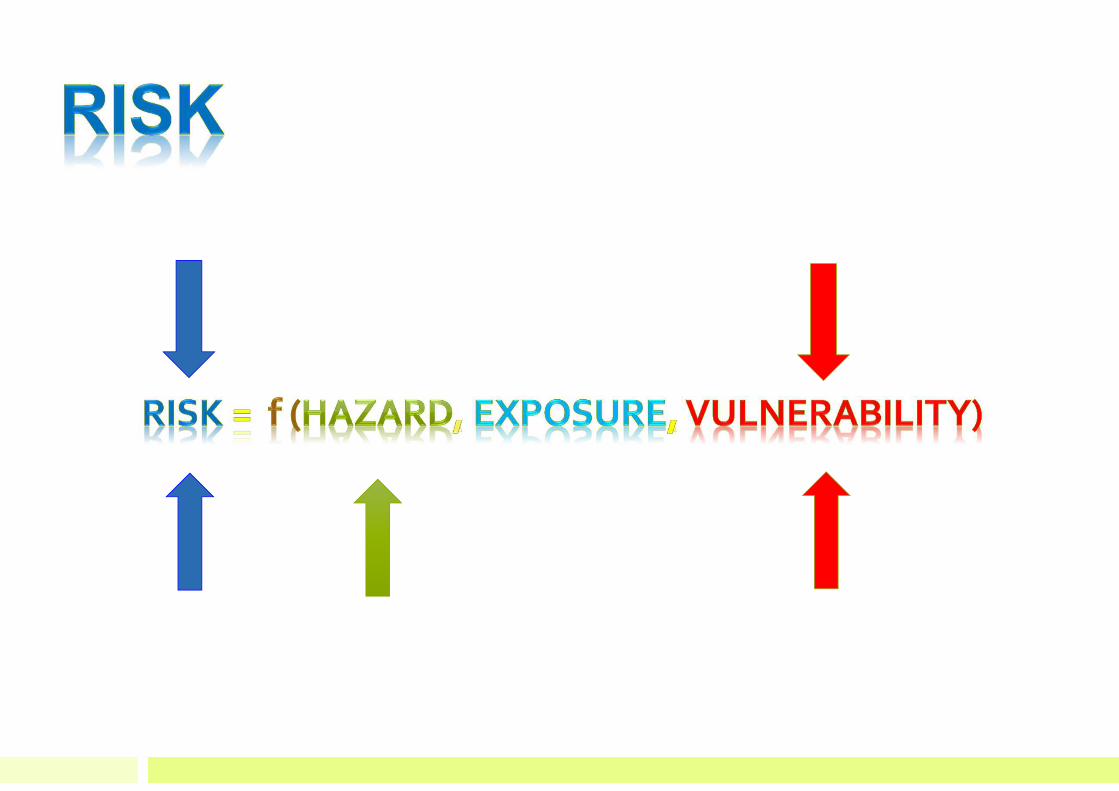
- Hazard- Vulnerability- Risk- Sustainable and disaster resilientdevelopment

The hazard is the probability of occurrence of a particular event within a
given time-period/geographic space
Exp: Flood, earthquake, landslide etc.
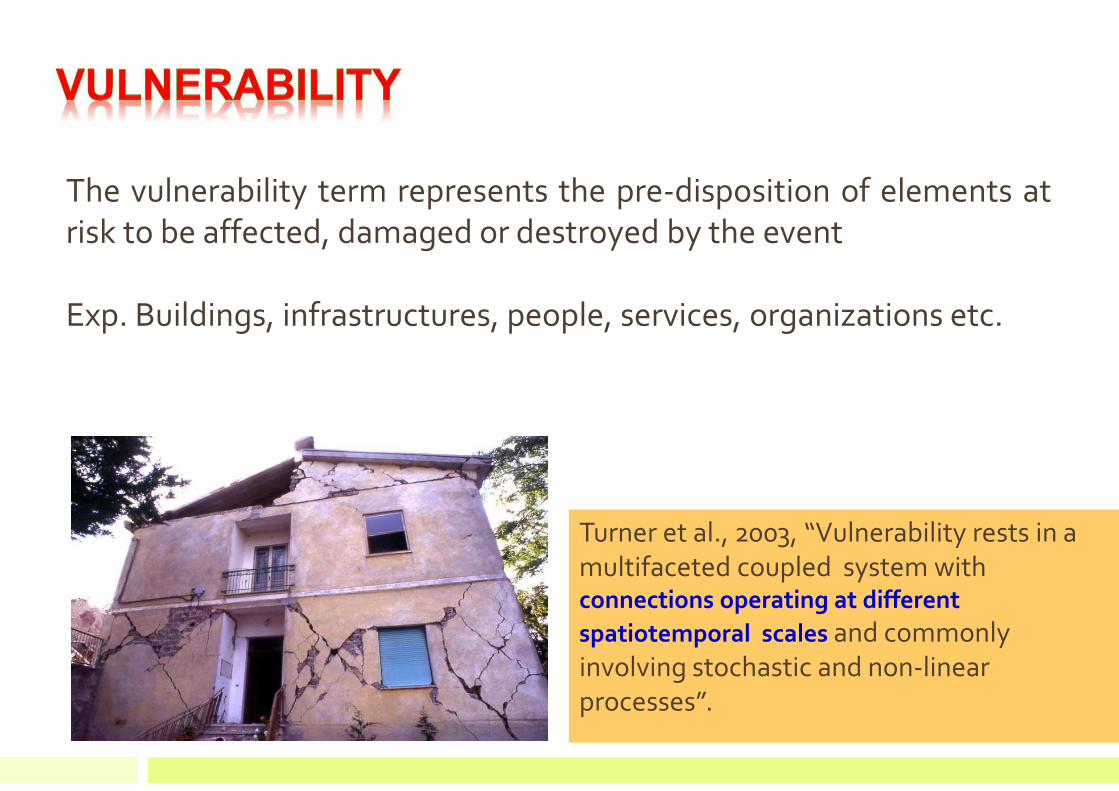
The vulnerability term represents the pre-disposition of elements at
risk to be affected, damaged or destroyed by the event
Exp. Buildings, infrastructures, people, services, organizations etc.
Turner et al., 2003, “Vulnerability rests in a
multifaceted coupled system with connections operating at differentspatiotemporal scales and commonly
involving stochastic and non-linear
processes”.
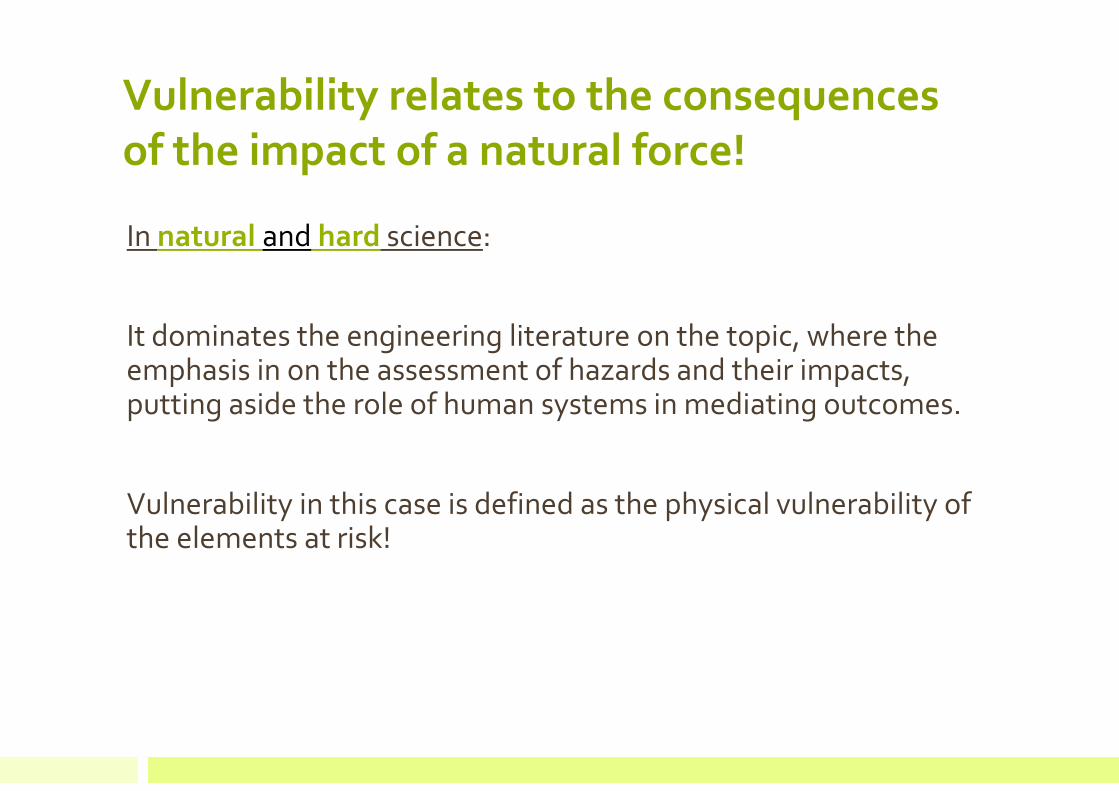
Vulnerability relates to the consequences of the impact of a natural force!
In natural and hard science:
It dominates the engineering literature on the topic, where the emphasis in on the assessment of hazards and their impacts, putting aside the role of human systems in mediating outcomes.
Vulnerability in this case is defined as the physical vulnerability of the elements at risk!
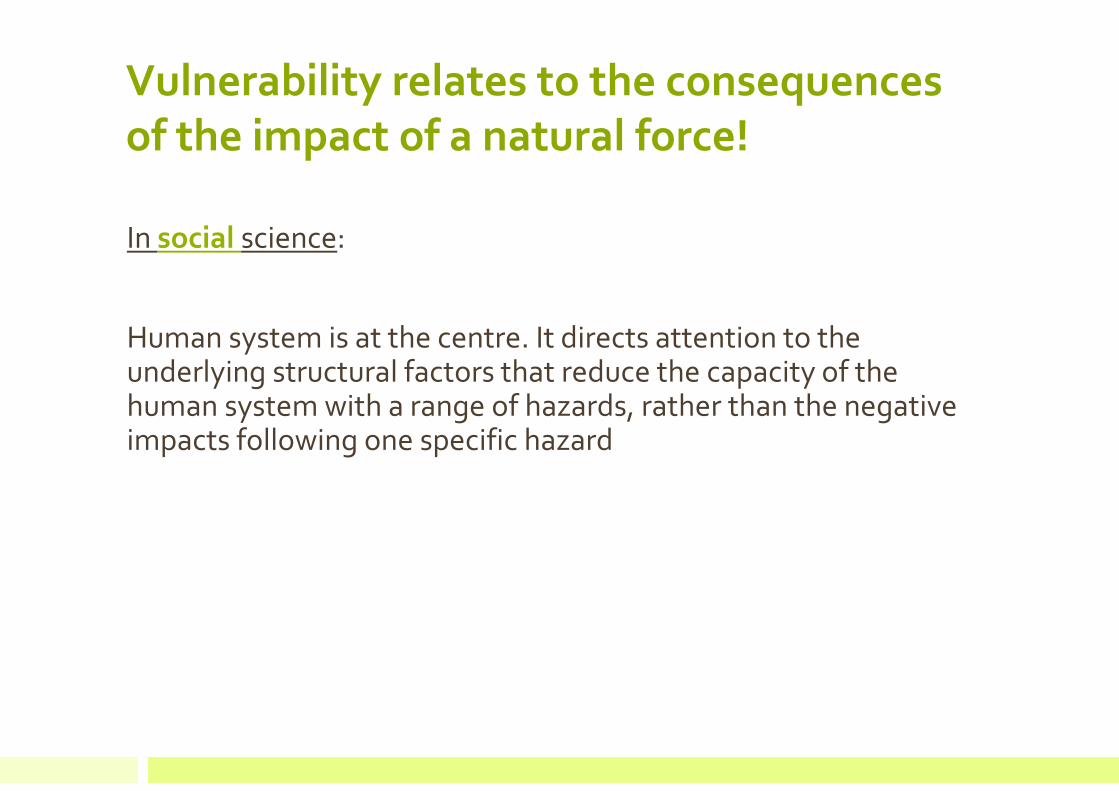
In social science:
Human system is at the centre. It directs attention to the underlying structural factors that reduce the capacity of the human system with a range of hazards, rather than the negative impacts following one specific hazard
Vulnerability relates to the consequences of the impact of a natural force!
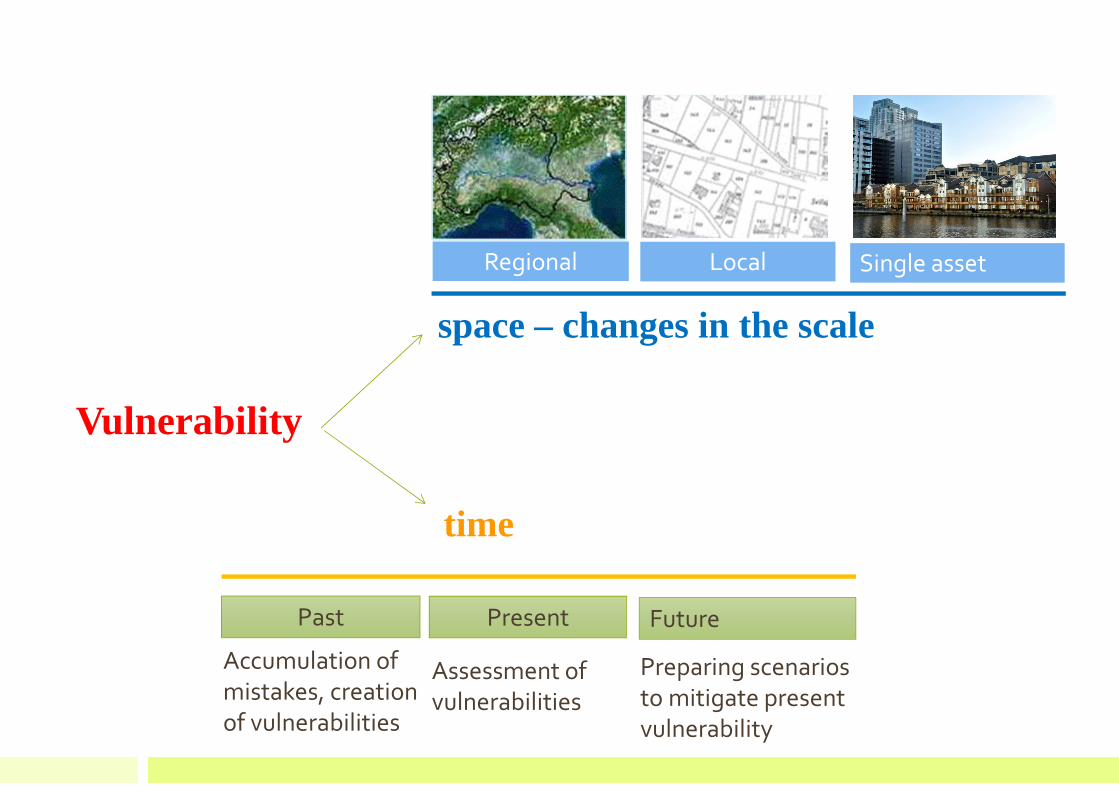
space – changes in the scale
Vulnerability
time
PresentPast Future
Accumulation of
mistakes, creation
of vulnerabilities
Assessment of
vulnerabilities
Preparing scenarios
to mitigate present
vulnerability
LocalRegional Single asset
Sustainable development:
“Sustainable development is development that meets the needs of the present without compromising the ability of future generations to meet their own needs”
SUSTAINABLE AND DISASTER RESILIENT DEVELOPMENT
February 3, 2014 [email protected]
United Nation Documents
Source: http://www.un-documents.net/ocf-02.htm

SUSTAINABLE AND DISASTER RESILIENT DEVELOPMENT
IUCN The future of sustainability, p.2
http://cmsdata.iucn.org/downloads/iucn_future_of_sustanability.pdf
What could be the solution?
The need of having a common platform where scientists and politicianscould discuss their role, define their aims and objectives, work together and achieve to have a common final product.
Altering the perspective of both scientists and policy makers from hazard to development.
SUSTAINABLE AND DISASTER RESILIENT DEVELOPMENT
Part 2: Systemicvulnerability
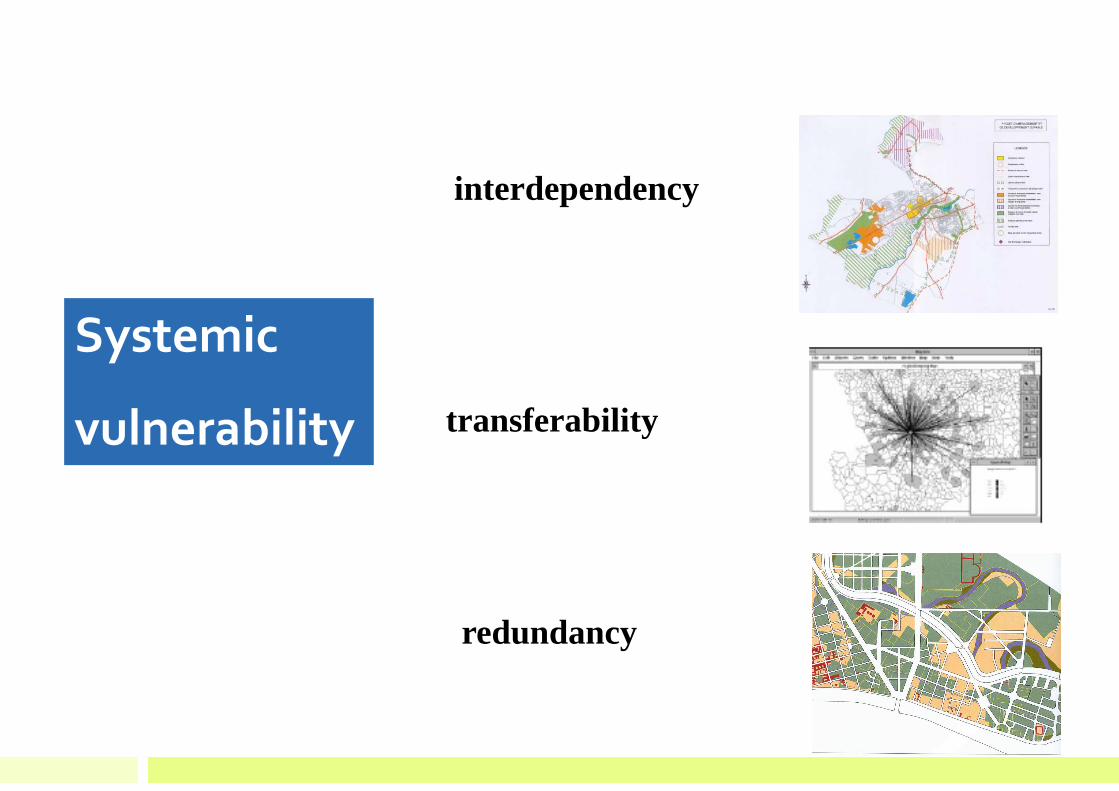
interdependency
transferability
redundancy
Systemic
vulnerability
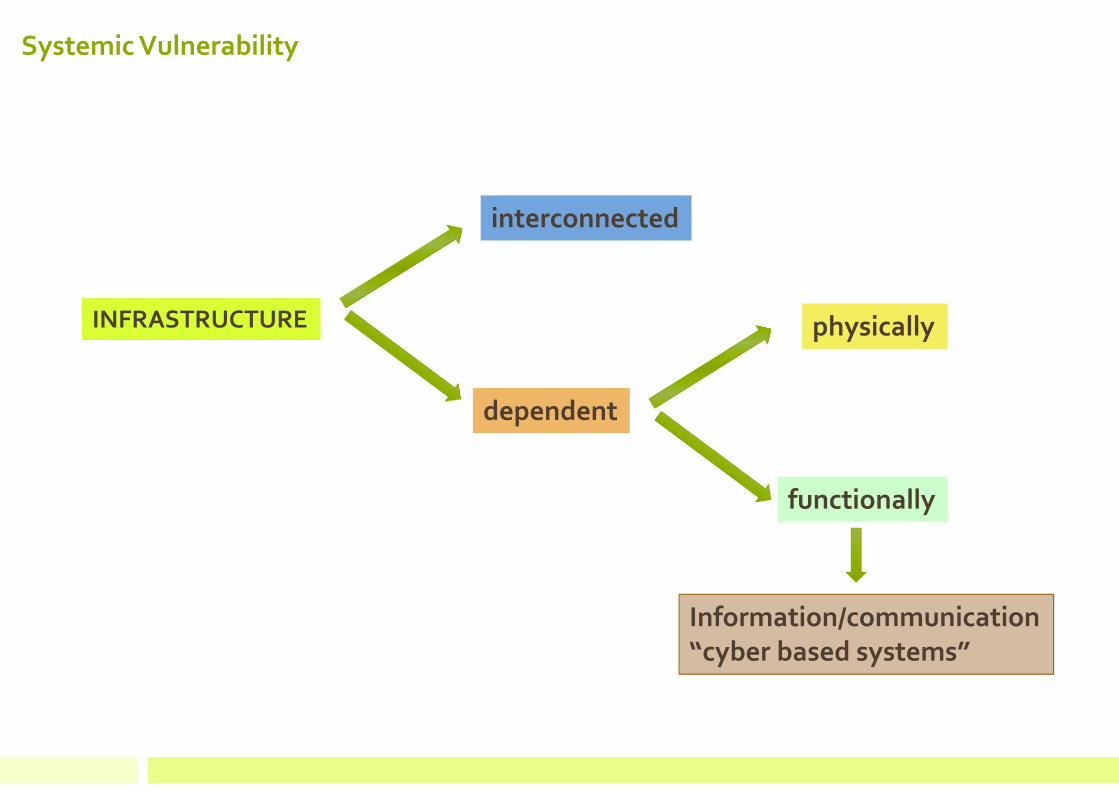
Systemic Vulnerability
INFRASTRUCTURE
dependent
interconnected
physically
functionally
Information/communication“cyber based systems”
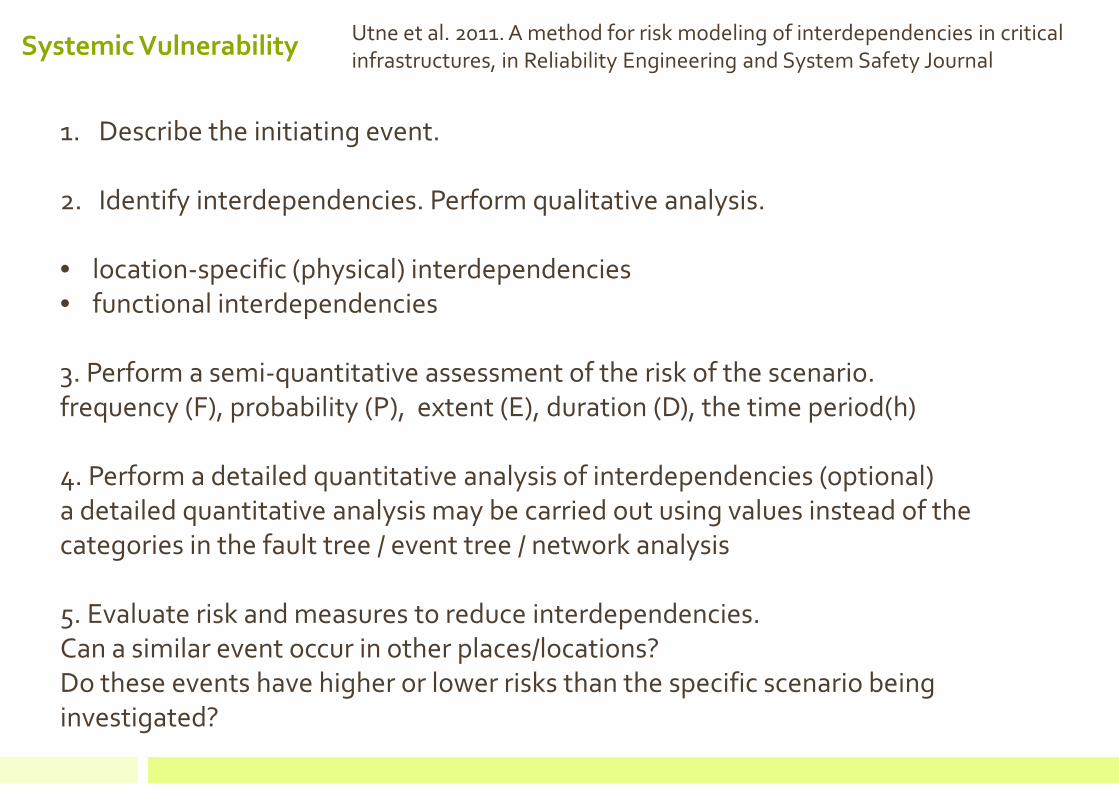
Systemic Vulnerability
1. Describe the initiating event.
2. Identify interdependencies. Perform qualitative analysis.
• location-specific (physical) interdependencies
• functional interdependencies
3. Perform a semi-quantitative assessment of the risk of the scenario.
frequency (F), probability (P), extent (E), duration (D), the time period(h)
4. Perform a detailed quantitative analysis of interdependencies (optional)
a detailed quantitative analysis may be carried out using values instead of the
categories in the fault tree / event tree / network analysis
5. Evaluate risk and measures to reduce interdependencies.
Can a similar event occur in other places/locations?
Do these events have higher or lower risks than the specific scenario being
investigated?
Utne et al. 2011. A method for risk modeling of interdependencies in critical
infrastructures, in Reliability Engineering and System Safety Journal

How to prevent?
Land use planning
Structuralmeasures
* re-develpment
* restauration
* relocation
* zoning
Support to implementation
* Disclosure
* Insurance; * tax incentives;
* Communication
levees
Landslide
consolidation
Avalanches
defence
Non structuralmeasures
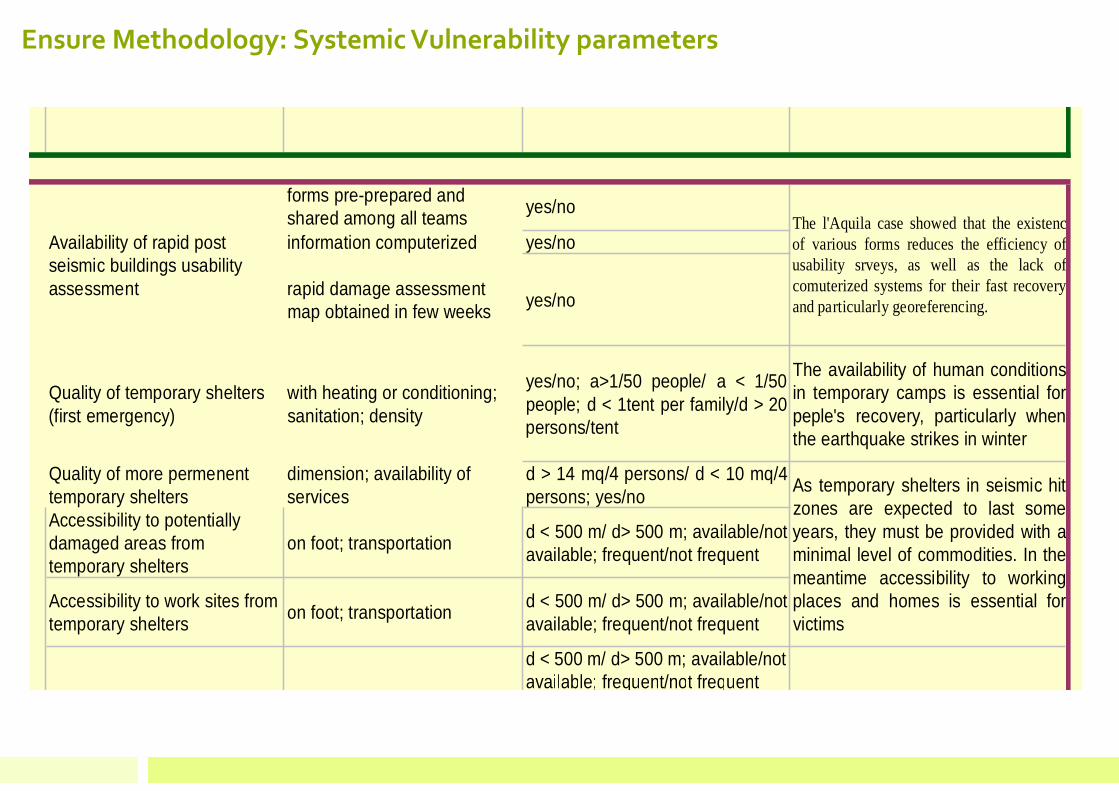
forms pre-prepared and shared among all teams
yes/no
information computerized yes/no
rapid damage assessment map obtained in few weeks
yes/no
Quality of temporary shelters (first emergency)
with heating or conditioning; sanitation; density
yes/no; a>1/50 people/ a < 1/50people; d < 1tent per family/d > 20persons/tent
The availability of human conditionsin temporary camps is essential forpeple's recovery, particularly whenthe earthquake strikes in winter
Quality of more permenent temporary shelters
dimension; availability of services
d > 14 mq/4 persons/ d < 10 mq/4persons; yes/no
Accessibility to potentially damaged areas from temporary shelters
on foot; transportationd < 500 m/ d> 500 m; available/notavailable; frequent/not frequent
Accessibility to work sites from temporary shelters
on foot; transportationd < 500 m/ d> 500 m; available/notavailable; frequent/not frequent
Accessibility to public facilities on foot; transportation
d < 500 m/ d> 500 m; available/not available; frequent/not frequent
The l'Aquila case showed that the existencof various forms reduces the efficiency ofusability srveys, as well as the lack ofcomuterized systems for their fast recoveryand particularly georeferencing.
As temporary shelters in seismic hitzones are expected to last someyears, they must be provided with aminimal level of commodities. In themeantime accessibility to workingplaces and homes is essential forvictims
Availability of rapid post seismic buildings usability assessment
Ensure Methodology: Systemic Vulnerability parameters

Contingency plan for na-tech binarythreats/does not
Business continuity plan binary yes/no
Access to understandable information
binaryyes/no; centralized /at each group level (for example in each temporary camp)
Trust in information provisers degree low/medium/highPreparedness to evacuation individual plan yes/no (like going to relatives)
Presence of impaired groups (elderly, sick persons, etc.)
binary and quality of caringyes/no; capacity to provide treatment in temporary camps/or not
In the l'Aquila case an accuratesurvey of people needing care forcronic deseases whas conductedand patients were given thiertreatment since the first days
Existance of contingency plan fro threats at stake
binary; date of last production or update
yes/no; recent/old
availability of quick post event scenarios to be checked and used as a guidance in crisis management
binary and quality
yes/no; considering alsoenchained effects and systemicdamage/restricted to physicaldamage
Comfort (1999) refers to theNorthridge earthquake whenrepsonders could count on availablepre-set scenarios for rapid damageestimation
Training using the contingency plan
binary; frequency of trainingyes/no; every two years/only occasionally
Overlapping responsiblities among agencies
degree Low/medium/high
Overlapping responsibilities between thefiremen and other technicians of the civilprotection in usability surveys and firstshoring have sometimes delayed surveysand return of people to undamaged housesin the l'Aquila case
Established protocols for information sharing
binary yes/no
Established protocols for use
Ensure Methodology: Systemic Vulnerability parameters

Accessibility to public facilities on foot; transportation
Redundancy in lifelines systems
degree low/high
Degree of interdependance among lifelines
degree low/medium/high
Availability of emergency devices
binary (generators; tanks, etc) yes/no
Continuity plan for lifelines, individually and in a coordinated fashion
binary and qualityyes/no; considers also inducedhazards/ does not
Degree of dependance of critical public facilities from lifelines
degree low/medium/high
Degree of dependance of production sites from lifelines
degree low/medium/high
Accessibility to the plant and to markets
redundancy; quality of roads; usability; expected increase in travel time
redundant/not redundant;open/close roads; t.inc < 30 min/t.inc > 30 min
Contingency plan for na-tech binaryyes/no; considers all potential
on
s
The capacity to isolate priority nodes forfast recovery of lifelines; the availability oftanks, generators and any other means tomake lifelines and critical facilities work atleast partially after the event is clearlycrucial also for carrying out emergencyoperations. The Kobe and the Northridgeearthquakes showed clearly that suchavailability is much less available thanthought and than what would be requiredand possibile thanks to modern technologies
Ensure Methodology: Systemic Vulnerability parameters

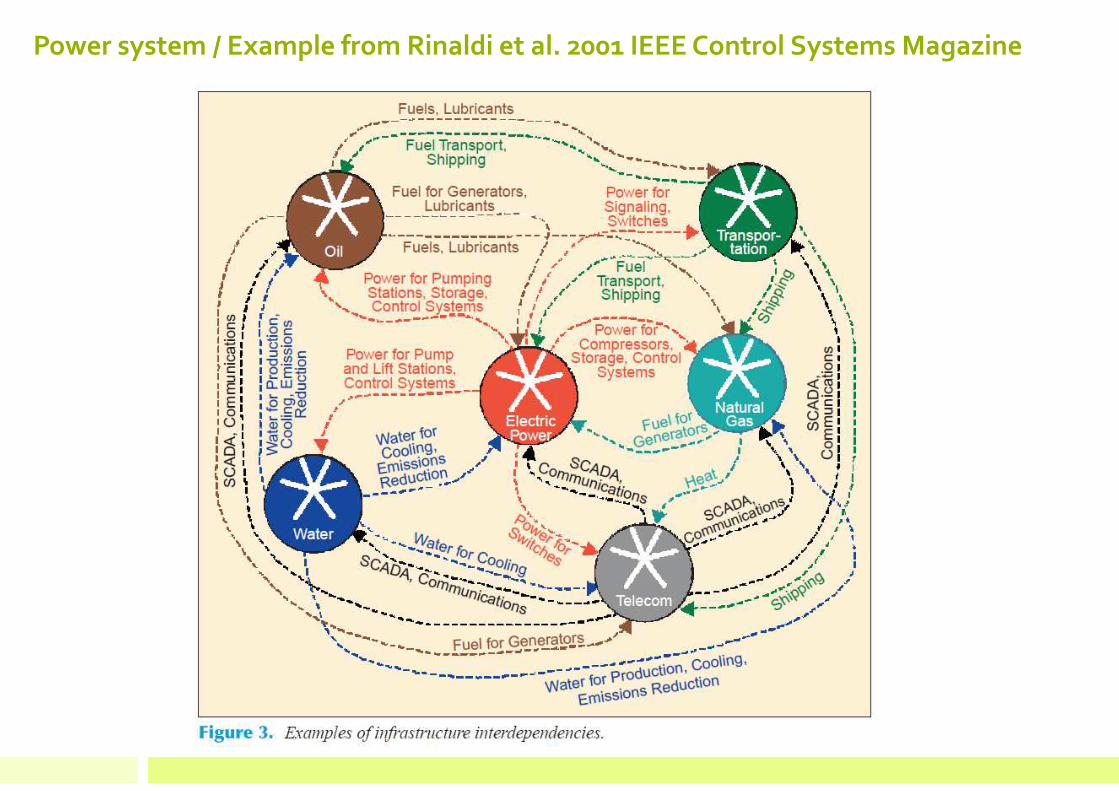
Power system / Example from Rinaldi et al. 2001 IEEE Control Systems Magazine

Power system / Example from Rinaldi et al. 2001 IEEE Control Systems Magazine
Power system / Example from Rinaldi et al. 2001 IEEE Control Systems Magazine

Power system / Example from Rinaldi et al. 2001 IEEE Control Systems Magazine
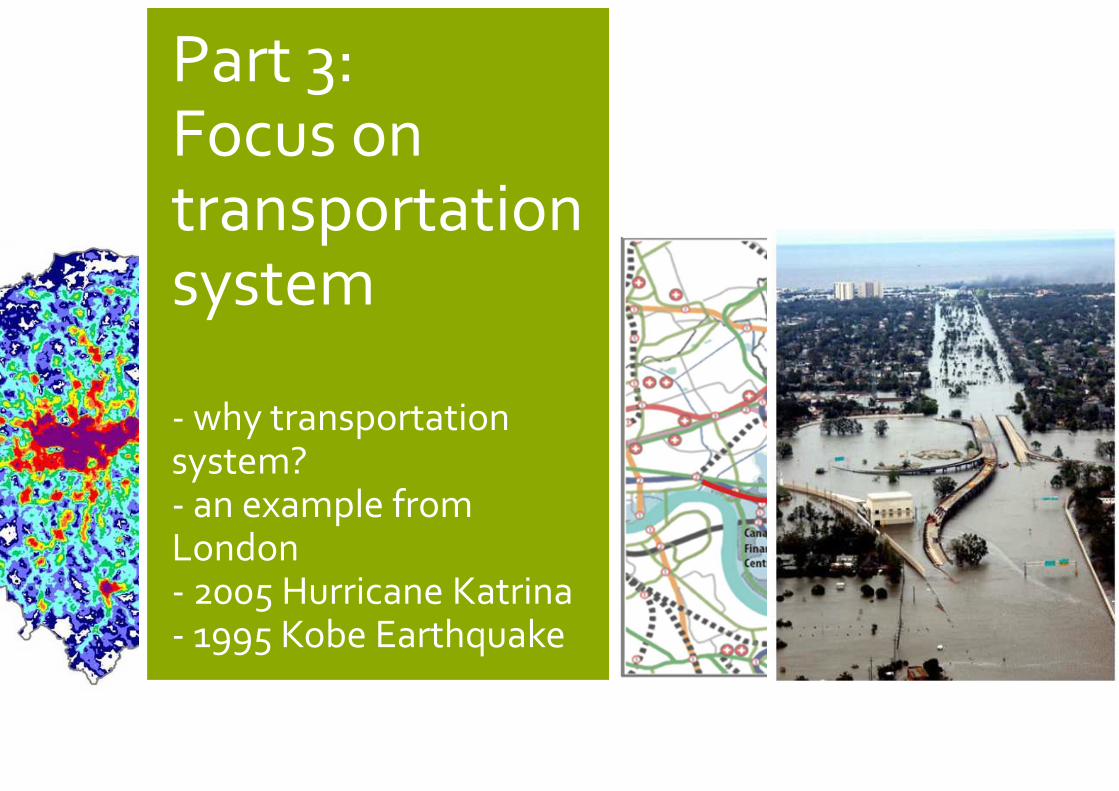
Part 3:Focus on transportation system
- why transportation system?- an example from London- 2005 Hurricane Katrina- 1995 Kobe Earthquake
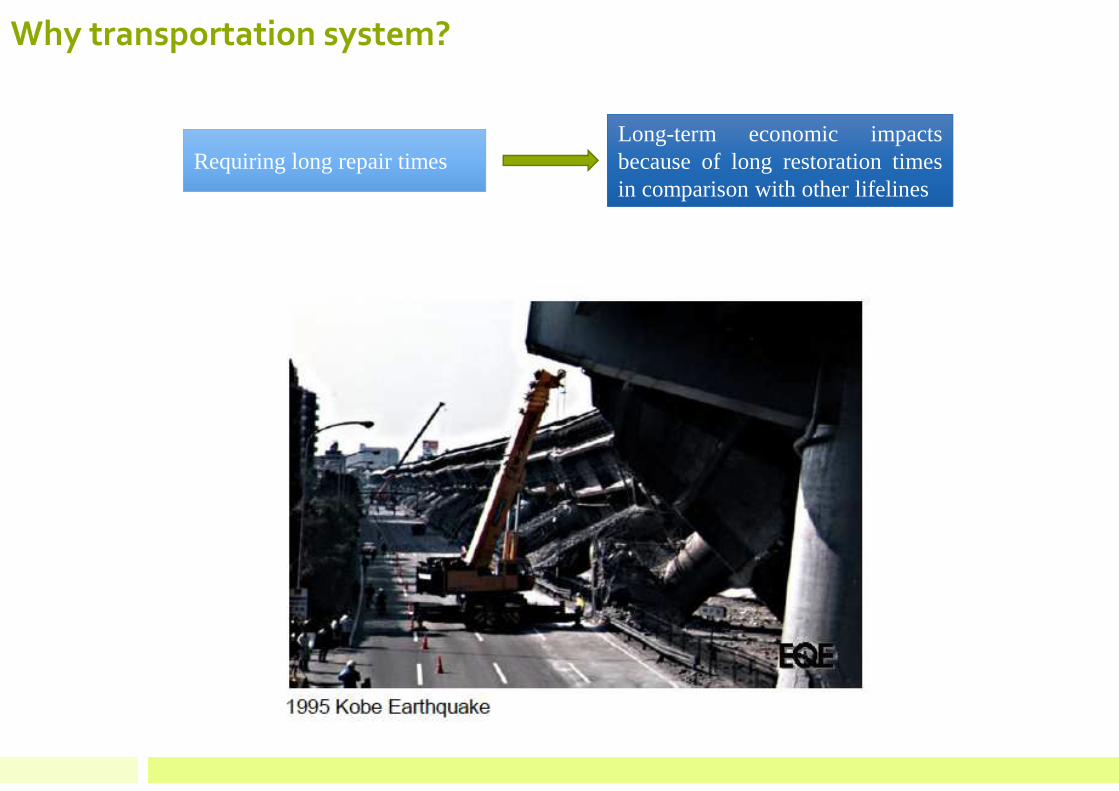
Requiring long repair timesLong-term economic impactsbecause of long restoration timesin comparison with other lifelines
Why transportation system?

Connectivity and interdependence
Why transportation system?

Strongly interdependent
Changing importance and function oftransportation system according to thedisaster phase
Why transportation system?
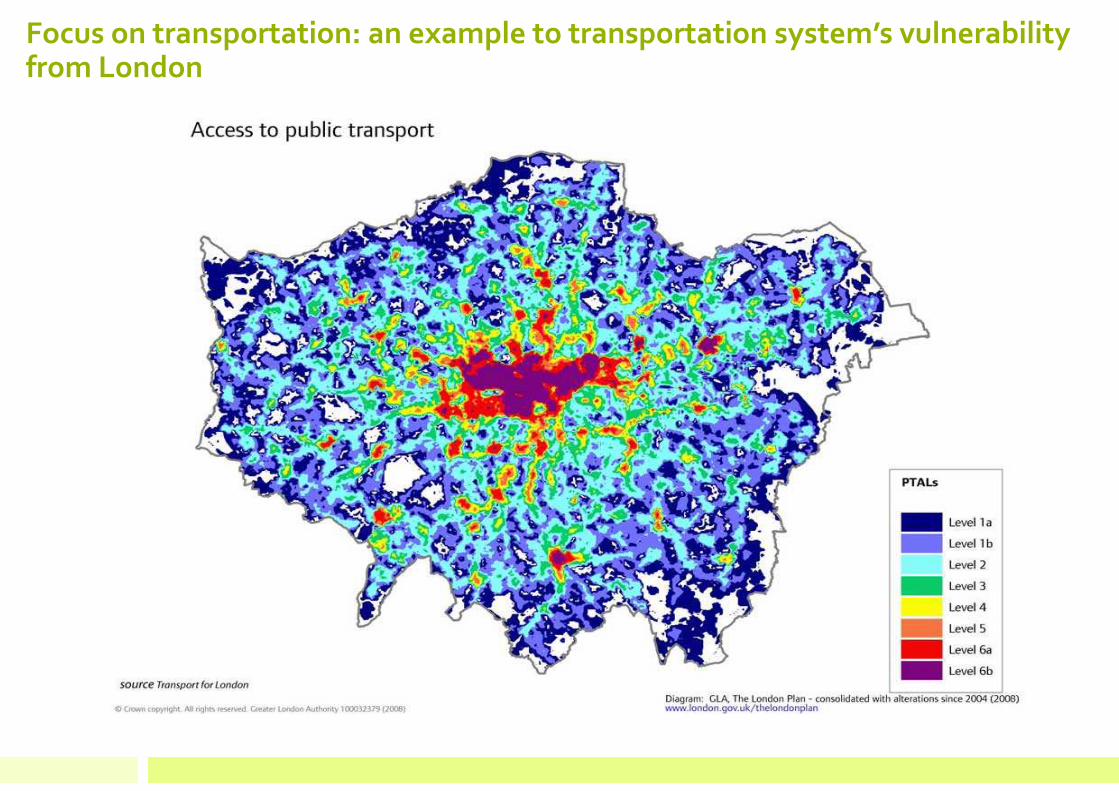
Focus on transportation: an example to transportation system’s vulnerability from London

30
The flooded area consists of3
Tube lines (District,Northern, Hammersmith&City), Railroad and LRT .
In total 26 stations (tube,
railroad, LRT) and CityAirport are located in the
flood risk area.
Besides, there are twohospitals(Newham University
Hospital, Cygnet Hospital
Becton) and1 Medical care(Docklands medical Care ) in
the flood risk area.London Boroughs of Tower Hamlet and Newham
Population: 308.000 Newham254.000 Tower HamletTotal: 562.000Population increase around %47 since 2001(Source: GLA population estimates 2011)
Area:36.22 km2 Newham19.77 km2 Tower Hamlet
This two boroughs consist of one of thehighest ethnic minority.Newham: 32.6% White British, 77,4% various ethnic minoritiesTower Hamlet: 46,9% White British, 53,1% various ethnic minoritiesDaily commuters in the area is around 100.000 people
Focus on transportation: an example to transportation system’s vulnerability from London
Connectivity and interdependence
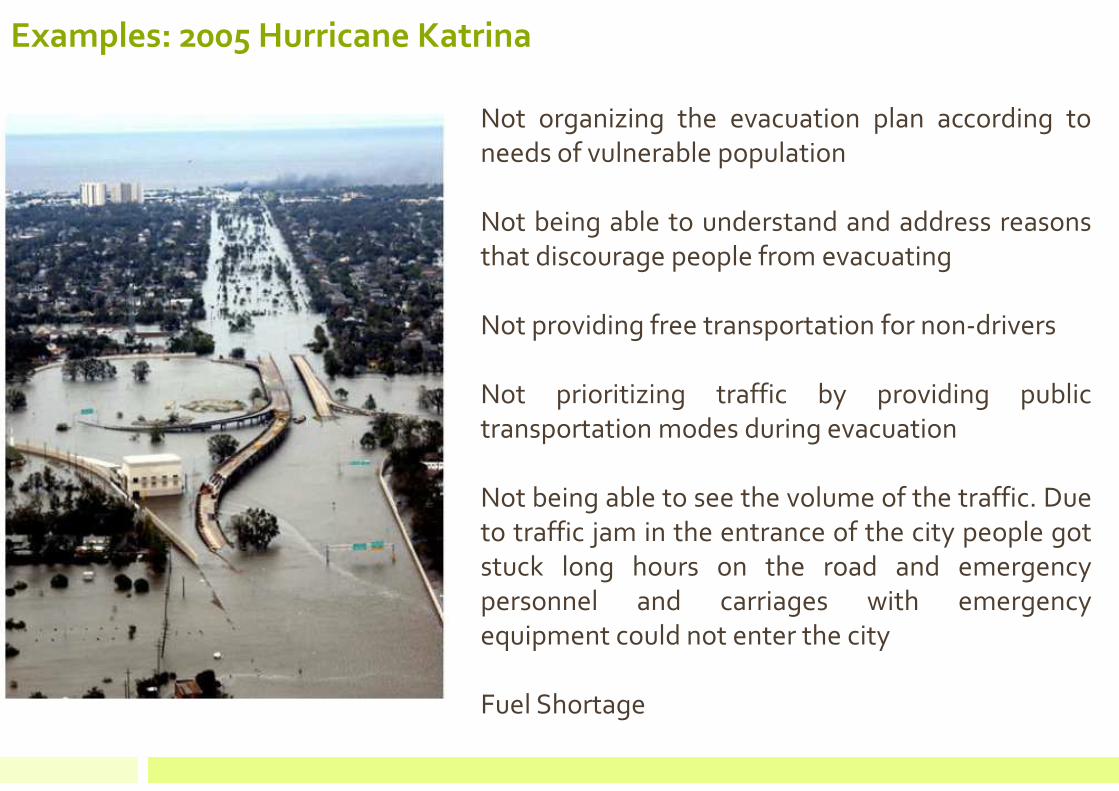
Examples: 2005 Hurricane Katrina
Not organizing the evacuation plan according to
needs of vulnerable population
Not being able to understand and address reasons
that discourage people from evacuating
Not providing free transportation for non-drivers
Not prioritizing traffic by providing public
transportation modes during evacuation
Not being able to see the volume of the traffic. Due
to traffic jam in the entrance of the city people got
stuck long hours on the road and emergency
personnel and carriages with emergency
equipment could not enter the city
Fuel Shortage

Examples: 1995 Kobe Earthquake
The collapsed Hanshin express way, which
connects Kobe and Osaka cities, made a tap
effect on traffic.
Due to traffic jam rescue activities were delayed
Helicopters were used as a solution to traffic
jam. However, noise of the helicopters
hampered search and rescue teams who were
trying to hear possible voices coming from the
debris.
Ports were destroyed and reconstruction of the
ports took several months. Due to competition
between ports, other ports in the region gained
importance.
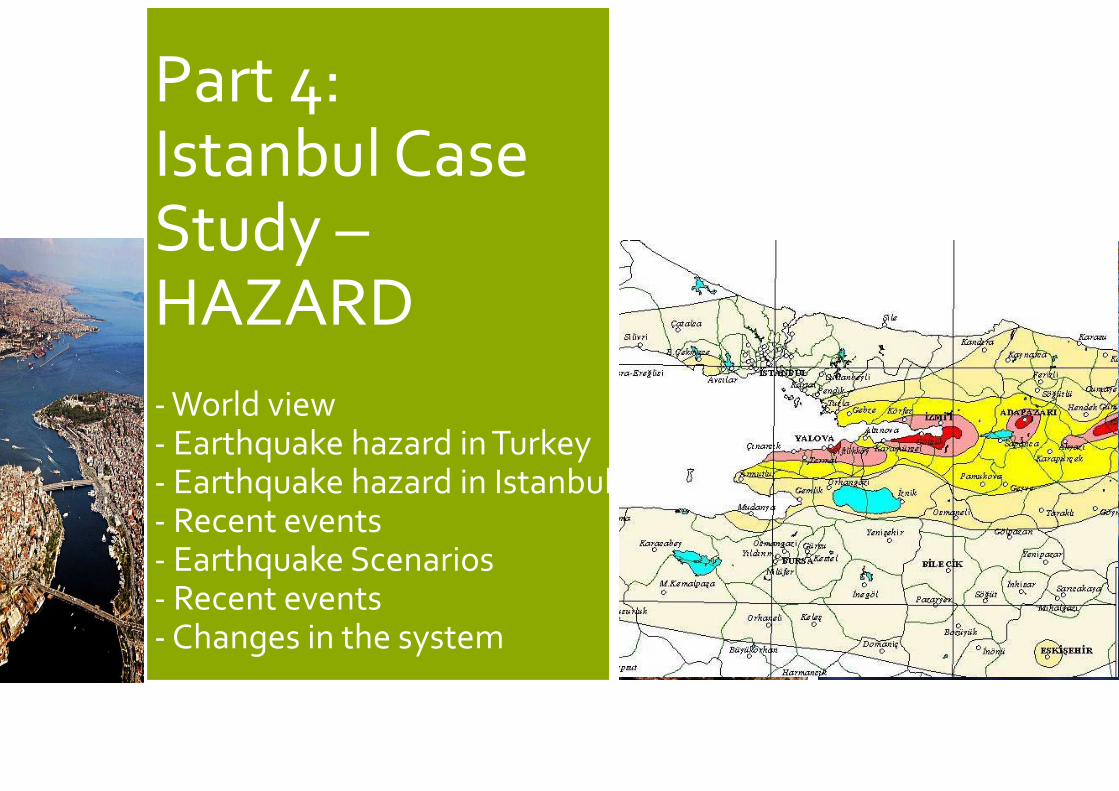
Part 4:Istanbul Case Study –HAZARD
- World view- Earthquake hazard in Turkey- Earthquake hazard in Istanbul- Recent events- Earthquake Scenarios- Recent events- Changes in the system
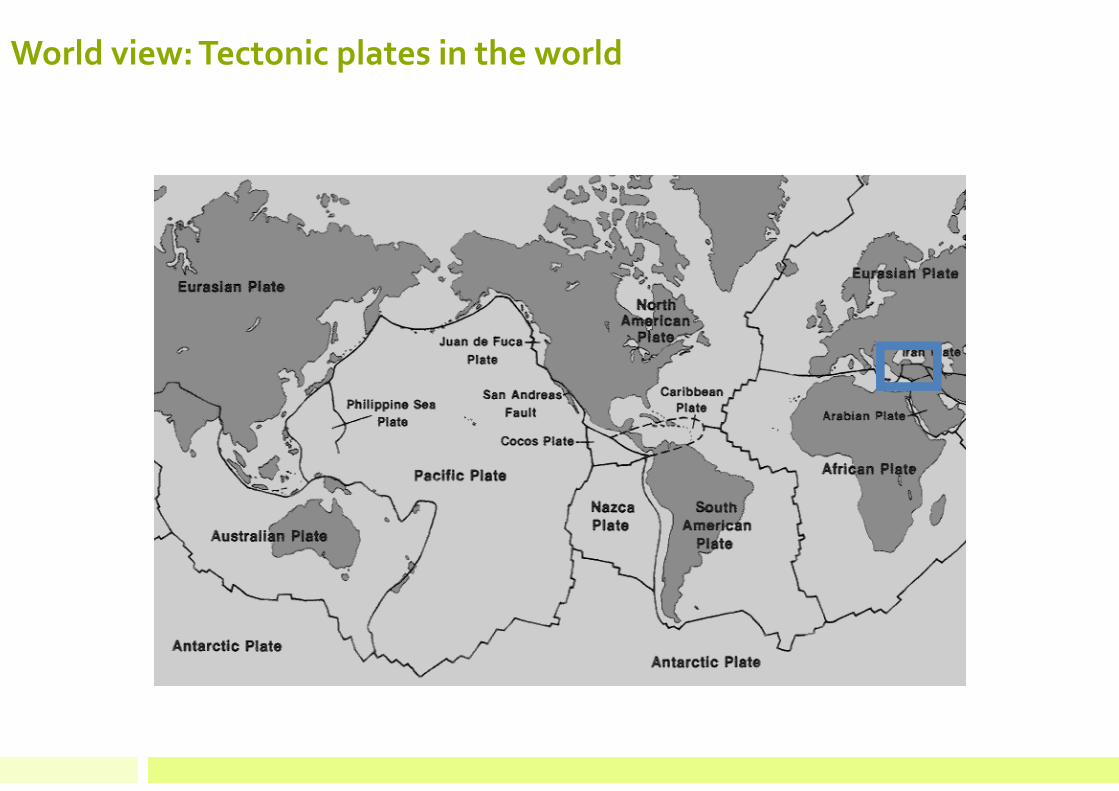
World view: Tectonic plates in the world

World view: Map of Earthquake Epicenters In The World
358,214 events recorded between 1963 & 1998
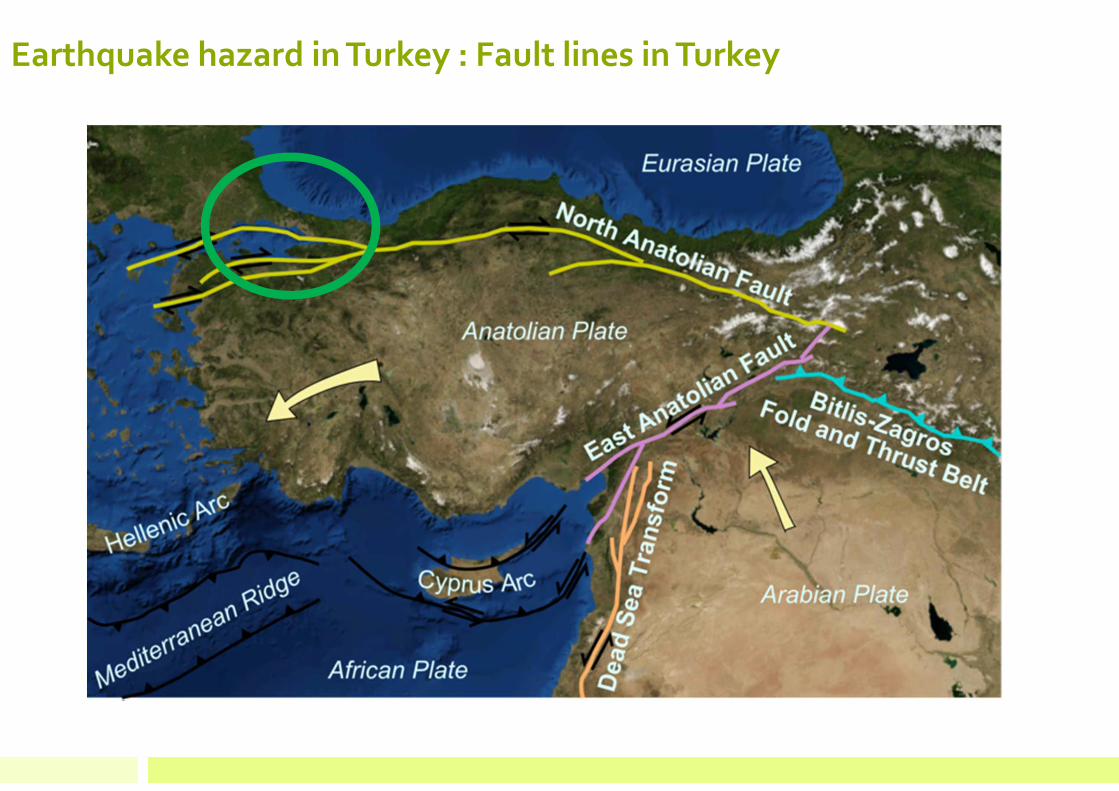
Earthquake hazard in Turkey : Fault lines in Turkey

Earthquake hazard in Turkey: Earthquake prone areas in Turkey
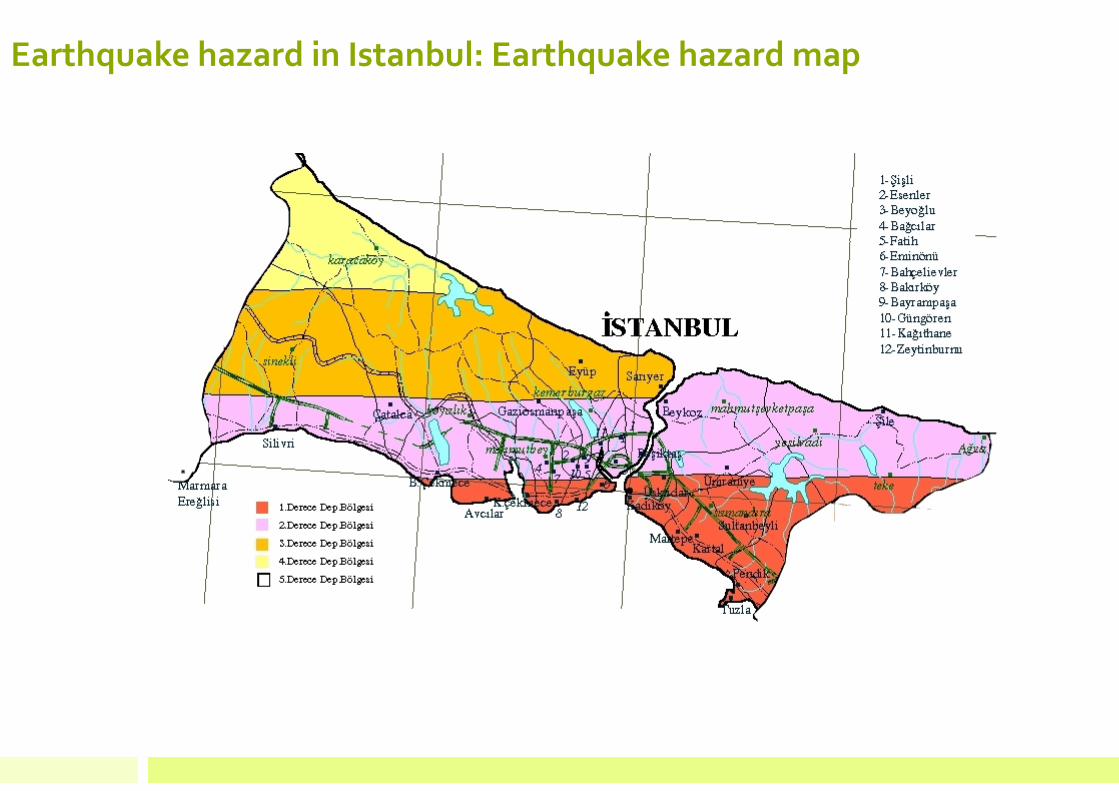
Earthquake hazard in Istanbul: Earthquake hazard map
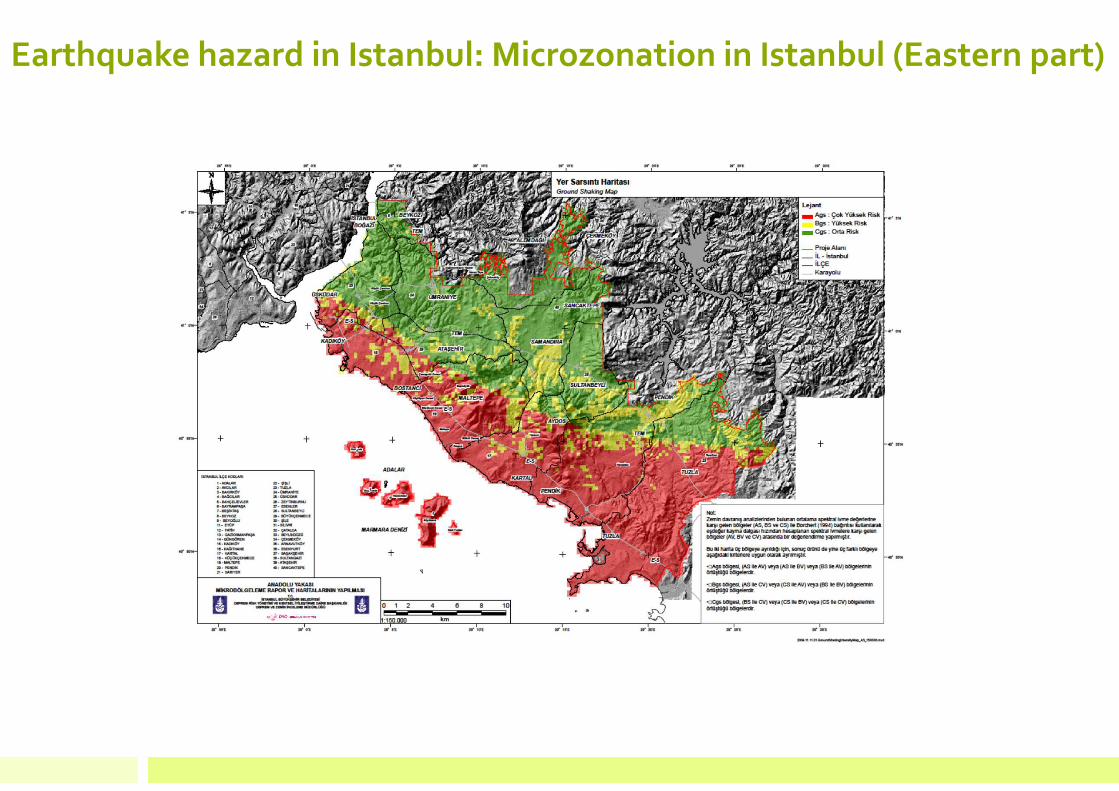
Earthquake hazard in Istanbul: Microzonation in Istanbul (Eastern part)
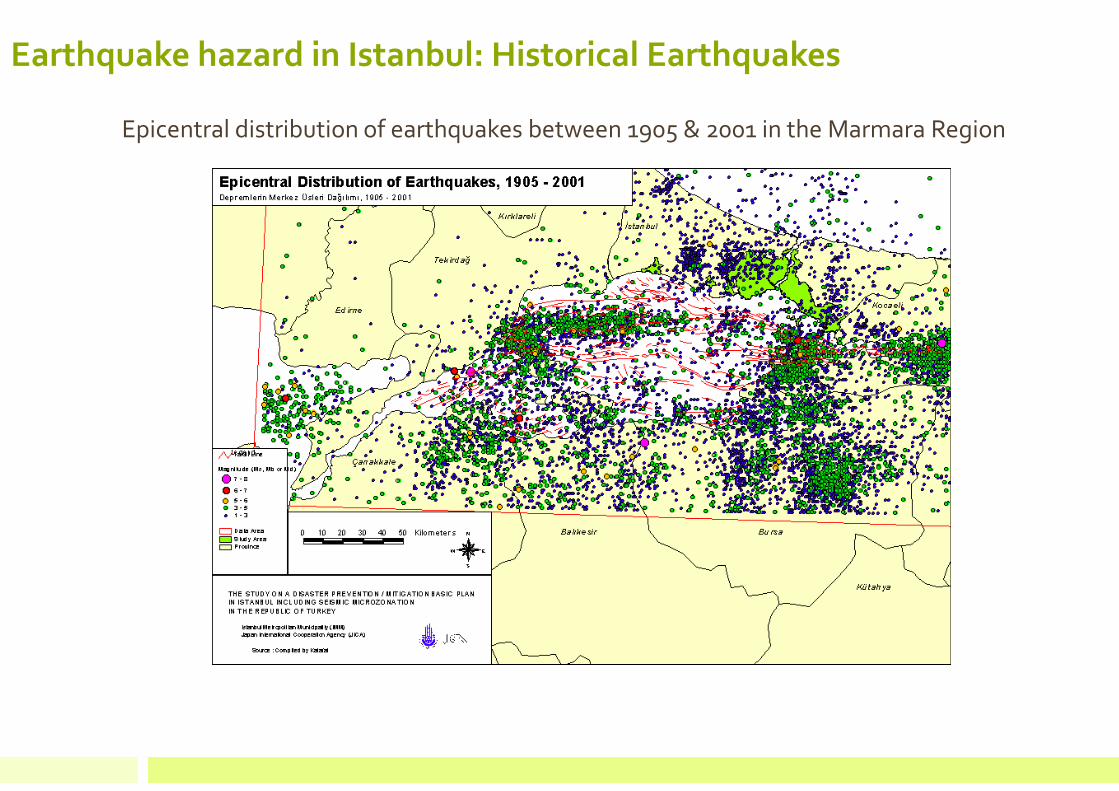
Epicentral distribution of earthquakes between 1905 & 2001 in the Marmara Region
Earthquake hazard in Istanbul: Historical Earthquakes

Earthquake hazard in Istanbul: Historical Earthquakes
Major earthquakes in the Marmara Region
between 1500-2000 (Source: Ambrasseys and Jackson, 2000)
Location, Mw, intensity, number of
deaths and total population data of historical earthquakes in 1509, 1719, 1766
and 1894 in Istanbul
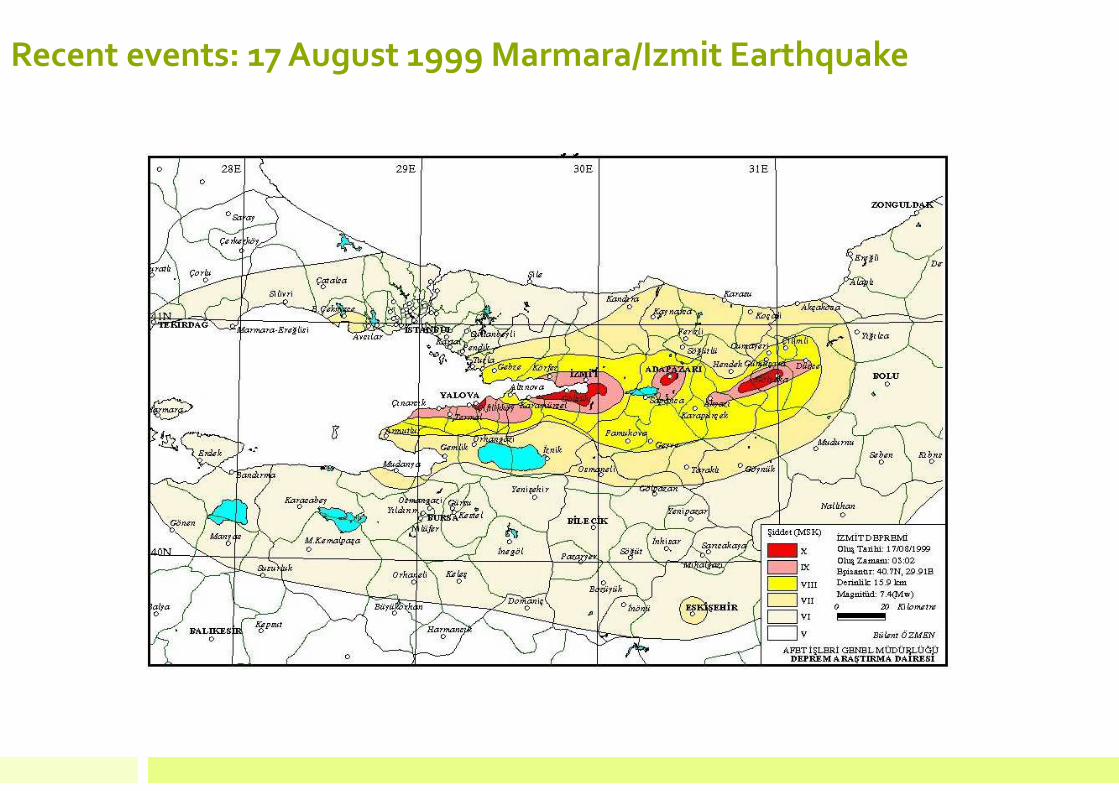
Recent events: 17 August 1999 Marmara/Izmit Earthquake

Recent events: 17 August 1999 Marmara/Izmit Earthquake
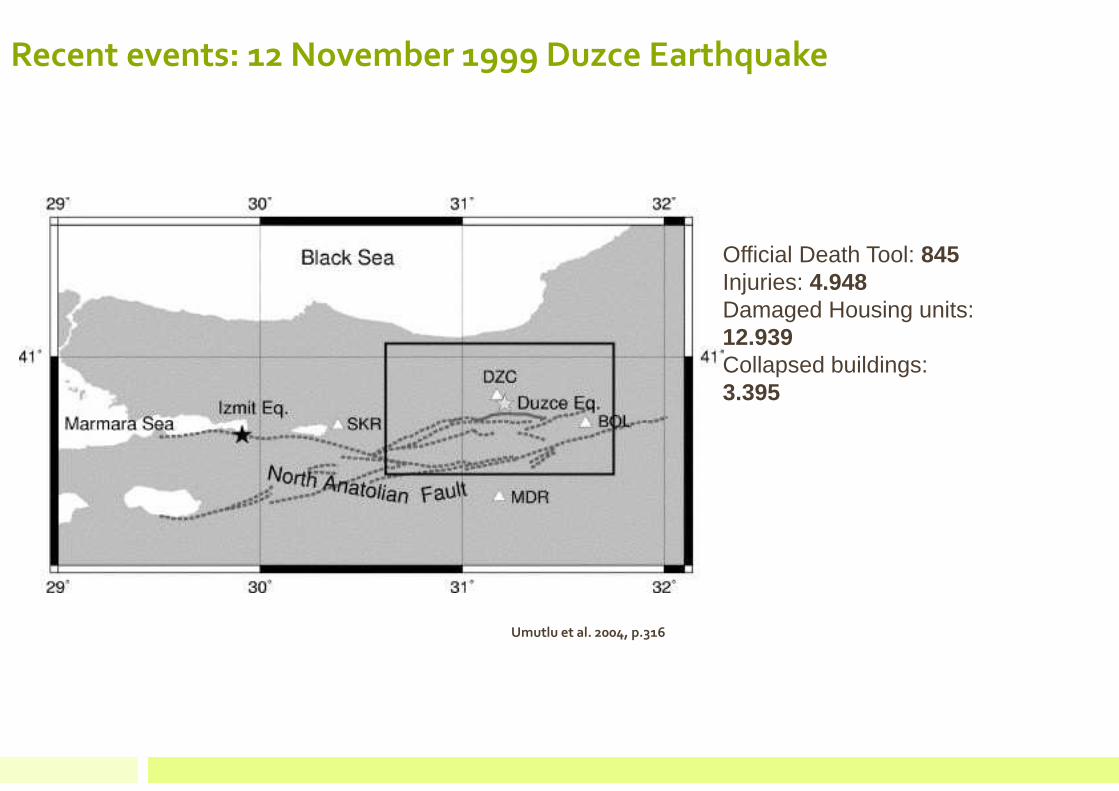
Official Death Tool: 845Injuries: 4.948Damaged Housing units: 12.939Collapsed buildings: 3.395
Recent events: 12 November 1999 Duzce Earthquake
Umutlu et al. 2004, p.316
Source: H. Sucuoglu and TolgaYilmaz, Düzce, Turkey: A City Hit by Two Major Earthquakes in 1999 within Three Months (no date)
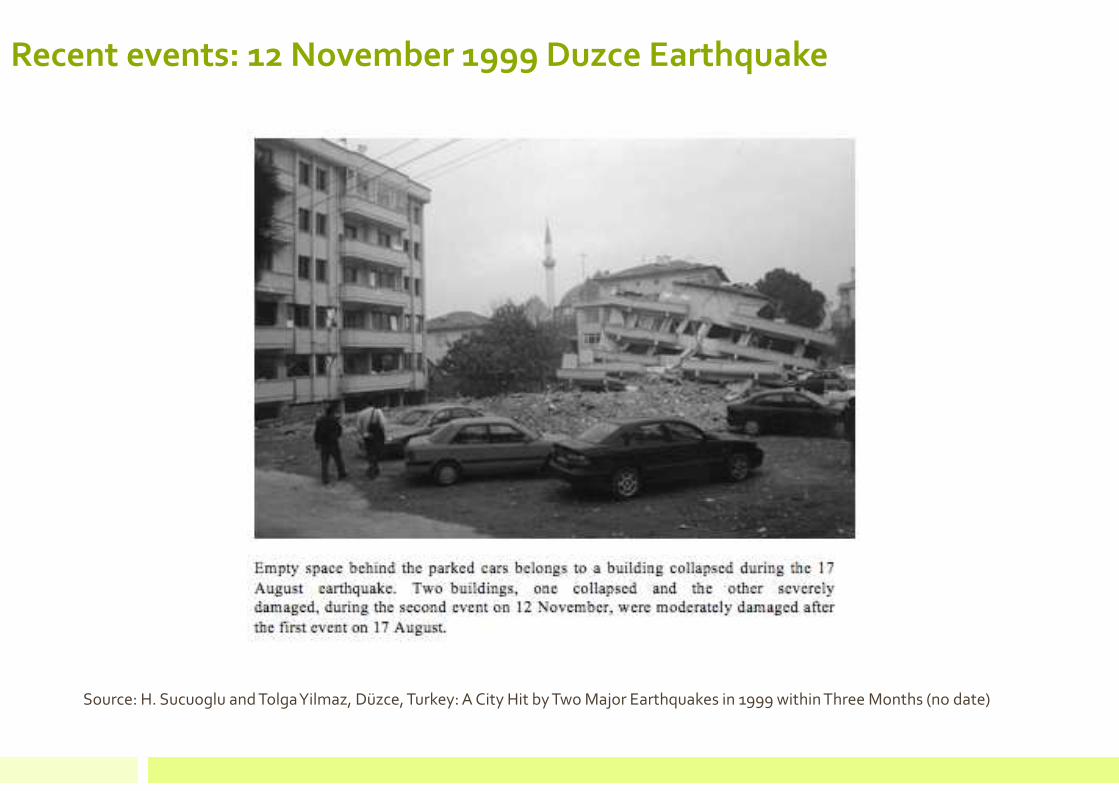
Recent events: 12 November 1999 Duzce Earthquake

Source: H. Sucuoglu and TolgaYilmaz, Düzce, Turkey: A City Hit by Two Major Earthquakes in 1999 within Three Months (no date)
Recent events - damage : 17 August & 12 November 1999 Earthquakes
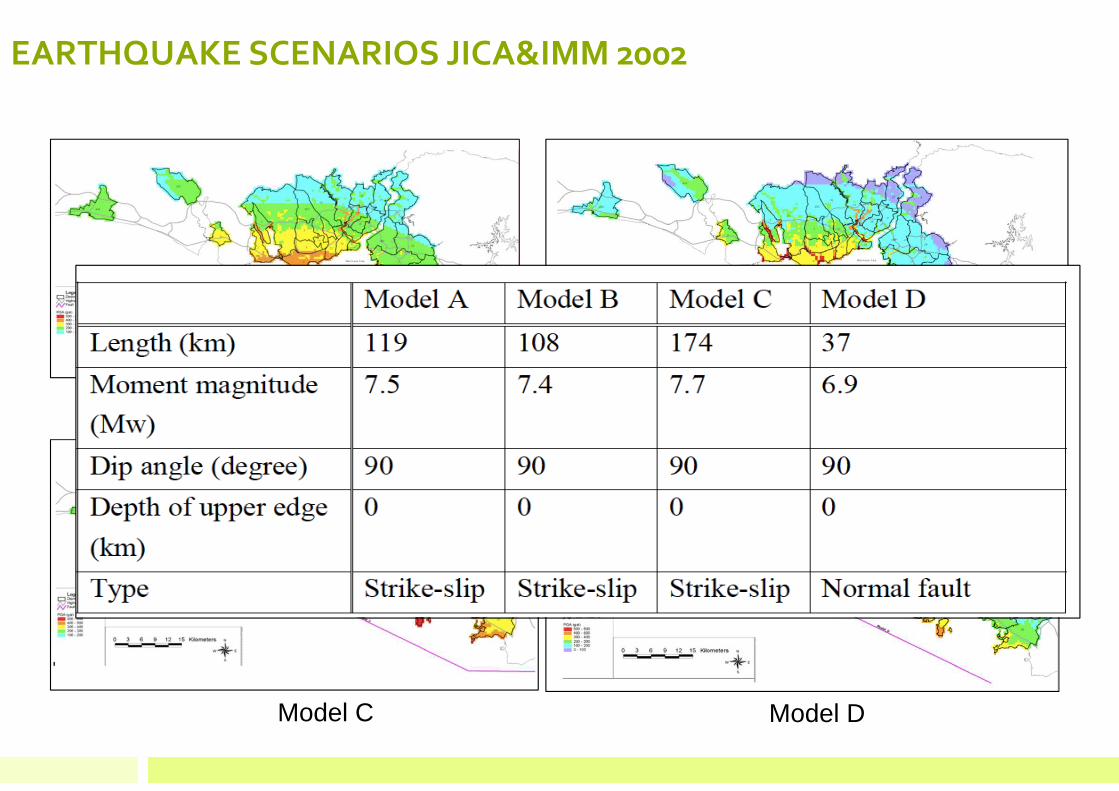
Model C
Model BModel A
Model D
EARTHQUAKE SCENARIOS JICA&IMM 2002
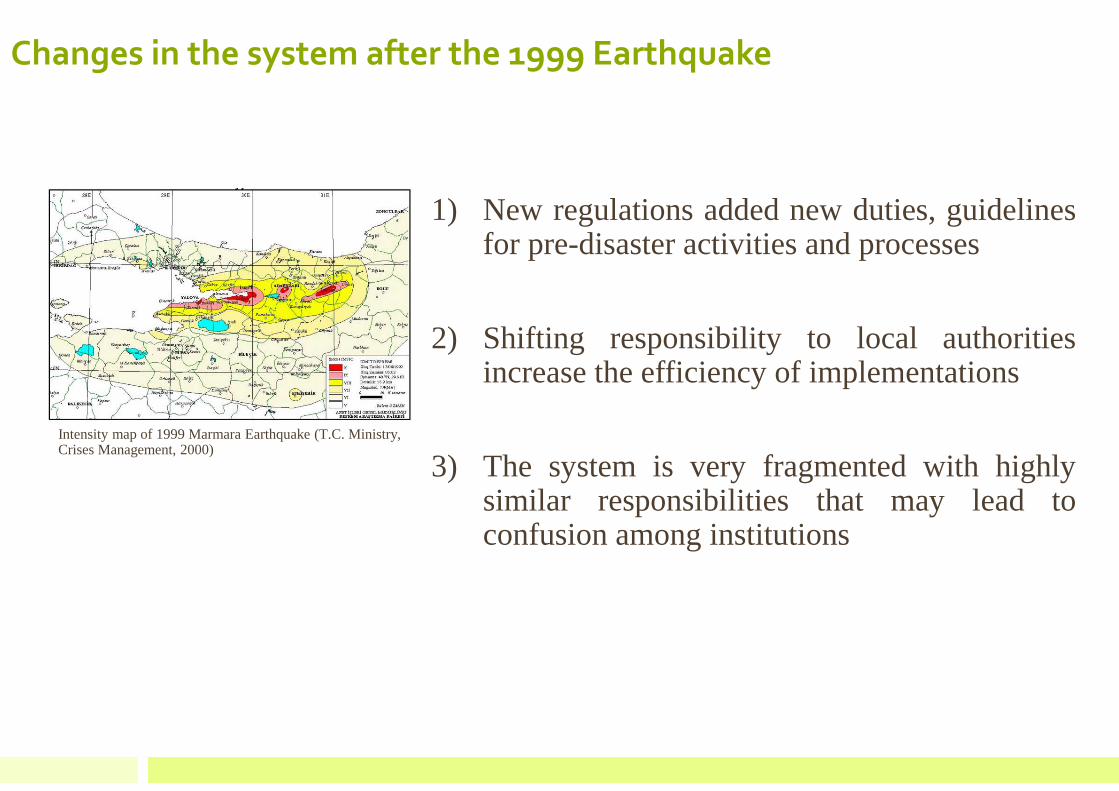
Changes in the system after the 1999 Earthquake
1) New regulations added newduties, guidelinesfor pre-disaster activities and processes
2) Shifting responsibility to local authoritiesincrease the efficiency of implementations
3) The systemis very fragmented with highlysimilar responsibilities that may lead toconfusion among institutions
Intensity map of 1999 Marmara Earthquake (T.C. Ministry, Crises Management, 2000)

Part 5: Istanbul Case Study -VULNERABILITY
- Current situation- Vulnerability of megacity Istanbul- Retrospective view of 80 years of vulnerability- Istanbul Master Plan
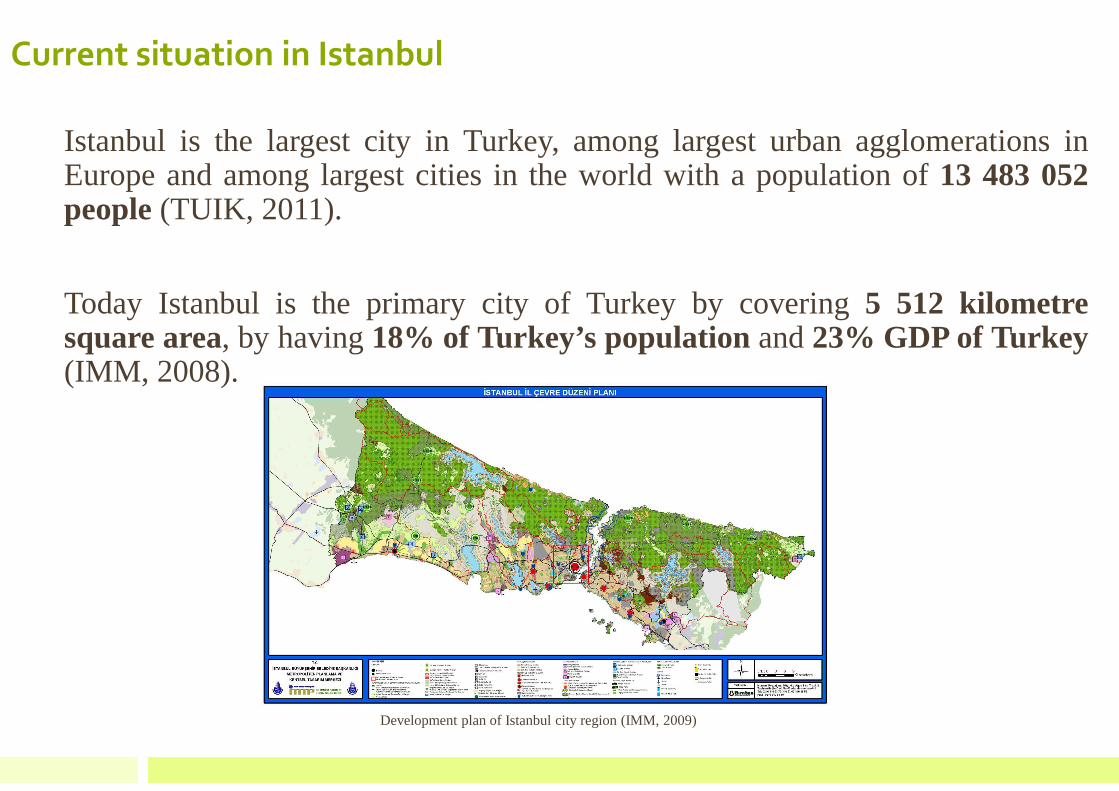
Current situation in Istanbul
Istanbul is the largest city in Turkey, among largest urban agglomerations inEurope and among largest cities in the world with a population of13 483 052people(TUIK, 2011).
Today Istanbul is the primary city of Turkey by covering5 512 kilometresquare area, by having18% of Turkey’s population and23% GDP of Turkey(IMM, 2008).
Development plan of Istanbul city region (IMM, 2009)
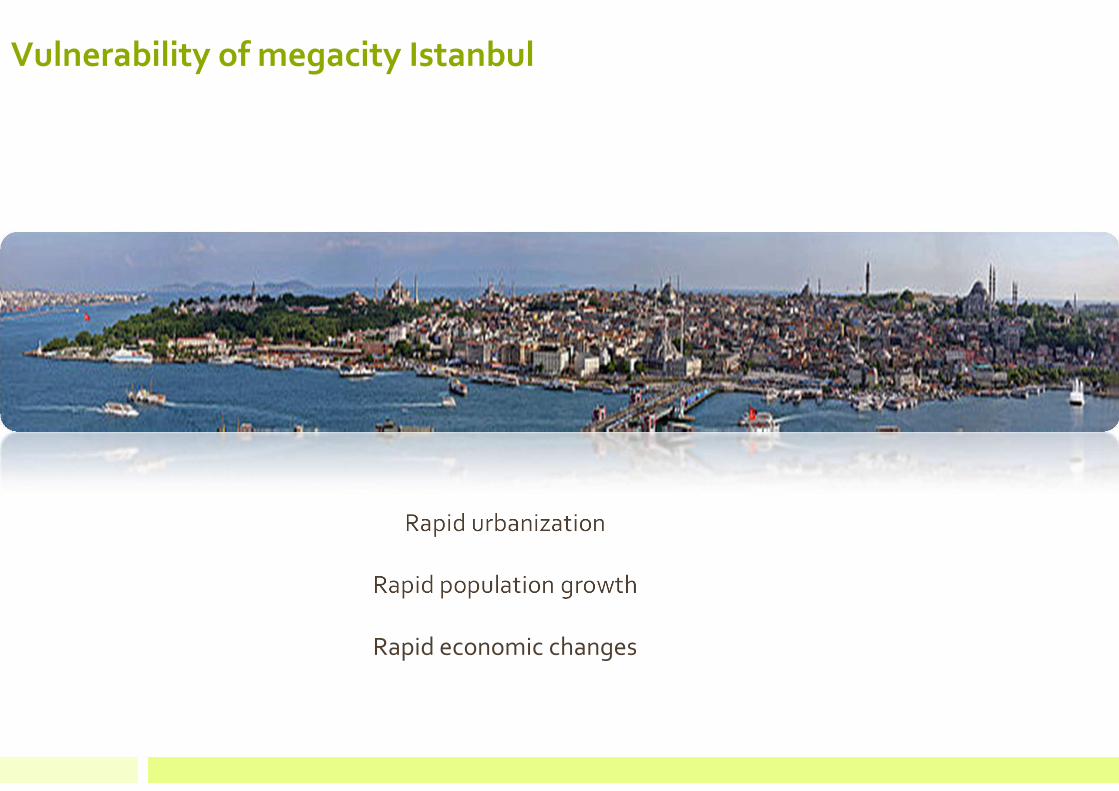
Vulnerability of megacity Istanbul
Rapid urbanization
Rapid population growth
Rapid economic changes
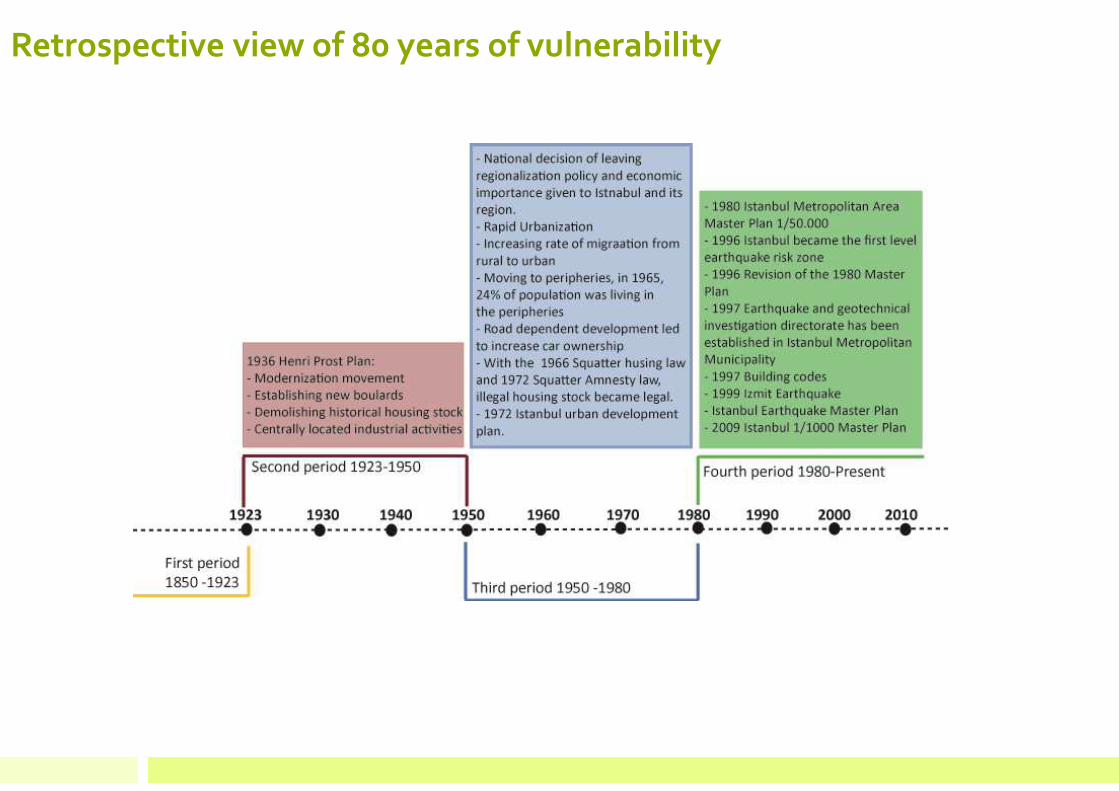
Retrospective view of 80 years of vulnerability
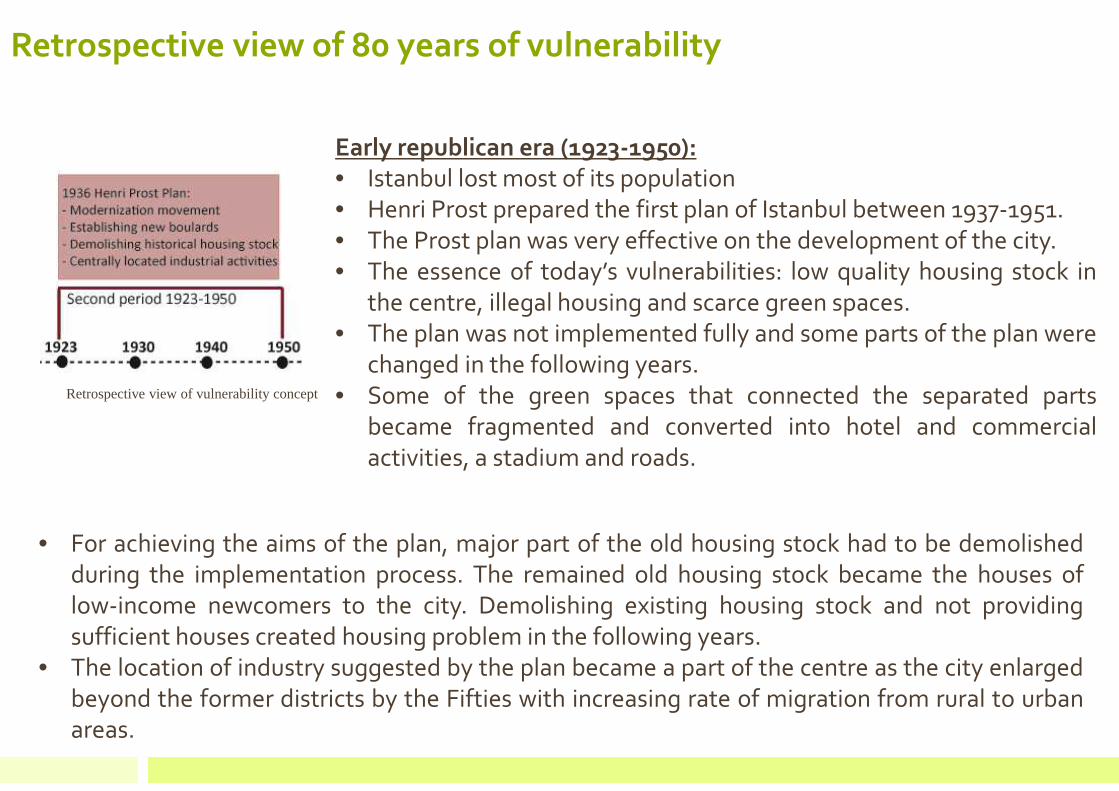
Retrospective view of vulnerability concept
Early republican era (1923-1950): • Istanbul lost most of its population
• Henri Prost prepared the first plan of Istanbul between 1937-1951.
• The Prost plan was very effective on the development of the city.
• The essence of today’s vulnerabilities: low quality housing stock in
the centre, illegal housing and scarce green spaces.
• The plan was not implemented fully and some parts of the plan were
changed in the following years.
• Some of the green spaces that connected the separated parts
became fragmented and converted into hotel and commercial
activities, a stadium and roads.
• For achieving the aims of the plan, major part of the old housing stock had to be demolished
during the implementation process. The remained old housing stock became the houses of
low-income newcomers to the city. Demolishing existing housing stock and not providing
sufficient houses created housing problem in the following years.
• The location of industry suggested by the plan became a part of the centre as the city enlarged
beyond the former districts by the Fifties with increasing rate of migration from rural to urban
areas.
Retrospective view of 80 years of vulnerability
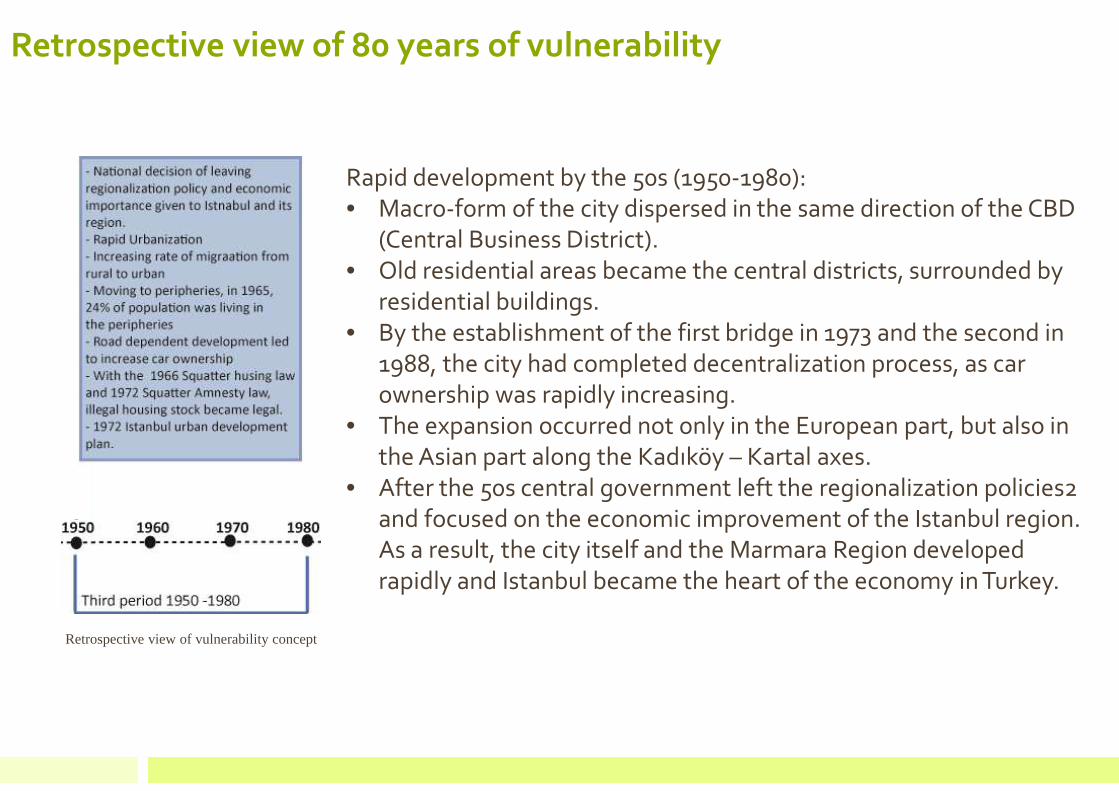
Retrospective view of vulnerability concept
Rapid development by the 50s (1950-1980):
• Macro-form of the city dispersed in the same direction of the CBD
(Central Business District).
• Old residential areas became the central districts, surrounded by
residential buildings.
• By the establishment of the first bridge in 1973 and the second in
1988, the city had completed decentralization process, as car
ownership was rapidly increasing.
• The expansion occurred not only in the European part, but also in
the Asian part along the Kadıköy – Kartal axes.
• After the 50s central government left the regionalization policies2
and focused on the economic improvement of the Istanbul region.
As a result, the city itself and the Marmara Region developed
rapidly and Istanbul became the heart of the economy in Turkey.
Retrospective view of 80 years of vulnerability
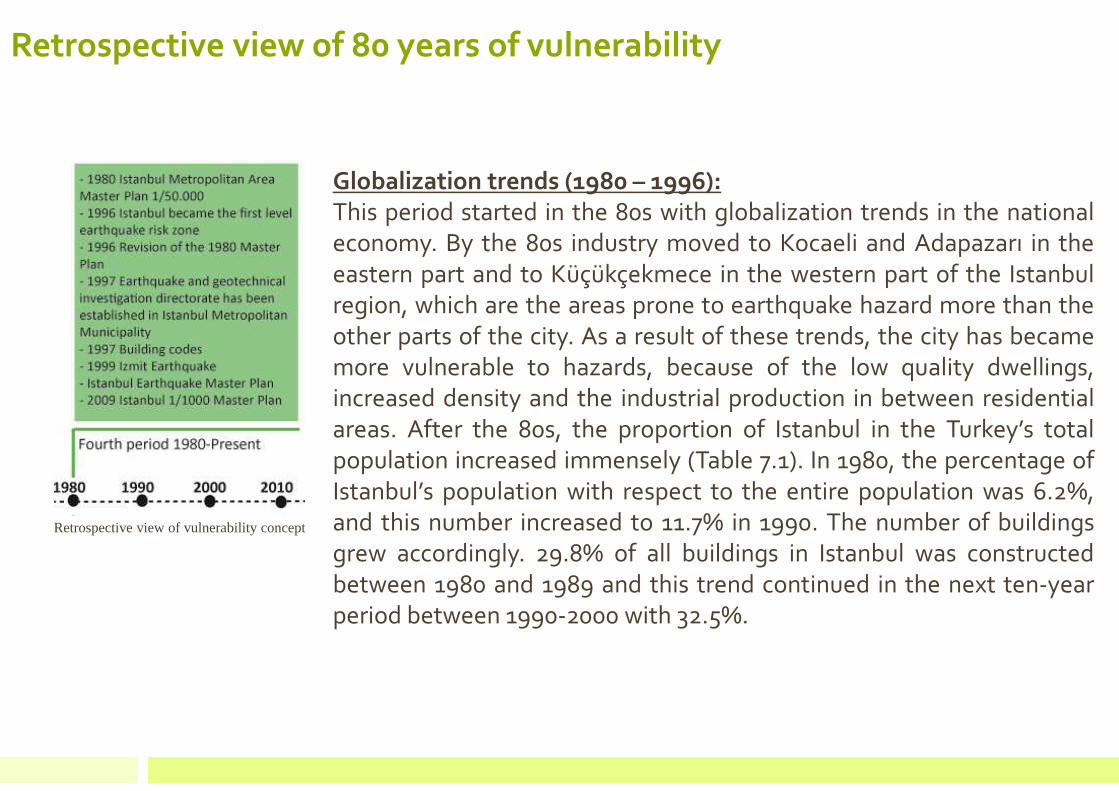
Retrospective view of vulnerability concept
Globalization trends (1980 – 1996): This period started in the 80s with globalization trends in the national
economy. By the 80s industry moved to Kocaeli and Adapazarı in the
eastern part and to Küçükçekmece in the western part of the Istanbul
region, which are the areas prone to earthquake hazard more than the
other parts of the city. As a result of these trends, the city has became
more vulnerable to hazards, because of the low quality dwellings,
increased density and the industrial production in between residential
areas. After the 80s, the proportion of Istanbul in the Turkey’s total
population increased immensely (Table 7.1). In 1980, the percentage of
Istanbul’s population with respect to the entire population was 6.2%,
and this number increased to 11.7% in 1990. The number of buildings
grew accordingly. 29.8% of all buildings in Istanbul was constructed
between 1980 and 1989 and this trend continued in the next ten-year
period between 1990-2000 with 32.5%.
Retrospective view of 80 years of vulnerability

Retrospective view of vulnerability concept
Globalization trends (1996 – present): The number of buildings
constructed in different periods helps to know the number of
vulnerable buildings approximately, because Istanbul became a first
level earthquake zone in 1996. Before it was classified as a second
level earthquake zone and therefore building codes were less
restrictive. With the changes of the building codes in 1997, the newly
constructed buildings became more resistant. According to the
previously given numbers, 482.763 buildings were constructed before
1990. Therefore, more than half of the built stock was built according
to a less stringent building code.
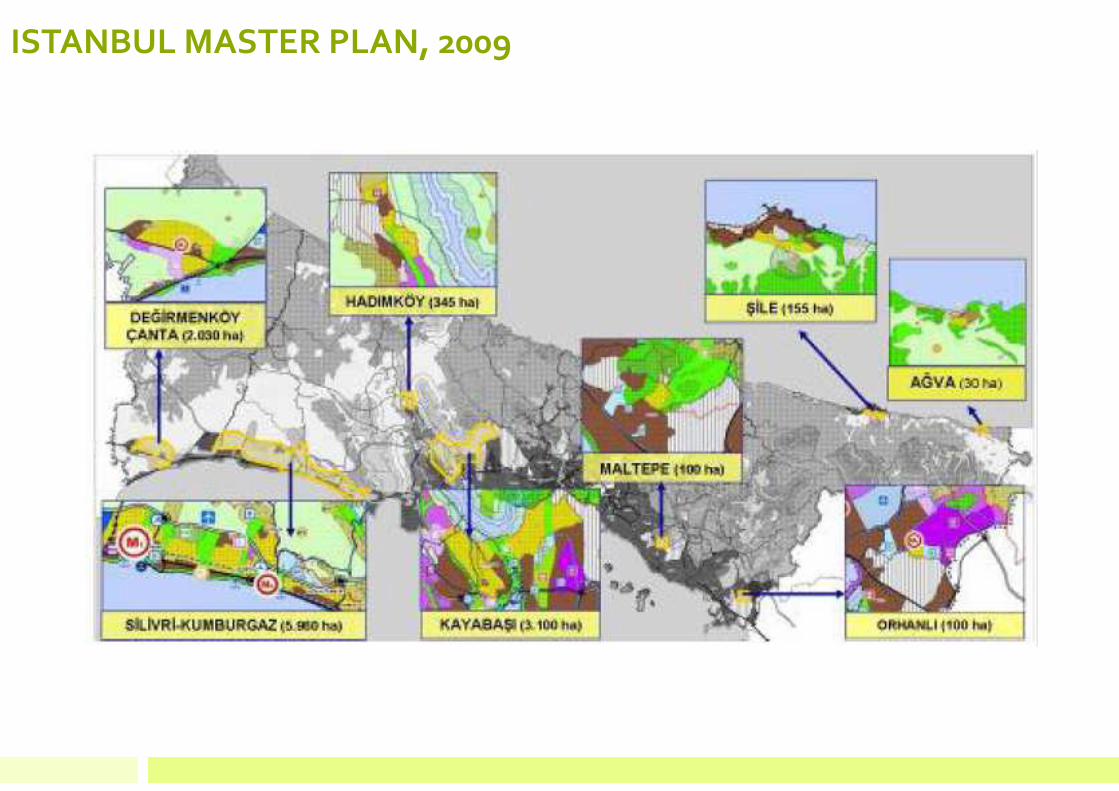
The 1/100 000 development plan of Istanbul was approved in 2009 by the Istanbul Metropolitan
Municipality. The plan decentralizes the increasing population to the North in the Western part
of Istanbul by opening new housing areas and commits the third airport near to Black Sea.
Having the natural resources, water reserves, agricultural areas and forests in the North, which
are crucial for sustainability of the city, forces to look for other options.
Retrospective view of 80 years of vulnerability
Retrospective view of 80 years of vulnerability
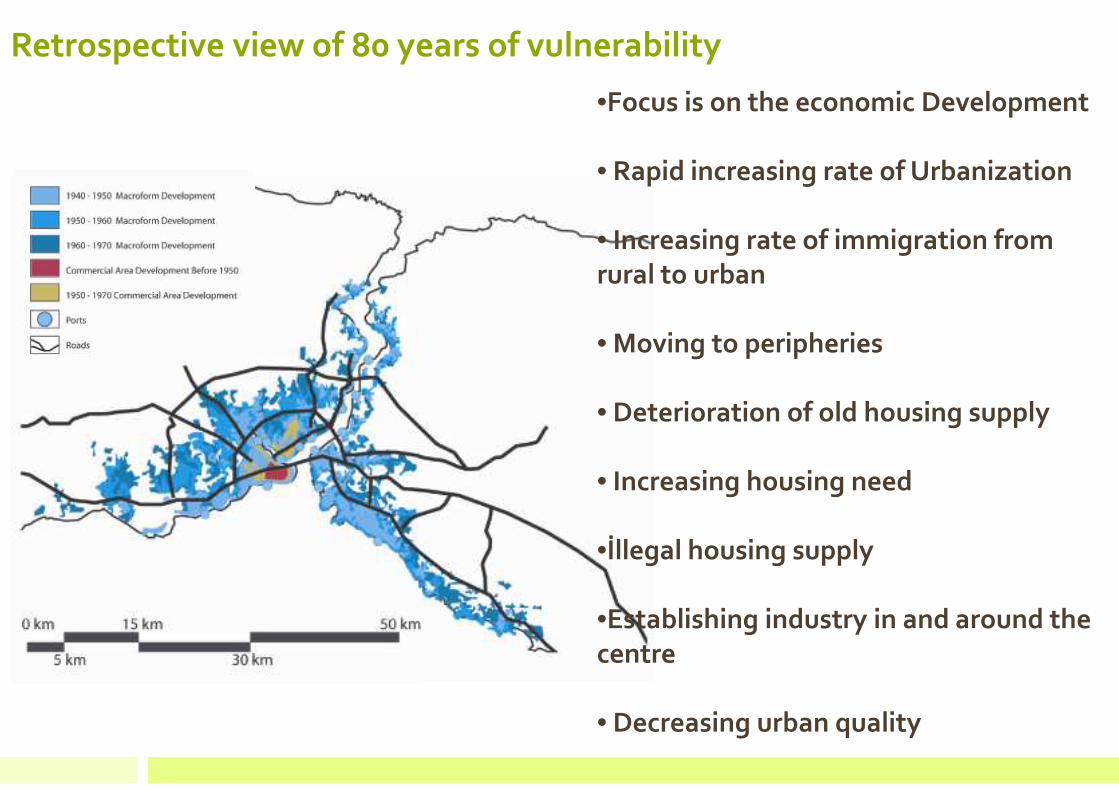
•Focus is on the economic Development
• Rapid increasing rate of Urbanization
• Increasing rate of immigration from rural to urban
• Moving to peripheries
• Deterioration of old housing supply
• Increasing housing need
•İllegal housing supply
•Establishing industry in and around the centre
• Decreasing urban quality

•Development through the lakes in the Western part, and through Izmit in the Eastern part of the city.
• The meaning of the squatter houses had changed from shelter to a property which can be sold and rented by the squatter amnesty law.
• First interaction between scientific community and governmental units
Retrospective view of 80 years of vulnerability

ISTANBUL MASTER PLAN, 2009
ISTANBUL MASTER PLAN, 2009

Part 6: Social vulnerability -Current awareness and preparedness of earthquake risk
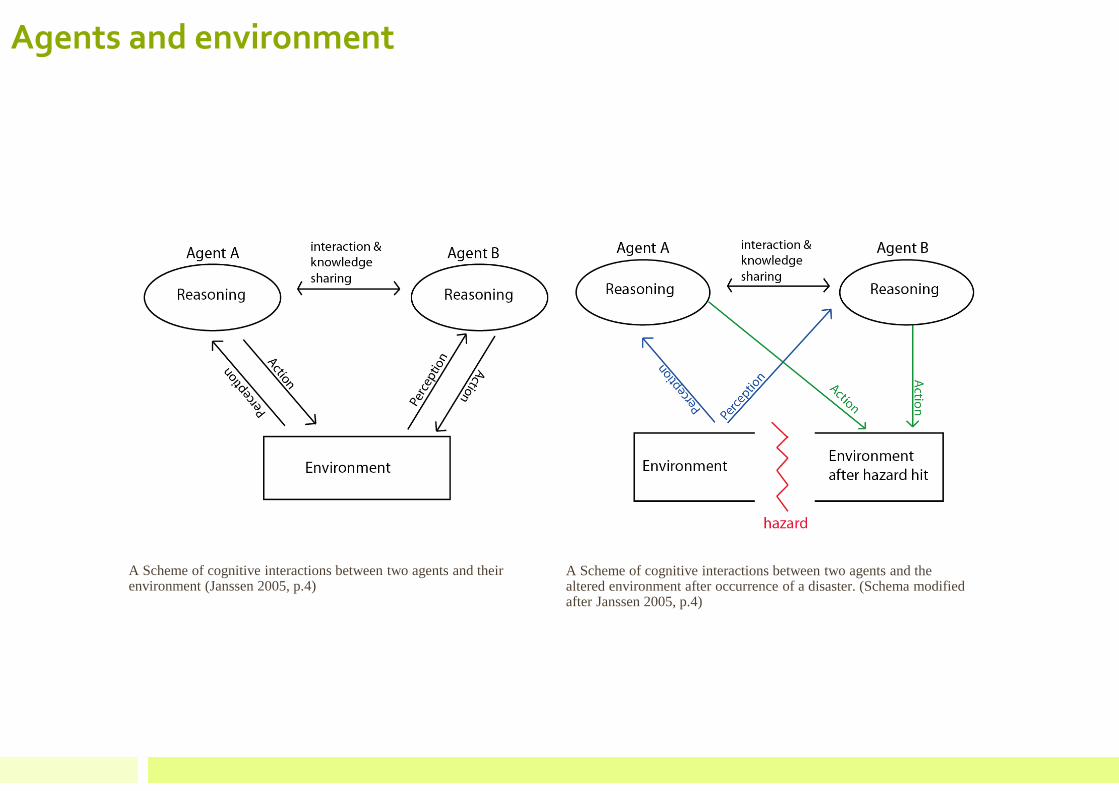
A Scheme of cognitive interactions between two agents and the altered environment after occurrence of a disaster. (Schema modified after Janssen 2005, p.4)
A Scheme of cognitive interactions between two agents and their environment (Janssen 2005, p.4)
Agents and environment
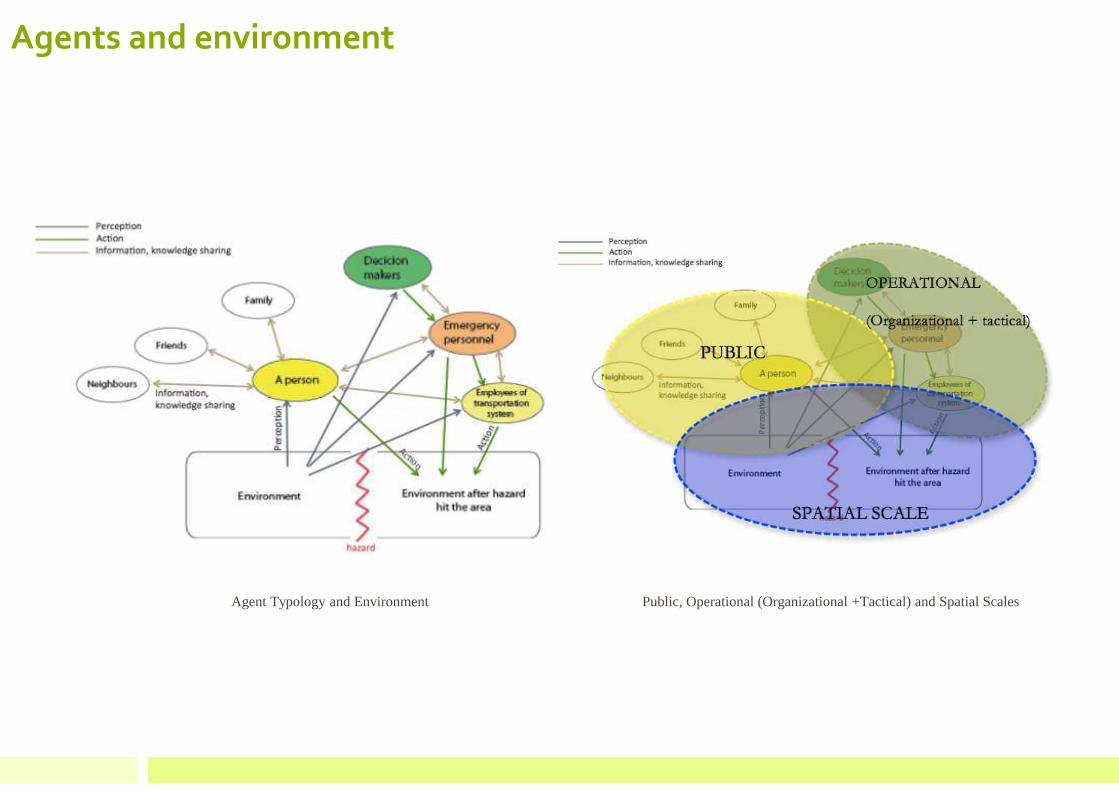
Public, Operational (Organizational +Tactical) and Spatial ScalesAgent Typology and Environment
Agents and environment
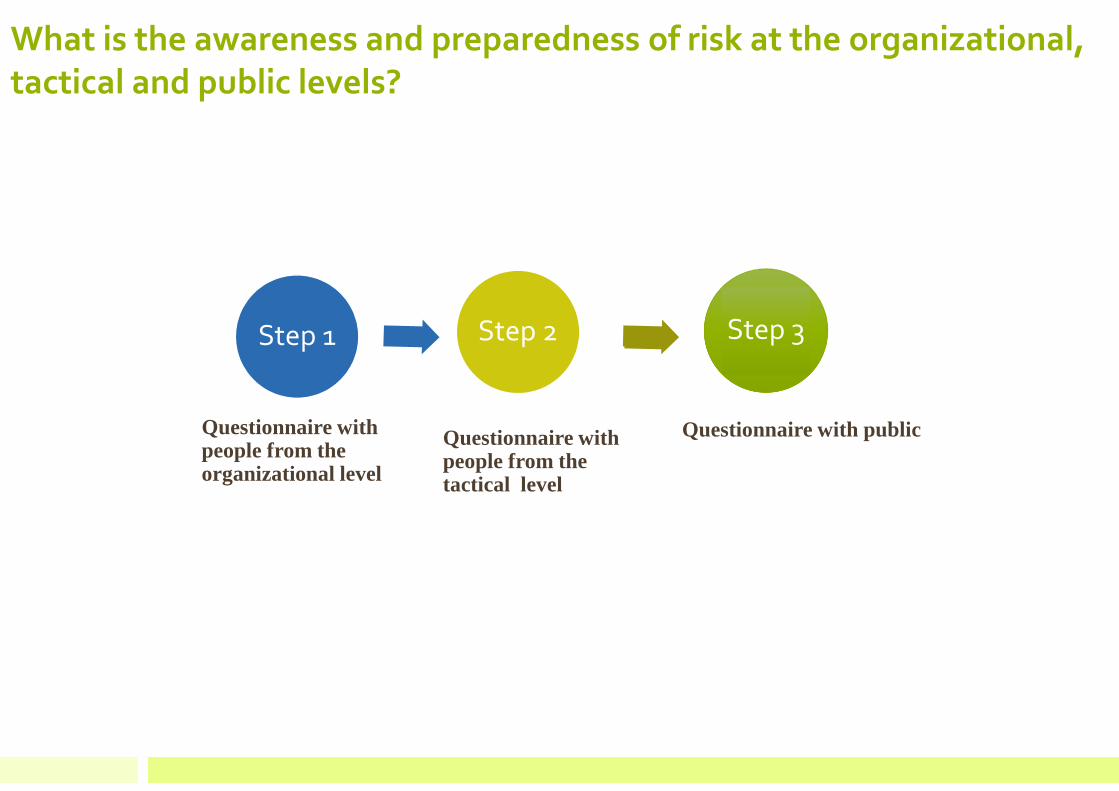
What is the awareness and preparedness of risk at the organizational, tactical and public levels?
Step 1 Step 2 Step 3
Questionnaire with people from the organizational level
Questionnaire with public Questionnaire with people from the tactical level
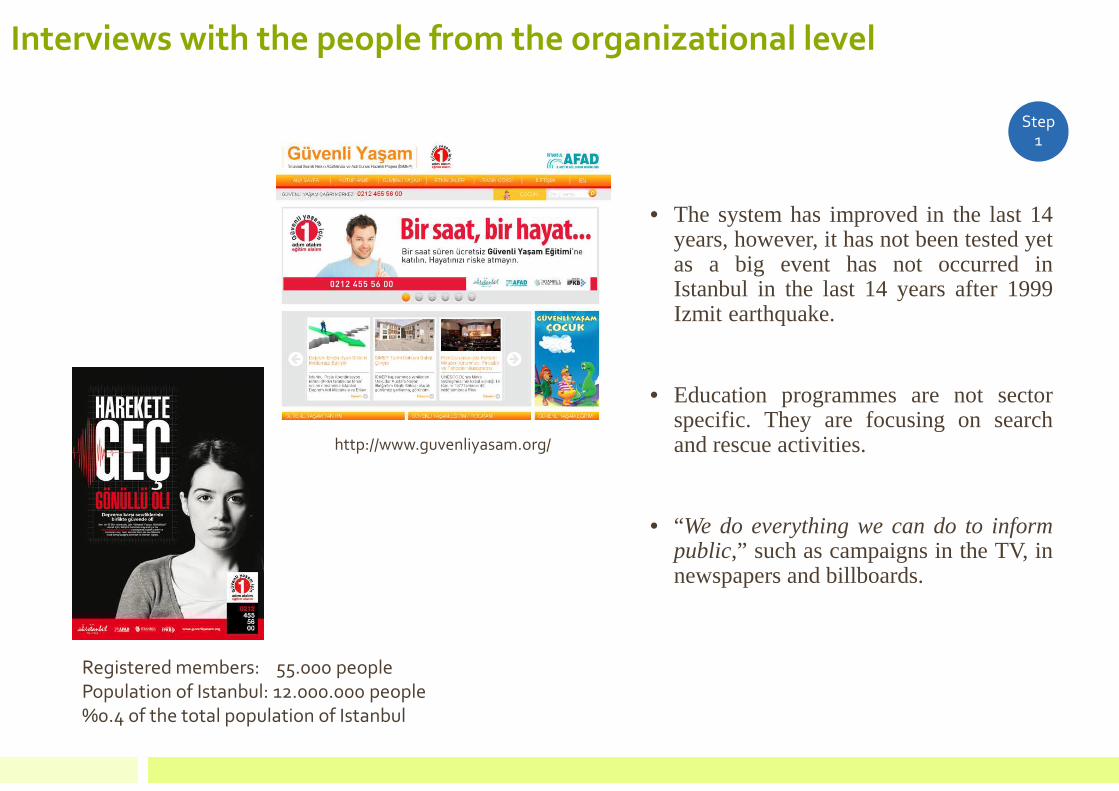
Interviews with the people from the organizational level
• The system has improved in the last 14years, however, it has not been tested yetas a big event has not occurred inIstanbul in the last 14 years after 1999Izmit earthquake.
• Education programmes are not sectorspecific. They are focusing on searchand rescue activities.
• “We do everything we can do to informpublic,” such as campaigns in the TV, innewspapers and billboards.
Step 1
http://www.guvenliyasam.org/
Registered members: 55.000 people
Population of Istanbul: 12.000.000 people
%0.4 of the total population of Istanbul
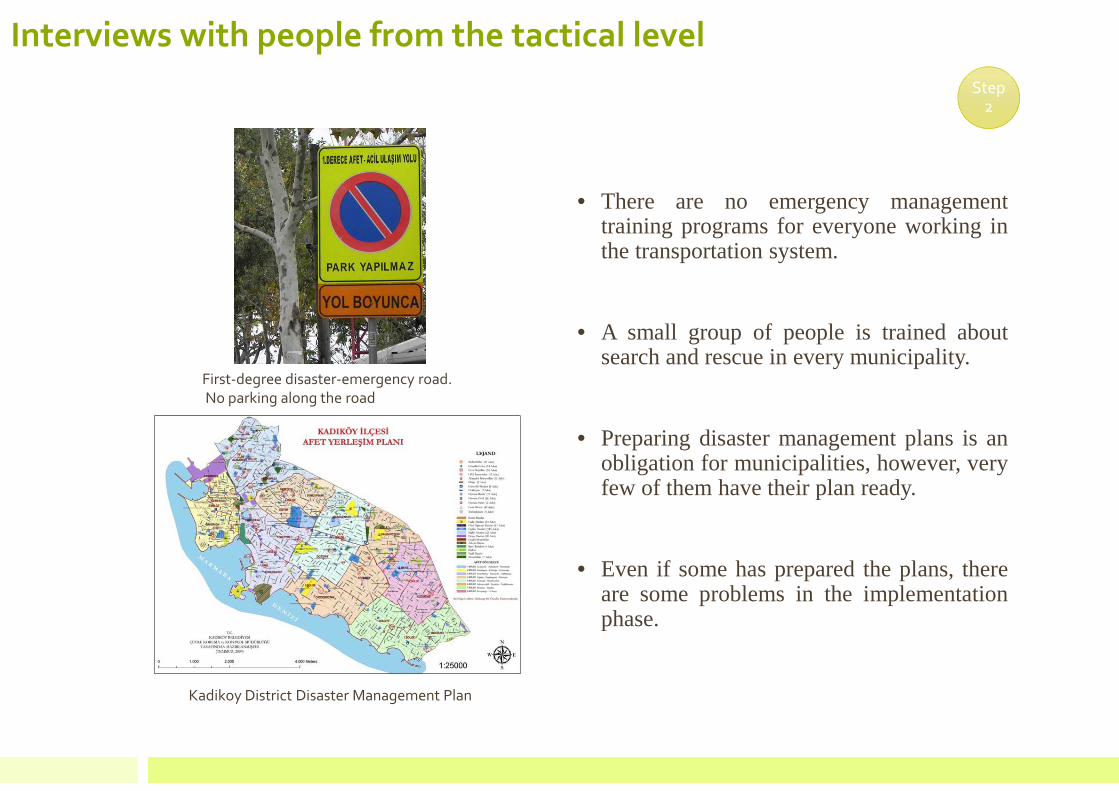
Interviews with people from the tactical level
• There are no emergency managementtraining programs for everyone working inthe transportation system.
• A small group of people is trained aboutsearch and rescue in every municipality.
• Preparing disaster management plans is anobligation for municipalities, however, veryfew of them have their plan ready.
• Even if some has prepared the plans, thereare some problems in the implementationphase.
Step 2
First-degree disaster-emergency road.No parking along the road
Kadikoy District Disaster Management Plan

Interviews with public Part 1: Perception and awareness of risk condition and risk of earthquake
Step 3
Whether people experienced 1999 Marmara
earthquake (Source: author)
Whether people knew that Istanbul is located in an earthquake prone
area before the occurrence of Marmara earthquake
Do you think that the building that you live in is
resistant to an earthquake?
Was the building checked against seismic risk?
Interviews with publicPart 2: Awareness of information programmes and access of information
Step 3
• People do not know the existence of such kind of activities• People know, but they ignore• People know, they do not ignore but they have other priorities• People know, but they do not believe of those activities may be successful
According to the results of the survey, 85% of them have information on mitigationworks against earthquake and information related programmes, but none of them havebeen actively involved in any kind of activities related with earthquake mitigation. Theymainly encounter with information on TV and newspapers. However, most of themchange the channel and do not listen or read news related with earthquake hazard.
The 1999 Marmara Earthquake is a milestone in the disaster risk management inTurkey. One of the changes after the earthquake is the increasing number of informationcampaigns prepared both by governmental and volunteers organizations. Although theyhave had extensive participation in number, the percentage of participants in theseactivities is less than 0.04% of the total population of Istanbul (according to the2011data). The main reasons are

Interviews with publicPart 3: Population’s individual preparedness
Step 3
Insurance holders
Home is strengthened against earthquake
Libraries, wardrobes wallmounted
Having an emergency kit at home
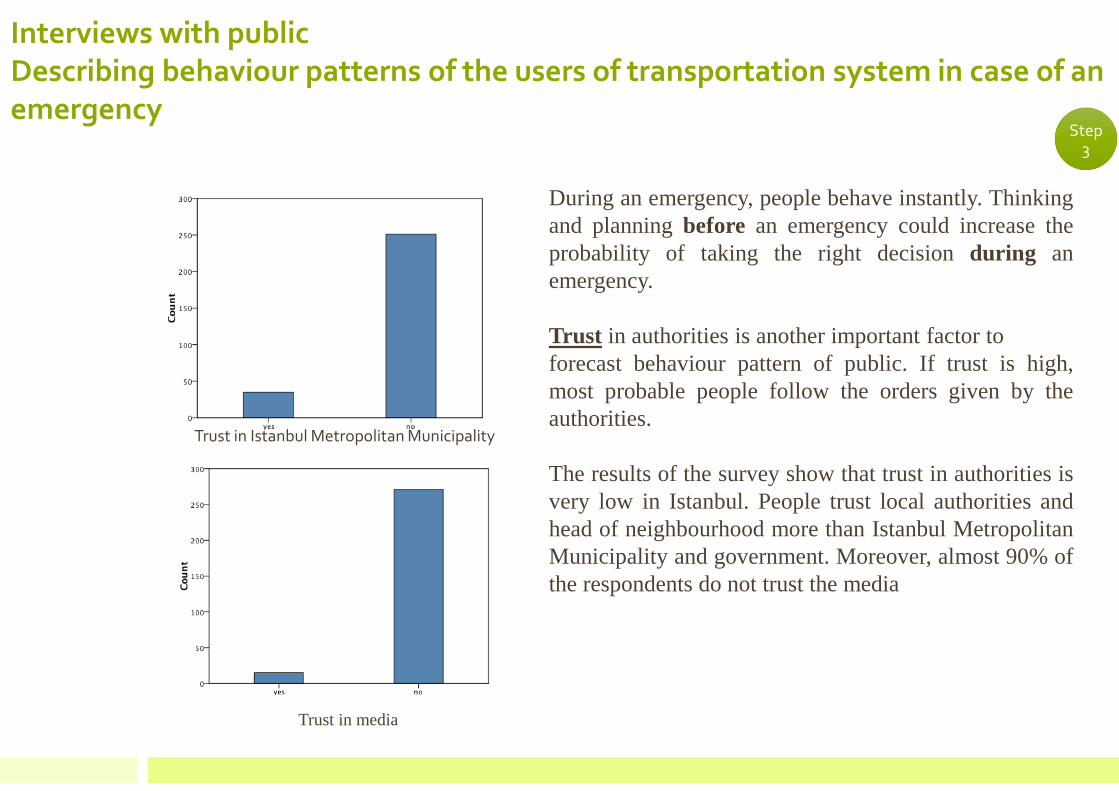
Interviews with publicDescribing behaviour patterns of the users of transportation system in case of an emergency
Step 3
Trust in media
During an emergency, people behave instantly. Thinkingand planningbefore an emergency could increase theprobability of taking the right decisionduring anemergency.
Trust in authorities is another important factor toforecast behaviour pattern of public. If trust is high,most probable people follow the orders given by theauthorities.
The results of the survey show that trust in authorities isvery low in Istanbul. People trust local authorities andhead of neighbourhood more than Istanbul MetropolitanMunicipality and government. Moreover, almost 90% ofthe respondents do not trust the media
Trust in Istanbul Metropolitan Municipality

Interviews with publicDescribing behaviour patterns of the users of transportation system in case of an emergency
Step 3
An evacuation plan must consider not only people who do
not able to move due to physical or mental reasons. Morethan half of the respondents do not know where evacuate
to. As an evacuation mode most of the respondents prefer
to use their own cars or their neighbour cars. When
considering the high percentage of car ownership in
Istanbul, it is very clear that traffic congestion and fuelshortage could be main concerns in case of an emergency.
Knowing where to go, if it is needed to leave the city
Preferred transportation mode for evacuation
Having a place to meet arranged early with the family
members in case of not being together during an earthquake
Interviews with public: General Results
• Although public awareness of risk is very high, their preparedness level isvery low.
• Public knows about the campaigns, sawthemin the media. But majority ofthemignored this information.
• People are strongly fatalistic.
• Trust in official information providers is quite low.
Step 3
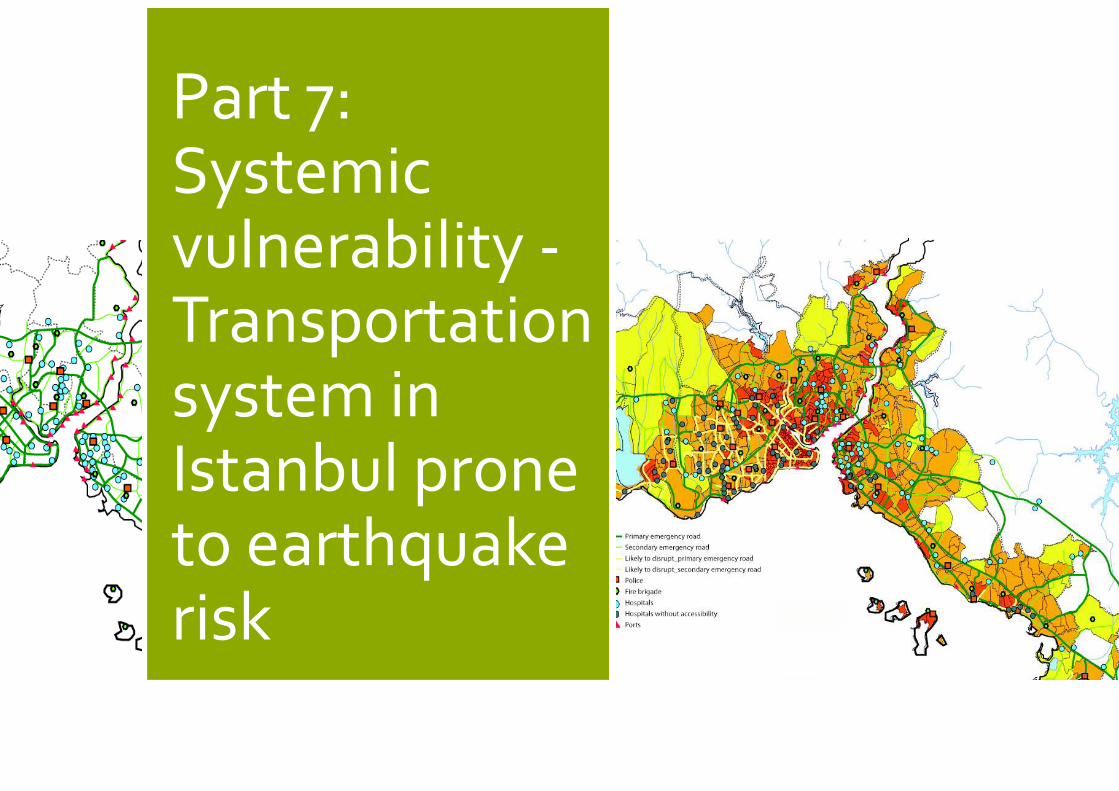
Part 7: Systemic vulnerability -Transportation system in Istanbul prone to earthquake risk

Problems are threefold
1. Disregarding inter-dependency of components in a system
and inter-dependency among systems
2. Disregarding indirect and multiple hazards
3. Dealing with social structure as if it is separated from the
physical structure
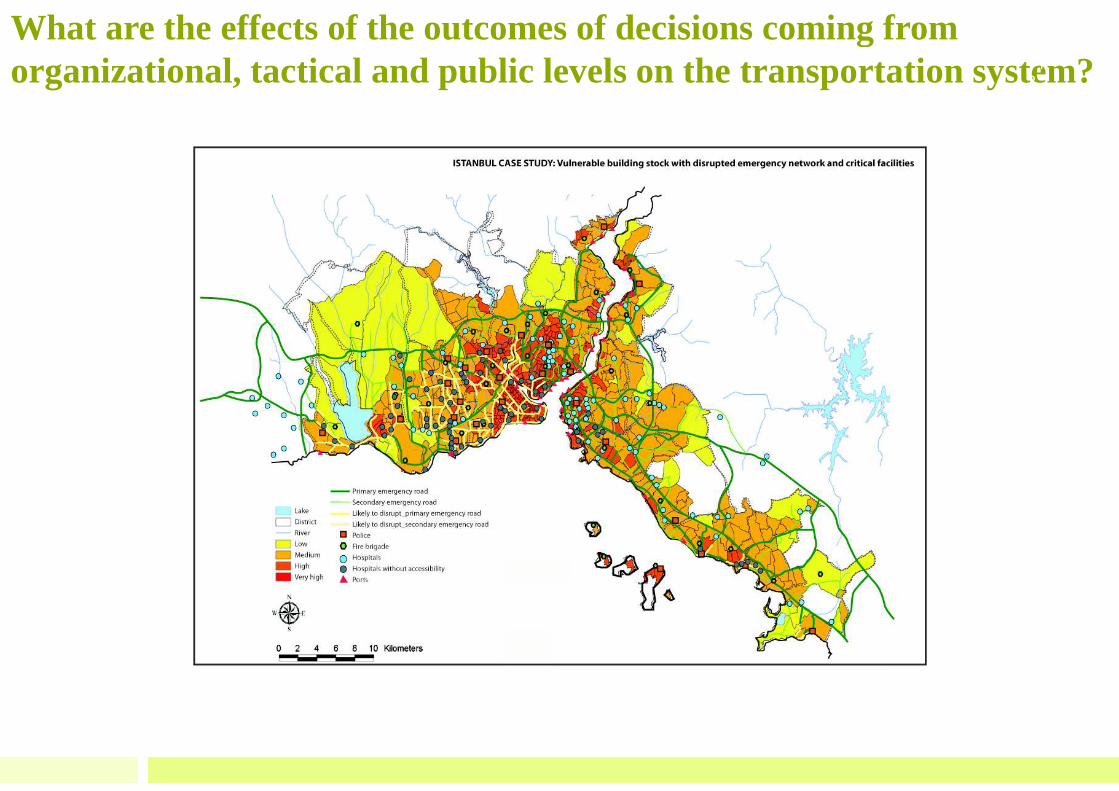
What are the effects of the outcomes of decisions coming from organizational, tactical and public levels on the transportation system?Step
3
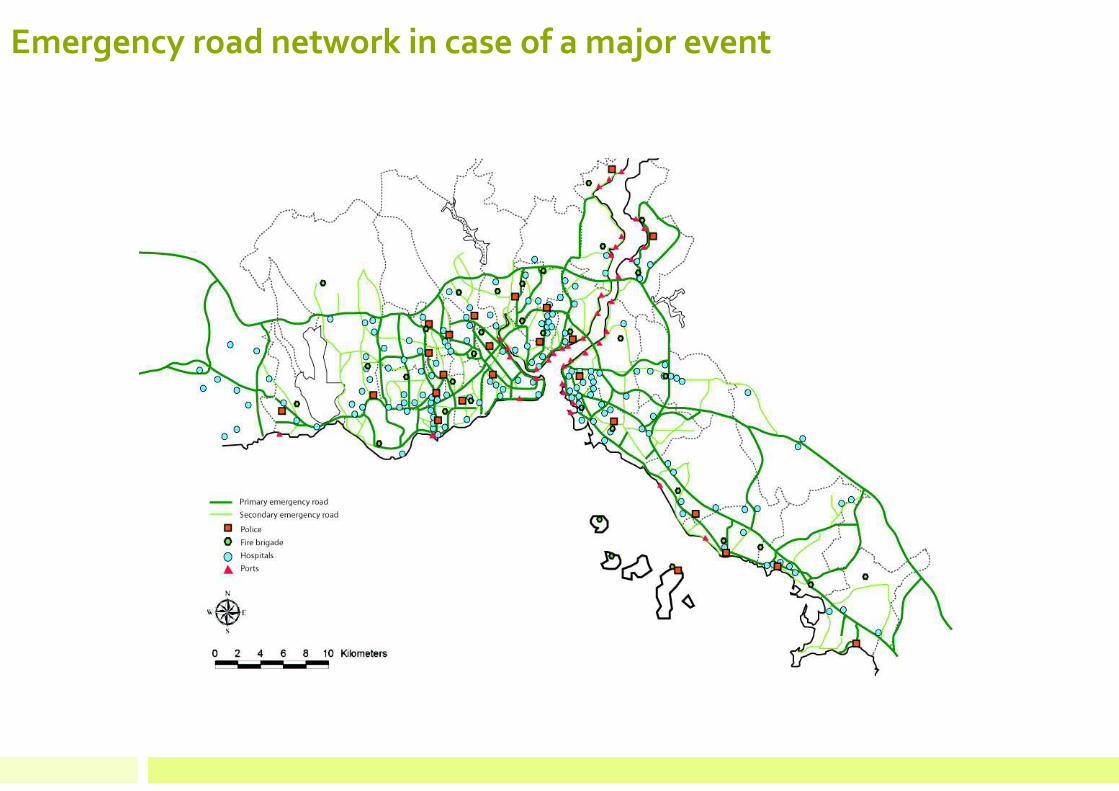
Emergency road network in case of a major event
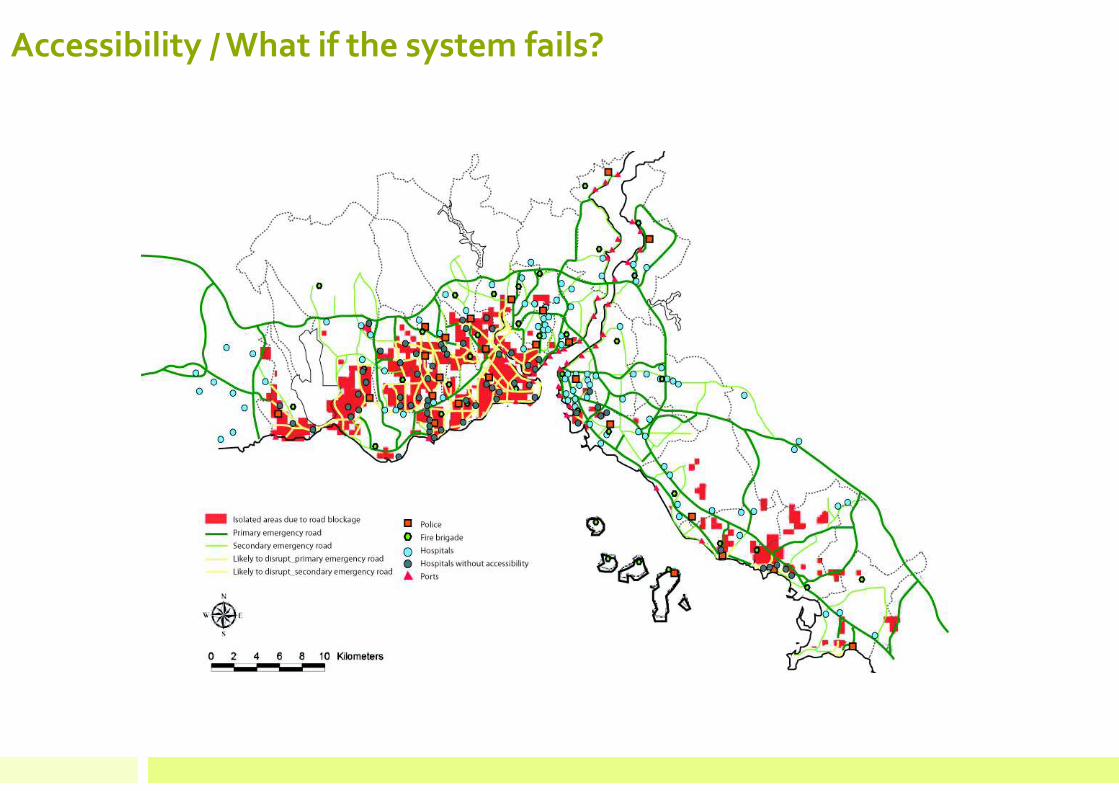
Accessibility / What if the system fails?
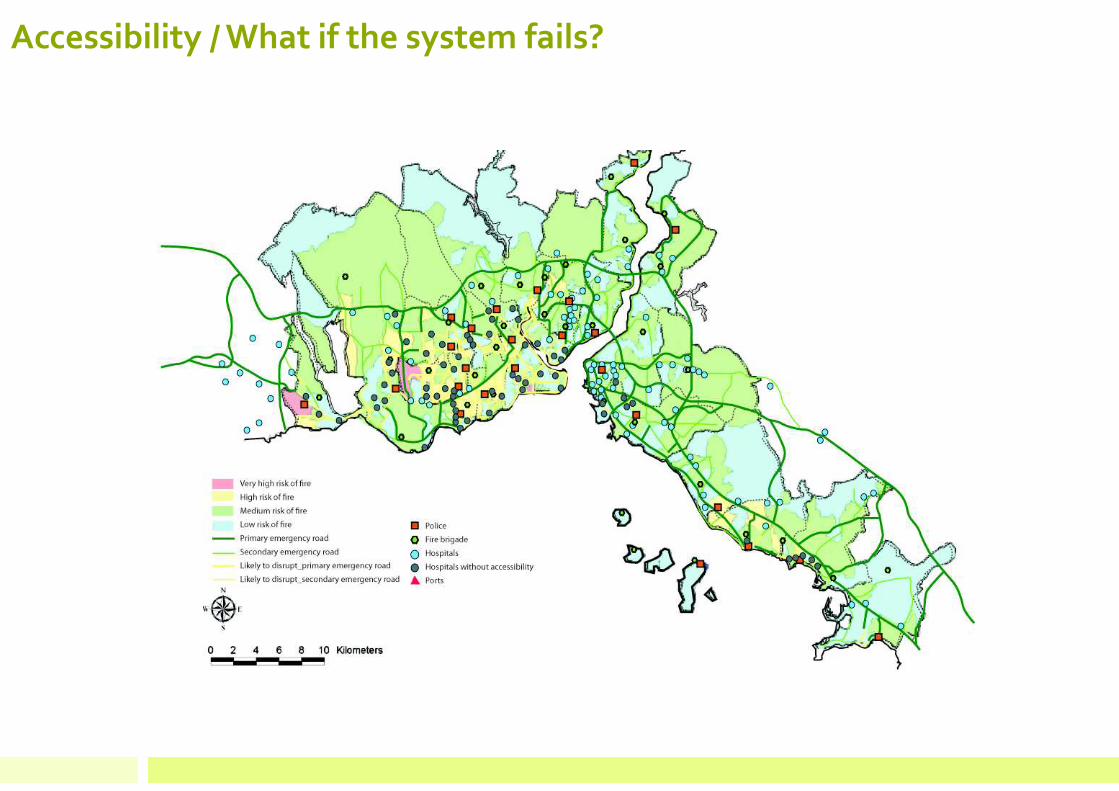
Accessibility / What if the system fails?
How to enhance resilience of complex transportation system against disasters?
• Failures or incidents during an emergency are emergent phenomena.
• Outcome of actions, which are defined in the plan by regulations, could bedifferent than anticipated due to constantly changing environment duringdisasters.
• Disaster management related plans have to be supported by development plans. Otherwise provided solutions could be short-lived.
• Flexible systems could be better than too much order in terms of providingresilience.
Conclusion
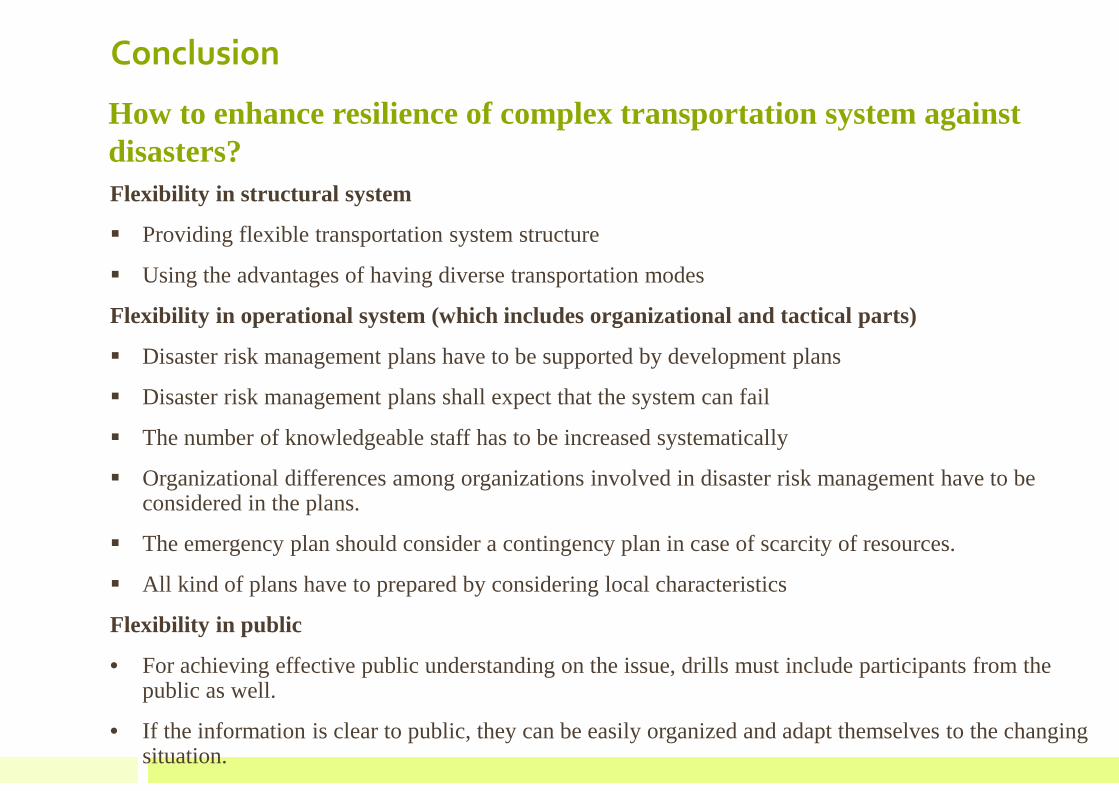
Flexibility in structural system
� Providing flexible transportation system structure
� Using the advantages of having diverse transportation modes
Flexibility in operational system (which includes organizational and tactical parts)
� Disaster risk management plans have to be supported by development plans
� Disaster risk management plans shall expect that the system can fail
� The number of knowledgeable staff has to be increased systematically
� Organizational differences among organizations involved in disaster risk management have to be considered in the plans.
� The emergency plan should consider a contingency plan in case of scarcity of resources.
� All kind of plans have to prepared by considering local characteristics
Flexibility in public
• For achieving effective public understanding on the issue, drills must include participants from the public as well.
• If the information is clear to public, they can be easily organized and adapt themselves to the changing situation.
Conclusion
How to enhance resilience of complex transportation system against disasters?