1 DISTRIBUTION STATEMENT A. Approved for public release; distribution is unlimited. Upper Ocean Mixing Processes and Circulation in the Arabian Sea during Monsoons using Remote Sensing, Hydrographic Observations and HYCOM Simulations PI: Prof. Subrahmanyam Bulusu Department of Earth and Ocean Sciences University of South Carolina Columbia, SC 29208 phone: (803) 777-2572 fax: (803) 777-6610 email: [email protected]Award Number: N00014-15-1-2592 1. LONG-TERM GOALS The upper ocean processes in the Arabian Sea play significant role in determining Sea Surface Temperature (SST) and air-sea fluxes, which are vital for understanding the monsoon and climate variability. Among the world oceanic regions, only the Arabian Sea cools during summer monsoon under the influence of air-sea interaction processes and oceanic advective processes as well. The Arabian Sea experiences more evaporation than precipitation and is connected to the warm and highly saline waters of the Persian Gulf and Red Sea effecting the salinity of the upper layer and the formation of the barrier layer (BL) within the isothermal layer. The BL in turn controls vertical mixing, mixed layer depth and warm pool dynamics affecting the onset and potential strength of the monsoon. On annual time scale, there is a considerable exchange of salt from one basin to the other. However, the pathways of these high salinity waters are speculated only through watermass analysis using the hydrographic data, and the limits of extent of high salinity waters from one basin to the other are not yet clearly delineated. Seychelles–Chagos thermocline ridge (SCTR) in the southwest tropical Indian Ocean also appears to play an important role in the regional climate and intraseasonal variability at the periods of Madden-Julian Oscillation (40-60 day). While the contribution of the AS is important to the global oceans salt and heat budgets, and global climatic impact is well known to the scientific community, quantified analyses of its physical dynamics are underrepresented in the literature. 2. OBJECTIVES Objective#1: To estimate the mixed layer depth and barrier layer thickness from satellite measurements of salinity, temperature and sea surface height using a multi-regression model. Objective#2: To study the influences of salinity on the mixing processes in the Arabian Sea and the Southeastern Arabian Sea Warm pool dynamics. Objective#3: To study the basin-scale exchange of fresh and salt water between the Arabian Sea and Bay of Bengal. To understand the variability of the subsurface high salinity water masses and their spreading across the Arabian Sea. Objective#4: To investigate the variability in the boundary currents of the northern and western Arabia Sea during monsoons.
Transcript
1
DISTRIBUTION STATEMENT A. Approved for public release; distribution is unlimited.
Upper Ocean Mixing Processes and Circulation in the Arabian Sea during Monsoons using Remote Sensing, Hydrographic
Observations and HYCOM Simulations
PI: Prof. Subrahmanyam Bulusu Department of Earth and Ocean Sciences
Award Number: N00014-15-1-2592 1. LONG-TERM GOALS The upper ocean processes in the Arabian Sea play significant role in determining Sea Surface Temperature (SST) and air-sea fluxes, which are vital for understanding the monsoon and climate variability. Among the world oceanic regions, only the Arabian Sea cools during summer monsoon under the influence of air-sea interaction processes and oceanic advective processes as well. The Arabian Sea experiences more evaporation than precipitation and is connected to the warm and highly saline waters of the Persian Gulf and Red Sea effecting the salinity of the upper layer and the formation of the barrier layer (BL) within the isothermal layer. The BL in turn controls vertical mixing, mixed layer depth and warm pool dynamics affecting the onset and potential strength of the monsoon. On annual time scale, there is a considerable exchange of salt from one basin to the other. However, the pathways of these high salinity waters are speculated only through watermass analysis using the hydrographic data, and the limits of extent of high salinity waters from one basin to the other are not yet clearly delineated. Seychelles–Chagos thermocline ridge (SCTR) in the southwest tropical Indian Ocean also appears to play an important role in the regional climate and intraseasonal variability at the periods of Madden-Julian Oscillation (40-60 day). While the contribution of the AS is important to the global oceans salt and heat budgets, and global climatic impact is well known to the scientific community, quantified analyses of its physical dynamics are underrepresented in the literature. 2. OBJECTIVES Objective#1: To estimate the mixed layer depth and barrier layer thickness from satellite
measurements of salinity, temperature and sea surface height using a multi-regression model.
Objective#2: To study the influences of salinity on the mixing processes in the Arabian Sea and the Southeastern Arabian Sea Warm pool dynamics.
Objective#3: To study the basin-scale exchange of fresh and salt water between the Arabian Sea and Bay of Bengal. To understand the variability of the subsurface high salinity water masses and their spreading across the Arabian Sea.
Objective#4: To investigate the variability in the boundary currents of the northern and western Arabia Sea during monsoons.
Objective#5: To understand the linkage between the Seychelles-Chagos thermocline ridge variability and processes in the Arabian Sea.
3. APPROACH 3.1 Aquarius and SMOS Salinity The launch of NASA Aquarius Salinity/SAC-D and European Space Agencies (ESA) Soil Moisture Ocean Salinity (SMOS) missions has allowed for global Sea Surface Salinity (SSS) measurements to be made on spatial and temporal scales that were previously logistically impossible. Aquarius was launched in June 10, 2011 and ended on June 7, 2015. As Aquarius swath is 390 km formed with a 3 beam push broom (76x94, 84x120, 96x156 km), with a repeat time of 7-day and with 4 samples in a month is available from August, 2012-June, 2015. The Soil Moisture and Ocean Salinity (SMOS) mission, launched in November 2, 2009, has been designed to observe soil moisture over the Earth's landmasses and salinity over the oceans. The SMOS mission will globally monitor surface soil moisture over land surfaces (with an accuracy of 4% volumetric soil moisture, a spatial resolution of 35-50 km and a revisit time of 1-3 days) and surface salinity over the oceans (with an accuracy of 0.1 psu, averaged over 10-30 days and an area of 200 km x 200 km). Daily, Weekly, Monthly composite, 1° resolution Level 3 SMOS SSS data will be available from 2009-present (5 years). 3.2 Altimetry Sea Surface Height & Argo 10-day and Monthly AVISO sea surface height anomalies (SSHAs) and geostrophic current anomalies from 1992-present at 1/3° degree resolution will be used to study the western boundary currents and circulation pattern in the Arabian Sea National Oceanic and Atmospheric Administration (NOAA) optimally interpolated monthly sea surface temperature (NOAA OI SST v2) data from January 2005 to present are also used. The SST monthly fields are derived by a linear interpolation of the weekly optimum interpolation (OI) version 2 fields to daily fields then averaging the daily values over a month with a 1° horizontal resolution [Reynolds et al., 2002]. Daily data (from Coriolis project) and Monthly gridded Argo temperature and salinity profiles will be obtained from the Asia Pacific Data-Research Center (APDRC) and INCOS, India. 3.3 HYCOM simulations Global Hybrid Coordinate Ocean Model (HYCOM) has an equatorial horizontal resolution of 0.04° (1/25° or ~4.5 km near the equator, ~3.5 km at mid-latitudes, and ~1.75 km near the North Pole), which makes it eddy resolving for the mesoscale. Eddy-resolving models can resolve the dynamics required to directly simulate western boundary currents, mesoscale variability, and the position and sharpness of ocean fronts. This version employs either 32 or 41 hybrid vertical coordinate surfaces. HYCOM is a next-generation system capable of nowcasting and forecasting the oceanic “weather.” The system used 3-hourly forcing from the Navy Operational Global Atmospheric Prediction System. Data assimilation was performed using the Navy Coupled Ocean Data Assimilation (NCODA) [Cummings, 2005] system with a model forecast as the first guess. NCODA assimilates available satellite altimeter observations (along track obtained via the NAVOCEANO Altimeter Data Fusion Center), satellite and in-situ sea surface temperature (SST), as well as available in-situ vertical temperature and salinity profiles from XBTs, Argo floats, and moored buoys. In this project we will use HYCOM Global Ocean Forecast System 3.0 (HYCOM Version 2.2.19).
3
3.4 SODA Reanalysis The SODA reanalysis is produced from a general ocean circulation model, driven by surface forcing and corrected based on direct observations [Carton and Giese, 2008]. SODA v2.2.4 surface layer salinity is chosen for this study, a global product produced by the Asian Pacific Data Research Center (APDRC) at a monthly temporal resolution and a 1/2° spatial resolution, which spans from 1950-2010.
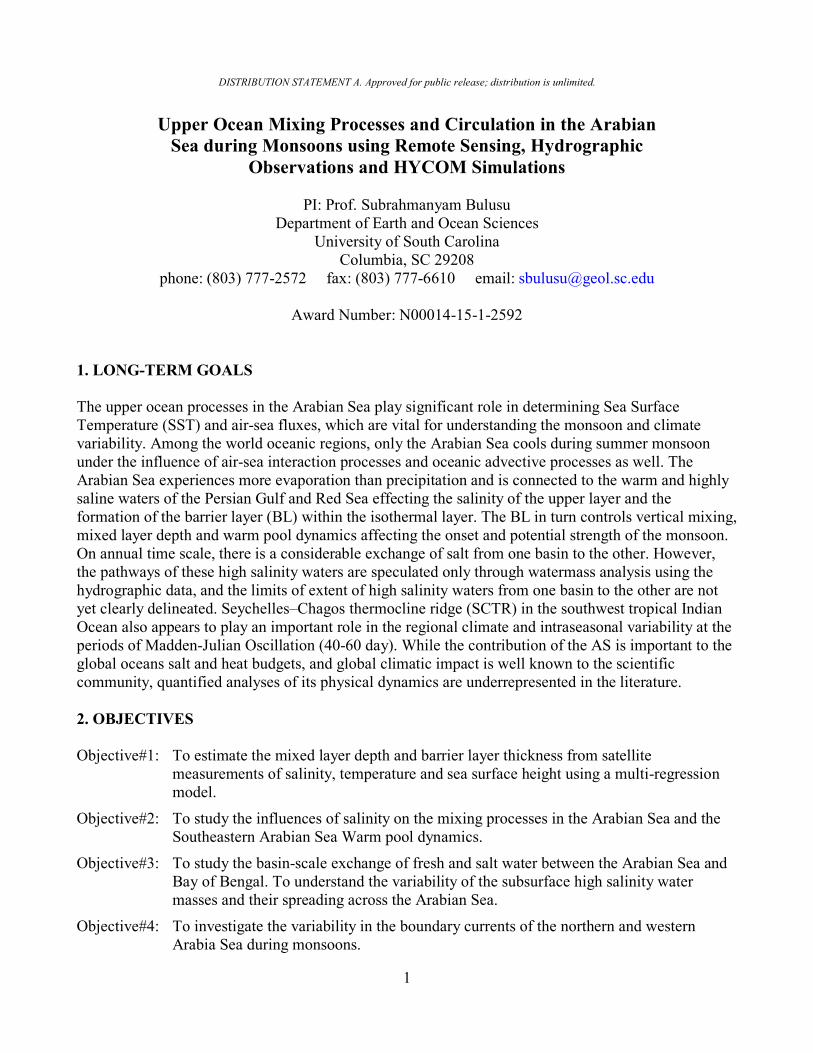
3.5 Hydrographic Data The Indian Oceanographic institutes such as the CSIR-National Institute of Oceanography (NIO), the Indian National Centre for Ocean Information Services (INCOIS), National Institute of Ocean Technology (NIOT) and other institutes would regularly organize cruises every year in the Arabian Sea as part of their Institutional/National observational programs. The cruises will be organized onboard the Indian Research vessels during the southwest monsoon (June – September) and northeast monsoon (November – February) seasons in the Arabian Sea and southern tropical Indian Ocean. Cruise tracks are unknown at this time but the data will be gathered from the 3 regions of intensive study (Figure 1) chosen to encompass the regions of highest surface salinity variability in the AS, the region of lowest surface salinity (SEAS and SWTIO). The data archive will be put in a GIS based database and be available to the public and other investigators subject to the aforementioned data policies of the Institutes. Dr. VSN Murty, the Scientific Collaborator from the CSIR-National Institute of Oceanography (NIO) India, and his graduate students and researchers would participate in some of these cruises.
Figure 1: Areas of possible observational programs during the cruises overlaid on the HYCOM annual Sea Surface Salinity during 2011.
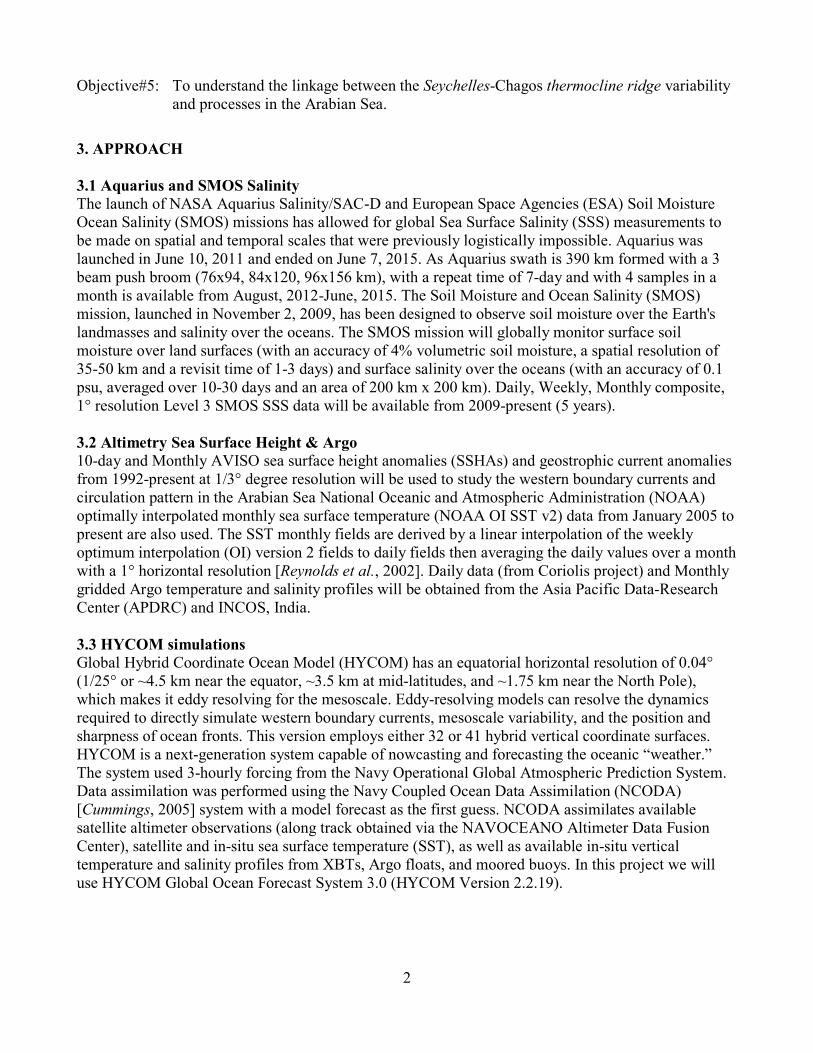
4. PRELIMINARY RESULTS 4.1 Seasonal variability of salt transports in the Northern Indian Ocean Due to limited observational data in the Indian Ocean compared to many other regions of the global ocean, past work on the Northern Indian Ocean (NIO) has relied heavily upon model analysis to study the variability of regional salinity caused by the monsoon seasons. With the launch of the Aquarius SAC-D satellite mission in 2011 (ended on June 7, 2011), remotely sensed, synoptic scale sea surface salinity (SSS) data is now readily available to study this dynamic region. This new observational data has allowed us to revisit the region to analyze seasonal variability of salinity in the NIO using several modeled products, the Aquarius satellite, and Argo floats data. The model simulations include the
4
Consortium for Estimating the Circulation and Climate of the Ocean (ECCO2), European Centre for Medium-Range Weather Forecasts - Ocean Reanalysis System 4 (ECMWF-ORSA4), Simple Ocean Data Assimilation (SODA) Reanalysis, and HYbrid Coordinate Ocean Model (HYCOM). Our analyses of salinity at the surface and at depths up to 200 m, surface salt transport in the top 5 m layer, and depth-integrated salt transports revealed different salinity processes in the NIO that are dominantly related to the semi-annual monsoons (as shown Figure 2). Aquarius proves a useful tool for observing this dynamic region, and reveals some aspects of SSS that Argo cannot resolve. A difference in subsurface salinity stratification causes many of the modeled products to incorrectly estimate the magnitude and seasonality of NIO barrier layer thickness (BLT) when compared to the Argo solution. This problem is also evident in model output from the Seychelles-Chagos Thermocline Ridge (SCTR), a region with strong air-sea teleconnections with the Arabian Sea and monsoon onset. Finally, meridional depth-integrated salt transports along 6°N revealed dominant advective processes from the surface towards near-bottom depths.
Figure 2. Time-depth sections of box-averaged salinity, mixed layer depth (m, black line), and isothermal layer depth (m, white dashed line) in the Arabian Sea between January 2008 and
December 2011 from Argo (a), HYCOM (b), CORA v3.4 (c), ECCO2 (d), ECMWF (e), and SODA (f). (D’Addezio et al., 2015)
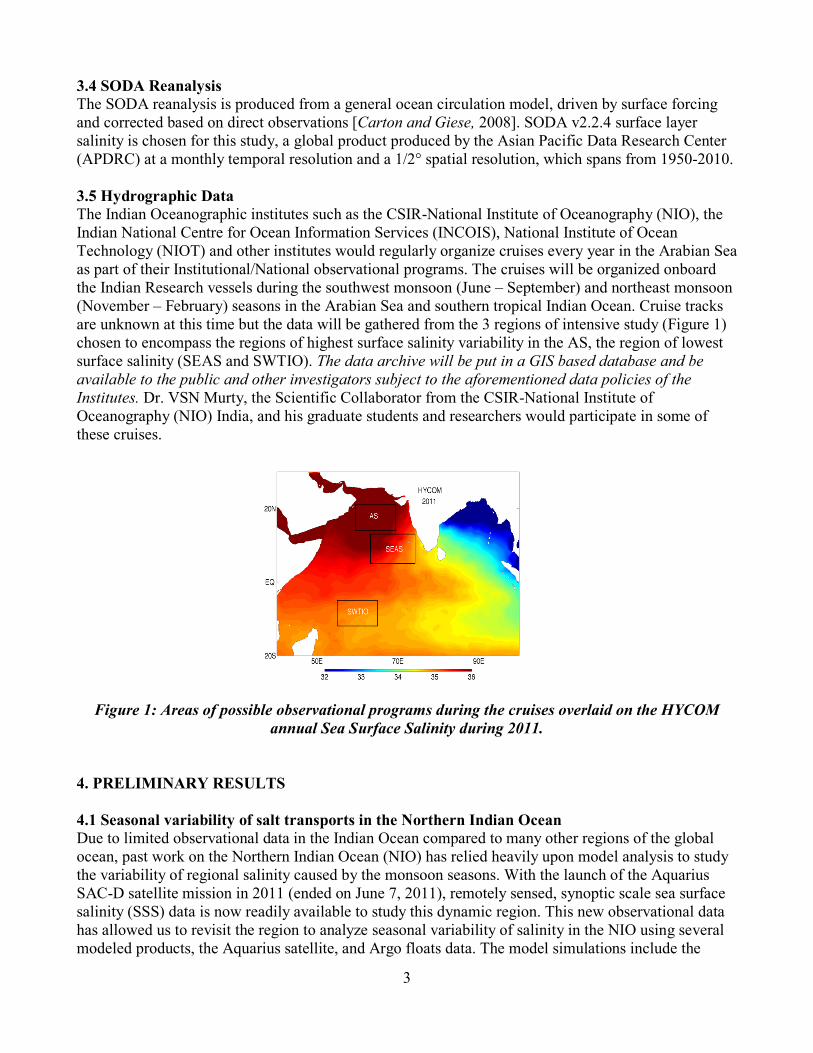
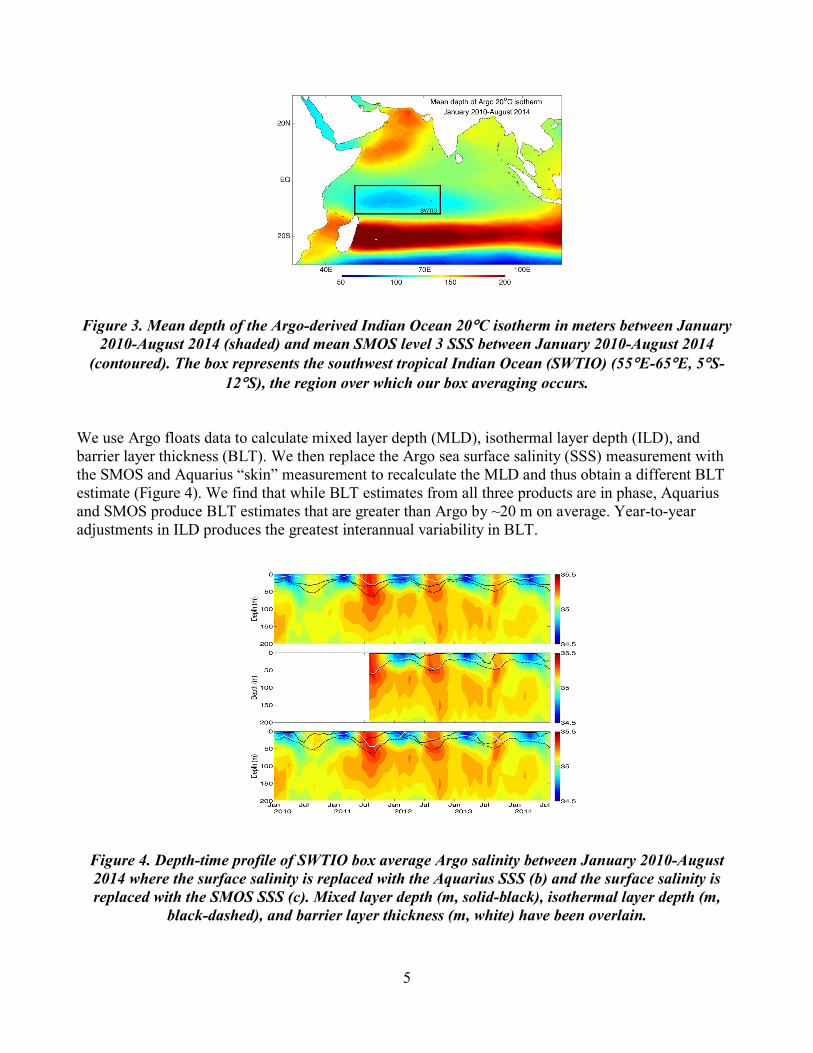
4.2 The role of salinity on the interannual variability of the SCTR ridge The southwest tropical Indian Ocean (SWTIO) (55°E-65°E, 5°S-12°S) features a seasonal thermocline dome (Figure 3) that has been shown to have important teleconnections with the Asian monsoon and ENSO. Several past studies have highlighted the lack of salinity variability in the region using model output, Argo floats data, and buoy measurements. The almost five year record from SMOS and three year record from Aquarius gives us reason to revisit this region to see if these two satellites can yield new information on seasonal and interannual salinity variability.
5
Figure 3. Mean depth of the Argo-derived Indian Ocean 20°C isotherm in meters between January
2010-August 2014 (shaded) and mean SMOS level 3 SSS between January 2010-August 2014 (contoured). The box represents the southwest tropical Indian Ocean (SWTIO) (55°E-65°E, 5°S-
12°S), the region over which our box averaging occurs.
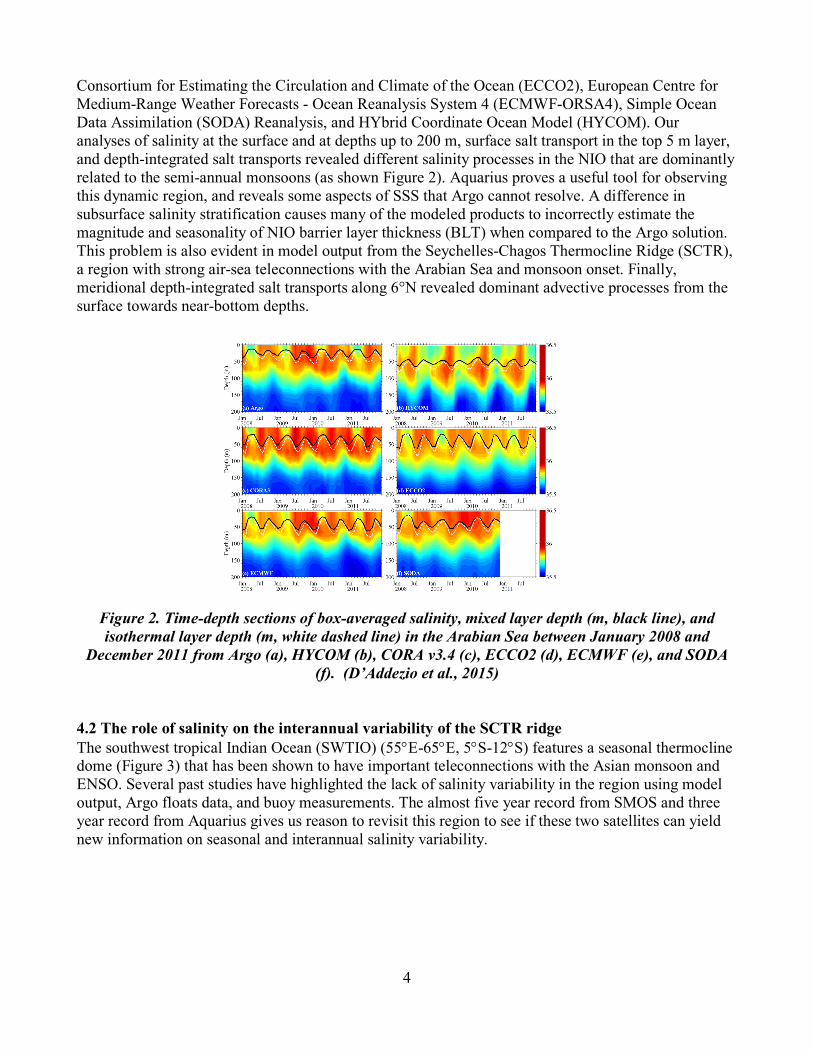
We use Argo floats data to calculate mixed layer depth (MLD), isothermal layer depth (ILD), and barrier layer thickness (BLT). We then replace the Argo sea surface salinity (SSS) measurement with the SMOS and Aquarius “skin” measurement to recalculate the MLD and thus obtain a different BLT estimate (Figure 4). We find that while BLT estimates from all three products are in phase, Aquarius and SMOS produce BLT estimates that are greater than Argo by ~20 m on average. Year-to-year adjustments in ILD produces the greatest interannual variability in BLT.
Figure 4. Depth-time profile of SWTIO box average Argo salinity between January 2010-August 2014 where the surface salinity is replaced with the Aquarius SSS (b) and the surface salinity is replaced with the SMOS SSS (c). Mixed layer depth (m, solid-black), isothermal layer depth (m,
black-dashed), and barrier layer thickness (m, white) have been overlain.
6
RELATED PROJECTS None PUBLICATIONS Refereed Publications 1. D'Addezio, J.M., B. Subrahmanyam, E.S. Nyadjro, and V.S.N. Murty (2015). Seasonal
Variability of Salinity and Salt Transports in the North Indian Ocean, Journal of Physical Oceanography, Vol. 45, No. 7. 1947-1966.
2. D'Addezio, J.M., and B. Subrahmanyam (2015). Role of Salinity on the interannual variability of the Seychelles-Chagos thermocline ridge, Remote Sensing of Environment (in review).
3. Nyadjro, E.S., and B. Subrahmanyam (2015). Indian Ocean Salinity Fronts observed by SMOS, Remote Sensing of Environment (in review).
Conference/Workshop presentations Subrahmanyam, B., Nyadjro, E.S. (2015). Indian Ocean salinity fronts observed by SMOS &
Aquarius, Open Science Conference, Salinity and Freshwater Changes in the Ocean, October 12-14, 2015, Hamburg, Germany. (Oral Presentation)
D'Addezio, J.M., B. Subrahmanyam (2015). The role of salinity on the interannual variability of the Seychelles-Chagos thermocline ridge, Open Science Conference, Salinity and Freshwater Changes in the Ocean, October 12-14, 2015, Hamburg, Germany. (Poster Presentation)