Md. Monirul Islam, ACA (Analyst, Financial Services) [email protected]Md. Ashfaque Alam (Associate) [email protected]DELTA BRAC HOUSING FINANCE CORPORATION LIMITED DELTA BRAC HOUSING FINANCE CORPORATION LIMITED March 1, 2010 March 1, 2010 Rating: OUTPERFORM Rating: OUTPERFORM Target Price: BDT 2,250 Target Price: BDT 2,250 Delta Brac Housing Finance Corporation Limited (DBH) started its operation in 1996 to meet the growing demand for housing sector finance in Bangladesh. DBH was the first company in the private sector to operate in specialized housing finance in Bangladesh. At the time of its inception, DBH very efficiently captured the housing finance market that was insufficiently serviced by the government owned House Building Finance Corporation. DBH has managed impressive growth in loan portfolio, deposit collection, earnings growth and total assets, asset quality, sound management and profitability. DBH has achieved 35% loan growth in the last two years. The company achieved average ROE and ROA of 24.49% and 1.79% respectively in the last financial year, which is impressive in the industry. DBH also managed to efficiently address a challenge faced by all non-banking financial institutions, namely to keep the cost of capital low. DBH has made efficient use of deposits and subsidized credit provided by the central bank. DBH is managed by an innovative and ambitious management team. It has internationally reputed institutions as shareholders. These shareholders, specially HDFC of India bring valuable lessons and knowledge of the housing finance business. A board representing these institutions ensures best practices in housing finance. It also ensures excellent corporate governance and minority investor protection. We initiate coverage of Delta Brac Housing Finance Corporation Limited with an OUTPERMFORM rating and a 12-month target price of BDT 2,250. Our rating takes into account the impressive growth and profitability of the company, prospect of continued growth and excellent management. We also considered the asset quality and the management practices of the company. Our target price implies a forward P/E ratio of 20.00x with expected 2010-2011 EPS of BDT 114.82. Table 1: 10 largest NBFIs by M cap, BDT MM Source: BRAC EPL Research and DSE web Graph 1: Close price and volume traded over a year 0 10000 20000 30000 40000 50000 60000 70000 80000 90000 0 500 1000 1500 2000 2500 Volume Close Company Summary 52-week Price Range (BDT) 2098 - 1104 Current Price BDT 1,930.0 12-month Target Price BDT 2,250.0 Cash dividend BDT 20.0 Total Return 18% Number of Shares MM 4.0 Market Cap BDT MM 7,956.9 Float (% of shares) 19 Revenue BDT MM Jun-08 Jun-09 Jun-10E Jun-11E Interest income 1,509.0 1,864.6 2,324.7 3,076.2 Fees and other charges 78.9 82.4 111.3 150.2 Income from investments .0 3.1 12.4 16.1 Other income .1 .1 .1 .1 Total revenue 1,587.9 1,950.2 2,448.5 3,242.7 Margins and Efficiency Jun-08 Jun-09 Jun-10E Jun-11E Loan/Deposit 107.70% 100.27% 103.36% 105.93% Operating efficiency 76.31% 76.27% 75.57% 72.15% Net Interest Margin 5.19% 4.88% 4.87% 5.22% ROE 23.84% 24.49% 26.97% 29.23% ROA 1.69% 1.71% 1.79% 2.03% Growth Indicators Jun-08 Jun-09 Jun-10E Jun-11E Assets growth 12.15% 48.80% 25.21% 27.31% Loans growth 32.94% 35.23% 35.00% 35.00% Deposits growth 14.69% 42.82% 35.00% 35.00% Earning growth 31.41% 32.53% 41.52% 43.03% Equity growth 32.23% 26.56% 30.09% 33.39% Per Share Jun-08 Jun-09 Jun-10E Jun-11E EPS 61.66 63.79 79.53 114.82 DPS 0.00 17.00 20.00 20.00 BVPS 208.85 264.32 343.84 458.66 NAME M Cap Current P/E (trail.) Lanka Bangla Finance Limited 18,555.7 26.51x Prime Finance and Investment Limited 15,695.5 28.74x IDLC Finance Limited 13,345.1 22.05x Delta Brac Housing Finance Corporation Limite 7,802.6 20.74x Uttara Finance limited 7,494.7 16.28x Union Capital Limited 5,856.0 39.33x United Leasing Company limited 5,470.1 43.79x Peoples Leasing 5,172.6 18.19x National Housing 4,850.3 47.88x Phoenix Finance 4,374.6 22.83 Source: DSE Web as on 24 Feb, 2010
Delta Brac Housing Finance Corporation Limited (DBH) started its operation in 1996 to meet the growing demand for housing sector finance in Bangladesh. DBH was the first company in the private sector to operate in specialized housing finance in Bangladesh. At the time of its inception, DBH very efficiently captured the housing finance market that was insufficiently serviced by the government owned House Building Finance Corporation.
DBH has managed impressive growth in loan portfolio, deposit collection, earnings growth and total assets, asset quality, sound management and profitability. DBH has achieved 35% loan growth in the last two years. The company achieved average ROE and ROA of 24.49% and 1.79% respectively in the last financial year, which is impressive in the industry. DBH also managed to efficiently address a challenge faced by all non-banking financial institutions, namely to keep the cost of capital low. DBH has made efficient use of deposits and subsidized credit provided by the central bank.
DBH is managed by an innovative and ambitious management team. It has internationally reputed institutions as shareholders. These shareholders, specially HDFC of India bring valuable lessons and knowledge of the housing finance business. A board representing these institutions ensures best practices in housing finance. It also ensures excellent corporate governance and minority investor protection.
We initiate coverage of Delta Brac Housing Finance Corporation Limited with an OUTPERMFORM rating and a 12-month target price of BDT 2,250. Our rating takes into account the impressive growth and profitability of the company, prospect of continued growth and excellent management. We also considered the asset quality and the management practices of the company. Our target price implies a forward P/E ratio of 20.00x with expected 2010-2011 EPS of BDT 114.82.
Table 1: 10 largest NBFIs by M cap, BDT MM
Source: BRAC EPL Research and DSE web
Graph 1: Close price and volume traded over a year
0
10000
20000
30000
40000
50000
60000
70000
80000
90000
0
500
1000
1500
2000
2500
Volume Close
Company Summary
52-week Price Range (BDT) 2098 - 1104
Current Price BDT 1,930.0
12-month Target Price BDT 2,250.0
Cash dividend BDT 20.0
Total Return 18%
Number of Shares MM 4.0
Market Cap BDT MM 7,956.9
Float (% of shares) 19
Revenue BDT MM Jun-08 Jun-09 Jun-10E Jun-11E
Interest income 1,509.0 1,864.6 2,324.7 3,076.2
Fees and other charges 78.9 82.4 111.3 150.2
Income from investments .0 3.1 12.4 16.1
Other income .1 .1 .1 .1
Total revenue 1,587.9 1,950.2 2,448.5 3,242.7Margins and Efficiency Jun-08 Jun-09 Jun-10E Jun-11E
Loan/Deposit 107.70% 100.27% 103.36% 105.93%
Operating efficiency 76.31% 76.27% 75.57% 72.15%
Net Interest Margin 5.19% 4.88% 4.87% 5.22%
ROE 23.84% 24.49% 26.97% 29.23%
ROA 1.69% 1.71% 1.79% 2.03%
Growth Indicators Jun-08 Jun-09 Jun-10E Jun-11E
Assets growth 12.15% 48.80% 25.21% 27.31%
Loans growth 32.94% 35.23% 35.00% 35.00%
Deposits growth 14.69% 42.82% 35.00% 35.00%
Earning growth 31.41% 32.53% 41.52% 43.03%
Equity growth 32.23% 26.56% 30.09% 33.39%
Per Share Jun-08 Jun-09 Jun-10E Jun-11E
EPS 61.66 63.79 79.53 114.82
DPS 0.00 17.00 20.00 20.00
BVPS 208.85 264.32 343.84 458.66
NAME M Cap Current
P/E (trail.)
Lanka Bangla Finance Limited 18,555.7 26.51x
Prime Finance and Investment Limited 15,695.5 28.74x
Delta Brac Housing Finance Corporation Limited– an overview
Delta Brac Housing Finance Corporation Limited (DBH) started its operation in 1996 to meet up the demand of housing sector finance in Bangladesh. DBH is the first in public sector in specialized housing sector finance in Bangladesh. It is committed to facilitate the real estate sector finance and other consulting services in housing related activities in the country.
Product and services snapshot
The main activities of DBH are providing various loans for construction of houses, purchases of flats or houses, exten-sion and improvement of existing houses or flats and purchase of housing plots. The diversified home loan product in-clude apartment loan, home construction loan, housing plot loan, home extension loan, home improvement loan, BB Refinance Scheme, home owner’s loan, flexi plus loan and protection Insurance. The company also provides services for purchase, sale and transfer of real estate assets.
DBH’s investment and financing products include term deposit scheme, cumulative deposit, triple money deposit, dou-ble money deposit, annual income deposit, quarterly income deposit, easy way deposit, profit first deposit etc. fro indi-vidual and corporate clients.
Source: Company annual report published as on October 22, 2009
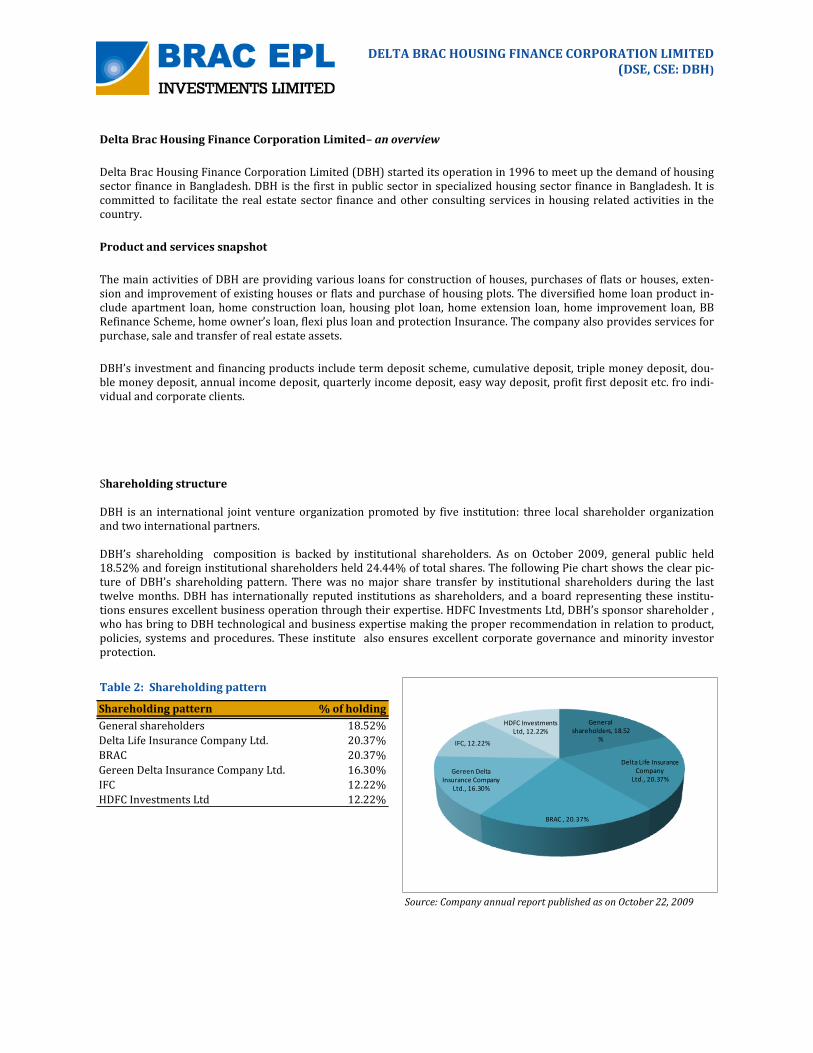
Shareholding structure DBH is an international joint venture organization promoted by five institution: three local shareholder organization and two international partners. DBH’s shareholding composition is backed by institutional shareholders. As on October 2009, general public held 18.52% and foreign institutional shareholders held 24.44% of total shares. The following Pie chart shows the clear pic-ture of DBH’s shareholding pattern. There was no major share transfer by institutional shareholders during the last twelve months. DBH has internationally reputed institutions as shareholders, and a board representing these institu-tions ensures excellent business operation through their expertise. HDFC Investments Ltd, DBH’s sponsor shareholder , who has bring to DBH technological and business expertise making the proper recommendation in relation to product, policies, systems and procedures. These institute also ensures excellent corporate governance and minority investor protection.
The main funding source of DBH is customer deposits. 71% of total fund comprises of various long term depos-its. The other sources of funds are long term loan (20%), Zero coupon bond (20%), shareholders funds (7%) and 0.1% of subordinated debt. The average cost of fund is around 8%-9%.
Shareholder's Funds
7% Zero Coupon Bonds2%
Long Term Loans20%
Subordinated Loan0.1%
Deposits71%
Funds Employed
Table 3: Equity position
0
200
400
600
800
1000
1200
2005 2006 2007 2008 2009
Share capital
Reserve & Surplus
Total Equity
Particulars 2005 2006 2007 2008 2009
Share capital 200.0 200.0 220.0 270.0 351.0
Reserve & Surplus 236.0 314.0 418.0 573.0 716.0
Total Equity 436.0 514.0 638.0 843.0 1,067.0
Source: Company Annual Report
Balance sheet growth: The shareholder’s equity as on 30 June 2009 was BDT 1.07 billion which was 26% higher than the previous year.
In the last two years, assets, loans, and deposits grew on average by 38.5%, 34.00% and 29% respectively. DBH’s total assets stood at BDT 16.3 billion year ended 2008-2009. In the year 2008-2009, assets increased by BDT 5.3 billion or 4879%. Loans and advances increased by BDT 3.5 billion and stood at BDT 13.24 billion at year end 2008- 2009. Growth rate was 36%. Total deposit grew by BDT 3.2 billion at year end 2008- 2009 with a growth rate of 42%. We are expecting same level of growth in coming years.
DBH has achieved 43% deposits growth in last year and deposit growth has been continued since 2005. We are expecting 35% deposit growth in next five years. This level of deposit growth is impressive in this sector where NBFIs are competing with the banks.
Source: Company Annual Report
Loan growth: both approval and disbursement has been increasing
DBH has achieved 35% loan growth in last year and loan growth has been continued since 2005. We are expecting 35% loan growth in next five years. This level of loan growth is impressive in this sector where NBFIs are com-peting with the banks in terms of interest rate.
Housing loan is the main area where DBH has put maxi-mum emphasis to increase and retain this level of growth.
Loan approval and disbursement has been increasing over the last five years and we are expecting this level of growth in next years. Currently DBH has more than BDT 13,000 million exposure to housing sector. The total cumulative loan amount of DBH was more than BDT 16,000 million on 30 June 2009.
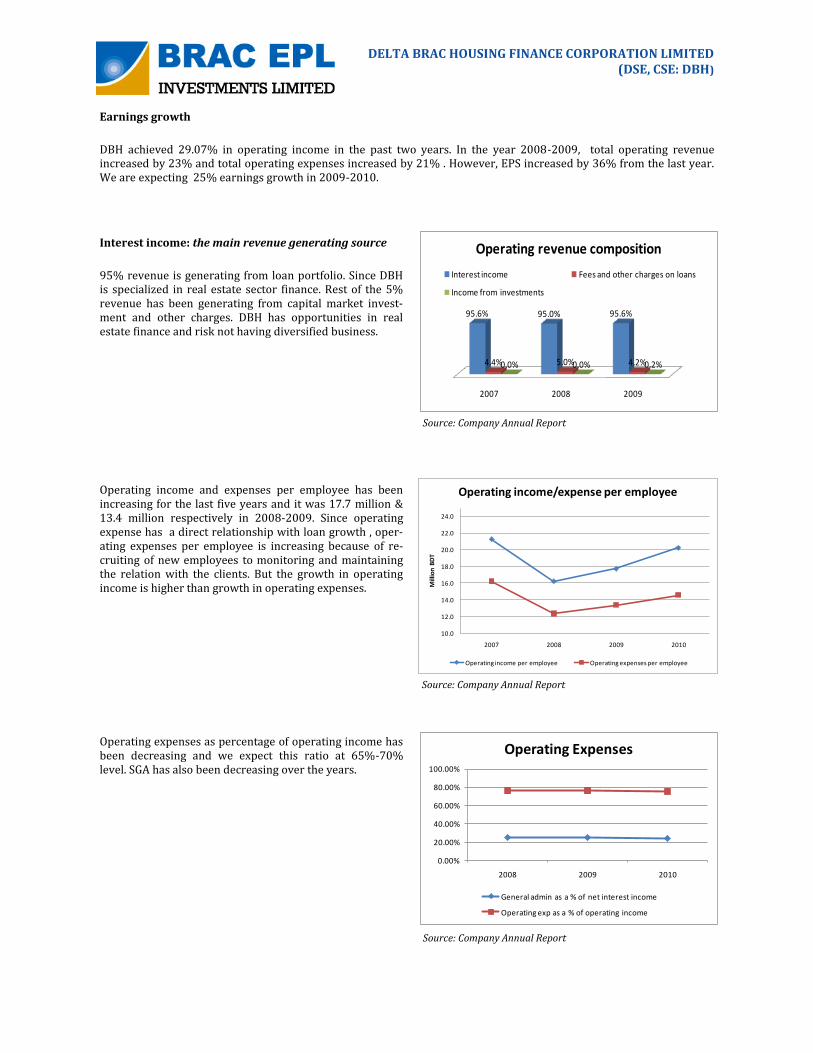
Operating income and expenses per employee has been increasing for the last five years and it was 17.7 million & 13.4 million respectively in 2008-2009. Since operating expense has a direct relationship with loan growth , oper-ating expenses per employee is increasing because of re-cruiting of new employees to monitoring and maintaining the relation with the clients. But the growth in operating income is higher than growth in operating expenses.
Operating expenses as percentage of operating income has been decreasing and we expect this ratio at 65%-70% level. SGA has also been decreasing over the years.
Earnings growth
DBH achieved 29.07% in operating income in the past two years. In the year 2008-2009, total operating revenue increased by 23% and total operating expenses increased by 21% . However, EPS increased by 36% from the last year. We are expecting 25% earnings growth in 2009-2010.
2007 2008 2009
95.6% 95.0% 95.6%
4.4% 5.0% 4.2%0.0% 0.0% 0.2%
Operating revenue composition
Interest income Fees and other charges on loans
Income from investments
Source: Company Annual Report
Interest income: the main revenue generating source
95% revenue is generating from loan portfolio. Since DBH is specialized in real estate sector finance. Rest of the 5% revenue has been generating from capital market invest-ment and other charges. DBH has opportunities in real estate finance and risk not having diversified business.
10.0
12.0
14.0
16.0
18.0
20.0
22.0
24.0
2007 2008 2009 2010
Mill
ion
BD
T
Operating income/expense per employee
Operating income per employee Operating expenses per employee
Operating profit before provision, profit before tax and net profit after tax has been increasing since 2005. The effect of provision on profit is significantly low due to impressive NPL ratio of DBH.
Asset quality Jun-07 Jun-08 Jun-09
Total provisions MM 111.9 170.80 216.20
NPL% 0.15% 0.11% 0.06%
Table 6: Assets quality
Asset Quality
DBH had a NPL ratio of 0.06% at the end of 2009 which is very impressive. Being all the loan portfolio is se-cured by the underlying assets, DBH has managed its NPL at a very low level. NPL ratio has also been de-creasing over the years because of management effi-ciency in managing non-performing loans.
Allowance for classified loans
The provision against classified loans of DBH increased during the year 2008-2009. But the NPL ratio has been decreasing over the years due to efficient management of loan portfolio. Since the loan portfolio is secured by highly eligible security, DBH’s NPL ratio always remains low.
Strength and Opportunities make DBH different
Strength
Well diversified home loan product.
Efficient utilization of housing refinance line of Bangladesh Bank (Central Bank).
DBH has staff/representative at the land registry offices to help clients with registration process.
Technological support from HDFC Limited in product development, business process, etc.
Secured loans, very low NPL
Good relationship with large developers due to real estate focus.
It has offices at the construction sites of large projects.
Opportunities
Financial intermediation in housing sector is not adequate because of high interest rates and limited sources of funding. BDH has experience and expertise to widen its existing customer base
The state owned House Building Finance Corporation (HBFC) is burdened with bad loans, and loan disbursement is relatively low in recent years.
Market expanding from predominately Dhaka based to city-centers in other economically important regions. DBH has scope to focus new customers.
Developers are sliding down the income range, targeting lower income clients .
Risk factors involved
Banks are the main competitor of DBH. Recently banks are showing their interest in real estate finance sector.
Market size will increase substantially, but mark-ups will reduce.
Competition expected to be intense, and jointly-funded projects may be undertaken.
Supply of power, water and gas (fuel) may be a bottleneck in real estate development sector which has a direct rela-tionship with BDH business.
Our residual income method of valuation estimates a value of BDT 2,229. We assume 27%-31% ROE for the years of 2010-2015(based on historical ROE), risk free rate of 9 % ( average Gov. Securities rate), cost of equity of 15% and a terminal growth rate of 7%.
VALUATION
Relative valuation
In valuing Delta Brac housing (DBH), we compared nine non-banking financial institution listed on the DSE and found average trailing P/E and P/B ratios of 28.84x (trailing) and 6.75x (trailing) respectively. At current price, DBH trades at 16.74x P/E (trailing) and 4.99x (trailing). Using a 20.00x P/E multiple over 2011E earnings of 114.82, we deter-mine a target price of BDT 2296.3. Using a 4.25x P/B multiple over 2011E book value of 458.66.00, we calculate a target price of BDT 1,949.3. We set a target price of BDT 2,250.00 for DBH that im-plies forward P/E and P/B ratios of 20.00x and 4.25x respectively. (Since 30 June is the financial year ending of DBH, 2011 EPS and BVPS have been considered for valuation)
Table 10: Comparative Information of four East Asian Bank/NBFIs
In conducting a valuation for DBH, we have looked at the trading prices of some of the leading similar type of banks/NBFIs in the region. These banks/NBFIs are in mid-income countries with mostly mature banking/financial markets, and have a slower growth prospect. Whereas Bangladeshi NBFIs routinely achieve 30% growth in assets and deposits, . On the other hand, these banks/NBFIs are also better managed with superior asset quality and risk management prac-tices.
These group of peer banks/NBFIs trade at an average of 24.29x P/E and 3.07x P/B (trailing). Consequently, we feel that the group of Bangladeshi banks in Table 6 are trading at a fair valuation.
Regional Banks/NBFIs Country Currency Price* EPS P/E BVPS P/B
IDFC INDIA INR 152 5.74 26.40x 47.51 3.19x
ICICI INDIA INR 843 32.13 26.25x 428.43 1.97x
HDFC INDIA INR 2,477 81.27 30.48x 483.88 5.12x
Tabungan Negara INDONESIA IDR 1,050 68.00 15.44x 484.50 2.17x
Average 24.64x 3.11x
Source: Business Week and Google Finance, as on 25 February 2010
Issues in the Bangladesh Real Estate Market
Following trends support growth in the real estate market:
As population continues to increase in future, land for agriculture and forest shrinks in tandem
This calls for high-density settlement either in high-rise or in small-unit low rise apartments
Area occupied by human settlement and infrastructure in Bangladesh is already quite high at 30%
Land becoming increasingly inadequate to provide individual housing solution to all; thus the demand for
apartments is growing
Inheritors also find building apartments a solution to share common property
Remittance flow, clocking a high growth, also drove up demand for housing
Dhaka experienced a 6% growth over the last 36 years, 4% growth in the last 10 years
Each year, about 3.0 million new households created
Estimates for annual requirement for housing in urban areas vary from 300,000 to 550,000 units
...However, certain structural issues are hindering a balanced growth in the real estate sector:
Financial intermediation in housing sector is not adequate because of high interest rates and limited sources
of funding
The state owned House Building Finance Corporation (HBFC) is burdened with bad loans, and loan disburse-
ment is relatively low in recent years
Long-term mortgage loan is an issue – bond market is a prerequisite
Land registration process is still archaic—it harbors many inefficiencies
Land is scarce—government still hold land in the urban area but is not very efficient in allocating it
Government participation in land development promoting opaque practices.
Analyst Certification: Each research analyst and research associate who authored this document and whose name appears herein certifies that the recommendations and opinions expressed in the research report accurately reflect their personal views about any and all of the securities or issuers discussed therein that are within the coverage universe. Disclaimer: Estimates and projections herein are our own and are based on assumptions that we believe to be reasonable. Information presented herein, while obtained from sources we believe to be reliable, is not guaranteed either as to accuracy or completeness. Neither the information nor any opinion expressed herein constitutes a solicitation of the purchase or sale of any security. As it acts for public companies from time to time, BRAC-EPL may have a relationship with the above mentioned company(s). This report is intended for distribution in only those jurisdictions in which BRAC-EPL is registered and any distribution outside those jurisdictions is strictly prohibited. Compensation of Analysts: The compensation of research analysts is intended to reflect the value of the services they provide to the clients of BRAC-EPL. As with most other employees, the compensation of research analysts is impacted by the overall profitability of the firm, which may include revenues from corporate finance activities of the firm's Corporate Finance department. However, Research analysts' compensation is not directly related to specific corporate finance transaction. General Risk Factors: BRAC-EPL will conduct a comprehensive risk assessment for each company under coverage at the time of initiating research coverage and also revisit this assessment when subsequent update reports are published or material company events occur. Following are some general risks that can impact future operational and financial performance: (1) Industry fundamentals with respect to customer demand or product / service pricing could change expected revenues and earnings; (2) Issues relating to major competitors or market shares or new product expectations could change investor attitudes; (3) Unforeseen developments with respect to the management, financial condition or accounting policies alter the prospective valuation; or (4) Interest rates, currency or major segments of the economy could alter investor confidence and investment prospects.