MAINE DEPARTMENT OF TRANSPORTATION BRIDGE PROGRAM GEOTECHNICAL SECTION AUGUSTA, MAINE GEOTECHNICAL DESIGN REPORT For the Replacement of: CHARLES RIVER BRIDGE OVER CHARLES RIVER FRYEBURG, MAINE Prepared by: Kathleen Maguire, P.E. Geotechnical Engineer Reviewed by: Laura Krusinski, P.E. Senior Geotechnical Engineer Oxford County Soils Report No. 2009-29 PIN 15095.00 Bridge No. 2151 Fed No. BR-1509(500)X October 2, 2009
Tables Table 1 - Summary of Bedrock Depths, Elevations and RQD Table 2 - Estimated Pile Lengths for H-Piles Table 3 - Factored Axial Resistances for Abutment Piles at the Strength Limit State Table 4 - Factored Axial Resistances for Abutment Piles at the Service and Extreme Limit States Table 5 - Equivalent Height of Soil for Estimating Live Load Surcharge Table 6 - Preliminary Estimates of Depth to Fixity Sheets Sheet 1 - Location Map Sheet 2 - Boring Location Plan and Interpretive Subsurface Profile Sheet 3 - Boring Logs Appendices Appendix A - Boring Logs Appendix B - Laboratory Data Appendix C - Calculations Appendix D - Special Provisions
Charles River Bridge Over Charles River Fryeburg, Maine PIN 15095.00
1
GEOTECHNICAL DESIGN SUMMARY The purpose of this report is to make geotechnical recommendations for the replacement of the Charles River Bridge over the Charles River in Fryeburg, Maine. The proposed replacement structure will be a single-span structure on H-pile supported integral abutments. The following design recommendations are discussed in detail in the attached report: Integral Abutment H-piles - The use of stub abutments founded on a single row of driven integral H-piles is a viable foundation system for use at the site. The piles should be end bearing, driven to the required resistance on or within the bedrock. Piles may be HP 12x53, HP 14x73, HP 14x89, or HP 14x117 depending on the design axial loads. Piles should be 50 ksi, Grade A572 steel H-piles. Piles should be driven with their weak axis perpendicular to the center line of the beams. Piles should be fitted with driving points. The use of Rock Injector “H” Bearing Pile points is recommended. Short piles supporting integral abutments should be designed in accordance with AASHTO LRFD criteria and checked for pile tip movement using L-Pile® software or as described in the design example found in Appendix B of Technical Report ME-01-7, June 2005, “Behavior of Pile Supported Integral Abutments at Bridge Sites with Shallow Bedrock - Phase 1” and Chapter 5 of that report. The designer shall design the H-piles at the strength limit state considering the structural resistance of the piles, the geotechnical resistance of the pile and loss of the lateral support due to scour at the design flood event. The structural resistance check should include checking axial, lateral, and flexural resistance. The design of the H-piles at the service limit state shall consider tolerable horizontal movement of the piles, overall stability of the pile group and scour at the design flow event. Since the abutment piles will be subjected to lateral loading, piles should be analyzed for axial loading and combined axial and flexure. The Contractor is required to perform a wave equation analysis of the proposed pile-hammer system and a dynamic pile test at each abutment. The first pile driven at each abutment should be dynamically tested to confirm capacity and verify the stopping criteria developed by the Contractor in the wave equation analysis. The ultimate pile resistance that must be achieved in the wave equation analysis and dynamic testing will be the factored axial pile load divided by a resistance factor of 0.65. The factored pile load should be shown on the plans. Abutments and Wingwalls - Abutments and wingwalls shall be designed for all relevant strength, service and extreme limit states and load combinations specified in LRFD Articles 3.4.1 and 11.5.5. The design of pile supported abutments and wingwalls at the strength limit state shall consider pile stability and structural resistance. Extreme limit state design shall also consider foundation resistance after scour due to the check flood. In designing integral abutments for passive earth pressure, the Rankine earth pressure coefficient (Kp) of 3.25 is allowed if the displacement of the abutment is less than 2 percent of the abutment height. All abutment designs shall include a drainage system to intercept any water. To avoid water intrusion behind the abutment, the approach slab should connect directly to the abutment.
Charles River Bridge Over Charles River Fryeburg, Maine PIN 15095.00
2
Pile Fixity - It is recommended that piles be designed to achieve a fixed condition at the pile toe. Due to the depth of the overburden at the site, it is anticipated that the pile sections at both abutments will not achieve a fixed condition assuming a pile penetration to the top of bedrock. Short piles supporting integral abutments should be designed in accordance with AASHTO LRFD criteria and checked for pile tip movement using L-Pile® software or as described in the design example found in Appendix B of Technical Report ME-01-7, June 2005, “Behavior of Pile Supported Integral Abutments at Bridge Sites with Shallow Bedrock - Phase 1” and Chapter 5 of that report. Bearing Resistance – MaineDOT policy requires that spread footing on soil at stream crossings be founded at a depth of at least 2 feet below the scour depth determined for the check flood for scour and that spread footings supported on soil within a stream channel should be located a minimum of 6 feet below the thalweg of the waterway. Therefore, if project abutments are supported on spread footings, it is recommended that the Abutment No. 2 footing be founded directly on bedrock or a seal constructed on bedrock. If the designer determines that the Abutment No. 1 spread footing on soil cannot withstand the consequences of change in foundation conditions at the strength limit state resulting from scour due to the design flood event, or at the extreme limit state resulting from scour due to the check flood event, then the Abutment No. 1 foundation should be founded on bedrock. These elements will need to be designed to provide stability against bearing capacity failure. Bearing resistances are as follows:
• For spread footings founded on native soils: o at the strength limit state a factored bearing resistance of 14 ksf o at the service limit state a factored bearing resistance of 6 ksf
• For spread footings founded on bedrock: o at the strength limit state a factored bearing resistance of 17 ksf o at the service limit state a factored bearing resistance of 20 ksf
Footings shall be designed so that the factored bearing resistance after the design scour event provides adequate resistance to support the factored strength limit state loads. Scour and Riprap - The consequences of changes in foundation conditions resulting from the design flood for scour shall be considered at the strength, service and extreme limit states. These changes in foundation conditions shall be investigated at the abutments, wingwalls and piers. For scour protection, any footings which are constructed on granular deposits, should be embedded a minimum of 3 feet below the design scour depth and armored with 3 feet of riprap. Settlement - Post-construction settlements are anticipated to be less than 1.0 inch. Any settlement of the bridge abutments will be due to the elastic compression of the piling and will be negligible. Frost Protection - Any foundations placed on granular soils should be founded a minimum of 6.5 feet below finished exterior grade for frost protection. Integral abutments shall be embedded a minimum of 6.5 feet for frost protection.
Charles River Bridge Over Charles River Fryeburg, Maine PIN 15095.00
3
Seismic Design Considerations - The Charles River Bridge is not the National Highway System and is therefore not considered to be functionally important and since the bridge construction costs should not exceed $10 million the bridge is not classified as a major structure. The site is assigned to Seismic Zone 1. A detailed seismic analysis is not required for single span bridges regardless of seismic zone. However, superstructure connections and minimum support length requirements shall be satisfied. Construction Considerations - Since the proposed bridge design will rely on the riprap slopes to provide scour protection for the integral abutment piles, slope construction and riprap placement are of critical importance. The existing riprap slopes shall be reconstructed in their entirety. Care should be taken in construction of the riprap slopes to assure that they are constructed in accordance with MaineDOT Special Provisions 610 and 703 and the plans. There is potential for wood fill and possible remaining granite blocks from a previous structure to impact the pile driving and/or installation operations. Obstructions may be cleared as approved by the Resident.
Charles River Bridge Over Charles River Fryeburg, Maine PIN 15095.00
4
1.0 INTRODUCTION A subsurface investigation for the replacement of the Charles River Bridge over the Charles River in Fryeburg, Oxford County, Maine has been completed. The purpose of the investigation was to explore subsurface conditions at the site in order to develop geotechnical recommendations for the bridge replacement. This report presents the soils information obtained at the site, geotechnical design recommendations, and foundation recommendations. The existing Charles River Bridge was constructed in 1930 and consists of a 75 foot long, single span, steel plate girder superstructure supported on concrete abutments. When the existing structure was designed, both of the abutments were designed as spread footings founded on the native sands. Construction files indicate that a construction change order was made to use a pile supported structure at the west end of the bridge. No details of the piles were available. The 2008 Maine Department of Transportation (MaineDOT) maintenance inspection reports indicate that the bridge superstructure is in “serious” condition (rating of 3), the substructure is in “good” condition (rating of 7) and the deck is in “fair” condition (rating of 5). The Bridge Sufficiency Rating is 20.1. The bridge has a scour critical rating of 8 meaning that the bridge foundations have been determined to be stable for the assessed or calculated scour condition. It is understood that portions of the existing abutments will remain in place in the replacement of the structure. The proposed replacement structure will be a 100 foot long, single span, rolled steel girder superstructure supported on integral abutments with butterfly wings on H-piles driven to bedrock. The proposed bridge alignment will match into the existing with a minor lateral shift to the south in order to accommodate the wider road section and minimize impacts to a driveway within the work area. The roadway grade will be raised approximately 1.7 feet behind both abutments. The bridge will be closed to traffic during the replacement.
2.0 GEOLOGIC SETTING The Charles River Bridge in Fryeburg carries Harbor Road over the Charles River approximately 1.9 miles east of Route 113 as shown on Sheet 1 - Location Map found at the end of this report. The Charles River flows out of Charles Pond in a southeasterly direction into the Old Course Saco River which flows into the Saco River. According to the Surficial Geologic Map of Maine published by the Maine Geological Survey (1985) the surficial soils in the vicinity of the site consist of stream alluvium. These soils consist of sand, gravel and silt. These soils are generally deposited on flat to gently sloping flood plains and stream terraces and gently to moderately sloping alluvial fans. These soils are deposited on flood plains and stream beds by post glacial streams. According to the Surficial Bedrock Map of Maine, published by the Maine Geological Survey (1985), the bedrock at the site is identified as igneous carboniferous muscovite-biotite granite commonly known as the Sebago pluton.
Charles River Bridge Over Charles River Fryeburg, Maine PIN 15095.00
5
3.0 SUBSURFACE INVESTIGATION Subsurface conditions were explored by drilling three (3) test borings at the site. Test boring BB-FCR-101 was drilled at the location of Abutment No. 1 (west). Test boring BB-FCR-102 was drilled at the center of the crossing. Test borings BB-FCR-103 was drilled at the location of Abutment No. 2 (east). The exploration locations and an interpretive subsurface profile depicting the site stratigraphy are shown on Sheet 2 - Boring Location Plan and Interpretive Subsurface Profile found at the end of this report. The borings were drilled between May 27 and June 1, 2009 by the MaineDOT drill crew. Details and sampling methods used, field data obtained, and soil and groundwater conditions encountered are presented in the boring logs provided in Appendix A - Boring Logs and on Sheet 3 - Boring Logs found end of this report. The borings were drilled using driven cased wash boring and solid stem auger techniques. Soil samples were obtained where possible at 5-foot intervals using Standard Penetration Test (SPT) methods. During SPT sampling, the sampler is driven 24 inches and the hammer blows for each 6 inch interval of penetration are recorded. The standard penetration resistance, N-value, is the sum of the blows for the second and third intervals. MaineDOT drill rig is equipped with an automatic hammer to drive the split spoon. The hammer was calibrated in February of 2009 and was found to deliver approximately 40 percent more energy during driving than the standard rope and cathead system. All N-values discussed in this report are corrected values computed by applying an average energy transfer factor of 0.84 to the raw field N-values. This hammer efficiency factor (0.84) and both the raw field N-value and the corrected N-value are shown on the boring logs. The bedrock was cored in the borings using an NQ-2” core barrel and the Rock Quality Designation (RQD) of the core was calculated. The MaineDOT geotechnical team member selected the boring locations and drilling methods, designated type and depth of sampling techniques and identified field and laboratory testing requirements. The geotechnical team member and a MaineDOT, North East Transportation Technician Certification Program (NETTCP) Certified Subsurface Inspector logged the subsurface conditions encountered. The borings were located in the field by use of a tape after completion of the drilling program.
4.0 LABORATORY TESTING Laboratory testing for samples obtained in the borings consisted of eleven (11) standard grain size analyses and two (2) grain size analyses with hydrometer. The results of these laboratory tests are provided in Appendix B - Laboratory Data at the end of this report. Moisture content information and other soil test results are included on the Boring Logs in Appendix A and on Sheet 3 - Boring Logs found at the end of this report.
Charles River Bridge Over Charles River Fryeburg, Maine PIN 15095.00
6
5.0 SUBSURFACE CONDITIONS Subsurface conditions encountered at the test borings generally consisted of fill sands, underlain by silt, underlain by native sand, underlain by granite bedrock. An interpretive subsurface profile depicting the site stratigraphy is shown on Sheet 2 – Boring Location Plan and Interpretive Subsurface Profile found at the end of this report. The following paragraphs discuss the subsurface conditions encountered in detail:
5.1 Fill Sand A layer of fill sand was encountered beneath the pavement behind both of the abutments. The thickness of the layer ranged from approximately 8.9 feet in boring BB-FCR-101 to approximately 9.5 feet in boring BB-FCR-103. The soil generally consisted of light brown and brown, damp, fine to coarse sand with little to some silt and little to trace gravel. The layer also included silty sand in boring BB-FCR-103. Corrected SPT N-values in the fill sand ranged from 6 to 20 blows per foot (bpf) indicating that the soil is loose to medium dense in consistency. Water contents from three (3) samples obtained within the fill sand layer range from approximately 7% to 30%. Three (3) grain size analyses conducted on samples of the fill sand indicate that the soil is classified as an A-2-4 or A-4 by the AASHTO Classification System and a SM by the Unified Soil Classification System.
5.2 Silt Silt was encountered beneath the fill sand behind the abutments. The thickness of the silt layer ranged from approximately 11.0 feet in boring BB-FCR-101 to approximately 4.5 feet in boring BB-FCR-103. A layer of wood was encountered at the top of the silt in boring BB-FCR-103. Organics were encountered within the layer in boring BB-FCR-101. The silt generally consisted of brown and grey, damp to wet, sandy silt, clayey silt and silt, with trace gravel. Corrected SPT N-values in the silt layer ranged from 3 to 49 bpf indicating that the silt is soft to hard in consistency. Water contents from four (4) samples obtained within the silt layer range from approximately 34% to 41%. Four (4) grain size analysis conducted on samples from the silt layer indicates that the soil is classified as an A-4 or A-7-6 by the AASHTO Classification System and a ML, CL, or CL-ML by the Unified Soil Classification System.
5.3 Native Sand A layer of native sand was encountered in all of the borings. The thickness of the layer ranged from approximately 5.8 feet in boring BB-FCR-103 to approximately 6.8 feet thick boring BB-FCR-102. The native sand generally consisted of brown and grey brown, wet to saturated, fine to coarse sand with little to some silt and trace to little gravel. Corrected SPT N-values in the native sand layer ranged from 8 to 41 bpf indicating that the soil is loose to dense in consistency. Water contents from six (6) samples obtained within the native sand layer range from approximately 10% to 30%. Six (6) grain size analyses conducted on
Charles River Bridge Over Charles River Fryeburg, Maine PIN 15095.00
7
samples from the native sand layer indicate that the soil is classified as an A-1-b or A-2-4 by the AASHTO Classification System and a SM by the Unified Soil Classification System.
5.4 Bedrock Bedrock was encountered and cored in three of the borings. The Table 1 summarizes the depths to bedrock and corresponding elevations of the top of bedrock:
Table 1 – Summary of Bedrock Depths, Elevations and RQD The bedrock is identified as white, brown, grey and black, coarse grained, GRANITE with mica and pyrite. The rock quality designation (RQD) of the bedrock was determined to range from 38 to 72 percent indicating a rock mass quality of poor to fair quality.
5.5 Groundwater Groundwater was observed at a depths ranging from approximately 10.0 feet to 12.4 feet below the existing ground surface. The water levels measured upon completion of drilling are indicated on the boring logs found in Appendix A. Note that water was introduced into the boreholes during the drilling operations. It is likely that the water levels indicated on the boring logs do not represent stabilized groundwater conditions. Additionally, groundwater levels are expected to fluctuate seasonally depending upon the local precipitation magnitudes.
6.0 FOUNDATION ALTERNATIVES Based on the subsurface conditions encountered during the subsurface exploration program, the following foundation alternatives may be considered for the bridge replacement:
• Cast-in-place concrete or precast concrete integral abutments supported on driven steel H-piles
• Cast-in-place concrete or precast concrete abutments supported on spread footings The Preliminary Design Report (PDR) for this project recommends that the replacement bridge be supported on H-pile supported integral abutments. This report addresses both of these foundation types for use in design.
Charles River Bridge Over Charles River Fryeburg, Maine PIN 15095.00
8
7.0 FOUNDATION CONSIDERATIONS AND RECOMMENDATIONS The following sections will discuss geotechnical design recommendations for cast-in-place concrete or precast concrete integral abutments supported on driven steel H-piles and cast-in-place concrete or precast concrete abutments supported on spread footings. The use of short pile supported integral abutments is under consideration by the MaineDOT Bridge Program. Initial results indicate that although fixity is not achieved for piles less than 13 feet long, the structure can accommodate cyclic live and thermal loading without any major consequence. The current study1 indicates that the use of short pile supported integral abutments for bridges with spans not exceeding 115 feet is applicable. However, in consideration of the consequences scour and pile exposure and the need to limit pile tip movement, a minimum pile length of 10 feet is recommended.
7.1 Integral Abutment H-piles The use of stub abutments founded on a single row of driven integral H-piles is a viable foundation system for use at the site. The piles should be end bearing, driven to the required resistance on or within the bedrock. Piles may be HP 12x53, HP 14x73, HP 14x89, or HP 14x117 depending on the design axial loads. Piles should be driven with their weak axis perpendicular to the center line of the beams. Piles should be 50 ksi, Grade A572 steel H-piles. Piles should be fitted with driving points to protect the tips, improve penetration and improve friction at the pile tip to support a pinned pile tip assumption. Due to the short length of pile for the project the use of Rock Injector “H” Bearing Pile points manufactured by Titus Steel Co. or approved equal is recommended. Pile lengths at the proposed abutments may be estimated based on Table 2 below:
Table 2 – Estimated Pile Lengths for H-Piles These pile lengths do not take into account the pile length embedded in the pile cap, the additional five (5) feet of pile required for dynamic testing instrumentation or any additional pile length needed to accommodate the Contractor’s leads and driving equipment.
1 MaineDOT Technical Report ME-01-7, June 2005, “Behavior of Pile Supported Integral Abutments at Bridge Sites with Shallow Bedrock - Phase 1”
Charles River Bridge Over Charles River Fryeburg, Maine PIN 15095.00
9
The designer shall design the H-piles at the strength limit state considering the structural resistance of the piles, the geotechnical resistance of the pile and loss of the lateral support due to scour at the design flood event. The structural resistance check should include checking axial, lateral, and flexural resistance. Resistance factors for use in the design of piles at the strength limit state are discussed below. Short piles supporting integral abutments should be designed in accordance with AASHTO LRFD criteria and checked for pile tip movement using L-Pile® software or as described in the design example found in Appendix B of Technical Report ME-01-7, June 2005, “Behavior of Pile Supported Integral Abutments at Bridge Sites with Shallow Bedrock - Phase 1” and Chapter 5 of that report. The design of the H-piles at the service limit state shall consider tolerable horizontal movement of the piles, overall stability of the pile group and scour at the design flow event. Extreme limit state design shall check that the nominal pile resistance remaining after scour due to the check flood can support the extreme limit state loads with a resistance factor of 1.0. The design and check floods for scour are defined in AASHTO LRFD Bridge Design Specifications 4th Edition (LRFD) Articles 2.6.4.4.2 and 3.7.5. Since the abutment piles will be subjected to lateral loading, piles should be analyzed for axial loading and combined axial and flexure as defined in LRFD Article 6.15.2 and specified in LRFD Article 6.9.2.2. An L-Pile® analysis is recommended to evaluate the soil-pile interaction for combined axial and flexure, with factored axial loads, movements and pile head displacements. Achievement of an assumed pinned condition at the pile tip should also be confirmed with an L-Pile® analysis. As the proposed piles for the abutments will be short and will not achieve fixity, the resistance for the pile will be determined for structural compliance with interaction equation. The integrity of the bridge approach fills and riprap abutment slopes must be maintained as these provide the only lateral support to the short pile group. The stream velocity should be low and there should be low potential for scour action, wave action, storm surge, and ice damage.
7.1.1 Strength Limit State The nominal structural compressive resistance (Pn) in the strength limit state for piles loaded in compression shall be as specified in LRFD Article 6.9.4.1. It is the responsibility of the structural engineer to recalculate the column slenderness factor (λ) for the upper and lower portions of the H-pile based on unbraced lengths and K-values from project specific L-Pile® analyses and determine structural pile resistances. Preliminary estimates of the factored structural axial compressive resistances of the four (4) proposed H-pile sections were calculated using a resistance factor, φc, of 0.60 (good driving conditions) and a λ of 0. The nominal geotechnical compressive resistance in the strength limit state was calculated using Canadian Foundation Engineering Manual methods. The factored geotechnical compressive resistances of the four proposed H-pile sections were calculated using a resistance factor, φstat, of 0.45.
Charles River Bridge Over Charles River Fryeburg, Maine PIN 15095.00
10
The drivability of the four (4) proposed H-pile sections was considered. The maximum driving stresses in the pile, assuming the use of 50 ksi steel, shall be less than 45 ksi. As the piles will be driven to refusal on bedrock a drivability analysis to determine the resistance that must be achieved was conducted. The resistance factor for a single pile in axial compression when a dynamic test is done, given in LRFD Table 10.5.5.2.3-1, is φdyn= 0.65. The calculated factored axial compressive structural, geotechnical and drivability resistances of the four (4) proposed H-pile sections for the abutments are summarized in Table 3 below. Supporting calculations are included in Appendix C- Calculations found at the end of this report.
Factored Resistance Pile Section Structural
Resistance* Geotechnical Resistance
Drivability Resistance
Design Resistance
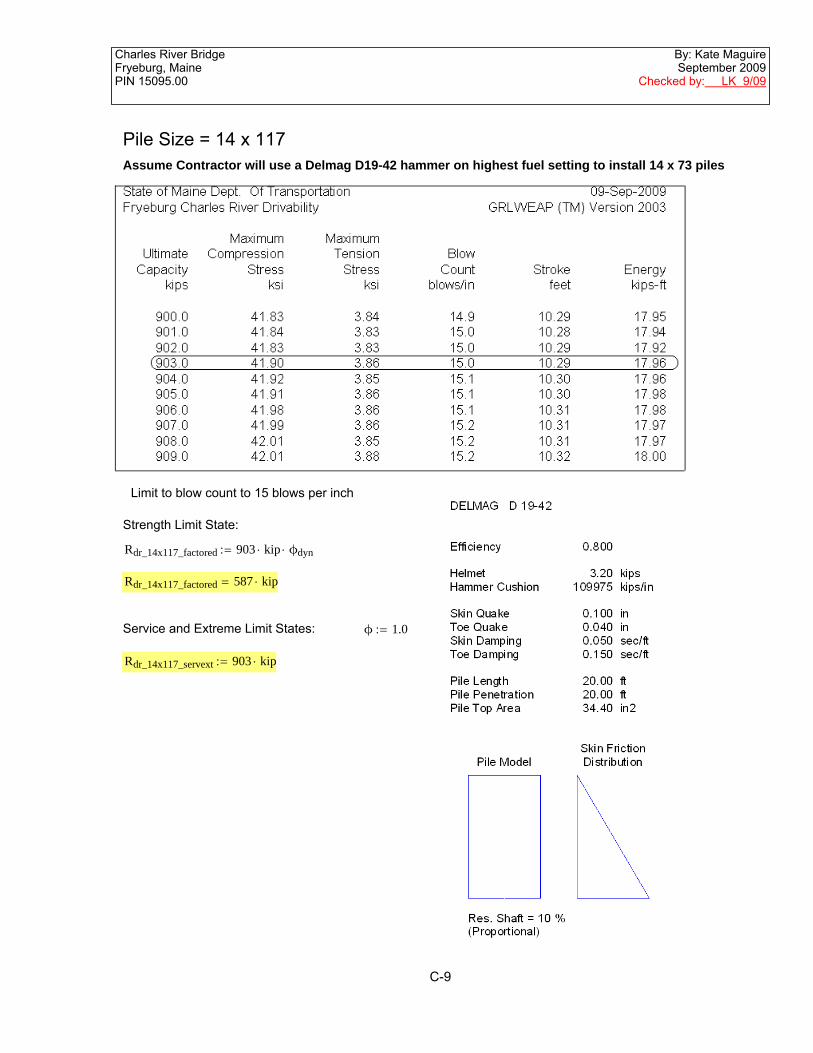
HP 12 x 53 465 kips 357 kips 232 kips 232 kips HP 14 x 73 642 kips 444 kips 348 kips 348 kips HP 14 x 89 783 kips 539 kips 463 kips 463 kips HP 14 x 117 1032 kips 706 kips 587 kips 587 kips
* based on preliminary assumption of λ=0 for the lower portion of the pile in only axial compression (no flexure) Table 3 – Factored Axial Resistances for Abutment Piles at the Strength Limit State
LRFD Article 10.7.3.2.3 states that the nominal resistance of piles driven to point bearing on hard rock where pile penetration into the rock formation is minimal is controlled by the structural limit state. However, the factored axial drivability resistance is less than the factored axial structural resistance and local experience supports the estimated factored resistance from the drivability analyses. Therefore, it is recommended that the maximum factored axial pile load used in design for the strength limit state should not exceed the factored drivability resistance shown in Table 3 above. Per LRFD Article 6.5.4.2, at the strength limit state, for H-piles in compression and bending, the axial resistance factor φc=0.7 and the flexural resistance factor φf =1.0 shall be applied to the combined axial and flexural resistance of the pile in the interaction equation (LFRD Eq. 6.12.2.2.1-1 or -2). The combined axial compression and flexure should be evaluated in accordance with the applicable sections of LRFD Articles 6.9.2.2 and 6.12.2.
7.1.2 Service and Extreme Limit States For the service and extreme limit states resistance factors, φ, of 1.0 are recommended for structural and geotechnical pile resistances. For preliminary analysis, the H-piles can be assumed fully embedded and λ can be taken as 0. It is the responsibility of the structural engineer to recalculate the column slenderness factor (λ) for the upper and lower portions of the H-pile based on unbraced lengths and K-values from project specific L-Pile® analyses and determine structural pile resistances.
Charles River Bridge Over Charles River Fryeburg, Maine PIN 15095.00
11
The calculated factored axial structural, geotechnical and drivability resistances of the four (4) proposed H-pile sections for each abutment are summarized in Table 4 below. Supporting calculations are included in Appendix C- Calculations found at the end of this report.
Factored Resistance Pile Section Structural
Resistance* Geotechnical Resistance
Drivability Resistance
Design Resistance
HP 12 x 53 775 kips 793 kips 357 kips 357 kips HP 14 x 73 1070 kips 986 kips 535 kips 535 kips HP 14 x 89 1305 kips 1198 kips 712 kips 712 kips HP 14 x 117 1720 kips 1568 kips 903 kips 903 kips
*based on preliminary assumption of λ=0 for the lower portion of the pile in only axial compression (no flexure) Table 4 - Factored Axial Resistances for Abutment Piles at the
Service and Extreme Limit States LRFD Article 10.7.3.2.3 states that the nominal resistance of piles driven to point bearing on hard rock where pile penetration into the rock formation is minimal is controlled by the structural limit state. However, the factored axial drivability resistance is less than the factored axial structural resistance and local experience supports the estimated factored resistance from the drivability analyses. Therefore, it is recommended that the maximum factored axial pile load used in design for the service and extreme limit states should not exceed the factored drivability resistance shown in Table 4 above.
7.1.3 Pile Resistance and Pile Quality Control The Contractor is required to perform a wave equation analysis of the proposed pile-hammer system and a dynamic pile test at each abutment. The first pile driven at each abutment should be dynamically tested to confirm capacity and verify the stopping criteria developed by the Contractor in the wave equation analysis. The ultimate pile resistance that must be achieved in the wave equation analysis and dynamic testing will be the factored axial pile load divided by a resistance factor of 0.65. The factored pile load should be shown on the plans. Piles should be driven to an acceptable penetration resistance as determined by the Contractor based on the results of a wave equation analysis and as approved by the Resident. Driving stresses in the pile determined in the drivability analysis shall be less than 45 ksi in accordance with LRFD Article 10.7.8. A hammer should be selected which provides the required resistance when the penetration resistance for the final 3 to 6 inches is 8 to 15 blows per inch. If an abrupt increase in driving resistance is encountered, the driving could be terminated when the penetration is less than 0.5-inch in 10 consecutive blows.
Charles River Bridge Over Charles River Fryeburg, Maine PIN 15095.00
12
7.2 Integral Abutments and Wingwalls Integral abutments and wingwalls shall be designed for all relevant strength, service and extreme limit states and load combinations specified in LRFD Articles 3.4.1 and 11.5.5. The design of pile supported abutments and wingwalls at the strength limit state shall consider pile stability and structural resistance. A resistance factor of φ= 1.0 shall be used to assess abutment design at the service limit state including: settlement, horizontal movement, overall stability and scour at the design flood. The strength limit state loads include any debris loads occurring during the design flood event. The overall global stability of the foundation should be investigated at the Service I Load Combination and a resistance factor,φ, of 0.65. Extreme limit state design checks for abutments supported on piles shall include pile structural resistance, pile geotechnical resistance, pile resistance in combined axial and flexure, and overall stability. Resistance factors, φ, for the extreme limit state shall be taken as 1.0. Extreme limit state design shall also check that the nominal resistance remaining after scour due to the check flood can support the extreme limit state loads with a resistance factor of 1.0. Integral abutments and wingwall sections that are integral with the abutments shall be designed to withstand a passive earth pressure state. The Coulomb passive earth pressure coefficient, Kp, of 6.89 is recommended. Developing full passive requires displacements of the abutment on the order of 2 to 5 percent of the abutment height. If the calculated displacements are significantly less than that required to develop full passive pressure, the designer may consider using the Rankine passive earth pressure case, which assumes no wall friction, or designing using a reduced Coulomb passive earth pressure coefficient, but not less than the Rankine passive earth pressure case using a Rankine passive earth pressure coefficient, Kp, of 3.25. A load factor for passive earth pressure is not specified in LRFD. Use the maximum load factor for active earth pressure, γEH = 1.50. Additional lateral earth pressure due to construction surcharge or live load surcharge is required per Section 3.6.8 of the MaineDOT Bridge Design Guide (BDG) for the wingwalls when traffic loads are located within a horizontal distance equal to one-half of the wall height behind the back of the wall. The live load surcharge on walls may be estimated as a uniform horizontal earth pressure due to an equivalent height of soil (heq) of 2.0 feet per LRFD Table 3.11.6.4-2. Use of an approach slab may be required per the MaineDOT BDG Sections 5.4.2.10 and 5.4.4. When a structural approach slab is specified, reduction, not elimination, of the surcharge loads on abutments is permitted per LRFD Article 3.11.6.5. The live load surcharge on abutments may be estimated as a uniform horizontal earth pressure due to an equivalent height (heq) taken from Table 5 below:
Table 5 - Equivalent Height of Soil for Estimating Live Load Surcharge
Charles River Bridge Over Charles River Fryeburg, Maine PIN 15095.00
13
The Designer may assume Soil Type 4 (MaineDOT BDG Section 3.6.1) for backfill material soil properties. The backfill properties are as follows: φ = 32 degrees, γ = 125 pcf. All abutment and wingwall designs shall include a drainage system behind the abutments to intercept any groundwater. Drainage behind the structure shall be in accordance with Section 5.4.1.4 Drainage of the MaineDOT BDG. Geocomposite drainage board applied to the backsides of the abutments and wingwalls with weep holes will provide adequate drainage. To avoid water intrusion behind the abutment, the approach slab should connect directly to the abutment. Backfill within 10 feet of the abutments and wingwalls and side slope fill shall conform to Granular Borrow for Underwater Backfill - MaineDOT Specification 709.19. This gradation specifies 10 percent or less of the material passing the No. 200 sieve. This material is specified in order to reduce the amount of fines and to minimize frost action behind the structure.
7.3 Estimated Depths to Pile Fixity Stability of the piles shall be evaluated in accordance with the provisions in LRFD Article 6.9 using an equivalent pile length that accounts for the laterally unsupported length of the pile plus the embedment depth to fixity. It is anticipated that the abutments will be protected with newly constructed riprap slopes underlain by a geotextile as scour protection and portions of the existing abutments to remain in place. Historically, there have been no major scour issues at the site. Therefore, no unsupported length of pile needs to be considered in the evaluation of pile fixity. Preliminary depths to fixity for the four (4) proposed H-pile sections were calculated, assuming only axial loading and without consideration of lateral loads using methodology from the MassHighway Bridge Manual (2005). Table 6 below summarizes the calculated depths to fixity for the four (4) proposed H-pile sections. Supporting calculations are included in Appendix C- Calculations found at the end of this report.
H-pile Section
Preliminary Estimates of Depth to Fixity w/ no lateral
loads applied HP 12 x 53 19 feet HP 14 x 73 21 feet HP 14 x 89 21 feet HP 14 x 117 23 feet
Table 6 - Preliminary Estimates of Depth to Fixity
In general it is recommended that piles be designed to achieve a fixed condition at the pile toe. Due to the depth of the overburden at the site, it is anticipated that the pile sections at both abutments will not achieve a fixed condition assuming a pile penetration to the top of bedrock. Short piles supporting integral abutments should be designed in accordance with AASHTO LRFD criteria and checked for pile tip movement using L-Pile® software or as
Charles River Bridge Over Charles River Fryeburg, Maine PIN 15095.00
14
described in the design example found in Appendix B of Technical Report ME-01-7, June 2005, “Behavior of Pile Supported Integral Abutments at Bridge Sites with Shallow Bedrock - Phase 1” and Chapter 5 of that report. When the lateral and axial pile load groups are known, this data should be provided to the geotechnical engineer. A more refined analysis of pile fixity can then be performed using L-Pile® software.
7.4 Buckling and Combined Axial and Flexure Pile group design shall consider loading effects due to combined axial and flexural loading, as outlined in LRFD Article 6.15. For a pile group composed of only vertical piles which is subjected to lateral loads, the pile structural analysis shall include consideration of soil-structure interaction effects as specified in LRFD Article 6.9. The recommended design approach considers the non-linear response of soil with lateral displacement. Soil-structure interaction considering the non-linear response of soil can be modeled using L-Pile® computer software. The factored structural resistances for pile sections in combined axial compression and flexure are not provided in this report as these analyses are considered part of the structural design and the responsibility of the structural engineer.
7.5 Bearing Resistance MaineDOT policy requires that spread footing on soil at stream crossings be founded at a depth of at least 2 feet below the scour depth determined for the check flood for scour and that spread footings supported on soil within a stream channel should be located a minimum of 6 feet below the thalweg of the waterway. Therefore, if project abutments are supported on spread footings, it is recommended that the Abutment No. 2 footing be founded directly on bedrock or a seal constructed on bedrock. If the designer determines that the Abutment No. 1 spread footing on soil cannot withstand the consequences of change in foundation conditions at the strength limit state resulting from scour due to the design flood event, or at the extreme limit state resulting from scour due to the check flood event, then the Abutment No. 1 foundation should be founded on bedrock. The design of spread footing supported abutments and wingwalls at the strength limit state shall consider nominal bearing resistance, eccentricity, lateral sliding and structural failure. Strength limit state design shall also consider foundation resistance after scour due to the design flood. Applicable permanent and transient loads are specified in LRFD Articles 3.4.1 and 11.5.5. In no instance shall the factored bearing stress exceed the nominal resistance of the footing concrete, which is taken as 0.3f’c. No footing shall be less than 2 feet wide regardless of the applied bearing pressure or bearing material. Any organic material encountered shall be removed to the full depth and replaced with compacted Granular Borrow, MaineDOT 703.19.
Charles River Bridge Over Charles River Fryeburg, Maine PIN 15095.00
15
Spread Footings on Native Soil - Bearing resistance for any spread footing founded on the native soils shall be investigated at the strength limit state using factored loads and a factored bearing resistance of 14 ksf. The bearing resistance factor, φb, for spread footings on soil is 0.45 based on bearing resistance evaluation using semi-empirical methods. The applied stress distribution may be assumed to be a uniform distribution over the effective base as shown in LRFD Figure 11.6.3.2-1. The eccentricity of loading at the strength limit state evaluated based on factored loads shall not exceed one-fourth of the corresponding footing dimension, B or L, for footings on soil. A factored bearing resistance of 6 ksf may be used when analyzing the service limit state and for preliminary sizing of footings assuming a resistance factor of 1.0. See Appendix C - Calculations for supporting documentation. Extreme limit state design checks for abutments supported on spread footings on soil shall include bearing resistance, eccentricity, sliding and overall stability. The bearing resistance for spread footings shall be checked for the extreme limit state with a resistance factor of 1.0. Furthermore, footings shall be designed so that the nominal bearing resistance after the check scour event provides adequate resistance to support the extreme limit state loads with a resistance factor of 1.0. Sliding computations for resistance to lateral loads shall assume a maximum allowable frictional coefficient of 0.45 at the soil-concrete interface. A sliding resistance factor of φτ=0.8 shall be applied to the nominal sliding resistance of walls founded on spread footings on sand. Spread Footings on Bedrock – Any spread footing founded on bedrock shall be proportioned to provide stability against bearing capacity failure. Applicable permanent and transient loads are specified in LRFD Article 11.5.5. The stress distribution may be assumed to be a triangular or trapezoidal distribution over an effective base as shown in LRFD Figure 11.6.3.2-2. Bearing resistance for any structure founded on bedrock shall be investigated at the strength limit state using factored loads and a factored bearing resistance of 17 ksf. The bearing resistance factor, φb, for spread footings on bedrock is 0.45. A factored bearing resistance of 20 ksf may be used when analyzing the service limit state for preliminary footing sizing and to control settlements assuming a resistance factor of 1.0. See Appendix C - Calculations for supporting documentation. Sliding computations for resistance to lateral loads shall assume a maximum allowable frictional coefficient of 0.70 at the concrete-bedrock interface. A sliding resistance factor of φτ=0.9 shall be applied to the nominal sliding resistance of spread footings on bedrock.
Charles River Bridge Over Charles River Fryeburg, Maine PIN 15095.00
16
7.6 Scour and Riprap If using integral abutments at the site, pile lengths will be short and, therefore, scour protection will be critical. For scour protection, the integral abutments should be located away from the channel. Since the proposed bridge design will rely on the riprap slopes to provide scour protection for the integral abutment piles, slope construction and riprap placement are of critical importance. The consequences of changes in foundation conditions resulting from the design flood for scour shall be considered at the strength and service limit states. The consequences of changes in foundation conditions resulting from the check flood for scour shall be considered at the extreme limit state. These changes in foundation conditions shall be investigated at the abutments and wingwalls. For scour protection, any footings which are constructed on granular deposits, should be embedded a minimum of 2 feet below the scour depth resulting from the check flood and armored with 3 feet of riprap. Refer to MaineDOT BDG Section 2.3.11 for information regarding scour design. Riprap conforming to Special Provisions 610 and 703 shall be placed at the toes of abutments and wingwalls. Special Provisions 610 and 703 are provided in Appendix D – Special Provisions found at the end of this report. Riprap shall be 3 feet thick. In front of the wingwalls, the bottom of the riprap section shall be constructed 6.5 feet above the bottom of the structures for frost protection. The riprap shall extend 1.5 feet horizontally in front of the wall before sloping at a maximum 1.75H:1V slope to the existing ground surface. The toe of the riprap section shall be constructed 1 foot below the streambed elevation. The riprap section shall be underlain by a 1 foot thick layer of bedding material conforming to item number 703.19 of the Standard Specification and Class “A” Erosion Control Geotextile per Standard Detail 610 (02-04).
7.7 Settlement The grade of the existing bridge approaches will be raised approximately 1.7 feet behind both abutments in the construction of the proposed bridge. Post-construction settlements are anticipated to be less than 1.0 inch. Supporting calculations are included in Appendix C- Calculations found at the end of this report. Any settlement of the bridge abutments will be due to the elastic compression of the piling and will be negligible.
7.8 Frost Protection Any foundation placed on granular subgrade soils should be designed with an appropriate embedment for frost protection. According to the MaineDOT frost depth maps for the State of Maine (MaineDOT BDG Figure 5-1) the site has a design-freezing index of approximately 1400 F-degree days. This correlates to a frost depth of 6.5 feet. Therefore, any foundations placed on granular soils should be founded a minimum of 6.5 feet below finished exterior grade for frost protection. This minimum embedment depth applies only to foundations placed on subgrade soils.
Charles River Bridge Over Charles River Fryeburg, Maine PIN 15095.00
17
Integral abutments shall be embedded a minimum of 4.0 feet for frost protection per Figure 5-2 of the MaineDOT BDG. See Appendix C- Calculations at the end of this report for supporting documentation.
7.9 Seismic Design Considerations In conformance with LRFD Article 4.7.4.2 seismic analysis is not required for single-span bridges regardless of seismic zone. According to Figure 2-2 of the Maine DOT BDG, the Charles River Bridge is not on the National Highway System (NHS). The bridge is not classified as a major structure since the construction costs will not exceed $10 million. These criteria eliminate the MaineDOT BDG requirement to design the foundations for seismic earth loads. However, superstructure connections and minimum support length requirements shall be satisfied per LRFD Articles 3.10.9 and 4.7.4.4, respectively. The following parameters were determined for the site from the USGS Seismic Parameters CD provided with the LRFD manual and LRFD Articles 3.10.3.1 and 3.10.6:
• Peak Ground Acceleration coefficient (PGA) = 0.102g • Site Class D (site soils with an average N-value between 5 and 50 bpf or an undrained
shear strength between 1000 and 2000 psf) • Acceleration coefficient (As) = 0.163 • Design spectral acceleration coefficient at 0.2-second period (SDS) = 0.317g • Design spectral acceleration coefficient at 1.0-second period (SD1) = 0.119g • Seismic Zone 1 (based on SD1 less than or equal to 0.15g)
See Appendix C- Calculations at the end of this report for supporting documentation.
7.10 Construction Considerations A layer of wood was encountered within the existing abutment backfill behind abutment No. 2. There is potential for this wood and possible remaining granite blocks from a previous structure to impact the pile driving and/or installation operations. Obstructions may be cleared by conventional excavation methods, pre-augering, pre-drilling, or down-hole hammers. Care should be taken to drive piles within allowable tolerances. Alternative methods to clear obstructions may be used as approved by the Resident. Since the proposed bridge design will rely on the riprap slopes to provide scour protection for the integral abutment piles, slope construction and riprap placement are of critical importance. The existing riprap slopes shall be reconstructed in their entirety. Care should be taken in construction of the riprap slopes to assure that they are constructed in accordance with MaineDOT Special Provisions 610 and 703 and the plans.
Charles River Bridge Over Charles River Fryeburg, Maine PIN 15095.00
18
8.0 CLOSURE This report has been prepared for the use of the MaineDOT Bridge Program for specific application to the proposed replacement of the Charles River Bridge in Fryeburg in accordance with generally accepted geotechnical and foundation engineering practices. No other intended use is implied. In the event that any changes in the nature, design, or location of the proposed project are planned, this report should be reviewed by a geotechnical engineer to assess the appropriateness of the conclusions and recommendations and to modify the recommendations as appropriate to reflect the changes in design. Further, the analyses and recommendations are based in part upon limited soil explorations at discrete locations completed at the site. If variations from the conditions encountered during the investigation appear evident during construction, it may also become necessary to re-evaluate the recommendations made in this report. We also recommend that we be provided the opportunity for a general review of the final design and specifications in order that the earthwork and foundation recommendations may be properly interpreted and implemented in the design.
Sheets
terry.white
Text Box
SHEET 1
terry.white
Oval
terry.white
Text Box
Project Location
terry.white
Text Box
Charles River Bridge #2151 carries Harbor Road over Charles River, Fryeburg, Maine PIN. 15095.00
Appendix A
Boring Logs
TERMS DESCRIBINGUNIFIED SOIL CLASSIFICATION SYSTEM DENSITY/CONSISTENCY
MAJOR DIVISIONSGROUP
SYMBOLS TYPICAL NAMESCoarse-grained soils (more than half of material is larger than No. 200
COARSE- CLEAN GW Well-graded gravels, gravel- sieve): Includes (1) clean gravels; (2) silty or clayey gravels; and (3) silty,GRAINED GRAVELS GRAVELS sand mixtures, little or no fines clayey or gravelly sands. Consistency is rated according to standard
SOILS penetration resistance.(little or no GP Poorly-graded gravels, gravel Modified Burmister System
fines) sand mixtures, little or no fines Descriptive Term Portion of Total trace 0% - 10%little 11% - 20%
(Appreciable GC Clayey gravels, gravel-sand-clay Density of Standard Penetration Resistance amount of mixtures. Cohesionless Soils N-Value (blows per foot)
fines) Very loose 0 - 4Loose 5 - 10
CLEAN SW Well-graded sands, gravelly Medium Dense 11 - 30SANDS SANDS sands, little or no fines Dense 31 - 50
Very Dense > 50(little or no SP Poorly-graded sands, gravelly
fines) sand, little or no fines.Fine-grained soils (more than half of material is smaller than No. 200sieve): Includes (1) inorganic and organic silts and clays; (2) gravelly, sandy
SANDS SM Silty sands, sand-silt mixtures or silty clays; and (3) clayey silts. Consistency is rated according to shearWITH strength as indicated.FINES Approximate
(Appreciable SC Clayey sands, sand-clay Undrained amount of mixtures. Consistency of SPT N-Value Shear Field
ML Inorganic silts and very fine WOP, <2sands, rock flour, silty or clayey Soft 2 - 4 250 - 500 Thumb easily penetratesfine sands, or clayey silts with Medium Stiff 5 - 8 500 - 1000 Thumb penetrates with
SILTS AND CLAYS slight plasticity. moderate effortStiff 9 - 15 1000 - 2000 Indented by thumb with
FINE- CL Inorganic clays of low to medium great effortGRAINED plasticity, gravelly clays, sandy Very Stiff 16 - 30 2000 - 4000 Indented by thumbnai
SOILS clays, silty clays, lean clays. Hard >30 over 4000 Indented by thumbnail(liquid limit less than 50) with difficulty
OL Organic silts and organic silty Rock Quality Designation (RQD): clays of low plasticity. RQD = sum of the lengths of intact pieces of core* > 100 mm
length of core advance *Minimum NQ rock core (1.88 in. OD of core)
MH Inorganic silts, micaceous or diatomaceous fine sandy or Correlation of RQD to Rock Mass Quality
SILTS AND CLAYS silty soils, elastic silts. Rock Mass Quality RQDVery Poor <25%
CH Inorganic clays of high Poor 26% - 50%plasticity, fat clays. Fair 51% - 75%
Good 76% - 90%(liquid limit greater than 50) OH Organic clays of medium to Excellent 91% - 100%
high plasticity, organic silts Desired Rock Observations: (in this order) Color (Munsell color chart) Texture (aphanitic, fine-grained, etc.)
Hammer Efficiency Factor: 0.84 Hammer Type: Automatic Hydraulic Rope & Cathead Definitions: R = Rock Core Sample Su = Insitu Field Vane Shear Strength (psf) Su(lab) = Lab Vane Shear Strength (psf)D = Split Spoon Sample SSA = Solid Stem Auger Tv = Pocket Torvane Shear Strength (psf) WC = water content, percentMD = Unsuccessful Split Spoon Sample attempt HSA = Hollow Stem Auger qp = Unconfined Compressive Strength (ksf) LL = Liquid LimitU = Thin Wall Tube Sample RC = Roller Cone N-uncorrected = Raw field SPT N-value PL = Plastic LimitMU = Unsuccessful Thin Wall Tube Sample attempt WOH = weight of 140lb. hammer Hammer Efficiency Factor = Annual Calibration Value PI = Plasticity IndexV = Insitu Vane Shear Test, PP = Pocket Penetrometer WOR/C = weight of rods or casing N60 = SPT N-uncorrected corrected for hammer efficiency G = Grain Size AnalysisMV = Unsuccessful Insitu Vane Shear Test attempt WO1P = Weight of one person N60 = (Hammer Efficiency Factor/60%)*N-uncorrected C = Consolidation Test
Remarks:
300-400 lbs. down pressure on Core Barrel.
Stratification lines represent approximate boundaries between soil types; transitions may be gradual.
* Water level readings have been made at times and under conditions stated. Groundwater fluctuations may occur due to conditions otherthan those present at the time measurements were made. Boring No.: BB-FCR-101
Dep
th (f
t.)
Sam
ple
No.
Sample Information
Pen
./Rec
. (in
.)
Sam
ple
Dep
th(ft
.)
Blo
ws
(/6 in
.)S
hear
Stre
ngth
(psf
)or
RQ
D (%
)
N-u
ncor
rect
ed
N60
Cas
ing
Blo
ws
Ele
vatio
n(ft
.)
Gra
phic
Log
Visual Description and Remarks
LaboratoryTesting Results/
AASHTO and
Unified Class.
Page 1 of 2
25
30
35
40
45
50
6D
R1
R2
24/14
60/60
60/60
25.00 - 27.00
27.00 - 32.00
32.00 - 37.00
9/8/11/24
RQD = 55%
RQD = 38%
19 27 65
97
100NQ-2
359.00
349.00
Grey-brown, wet, medium dense, fine to coarse SAND, little silt, tracegravel.
27.00Top of Bedrock at Elev. 359.0'.Bedrock: White and brown, coarse grained, GRANITE, fractured. RockMass Quality = Fair.R1:Core Times (min:sec)27.0-28.0' (1:40)28.0-29.0' (2:11)29.0-30.0' (2:12)30.0-31.0' (2:12)31.0-32.0' (2:12) 100% Recovery
Bedrock: White and brown, coarse grained, GRANITE, fractured. RockMass Quality = Poor.R2:Core Times (min:sec)32.0-33.0' (2:10)33.0-34.0' (2:10)34.0-35.0' (2:15)35.0-36.0' (2:11)36.0-37.0' (2:15) 100% Recovery
37.00Bottom of Exploration at 37.00 feet below ground surface.
G#212256A-1-b, SMWC=13.4%
Maine Department of Transportation Project: Charles River Bridge #2151 carries HarborRoad over Charles River
Hammer Efficiency Factor: 0.84 Hammer Type: Automatic Hydraulic Rope & Cathead Definitions: R = Rock Core Sample Su = Insitu Field Vane Shear Strength (psf) Su(lab) = Lab Vane Shear Strength (psf)D = Split Spoon Sample SSA = Solid Stem Auger Tv = Pocket Torvane Shear Strength (psf) WC = water content, percentMD = Unsuccessful Split Spoon Sample attempt HSA = Hollow Stem Auger qp = Unconfined Compressive Strength (ksf) LL = Liquid LimitU = Thin Wall Tube Sample RC = Roller Cone N-uncorrected = Raw field SPT N-value PL = Plastic LimitMU = Unsuccessful Thin Wall Tube Sample attempt WOH = weight of 140lb. hammer Hammer Efficiency Factor = Annual Calibration Value PI = Plasticity IndexV = Insitu Vane Shear Test, PP = Pocket Penetrometer WOR/C = weight of rods or casing N60 = SPT N-uncorrected corrected for hammer efficiency G = Grain Size AnalysisMV = Unsuccessful Insitu Vane Shear Test attempt WO1P = Weight of one person N60 = (Hammer Efficiency Factor/60%)*N-uncorrected C = Consolidation Test
Remarks:
300-400 lbs. down pressure on Core Barrel.
Stratification lines represent approximate boundaries between soil types; transitions may be gradual.
* Water level readings have been made at times and under conditions stated. Groundwater fluctuations may occur due to conditions otherthan those present at the time measurements were made. Boring No.: BB-FCR-101
Dep
th (f
t.)
Sam
ple
No.
Sample Information
Pen
./Rec
. (in
.)
Sam
ple
Dep
th(ft
.)
Blo
ws
(/6 in
.)S
hear
Stre
ngth
(psf
)or
RQ
D (%
)
N-u
ncor
rect
ed
N60
Cas
ing
Blo
ws
Ele
vatio
n(ft
.)
Gra
phic
Log
Visual Description and Remarks
LaboratoryTesting Results/
AASHTO and
Unified Class.
Page 2 of 2
0
5
10
15
20
25
1D
2D
R1
R2
24/4
21.6/18
60/51
60/60
0.00 - 2.00
5.00 - 6.80
6.80 - 11.80
11.80 - 16.80
WOR/WOR/6/10
4/4/11/50
RQD = 60%
RQD = 45%
6
15
8
21
11
38
32
32
43
10
NQ-2360.20
350.20
Brown, saturated, loose, fine to coarse SAND, little silt, little gravel.
Brown, wet, medium dense, fine to coarse SAND, some silt, little gravel.
6.80Top of Bedrock at Elev. 360.2'.Bedrock: White, grey and black, coarse grained, GRANITE, with micaand pyrite, friable. Rock Mass Quality = Fair.R1:Core Times (min:sec)6.8-7.8' (1:10)7.8-8.8' (1:30)8.8-9.8' (1:30)9.8-10.8' (2:15)10.8-11.8' (1:40) 85% RecoveryNo water returnBedrock: White, grey and black, coarse grained, GRANITE, with micaand pyrite, less friable with depth. Rock Mass Quality = Poor.R2:Core Times (min:sec)11.8-12.8' (2:00)12.8-13.8' (2:00)13.8-14.8' (3:04)14.8-15.8' (2:30)15.8-16.8' (3:20) 100% RecoveryNo water return
16.80Bottom of Exploration at 16.80 feet below ground surface.
G#212257A-1-b, SMWC=30.1%
G#212258A-2-4, SMWC=13.1%
Maine Department of Transportation Project: Charles River Bridge #2151 carries HarborRoad over Charles River
Hammer Efficiency Factor: 0.84 Hammer Type: Automatic Hydraulic Rope & Cathead Definitions: R = Rock Core Sample Su = Insitu Field Vane Shear Strength (psf) Su(lab) = Lab Vane Shear Strength (psf)D = Split Spoon Sample SSA = Solid Stem Auger Tv = Pocket Torvane Shear Strength (psf) WC = water content, percentMD = Unsuccessful Split Spoon Sample attempt HSA = Hollow Stem Auger qp = Unconfined Compressive Strength (ksf) LL = Liquid LimitU = Thin Wall Tube Sample RC = Roller Cone N-uncorrected = Raw field SPT N-value PL = Plastic LimitMU = Unsuccessful Thin Wall Tube Sample attempt WOH = weight of 140lb. hammer Hammer Efficiency Factor = Annual Calibration Value PI = Plasticity IndexV = Insitu Vane Shear Test, PP = Pocket Penetrometer WOR/C = weight of rods or casing N60 = SPT N-uncorrected corrected for hammer efficiency G = Grain Size AnalysisMV = Unsuccessful Insitu Vane Shear Test attempt WO1P = Weight of one person N60 = (Hammer Efficiency Factor/60%)*N-uncorrected C = Consolidation Test
Remarks:
12" Concrete Deck.19.0' from Deck to Streambed.200-300 lbs. down pressure on Core Barrel.
Stratification lines represent approximate boundaries between soil types; transitions may be gradual.
* Water level readings have been made at times and under conditions stated. Groundwater fluctuations may occur due to conditions otherthan those present at the time measurements were made. Boring No.: BB-FCR-102
Dep
th (f
t.)
Sam
ple
No.
Sample Information
Pen
./Rec
. (in
.)
Sam
ple
Dep
th(ft
.)
Blo
ws
(/6 in
.)S
hear
Stre
ngth
(psf
)or
RQ
D (%
)
N-u
ncor
rect
ed
N60
Cas
ing
Blo
ws
Ele
vatio
n(ft
.)
Gra
phic
Log
Visual Description and Remarks
LaboratoryTesting Results/
AASHTO and
Unified Class.
Page 1 of 1
0
5
10
15
20
25
1D
2D
3D
4D
5D
R1
24/17
24/18
24/10
24/18
3.6/3.6
63.6/57
1.00 - 3.00
5.00 - 7.00
10.00 - 12.00
15.00 - 17.00
20.00 - 20.30
21.70 - 27.00
6/6/3/3
2/2/2/3
WOH/13/22/8
5/15/14/12
50(3.6")
RQD = 68%
9
4
35
29
---
13
6
49
41
SSA
24
23
27
33
83
a50RC
NQ-2
385.50
376.00375.50375.00
371.50
368.50
365.70
Pavement0.50
Brown, damp, medium dense, fine to coarse SAND, little silt, tracegravel, (Fill).
14.50Grey-brown, wet, dense, fine to coarse SAND, some gravel, some silt.
17.50
a50 blows for 0.3'.Brown, wet, very dense, fine to coarse SAND, little silt, trace gravel.
20.30Top of Bedrock at Elev. 365.7'.Roller Coned ahead from 20.3-21.7' bgs.Bedrock: Grey and white, coarse grained, GRANITE with mica. RockMass Quality = Fair.R1:Core Times (min:sec)21.7-22.7' (1:10)22.7-23.7' (1:30)23.7-24.7' (1:30)
G#212259A-2-4, SMWC=9.4%
G#212260A-4, SM
WC=29.8%
G#212261A-4, ML
WC=34.1%
G#212262A-1-b, SMWC=10.0%
G#212263A-1-b, SMWC=16.4%
Maine Department of Transportation Project: Charles River Bridge #2151 carries HarborRoad over Charles River
Hammer Efficiency Factor: 0.84 Hammer Type: Automatic Hydraulic Rope & Cathead Definitions: R = Rock Core Sample Su = Insitu Field Vane Shear Strength (psf) Su(lab) = Lab Vane Shear Strength (psf)D = Split Spoon Sample SSA = Solid Stem Auger Tv = Pocket Torvane Shear Strength (psf) WC = water content, percentMD = Unsuccessful Split Spoon Sample attempt HSA = Hollow Stem Auger qp = Unconfined Compressive Strength (ksf) LL = Liquid LimitU = Thin Wall Tube Sample RC = Roller Cone N-uncorrected = Raw field SPT N-value PL = Plastic LimitMU = Unsuccessful Thin Wall Tube Sample attempt WOH = weight of 140lb. hammer Hammer Efficiency Factor = Annual Calibration Value PI = Plasticity IndexV = Insitu Vane Shear Test, PP = Pocket Penetrometer WOR/C = weight of rods or casing N60 = SPT N-uncorrected corrected for hammer efficiency G = Grain Size AnalysisMV = Unsuccessful Insitu Vane Shear Test attempt WO1P = Weight of one person N60 = (Hammer Efficiency Factor/60%)*N-uncorrected C = Consolidation Test
Remarks:
300-400 lbs. down pressure on Core Barrel.
Stratification lines represent approximate boundaries between soil types; transitions may be gradual.
* Water level readings have been made at times and under conditions stated. Groundwater fluctuations may occur due to conditions otherthan those present at the time measurements were made. Boring No.: BB-FCR-103
Dep
th (f
t.)
Sam
ple
No.
Sample Information
Pen
./Rec
. (in
.)
Sam
ple
Dep
th(ft
.)
Blo
ws
(/6 in
.)S
hear
Stre
ngth
(psf
)or
RQ
D (%
)
N-u
ncor
rect
ed
N60
Cas
ing
Blo
ws
Ele
vatio
n(ft
.)
Gra
phic
Log
Visual Description and Remarks
LaboratoryTesting Results/
AASHTO and
Unified Class.
Page 1 of 2
25
30
35
40
45
50
R2 60/60 27.00 - 32.00 RQD = 72%
354.00
24.7-25.7' (2:15)25.7-26.6' (1:40)26.6-27.0' (0:20) Void-seam89% RecoveryBedrock: Grey and white, coarse grained, GRANITE with mica. RockMass Quality = Fair.R2:Core Times (min:sec)27.0-28.0' (1:37)28.0-29.0' (2;00)29.0-30.0' (1:35)30.0-31.0' (1:33)31.0-32.0' (2:00) 100% RecoveryNo water return
32.00Bottom of Exploration at 32.00 feet below ground surface.
Maine Department of Transportation Project: Charles River Bridge #2151 carries HarborRoad over Charles River
Hammer Efficiency Factor: 0.84 Hammer Type: Automatic Hydraulic Rope & Cathead Definitions: R = Rock Core Sample Su = Insitu Field Vane Shear Strength (psf) Su(lab) = Lab Vane Shear Strength (psf)D = Split Spoon Sample SSA = Solid Stem Auger Tv = Pocket Torvane Shear Strength (psf) WC = water content, percentMD = Unsuccessful Split Spoon Sample attempt HSA = Hollow Stem Auger qp = Unconfined Compressive Strength (ksf) LL = Liquid LimitU = Thin Wall Tube Sample RC = Roller Cone N-uncorrected = Raw field SPT N-value PL = Plastic LimitMU = Unsuccessful Thin Wall Tube Sample attempt WOH = weight of 140lb. hammer Hammer Efficiency Factor = Annual Calibration Value PI = Plasticity IndexV = Insitu Vane Shear Test, PP = Pocket Penetrometer WOR/C = weight of rods or casing N60 = SPT N-uncorrected corrected for hammer efficiency G = Grain Size AnalysisMV = Unsuccessful Insitu Vane Shear Test attempt WO1P = Weight of one person N60 = (Hammer Efficiency Factor/60%)*N-uncorrected C = Consolidation Test
Remarks:
300-400 lbs. down pressure on Core Barrel.
Stratification lines represent approximate boundaries between soil types; transitions may be gradual.
* Water level readings have been made at times and under conditions stated. Groundwater fluctuations may occur due to conditions otherthan those present at the time measurements were made. Boring No.: BB-FCR-103
Dep
th (f
t.)
Sam
ple
No.
Sample Information
Pen
./Rec
. (in
.)
Sam
ple
Dep
th(ft
.)
Blo
ws
(/6 in
.)S
hear
Stre
ngth
(psf
)or
RQ
D (%
)
N-u
ncor
rect
ed
N60
Cas
ing
Blo
ws
Ele
vatio
n(ft
.)
Gra
phic
Log
Visual Description and Remarks
LaboratoryTesting Results/
AASHTO and
Unified Class.
Page 2 of 2
Appendix B
Laboratory Data
Station Offset Depth Reference G.S.D.C. W.C. L.L. P.I.
(Feet) (Feet) (Feet) Number Sheet % Unified AASHTO Frost
19+50.5 2.1 Rt. 5.0-7.0 212251 1 7.3 SM A-2-4 II
19+50.5 2.1 Rt. 10.0-12.0 212252 1 33.7 ML A-4 IV
19+50.5 2.1 Rt. 15.0-17.0 212253 1 40.6 CL A-7-6 IV
19+50.5 2.1 Rt. 20.0-20.5 212254 1 34.3 CL-ML A-4 IV
19+50.5 2.1 Rt. 20.5-22.0 212255 1 14.0 SM A-1-b II
19+50.5 2.1 Rt. 25.0-27.0 212256 1 13.4 SM A-1-b II
20+03.9 9.5 Lt. 0.0-2.0 212257 2 30.1 SM A-1-b II
20+03.9 9.5 Lt. 5.0-6.8 212258 2 13.1 SM A-2-4 II
20+50.5 8.6 Lt. 1.0-3.0 212259 3 9.4 SM A-2-4 II
20+50.5 8.6 Lt. 5.0-7.0 212260 3 29.8 SM A-4 III
20+50.5 8.6 Lt. 10.0-12.0 212261 3 34.1 ML A-4 IV
20+50.5 8.6 Lt. 15.0-17.0 212262 3 10.0 SM A-1-b II
20+50.5 8.6 Lt. 20.0-20.3 212263 3 16.4 SM A-1-b II
Classification of these soil samples is in accordance with AASHTO Classification System M-145-40. This classification
is followed by the "Frost Susceptibility Rating" from zero (non-frost susceptible) to Class IV (highly frost susceptible).
The "Frost Susceptibility Rating" is based upon the MaineDOT and Corps of Engineers Classification Systems.
GSDC = Grain Size Distribution Curve as determined by AASHTO T 88-93 (1996) and/or ASTM D 422-63 (Reapproved 1998)
WC = water content as determined by AASHTO T 265-93 and/or ASTM D 2216-98
LL = Liquid limit as determined by AASHTO T 89-96 and/or ASTM D 4318-98
PI = Plasticity Index as determined by AASHTO 90-96 and/or ASTM D4318-98
BB-FCR-102, 1D
Classification
State of Maine - Department of Transportation
Laboratory Testing Summary Sheet
Town(s): FryeburgBoring & Sample
BB-FCR-101, 4D
BB-FCR-101, 5D
BB-FCR-101, 5D/A
BB-FCR-101, 6D
Identification Number
BB-FCR-101, 2D
Project Number: 15095.00
BB-FCR-101, 3D
BB-FCR-102, 2D
BB-FCR-103, 1D
BB-FCR-103, 2D
BB-FCR-103, 3D
BB-FCR-103, 4D
BB-FCR-103, 5D
1 of 1
3"
2"1-1/2"
1"
3/4"
1/2"
3/8"
1/4"
#4
#8
#10
#16
#20
#40
#60
#100
#200
0.05
0.03
0.010
0.005
0.001
76.2
50.8
38.1
25.4
19.05
12.7
9.53
6.35
4.75
2.36
2.00
1.18
0.85
0.426
0.25
0.15
0.075
0.05
0.03
0.005
GRAVEL
SAND
SILT
SIEVE ANALYSIS
US Standard Sieve Numbers
HYDROMETER ANALYSIS
Grain Diameter, mm
State of Maine Department of Transportation
GRAIN
SIZE DISTRIBUTIO
N CURVE
100
10
10.1
0.01
0.001
Grain Diameter, mm
0
10
20
30
40
50
60
70
80
90
100
Percent Finer by Weight
100
90
80
70
60
50
40
30
20
10
0
Percent Retained by Weight
CLAY
SHEET NO.
UNIFIED CLASSIFICATION
SAND, some silt, little gravel.
SILT, some clay, little sand, trace gravel.
Clayey SILT, trace sand.
Sandy SILT.
7.3
14.0
SAND, little gravel, little silt.
33.7
40.6
34.3
BB-FCR-101/2D
BB-FCR-101/5DA
BB-FCR-101/3D
BB-FCR-101/4D
BB-FCR-101/5D
13.4
SAND, little silt, trace gravel.
BB-FCR-101/6D
5.0-7.0
20.5-22.0
10.0-12.0
15.0-17.0
20.0-20.5
25.0-27.0
Depth, ft
Boring/Sample No.
Description
W, %
LL
PL
PI
� ��� � ��� � ��� � ��� � ��� � ���
SHEET 1
Fryeburg
015095.00
WHITE, TERRY A 8/19/2009
PIN
Town
Reported by/Date
2.1 RT
2.1 RT
2.1 RT
2.1 RT
2.1 RT
2.1 RT
Offset, ft
19+50.5
19+50.5
19+50.5
19+50.5
19+50.5
19+50.5
Station
3"
2"1-1/2"
1"
3/4"
1/2"
3/8"
1/4"
#4
#8
#10
#16
#20
#40
#60
#100
#200
0.05
0.03
0.010
0.005
0.001
76.2
50.8
38.1
25.4
19.05
12.7
9.53
6.35
4.75
2.36
2.00
1.18
0.85
0.426
0.25
0.15
0.075
0.05
0.03
0.005
GRAVEL
SAND
SILT
SIEVE ANALYSIS
US Standard Sieve Numbers
HYDROMETER ANALYSIS
Grain Diameter, mm
State of Maine Department of Transportation
GRAIN
SIZE DISTRIBUTIO
N CURVE
100
10
10.1
0.01
0.001
Grain Diameter, mm
0
10
20
30
40
50
60
70
80
90
100
Percent Finer by Weight
100
90
80
70
60
50
40
30
20
10
0
Percent Retained by Weight
CLAY
SHEET NO.
UNIFIED CLASSIFICATION
SAND, little silt, little gravel.
SAND, some silt, little gravel.
30.1
13.1
BB-FCR-102/1D
BB-FCR-102/2D
0.0-2.0
5.0-6.8
Depth, ft
Boring/Sample No.
Description
W, %
LL
PL
PI
� ��� � ��� � ��� � ��� � ��� � ���
SHEET 2
Fryeburg
015095.00
WHITE, TERRY A 8/19/2009
PIN
Town
Reported by/Date
9.5 LT
9.5 LT
Offset, ft
20+03.9
20+03.9
Station
3"
2"1-1/2"
1"
3/4"
1/2"
3/8"
1/4"
#4
#8
#10
#16
#20
#40
#60
#100
#200
0.05
0.03
0.010
0.005
0.001
76.2
50.8
38.1
25.4
19.05
12.7
9.53
6.35
4.75
2.36
2.00
1.18
0.85
0.426
0.25
0.15
0.075
0.05
0.03
0.005
GRAVEL
SAND
SILT
SIEVE ANALYSIS
US Standard Sieve Numbers
HYDROMETER ANALYSIS
Grain Diameter, mm
State of Maine Department of Transportation
GRAIN
SIZE DISTRIBUTIO
N CURVE
100
10
10.1
0.01
0.001
Grain Diameter, mm
0
10
20
30
40
50
60
70
80
90
100
Percent Finer by Weight
100
90
80
70
60
50
40
30
20
10
0
Percent Retained by Weight
CLAY
SHEET NO.
UNIFIED CLASSIFICATION
SAND, little silt, trace gravel.
SAND, some gravel, some silt.
Sandy SILT, trace gravel.
Silty SAND, trace gravel.
9.4
16.4
SAND, little silt, trace gravel.
29.8
34.1
10.0
BB-FCR-103/1D
BB-FCR-103/5D
BB-FCR-103/2D
BB-FCR-103/3D
BB-FCR-103/4D
1.0-3.0
20.0-20.3
5.0-7.0
10.0-12.0
15.0-17.0
Depth, ft
Boring/Sample No.
Description
W, %
LL
PL
PI
� ��� � ��� � ��� � ��� � ��� � ���
SHEET 3
Fryeburg
015095.00
WHITE, TERRY A 8/19/2009
PIN
Town
Reported by/Date
8.6 LT
8.6 LT
8.6 LT
8.6 LT
8.6 LT
Offset, ft
20+50.5
20+50.5
20+50.5
20+50.5
20+50.5
Station
Appendix C
Calculations
Charles River Bridge Fryeburg, MainePIN 15095.00
By: Kate MaguireSeptember 2009
Checked by: LK 9/09
Abutment Foundations: Integral driven H-pilesAxial Structural Resistance of H-piles Ref: AASHTO LRFD Bridge Design
Specifications 4th Edition 2007 with Interims through 2009
End bearing resistance of piles on bedrock - LRFD code specifies Canadian Geotech Method 1985(LRFD Table 10.5.5.2.3-1) Canadian Foundation Manual 4th Edition (2006) Section 18.6.3.3.
Average compressive strength of rock corefrom AASHTO Standard Spec for Highway Bridges 17 Ed.Table 4.4.8.1.2B pg 64
qu for granite compressive strength ranges from 2100 to 49000 psi
use σc 25000 psi⋅:=
Determine Ksp: From Canadian Foundation Manual 4th Edition (2006) Section 9.2
Spacing of discontinuities: c 48 in⋅:= Assumed based on rock core
Aperture of discontinuities: δ1
128in⋅:= joints are tight
Footing width, b: HP 12 x 53HP 14 x 73HP 14 x 89HP 14 x 117
b
12.045
14.585
14.695
14.885
⎛⎜⎜⎜⎜⎝
⎞⎟⎟⎟⎟⎠
in⋅=
Ksp
3cb
+
10 1 300δ
c⋅+⎛⎜
⎝⎞⎟⎠
0.5⋅
:=Ksp
0.6821
0.6143
0.6119
0.6078
⎛⎜⎜⎜⎜⎝
⎞⎟⎟⎟⎟⎠
= Ksp includes a factor of safety of 3
C-3
Charles River Bridge Fryeburg, MainePIN 15095.00
By: Kate MaguireSeptember 2009
Checked by: LK 9/09
Length of rock socket, Ls: Ls 0 in⋅:= Pile is end bearing on rock
Diameter of socket, Bs: Bs 1 ft⋅:=
depth factor, df: df 1 0.4Ls
Bs
⎛⎜⎝
⎞⎟⎠
+:= df 1= should be < or = 3 OK
qa σc Ksp⋅ df⋅:= qa
2455
2211
2203
2188
⎛⎜⎜⎜⎜⎝
⎞⎟⎟⎟⎟⎠
ksf⋅=
Nominal Geotechnical Tip Resistance, Rp:
Multiply by 3 to take out FS=3 on Ksp
HP 12 x 53HP 14 x 73HP 14 x 89HP 14 x 117
Rp 3qa As⋅( )→⎯⎯⎯
:= Rp
793
986
1198
1568
⎛⎜⎜⎜⎜⎝
⎞⎟⎟⎟⎟⎠
kip⋅=
STRENGTH LIMIT STATE:
Factored Geotechnical Resistance at Strength Limit State:
Resistance factor, end bearing on rock (Canadian Geotech. Society, 1985 method):
Nominal resistance of Single Pile in Axial Compression -Static Analysis Methods, φstat
ϕstat 0.45:= LRFD Table 10.5.5.2.3-1
Rf ϕstat Rp⋅:= HP 12 x 53HP 14 x 73HP 14 x 89HP 14 x 117
Strength Limit StateRf
357
444
539
706
⎛⎜⎜⎜⎜⎝
⎞⎟⎟⎟⎟⎠
kip⋅=
SERVICE/EXTREME LIMIT STATES:
Factored Geotechnical Resistance at the Service/Extreme Limit States:
Resistance Factors for Service and Extreme Limit States φ = 1.0 LRFD 10.5.5.1 and 10.5.8.3
ϕ 1.0:=
HP 12 x 53HP 14 x 73HP 14 x 89HP 14 x 117
Rfse ϕ Rp⋅:= Rfse
793
986
1198
1568
⎛⎜⎜⎜⎜⎝
⎞⎟⎟⎟⎟⎠
kip⋅= Service/ExtremeLimit States
C-4
Charles River Bridge Fryeburg, MainePIN 15095.00
By: Kate MaguireSeptember 2009
Checked by: LK 9/09
DRIVABILITY ANALYSIS Ref: LRFD Article 10.7.8
For steel piles in compression or tension σdr = 0.9 x φda x fy (eq. 10.7.8-1)
σdr 0.9 ϕda⋅ fy⋅:= σdr 45 ksi⋅= driving stresses in pile can not exceed 45 ksi
Compute Resistance that can be achieved in a drivability analysis:
The resistance that must be achieved in a drivability analysis will be the maximum applied pile axial load(must be less than the the factored geotechnical resistance from above as this governs) divided by the appropriate resistance factor for wave equation analysis and dynamic test which will berequired for construction.
There are 5 piles at each abutment. No reduction of Φdyn is necessary.
C-5
Charles River Bridge Fryeburg, MainePIN 15095.00
By: Kate MaguireSeptember 2009
Checked by: LK 9/09
Pile Size = 12 x 53
Assume Contractor will use a Delmag D19-42 hammer on highest fuel setting to install 12 x 53 piles
Limited to driving stress to 45 ksi
Strength Limit State:
Rdr_12x53_factored 357 kip⋅ ϕdyn⋅:=
Rdr_12x53_factored 232 kip⋅=
Service and Extreme Limit States: ϕ 1.0:=
Rdr_12x53_servext 357 kip⋅:=
C-6
Charles River Bridge Fryeburg, MainePIN 15095.00
By: Kate MaguireSeptember 2009
Checked by: LK 9/09
Pile Size = 14 x 73Assume Contractor will use a Delmag D19-42 hammer on third fuel setting to install 14 x 73 piles
Limit to driving stress to 45 ksi
Strength Limit State:
Rdr_14x73_factored 535 kip⋅ ϕdyn⋅:=
Rdr_14x73_factored 348 kip⋅=
Service and Extreme Limit States: ϕ 1.0:=
Rdr_14x73_servext 535 kip⋅:=
C-7
Charles River Bridge Fryeburg, MainePIN 15095.00
By: Kate MaguireSeptember 2009
Checked by: LK 9/09
Pile Size = 14 x 89
Assume Contractor will use a Delmag D19-42 hammer on third fuel setting to install 14 x 73 piles
Limit to driving stress to 45 ksi
Strength Limit State:
Rdr_14x89_factored 712 kip⋅ ϕdyn⋅:=
Rdr_14x89_factored 463 kip⋅=
Service and Extreme Limit States: ϕ 1.0:=
Rdr_14x89_servext 712 kip⋅:=
C-8
Charles River Bridge Fryeburg, MainePIN 15095.00
By: Kate MaguireSeptember 2009
Checked by: LK 9/09
Pile Size = 14 x 117Assume Contractor will use a Delmag D19-42 hammer on highest fuel setting to install 14 x 73 piles
Limit to blow count to 15 blows per inch
Strength Limit State:
Rdr_14x117_factored 903 kip⋅ ϕdyn⋅:=
Rdr_14x117_factored 587 kip⋅=
Service and Extreme Limit States: ϕ 1.0:=
Rdr_14x117_servext 903 kip⋅:=
C-9
Charles River Bridge Fryeburg, MainePIN 15095.00
By: Kate MaguireSeptember 2009
Checked by: LK 9/09
Earth Pressures: Soil Type 4 Properties from MaineDOT Bridge Design Guide (BDG)
unit weight: γtype4 125 pcf⋅:=
Internal Friction Angle: ϕtype4 32 deg⋅:=
Cohesion: csand 0 psf⋅:=
Active Earth Pressure - Rankine Theory from MaineDOT Bridge Design Guide Section 3.6.5.2 pg 3-7
β
β
Pa
Generally use Rankine for long heeled cantilever walls where the failure surface is un interrupted by the topof the wall system. The earth pressure is applied to a plane extending vertically up from the heel of the wallbase and the weight of the soil on the inside of the vertical plane is considered as part of the wall weight.The failure sliding surface is not restricted by the top of the wall or the backface of the wall.
For cantilever walls with horizontal backfill surface:
Ka_rankine tan 45 deg⋅ϕtype4
2−
⎛⎜⎝
⎞⎟⎠
2:= Ka_rankine 0.307=
For cantilever walls with sloped backfill surface:
β = Angel of fill slope to the horizontal
β 0 deg⋅:=
Ka_rankine_slopecos β( ) cos β( )2 cos ϕtype4( )2−−
cos β( ) cos β( )2 cos ϕtype4( )2−+:= Ka_rankine_slope 0.307=
Pa is oriented at an angle of β to the vertical plane.
C-10
Charles River Bridge Fryeburg, MainePIN 15095.00
By: Kate MaguireSeptember 2009
Checked by: LK 9/09
Passive Earth Pressure - Coulomb Theory from MaineDOT Bridge Design Guide Section 3.6.6 pg 3-8
Angle of back face of wall to the horizontal: α 90 deg⋅:=
Angle of internal soil friction: ϕ 32 deg⋅:=
Friction angle between fill and wall:From LRFD Table 3.11.5.3-1 range from 17 to 22 δ 20 deg⋅:=
Angle of backfill to the horizontal β 0 deg⋅:=
Kp_coulombsin α ϕ−( )2
sin α( )2 sin α δ+( )⋅ 1sin ϕ δ+( ) sin ϕ β+( )⋅sin α δ+( ) sin α β+( )⋅
−⎛⎜⎝
⎞⎟⎠
2⋅
:=
Kp_coulomb 6.89=
Passive Earth Pressure - Rankine Theory from Bowles 5th Edition Section 11-5 pg 602
Angle of backfill to the horizontal β 0 deg⋅:=
Angle of internal soil friction: ϕ 32 deg⋅:=
Kp_rankcos β( ) cos β( )2 cos ϕ( )2
−+
cos β( ) cos β( )2 cos ϕ( )2−−
:= Kp_rank 3.25=
Bowles does not recommend the use of the Rankine Method for Kp when β>0.
C-11
Charles River Bridge Fryeburg, MainePIN 15095.00
By: Kate MaguireSeptember 2009
Checked by: LK 9/09
Estimated Depth to Fixity for H-piles:Consider Pile sizes:
HP 12x53HP 14x73HP 14x 89HP 14x117
Method 1:
Use LRFD Article 10.7.3.13.4:Lfix = 1.8 (Ep*Iw/nh)0.2 for sands
Ep = Modulus of elasticity of pile (ksi): Esteel 29000 ksi⋅:=
Ip = weak axis Moment of Inertia (ft4):
use Y-Y axisIp
127
261
326
443
⎛⎜⎜⎜⎜⎝
⎞⎟⎟⎟⎟⎠
in4⋅:= Ip
0.006
0.013
0.016
0.021
⎛⎜⎜⎜⎜⎝
⎞⎟⎟⎟⎟⎠
ft4⋅=
nh = rate of increased= of soil modulus with depth for sands as specified in Table C10.4.6.3-2 (ksi/ft)
nh 0.556ksift
⋅:= for submerged, medium dense sand
HP 12 x 53HP 14 x 73HP 14 x 89HP 14 x 117
Lfix 1.8Esteel Ip⋅
nh
⎛⎜⎝
⎞⎟⎠
0.2:=
Lfix
6
7
7
7
⎛⎜⎜⎜⎜⎝
⎞⎟⎟⎟⎟⎠
ft⋅=
C-12
Charles River Bridge Fryeburg, MainePIN 15095.00
By: Kate MaguireSeptember 2009
Checked by: LK 9/09
Method 2:
Look at Fixity using MassHighway Bridge Manual (2005)
The length of pile from the base of the abutment to the point of fixity shall be the equvalentlength, Le, as defined as the theoretical equivalent length of free standing column withfixed/fixed support conditions translated though a distance δT.
The equivalent length of pile Le is determined from the regression equation:
Le = A(EI/d)+B(δT)+C (MassHighway 3.9.6.2) where: A, B, & C are equation coefficients from Table 3.1 Mass Highway Bridge Manual Section 3.9.6.2 E = Modulus of elasticity of pile material I = Moment of inertia d = pile section depth δΤ = pile head horizontal displacement
Look at four pile sizes:HP 12 x 53 HP 14 x 73 Note: All matrices in this orderHP 14 x 89HP 14 x 117
E = Steel modulus: E 29000 ksi⋅:=
Moment of Inertia: Use Y-Y axis for weak axis bendingIw
127
261
326
443
⎛⎜⎜⎜⎜⎝
⎞⎟⎟⎟⎟⎠
in4⋅:=
Depth of pile dp
299
346
351
361
⎛⎜⎜⎜⎜⎝
⎞⎟⎟⎟⎟⎠
mm⋅:= dp
11.77
13.62
13.82
14.21
⎛⎜⎜⎜⎜⎝
⎞⎟⎟⎟⎟⎠
in⋅=
Assume pile head displacement: δT 10 mm⋅:= δT 0.3937 in⋅=
From Mass Highway Bridge Manual Section 3.9.6.2 Table 3.1Assume soil condituions = Dry crushed stone over wet or dry sand
A 3.28 10 5−⋅
inin kip⋅
⋅:=
B 11.9inin
⋅:=
C 89.1 in⋅:=
C-13
Charles River Bridge Fryeburg, MainePIN 15095.00
By: Kate MaguireSeptember 2009
Checked by: LK 9/09
Le AE Iw⋅
dp
→⎯⎯⎛⎜⎜⎝
⎞⎟⎟⎠
⋅ B δT⋅+ C+:=
Le
Lf
Le
8.67
9.33
9.69
10.29
⎛⎜⎜⎜⎜⎝
⎞⎟⎟⎟⎟⎠
ft⋅=
From MassHighway Bridge Manual Section 3.9.6.2 Table 3.1 Fixity Ratio Lf/Le = 2.2Solve for Lf - length for fixity
Lf Le 2.2⋅:= Lf
19
21
21
23
⎛⎜⎜⎜⎜⎝
⎞⎟⎟⎟⎟⎠
ft⋅=
Piles will not achieve fixity based on Method 2.
C-14
Charles River Bridge Fryeburg, MainePIN 15095.00
By: Kate MaguireSeptember 2009
Checked by: LK 9/09
Bearing Resistance - Native Soils:Part 1 - Service Limit State
Nominal and factored Bearing Resistance - spread footing on fill soils
Presumptive Bearing Resistance for Service Limit State ONLY
Reference: AASHTO LRFD Bridge Design Specifications 4th EditionTable C10.6.2.6.1-1 Presumptive Bearing Resistances for Spread Footings at the Service Limit State Modified after US Department of Navy (1982)
Type of Bearing Material: Coarse to medium sand, with little gravel (SW, SP)
Based on corrected N-values ranging from 4 to 49 - Soils are loose to dense
Consistency In Place: Medium dense to dense
Bearing Resistance: Ordinary Range (ksf) 4 to 8
Recommended Value of Use: 6ksftsf g
ton
ft2⎛⎜⎝
⎞⎟⎠
⋅:=
Recommended Value: 6 ksf⋅ 3 tsf⋅=
Therefore: qnom 3 tsf⋅:=
Resistance factor at the service limit state = 1.0 (LRFD Article 10.5.5.1)
qfactored_bc 3 tsf⋅:= or qfactored_bc 6 ksf⋅=
Note: This bearing resistance is settlement limited (1 inch) and applies only a the service limit state.
Part 2 - Strength Limit State
Nominal and factored Bearing Resistance - spread footing on native soils
Reference: Foundation Engineering and Design by JE Bowles Fifth Edition
Assumptions:
1. Footings will be embedded 6.5 feet for frost protection. Df 6.5 ft⋅:=
2. Assumed parameters for fill soils: (Ref: Bowles 5th Ed Table 3-4)
Saturated unit weight: γs 125 pcf⋅:=
Dry unit weight: γd 120 pcf⋅:=
Internal friction angle: ϕns 32 deg⋅:=
Undrained shear strength: cns 0 psf⋅:=
3. Use Terzaghi strip equations as L>B
4. Effective stress analysis footing on φ-c soil (Bowles 5th Ed. Example 4-1 pg 231)
Depth to Groundwater table: Dw 12 ft⋅:= Based on boring logs
At Strength Limit State: Recommend a limiting factored bearing resistance of 7 tsf or 14 ksf
C-16
Charles River Bridge Fryeburg, MainePIN 15095.00
By: Kate MaguireSeptember 2009
Checked by: LK 9/09
Bearing Resistance - Bedrock:Part 1 - Service Limit State
Nominal and factored Bearing Resistance - spread footing on bedrock
Presumptive Bearing Resistance for Service Limit State ONLY
Bedrock at the site is Granite which is "fair" to "poor" in quality.RQD = 38 to 72%
Reference: AASHTO LRFD Bridge Design Specifications Third EditionTable C10.6.2.6.1-1 "Presumptive Bearing Resistances for Spread Footings at the Service Limit State Modified after US Department of Navy (1982)"
Due to RQD look at "medium hard rock"
Type of Bearing Material: Weathered or broken rock of any kind except highly argillaceous rock (shale)
Consistency In Place: Medium hard rock
Bearing Resistance: Ordinary Range (ksf) 16 - 24
Recommended Value of Use (ksf): 20 ksf
Based on RQD values ranging from 38% to 72%
Recommended Value: qpres 20 ksf⋅:=
Note: This bearing resistance is settlement limited (1 inch) and applies only at the service limit state.
Part 2 - Strength Limit State
Nominal and Factored Bearing Resistance - spread footing on bedrock
Nominal Bearing Resistance for Strength Limit State
Bedrock at the site is Granite which is "fair" to "poor" in quality.RQD = 38 to 72%
Reference: AASHTO LRFD Bridge Design Specifications Third Edition Article 10.6.3.2: For footings on competent rock, reliance on simple and direct analyses based on uniaxial compressive rock strengths and RQD may be applicable. Where engineering judgment does not verify the presence of competent rock, the competency of the rock mass should be verified using the procedures for RMR rating in Article 10.4.6.4.
Due to competency of bedrock (RQD 38 to 72%), RMR method is not required.
C-17
Charles River Bridge Fryeburg, MainePIN 15095.00
By: Kate MaguireSeptember 2009
Checked by: LK 9/09
Reference: Foundation Analysis and Design by JE Bowles Fifth Edition
Section 4-16 pg 277 Bearing Capacity of Rock
Assume: ϕ 45 deg⋅:= internal friction angle rock
cr 0 psi⋅:= cohesion (rock)
Bearing Capacity factors by Stagg and Zienkiewicz 1968
Nc 5 tan 45 deg⋅ϕ
2+⎛⎜
⎝⎞⎟⎠
4⎛⎜⎝
⎞⎟⎠
⋅:= Nc 170=
Nq tan 45 deg⋅ϕ
2+⎛⎜
⎝⎞⎟⎠
6:= Nq 198=
Nγ Nq 1+:= Nγ 199=
Terzaghi Shape factors from Table 4-1 pg 220 For a strip footing: sc 1.0:= sγ 1.0:=
Assume γr 155 pcf⋅:= for the rock
Df 0 ft⋅:= footing placed on bedrock surface - no embedment
q γr Df⋅:= q 0 psf⋅=
B
6
8
10
12
⎛⎜⎜⎜⎜⎝
⎞⎟⎟⎟⎟⎠
ft⋅:= Look at several footing widths
qult cr Nc⋅ sc⋅ q Nq⋅+ 0.5 γr⋅ B⋅ Nγ⋅ sγ⋅+:=qult
93
123
154
185
⎛⎜⎜⎜⎜⎝
⎞⎟⎟⎟⎟⎠
ksf⋅=
Reduce ultimate bearing based on average RQD = 56%
qreduced qult 0.56( )2⋅:=
qreduced
29
39
48
58
⎛⎜⎜⎜⎜⎝
⎞⎟⎟⎟⎟⎠
ksf⋅=
Assume this ultimate load is a nominal load. Apply 0.45 resistance factor to get factored resistance.
qfactored qreduced 0.45⋅:=
qfactored
13
17
22
26
⎛⎜⎜⎜⎜⎝
⎞⎟⎟⎟⎟⎠
ksf⋅= B
6
8
10
12
⎛⎜⎜⎜⎜⎝
⎞⎟⎟⎟⎟⎠
ft⋅:=
At the Strength Limit State: Recommend a limiting factored bearing resistance of 17 ksf
From Figure 7-7 page 7-17 using the "Clean well graded fine to coarse SAND" curve
Bearing Capacity Index: C4 90:=
Use STRESS to determine the change in stress at the mid point of the layer under consideration (above)
Δσz4 161.34 psf⋅=
C-22
Charles River Bridge Fryeburg, MainePIN 15095.00
By: Kate MaguireSeptember 2009
Checked by: LK 9/09
Settlement at each layer Interbedded sand and gravel:
Δσz3 181.46 psf⋅=ΔH1 H1
1C1
⋅ logσ1o Δσz1+
σ1o
⎛⎜⎝
⎞⎟⎠
⋅:=ΔH1 0.22 in⋅=
ΔH2 H21
C2⋅ log
σ2o Δσz2+
σ2o
⎛⎜⎝
⎞⎟⎠
⋅:=ΔH2 0.17 in⋅=
ΔH3 H31
C3⋅ log
σ3o Δσz3+
σ3o
⎛⎜⎝
⎞⎟⎠
⋅:=ΔH3 0.14 in⋅=
ΔH4 H41
C4⋅ log
σ4o Δσz4+
σ4o
⎛⎜⎝
⎞⎟⎠
⋅:=ΔH4 0.03 in⋅=
Total settlement =
ΔHA2 ΔH1 ΔH2+ ΔH3+ ΔH4+:= ΔHA2 0.57 in⋅=
C-23
Charles River Bridge Fryeburg, MainePIN 15095.00
By: Kate MaguireSeptember 2009
Checked by: LK 9/09
Frost Protection:Method 1 - MaineDOT Design Freezing Index (DFI) Map and Depth of Frost Penetration Tableare in BDG Section 5.2.1.
From the Design Freezing Index Map: Fryeburg, MaineDFI = 1400 degree-days
From the lab testing: soils are coarse grained with a water content = ~25%
From Table 5-1 MaineDOT BDG for Design Freezing Index of 1400 frost penetration = 61 inches
Frost_depth 61in:= Frost_depth 5.1 ft⋅=
Note: The final depth of footing embedment may be controlled by the scour susceptibility of the foundationmaterial and may, in fact, be deeper than the depth required for frost protection.
Method 2 - Check Frost Depth using Modberg Software
Closest Station is Bridgton
ModBerg Results
Project Location: Bridgton 3 NW, Maine
Air Design Freezing Index = 1600 F-days N-Factor = 0.80 Surface Design Freezing Index = 1280 F-days Mean Annual Temperature = 43.9 deg F Design Length of Freezing Season = 133 days
------------------------------------------------------------------------------------------------------------------- Layer #:Type t w% d Cf Cu Kf Ku L ------------------------------------------------------------------------------------------------------------------- 1-Coarse 82.4 25.0 125.0 37 53 4.7 2.0 4,500 -------------------------------------------------------------------------------------------------------------------
t = Layer thickness, in inches. w% = Moisture content, in percentage of dry density. d = Dry density, in lbs/cubic ft. Cf = Heat Capacity of frozen phase, in BTU/(cubic ft degree F). Cu = Heat Capacity of thawed phase, in BTU/(cubic ft degree F). Kf = Thermal conductivity in frozen phase, in BTU/(ft hr degree). Ku = Thermal conductivity in thawed phase, in BTU/(ft hr degree). L = Latent heat of fusion, in BTU / cubic ft.
************************************************************************************************ Total Depth of Frost Penetration = 6.87 ft = 82.4 in. ************************************************************************************************
Seismic:Fryeburg Charles River Bridge PIN 15095.00Date and Time: 9/9/2009 1:48:20 PM
Conterminous 48 States2007 AASHTO Bridge Design GuidelinesAASHTO Spectrum for 7% PE in 75 years State - Maine Zip Code - 04037 Zip Code Latitude = 44.000500 Zip Code Longitude = -070.963200 Site Class B Data are based on a 0.05 deg grid spacing. Period Sa (sec) (g) 0.0 0.102 PGA - Site Class B 0.2 0.198 Ss - Site Class B 1.0 0.049 S1 - Site Class B
Conterminous 48 States2007 AASHTO Bridge Design GuidelinesSpectral Response Accelerations SDs and SD1 State - Maine Zip Code - 04037 Zip Code Latitude = 44.000500 Zip Code Longitude = -070.963200 As = FpgaPGA, SDs = FaSs, and SD1 = FvS1 Site Class D - Fpga = 1.60, Fa = 1.60, Fv = 2.40 Data are based on a 0.05 deg grid spacing. Period Sa (sec) (g) 0.0 0.163 As - Site Class D 0.2 0.317 SDs - Site Class D 1.0 0.119 SD1 - Site Class D
C-25
Appendix D
Special Provisions
1 of 1
SPECIAL PROVISION
SECTION 610 STONE FILL, RIPRAP, STONE BLANKET,
AND STONE DITCH PROTECTION Add the following paragraph to Section 610.02: Materials shall meet the requirements of the following Sections of Special Provision 703:
Stone Fill 703.25 Plain and Hand Laid Riprap 703.26 Stone Blanket 703.27 Heavy Riprap 703.28 Definitions 703.32
Add the following paragraph to Section 610.032.a. Stone fill and stone blanket shall be placed on the slope in a well-knit, compact and uniform layer. The surface stones shall be chinked with smaller stone from the same source. Add the following paragraph to Section 610.032.b: Riprap shall be placed on the slope in a well-knit, compact and uniform layer. The surface stones shall be chinked with smaller stone from the same source. Add the following to Section 610.032: Section 610.032.d. The grading of riprap, stone fill, stone blanket and stone ditch protection shall be determined by the Resident by visual inspection of the load before it is dumped into place, or, if ordered by the Resident, by dumping individual loads on a flat surface and sorting and measuring the individual rocks contained in the load. A separate, reference pile of stone with the required gradation will be placed by the Contractor at a convenient location where the Resident can see and judge by eye the suitability of the rock being placed during the duration of the project. The Resident reserves the right to reject stone at the job site or stockpile, and in place. Stone rejected at the job site or in place shall be removed from the site at no additional cost to the Department.
1 of 1
SPECIAL PROVISION SECTION 703
AGGREGATES Replace subsections 703.25 through 703.28 with the following: 703.25 Stone Fill Stones for stone fill shall consist of hard, sound, durable rock that will not disintegrate by exposure to water or weather. Stone for stone fill shall be angular and rough. Rounded, subrounded, or long thin stones will not be allowed. Stone for stone fill may be obtained from quarries or by screening oversized rock from earth borrow pits. The maximum allowable length to thickness ratio will be 3:1. The minimum stone size (10 lbs) shall have an average dimension of 5 inches. The maximum stone size (500 lbs) shall have a maximum dimension of approximately 36 inches. Larger stones may be used if approved by the Resident. Fifty percent of the stones by volume shall have an average dimension of 12 inches (200 lbs). 703.26 Plain and Hand Laid Riprap Stone for riprap shall consist of hard, sound durable rock that will not disintegrate by exposure to water or weather. Stone for riprap shall be angular and rough. Rounded, subrounded or long thin stones will not be allowed. The maximum allowable length to width ratio will be 3:1. Stone for riprap may be obtained from quarries or by screening oversized rock from earth borrow pits. The minimum stone size (10 lbs) shall have an average dimension of 5 inches. The maximum stone size (200 lbs) shall have an average dimension of approximately 12 inches. Larger stones may be used if approved by the Resident. Fifty percent of the stones by volume shall have an average dimension greater than 9 inches (50 lbs). 703.27 Stone Blanket Stones for stone blanket shall consist of sound durable rock that will not disintegrate by exposure to water or weather. Stone for stone blanket shall be angular and rough. Rounded or subrounded stones will not be allowed. Stones may be obtained from quarries or by screening oversized rock from earth borrow pits. The minimum stone size (300 lbs) shall have minimum dimension of 14 inches, and the maximum stone size (3000 lbs) shall have a maximum dimension of approximately 66 inches. Fifty percent of the stones by volume shall have average dimension greater than 24 inches (1000 lbs). 703.28 Heavy Riprap Stone for heavy riprap shall consist of hard, sound, durable rock that will not disintegrate by exposure to water or weather. Stone for heavy riprap shall be angular and rough. Rounded, subrounded, or thin, flat stones will not be allowed. The maximum allowable length to width ratio will be 3:1. Stone for heavy riprap may be obtained from quarries or by screening oversized rock from earth borrow pits. The minimum stone size (500 lbs) shall have minimum dimension of 15 inches, and at least fifty percent of the stones by volume shall have an average dimension greater than 24 inches (1000 lbs). Add the following paragraph: 703.32 Definitions (ASTM D 2488, Table 1). Angular: Particles have sharp edges and relatively plane sides with unpolished surfaces Subrounded: Particles have nearly plane sides but have well-rounded corners and edges Rounded: Particles have smoothly curved sides and no edges