172
Barrick Now Annual Review 2006

Proven and Measured andProbable Reserves Indicated Resources
Gold (mm ozs)
North America 46 15South America 38 6Australia-Pacific 22 12 Africa 17 2
Total 123 35
Other MetalsCopper (bn lbs) 6.0 6.6Nickel (mm lbs) – 254Platinum (000s ozs) – 262Palladium (000s ozs) – 1,073
Measured andOther Metals Contained In: Proven and Probable Indicated
Gold Reserves Gold Resources
Silver (mm ozs) 964 48Copper (bn lbs) 1.2 –Zinc (mm lbs) 1,555 48
The company expects 2007 gold production of 8.1 to 8.4 million ounces and copper production of approximately 400 million pounds. Total cash costs are expected to be in the range of $335 to $350 per ounce for gold and about $0.90 per pound for copper. Gold production is expected to be slightly weighted to the second half of 2007.
1. Mineral reserves (“reserves”) and mineral resources (“resources”) have been calculated as at December 31, 2006 in accordance with National Instrument 43-101 as required by Canadian securities regulatory authorities. For United States report-ing purposes, Industry Guide 7, (under the Securities and Exchange Act of 1934), as interpreted by Staff of the SEC, applies different standards in order to classify mineralization as a reserve. Accordingly, for U.S. reporting purposes, 1.88 millionounces of the Cortez reserve, Buzwagi and Pueblo Viejo are classified as mineralized material. In addition, while the terms “measured”, “indicated” and “inferred” mineral resources are required pursuant to National Instrument 43-101, the U.S.Securities and Exchange Commission does not recognize such terms. Canadian standards differ significantly from the requirements of the U.S. Securities and Exchange Commission, and mineral resource information contained herein is not com-parable to similar information regarding mineral reserves disclosed in accordance with the requirements of the U.S. Securities and Exchange Commission. U.S. investors should understand that “inferred” mineral resources have a great amount ofuncertainty as to their existence and great uncertainty as to their economic and legal feasibility. In addition, U.S. investors are cautioned not to assume that any part or all of Barrick’s mineral resources constitute or will be converted into reserves.Calculations have been prepared by employees of Barrick, its joint venture partners or its joint venture operating companies, as applicable, under the supervision of Jacques McMullen, Vice President, Metallurgy and Process Development ofBarrick, Rick Allan, Director – Engineering and Mining Support of Barrick, and Rick Sims, Manager Corporate Reserves of Barrick. Reserves have been calculated using an assumed long-term average gold price of $US 475 ($Aus. 640) per ounce,a silver price of $US 8.50 per ounce, a copper price of $US 1.50 per pound and exchange rates of $1.21 $Can/$US and $0.74 $US/$Aus. Reserves at the Kalgoorlie property assumed a gold price of $US 500 ($Aus. 675). Copper reserves at theOsborne property assumed a copper price of $US 1.75 per pound. Reserve calculations incorporate current and/or expected mine plans and cost levels at each property. Varying cut-off grades have been used depending on the mine and type ofore contained in the reserves. Barrick’s normal data verification procedures have been employed in connection with the calculations. Resources as at December 31, 2006 have been estimated using varying cut-off grades, depending on both thetype of mine or project, its maturity and ore types at each property. For a breakdown of reserves and resources by category and for a more detailed description of the key assumptions, parameters and methods used in calculating Barrick’sreserves and resources, see Barrick’s most recent Annual Information Form/Form 40-F on file with Canadian provincial securities regulatory authorities and the U.S. Securities and Exchange Commission.
2. Gold and copper resource estimates for Reko Diq have been prepared by employees and consultants of Tethyan Copper Company Limited (“Tethyan”) in accordance with the JORC Code. For additional information related to Reko Diq resourcesreported by Tethyan, including related assumptions, see Tethyan’s press release dated January 11, 2006 and its 2005 Fourth Quarter Report. Such resource estimates have been reviewed by Jacques McMullen, Vice President, Metallurgy andProcess Development of Barrick, Rick Allan, Director – Engineering and Mining Support of Barrick, and Rick Sims, Manager Corporate Reserves of Barrick. The inferred and indicated mineral resource amounts reported under the JORC Code aresubstantially similar to the inferred and indicated mineral resource amounts that would be reported in accordance with National Instrument 43-101.
Reserves and Resources as of December 31, 2006 1, 2
BarrickNowAnnual Review 2006
www.barrick.comCorporate Office BCE Place TD Canada Trust Tower 161 Bay Street,Suite 3700 P.O.Box 212 Toronto, Canada M5J 2S1
Tel:416-861-9911 Fax:416-861-2492

Certain information contained or incorporated by reference in this Annual Report 2006, including any information asto our future financial or operating performance, constitutes “forward-looking statements”. All statements, other thanstatements of historical fact, are forward-looking statements. The words “believe”, “expect”, “anticipate”, “contemplate”, “target”, “plan”, “intends“, “continue”, “budget”, “estimate“, “may”, “will”, “schedule” and sim-ilar expressions identify forward-looking statements. Forward-looking statements are necessarily based upon a number of estimates and assumptions that, while considered reasonable by us, are inherently subject to significant business,economic and competitive uncertainties and contingencies. Known and unknown factors could cause actual results todiffer materially from those projected in the forward-looking statements. Such factors include, but are not limited to:fluctuations in the currency markets (such as Canadian and Australian dollars, South African rand, Chilean Peso andPapua New Guinean kina versus US dollar); fluctuations in the spot and forward price of gold and copper or certainother commodities (such as silver, diesel fuel and electricity); changes in US dollar interest rates or gold lease rates thatcould impact the mark-to-market value of outstanding derivative instruments and ongoing payments/receipts underinterest rate swaps and variable rate debt obligations; risks arising from holding derivative instruments (such as creditrisk, market liquidity risk and mark-to-market risk); changes in national and local government legislation, taxation, con-trols, regulations and political or economic developments in Canada, the United States, Dominican Republic, Australia,Papua New Guinea, Chile, Peru, Argentina, South Africa, Tanzania, Russia, Pakistan or Barbados or other countries in which we do or may carry on business in the future; business opportunities that may be presented to, or pursuedby, us; our ability to successfully integrate acquisitions; operating or technical difficulties in connection with mining or development activities; employee relations; litigation; the speculative nature of exploration and development,including the risks of obtaining necessary licenses and permits; diminishing quantities or grades of reserves; adversechanges in our credit rating; and contests over title to properties, particularly title to undeveloped properties. In addi-tion, there are risks and hazards associated with the business of exploration, development and mining, includingenvironmental hazards, industrial accidents, unusual or unexpected formations, pressures, cave-ins, flooding and goldbullion or copper cathode losses (and the risk of inadequate insurance, or inability to obtain insurance, to cover theserisks). Many of these uncertainties and contingencies can affect our actual results and could cause actual results to differ materially from those expressed or implied in any forward-looking statements made by, or on behalf of, us.Readers are cautioned that forward-looking statements are not guarantees of future performance. All of the forward-looking statements made in this Annual Report 2006 are qualified by these cautionary statements. Specific referenceis made to Barrick’s most recent Form 40-F/Annual Information Form on file with the SEC and Canadian provincialsecurities regulatory authorities for a discussion of some of the factors underlying forward-looking statements.
We disclaim any intention or obligation to update or revise any forward-looking statements whether as a result of newinformation, future events or otherwise, except to the extent required by applicable laws.
Cautionary Statement on Forward-Looking Information
Ove
Des
ign
& C
omm
unic
atio
ns L
td.
/
Mov
eabl
e In
c.
/ B
owne
of
Can
ada,
Ltd
.
TABLE OF CONTENTS
1 Financial Highlights2 Letter to Shareholders6 Barrick Now
Barrick TodayBarrick in 2006Barrick in 2007
10 Barrick Projects12 Responsible Mining14 Financial Strategy
16 Regional Business UnitsNorth AmericaSouth AmericaAustralia-PacificAfrica
24 Corporate Directory
The 2006 Annual Report consists of the 2006 Annual Review and the 2006 Financial Report.
Barrick’s vision is to be the world’s best goldcompany by finding, acquiring, developingand producing quality reserves in a safe, profitable and socially responsible manner.
The Company’s quality assets and its unrivalled project pipeline, combined with the strength of its balance sheet and the talents of its people, position Barrick to deliver significant value to its shareholders.

Financial Highlights � 1Barrick Annual Review 2006
FinancialHighlights
(in millions of US dollars, except per share data)(US GAAP basis) 2006 2005 2004
Sales $ 5,636 $ 2,350 $ 1,932Net income for the year 1,506 401 248Operating cash flow 2,122 726 509Cash and equivalents 3,043 1,037 1,398Shareholders’ equity 14,199 3,850 3,574Net income per share (diluted) 1.77 0.75 0.46Operating cash flow per share 2.48 1.35 0.95Dividends per share 0.22 0.22 0.22
Operating HighlightsGold production (thousands of ounces) 8,643 5,460 4,958 Average realized gold price per ounce $ 541 $ 439 $ 391 Total cash costs per ounce1 $ 282 $ 227 $ 214 Total production costs per ounce $ 359 $ 303 $ 300
Copper production (millions of pounds) 367 – – Average realized copper price per pound $ 3.06 $ – $ – Total cash costs per pound1 $ 0.79 $ – $ – Total production costs per pound $ 1.22 $ – $ –
Reserves: proven and probable (thousands of ounces)2 123,066 88,591 89,056
1. See page 34 of Barrick’s 2006 Financial Report for a discussion of our total cash cost performance measures.
2. Calculated in accordance with National Instrument 43-101 as required by Canadian securities regulatory authorities. For United States reporting purposes, Industry Guide 7(under the Securities Exchange Act of 1934), as interpreted by the Staff of the SEC, applies different standards in order to classify mineralization as a reserve. Accordingly,for U.S. reporting purposes, 1.88 million ounces of the Cortez reserve, Buzwagi and Pueblo Viejo are classified as mineralized material. For a breakdown of reserves andresources by category and additional information relating to reserves and resources, see pages 128–136 of Barrick’s 2006 Financial Report.
Higher Prices… Expanded Margins
0
150
300
450
600
2005
439
REALIZED PRICEUS$ per ounce
2006
Up 23%
0
0.75
1.50
2.25
3.00541
2005
0.75
EARNINGSUS$ per share
2006
Up 136%
1.77
2005
CASH FLOWUS$ per share
2006
Up 84%
2.48
1.35

2 � Letter to Shareholders Barrick Annual Review 2006
Letter toShareholders
Dear Shareholders,2006 was a dynamic year for the gold mining indus-
try, and a banner year for Barrick. We saw a wave of
industry consolidation and historically high gold
prices, coupled with robust demand and flat supply.
This comes at a time when global interest in gold as
an alternate investment is on the rise.
The yellow metal has been trading higher in
United States dollar terms, but also against other
major global currencies, an encouraging indicator
for gold. However, while higher gold prices have
attracted capital to the sector, few new discoveries
have been found. Over the next three years, new
gold projects around the world are unlikely to
replace production declines across the industry.
This growing discrepancy between gold supply and
demand should have a profound impact on our
industry and we believe Barrick is strategically posi-
tioned to leverage the opportunities that lie ahead.
For the industry as a whole, new projects are
characterized by higher capital and operating costs,
significantly longer timelines for development,
more rigorous regulatory and public scrutiny, and
in most cases, by lower grades.
We have worked steadily to prepare Barrick
for this new environment. We have the strength,
breadth and scale, coupled with the financial
resources, to maintain a comprehensive exploration
program, optimize our portfolio of operating mines
and advance our pipeline of quality projects. It is
this project pipeline, unrivalled in the gold mining
industry, which also sets Barrick apart from its
competitors.
In 2006 we laid much of the ground work for
our future. The acquisition of Placer Dome and a
strong performance from Barrick’s four newest gold
mines led to record levels of gold production, which
combined with strong gold and copper prices
to produce the best financial results in Barrick’s
history. The Company also effectively completed
the integration of Placer Dome to establish itself as
the pre-eminent gold producer.
Peter Munk, Chairman (left)Gregory C. Wilkins, President and Chief Executive Officer

Letter to Shareholders � 3Barrick Annual Review 2006
These strong financial results were achieved
in spite of the fact that we incurred significant costs
in voluntarily reducing our forward sales contracts.
During the year the legacy Placer Dome hedge
book was eliminated, and by February 2007, we had
also completely eliminated Barrick’s fixed price
corporate gold sales contracts. As a result of these
deliveries, the Company expects to incur an after-
tax cost of $564 million in the first quarter of 2007,
and $65 million in the second quarter. From second
quarter 2007 onwards, all gold production from our
operating mines will be sold into the spot market.
The remaining project gold sales contracts serve as
price support to optimize financing for our major
projects, including Pascua-Lama and Pueblo Viejo.
We repositioned our portfolio of operating
mines by selling certain Placer Dome assets for
$3.1 billion. We were able to obtain significant value
for the assets by selling them to companies better
positioned to maximize synergies with their own
operations. The capital will be redeployed into build-
ing our new projects, which offer greater upside
potential and lower cash costs for our shareholders.
2006 was the first full year of operations for
three of the Company’s newest mines: Lagunas
Norte, Veladero, and Tulawaka. All three turned in
solid performances, meeting their targets for the
year. The Cowal mine, the fourth in this suite of
new mines, was commissioned in April 2006.
The average spot gold price in 2006 increased
36 per cent, but Barrick earnings and operating
cash flow per share increased by multiples of that
percentage. This demonstrates the excellent lever-
age our earnings and cash flow have to movements
in gold price. Our results also benefited from newly
acquired copper production, and higher copper
prices, which rose 83 per cent over 2005.
Record results for Barrick in 2006:
� Gold production for the year was
8.6 million ounces, at total cash
costs per ounce of $282, meeting
our original guidance;
� Copper production was 367 million
pounds, exceeding our original
production guidance, at total cash
costs of $0.79 per pound;
� Earnings per share increased
136 per cent to $1.77; and
� Cash flow per share from operations
rose 84 per cent to $2.48.

4 � Letter to Shareholders Barrick Annual Review 2006
our copper production for the next three years.
Proceeds from the notes will be used to build our
pipeline of gold projects – Barrick’s core business.
There are also a number of intangibles that
contributed to our successes in 2006. We know suc-
cessful companies thrive over time largely because
they have attracted, retained and motivated the
best talent in their industry. We believe that Barrick
has a management team and a workforce second to
none in the industry. Our employees are motivated
and dedicated to making our strategic vision a
reality. It is their drive and perseverance that have
made the Company what it is today.
We also recognize that good corporate citizen-
ship is also good business. In fact, it is essential to
achieve long-term business sustainability. Barrick
has always been a pioneer and a leader in corporate
social responsibility. The Company’s philosophy of
responsible mining represents a commitment to
share the benefits of mining with the communities
where we live and work.
Barrick in 2007: Strength now, and into the futureIn 2007 we anticipate gold production will be slightly
lower and operating costs higher than last year.
Production is expected to be 8.1 to 8.4 million
ounces at total cash costs of $335 to $350 per ounce.
We advanced each of the Company’s four
significant projects: Cortez Hills in Nevada, Pascua-
Lama on the border of Chile and Argentina, Pueblo
Viejo in the Dominican Republic, and Donlin Creek
in Alaska. At Cortez Hills, our most advanced
project, we are currently working to secure permits
for the development of the proposed mine. Pascua-
Lama received the necessary approvals of the
Environmental Impact Assessment from both the
Chilean and Argentinean governments. The Pueblo
Viejo project benefited from exploration drilling
that increased reserves by 35 per cent to 18.1 million
ounces of gold (100 per cent basis). At Donlin
Creek, we are on track to complete a feasibility
study and satisfy the terms of the joint-venture
agreement to increase our interest to 70 per cent.
Barrick acquired a 37.5 per cent interest in the
Reko Diq property in Pakistan, through the joint
acquisition of Tethyan Copper Company in part-
nership with Antofagasta plc. This provides the
Company with an interest in a very large copper-
gold district which has the potential to become a
major source of production in the future.
During the year we took advantage of favorable
financing conditions in the debt market to issue
innovative copper-linked notes. These notes raised
$1 billion while locking in an attractive average
price (over $3 per pound) for roughly one-third of
“The challenges are complex, but the opportunities are very great. We have the people, assets and discipline to achieve our targets and generate strong financial results.”

Letter to Shareholders � 5Barrick Annual Review 2006
A substantial portion of the cash cost increase is
attributable to mining at below reserve grade in
2007 as planned.
Inflationary pressures felt across the mining
industry have also had an impact on industry-wide
cash costs; however, the Company’s cost containment
programs have helped to mitigate the impact on
Barrick. As cost pressures begin to stabilize in 2007,
we do not expect to see similar increases in 2008.
The Company has already poured gold at the
new Ruby Hill mine in Nevada and throughout
2007 we will continue advancing our projects, which
represent the strongest pipeline in the industry.
As envisioned, many of Barrick’s projects have the
potential to become large, long-life producers.
However, as we noted earlier, these projects entail
lengthy permitting timeframes, and as significant
projects, take time to build to our standards.
The challenges going forward are many and
complex – but the opportunities are also very great.
The Company remains positive on the outlook for
gold price, and we have the people, the assets, and
the discipline to continue to achieve our targets,
replace our reserves, build new mines, and generate
strong financial results.
Further, we recognize that our share price per-
formance needs to improve relative to the gold price
and we believe that the market will recognize the
latent value in our assets and the pipeline of
projects for the benefit of our shareholders.
Lastly, before closing, we wish to pay tribute to
a Company director who has helped to shape and
guide Barrick’s success over the years. Joseph
Rotman, one of our founding shareholders and
directors, retires from our Board in 2007. He has
been a valued director, friend, and colleague since
1983. We will miss his wise counsel.
Peter MunkChairman
Gregory C. WilkinsPresident and ChiefExecutive Officer

BarrickNow
Our reserves, mines, projects and balance
sheet are at record strength, our operating
mines are fully levered to the gold price
and our project pipeline is unequalled.
We achieved record results in 2006 of $1.5 billion in earnings and $2.1 billion in operating cash flow, positioning Barrickfor the opportunities that lie ahead. We have the strength, breadth, scale and financial resources to maintain a comprehensive exploration program, optimize our operating mines, and advance our unrivalled pipeline of quality projects.
6 � Barrick Now Barrick Annual Review 2006

Barrick Today � 7Barrick Annual Review 2006
BarrickToday
Barrick is the industry’s pre-eminent gold producer, with
27 operating mines, an unrivalled pipeline of quality projects,
and the expertise and financial strength to unlock their value
for our investors.
As of February 2007 – more than two years ahead of schedule –
our operating mines have full leverage to a rising gold market.
Our quality portfolio of operating mines represents a largeproduction base – substantial reserves, long life and a stablecost structure. Over 60% of production is anticipated tocome from OECD countries in 2007.
Quality portfolio ofoperating mines
See pages 16–23
With 123 million ounces in proven and probable reservesand 35 million ounces in measured and indicated resources,Barrick has the industry’s largest reserve base of gold plusthe proven ability to extract value from these ounces.
Industry’s largest reserves See page 11
Barrick has an unrivalled project pipeline, paired with ahighly skilled and experienced project development teamthat has brought five new mines into production in the last two years.
Unrivalled pipeline of projects See pages 10–11
Our focus on high discovery potential has positioned us onsome of the world’s most prolific trends. Our competitiveedge has already led us to nine super-giant deposits, eachwith over 20 million ounces of gold endowment.
Extensive land positions on themost prolific trends
See pages 16–23
Barrick has the industry’s only ‘A’ rated balance sheet. Thisgives us the flexibility and the financial capacity to manageour operations and advance our project pipeline withoutequity dilution.
Financial strength See pages 14–15
Barrick is positive on the outlook for gold. As of February2007, we have eliminated our fixed price Corporate GoldSales Contracts and the legacy Placer Dome hedge position,two years ahead of schedule, giving our operating minesfull leverage to a rising gold market.
Enhanced leverage to gold See page 15
Barrick’s success is predicated on a commitment to excellence. Our Code of Business Conduct and Ethics provides the framework to conduct our business to thehighest standards, while our environmental, health, safetyand social programs are focused on responsible mining.
Corporate Governance and Social Responsibility
See pages 12–13

Barrickin 2006
1 23 4
First Quarter
� Acquired Placer Dome Inc. Strengthened our operating portfolio with 12 new mines, deepened our pipeline with 4 world-class projects, and addedlarge copper production and reserves
� Received approval of the Pascua-Lama EnvironmentalImpact Assessment from ChileA milestone achievement, significantly advancing this key projectthrough the environmental permitting process
� Acquired Tethyan Copper CompanyJoint acquisition with Antofagasta plc brought us a 37.5% interest in the large Reko Diq copper-gold project in Pakistan,located on the prospective Tethyan belt
Quarterly Highlights
8 � Barrick in 2006 Barrick Annual Review 2006
Third Quarter
� Sold South Deep for US$1.5 billionContinued our rationalization of the Placer Dome portfolio byselling this non-core South African asset
� Realized synergiesCompleted integration of Placer Dome mines, putting us ontrack to capture the expected $200 million in annual synergiesbeginning in 2007
� Showcased our Nevada operations Conducted mine tours to highlight the long life and excellentexploration potential of our Nevada operations from our flagship Goldstrike operation and the newly acquired Cortezand Bald Mountain mines
Fourth Quarter
� Met our original full-year production and total cash cost guidanceBy meeting our original guidance for gold, and exceeding ouroriginal guidance for copper, the Company posted recordfinancial results for the year
� Issued $1 billion of copper-linked notesInnovative financing secured funding for our project pipeline,simultaneously taking advantage of strong copper prices andfavorable debt markets
� Received approval of the Pascua-Lama EnvironmentalImpact Assessment from ArgentinaMarked the receipt of both the Chilean and Argentineanenvironmental approvals for this bi-national gold-silverdevelopment project
2006 was a banner year for Barrick, a year of
great opportunities and singular achievements.
Here are some of the highlights.
Second Quarter
� Reported record earnings and cash flowPeak gold margins above $300 per ounce and robustcopper revenues flowed to our bottom line, deliveringshareholder value
� Eliminated legacy Placer Dome hedge positionUsed favorable market conditions to eliminate the PlacerDome hedge book and to increase our leverage to gold
� Sold four Placer Dome mines to GoldcorpFocused our operating portfolio by divesting non-core assetsfor US$1.6 billion in cash

Barrick Annual Review 2006 Barrick in 2007 � 9
Barrickin 2007Outlook for the Year
2007 Outlook� 8.1 – 8.4 million ounces of gold at total cash costs of $335–$350 per ounce� 400 million pounds of copper at total cash costs of about $0.90 per pound� Capture or exceed $200 million in annual synergies from Placer Dome integration
Hedge Book Reductions� All fixed price Corporate Gold Sales Contracts eliminated by February 2007 � Operating mines unhedged and fully leveraged to gold prices� Project Gold Sales Contracts to support financing of development pipeline
SummaryWe expect 2007 to be a year of significant progress on many fronts. Our 27 operations arepoised to deliver full leverage to the strong gold price. A number of key milestones areanticipated on our expanded project pipeline. Our exploration portfolio is focused onhigh discovery potential on some of the world’s most prolific trends.
We have positioned our Company to excel in a rising
gold market. In 2007 we expect to reap the benefits
of our quality portfolio of unhedged production,
advance our project pipeline and unlock the value of
our non-gold assets.
Key Exploration OpportunitiesThe company plans to spend $170 million on exploration in 2007. Key areas of focus include:� North America – Nevada mine sites; Pueblo Viejo; Donlin Creek � Australia-Pacific – Porgera, Reko Diq� South America – Frontera District � Africa – North Mara, Lake Victoria greenstone belt
Project Pipeline� $1.1 – $1.8 billion capital budget� Focused on preparing a final EIS at Cortez Hills, obtaining construction permits at Pascua-Lama, advancing detailed engineering on
Pueblo Viejo and completing the Donlin Creek feasibility study� $190 million on expensed project development� Obtain EIA approval and commence detailed engineering at Buzwagi; complete a scoping study and new resource estimate at Reko Diq
Unlocking Value in Other MetalsOur objective in 2007 is to surface value in our quality portfolio of non-gold projects by completing pre-feasibility studies at the large,high grade Kabanga and Sedibelo projects and a feasibility study on the Fedorova project to increase our interest to 79%

10 � Barrick in 2007 Barrick Annual Review 2006
Barrickin 2007Advancing Projects
During the year we will continue to advance our
projects through the pipeline, and bring them
steadily closer to long-life production.
Pascua-LamaLOCATION:......................................Chile and Argentina borderPROVEN AND PROBABLE GOLD RESERVES: ......................17.0 mm ozsMEASURED AND INDICATED GOLD RESOURCES:..................3.1 mm ozsEXPECTED PRE-PRODUCTION CAPITAL:..................$2.3 to $2.4 billionEXPECTED GOLD PRODUCTION (FIRST 5 YRS): ..........750 – 775 kozs/yrEXPECTED TOTAL CASH COSTS (FIRST 5 YRS): ............$40 – $50 per oz
KEY POINTS:� World-class gold-silver deposit, with exploration opportunities� Large annual production, long mine life, low cash cost� In 2007: secure remaining key agreements and permits;
advance detailed engineering
KEY POINTS:� Multi-metal revenue from world-class reserve� +20 year mine life; high exploration potential� In 2007: advance exploration and metallurgical analysis; begin
detailed engineering; optimize mine design
Pueblo Viejo (60% basis)LOCATION:....................................................Dominican RepublicPROVEN AND PROBABLE GOLD RESERVES:........................10.9 mm ozsMEASURED AND INDICATED GOLD RESOURCES:....................1.3 mm ozsEXPECTED PRE-PRODUCTION CAPITAL:..............$1.26 to $1.38 billionEXPECTED GOLD PRODUCTION (FIRST 5 YRS): ............465 – 480 kozs/yrEXPECTED TOTAL CASH COSTS (FIRST 5 YRS):..........$180 – $190 per oz
Cortez Hills (60% basis)LOCATION: ................................................................Nevada, USAPROVEN AND PROBABLE GOLD RESERVES:..........................5.1 mm ozsEXPECTED PRE-PRODUCTION CAPITAL:................$288 to $300 millionEXPECTED GOLD PRODUCTION* (FIRST 5 YRS):..........580 – 595 kozs/yrEXPECTED TOTAL CASH COSTS* (FIRST 5 YRS):........$280 – $290 per oz* includes production from pipeline
KEY POINTS:� Highly prospective deposit, close to existing infrastructure� Construction period of approximately 15 months� In 2007: complete detailed engineering and planning; advance
exploration drilling
KEY POINTS:� Large gold deposit with good exploration potential� In 2007: conduct drilling program to increase measured and
indicated resource; complete feasibility study and meet back-inrequirements to increase our ownership to 70%
Donlin Creek (30%, with earn-in right to 70%)LOCATION:..................................................................Alaska, USAMEASURED AND INDICATED GOLD RESOURCES:....................5.9 mm ozsSTATUS: ..................Feasibility study to be completed in 2007

Barrick Annual Review 2006 Barrick in 2007 � 11
Barrick’s Project Pipeline Barrick has the gold industry’s largest pipeline of projects, and the expertise and financial strength to unlock the value ofgold and other metals contained in these deposits. The projects are expected to come into operation over a number of years– providing a continuing stream of new production for the Company, and long-term social and economic benefit for thelocal communities.
Replacing ProductionBarrick has the industry’s largest base of gold reserves. We also have very significant resources, both measured, indicated andinferred – and the exploration and financial strength to continue to find, acquire and develop new ounces, well into the future.
Inferred
25Measured &Indicated
35Proven & Probable
123Resources(millions of ounces at December 31, 2006)
Reserves(millions of ounces at December 31, 2006)
2007E Production
8.1–8.4
EXPLORATION FEASIBILITY PERMITTING CONSTRUCTION
Pueblo Viejo
Donlin Creek
Sedibelo
Kabanga
Reko Diq
Fedorova
Ruby Hill
Pascua-Lama
Buzwagi
Cortez Hills
OPERATIONS
PROVEN AND PROBABLE MEASURED AND INDICATEDRESERVES RESOURCES
Gold (mm ozs) 36 15
Copper (mm lbs) – 5,675
Nickel (mm lbs) – 254
Other metals contained within gold reserves and resources:
Silver (mm ozs) 742 48
Copper (mm lbs) 899 150
Zinc (mm lbs) 1,555 48

At Barrick, we are committed to making a positive difference in the communities in which we live andwork. We recognize that responsible behavior is our call-ing card, and that it creates opportunities to generategreater value for our shareholders while also fosteringsustainable development in the communities and coun-tries where we operate. We strive to earn the trust ofeveryone involved – our employees, local communitymembers, governments, and any other stakeholders withwhom we interact.
Barrick’s Social Responsibility Charter provides apolicy framework for all our business activities world-wide. This framework is defined under four pillars:Ethics; Employees; Community; and Environment,Health and Safety.
Ethical BehaviorThe Barrick Code of Business Conduct and Ethicsmandates that we conduct our business with the highest ethical standards and in accordance with allapplicable laws, rules and regulations. Each year, ouremployees are required to review and renew, on anindividual basis, their commitment to abide by theCode. They are also given the means to report conductthat violates the Code, in confidence when necessary.
We strive to act as a responsible corporate citizen,and we use our expertise to help facilitate constructivepublic dialogue and informed debate on issues ofimportance to Barrick, the mining industry, and thecommunities in which we operate. We do so both as anindividual company, and through our affiliation with a variety of industry associations and initiatives thatpromote responsible mining practices, including theUN Global Compact, Global Business Coalition onHIV/AIDS and the Mining Association of Canada, toname a few.
Our EmployeesBarrick is committed to developing the full potential ofits employees. This process starts with respect for eachindividual, and we act on that respect by observing the fundamental tenets of human rights, safety, non-discrimination and non-harassment in the workplace.
We compensate our employees fairly for their con-tributions, provide them with meaningful performancefeedback, and offer them professional development andtraining opportunities. We encourage accountability andemployee involvement in issues affecting the work-place, an approach that helps us continue to improvesafety and work conditions, business efficiency, and theCompany as a whole.
Our Courageous Leadership program, whichinvolves all employees, goes far beyond merely ‘teach-ing’ safety. It emphasizes individual responsibility andleadership, so that everyone recognizes their personalrole in ensuring workplace safety. Because of thisemphasis on individual leadership, the program isstrengthening a culture of responsibility and empow-erment in all areas of employees’ work lives, fromsafety to environment to production. Our goal is tohave every employee go home in good health and unin-jured, after every shift, each and every day. In 2006, ourefforts resulted in a 41% reduction in our total medicalinjury rate. We are now instituting our new PowerfulLeadership program, which builds on the success ofCourageous Leadership and goes beyond empower-ment to teach specific leadership skills.
We recognize that best practices continue to evolvein this important area, and we too will continue toevolve, learn, and apply what we learn.
ResponsibleMining
We are committed to making a
positive difference in the places
where we live and work. Each
year builds on the strengths and
experience of the previous year.
12 � Responsible Mining Barrick Annual Review 2006
Responsible Mining � 13Barrick Annual Review 2006
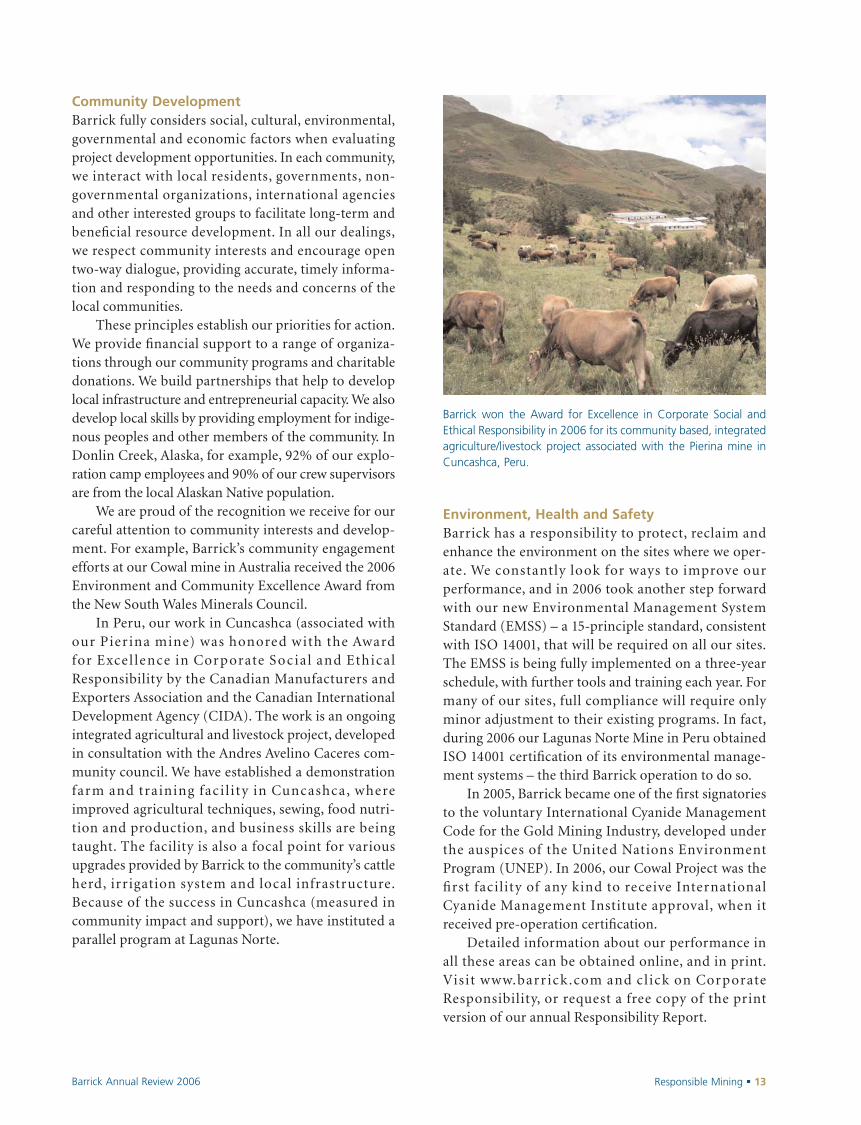
Community DevelopmentBarrick fully considers social, cultural, environmental,governmental and economic factors when evaluatingproject development opportunities. In each community,we interact with local residents, governments, non-governmental organizations, international agencies and other interested groups to facilitate long-term andbeneficial resource development. In all our dealings,we respect community interests and encourage opentwo-way dialogue, providing accurate, timely informa-tion and responding to the needs and concerns of thelocal communities.
These principles establish our priorities for action.We provide financial support to a range of organiza-tions through our community programs and charitabledonations. We build partnerships that help to developlocal infrastructure and entrepreneurial capacity. We alsodevelop local skills by providing employment for indige-nous peoples and other members of the community. InDonlin Creek, Alaska, for example, 92% of our explo-ration camp employees and 90% of our crew supervisorsare from the local Alaskan Native population.
We are proud of the recognition we receive for ourcareful attention to community interests and develop-ment. For example, Barrick’s community engagementefforts at our Cowal mine in Australia received the 2006Environment and Community Excellence Award fromthe New South Wales Minerals Council.
In Peru, our work in Cuncashca (associated withour Pier ina mine) was honored with the Award for Exce l lence in Corporate Soc ial and EthicalResponsibility by the Canadian Manufacturers andExporters Association and the Canadian InternationalDevelopment Agency (CIDA). The work is an ongoingintegrated agricultural and livestock project, developedin consultation with the Andres Avelino Caceres com-munity council. We have established a demonstrationfarm and training fac i l ity in Cuncashca, whereimproved agricultural techniques, sewing, food nutri-tion and production, and business skills are beingtaught. The facility is also a focal point for variousupgrades provided by Barrick to the community’s cattleherd, irrigation system and local infrastructure.Because of the success in Cuncashca (measured incommunity impact and support), we have instituted aparallel program at Lagunas Norte.
Environment, Health and SafetyBarrick has a responsibility to protect, reclaim andenhance the environment on the sites where we oper-ate. We constantly look for ways to improve our performance, and in 2006 took another step forwardwith our new Environmental Management SystemStandard (EMSS) – a 15-principle standard, consistentwith ISO 14001, that will be required on all our sites.The EMSS is being fully implemented on a three-yearschedule, with further tools and training each year. Formany of our sites, full compliance will require onlyminor adjustment to their existing programs. In fact,during 2006 our Lagunas Norte Mine in Peru obtainedISO 14001 certification of its environmental manage-ment systems – the third Barrick operation to do so.
In 2005, Barrick became one of the first signatoriesto the voluntary International Cyanide ManagementCode for the Gold Mining Industry, developed underthe auspices of the United Nations EnvironmentProgram (UNEP). In 2006, our Cowal Project was thefirst facility of any kind to receive InternationalCyanide Management Institute approval, when itreceived pre-operation certification.
Detailed information about our performance in all these areas can be obtained online, and in print.Visit www.barr ick.com and c l ick on CorporateResponsibility, or request a free copy of the print version of our annual Responsibility Report.
Barrick won the Award for Excellence in Corporate Social andEthical Responsibility in 2006 for its community based, integratedagriculture/livestock project associated with the Pierina mine inCuncashca, Peru.

14 � Financial Strategy Barrick Annual Review 2006
FinancialStrategyIn 2006, we successfully returned to the debt marketswith an innovatively structured financing. We issued a $1 billion copper-linked note to take advantage ofstrong copper prices and attractive market conditionsfor long-term debt. We issued $400 million in 10-yearnotes and $600 million in 30-year notes to fund development projects and to pre-finance upcomingdebt maturities.
The financing was structured to accomplish two ofour goals: to raise $1 billion of long-term liquidity, andto allow us to repay the notes by delivering the dollarequivalent of 324 million pounds of copper over thenext three years, at attractive prices.
The market viewed this as one of the most inno-vative financing deals done to date in the mining industry. As a result of our strong balance sheet, wewere able to maintain our credit ratings from Moody’s,Dominion Bond Rating Service, and Standard & Poor’sfor the issuance.
With the Placer Dome acquisition, we decided toincrease our existing credit facility from $1 billion to$1.5 billion and to cancel the legacy Placer Domefacility of $750 million. This arrangement provides us with access to short-term liquidity for bridgefinancing at better pricing than each company wasreceiving individually.
Also, in 2006, we issued another tranche of $50 mil-lion of bonds in the Peruvian capital markets, bringingthe total debt issued in this manner to $100 million. Theissue was done at very attractive rates and has allowedPeruvian investors to become our partners in LagunasNorte, a project of great importance to their country.
In 2007, we expect to repay $600 million of debtmaturities, in keeping with the Company’s conserva-tive financial philosophy. Over the next seven years,
Barrick expects to spend $7 to $10 billion in furtherdeveloping its project pipeline, maintaining its strongexploration program, and funding its sustaining capitalrequirements.
Barrick has maintained, and is committed tomaintaining, a strong balance sheet. We forecast that,at current commodity prices, the Company canfinance its project pipeline, without equity dilution,while maintaining its investment grade credit rating.
Reducing the Forward Sales ProgramBarrick is positive on the long-term outlook of the goldprice and has positioned itself for greater leverage tohigher prices.
In 2006, we successfully eliminated Placer Dome’s7.7 million ounce gold hedge book. We completed thisaction within six months of acquiring the company, togive the newly acquired ounces full exposure to risinggold prices.
We also reduced the Barrick fixed price CorporateGold Sales Contracts by 1.7 million ounces in 2006, andcompletely eliminated the fixed price position byFebruary 21, 2007. This has occurred more than twoyears earlier than our previously stated target, and isconsistent with our positive view for higher gold prices.
As of February 2007, Barrick has 9.5 million ouncesof Project Gold Sales Contracts, which have been allocated to facilitate the financing of our pipeline ofprojects, including Pascua-Lama, Pueblo Viejo, DonlinCreek, and Reko Diq. These contracts will provide pricesupport for these future financings, and representabout 26% of Barrick’s 36 million ounces of undevel-oped gold reserves.

Financial Strategy � 15Barrick Annual Review 2006
Currency and Commodity Risk ManagementBarrick has always placed a high priority on cost con-trol and reduction. As our global footprint has grownover the years, our foreign currency exposure nowmakes up approximately 30% of our total cash costs.Our mine sites are also large consumers of energy suchas diesel, gas, oil and propane for equipment and general power use.
As such, we have developed and maintain an activerisk management program where we monitor long-term exposures and use appropriate financial instru-ments to mitigate our currency and commodity risks.This program has generated over $360 million to oper-ating cash flow over the last three years and is expectedto continue to contribute as we remain disciplined incontrolling costs.
0
5
10
15
20
25
30
2001 2002 2003 2004 2005 2006 2007–Feb 21 ■ Corporate Gold Sales■ Project Gold Sales
Total Fixed Price Forward Sales as a % of Company Reserves
Internal Controls and ComplianceManagement has a framework for the evaluation ofinternal controls throughout the business supported bya Compliance function as well as an Internal Auditprocess. The framework includes the review and assess-ment of controls as envisaged by the Sarbanes-Oxleyrequirements. The results of our assessment madethrough the application of this framework enabled usto conclude that the system of internal controls overfinancial reporting, including disclosure controls andprocedures, is effective. The assessment of the legacyPlacer Dome sites was not required to be performed aspart of the 2006 Sarbanes-Oxley driven process per the
Securities and Exchange Commission; however, we did complete substantial preliminary reviews of theseoperations in 2006, in discharging our commitment tomaintain the integrity and reliability of our consoli-dated financial statements and in preparation for theirfull inclusion in our 2007 assessment.
We are leveraging the internal controls frameworkin our business improvement initiative to standardizeprocesses, including financial management procedures,to further improve reporting performance, informationquality and capacity utilization in support of our over-riding objective of increased shareholder value.

CANADA
UNITED STATES
• Eskay Creek
•
Golden Sunlight
▲ Donlin Creek
• Hemlo
GoldstrikeTurquoise Ridge
MarigoldCortez/Cortez HillsBald MountainRuby HillRound Mountain
•••
•●▲
•
▲
Pueblo Viejo
Regional Business Unit
16 � Regional Business Units – North America Barrick Annual Review 2006
North America
� Goldstrike celebrated 10 years of underground
mining, 20 years of open pit mining, and 30 million
ounces of gold production
� Exploration at Pueblo Viejo increased reserves on
a 100% basis from 13 million ounces to 18 million
ounces, and R&D shows potential to significantly
increase recoveries of copper, silver and zinc
� Ruby Hill mine in Nevada poured first gold in
February, 2007
� Exploration drilling at Cortez Hills underground
expanded proven and probable reserves to
5.1 million ounces
Regional OverviewWith the acquisition of Placer Dome, our NorthAmerica region now consists of 10 operating mines andthree large projects. It is our largest region by produc-tion and reserve measures, with 46 million ounces ofproven and probable reserves and 15 million ounces ofmeasured and indicated resources. The region isexpected to produce about 3.15 to 3.25 million ouncesof gold in 2007, at total cash costs of about $370 to $385per ounce.
In Nevada, the region’s largest cluster of operations,we moved quickly to integrate the acquired assets andbegan realizing the financial and operational benefits ofour larger, stronger portfolio.
3142006 Production(million ounces)
2006 Total Cash Costs(dollars per ounce)
3.4
46million ounces of proven and probable reserves
•
● Mine ▲ Project

Regional Business Units – North America � 17Barrick Annual Review 2006
2006 marked a major anniversary for Goldstrike:10 years of underground mining, 20 years of open pitmining, and cumulative production of 30 million ouncesof gold. It is our flagship operation, and our single largestmine. In 2007, Goldstrike will produce about 20% of ourtotal gold production, and it hosts 16 million ounces ofproven and probable reserves.
This property, with its world-class mining and pro-cessing facilities, is the Company’s center of operatingexcellence. We often transfer experience and lessonslearned here to our other sites. For example, Cortez andother mines are now benefiting from knowledge gainedin the Goldstrike tire management program, which hashad the dual result of saving money and improvingequipment availability. The Western 102 Power Plant atGoldstrike met all expectations in 2006, its first fullyear of operation, and reduced total cash costs at theproperty by $9 per ounce of gold produced.
Our most advanced project is Cortez Hills, located 60miles from Goldstrike in Nevada and in which we have60% ownership. This project is part of the Cortez prop-erty, which covers 1,080 square miles on one of theworld’s most highly prospective mineral trends. Capitalcosts on a 100% basis are estimated at about $480–$500million, including the development of two open pits andtwin exploration declines to delineate the undergroundpotential. Ore from the two pits will be conveyed acrossthe valley to be processed at existing facilities.
We made significant progress at our 60%-ownedPueblo Viejo project in the Dominican Republic, whichhas a large, world-class reserve of 18.1 million ounces ona 100% basis. This project took a major step forward inearly 2007 when the Dominican Republic governmentoffic ial ly approved its Environmental ImpactAssessment. We have used Barrick expertise to reviewand update the 2005 Placer Dome feasibility study forthis project. While capital costs have risen to about $2.1–$2.3 billion (100% basis) due to inflation andchanges in project scope, design changes are expected toresult in the recovery of significant amounts of zinc,silver and copper.
The Ruby Hill mine in Nevada poured gold in thefirst quarter of 2007. This is the fifth mine Barrick hascommissioned in the last two years, and demonstrates theCompany’s ability to develop projects successfully.
ExplorationNorth America remains our key exploration focus, with$69 million of the total 2007 exploration budget ofabout $170 million to be spent in this region, most of itin Nevada. The Placer Dome acquisition greatlyexpanded our opportunities, by adding Cortez, BaldMountain and Turquoise Ridge/Getchell to the Barrickportfolio. Our 2007 exploration programs will followup on the positive results returned this year.
In Nevada, the main focus for 2007 will be to add resources around our existing operations, and toprioritize and test new targets on our extensive landholdings on the state’s three most prospective trends.
As an example, at the Cortez joint-venture prop-erty, the exploration group is testing for extensions ofknown mineralization along strike and at depth, andalso looking for new mineralization. At the Cortez HillsLower Zone, where known mineralization has beenexpanded significantly, in-fill and extension drilling willcontinue through 2007.
Successful drill programs were also completed atBald Mountain and at Dee-South Arturo, where miner-alization was upgraded and expanded.
At Pueblo Viejo in the Dominican Republic, we willconduct drilling to expand mineralization between theMoore and Monte Negro pits, and follow up with infilland extension drilling to test regional targets.
2007 OpportunitiesWe anticipate steady operations at our existing sites,where we focus on operational excellence and cost con-tainment. We will continue to look for ways to optimizeuse of our processing facilities at Goldstrike so that wecan expand their range of profitable operations – withtoll milling of ore, for example – and leverage ourinvestment in that infrastructure.
At Cor te z Hi l l s , we p l an to comple te theEnvironmental Impact Study this year and expect toreceive a Record of Decision enabling the start ofpre-production waste stripping in 2008.
At Pueblo Viejo, our 2007 goals are to optimize themine plan, update the EIS, conduct detailed engineer-ing to facilitate sectoral permits, and finalize govern-ment negotiations in advance of providing a Notice toProceed by February 2008.
At Donlin Creek in Alaska, our focus is to deliver a feasibility study to our joint-venture partner and fulfillthe back-in requirements to earn a 70% interest. We willcontinue drilling to increase and upgrade the 20 millionounces of measured and indicated resources.

CHILE ARGENTINA
PERU
South America
38million ounces of proven and probable reserves
Regional Business Unit
18 � Regional Business Units – South America Barrick Annual Review 200618 � Regional Business Units – South America
� Lagunas Norte (Peru) exceeded expectations,
producing 1.1 million ounces of gold at total
cash costs of $100 per ounce
� Veladero (Argentina) produced 511,000 ounces
at total cash costs of $168 per ounce, achieving
the target for its first full year of operation
� Zaldívar (Chile) produced 308 million pounds of
copper at total cash costs of $0.62 per pound
� Pascua-Lama received environmental approvals
from Chile and Argentina
Regional OverviewThe start-up of our new generation of mines in 2005paid off in 2006, with the region producing moreounces, at very low total cash costs. We saw thisstrength in all our mines – established, newly built, andnewly acquired. The region is expected to produceapproximately 1.85 to 1.93 million ounces of gold in2007, at total cash costs of about $230 to $245 perounce and approximately 315 million pounds of copperat total cash costs of about $0.80 per pound.
Lagunas Norte and Veladero both had excellent per-formances in their first full year of operation. Zaldívar,our newly acquired copper mine from Placer Dome,proved a powerful addition to our portfolio, allowingthe Company to take advantage of robust copper pricesthroughout the year to generate significant cash flowand earnings. Pierina (Peru) continues to be a success,producing more than one-half million ounces of gold atlower total cash costs per ounce than anticipated.
In December, our Pascua-Lama project receivedenvironmental approval from the Argentinean govern-ment, after a thorough, intensive two-year review thatincluded detailed examination by a commission ofindependent scientific professionals. With environmen-tal approvals from both Chile and Argentina now inplace, we are developing detailed engineering plans and
1472006 Production(million ounces)
2006 Total Cash Costs(dollars per ounce)
2.1
• VeladeroPascua-Lama ▲
• Pierina• Lagunas Norte
Zaldívar •
● Mine ▲ Project

Regional Business Units – South America � 19Barrick Annual Review 2006
have begun submission of documentation to obtain thesectoral approvals and permits that are required prior toinitiating construction in either country. The Pascua-Lama project has strong support from local citizens andregional stakeholders in both countries. Pascua-Lama’sapproval in Chile, for example, has some 400 conditionsthat will ensure it is an environmentally responsibleproject. One of our objectives is to help the people inthe region find ways to grow their economy, skills andinfrastructure for long-term benefit. As a result, thislarge, long-life mine will not only contribute low costounces to Company production, it will also offer jobsand community development in the region for manyyears to come. We believe Pascua-Lama will be a modelfor sustainable, meaningful development.
Exploration With the environmental permitting of Pascua-Lamacompleted, the Company intends to resume explo-ration in the Frontera district in 2007 with a budget ofabout $30 million. New gold and copper-gold targetswhich were outlined by early stage exploration in 2006will be drill-tested in 2007.
2007 OpportunitiesOver the years, we have done extensive engineering andpermitting for one of the most significant development
projects in our history: Pascua-Lama. Now, in 2007,we expect to make further progress toward construc-tion permits.
The timing is excellent. We now have 10 years ofexperience in South America; we operate four mines inthe region, three of which we built ourselves; and wehave an excellent track record in responsible mining.We will use the power of all these resources to unlockthe value of this world-class gold-silver deposit, whichalready has 17 million ounces of proven and probablegold reserves, and a further 689 million ounces ofsilver contained within those reserves.
The pre-production capital cost estimate at Pascua-Lama has been updated from $1.4–$1.5 billion to about$2.3–$2.4 billion, reflecting inflationary pressuresaf fecting the mining industr y as wel l as designimprovements and scope changes. Once in operation,Pascua-Lama is expected to produce an average ofabout 750,000–775,000 ounces of gold and about 35 million ounces of silver a year in the first five yearsof an estimated 23-year mine life at total cash costs ofabout $40–$50 per ounce of gold (including silver credits). These cash costs are expected to be near thebottom of the operating cost curve for the industry.Pascua-Lama will benefit from existing infrastructure,processing, staffing and experience from the Veladeromine, located less than 10 kilometers away.
Pascua-Lama: Its development will benefit from our decade of experience in South America, strong local and regional community support, and existing infrastructure (including roads, water, camps, and power supply) at Veladero, just 6 kilometers away. The Veladeropit is visible, center-right above.

Regional Business Unit
20 � Regional Business Units – Australia-Pacific Barrick Annual Review 2006
Australia-Pacific
22million ounces of proven and probable reserves
� Cowal mine started operations in April 2006
� Porgera expected to be a solid producer for
years to come
� Osborne copper production expected to
increase by over 40% in 2007 to about
85 million pounds
3532006 Production(million ounces)
2006 Total Cash Costs(dollars per ounce)
2.2
Regional OverviewThe Australia-Pacific region grew in size and strengthin 2006. We now have 10 operating mines, which areexpected to produce 2.2 to 2.3 million ounces of goldin 2007, at total cash costs of $385 to $400 per ounce.
The Cowal mine entered production in late April,and is expected to produce approximately 240,000ounces of gold in 2007, at total cash costs of about $315per ounce.
In Papua New Guinea, remediation work is beingcompleted on the West Wall at Porgera. Production levels were affected by this work in 2006, and are expectednow to rise again. Barrick owns a 75% interest in thisjoint venture and operates the mine. We expect Porgerato be a solid producer for many years to come. Ourshare of reserves and resources stands at seven millionounces of proven and probable reserves, and two mil-lion ounces of measured and indicated resources.
Our Osborne mine, benefiting from higher copperprices, commissioned its first satellite project inOctober. This project will supplement ore from themine’s underground operations. Osborne is expected toproduce about 85 million pounds of copper in 2007, attotal cash costs of approximately $1.35 per pound.
TASMANIA
• Porgera
• KalgoorlieKanowna •
Lawlers • • Darlot• Granny Smith
• Plutonic
• Osborne
• Henty
PAPUANEW GUINEA
QUEENSLAND
NEW SOUTHWALES
WESTERNAUSTRALIA
Cowal •
● Mine

Regional Business Units – Australia-Pacific � 21Barrick Annual Review 2006
In 2006, our Australian business unit, in conjunctionwith our Corporate office, identified an opportunity thatled us to partner with Antofagasta plc to purchaseTethyan Copper Company. We acquired a 37.5% interestin the Reko Diq copper-gold project on the highlyprospective – and largely unexplored – Tethyan gold beltin Pakistan. The project as a whole has an indicatedresource of 15 billion pounds of copper and 10 millionounces of gold plus an inferred resource of 12 billionpounds of copper and 12 million ounces of gold. We arecurrently working with Antofagasta to advance the infilldrilling program and complete a scoping study for theproject in 2007.
Exploration Exploration in this region is focused primarily aroundour mine sites, where we can add value at existing operations. We have also begun initial exploration foriron-oxide copper-gold targets in South Australia.
Drilling at Porgera shows excellent potential forreserve additions at depth, and further laybacks to theexisting pit are also being contemplated. This potential,and the existing strong production, make Porgera avaluable part of our portfolio.
At Reko Diq in Pakistan, a 95,000 meter drill pro-gram, which commenced in the second half of 2006,will continue through 2007. The focus of this programis to confirm and upgrade resources previously definedat the Western Porphyries and Tanjeel areas, with theobjective of preparing a new resource statement.
2007 OpportunitiesOverall, the Australia-Pacific region provides Barrickwith strong, steady production from a group of stablemines. We expect production to rise in 2007, mainlybecause of higher contributions from both Cowal andPorgera. In total, this region represents over 25% of our2007 production base.
We are starting to see some stabilization of cashcosts in Australia, which have been subject to upwardpressure over the last few years because of the country’sbase metals mining boom and resulting competitionfor labor. This pressure has begun to abate, and in addi-tion we are starting to feel the benefits of the employeeretention programs that we put in place to help addressthe issue.
Our continued exploration programs and highergold prices are helping to extend the life of a number ofour mines in the region.
Cowal: Entered production in April 2006, the fourth in Barrick’s new generation of mines announced for development in 2004, and theninth we have built in the last 10 years.
22 � Regional Business Units – Africa Barrick Annual Review 2006
Africa
17million ounces of proven and probable reserves
Regional Business Unit
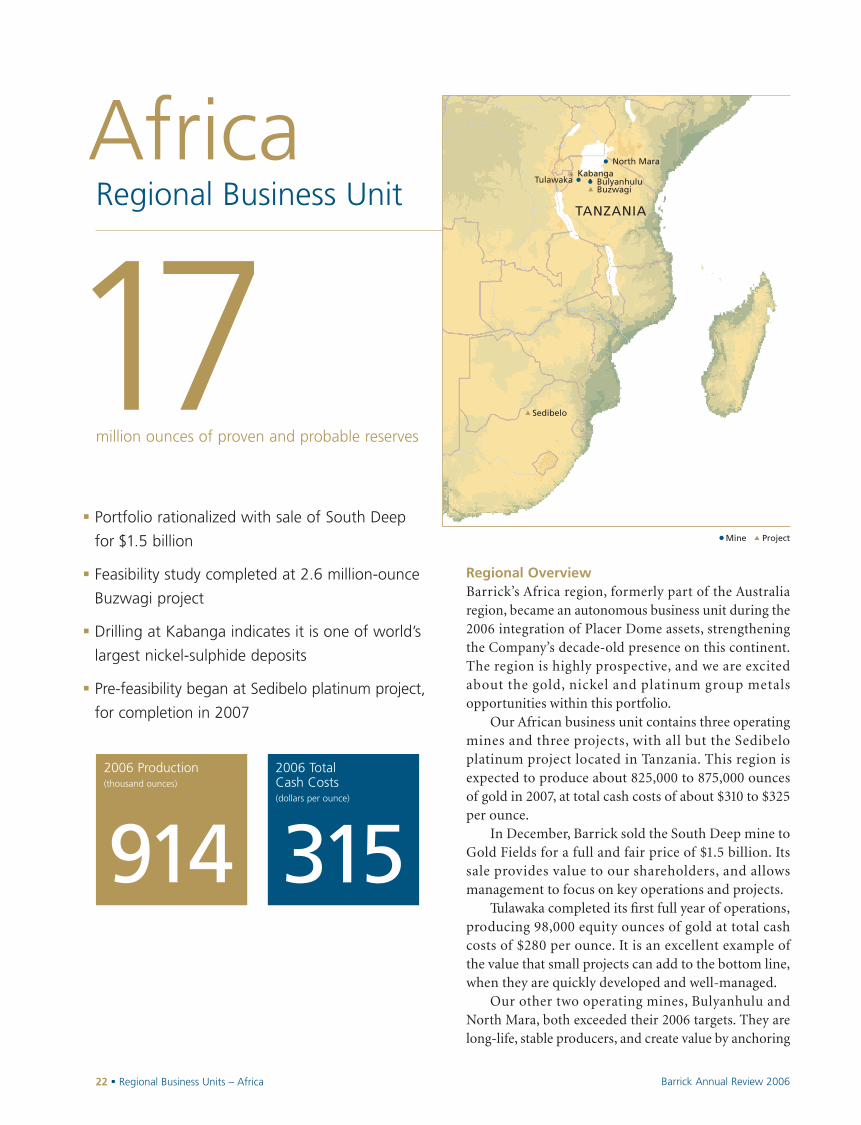
� Portfolio rationalized with sale of South Deep
for $1.5 billion
� Feasibility study completed at 2.6 million-ounce
Buzwagi project
� Drilling at Kabanga indicates it is one of world’s
largest nickel-sulphide deposits
� Pre-feasibility began at Sedibelo platinum project,
for completion in 2007
Regional OverviewBarrick’s Africa region, formerly part of the Australiaregion, became an autonomous business unit during the2006 integration of Placer Dome assets, strengtheningthe Company’s decade-old presence on this continent.The region is highly prospective, and we are excitedabout the gold, nickel and platinum group metalsopportunities within this portfolio.
Our African business unit contains three operatingmines and three projects, with all but the Sedibelo platinum project located in Tanzania. This region isexpected to produce about 825,000 to 875,000 ouncesof gold in 2007, at total cash costs of about $310 to $325per ounce.
In December, Barrick sold the South Deep mine toGold Fields for a full and fair price of $1.5 billion. Itssale provides value to our shareholders, and allowsmanagement to focus on key operations and projects.
Tulawaka completed its first full year of operations,producing 98,000 equity ounces of gold at total cashcosts of $280 per ounce. It is an excellent example ofthe value that small projects can add to the bottom line,when they are quickly developed and well-managed.
Our other two operating mines, Bulyanhulu andNorth Mara, both exceeded their 2006 targets. They arelong-life, stable producers, and create value by anchoring
3152006 Production(thousand ounces)
2006 Total Cash Costs(dollars per ounce)
914
▲ Kabanga• Bulyanhulu
• North Mara
Tulawaka •
TANZANIA
▲ Buzwagi
● Mine ▲ Project
▲ Sedibelo

Regional Business Units – Africa � 23Barrick Annual Review 2006
our presence in Africa. From this solid base, we havealready brought one new mine into production, and arenow steadily advancing our other projects.
Exploration In 2006, Barrick spent $22 million in this region andfocused its efforts in Tanzania with a balanced strategybetween minesite activities and grassroots explorationon the Lake Victoria greenstone belt. We advanced ourunderstanding of the underground potential at NorthMara and airborne geophysical surveys identified newregional targets that will be tested in 2007.
2007 OpportunitiesWe are encouraged by the potential we see at our threeprojects in this region.
At Kabanga, our 50% joint-venture partner, XstrataPLC, will complete the drilling program and pre-feasi-bility study begun in 2006, as part of an agreement withBarrick. As the operator, Xstrata has already spent $50 million, and is committed to spend an additional$95 million in order to complete a full feasibility study,expected in the latter part of 2008. Results to date indi-cate that Kabanga is one of the largest and highestgrade nickel-sulphide deposits in the world.
This is an excellent example of one of the methodsthat Barrick uses to realize the value of assets within theportfolio. Initial work by our exploration teams at
Kabanga, which was part of the Sutton Resources trans-action, demonstrated a significant resource. We thenpartnered with a leading nickel company, whoseexpertise will allow us to maximize the opportunity itrepresents for our investors.
In 2006, we completed a feasibility study and anEnvironmental Impact Assessment (EIA) at Buzwagi.This gold project, close to the Bulyanhulu mine, has 2.6million ounces of proven and probable reserves, and anadditional 0.4 million ounces of measured and indi-cated resources. A major milestone was reached inFebruary 2007 when we signed a Mineral DevelopmentAgreement (MDA) with the Tanzanian government. In2007, we expect to complete a detailed constructiondesign and receive EIA approval.
We expect to complete the Sedibelo pre-feasibilitystudy during 2007. Barrick has the right to earn into a 50% interest in this platinum-palladium project in South Africa. The deposit contains measured andindicated resources of 3.8 million ounces of platinumand 1.7 million ounces of palladium. Sedibelo islocated in the Bushveld Complex, one of the world’smost prolific platinum districts, and has excellent economic potential. Drilling will continue for most of2007 to confirm additional targets in the lease area. Ourpartner on this project is a local South African tribe,whose 50% ownership significantly exceeds localrequirements for Black Economic Empowerment.
Tulawaka: A small but high-return open pit mine that strengthens our presence on Tanzania’s highly prospective Lake Victoria green-stone belt. Buzwagi, our new project on the belt, will benefit from experience gained building Tulawaka, plus shared infrastructure andtraining and manpower opportunities.

24 � Board of Directors and Senior Officers Barrick Annual Review 2006
Board of Directors and Senior Officers
Howard L. Beck, Q.C.Toronto, OntarioCorporate Director
C. William D. BirchallToronto, OntarioVice Chairman,
Barrick Gold Corporation
Donald J. Carty, O.C.Dallas, TexasVice Chairman and
Chief Financial Officer,
Dell, Inc.
Gustavo CisnerosCaracas, VenezuelaChairman and
Chief Executive Officer,
Cisneros Group of Companies
Marshall A. Cohen, O.C.Toronto, OntarioCounsel,
Cassels Brock & Blackwell LLP
Peter A. Crossgrove, O.C.Toronto, OntarioCorporate Director
John W. CrowToronto, OntarioPresident, J&R Crow Inc.
Robert M. FranklinToronto, OntarioPresident, Signalta Capital
Corporation
Peter C. Godsoe, O.C.Toronto, OntarioCorporate Director
J. Brett HarveyVenetia, PennsylvaniaPresident, Chief Executive
Officer and Director,
CONSOL Energy Inc.
The Right HonourableBrian Mulroney, P.C.,C.C., LL.D.Montreal, QuebecSenior Partner, Ogilvy Renault
Anthony MunkNew York, New YorkManaging Director,
Onex Investment Corp.
Peter Munk, O.C.Toronto, OntarioFounder and Chairman,
Barrick Gold Corporation
Joseph L. Rotman, O.C.Toronto, OntarioChairman,
Roy-L Capital Corporation
Steven J. ShapiroHouston, TexasCorporate Director
Gregory C. WilkinsToronto, OntarioPresident and
Chief Executive Officer,
Barrick Gold Corporation
Board of Directors
Senior Officers
Peter MunkFounder and Chairman
C. William D. BirchallVice Chairman
Gregory C. WilkinsPresident andChief Executive Officer
Alexander J. DavidsonExecutive Vice President,Exploration andCorporate Development
Gordon F. FifeExecutive Vice President,Organizational Effectiveness
Patrick J. GarverExecutive Vice Presidentand General Counsel
Peter J. KinverExecutive Vice Presidentand Chief Operating Officer
Jamie C. SokalskyExecutive Vice Presidentand Chief Financial Officer
Vincent BorgSenior Vice President,Corporate Communications
Kelvin DushniskySenior Vice President,Corporate Affairs
International Advisory Board
The International Advisory Board was established to provide advice to Barrick’s Board of Directors and management as the Company expands internationally.
Chairman
The Right HonourableBrian MulroneyFormer Prime Minister of Canada
Members
Gustavo CisnerosVenezuela
Secretary William S. CohenUnited States
The Honourable Paul G. Desmarais, Sr.Canada
Vernon E. Jordan, Jr.United States
Andrónico LuksicChile
Angus A. MacNaughtonUnited States
Peter MunkCanada
Karl Otto PöhlGermany
Lord Charles Powell ofBayswater KCMGUnited Kingdom
The Honourable Nathaniel RothschildUnited Kingdom
The Honorable Andrew YoungUnited States

Proven and Measured andProbable Reserves Indicated Resources
Gold (mm ozs)
North America 46 15South America 38 6Australia-Pacific 22 12 Africa 17 2
Total 123 35
Other MetalsCopper (bn lbs) 6.0 6.6Nickel (mm lbs) – 254Platinum (000s ozs) – 262Palladium (000s ozs) – 1,073
Measured andOther Metals Contained In: Proven and Probable Indicated
Gold Reserves Gold Resources
Silver (mm ozs) 964 48Copper (bn lbs) 1.2 –Zinc (mm lbs) 1,555 48
The company expects 2007 gold production of 8.1 to 8.4 million ounces and copper production of approximately 400 million pounds. Total cash costs are expected to be in the range of $335 to $350 per ounce for gold and about $0.90 per pound for copper. Gold production is expected to be slightly weighted to the second half of 2007.
1. Mineral reserves (“reserves”) and mineral resources (“resources”) have been calculated as at December 31, 2006 in accordance with National Instrument 43-101 as required by Canadian securities regulatory authorities. For United States report-ing purposes, Industry Guide 7, (under the Securities and Exchange Act of 1934), as interpreted by Staff of the SEC, applies different standards in order to classify mineralization as a reserve. Accordingly, for U.S. reporting purposes, 1.88 millionounces of the Cortez reserve, Buzwagi and Pueblo Viejo are classified as mineralized material. In addition, while the terms “measured”, “indicated” and “inferred” mineral resources are required pursuant to National Instrument 43-101, the U.S.Securities and Exchange Commission does not recognize such terms. Canadian standards differ significantly from the requirements of the U.S. Securities and Exchange Commission, and mineral resource information contained herein is not com-parable to similar information regarding mineral reserves disclosed in accordance with the requirements of the U.S. Securities and Exchange Commission. U.S. investors should understand that “inferred” mineral resources have a great amount ofuncertainty as to their existence and great uncertainty as to their economic and legal feasibility. In addition, U.S. investors are cautioned not to assume that any part or all of Barrick’s mineral resources constitute or will be converted into reserves.Calculations have been prepared by employees of Barrick, its joint venture partners or its joint venture operating companies, as applicable, under the supervision of Jacques McMullen, Vice President, Metallurgy and Process Development ofBarrick, Rick Allan, Director – Engineering and Mining Support of Barrick, and Rick Sims, Manager Corporate Reserves of Barrick. Reserves have been calculated using an assumed long-term average gold price of $US 475 ($Aus. 640) per ounce,a silver price of $US 8.50 per ounce, a copper price of $US 1.50 per pound and exchange rates of $1.21 $Can/$US and $0.74 $US/$Aus. Reserves at the Kalgoorlie property assumed a gold price of $US 500 ($Aus. 675). Copper reserves at theOsborne property assumed a copper price of $US 1.75 per pound. Reserve calculations incorporate current and/or expected mine plans and cost levels at each property. Varying cut-off grades have been used depending on the mine and type ofore contained in the reserves. Barrick’s normal data verification procedures have been employed in connection with the calculations. Resources as at December 31, 2006 have been estimated using varying cut-off grades, depending on both thetype of mine or project, its maturity and ore types at each property. For a breakdown of reserves and resources by category and for a more detailed description of the key assumptions, parameters and methods used in calculating Barrick’sreserves and resources, see Barrick’s most recent Annual Information Form/Form 40-F on file with Canadian provincial securities regulatory authorities and the U.S. Securities and Exchange Commission.
2. Gold and copper resource estimates for Reko Diq have been prepared by employees and consultants of Tethyan Copper Company Limited (“Tethyan”) in accordance with the JORC Code. For additional information related to Reko Diq resourcesreported by Tethyan, including related assumptions, see Tethyan’s press release dated January 11, 2006 and its 2005 Fourth Quarter Report. Such resource estimates have been reviewed by Jacques McMullen, Vice President, Metallurgy andProcess Development of Barrick, Rick Allan, Director – Engineering and Mining Support of Barrick, and Rick Sims, Manager Corporate Reserves of Barrick. The inferred and indicated mineral resource amounts reported under the JORC Code aresubstantially similar to the inferred and indicated mineral resource amounts that would be reported in accordance with National Instrument 43-101.
Reserves and Resources as of December 31, 2006 1, 2
BarrickNowAnnual Review 2006
www.barrick.comCorporate Office BCE Place TD Canada Trust Tower 161 Bay Street,Suite 3700 P.O.Box 212 Toronto, Canada M5J 2S1
Tel:416-861-9911 Fax:416-861-2492

Certain information contained or incorporated by reference in this Annual Report 2006, including any information asto our future financial or operating performance, constitutes “forward-looking statements”. All statements, other thanstatements of historical fact, are forward-looking statements. The words “believe”, “expect”, “anticipate”, “contemplate”, “target”, “plan”, “intends“, “continue”, “budget”, “estimate“, “may”, “will”, “schedule” and sim-ilar expressions identify forward-looking statements. Forward-looking statements are necessarily based upon a number of estimates and assumptions that, while considered reasonable by us, are inherently subject to significant business,economic and competitive uncertainties and contingencies. Known and unknown factors could cause actual results todiffer materially from those projected in the forward-looking statements. Such factors include, but are not limited to:fluctuations in the currency markets (such as Canadian and Australian dollars, South African rand, Chilean Peso andPapua New Guinean kina versus US dollar); fluctuations in the spot and forward price of gold and copper or certainother commodities (such as silver, diesel fuel and electricity); changes in US dollar interest rates or gold lease rates thatcould impact the mark-to-market value of outstanding derivative instruments and ongoing payments/receipts underinterest rate swaps and variable rate debt obligations; risks arising from holding derivative instruments (such as creditrisk, market liquidity risk and mark-to-market risk); changes in national and local government legislation, taxation, con-trols, regulations and political or economic developments in Canada, the United States, Dominican Republic, Australia,Papua New Guinea, Chile, Peru, Argentina, South Africa, Tanzania, Russia, Pakistan or Barbados or other countries in which we do or may carry on business in the future; business opportunities that may be presented to, or pursuedby, us; our ability to successfully integrate acquisitions; operating or technical difficulties in connection with mining or development activities; employee relations; litigation; the speculative nature of exploration and development,including the risks of obtaining necessary licenses and permits; diminishing quantities or grades of reserves; adversechanges in our credit rating; and contests over title to properties, particularly title to undeveloped properties. In addi-tion, there are risks and hazards associated with the business of exploration, development and mining, includingenvironmental hazards, industrial accidents, unusual or unexpected formations, pressures, cave-ins, flooding and goldbullion or copper cathode losses (and the risk of inadequate insurance, or inability to obtain insurance, to cover theserisks). Many of these uncertainties and contingencies can affect our actual results and could cause actual results to differ materially from those expressed or implied in any forward-looking statements made by, or on behalf of, us.Readers are cautioned that forward-looking statements are not guarantees of future performance. All of the forward-looking statements made in this Annual Report 2006 are qualified by these cautionary statements. Specific referenceis made to Barrick’s most recent Form 40-F/Annual Information Form on file with the SEC and Canadian provincialsecurities regulatory authorities for a discussion of some of the factors underlying forward-looking statements.
We disclaim any intention or obligation to update or revise any forward-looking statements whether as a result of newinformation, future events or otherwise, except to the extent required by applicable laws.
Cautionary Statement on Forward-Looking Information
Ove
Des
ign
& C
omm
unic
atio
ns L
td.
/
Mov
eabl
e In
c.
/ B
owne
of
Can
ada,
Ltd
.
TABLE OF CONTENTS
1 Financial Highlights2 Letter to Shareholders6 Barrick Now
Barrick TodayBarrick in 2006Barrick in 2007
10 Barrick Projects12 Responsible Mining14 Financial Strategy
16 Regional Business UnitsNorth AmericaSouth AmericaAustralia-PacificAfrica
24 Corporate Directory
The 2006 Annual Report consists of the 2006 Annual Review and the 2006 Financial Report.
Barrick’s vision is to be the world’s best goldcompany by finding, acquiring, developingand producing quality reserves in a safe, profitable and socially responsible manner.
The Company’s quality assets and its unrivalled project pipeline, combined with the strength of its balance sheet and the talents of its people, position Barrick to deliver significant value to its shareholders.

Proven and Measured andProbable Reserves Indicated Resources
Gold (mm ozs)
North America 46 15South America 38 6Australia-Pacific 22 12 Africa 17 2
Total 123 35
Other MetalsCopper (bn lbs) 6.0 6.6Nickel (mm lbs) – 254Platinum (000s ozs) – 262Palladium (000s ozs) – 1,073
Measured andOther Metals Contained In: Proven and Probable Indicated
Gold Reserves Gold Resources
Silver (mm ozs) 964 48Copper (bn lbs) 1.2 –Zinc (mm lbs) 1,555 48
The company expects 2007 gold production of 8.1 to 8.4 million ounces and copper production of approximately 400 million pounds. Total cash costs are expected to be in the range of $335 to $350 per ounce for gold and about $0.90 per pound for copper. Gold production is expected to be slightly weighted to the second half of 2007.
1. Mineral reserves (“reserves”) and mineral resources (“resources”) have been calculated as at December 31, 2006 in accordance with National Instrument 43-101 as required by Canadian securities regulatory authorities. For United States report-ing purposes, Industry Guide 7, (under the Securities and Exchange Act of 1934), as interpreted by Staff of the SEC, applies different standards in order to classify mineralization as a reserve. Accordingly, for U.S. reporting purposes, 1.88 millionounces of the Cortez reserve, Buzwagi and Pueblo Viejo are classified as mineralized material. In addition, while the terms “measured”, “indicated” and “inferred” mineral resources are required pursuant to National Instrument 43-101, the U.S.Securities and Exchange Commission does not recognize such terms. Canadian standards differ significantly from the requirements of the U.S. Securities and Exchange Commission, and mineral resource information contained herein is not com-parable to similar information regarding mineral reserves disclosed in accordance with the requirements of the U.S. Securities and Exchange Commission. U.S. investors should understand that “inferred” mineral resources have a great amount ofuncertainty as to their existence and great uncertainty as to their economic and legal feasibility. In addition, U.S. investors are cautioned not to assume that any part or all of Barrick’s mineral resources constitute or will be converted into reserves.Calculations have been prepared by employees of Barrick, its joint venture partners or its joint venture operating companies, as applicable, under the supervision of Jacques McMullen, Vice President, Metallurgy and Process Development ofBarrick, Rick Allan, Director – Engineering and Mining Support of Barrick, and Rick Sims, Manager Corporate Reserves of Barrick. Reserves have been calculated using an assumed long-term average gold price of $US 475 ($Aus. 640) per ounce,a silver price of $US 8.50 per ounce, a copper price of $US 1.50 per pound and exchange rates of $1.21 $Can/$US and $0.74 $US/$Aus. Reserves at the Kalgoorlie property assumed a gold price of $US 500 ($Aus. 675). Copper reserves at theOsborne property assumed a copper price of $US 1.75 per pound. Reserve calculations incorporate current and/or expected mine plans and cost levels at each property. Varying cut-off grades have been used depending on the mine and type ofore contained in the reserves. Barrick’s normal data verification procedures have been employed in connection with the calculations. Resources as at December 31, 2006 have been estimated using varying cut-off grades, depending on both thetype of mine or project, its maturity and ore types at each property. For a breakdown of reserves and resources by category and for a more detailed description of the key assumptions, parameters and methods used in calculating Barrick’sreserves and resources, see Barrick’s most recent Annual Information Form/Form 40-F on file with Canadian provincial securities regulatory authorities and the U.S. Securities and Exchange Commission.
2. Gold and copper resource estimates for Reko Diq have been prepared by employees and consultants of Tethyan Copper Company Limited (“Tethyan”) in accordance with the JORC Code. For additional information related to Reko Diq resourcesreported by Tethyan, including related assumptions, see Tethyan’s press release dated January 11, 2006 and its 2005 Fourth Quarter Report. Such resource estimates have been reviewed by Jacques McMullen, Vice President, Metallurgy andProcess Development of Barrick, Rick Allan, Director – Engineering and Mining Support of Barrick, and Rick Sims, Manager Corporate Reserves of Barrick. The inferred and indicated mineral resource amounts reported under the JORC Code aresubstantially similar to the inferred and indicated mineral resource amounts that would be reported in accordance with National Instrument 43-101.
Reserves and Resources as of December 31, 2006 1, 2
BarrickNowAnnual Review 2006
www.barrick.comCorporate Office BCE Place TD Canada Trust Tower 161 Bay Street,Suite 3700 P.O.Box 212 Toronto, Canada M5J 2S1
Tel:416-861-9911 Fax:416-861-2492

BarrickNowFinancial Report 2006

TABLE OF CONTENTS
1 Management’s Discussionand Analysis
73 Financial Statements
77 Notes to ConsolidatedFinancial Statements
128 Mineral Reserves and Resources
137 Corporate Governance andCommittees of the Board
138 Shareholder Information
140 Board of Directors and Senior Officers
The 2006 Annual Report consists of the Annual Review 2006 and this Financial Report 2006

This MD&A is intended to help the reader understandBarrick Gold Corporation (“Barrick”, “we”, “our” orthe “Company”), our operations, financial perfor-mance and present and future business environment.It includes the following sections:� Our Business – a general description of our core
business; our vision and strategy; our capability toexecute our strategy; and key economic trends inour present business environment.� Operations Review – an analysis of our consoli-
dated results of operations for the last three yearsfocusing on our material operating segments andthe outlook for 2007.� Liquidity, Capital Resources and Financial Position –
an analysis of cash flows; sources and uses of cash;contractual obligations and commitments; ourfinancial position; financial instruments; and off-balance sheet arrangements.� Critical Accounting Policies and Estimates –
a discussion of accounting policies that requirecritical judgments and estimates.
This MD&A, which has been prepared as of February 21,2007, is intended to supplement and complement ouraudited consolidated financial statements and notes
thereto for the year ended December 31, 2006 preparedin accordance with United States generally acceptedaccounting principles, or US GAAP (collectively, our“Financial Statements”). You are encouraged to reviewour Financial Statements in conjunction with yourreview of this MD&A. Additional information relatingto our Company, including our most recent AnnualInformation Form, is avai lable on SEDAR atwww.sedar.com and on EDGAR at www.sec.gov. For anexplanation of terminology used in our MD&A that isunique to the mining industry, readers should refer tothe glossary on page 66. All dollar amounts in ourMD&A are in US dollars, unless otherwise specified.
For the purposes of preparing our MD&A, weconsider the materiality of information. Informationis considered material if: (i) such information resultsin, or would reasonably be expected to result in,a significant change in the market price or value of ourshares; or (ii) there is a substantial likelihood that a reasonable investor would consider it important in making an investment decision; or (iii) if it wouldsignificantly alter the total mix of information avail-able to investors. We evaluate materiality with refer-ence to all relevant circumstances, including potentialmarket sensitivity.
Management’s Discussion and Analysis � 1Barrick Financial Report 2006
Management’s Discussion and Analysis (“MD&A”)
2 Our Business
2 Core Business2 Vision and Strategy4 Capability to Execute our Strategy7 Key Economic Trends
14 Operations Review
15 Executive Overview and 2007 Outlook17 Acquisitions and Divestitures20 Consolidated Gold and Copper Production,
Sales and Costs21 Results of Operating Segments34 Total Cash Costs Performance Measures37 Other Costs and Expenses
43 Quarterly Information44 Fourth Quarter Results45 Liquidity, Capital Resources and Financial Position
45 Cash Flow47 Liquidity48 Financial Position49 Contractual Obligations and Commitments51 Financial Instruments52 Off-Balance Sheet Arrangements55 Critical Accounting Policies and Estimates
65 Cautionary Statement on Forward-Looking Information
66 Glossary of Technical Terms
Contents

Our Business
Core BusinessWe are the world’s preeminent gold mining companyin terms of market capitalization, annual gold produc-tion and gold reserves. In early 2006, we completedthe acquisition of Placer Dome Inc. (“Placer Dome”),which resulted in a significant increase in the scale ofour mining operations. The acquisition of PlacerDome also added significant copper reserves at twomines, Zaldívar in Chile and Osborne in Australia.Further details of the Placer Dome acquisition can befound on page 17.
We generate revenue and cash flow from the pro-duction and sale of gold and copper. We sell our pro-duction in the world market through three primarydistribution channels: gold bullion is sold in the goldspot market; gold and copper concentrate is sold toindependent smelting companies; and gold bullionand copper cathode is sold under gold and coppercathode sales contracts between ourselves and variousthird parties.
Gold Produced by Region in 2006
North America 39%
Africa 11%
South America 24%
Australia Pacific 26%
Vision and StrategyOur vision is to be the world’s best gold mining com-pany by finding, acquiring, developing and producingquality reserves in a safe, profitable and socially respon-sible manner.
Our goal is to create value for our shareholders.We reinvest cash flow from our mines in exploration,development projects and other investments to worktowards the long-term sustainability of our business,to generate cash flow, and to provide leverage to goldprices through gold production and replacement of our reserve/resource base. It can take a number of years for a project to move from the explorationstage through to mine construction and production.Our business strategy reflects this long lead time byensuring that we have a strong project pipeline, whileeffectively managing current operations.
In 2005, we set our 2006 strategy, which focusedon growth in reserves and production, operationalexcellence, strengthening the organization andresponsible mining. Our successes in each of theseareas, including the successful integration of PlacerDome into Barrick, have laid the foundation for our2007 key areas of focus: share price performance,responsible mining and building and maintaining a high performance organization.
2 � Management’s Discussion and Analysis Barrick Financial Report 2006

Management’s Discussion and Analysis � 3Barrick Financial Report 2006
2006 Strategic Objectives 2006 Results 2007 Strategic Objectives
Growth in reserves and production� Growth at existing mine sites by finding
new reserves and converting mineralizedmaterial to reserves� Growth through successful exploration
focusing principally in key explorationdistricts � Growth through targeted acquisitions� Advance the development of Cowal,
Pascua-Lama, Ruby Hill and Buzwagi as well as newly acquired Placer Domeprojects, including Pueblo Viejo, Cortez Hills, Donlin Creek and Sedibelo
� Met market guidance for production� Benefited from an excellent first full year
of production at 3 new mines and broughtthe Cowal mine into production � Advanced all of our major projects� Achieved reserve growth through
exploration discoveries� Completed Placer Dome acquisition, sale
of assets to Goldcorp Inc. (“Goldcorp”),South Deep sale, and Reko Diq acquisition� Research and development successes that
are expected to enhance project economics � Realigned Russian business strategy
Share price performance� Grow the business through a combination
of opportunistic acquisitions, new depositdiscoveries and replacement of reserves and resources� Advance project pipeline through
achievement of milestones, prioritization and effective sequencing� Strong financial management, including
hedge book management, balance sheetoptimization and realizing additional Placer Dome acquisition synergies� Operational excellence focused on meeting
production and cost targets, realizing savingsfrom ongoing continuous improvementinitiatives, and increased focus on R&D� Advance opportunities for vertical
integration and effective consumablesmanagement
Operational excellence� Control costs� Global supply chain management
(such as extending tire life and evaluating alternatives for supply)� Continuous improvement initiatives� Currency, interest rate and commodity
hedge programs� Effective assessment and management
of risk� Effective capital allocation� Secure efficient sources of funding
for capital
� Met market guidance for total cash costs � Effective program of hedging and managing
production cost risks, such as currencyexchange rates, fuel and power� Successfully reduced fixed-price Corporate
Gold Sales Contracts and eliminatedacquired Placer Dome hedge position� Continuous improvement initiatives ongoing
to mitigate cost pressures, increasethroughput and quality improvements� Launched capital allocation process
improvements including new approvalsprocess and tracking system� Issued $1 billion of copper-linked notes
and increased credit facility from $1.0 to$1.5 billion
Strengthen the organization� Workforce – identify and develop talent� Leadership development and succession
planning� Adopt best practices in corporate
governance, including strengthening internal control over financial reporting
� Successful integration of Placer Dome across all regions and functions, includingcultural integration� Leadership development and succession
plans completed for key leaders � Achieved targets in developing compliance
and governance capabilities
High performance organization� Leadership development� Optimization of business processes such
as planning project management and risk management� Technology improvements to increase
automation and control costs� Effective capital management through
prioritization, capital allocation and value measurement� Compliance with business code of
conduct and applicable corporategovernance legislation
Responsible mining� Reinforce health and safety culture� Enhance environmental performance,
including use of innovative technology to protect the environment� Maintain positive community and
government relations
� Courageous Safety Leadership programrolled out across Barrick� Focus on contractor safety resulted in 40%
reduction of incidents over 2005� Developed and adopted Corporate Social
Responsibility (“CSR”) guidelines acrossBarrick� Expanded Non-Governmental
Organizations (“NGO”) partnerships� Improved ratings on Dow Jones
Sustainability Index� Recipient of 2006 CME/CIDA Award for
Excellence in CSR
Responsible mining� Achieve safety and health performance
targets� Effective government relations and
community engagement� Environmental leadership through energy
and conservation strategy

Capability to Execute our StrategyOur capability to execute our strategy comes from the strength of our regional business unit structure,our experienced management team and a strong proj-ect pipeline that ensures long-term sustainability ofthe business.
Regional Business Unit StructureWe manage our business using a regional businessunit (“RBU”) structure. We have four RBUs: NorthAmerica, South America, Australia Pacific, and Africa.Each region receives direction from the CorporateOffice, but has responsibility for all aspects of its business such as strategy and sustainability of miningoperations, including exploration, development, con-struction, production and closure. Each team is led by its own Regional President, with oversight by theCorporate Office. Each region has two overridingresponsibilities: to optimize current assets and to growits business.
Each RBU essentially operates as a business unitand contains the fol lowing functional groups:Technical Services; Legal; Organizational Effective-ness, including Human Resources and ContinuousImprovement; Finance; Operations Support; Commu-nications; Exploration; Business Development; andGovernmental Relations. Since their inception, theRBUs have added significant value to our business byrealizing operational efficiencies in the region, allocat-ing resources more effectively and understanding andbetter managing the local business environment,including labor, consumable costs and supply, andgovernment and community relations. In a period of inflationary cost pressures experienced by the min-ing industry, we believe that our RBU structure hasallowed us to better deal with the challenges andissues impacting our industry. Furthermore, thisstructure served us well for the integration of PlacerDome, which was successful and substantially com-plete by the end of second quarter 2006.
In fourth quarter 2006, on closing of a transactionto vend-in our Russian gold assets to Highland GoldMining Ltd. (“Highland”), we concluded that we nolonger had a Russia/Central Asia operating segmentand our segment disclosure in our Financial Statementshas been revised to exclude Russia/Central Asia.
Experienced Management Team and Skilled WorkforceWe have an experienced management team with aproven track record in the mining industry. Strongleadership and governance are critical to the success-ful implementation of our core strategies. We continueto focus on leadership development for key membersof our executive, senior mine management and front-line management. A skilled workforce has a significantimpact on the efficiency and effectiveness of our oper-ations. The remote nature of many of our mine sites,as well as strong competition for human resources,presents challenges in maintaining a well-trained andskilled workforce. We continue to focus our efforts onemployee retention, recruiting skilled employees andpositive labor relations, including training programs,leadership development and succession planning. In2006, we completed the implementation of a HumanResource information system to help us effectivelymanage the impact our workforce has on our miningoperations.
Advanced Exploration and Project PipelineOur pipeline of advanced exploration and develop-ment projects represents a critical component to ourlong-term strategy of growing the business. We andothers in the mining industry face the challenges asso-ciated with finding, acquiring and developing projects.An economic discovery is no longer a guarantee of anew mine, as considerable opposition to new miningprojects can develop from institutional NGOs orunstable political climates. The development of a newmine requires successful permitting and governmentrelations, community dialogue and engagement, andsignificant financial and human capital. The size,breadth and scale of a company such as ours, coupledwith our regional structure, enhances our prospectsfor success; however, the timeline for developing proj-ects has increased significantly.
During 2004, we were focused on building our newmines and laying the groundwork for growth in ourproduction. In 2005, we began to realize that growth, asour new mines, Tulawaka, Lagunas Norte and Veladeroentered production. In 2006, our newest mine, Cowal,began production and our Pascua-Lama projectreceived necessary environmental approvals in Chile
4 � Management’s Discussion and Analysis Barrick Financial Report 2006

and Argentina. We also completed a feasibility study forBuzwagi in Tanzania and are awaiting approval of theEnvironmental Impact Assessment (“EIA”).
In 2006, we acquired Placer Dome, and with thatacquisition, added four significant exploration andadvanced stage projects to our project pipeline: CortezHills, Donlin Creek in North America; Pueblo Viejo inthe Dominican Republic; and Sedibelo, a platinumdeposit in South Africa. With this significant pipelineof projects, we are expanding our staff capacity.During the year, efforts were undertaken to quantifythe expected requirements. Initiatives to meet theseneeds have now commenced through programs suchas our Engineers-in-Training Program.
In addition to the focus on personnel, enhance-ments to systems and business processes are ongoingand will help to improve operating and cost visibility.We expect that these improvements will allow us tomore easily identify value-creating opportunities inexisting operating sites, development projects andrelated merger and acquisition activity. The improve-ments should allow better information sharing andthe ability to benchmark operating activities so thatbest practices can be applied from our most efficientoperations. For example, a detailed cost benchmark-ing exercise was completed for open pit mining in2006 that led to the identification of improvementopportunities at a number of our mine sites.
Technical innovation is also being pursued, utiliz-ing our in-house research and development (“R&D”)lab. Certain of our projects have realized benefits as are sult of this R&D work, which has producedmodified process flow designs that yield enhancedgold and metal by-product recoveries. An example ofthis is the change in metallurgical process design atPueblo Viejo to improve recoveries of silver and zincthat we expect will have a positive impact on projecteconomics. We increased our budget for R&D to $20 million in 2007 from about $8 million spent in2006 to support the various ongoing initiatives.
Cost Control and Supply SourcingIn 2006, our supply chain focus was on implementinglong-term cost control and sourcing strategies formajor consumables and supplies used in our miningactivities through global commodity purchasingteams. We also focused on mitigating the impact thatglobal shortages of commodities such as tires andcyanide have on our operations through implementa-tion of long-term supply arrangements for theseitems. We have developed processes and systems tomonitor usage and supply of tires at our mine sitesthat enable reallocation of tires between sites wherenecessary. In 2007, we plan to continue to implementcost control and sourcing strategies for consumablesand supplies.
Energy costs, which include costs for electricalenergy, diesel fuel, natural gas, propane, explosivesand some energy costs embedded into maintenanceand contractor services, account for approximately30% of our total cash operating costs. In 2006, welaunched a strategic effort to design and implement acompany-wide, sustainable energy management pro-gram that will pursue demand management, operat-ing effic ienc ie s and inve stment in generat ingcapability. In 2007, our goal is to manage our demandand seek to realize annual energy efficiency savings.We plan to review new technologies and analyze cur-rent practices to look for energy efficiency opportuni-ties, as well as look to alternative, cleaner sources ofenergy, possibly including solar or geothermal energy.We also continue to review opportunities to increaseour generating capability, including renewable energyprojects such as the commissioning of our first 2-megawatt wind turbine at Veladero later in 2007.
Many of our development projects reside in areaswhere the energy infrastructure is either nonexistentor severely stretched due to a lack of investment. Theimplementation of energy solutions to support ourdevelopment activities is a significant opportunity forus to manage a large portion of future operatingexpenses and provide long-lasting infrastructure forour mining activities. For example, in 2005, we built agas-fired power plant in Nevada, which provides significant cost benefits to the Goldstrike property(see page 12 under Electricity).
Management’s Discussion and Analysis � 5Barrick Financial Report 2006

Maintenance ProgramMaintenance costs (including maintenance labor) rep-resents about 30% of total cash operating costs at ourmines. The cost of maintenance is not only a functionof the price paid for parts and labor, but can also varyconsiderably depending on whether the maintenanceis planned or unplanned, with unplanned mainte-nance being the more costly. We are designing a globalmaintenance program to support our operating minesand projects in the adoption of best practices to achieveoptimal mine equipment performance and to enablecost-effective on-site maintenance.
In 2006, our maintenance group supported vari-ous programs, including: maintenance trades trainingand certification (e.g. mechanics, welders) for ouremployees in Africa; implementation of a reportingsystem for key maintenance performance indicatorsfor mines in Australia Pacific; establishment of aregional-based reliability engineering team and testlaboratory in North America to investigate the poten-tial benefits of establishing regional-based laborato-ries and training facilities; and implementation of anupgraded electronic asset management system inSouth America.
In 2007, areas of focus for our maintenance groupinclude standardized polic ies , procedures andprocesses for asset management; the introduction ofnew technology and programs to improve mainte-nance productivity; and setting standards for theimplementation of a global enterprise asset manage-ment system.
Continuous ImprovementOur Continuous Improvement (“CI”) group’s vision isto achieve operational excellence and a company cul-ture that engages every employee in improvementevery day. We have a global network of Barrick employ-ees across all sites that focus on CI in all key aspects ofour business. Structured problem-solving and planningmethodologies are used extensively to help identify and execute improvement initiatives while fosteringcompany-wide learning through knowledge-sharing.Implementation of CI initiatives has led to significantvalue creation to Barrick in terms of cost mitigation,throughput increases and quality improvements.
Environmental, Health and Safety Responsible mining is one of our key strategic objec-tives. As part of our commitment to responsible min-ing, we focus on continuously improving health andsafety programs, systems and resources to help controlworkplace hazards. Continuous monitoring and inte-gration of health and safety into decision-makingenables us to operate effectively, while also focusing onhealth and safety. In 2006, we completed a review ofthe Safety and Health System and Standards, withimplementation commencing in 2007; we completedtraining of former Placer Dome supervisory and man-agement-level employees in our “Courageous Leader-ship for Safety and Health” program; we instituted riskand change management processes including riskassessments; and we established contractor safety controls across all regions. Key areas of focus for 2007will include: courageous safety leadership develop-ment for the remainder of the hourly personnel;implementation of the Gold Standards, which aresecurity standards by which we handle and protect thegold from the point the gold is mined to the pointwhen it is processed and shipped; identification ofsignificant health issues; continued focus on risk andchange management; and continuing communicationof a safety culture as part of our core values.
We are subject to extensive laws and regulationsgoverning the protection of the environment, use ofwater, endangered and protected species, waste dis-posal, mine closure and reclamation and worker health and safety. We seek to continuously implementoperational improvements to enhance environmentalperformance. Our Environmental, Health, Safety andSustainability Executive Committee is responsible formonitoring and reviewing environmental, safety andhealth policies and programs, assessing performanceand monitoring current and future regulatory issues.We are a charter signatory to the International CyanideManagement Code. In March 2006, our Cowal minebecame the first facility in the world to obtain theInternational Cyanide Institute Certification. We are asignatory to the UN Global Compact, which encour-ages businesses to support a precautionary approach toenvironmental challenges, undertake initiatives to pro-mote greater environmental responsibility and encour-age the development and diffusion of environmentally
6 � Management’s Discussion and Analysis Barrick Financial Report 2006

friendly technologies. Following the acquisition ofPlacer Dome, we began the implementation of ourEnvironmental Management System (“EMS”) Stan-dard at all of the acquired operations. The EMSStandard contains 15 elements of good environmen-tal management and is consistent with ISO 14001.Three of our mines, Lagunas Norte, Pierina andZaldívar, are ISO 14001 Certified and our goal is thatothers will receive certification in the future. Eachyear, we issue a Responsibility Report that outlines ourenvironmental, health and safety and social responsi-bility performance for the year.
Information Management and TechnologyOur Information Management and Technology(“IMT”) group provides focused and responsive sup-port to enable us to meet our current business objec-tives and long-term strategy goals. The IMT groupalso manages significant risks, such as informationsecurity; risks relating to the implementation of newapplications; and the risk of failure of critical systems.We are implementing strategies to mitigate these risks,including monitoring operating procedures and theeffectiveness of system controls to safeguard data,evaluating the effective use of technology and main-taining disaster recovery plans. Other areas of focusinclude working with other functional groups toreduce technology diversity and cost by standardizingsystem solutions, and ongoing analysis of businessneeds and the potential benefits that can be gainedfrom system enhancements.
Internal Control Over Financial ReportingManagement is responsible for establishing and main-taining adequate internal control over financialreporting. Internal control over financial reporting isa process designed to provide reasonable assuranceregarding the reliability of financial reporting and thepreparation of financial statements for external pur-poses in accordance with US GAAP.
The Company’s internal control over financialreporting includes those policies and procedures that(i) pertain to the maintenance of records that, in rea-sonable detail, accurately and fairly reflect the trans-actions and dispositions of the assets of the Company;(ii) provide reasonable assurance that transactions arerecorded as necessary to permit preparation of finan-cial statements in accordance with US GAAP, and that
receipts and expenditures of the Company are beingmade only in accordance with authorizations of man-agement and directors of the Company; and (iii) pro-vide reasonable assurance regarding prevention ortimely detection of unauthorized acquisition, use ordisposition of the Company’s assets that could have amaterial effect on the Company’s Financial State-ments. Due to its inherent limitations, internal controlover financial reporting may not prevent or detectmisstatements. Also, projections of any evaluation ofeffectiveness to future periods are subject to the riskthat controls may become inadequate because ofchanges in conditions, or that the degree of compli-ance with the policies or procedures may deteriorate.
Barrick’s annual management report on internalcontrol over financial reporting for the year endedDecember 31, 2006 and the related attestation reportof Barrick’s auditors is included in Barrick’s 2006Annual Report and its 2006 Form 40-F/Annual Infor-mation Form on file with the SEC and Canadianprovincial securities regulatory authorities.
Key Economic TrendsIn 2006, higher gold, copper and silver prices contin-ued. While benefiting gold and copper revenues andsilver by-product credits, this also led to higher royaltyexpenses. Although the trend of inflationary pressureon other commodities and consumables, such as oiland natural gas, eased late in 2006 and into 2007,prices for many other commodities and consumables,including electricity, tires and cyanide, remain at rel-atively high levels and continue to cause upward pres-sure on production costs. The gold mining industryhas also been facing upward pressure on labor costs.We believe that other companies in the industry areexperiencing similar trends for labor, commoditiesand consumables. Since the acquisition of PlacerDome, the increase in scale of our business means thatthese factors also impact the business on a larger scale.
Gold, Copper and Silver PricesMarket gold and copper prices have a significantimpact on our revenue. Silver prices impact total cash costs of gold as silver sales are recorded as a by-product credit. These prices are subject to volatileprice movements over short periods of time, and areaffected by numerous industry and macroeconomicfactors that are beyond our control.
Management’s Discussion and Analysis � 7Barrick Financial Report 2006

In 2006, gold prices ranged from $516 to $730 perounce with an average market price of $604 per ounceand closed the year at $632 per ounce. The price of gold followed an upward trend in 2006, reaching a25-year high of $730 per ounce in May, primarily dueto strong physical and investment demand. Since May,market gold prices retreated to trade generally in the$600 to $650 per ounce range. Other economic influ-ences such as supply and demand, oil prices, tradedeficits, the US dollar and US interest rates are factorsin explaining gold price movements, as well as CentralBank activity. Demand for gold remains strong, bothfor jewelry and as an investment in response to globaleconomic and political uncertainty. In the past fewyears there has been a resurgence in gold as an invest-ment vehicle, with more readily accessible gold invest-ment opportunities (such as gold exchange tradedfunds – “ETFs”). There has been speculation that cen-tral banks in Asia and Russia have considered diversify-ing their reserves away from the US dollar and intoother currencies and gold, which would provide furtherfundamental strength to gold prices. We believe thateconomic conditions for a higher gold price remainfavorable and we expect that gold mine supply will con-tinue to fall short of jewelry and investment demand.
300
350
400
450
500
550
600
650
700
750
Average Monthly Spot Gold Prices (dollars per ounce)
2004 2005 2006
Over the last three years, our realized gold salesprices have generally tracked the rising market goldprice. In certain periods our average realized price wasbelow market prices as we voluntarily chose to deliversome of our production into gold sales contracts atprices lower than prevailing market prices, consistentwith our goal to eliminate our fixed-price CorporateGold Sales Contracts position (see page 54 for moredetails). In 2006, our realized gold price was reducedduring the year by the opportunity cost of deliveriesinto fixed-price Corporate Gold Sales Contracts of$367 million ($327 million in fourth quarter 2006)combined with Placer Dome gold hedge accountingadjustments of $165 million as we completely elimi-nated the position in 2006. Had it not been for theseitems, our realized price would have been approxi-mately $63 per ounce higher in 2006 (and would havelargely tracked the spot gold price). In 2006, wereduced our fixed-price Corporate Gold Sales Con-tracts through the delivery of 1.2 million ounces ofproduction into contracts and converting the pricingof 0.5 million ounces into future spot pricing. We alsoreallocated 3.0 million ounces of hedges to the ProjectGold Sales Contracts (see pages 52 to 55 for a descrip-tion of our Gold Sales Contracts).
As of February 21, 2007, we fully eliminated theremaining fixed-price Corporate Gold Sales Con-tracts. We expect to eliminate the entire FloatingSpot-Price Gold Sales Contracts position throughdeliveries of gold production before the end of thesecond quarter of 2007. This is expected to result in apre-tax reduction to our net income and cash flow of$572 million ($564 million post-tax) in first quarter2007 and $76 million ($65 million post-tax) in sec-ond quarter 2007.
8 � Management’s Discussion and Analysis Barrick Financial Report 2006

The acquisition of Placer Dome has led to copperprices having a significant effect on our results due to copper production from the Zaldívar copper mineand the Osborne gold and copper mine. In 2006,these mines produced 367 million pounds of copperin the aggregate.
Copper prices rose significantly in the first half of2006, reaching a high of $3.99 per pound in May.Realized copper prices tracked the rising spot marketprices. This rally was mainly due to strong physical andinvestment demand, as well as relatively low globalcopper inventory levels, exacerbated by labor strikes atsome of Chile’s large copper mines. We took advantageof these high copper prices to issue $1 billion of cop-per-linked notes that are repayable in the dollar equiv-alent of 324 million pounds of copper (starting inOctober 2006) over the following three years at $3.08per pound (see page 47 for more details). In the latterpart of the year, copper prices trended lower from thehigh in May 2006, closing at $2.85 per pound onDecember 31, 2006. Copper prices have declined further since December 31, 2006 on concerns of aslowdown in global economic activity. In February2007, we entered into a transaction where we can par-ticipate in stronger copper prices up to $3.50 perpound, while maintaining a floor price of $3.00 perpound, on the remaining 274 million pounds of cop-per in copper-linked notes.
1.00
1.50
2.00
2.50
3.00
3.50
4.00
4.50
Average Monthly Spot Copper Prices (dollars per pound)
2004 2005 2006
Silver prices have risen more than 40% since the begin-ning of the year, and reached a high of $15.17 per ouncein May 2006, largely due to investment demand led bythe silver exchange-traded fund launched in secondquarter 2006. Silver rallied in the first few months of2006 along with gold, despite continued news that attri-tion in the US photographic market would depressdemand. Silver prices have had support from industrialconsumers as technological advances continue to cre-ate new uses for silver. Industrial demand now accountsfor approximately half of total demand. Over the lastthree years we have produced between 10 to 18 millionounces of silver by-products annually, mainly at ourEskay Creek mine. For 2007, we expect to produce about7 million ounces of silver, as Eskay Creek approachesthe end of its reserve life in early 2008. After Pascua-Lama begins production, we expect that the quantitiesof silver we produce annually will increase significantlydue to the substantial amount of silver that is containedin the gold mineral reserves.
Based on estimates of 2007 production and sales,the approximate sensitivities of our income from con-tinuing operations before income taxes and other itemsto a 10% change in metal prices from 2006 average spot rates are as follows: gold – $340 million; copper –$75 million; and silver – $10 million.
4.00
6.00
8.00
10.00
12.00
14.00
Average Monthly Spot Silver Prices (dollars per ounce)
2004 2005 2006
Management’s Discussion and Analysis � 9Barrick Financial Report 2006

Currency Exchange RatesResults of our mining operations in Australia, Canadaand Chile, reported in US dollars, are affected byexchange rates between the Australian, Canadian andChilean currencies and the US dollar because a por-tion of our annual expenditures are based in local currencies. Following the Placer Dome acquisition,our exposure to the Australian dollar and the Chileanpeso increased.
0.60
0.70
0.65
0.75
0.80
0.90
0.85
0.95
Average Monthly CAD$ Spot and Hedge Rates (C$:US$ exchange rate)
2004 2005 2006
Average Spot Rate
Average Hedge Rate
0.45
0.55
0.50
0.60
0.70
0.65
0.80
0.75
0.90
0.85
Average Monthly AUD$ Spot and Hedge Rates (A$:US$ exchange rate)
2004 2005 2006
Average Spot Rate
Average Hedge Rate
A weaker US dollar would cause our costs reported inUS dollars to increase. In 2006, the Canadian dollarstabilized at the higher levels reached in 2005, mainlydue to sustained higher energy prices and globalinvestor interest in resource assets. The Australian dol-lar has appreciated, mainly due to higher commodityprices and a strong economic performance in Austra-lia resulting in an interest rate environment that isattractive to investors. The Chilean peso strengthenedin tandem with copper prices in 2006. It has sinceweakened following copper.
We have a currency hedge position as part of ourstrategy to control costs by mitigating the impact ofvolatility in the US dollar on Canadian and Australiandollar-based costs. About 70% of our consolidated pro-duction costs are denominated in US dollars and arenot exposed to fluctuations in US dollar exchange rates.For the remaining portion, our currency hedge positionhas mitigated to a significant extent the effect of theweakening of the US dollar over the last few years onoperating costs at our Australian and Canadian mines.Over the last three years, our currency hedge positionhas provided benefits to us in the form of hedge gains
500.00
525.00
550.00
575.00
625.00
600.00
650.00
Average Monthly Chilean Peso Spot Rates (US$:Chilean peso exchange rate)
2004 2005 2006
10 � Management’s Discussion and Analysis Barrick Financial Report 2006
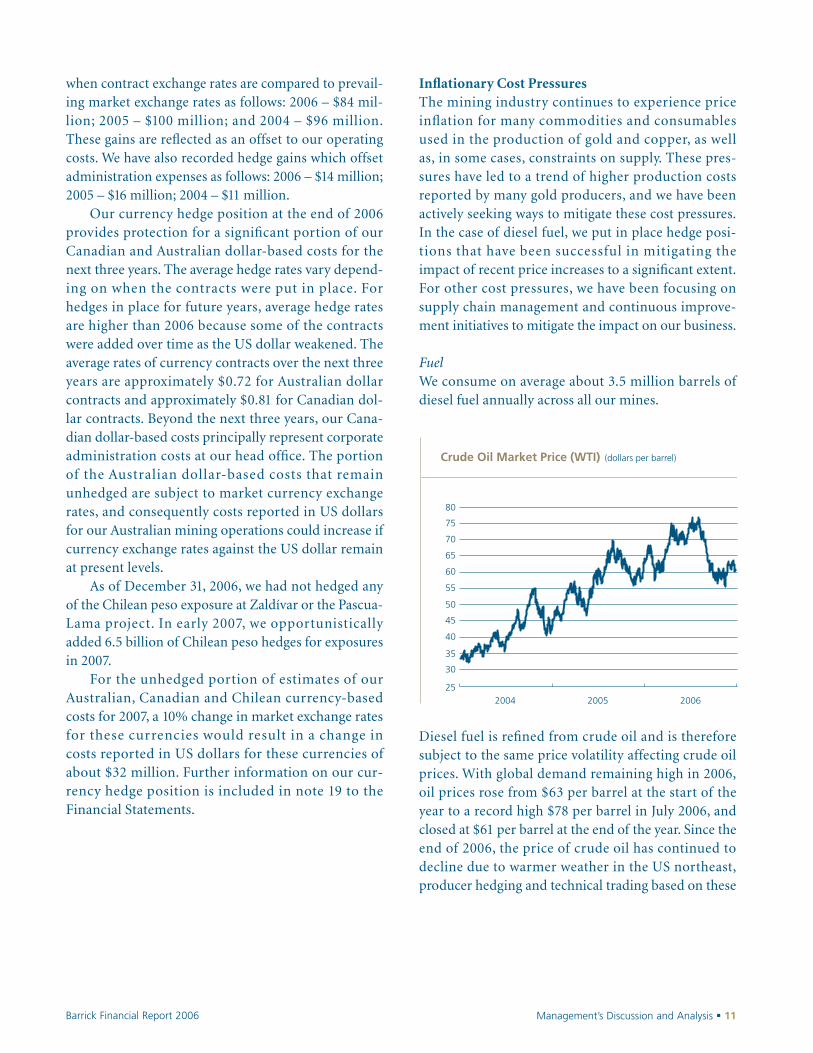
when contract exchange rates are compared to prevail-ing market exchange rates as follows: 2006 – $84 mil-lion; 2005 – $100 million; and 2004 – $96 million.These gains are reflected as an offset to our operatingcosts. We have also recorded hedge gains which offsetadministration expenses as follows: 2006 – $14 million;2005 – $16 million; 2004 – $11 million.
Our currency hedge position at the end of 2006provides protection for a significant portion of ourCanadian and Australian dollar-based costs for thenext three years. The average hedge rates vary depend-ing on when the contracts were put in place. Forhedges in place for future years, average hedge ratesare higher than 2006 because some of the contractswere added over time as the US dollar weakened. Theaverage rates of currency contracts over the next threeyears are approximately $0.72 for Australian dollarcontracts and approximately $0.81 for Canadian dol-lar contracts. Beyond the next three years, our Cana-dian dollar-based costs principally represent corporateadministration costs at our head office. The portion of the Australian dollar-based costs that remainunhedged are subject to market currency exchangerates, and consequently costs reported in US dollarsfor our Australian mining operations could increase ifcurrency exchange rates against the US dollar remainat present levels.
As of December 31, 2006, we had not hedged anyof the Chilean peso exposure at Zaldívar or the Pascua-Lama project. In early 2007, we opportunisticallyadded 6.5 billion of Chilean peso hedges for exposuresin 2007.
For the unhedged portion of estimates of ourAustralian, Canadian and Chilean currency-basedcosts for 2007, a 10% change in market exchange ratesfor these currencies would result in a change in costs reported in US dollars for these currencies ofabout $32 million. Further information on our cur-rency hedge position is included in note 19 to theFinancial Statements.
Inflationary Cost PressuresThe mining industry continues to experience priceinflation for many commodities and consumablesused in the production of gold and copper, as well as, in some cases, constraints on supply. These pres-sures have led to a trend of higher production costsreported by many gold producers, and we have beenactively seeking ways to mitigate these cost pressures.In the case of diesel fuel, we put in place hedge posi-tions that have been successful in mitigating theimpact of recent price increases to a significant extent.For other cost pressures, we have been focusing onsupply chain management and continuous improve-ment initiatives to mitigate the impact on our business.
FuelWe consume on average about 3.5 million barrels ofdiesel fuel annually across all our mines.
Diesel fuel is refined from crude oil and is thereforesubject to the same price volatility affecting crude oilprices. With global demand remaining high in 2006,oil prices rose from $63 per barrel at the start of theyear to a record high $78 per barrel in July 2006, andclosed at $61 per barrel at the end of the year. Since theend of 2006, the price of crude oil has continued todecline due to warmer weather in the US northeast,producer hedging and technical trading based on these
25
35
30
40
65
55
50
45
60
75
70
80
Crude Oil Market Price (WTI) (dollars per barrel)
2004 2005 2006
Management’s Discussion and Analysis � 11Barrick Financial Report 2006

lower levels. To help mitigate rising oil prices and con-trol the cost of fuel consumption, at year end we had afuel hedge position totaling 4.2 million barrels, whichrepresents about 30% of our total estimated consump-tion in 2007 and 15–20% of our total estimated con-sumption in each of the following six years. The fuelhedge contracts are primarily designated for ourNevada-based mines and have an average price of$59 per barrel. In 2006, we realized benefits in the formof fuel hedge gains totaling $16 million (2005: $10 mil-lion; 2004: $4 million), when fuel hedge prices werecompared to market prices. These gains are reflectedin our operating costs. Based on estimates of our 2007diesel fuel consumption, a $5 per barrel increase in theprice of oil would result in an increase in our annualcost of fuel consumed of about $16 million for theunhedged portion of our fuel consumption.
ElectricityWe purchase about 3 billion kilowatt hours (“kwh”) ofelectricity annually across all our mines. Electricitycosts represent approximately 12% of our operatingcosts to produce gold and copper. We typically buyelectricity from regional power utilities, but at somemines, we generate our own power. Fluctuations inelectricity prices are generally caused by local eco-nomic factors. Electricity prices have generally beenrising in recent years due to increases in the price ofdiesel fuel, coal and natural gas, which are used bymany power generators, as well as excess demand forelectricity. Natural gas prices declined in North Amer-ica in 2006, mainly due to mild winter weather, a rela-tively calm hurricane season, and high natural gasinventory levels.
In 2005, we completed construction of ourWestern 102 power plant in Nevada for our Goldstrikemine, designed to enable us to lower the cost of powerconsumed at the mine. The plant has enabled us tolower the cost per kwh from approximately 10 cents toapproximately 8 cents in 2006, with a correspondingdecrease of approximately $17 million in the total cashcosts of gold produced at Goldstrike or about $9 perounce in 2006.
ConsumablesWith increasing demand for tires and limitations insupply from tire manufacturers, costs have been risingand some companies have experienced difficultysecuring tires. We have been successful in mitigatingthis cost pressure by finding ways to extend tire lifeand looking at various alternatives for supply. In 2006,we completed a tire tender process and concludedlong-term sourcing arrangements with preferred tiresuppliers to ensure that we continue to receive an ade-quate supply of tires for our mines and developmentprojects. The limited availability of tires did not havea significant impact on productivity at our mines in2006. In 2007, we will continue to monitor tire usageand implement improved tire management processesto further extend tire life.
Generally, prices for certain other consumables,such as explosives, grinding media and cyanide, havealso been increasing. We experienced price increasesfor explosives in 2006, by 25% in some cases, due toincreases in raw material prices (natural gas andammonia), but we were able to work with our suppli-ers to mitigate the impact of price increases on theseraw material and explosives costs. Prices for grindingmedia have also increased, by 15% in some cases.
12 � Management’s Discussion and Analysis Barrick Financial Report 2006
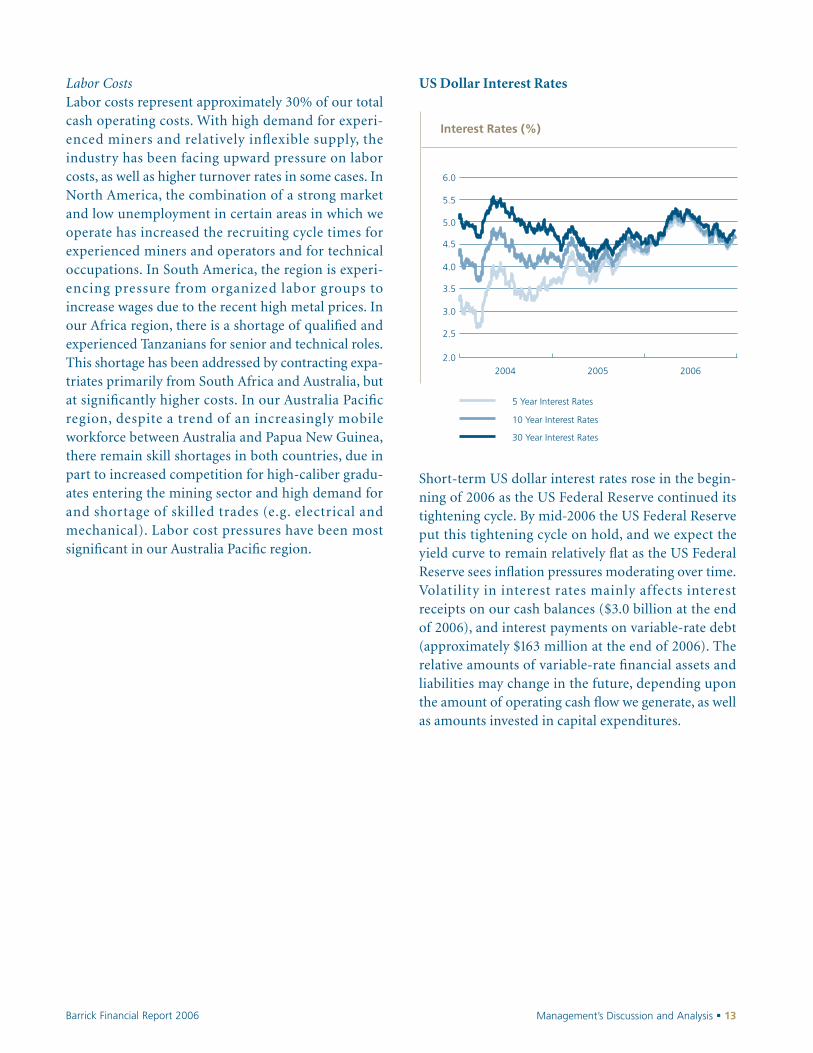
Labor CostsLabor costs represent approximately 30% of our totalcash operating costs. With high demand for experi-enced miners and relatively inflexible supply, theindustry has been facing upward pressure on laborcosts, as well as higher turnover rates in some cases. InNorth America, the combination of a strong marketand low unemployment in certain areas in which weoperate has increased the recruiting cycle times forexperienced miners and operators and for technicaloccupations. In South America, the region is experi-encing pressure from organized labor groups toincrease wages due to the recent high metal prices. Inour Africa region, there is a shortage of qualified andexperienced Tanzanians for senior and technical roles.This shortage has been addressed by contracting expa-triates primarily from South Africa and Australia, butat significantly higher costs. In our Australia Pacificregion, despite a trend of an increasingly mobileworkforce between Australia and Papua New Guinea,there remain skill shortages in both countries, due inpart to increased competition for high-caliber gradu-ates entering the mining sector and high demand forand shortage of skilled trades (e.g. electrical andmechanical). Labor cost pressures have been mostsignificant in our Australia Pacific region.
US Dollar Interest Rates
Short-term US dollar interest rates rose in the begin-ning of 2006 as the US Federal Reserve continued itstightening cycle. By mid-2006 the US Federal Reserveput this tightening cycle on hold, and we expect theyield curve to remain relatively flat as the US FederalReserve sees inflation pressures moderating over time.Volatility in interest rates mainly affects interestreceipts on our cash balances ($3.0 billion at the endof 2006), and interest payments on variable-rate debt(approximately $163 million at the end of 2006). Therelative amounts of variable-rate financial assets andliabilities may change in the future, depending uponthe amount of operating cash flow we generate, as wellas amounts invested in capital expenditures.
2.0
3.0
2.5
3.5
4.5
4.0
5.0
6.0
5.5
Interest Rates (%)
2004 2005 2006
5 Year Interest Rates
10 Year Interest Rates
30 Year Interest Rates
Management’s Discussion and Analysis � 13Barrick Financial Report 2006

Operations Review
Selected Annual Information($ millions, except per share,
For the years ended December 31
Gold Copper1
per ounce/pound data in dollars)2006 2005 2004 2006
Production (000s oz/millions lbs)2 8,643 5,460 4,958 367Sales
000s oz/millions lbs3 8,390 5,320 4,936 376$ millions3 $ 4,485 $ 2,350 $ 1,932 $ 1,151
Market price4 604 444 409 3.05Realized price4,5 541 439 391 3.06Total cash costs2,4,6 282 227 214 0.79Amortization2,4,7 77 76 86 0.43Total production costs2,4 $ 359 $ 303 $ 300 $ 1.22
2006 2005 2004
Net income from continuing operations $ 1,209 $ 395 $ 248Net income from continuing
operations – per shareBasic 1.44 0.74 0.47Diluted 1.42 0.73 0.46
Net income 1,506 401 248Net income per share
Basic 1.79 0.75 0.47Diluted 1.77 0.75 0.46
Cash inflow (outflow) from continuing operations
Operating activities 2,122 726 509Investing activities (1,593) (1,180) (821)Financing activities (1,347) 93 740
Cash inflow from discontinued operations8 2,828 – –
Cash position – end of year 3,043 1,037 1,398Total assets9 21,373 6,862 6,287Total long-term financial liabilities10 $ 3,394 $ 1,780 $ 1,707Gold reserves (millions of contained ounces) 123.1A 88.6 89.1Copper reserves (billions of contained pounds) 6.0A – –
1. The 2005 and 2004 comparative periods for copper have been omitted aswe did not produce any significant amounts of copper prior to the produc-tion from the copper mines acquired with Placer Dome.
2. Gold production and total cash cost per ounce/pound/ton statistics reflectour equity share of production, including our equity share of productionfrom the South Deep mine through November 30, 2006.
3. Gold sales ($ millions) exclude the results of discontinued operations. Goldsales (000s oz/millions lbs) exclude the results of discontinued operationsand reflect our equity share of sales.
4. Per ounce/pound weighted average.5. The realized gold price in 2006 is inclusive of the opportunity cost of deliv-
eries into gold sales contracts of $367 million, combined with Placer Domegold hedge accounting adjustments of $165 million.
6. Total cash costs per ounce/pound/ton statistics exclude amortization andinventory purchase accounting adjustments. Total cash costs per ounce/pound/ton is a performance measure that is used throughout this MD&A.For more information see pages 34 to 36.
7. Amortization includes inventory purchase accounting adjustments.8. In 2006, we received cash of approximately $1.6 billion from the sale of
operations to Goldcorp and approximately $1.2 billion from the sale of theSouth Deep mine to Gold Fields Limited (“Gold Fields”).
9. Total assets increased in 2006 largely due to the acquisition of Placer Domethat resulted in the recognition of assets totaling $15.3 billion.
10. Total long-term financial liabilities increased in 2006 largely due to liabilitiestotaling $3.0 billion that were assumed in the acquisition of Placer Dome.
At the end of 2006, we had proven and probable goldreserves of 123.1 million ounces.1 We also reportedgold mineral resources (measured and indicated) of 35.0 million ounces and inferred resources of24.9 million ounces.2 We have proven and probablecopper reserves of 6 billion pounds,2 with an addi-tional 6.6 billion pounds of measured and indicatedresources.2 Copper contained in Barrick’s goldreserves at year end 2006 was 1.2 billion pounds.2
Silver contained in our gold reserves at year end is963.9 million ounces and is primarily derived fromthe Pascua-Lama deposit, one of the largest silverdeposits in the world, which contains 689.3 millionounces of silver.2 By replacing gold and copperreserves depleted by production year over year, we canmaintain production levels over the long term. Ifdepletion of reserves exceeds discoveries over the longterm, then we may not be able to sustain gold andcopper production levels. Reserves can be replaced byexpanding known ore bodies, acquiring mines orproperties or discovering new deposits. Once a sitewith gold or copper mineralization is discovered, itmay take several years from the initial phases ofdrilling until production is possible, during whichtime the economic feasibility of production maychange. Substantial expenditures are required toestablish proven and probable reserves and to con-struct mining and processing facilities. Given thatexploration is speculative in nature, exploration proj-ects may prove unsuccessful.
14 � Management’s Discussion and Analysis Barrick Financial Report 2006
1. Calculated in accordance with National Instrument 43-101 as required by Canadian securities regulatory authorities. For United States reporting purposes, Industry Guide 7, (under the Securities and Exchange Act of 1934),as interpreted by Staff of the SEC, applies different standards in order to classify mineralization as a reserve. Accordingly, for U.S. reporting purposes,1.88 million ounces of the Cortez reserve, Buzwagi and Pueblo Viejo are clas-sified as mineralized material. For a breakdown of reserves and resources bycategory and additional information relating to reserves and resources, seepages 128–136 of this Financial Report 2006.
2. For a breakdown of reserves and resources by category and additional information relating to reserves and resources, see pages 128–136 of thisFinancial Report 2006.
A. Calculated in accordance with National Instrument 43-101 as required by Canadian securities regulatory authorities. For United States reporting purposes, Industry Guide 7, (under the Securities and Exchange Act of 1934),as interpreted by Staff of the SEC, applies different standards in order to classify mineralization as a reserve. Accordingly, for U.S. reporting purposes,1.88 million ounces of the Cortez reserve, Buzwagi and Pueblo Viejo are clas-sified as mineralized material. For a breakdown of reserves and resources bycategory and additional information relating to reserves and resources, seepages 128–136 of this Financial Report 2006.

Executive Overview and 2007 OutlookGold production in 2006 has increased substantiallyover the prior year due to contributions from our newmines, Tulawaka, Lagunas Norte, Veladero and Cowal,as well as production from the Placer Dome minesacquired in January 2006. Gold production in 2006includes 2.56 million ounces from the acquired PlacerDome mines. In 2006, we also produced 367 millionpounds of copper from two copper mines acquiredwith Placer Dome. Earnings and operating cash flowhave increased substantially due to the higher gold pro-duction levels and higher realized gold prices, as well asthe contribution from copper production at recent highcopper prices. Earnings in 2006 also reflect a pre-tax$367 million opportunity cost relating to the voluntarydelivery of 1.2 million ounces of gold production intofixed-price Corporate Gold Sales Contracts, and a pre-tax gain of $288 million on the sale of South Deep.Earnings on a per share basis reflect 322.8 million com-mon shares issued in first quarter 2006 to acquirePlacer Dome. In 2006, we completed the sale of certainPlacer Dome operations to Goldcorp, and the sale ofSouth Deep to Gold Fields. We also completed theacquisition of a 37.5% indirect interest in the Reko Diqcopper project in Pakistan and acquired a 15% interestin NovaGold Resources Inc. (“NovaGold”). For moredetails please see pages 17 to 19.
Key Factors Affecting Earnings
For the years ended December 31 Refer($ millions) to page
Net income – 2005 $ 401Increase (decrease)
Higher market gold prices1 7 $ 1,342Less: impact of gold sales contracts1 7 (476)Higher sales volumes gold2 20 429Higher earnings from copper sales 20 767Higher total cash costs 20 (461)Higher interest expense (119)Higher exploration and project
development expense 37 (149)Higher income tax expense3 42 (387)Special items1,4 16 265Other (106)
Total increase $ 1,105
Net income – 2006 $ 1,506
1. Our realized gold price was reduced during the year for the opportunity costof deliveries into fixed-price Corporate Gold Sales Contracts of $367 million,combined with Placer Dome gold hedge accounting adjustments of $165 mil-lion. Had it not been for these items, our realized price would have beenapproximately $63 per ounce higher in 2006. The opportunity cost of deliver-ies into fixed-price Corporate Gold Sales Contracts and the Placer Dome goldhedge accounting adjustments have been excluded from the special itemsline on this table.
2. Impact of changing sales volumes on margin between selling prices, totalcash costs and amortization, but excluding inventory purchase accountingadjustments.
3. Excluding the impact of the tax effects of special items.4. Special items are presented on a post-tax basis. See page 16 for a description
of the special items.
Management’s Discussion and Analysis � 15Barrick Financial Report 2006
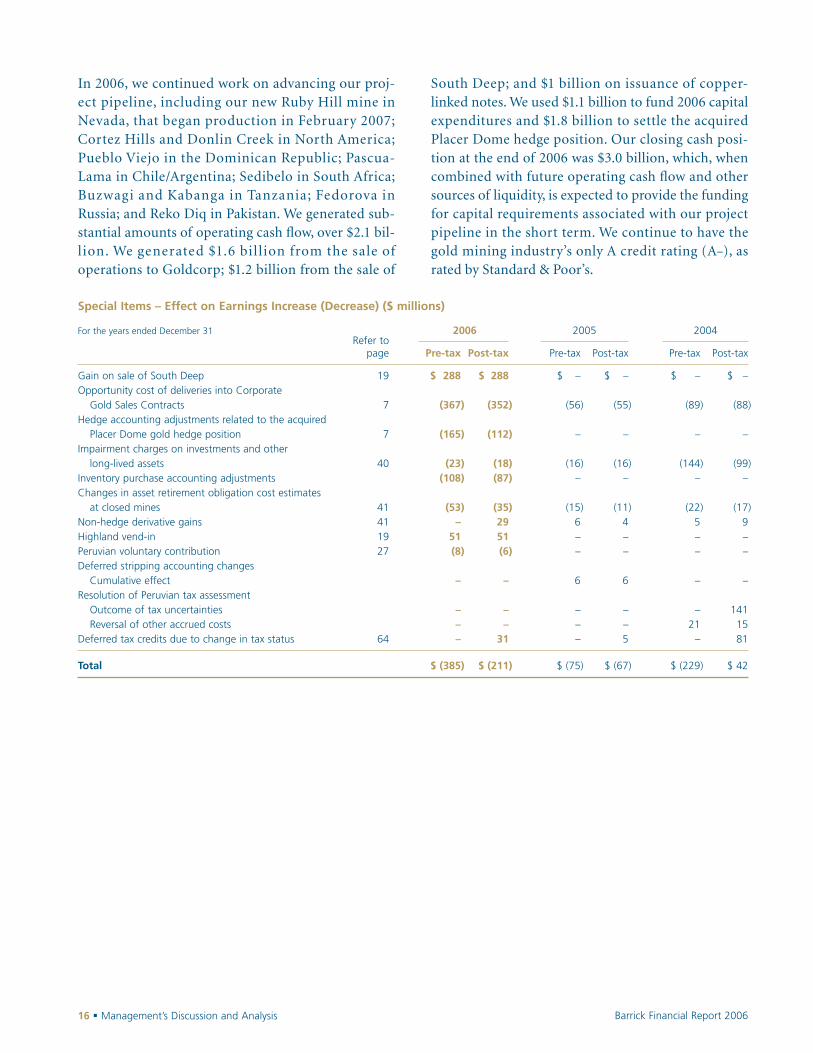
16 � Management’s Discussion and Analysis Barrick Financial Report 2006
Special Items – Effect on Earnings Increase (Decrease) ($ millions)
For the years ended December 31Refer to
2006 2005 2004
page Pre-tax Post-tax Pre-tax Post-tax Pre-tax Post-tax
Gain on sale of South Deep 19 $ 288 $ 288 $ – $ – $ – $ –Opportunity cost of deliveries into Corporate
Gold Sales Contracts 7 (367) (352) (56) (55) (89) (88)Hedge accounting adjustments related to the acquired
Placer Dome gold hedge position 7 (165) (112) – – – –Impairment charges on investments and other
long-lived assets 40 (23) (18) (16) (16) (144) (99)Inventory purchase accounting adjustments (108) (87) – – – –Changes in asset retirement obligation cost estimates
at closed mines 41 (53) (35) (15) (11) (22) (17)Non-hedge derivative gains 41 – 29 6 4 5 9Highland vend-in 19 51 51 – – – –Peruvian voluntary contribution 27 (8) (6) – – – –Deferred stripping accounting changes
Cumulative effect – – 6 6 – –Resolution of Peruvian tax assessment
Outcome of tax uncertainties – – – – – 141Reversal of other accrued costs – – – – 21 15
Deferred tax credits due to change in tax status 64 – 31 – 5 – 81
Total $ (385) $ (211) $ (75) $ (67) $ (229) $ 42
In 2006, we continued work on advancing our proj-ect pipeline, including our new Ruby Hill mine inNevada, that began production in February 2007;Cortez Hills and Donlin Creek in North America;Pueblo Viejo in the Dominican Republic; Pascua-Lama in Chile/Argentina; Sedibelo in South Africa;Buzwagi and Kabanga in Tanzania; Fedorova inRussia; and Reko Diq in Pakistan. We generated sub-stantial amounts of operating cash flow, over $2.1 bil-lion. We generated $1.6 bil lion from the sale ofoperations to Goldcorp; $1.2 billion from the sale of
South Deep; and $1 billion on issuance of copper-linked notes. We used $1.1 billion to fund 2006 capitalexpenditures and $1.8 billion to settle the acquiredPlacer Dome hedge position. Our closing cash posi-tion at the end of 2006 was $3.0 billion, which, whencombined with future operating cash flow and othersources of liquidity, is expected to provide the fundingfor capital requirements associated with our projectpipeline in the short term. We continue to have thegold mining industry’s only A credit rating (A–), asrated by Standard & Poor’s.
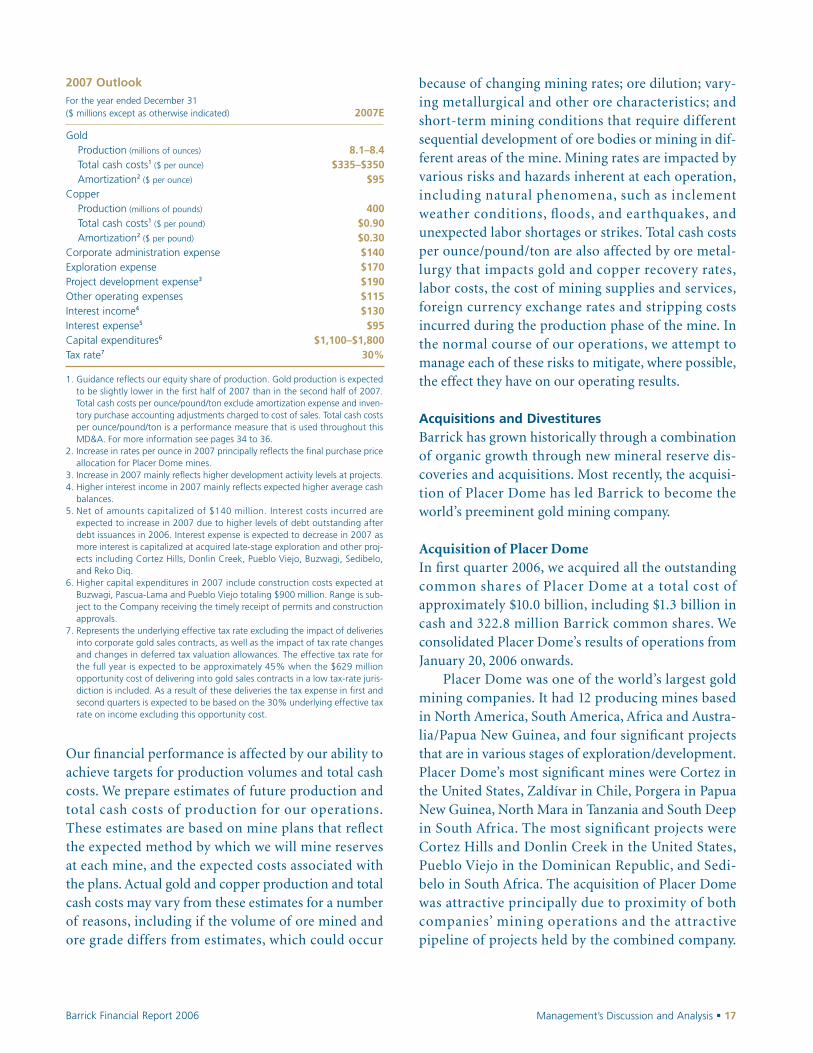
2007 OutlookFor the year ended December 31($ millions except as otherwise indicated) 2007E
GoldProduction (millions of ounces) 8.1–8.4Total cash costs1 ($ per ounce) $335–$350Amortization2 ($ per ounce) $95
CopperProduction (millions of pounds) 400Total cash costs1 ($ per pound) $0.90Amortization2 ($ per pound) $0.30
Corporate administration expense $140Exploration expense $170Project development expense3 $190Other operating expenses $115Interest income4 $130Interest expense5 $95Capital expenditures6 $1,100–$1,800Tax rate7 30%
1. Guidance reflects our equity share of production. Gold production is expectedto be slightly lower in the first half of 2007 than in the second half of 2007.Total cash costs per ounce/pound/ton exclude amortization expense and inven-tory purchase accounting adjustments charged to cost of sales. Total cash costsper ounce/pound/ton is a performance measure that is used throughout thisMD&A. For more information see pages 34 to 36.
2. Increase in rates per ounce in 2007 principally reflects the final purchase priceallocation for Placer Dome mines.
3. Increase in 2007 mainly reflects higher development activity levels at projects.4. Higher interest income in 2007 mainly reflects expected higher average cash
balances.5. Net of amounts capitalized of $140 million. Interest costs incurred are
expected to increase in 2007 due to higher levels of debt outstanding afterdebt issuances in 2006. Interest expense is expected to decrease in 2007 asmore interest is capitalized at acquired late-stage exploration and other proj-ects including Cortez Hills, Donlin Creek, Pueblo Viejo, Buzwagi, Sedibelo,and Reko Diq.
6. Higher capital expenditures in 2007 include construction costs expected atBuzwagi, Pascua-Lama and Pueblo Viejo totaling $900 million. Range is sub-ject to the Company receiving the timely receipt of permits and constructionapprovals.
7. Represents the underlying effective tax rate excluding the impact of deliveriesinto corporate gold sales contracts, as well as the impact of tax rate changesand changes in deferred tax valuation allowances. The effective tax rate forthe full year is expected to be approximately 45% when the $629 millionopportunity cost of delivering into gold sales contracts in a low tax-rate juris-diction is included. As a result of these deliveries the tax expense in first andsecond quarters is expected to be based on the 30% underlying effective taxrate on income excluding this opportunity cost.
Our financial performance is affected by our ability toachieve targets for production volumes and total cashcosts. We prepare estimates of future production andtotal cash costs of production for our operations.These estimates are based on mine plans that reflectthe expected method by which we will mine reservesat each mine, and the expected costs associated withthe plans. Actual gold and copper production and totalcash costs may vary from these estimates for a numberof reasons, including if the volume of ore mined andore grade differs from estimates, which could occur
because of changing mining rates; ore dilution; vary-ing metallurgical and other ore characteristics; andshort-term mining conditions that require differentsequential development of ore bodies or mining in dif-ferent areas of the mine. Mining rates are impacted byvarious risks and hazards inherent at each operation,including natural phenomena, such as inclementweather conditions, floods, and earthquakes, andunexpected labor shortages or strikes. Total cash costsper ounce/pound/ton are also affected by ore metal-lurgy that impacts gold and copper recovery rates,labor costs, the cost of mining supplies and services,foreign currency exchange rates and stripping costsincurred during the production phase of the mine. Inthe normal course of our operations, we attempt tomanage each of these risks to mitigate, where possible,the effect they have on our operating results.
Acquisitions and DivestituresBarrick has grown historically through a combinationof organic growth through new mineral reserve dis-coveries and acquisitions. Most recently, the acquisi-tion of Placer Dome has led Barrick to become theworld’s preeminent gold mining company.
Acquisition of Placer DomeIn first quarter 2006, we acquired all the outstandingcommon shares of Placer Dome at a total cost ofapproximately $10.0 billion, including $1.3 billion incash and 322.8 million Barrick common shares. Weconsolidated Placer Dome’s results of operations fromJanuary 20, 2006 onwards.
Placer Dome was one of the world’s largest goldmining companies. It had 12 producing mines basedin North America, South America, Africa and Austra-lia/Papua New Guinea, and four significant projectsthat are in various stages of exploration/development.Placer Dome’s most significant mines were Cortez inthe United States, Zaldívar in Chile, Porgera in PapuaNew Guinea, North Mara in Tanzania and South Deepin South Africa. The most significant projects wereCortez Hills and Donlin Creek in the United States,Pueblo Viejo in the Dominican Republic, and Sedi-belo in South Africa. The acquisition of Placer Domewas attractive principally due to proximity of bothcompanies’ mining operations and the attractivepipeline of projects held by the combined company.
Management’s Discussion and Analysis � 17Barrick Financial Report 2006

We believe that the business combination betweenBarrick and Placer Dome was an opportunity to createa Canadian-based leader in the global gold miningindustry. This business combination further strength-ened our position in the industry, with respect to ourreserves, development pipeline, production profile,and balance sheet. In the second quarter 2006, wecompleted the majority of integration activities for thePlacer Dome mines and offices. The integration plan,which we began immediately following the acquisitionof Placer Dome in first quarter 2006, focused on inte-grating people and mining operations of Placer Dome,consolidation of certain business functions and explo-ration offices, and elimination of redundanciesbetween the two organizations. We have identified over$200 million in annual synergies from the combinedcompanies and we expect to reach the $200 millionannual synergies by the end of 2007. The synergiesidentified are in the following areas:� Administration and offices globally – We expect
this area to contribute about 25% of the total synergies. In 2006, we closed redundant officesaround the world, including Placer Dome’sBrisbane office in Australia; Santiago office inChile; and Reno and Denver offices in the US. Mosthead office functions have been transferred fromVancouver to Toronto. We have also begun to realize synergies from other consolidating activities around IT services, consolidated annualreporting, and establishment of regional sharedservice centers.� Exploration – This area contributes about 25% of
the total synergies. In 2006, synergies were realizedmainly from a reduced total exploration expendi-ture on “new mine exploration” due to overlappingbudgets and reduced exploration on existingBarrick and Placer projects as a result of more rig-orous approval criteria for the combined company.
� Operations and technical services – This area comprises about 20% of the total synergies. Value is being driven from sharing of operational andmaintenance best practices; project optimization;continuous improvement; strategic sourcing andsupply chain management.� Finance and tax – We captured significant value by
capitalizing on opportunities for debt consolida-tion, reduced fees and costs, tax-related savings andinsurance savings, which comprise about 30% ofthe total synergies.
We accounted for the acquisition of Placer Dome as apurchase business combination, with Barrick as theacquirer. The cost of acquisition has been allocated tothe assets and liabilities acquired. The excess of thepurchase cost over the net assets acquired representsgoodwill arising upon the acquisition. Goodwill prin-cipally represents the advantage of sustaining andgrowing a portfolio of mining operations and will beenhanced in the combined business through findingnew mineral reserves and synergies that are realizablefrom combining the operations of both companies.
We believe that goodwill arises due to the benefitsthat can be realized from managing a portfolio ofmines and mineral properties, rather than from indi-vidual mines. In managing a group of mines, we havethe flexibility, through our regional business units, toallocate scarce resources such as capital and manpowerto the best opportunities. We seek to sustain and growthe portfolio of mines in each region through locatingnew investment opportunities over time, thereby sus-taining the region as a going concern and, as a conse-quence, goodwill value. The realization of synergies ismanaged at a regional level. Each region has identifiedpotential synergies and is focused on the realization ofthose synergies. We believe that, based on the way weorganize and manage our business, that goodwill ismost naturally associated with our regional businessunits. Notwithstanding this belief, the allocation ofgoodwill to reporting units is determined by specificaccounting rules that may preclude defining reporting
18 � Management’s Discussion and Analysis Barrick Financial Report 2006

units to represent aggregations of mines. We arepresently completing a process to determine the appro-priate definition of reporting units for the allocation ofgoodwill, which could range from either individualmines up to aggregation of all mines in each regionalbusiness unit. On conclusion of this process the finalallocation of goodwill to reporting units will be com-pleted. For further information on goodwill allocationand goodwill impairment testing see page 61.
Sale of Certain Placer Dome Operations to GoldcorpIn second quarter 2006, we completed the sale of sharesof Placer Dome (CLA) Limited to Goldcorp Inc. undera sale agreement that was entered into with Goldcorpat the time of our original offer to acquire PlacerDome. On completion of the transaction, Goldcorpassumed interests and liabilities in all of Placer Dome’sCanadian operations (other than its office in Van-couver), including all mining, reclamation and explo-ration properties, Placer Dome’s interest in the LaCoipa mine in Chile, and a 40% interest in the PuebloViejo project in the Dominican Republic, for cash con-sideration of $1.6 billion. We recognized that we wouldbe able to create more value with the remaining PlacerDome assets, after selling Placer Dome’s Canadianoperations to Goldcorp. The results of these operationswere consolidated until closing of the sale (May 12,2006), and are presented under discontinued opera-tions in the Financial Statements. No gain or loss aroseon closing of the transaction.
Acquisition of Interest in Reko Diq In third quarter 2006, we completed the acquisition of a50% interest in Atacama Copper Pty Ltd. (“Atacama”),which has a 75% interest in the Reko Diq project inPakistan and associated mineral interests. The RekoDiq project is located in a mining district which hassignificant gold and copper porphyry deposits as partof an extended gold and copper belt. We paid cash con-sideration of $123 million, including the cost of acquir-ing a claw-back right held by BHP Billiton and we arecommitted to fund our share of an exploration pro-gram at Reko Diq.
Sale of South Deep Mine to Gold Fields LimitedIn fourth quarter 2006, we sold our 50% interest inthe South Deep mine to Gold Fields for considerationof $1.5 billion, of which approximately $1.2 billion waspaid in cash and the balance in Gold Fields shareswith a value of $308 million on closing. As with thesale of Placer Dome’s Canadian operations toGoldcorp, the sale of South Deep to Gold Fields madesense strategically as we optimize our portfolio ofoperating mines by selling non-strategic assets. Theresults of the South Deep mine for 2006 have beenpresented under discontinued operations in theFinancial Statements. A gain on sale of $288 millionwas recorded on closing within discontinued opera-tions. Our consolidated gold production and totalcash costs per ounce statistics include South Deep upuntil November 30, 2006.
Vend-in of assets to Highland On November 17, 2006, we entered into an agreementwith Highland to transfer ownership of certain com-panies holding Russian and Kyrgyz licenses in returnfor 34.3 million Highland common shares, increasingour ownership of Highland from 20% to 34%. Ineffect, we have contributed our 50% interest in theTaseevskoye deposit, as well as other exploration prop-erties in Russia and Central Asia, to Highland, therebyconsolidating ownership of these properties underone company. As part of the transaction, we have sec-onded several of our employees to Highland, and have received two additional Board seats. Completionof the transaction occurred on December 15, 2006.On closing, the fair value of Highland common sharesexceeded the carrying amount of assets exchanged by $76 million. We recorded this difference as a gain of $51 million in other income/expense to the extentof the ownership in Highland held by independentthird parties, and the balance of $25 million as areduction in the carrying amount of our investmentin Highland. The Fedorova PGM deposit is notincluded in this transaction.
Management’s Discussion and Analysis � 19Barrick Financial Report 2006

Consolidated Gold and Copper Production, Sales and CostsIn 2006, gold production increased by about 3.2 mil-lion ounces over the prior period, primarily due to theacquired Placer Dome mines and also due to produc-tion from our new mines, Tulawaka, Lagunas Norte,Veladero and Cowal, partially offset by lower produc-tion at Goldstrike and Kalgoorlie.
Realized gold prices of $541 per ounce in 2006were $102 higher than in 2005, principally due tohigher market gold prices. Realized gold prices in 2006reflect a reduction of $532 million or $63 per ouncedue to i) $165 million hedge accounting adjustmentsrelating to the acquired Placer Dome gold hedge posi-tion, from the date of acquisition through the date theposition was eliminated, and ii) $367 million from thevoluntary delivery of 1.2 million ounces into our fixed-price Corporate Gold Sales Contracts at average pricesbelow the prevailing spot price. Cash margins on gold,representing the difference between realized gold sell-ing prices and total cash costs, increased by $47 perounce, or 22% in 2006 compared to 2005, as gold priceincreases have more than offset increases in total cashcosts over the same period. Excluding the impact ofhedge accounting adjustments and deliveries intofixed-price Corporate Gold Sales Contracts, marginswould have increased by $110 per ounce or 52%. As of
February 21, 2007, we fully eliminated the remainingfixed-price Corporate Gold Sales Contracts. We furtherexpect to eliminate the entire Floating Spot-Price GoldSales Contracts position through deliveries of goldproduction before the end of the second quarter of2007. This is expected to result in a reduction to ourpre-tax income and cash flow of $572 million in firstquarter 2007, and $76 million in second quarter 2007(assuming an average prevailing spot gold price of$650 per ounce).
Realized copper prices also increased significantlyover the course of 2006, reflecting the trend of highermarket copper prices. The realized copper price for2006 was reduced by $28 million or $0.07 per poundfor hedge accounting adjustments primarily relatingto premiums paid for copper put options purchased inearly 2006. Future realized copper prices will beimpacted by the copper-linked notes issued in 2006.Under this issuance, we will receive $3.08 per poundfor a total of 285 million pounds of copper sales in the period 2007 to 2009, including 129 million poundsin 2007. In February 2007, we entered into a transac-tion where we can participate in stronger copperprices up to $3.50 per pound, while maintaining a floor price of $3.00 per pound, on the remaining 274 million pounds of copper in copper-linked notes.
Cost of goods sold on a per ounce basis for 2006 washigher than 2005 and 2004, primarily because, onaverage, costs at the acquired Placer Dome mines arehigher than at our legacy mines. Costs also reflect theeffects of rising commodity and consumable prices
and processing of lower-grade ore at some mines,partly offset by lower-cost production in 2006 fromLagunas Norte that began operations in the secondhalf of 2005. Royalty expenses increased in 2006largely due to the impact of higher market gold prices.
20 � Management’s Discussion and Analysis Barrick Financial Report 2006
Consolidated Cost of Sales/Total Cash Costs of Gold1,2
in millions per ounce
For the years ended December 31 2006 2005 2004 2006 2005 2004
Cost of goods sold1,2,3 $ 2,388 $ 1,357 $ 1,217 $ 285 $ 255 $ 248Currency/commodity hedge gains (100) (110) (100) (12) (21) (19)By-product credits (123) (132) (146) (15) (25) (30)Royalties/production taxes 177 81 65 21 16 13Accretion/other costs 28 11 11 3 2 2
Cost of sales/Total cash costs1 $ 2,370 $ 1,207 $ 1,047 $ 282 $ 227 $ 214
1. Total cash costs and cost of sales both exclude amortization and inventory purchase accounting adjustments – see page 36.2. Excludes costs of sales related to discontinued operations and non-controlling interests.3. At market currency exchange and commodity rates.
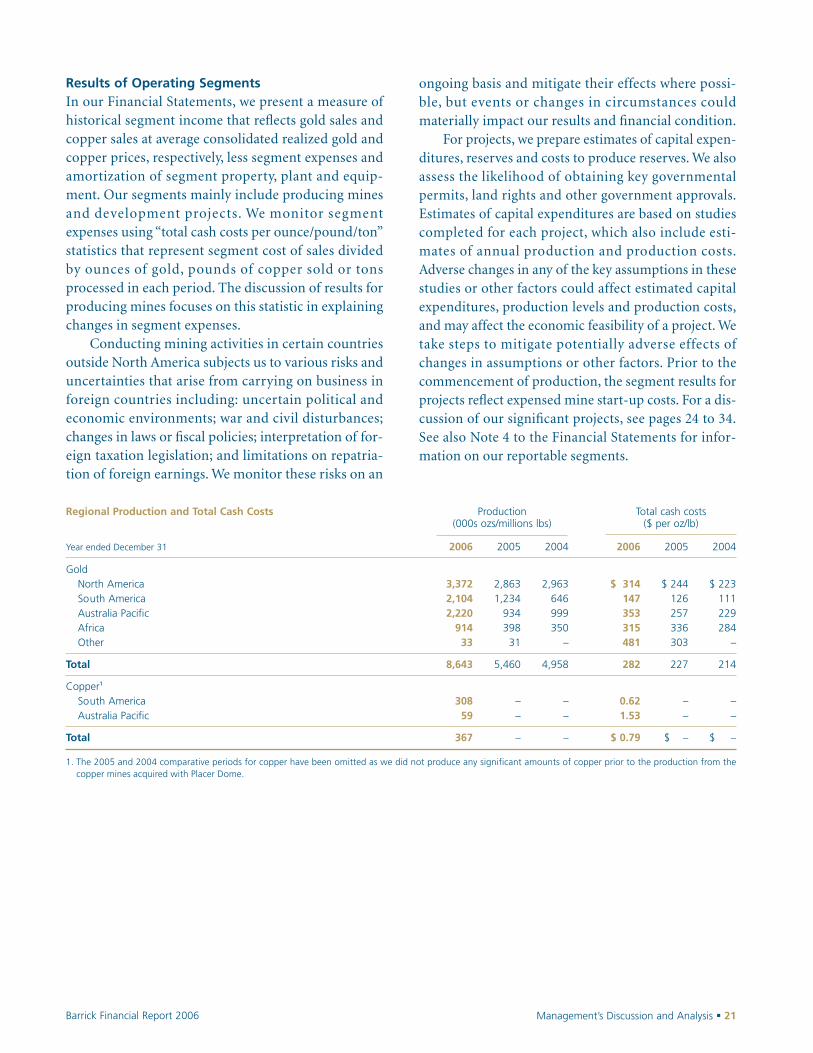
Results of Operating SegmentsIn our Financial Statements, we present a measure ofhistorical segment income that reflects gold sales andcopper sales at average consolidated realized gold andcopper prices, respectively, less segment expenses andamortization of segment property, plant and equip-ment. Our segments mainly include producing minesand development projects. We monitor segmentexpenses using “total cash costs per ounce/pound/ton”statistics that represent segment cost of sales dividedby ounces of gold, pounds of copper sold or tonsprocessed in each period. The discussion of results forproducing mines focuses on this statistic in explainingchanges in segment expenses.
Conducting mining activities in certain countriesoutside North America subjects us to various risks anduncertainties that arise from carrying on business inforeign countries including: uncertain political andeconomic environments; war and civil disturbances;changes in laws or fiscal policies; interpretation of for-eign taxation legislation; and limitations on repatria-tion of foreign earnings. We monitor these risks on an
ongoing basis and mitigate their effects where possi-ble, but events or changes in circumstances couldmaterially impact our results and financial condition.
For projects, we prepare estimates of capital expen-ditures, reserves and costs to produce reserves. We alsoassess the likelihood of obtaining key governmentalpermits, land rights and other government approvals.Estimates of capital expenditures are based on studiescompleted for each project, which also include esti-mates of annual production and production costs.Adverse changes in any of the key assumptions in thesestudies or other factors could affect estimated capitalexpenditures, production levels and production costs,and may affect the economic feasibility of a project. Wetake steps to mitigate potentially adverse effects ofchanges in assumptions or other factors. Prior to thecommencement of production, the segment results forprojects reflect expensed mine start-up costs. For a dis-cussion of our significant projects, see pages 24 to 34.See also Note 4 to the Financial Statements for infor-mation on our reportable segments.
Management’s Discussion and Analysis � 21Barrick Financial Report 2006
Regional Production and Total Cash Costs Production Total cash costs(000s ozs/millions lbs) ($ per oz/lb)
Year ended December 31 2006 2005 2004 2006 2005 2004
GoldNorth America 3,372 2,863 2,963 $ 314 $ 244 $ 223South America 2,104 1,234 646 147 126 111Australia Pacific 2,220 934 999 353 257 229Africa 914 398 350 315 336 284Other 33 31 – 481 303 –
Total 8,643 5,460 4,958 282 227 214
Copper1
South America 308 – – 0.62 – –Australia Pacific 59 – – 1.53 – –
Total 367 – – $ 0.79 $ – $ –
1. The 2005 and 2004 comparative periods for copper have been omitted as we did not produce any significant amounts of copper prior to the production from the copper mines acquired with Placer Dome.
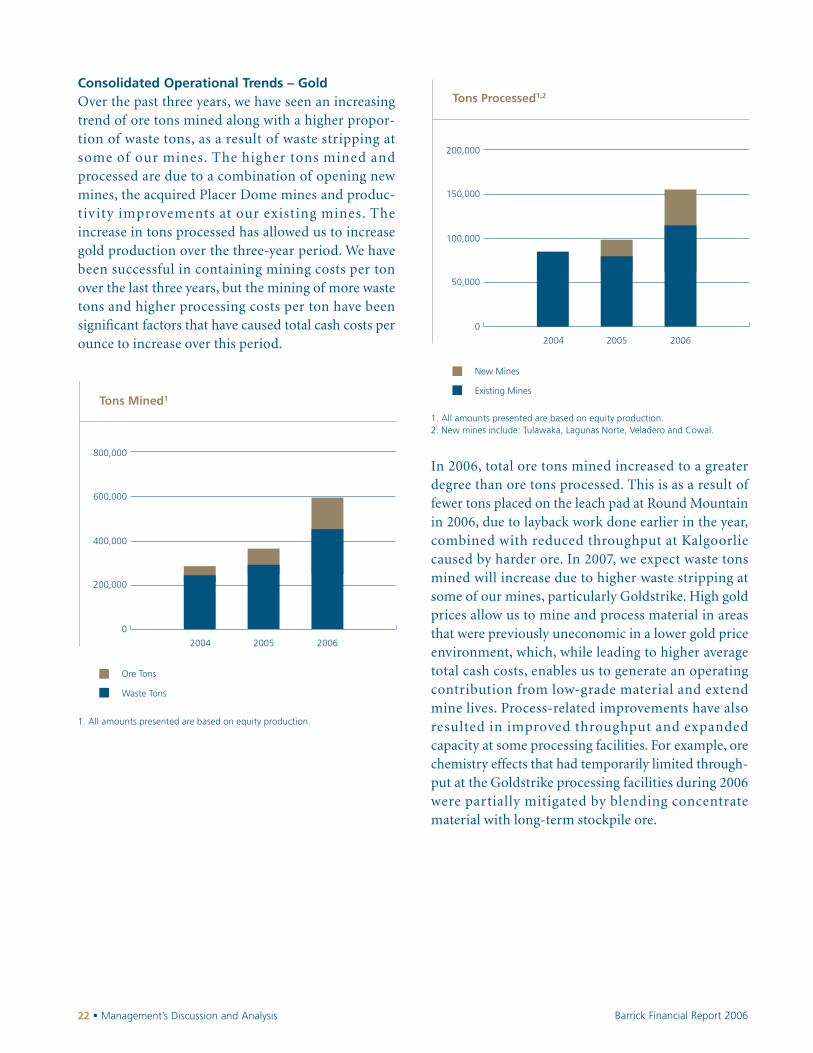
Consolidated Operational Trends – GoldOver the past three years, we have seen an increasingtrend of ore tons mined along with a higher propor-tion of waste tons, as a result of waste stripping atsome of our mines. The higher tons mined andprocessed are due to a combination of opening newmines, the acquired Placer Dome mines and produc-tivity improvements at our existing mines. Theincrease in tons processed has allowed us to increasegold production over the three-year period. We havebeen successful in containing mining costs per tonover the last three years, but the mining of more wastetons and higher processing costs per ton have beensignificant factors that have caused total cash costs perounce to increase over this period.
1. All amounts presented are based on equity production.
0
200,000
400,000
600,000
800,000
2004 2005 2006
Ore Tons
Waste Tons
Tons Mined1
1. All amounts presented are based on equity production.2. New mines include: Tulawaka, Lagunas Norte, Veladero and Cowal.
In 2006, total ore tons mined increased to a greaterdegree than ore tons processed. This is as a result offewer tons placed on the leach pad at Round Mountainin 2006, due to layback work done earlier in the year,combined with reduced throughput at Kalgoorliecaused by harder ore. In 2007, we expect waste tonsmined will increase due to higher waste stripping atsome of our mines, particularly Goldstrike. High goldprices allow us to mine and process material in areasthat were previously uneconomic in a lower gold priceenvironment, which, while leading to higher averagetotal cash costs, enables us to generate an operatingcontribution from low-grade material and extendmine lives. Process-related improvements have alsoresulted in improved throughput and expandedcapacity at some processing facilities. For example, orechemistry effects that had temporarily limited through-put at the Goldstrike processing facilities during 2006were partially mitigated by blending concentratematerial with long-term stockpile ore.
0
50,000
100,000
150,000
200,000
2004 2005 2006
New Mines
Existing Mines
Tons Processed1,2
22 � Management’s Discussion and Analysis Barrick Financial Report 2006
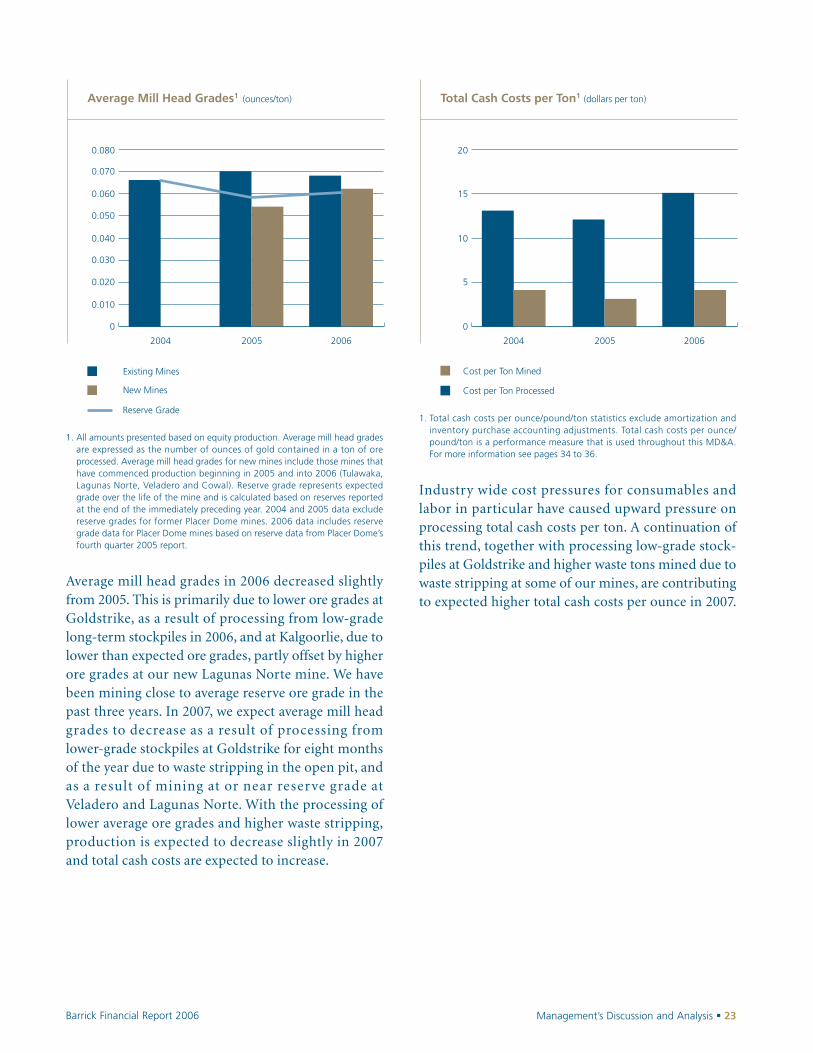
1. All amounts presented based on equity production. Average mill head gradesare expressed as the number of ounces of gold contained in a ton of oreprocessed. Average mill head grades for new mines include those mines thathave commenced production beginning in 2005 and into 2006 (Tulawaka,Lagunas Norte, Veladero and Cowal). Reserve grade represents expectedgrade over the life of the mine and is calculated based on reserves reportedat the end of the immediately preceding year. 2004 and 2005 data excludereserve grades for former Placer Dome mines. 2006 data includes reservegrade data for Placer Dome mines based on reserve data from Placer Dome’sfourth quarter 2005 report.
Average mill head grades in 2006 decreased slightlyfrom 2005. This is primarily due to lower ore grades atGoldstrike, as a result of processing from low-gradelong-term stockpiles in 2006, and at Kalgoorlie, due tolower than expected ore grades, partly offset by higherore grades at our new Lagunas Norte mine. We havebeen mining close to average reserve ore grade in thepast three years. In 2007, we expect average mill headgrades to decrease as a result of processing fromlower-grade stockpiles at Goldstrike for eight monthsof the year due to waste stripping in the open pit, andas a result of mining at or near reserve grade atVeladero and Lagunas Norte. With the processing oflower average ore grades and higher waste stripping,production is expected to decrease slightly in 2007and total cash costs are expected to increase.
2004 2005 2006
0
0.020
0.040
0.060
0.070
0.050
0.030
0.010
0.080
Existing Mines
New Mines
Reserve Grade
Average Mill Head Grades1 (ounces/ton)
1. Total cash costs per ounce/pound/ton statistics exclude amortization andinventory purchase accounting adjustments. Total cash costs per ounce/pound/ton is a performance measure that is used throughout this MD&A.For more information see pages 34 to 36.
Industry wide cost pressures for consumables andlabor in particular have caused upward pressure onprocessing total cash costs per ton. A continuation ofthis trend, together with processing low-grade stock-piles at Goldstrike and higher waste tons mined due towaste stripping at some of our mines, are contributingto expected higher total cash costs per ounce in 2007.
2004 2005 2006
0
5
10
15
20
Cost per Ton Processed
Cost per Ton Mined
Total Cash Costs per Ton1 (dollars per ton)
Management’s Discussion and Analysis � 23Barrick Financial Report 2006

Operating Segments – GoldNorth America
Producing MinesThrough the Placer Dome acquisition (after taking intoaccount the sale of assets to Goldcorp) we acquiredfour producing mines in North America. The minesacquired from Placer Dome are Cortez (60% owned),Turquoise Ridge (75% owned) and Bald Mountain inNevada, and Golden Sunlight in Montana. We alsoacquired three significant projects in North America:Cortez Hills, within the Cortez Joint Venture area ofinterest in Nevada (60% owned); Pueblo Viejo in theDominican Republic (60% owned); and Donlin Creekin Alaska (30% owned with earn-in rights to 70%).
0
1,000
2,000
3,000
4,000
0
100
200
300
400
2004 2005 2006 2007E
Placer Dome Sites
Barrick Sites
Cash Cost
North America Operational Performance
Gold production(000s ounces)
Gold total cash cost(dollars per ounce)
In 2006, the region produced 3.4 million ouncesof gold (2005: 2.9 million ounces) at total cash costs of$314 per ounce (2005: $244 per ounce) in line with theguidance for 2006. The 18% increase in gold produc-tion over the prior year period was primarily due tothe acquired Placer Dome operations, partially offsetby lower production at Goldstrike, Eskay Creek andRound Mountain. Although gold production at Cortezlagged expectations earlier in 2006, due to laybackwork resulting in lower processed ore grades, full-yearproduction was higher than expected due to betterthan planned ore grades encountered in the secondhalf of 2006. At Golden Sunlight, production waslower than expected due to high-wall instability issuesexperienced during the first half of the year, whichlimited access to high-grade ore for the remainder ofthe year. Excavation and development of the newNorth Ramp pit access at the Golden Sunlight minewas completed in August and ground monitoringequipment was put in place to help mitigate theimpact of future slides, but the site is nonetheless vul-nerable to continued high-wall instability challenges.We are advancing feasibility studies that could resultin mine expansion and higher levels of production atBald Mountain beginning in 2009, subject to the tim-ing of permitting. Lower production from Goldstrikein 2006 was primarily attributed to lower-grade oreprocessed from the open-pit stockpiles and ore chem-istry effects that temporarily limited throughput at theGoldstrike processing facilities. In fourth quarter2006, we were able to partially mitigate the above orechemistry effects by blending concentrate materialwith long-term stockpile ore. At Eskay Creek, fewertons at lower grades are being mined as the minereaches the end of its reserve life. At Round Mountain,layback efforts during the year as part of the plannedpit expansion project, resulted in fewer ore tons minedand more waste. This was partly mitigated by higherthan planned ore grades during the year.
24 � Management’s Discussion and Analysis Barrick Financial Report 2006

Total cash costs per ounce increased by 29% overthe prior year period. Higher costs resulted primarilyfrom higher prices paid for input commodities andconsumables used in the production process, andhigher royalties and production taxes due to highermarket gold prices. The region’s major consumablessuch as tires, labor, cyanide, propane and diesel expe-rienced an increase in price of 15% to 25%, whichaccounts for the majority of the increase in total cashcosts per ounce. These cost increases were partiallymitigated by higher than expected silver by-productcredits at Eskay Creek due to high market silver prices($4 per ounce) and better than expected silver grades,and lower power costs at Goldstrike due to the com-missioning of the Western 102 power plant. Year-to-date power savings from the Western 102 power plant,compared to local public utility rates, are estimated at$9 per ounce for the Goldstrike property and $5 perounce for the region.
In 2007, we expect gold production of 3.150 to 3.250 million ounces at total cash costs of $370 to $385per ounce from the North America region. Productionis expected to be lower than 2006 as increases in pro-duction due to the start-up of the Ruby Hill and Stormmines is expected to be more than offset by lower pro-duction at Goldstrike and Round Mountain. Gold-strike will be processing lower-grade ore stockpiles forabout eight months of the year due to waste strippingin the open pit. Production is expected to be lower atBald Mountain due to lower ore grades, partly offset byhigher ore tons processed. Total cash costs per ouncefor the region is expected to be higher than 2006 dueto general inflationary cost pressures, the start up ofthe Ruby Hill and Storm mines, and higher waste tonsmined at some of our mines.
Significant ProjectsRuby Hill is an open pit mine with primarily oxidematerial. Actual construction costs are expected to bebelow the estimate of $75 million, including almost$30 million in new mining equipment and processingupgrades. Ore processing includes on-site gold recov-ery by zero-discharge heap leach and carbon columnfacilities. At the end of 2006, Ruby Hill had provenand probable reserves of 1.1 million ounces of gold.1
First gold production occurred in February 2007 andthe mine is expected to produce about 120,000 ouncesat total cash costs of $240 to $250 per ounce for 2007.
Cortez Hills is our most advanced project and iscurrently in the permitting stage. The project involvesthe development of two adjacent deposits – CortezHills and Pediment – within the Cortez Joint Venturearea of interest. The project will be developed as twoopen pits with part of the deposit potentially to bemined by underground mining methods. In 2006,activities included the procurement of mining equip-ment, the construction of the F-Canyon power line,and underground exploration decline development.Geological, geotechnical and hydrological site data continues to be collected for use in the undergroundpre-feasibility study. In 2007 we expect to advanceexploration drilling by approximately 200,000 feet,and complete the detailed engineering and planning.The project construction budget is $480 million to$500 million2 (100% basis). Construction activities areexpected to last 15 months and will commence oncethe Environmental Impact Study Record of Decisionis obtained, which is anticipated to be received in 2008.Our share of production from Cortez is expected toaverage 425–440 thousand ounces at total cash costs of$290 to $300 per ounce in the first 10 years after pro-duction commences from Cortez Hills.
Management’s Discussion and Analysis � 25Barrick Financial Report 2006
1. For a breakdown of reserves and resources by category and additional information relating to reserves and resources, see pages 128–136 of thisFinancial Report 2006.
2. Excluding capitalized interest.

In May 2006, a joint venture agreement withGoldcorp was finalized, which establishes Barrick asthe 60% owner and operator of the Pueblo Viejo proj-ect. The Pueblo Viejo project is located in the Domini-can Republic, 15 kilometers southwest of the provincialcapital of Cotui and approximately 100 kilometersnorthwest of the national capital, Santo Domingo. Theaccess to the property is via paved national highwayswhich will require minor repairs to allow for trans-portation of heavy equipment to the site. We initiated a project review in March 2006 and must give notice to the government by February 2008 whether we planto proceed with development. Since last March, wehave updated capital costs estimates, re-evaluated theprocess flowsheet, optimized the project and carriedout an exploration program. Our review has resultedin a new silver process that is expected to increase sil-ver recovery from 5% to 84%; inclusion of a copperrecovery circuit; and potential inclusion of a zincrecovery process (currently being tested). The projecthas high power requirements due to high levels of sul-phur contained in the ore and we are investigatingoptions for the sourcing of power. At year end, ourshare of proven and probable gold reserves at PuebloViejo was 10.9 million ounces.1 We also reportedmeasured and indicated resources of 1.3 millionounces and 2.7 million ounces in the inferred cate-gory.2 Annual gold production in the first full five yearsof production is expected to be between 775 to 800thousand ounces of gold at total cash costs of $180 to$190 per ounce. Concurrent with the review andupdate of the feasibility analysis, activities relating togovernment and community relations and environ-mental permitting for the mine are ongoing.
An updated capital cost estimate for the PuebloViejo project was completed in 2006. The revised costestimate is $2.1 billion to $2.3 billion3, an increase from
the $1.35 billion estimated in the feasibility analysisprepared by Placer Dome in 2005. The increase is dueto the effect of design adjustments, capital required toenable recovery of the by-product metals (copper, sil-ver, and zinc) and significant inflationary cost pressuresin the industry (reflecting the cost environment prevail-ing in late 2006). Our 2007 objectives are to completeengineering, confirm zinc assumptions and test pro-gram; complete negotiations with the government;finalize a power sourcing strategy; continue to expandthe community development programs; and advanceexploration and metallurgical programs.
The Donlin Creek project is a large refractory golddeposit in Southwestern Alaska, under lease from twoAlaska aboriginal corporations until 2015 and for solong thereafter as mining operations are carried out onthe property. The Donlin Creek property is beingexplored and developed under a Mining VentureAgreement (“MVA”) between NovaGold and Barrick,entered into in November 2002. Under the terms ofthat agreement, we currently hold a 30% interest in theproject with the right to increase that interest to 70%by satisfying the following conditions on or beforeNovember 12, 2007: (1) funding of $32 million ofexploration and development expenditures on the project; (2) delivering a feasibility study to NovaGoldmeeting the requirements set out in the MVA; and (3) obtaining the approval of Barrick’s Board ofDirectors to construct a mine on the property. Thefunding condition was satisfied in March 2006. Sinceacquiring control of Placer Dome, we have moved deci-sively to ensure that the appropriate financial, technicaland human resources are being devoted to the timelycompletion of the required feasibility study at DonlinCreek and fulfill the back-in requirements to increaseour stake in Donlin Creek to 70%. In addition, we haveassigned technical personnel from both inside of
26 � Management’s Discussion and Analysis Barrick Financial Report 2006
1. Calculated in accordance with National Instrument 43-101 as required byCanadian securities regulatory authorities. For United States reporting pur-poses, Industry Guide 7, (under the Securities and Exchange Act of 1934), asinterpreted by Staff of the SEC, applies different standards in order to classifymineralization as a reserve. Accordingly, for U.S. reporting purposes, PuebloViejo is classified as mineralized material. For a breakdown of reserves andresources by category and additional information relating to reserves andresources, see pages 128–136 of this Financial Report 2006.
2. For a breakdown of reserves and resources by category and additional information relating to reserves and resources, see pages 128–136 of thisFinancial Report 2006.
3. Excluding capitalized interest.
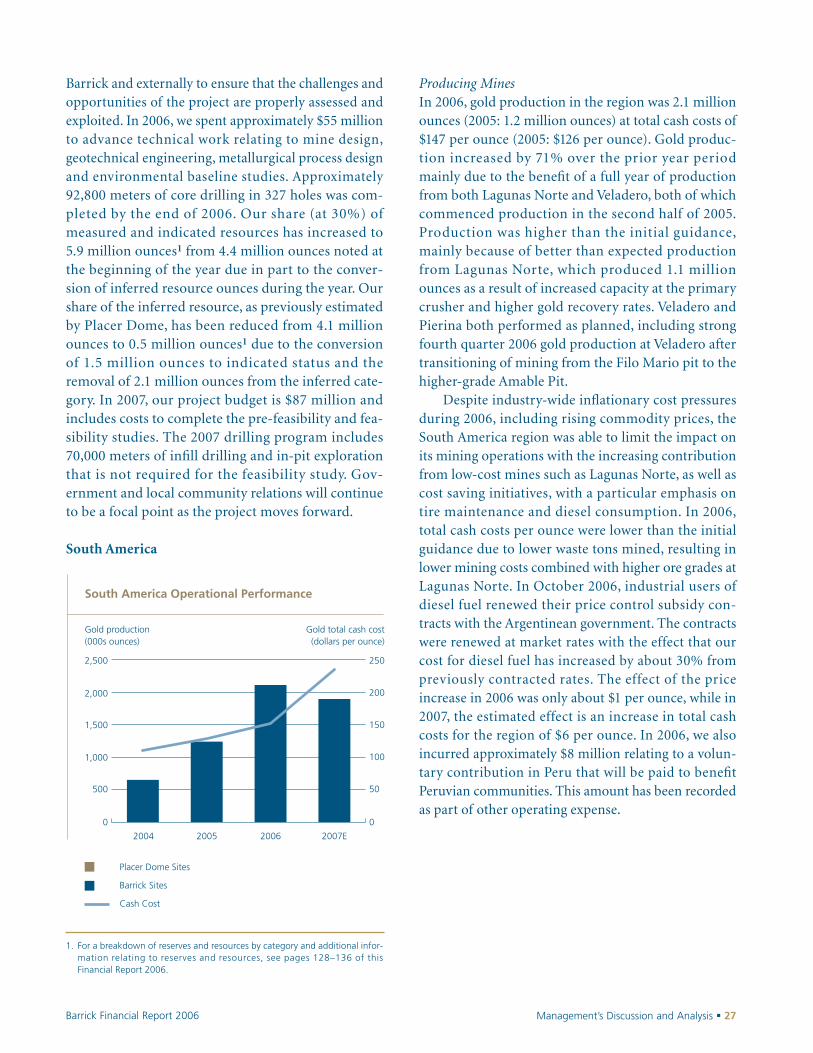
Barrick and externally to ensure that the challenges andopportunities of the project are properly assessed andexploited. In 2006, we spent approximately $55 millionto advance technical work relating to mine design,geotechnical engineering, metallurgical process designand environmental baseline studies. Approximately92,800 meters of core drilling in 327 holes was com-pleted by the end of 2006. Our share (at 30%) ofmeasured and indicated resources has increased to 5.9 million ounces1 from 4.4 million ounces noted atthe beginning of the year due in part to the conver-sion of inferred resource ounces during the year. Ourshare of the inferred resource, as previously estimatedby Placer Dome, has been reduced from 4.1 millionounces to 0.5 million ounces1 due to the conversionof 1.5 million ounces to indicated status and theremoval of 2.1 million ounces from the inferred cate-gory. In 2007, our project budget is $87 million andincludes costs to complete the pre-feasibility and fea-sibility studies. The 2007 drilling program includes70,000 meters of infill drilling and in-pit explorationthat is not required for the feasibility study. Gov-ernment and local community relations will continueto be a focal point as the project moves forward.
South America
0
1,000
500
1,500
2,000
2,500
0
100
50
150
200
250
2004 2005 2006 2007E
Placer Dome Sites
Barrick Sites
Cash Cost
South America Operational Performance
Gold production(000s ounces)
Gold total cash cost(dollars per ounce)
Producing MinesIn 2006, gold production in the region was 2.1 millionounces (2005: 1.2 million ounces) at total cash costs of$147 per ounce (2005: $126 per ounce). Gold produc-tion increased by 71% over the prior year periodmainly due to the benefit of a full year of productionfrom both Lagunas Norte and Veladero, both of whichcommenced production in the second half of 2005.Production was higher than the initial guidance,mainly because of better than expected productionfrom Lagunas Norte, which produced 1.1 millionounces as a result of increased capacity at the primarycrusher and higher gold recovery rates. Veladero andPierina both performed as planned, including strongfourth quarter 2006 gold production at Veladero aftertransitioning of mining from the Filo Mario pit to thehigher-grade Amable Pit.
Despite industry-wide inflationary cost pressuresduring 2006, including rising commodity prices, theSouth America region was able to limit the impact onits mining operations with the increasing contributionfrom low-cost mines such as Lagunas Norte, as well ascost saving initiatives, with a particular emphasis ontire maintenance and diesel consumption. In 2006,total cash costs per ounce were lower than the initialguidance due to lower waste tons mined, resulting inlower mining costs combined with higher ore grades atLagunas Norte. In October 2006, industrial users ofdiesel fuel renewed their price control subsidy con-tracts with the Argentinean government. The contractswere renewed at market rates with the effect that ourcost for diesel fuel has increased by about 30% frompreviously contracted rates. The effect of the priceincrease in 2006 was only about $1 per ounce, while in2007, the estimated effect is an increase in total cashcosts for the region of $6 per ounce. In 2006, we alsoincurred approximately $8 million relating to a volun-tary contribution in Peru that will be paid to benefitPeruvian communities. This amount has been recordedas part of other operating expense.
Management’s Discussion and Analysis � 27Barrick Financial Report 2006
1. For a breakdown of reserves and resources by category and additional infor-mation relating to reserves and resources, see pages 128–136 of thisFinancial Report 2006.
In 2007, we expect gold production of 1.850 to 1.925 million ounces at total cash costs of $230 to $245per ounce. Production is expected to be lower than2006 primarily due to lower ore grades at LagunasNorte. Total cash costs per ounce are expected to behigher than 2006 due to the impact of lower produc-tion at Lagunas Norte, higher waste stripping costs atVeladero as mining transitions to the Filo Federico pit,combined with inflationary cost pressures.
Significant ProjectsIn 2004, we made a decision to proceed with thedevelopment of the Pascua-Lama project, contingenton obtaining the necessary permits, approvals andresolving certain fiscal matters. The Pascua-Lamaproject is unique in that it is a bi-national project witha mineral deposit that spans the border betweenArgentina and Chile. It is located in the FronteraDistrict within approximately 10 kilometers of ourVeladero mine. The project is at an elevation of 3,800to 5,200 meters. Pascua-Lama’s proximity to Veladerois expected to provide benefits during both the con-struction phase and once operations have com-menced, derived from shared infrastructure, localsupplier development, training and employee devel-opment. As well, we expect that the construction ofPascua-Lama will benefit from our experience in con-structing Veladero, a mine that was very similar interms of the challenges for construction. In February2006, the Pascua-Lama project was granted approvalby the Chilean environmental regulatory authoritiesin Resolution RCA 024. The Resolution imposes otherconditions on the development of the project, theimplications of which have re sulted in thereclassification of about 1 million ounces of reservesto mineralized material for reporting purposes. InDecember 2006, the Province of San Juan, Argentinaissued its Declaration of Environmental ImpactAssessment which approves the environmental permitsubmission in Argentina. We are developing detailedengineering plans and have begun submission of doc-umentation to obtain the administrative and sectoral
approvals and permits that are required prior to initi-ating construction in either country. In addition, thegovernments of Chile and Argentina must resolve cer-tain remaining fiscal matters, including taxation, relat-ing to the bi-national project. The timing of receipt ofapprovals for permitting and licensing, cross-borderapprovals and operating issues and fiscal tax and roy-alty items are largely beyond the control of theCompany. The project team is using this period toadvance activities possible within the current permit-ting outline, including site topography and controlsurveys, as well as detailed geotechnical and geotec-tonic information required for sectoral permitting.
At the end of 2006, Pascua-Lama had gold reservesof 17.0 million ounces1, 1.4 million ounces less thanpreviously estimated due principally to the reclassifi-cation of approximately 1 million ounces of reserves to mineralized material as a result of the conditions ofthe Resolution. Pascua-Lama also has 689 millionounces of silver and 565 million pounds of coppercontained in the gold reserves.1 In 2006, we updatedour feasibility study, including capital and operatingcost estimates for the Pascua-Lama project from thoseestimates that were previously completed in June 2004.The total estimated cost of construction is $2.3 billionto $2.4 billion, an increase from the previous cost esti-mate of $1.4 to $1.5 billion2 provided in July 2004. Theincrease in capital cost is due primarily to inflationarycost pressures (reflecting the cost environment prevail-ing in late 2006). Although inflationary cost pressureshave increased the capital and operating cost estimatesat Pascua-Lama, we are currently evaluating possibleimprovement opportunities that may enhance projecteconomics. Initial annual gold production in the firstfive years at Pascua-Lama is expected to be between750 to 775 thousand ounces at total cash costs of $40to $50 per ounce.
28 � Management’s Discussion and Analysis Barrick Financial Report 2006
1. For a breakdown of reserves and resources by category and additional information relating to reserves and resources, see pages 128–136 of thisFinancial Report 2006.
2. Excluding capitalized interest.

Australia Pacific
Producing MinesThrough the Placer Dome acquisition, we acquired fourproducing gold mines and a copper-gold mine. Theacquired Placer Dome gold mines are Porgera (75%owned) in Papua New Guinea, and Kanowna, GrannySmith and Henty, in Australia. Gold production for theregion in 2006 was 2.2 million ounces (2005: 0.9 mil-lion ounces), at total cash costs of $353 per ounce(2005: $257 per ounce). The increase in gold produc-tion in 2006 was mainly due to the contribution fromthe acquired Placer Dome mines, combined with pro-duction start-up at our newly constructed Cowal mine,partially offset by lower production from Kalgoorlie.Total gold production for 2006 was slightly below theinitial guidance, mainly due to lower production atKalgoorlie and a small delay in the start-up at Cowal.
0
1,000
500
1,500
2,000
2,500
0
90
180
270
450
360
2004 2005 2006 2007E
Placer Dome Sites
Barrick Sites
Cash Cost
Australia-Pacific Operational Performance
Gold production(000s ounces)
Gold total cash cost(dollars per ounce)
Total cash costs per ounce were higher in 2006compared to the prior year, and also higher than themost recent guidance issued in second quarter 2006 of $330 to $345 per ounce, due to higher currencyexchange rates and higher costs for labor and inputcommodities, including diesel fuel. Higher mainte-nance costs, as equipment fleets age, and the lowerproduction levels at some mines also contributed tothe higher total cash costs per ounce. To help mitigaterising oil prices and control the cost of fuel consump-tion, we put in place a fuel hedge position.
At Kalgoorlie, production in 2006 was lower thanthe prior year due to reduced throughput caused byharder ore, together with lower than expected oregrades. Throughput improvements were expectedthrough the replacement of a damaged girth gear ear-lier in the year, but these improvements were offset bythe effect of more abrasive, harder ore than originallyanticipated. A number of improvement programs havebeen commenced, designed to address key issues suchas shovel and truck productivity and mill throughput.
At Porgera, remediation of the West Wall cutbackhas precluded mining of Stage 5 of the pit, with con-sequent lower production levels until mining ofhigher grade ore recommences. Installation of a but-tress was completed in December 2006, and the mineis in the process of removing the buttress ramps,which is the critical path to recommence mining onStage 5. We expect the first blast to take place inFebruary 2007. Mill feed at Porgera in 2006 principallycame from low-grade long-term stockpiles. OnDecember 13, 2006, an explosion caused by a light-ning strike resulted in substantial damage to the HidesPower Station, Porgera’s main source of power. Therewere no serious injuries, but extensive damage to thepower station resulted in a reduction of productioncapacity to approximately half of normal levels. Weexpect that production will return to normal levelsnear the end of the first quarter 2007, after repairs tothe power station are completed. A claim under ourbusiness interruption insurance policy has been initi-ated to compensate for the lost production.
Management’s Discussion and Analysis � 29Barrick Financial Report 2006

Our newly constructed Cowal mine went into pro-duction in May of 2006. The total cost of constructionof the mine was $417 million. The projected cost ofconstruction exceeded the $335 million previously esti-mated in 2005 due to construction delays that resultedin an increase in the construction workforce asattempts were made to meet the planned timing of theproject, and due to greater than expected input costs,including labor, contractors, steel and fuel. Gold pro-duction was below expectation during the start-upphase as the grade of the soft oxide ore underper-formed against plan, but has since improved with theinstallation of the ball mill. Production during firstquarter 2007 could be impacted by a shortage ofprocess water as a result of the drought affecting thearea. To mitigate the effects of the drought, we havesecured supplies of water from alternate sources andare in the process of constructing additional water stor-age facilities.
In November 2006, we signed a sale agreement fordisposition of our Paddington operations in Australiafor $39 million. The Paddington operations, whichform part of our Kanowna mine acquired in theacquisition of Placer Dome, consist of the Paddingtonmill and certain tenements in the region near the mill.The transaction is expected to close in the first quar-ter of 2007.
In 2007, we expect gold production of 2.2 to 2.3 million ounces at total cash costs of approximately$385 to $400 per ounce. Gold production is expectedto be similar to 2006, with higher production fromPorgera and Cowal offset by lower production atKanowna and Granny Smith. The expected increase inproduction is primarily due to higher ore grades atPorgera and the first full year of production fromCowal. The expected decrease at Kanowna is due tolower production as a result of the sale of the Pad-dington assets. At Granny Smith, lower ore grades areexpected due to the depletion of the Wallaby open pitdeposit and the processing of low-grade stockpiles.
Total cash costs per ounce are expected to be higher in2007 due to a higher average currency hedge rate com-bined with higher waste tons mined at some minesand inflationary cost pressures relating to labor andother consumables.
Africa
Producing MinesThrough the Placer Dome acquisition, we acquiredtwo producing gold mines in Africa, South Deep(50%) in South Africa, and North Mara in Tanzania.As described on page 19, we completed the sale ofSouth Deep to Gold Fields in 2006. Gold productionfor 2006 was 0.9 million ounces (2005: 0.4 millionounces), at total cash costs of $315 per ounce (2005:$336 per ounce). Gold production and total cash costsper ounce were both within the ranges of guidanceissued for 2006. Production for 2006 was higher thanthe prior year due to the contribution from theacquired Placer Dome mines, together with higher
0
500
250
750
1,000
0
100
200
400
300
2004 2005 2006 2007E
Placer Dome Sites
Barrick Sites
Cash Cost
Africa Operational Performance
Gold production(000s ounces)
Gold total cash cost(dollars per ounce)
30 � Management’s Discussion and Analysis Barrick Financial Report 2006

production at Bulyanhulu and Tulawaka. North Mara’sproduction was positively impacted by the results ofmining the Gokona ore body rather than processing ofpredominantly lower-grade stockpiles. At Tulawaka,higher production in 2006 was a result of more hoursavailable to process material, as well as higher oregrades and increased throughput due to the process-ing of softer oxide ore. Production at Bulyanhuluimproved as a result of the completion of projects toremove technical constraints to hoisting and plantthroughput rates.
Production at South Deep was lower than ex-pected as a result of the skip accident that occurred insecond quarter 2006. A fully loaded skip fell down themain shaft in May during routine maintenance, result-ing in the restricted production for the remainder ofthe year being hoisted from the lower capacity southshaft. An underground fire broke out in August 2006,resulting in some of the higher grade mining areasbecoming inaccessible during the remainder of 2006,which also impacted gold production levels.
During fourth quarter 2006, we reached an agree-ment in principle with the Tanzanian government tomake additional annual payments under the Miningand Development Agreements (“MDA”). Under theagreement, Barrick will pay $7 million per year to theGovernment, and has committed to make more use ofTanzanian supplies and services. We expect the agree-ment to be concluded early in 2007 and we haveaccrued $7 million at December 31, 2006. This amounthas been recorded in other operating expense in the Financial Statements. The payment of this amountwill be reviewed by both parties should economic conditions deteriorate.
Higher production at North Mara, Bulyanhuluand Tulawaka, partly offset by higher labor and con-tractor costs, had a favorable impact on total cashcosts per ounce compared to the prior year. Increasesin labor cost for the region caused an increase in totalcash costs of approximately $6 per ounce. As with ourmines in other regions, higher input commodityprices are leading to higher cash costs. In the Africaregion, input commodity prices are controlled bymeans of using preferred suppliers. Freight and ship-ping costs are significant, but through proper planningand logistics, freight and shipping costs on input com-modities can be effectively controlled. The regionalsupply chain team is in the process of implementingforward purchase agreements on critical supply items.
At South Deep, business interruption insurancehas mitigated the impact on total cash costs of the skipaccident in the main shaft. In 2006, insurance pro-ceeds related to the skip accident, included in totalcash costs, including the share attributed to GoldFields, totaled $22 million. Substantially all insuranceproceeds related to the underground fire will be to theaccount of Gold Fields.
In 2007, we expect gold production of 0.825 to 0.875 million ounces at total cash costs of $310 to $325per ounce from the Africa region. We expect lowerproduction in 2007 as increases in production atBulyanhulu and Tulawaka are more than offset by theimpact of the sale of our 50% interest in South Deepin late 2006, in which our share of production in 2006was approximately 124,000 ounces. Total cash costsper ounce for the region are expected to be slightlylower than 2006 primarily as a result of the sale of thehigher cost South Deep mine and higher productionat Tulawaka, partially offset by higher labor and con-sumables costs.
Management’s Discussion and Analysis � 31Barrick Financial Report 2006
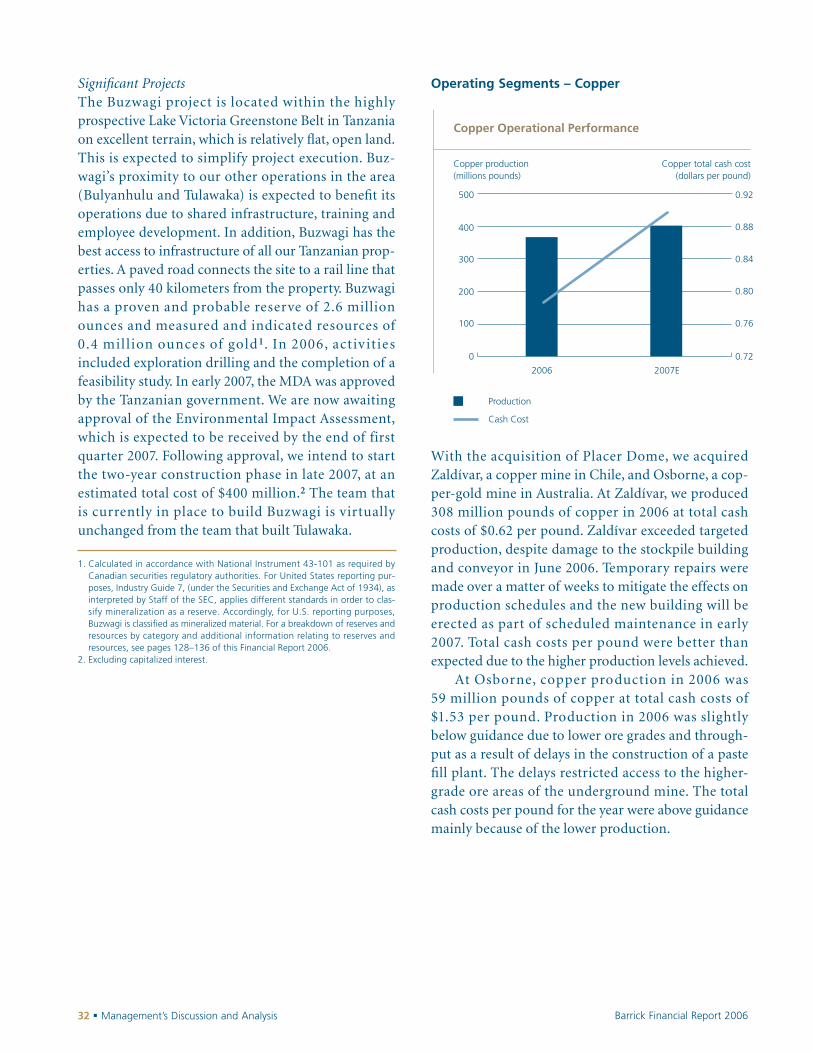
Significant ProjectsThe Buzwagi project is located within the highlyprospective Lake Victoria Greenstone Belt in Tanzaniaon excellent terrain, which is relatively flat, open land.This is expected to simplify project execution. Buz-wagi’s proximity to our other operations in the area(Bulyanhulu and Tulawaka) is expected to benefit itsoperations due to shared infrastructure, training andemployee development. In addition, Buzwagi has thebest access to infrastructure of all our Tanzanian prop-erties. A paved road connects the site to a rail line thatpasses only 40 kilometers from the property. Buzwagihas a proven and probable reserve of 2.6 millionounces and measured and indicated resources of0.4 mil lion ounces of gold1. In 2006, activ itiesincluded exploration drilling and the completion of afeasibility study. In early 2007, the MDA was approvedby the Tanzanian government. We are now awaitingapproval of the Environmental Impact Assessment,which is expected to be received by the end of firstquarter 2007. Following approval, we intend to startthe two-year construction phase in late 2007, at anestimated total cost of $400 million.2 The team that is currently in place to build Buzwagi is virtuallyunchanged from the team that built Tulawaka.
Operating Segments – Copper
With the acquisition of Placer Dome, we acquiredZaldívar, a copper mine in Chile, and Osborne, a cop-per-gold mine in Australia. At Zaldívar, we produced308 million pounds of copper in 2006 at total cashcosts of $0.62 per pound. Zaldívar exceeded targetedproduction, despite damage to the stockpile buildingand conveyor in June 2006. Temporary repairs weremade over a matter of weeks to mitigate the effects onproduction schedules and the new building will beerected as part of scheduled maintenance in early2007. Total cash costs per pound were better thanexpected due to the higher production levels achieved.
At Osborne, copper production in 2006 was 59 million pounds of copper at total cash costs of$1.53 per pound. Production in 2006 was slightlybelow guidance due to lower ore grades and through-put as a result of delays in the construction of a pastefill plant. The delays restricted access to the higher-grade ore areas of the underground mine. The totalcash costs per pound for the year were above guidancemainly because of the lower production.
0
200
100
300
400
500
0.72
0.80
0.76
0.84
0.88
0.92
2006 2007E
Production
Cash Cost
Copper Operational Performance
Copper production(millions pounds)
Copper total cash cost(dollars per pound)
32 � Management’s Discussion and Analysis Barrick Financial Report 2006
1. Calculated in accordance with National Instrument 43-101 as required byCanadian securities regulatory authorities. For United States reporting pur-poses, Industry Guide 7, (under the Securities and Exchange Act of 1934), asinterpreted by Staff of the SEC, applies different standards in order to clas-sify mineralization as a reserve. Accordingly, for U.S. reporting purposes,Buzwagi is classified as mineralized material. For a breakdown of reserves andresources by category and additional information relating to reserves andresources, see pages 128–136 of this Financial Report 2006.
2. Excluding capitalized interest.

In 2006, we met our guidance for consolidatedcopper production and total cash costs per pound. In2007, we expect to produce about 400 million poundsof copper at total cash costs of about $0.90 per pound.We expect higher copper production from Zaldívar in2007, primarily because of the higher-grade ore minedand placed on the leach pad in 2006 that will be pro-duced in 2007. At Osborne, the paste fill plant isexpected to be operational late in first quarter 2007and will provide access to higher-grade ore blocks.The Trekelano open-pit project at Osborne com-menced production during fourth quarter 2006 and isnow supplementing the ore supply from under-ground. The ore grade from Trekelano is lower, but isexpected to complement the higher-grade under-ground ore sources and allow higher throughput ratesto be achieved in 2007.
Total cash costs per pound at Zaldívar are expectedto be higher than 2006 due to higher prices for com-modities and consumables as well as inflationary costpressures. Total cash costs per pound at Osborne areexpected to be lower in 2007 due to higher production.
Other Significant ProjectsIn April 2005, we entered into a joint venture agree-ment with Falconbridge Limited (“Falconbridge”) withrespect to the Kabanga nickel deposit and related con-cession in Tanzania. In 2006, Xstrata Plc (“Xstrata”)acquired Falconbridge. Xstrata is the operator of thejoint venture and the project is currently in the pre-feasibility stage. Kabanga, which is one of the largestundeveloped nickel sulphide deposits in the world,is located in northwest Tanzania. The property isapproximately 385 kilometers from Bulyanhulu andapproximately 200 kilometers west of Tulawaka and isaccessible by paved/gravel road. In 2006, ongoing dia-mond drilling, exploration and other project develop-ment engineering activities being managed by Xstratahave been performed as part of a work plan to preparean updated resource model and scoping study. Xstratahas recently completed the $50 million work plan thatwas contemplated in the joint venture agreement.At December 31, 2006 our share of indicated nickelresources at Kabanga was 254 million pounds ofnickel.1 We also had inferred resources of 1.1 billion
pounds of nickel.1 This is an increase from prior esti-mates and is the result of the recently discoveredTembo and Tusker zones. The new discoveries at Temboand Tusker are near surface and at good ore grade andhave the potential to significantly enhance the econom-ics of the Kabanga project. In 2007, Xstrata plans to pre-pare a pre-feasibility study. In accordance with the jointventure agreement, Xstrata has committed to spend an additional $95 million, which will be used to fundthe pre-feasibility study with funds remaining for othersubsequent activities. After the $95 million spent by Xstrata, funding will be shared equally by Barrickand Xstrata.
Sedibelo is a large platinum deposit in SouthAfrica. The Sedibelo platinum project is located innorthern South Africa within the Western Limb of theprolific Bushveld Igneous Complex (“Bushveld”). TheBushveld is the source of 80% of the world’s platinumreserves and 70% of the world’s platinum production.As operator of the project, we have a 50% earn-inright to this project. We will earn a 10% interest oncompletion of a feasibility study and an additional40% interest once a decision to construct a mine hasbeen made. We will fund the exploration and feasibil-ity study. Funding during the construction of the minewill be shared 50% by each of the partners. In 2006,we commenced work on a pre-feasibility study. AtDecember 31, 2006, the deposit had 3.8 million ouncesof measured and indicated platinum resources.2 Theproject also had 5.3 million ounces of inferred plat-inum resources.2 Mineralization is close to surfacewhich is expected to facilitate a possible open pitmine. In 2007, we expect to spend about $26 millionto complete a pre-feasibility study as well as for otherdrilling and planning activities.
Fedorova is a palladium and platinum develop-ment project with nickel, copper and gold by-productslocated in the Kola Peninsula of the Russian Feder-ation. We own 50% (with an earn-in right to 79%) ofFedorova. We are also the operator. Fedorova is a largenear surface PGM (platinum group metals) deposit.
Management’s Discussion and Analysis � 33Barrick Financial Report 2006
1. For a breakdown of reserves and resources by category and additional information relating to reserves and resources, see pages 128–136 of thisFinancial Report 2006.
2. Calculated as at December 31, 2006 in accordance with National Instrument43-101 as required by Canadian securit ies regulatory authorit ies.Calculations have been prepared by or under the supervision of HannesHenckel, Manager Exploration and Geology of Barrick. Sedibelo measuredand indicated resources have been estimated using varying cut-off rates, asapplicable, depending on the ore type, and other relevant factors.

At December 31, 2006 we had 1.1 million ounces ofpal ladium and 0.3 mil l ion ounces of platinumresources categorized to measured and indicated sta-tus.1 We also had 1.3 million ounces of palladium and0.3 million ounces of platinum resources categorizedto inferred resources.1 With regard to smelting, workto date indicates recoveries are good. The 2006 drillingprogram has allowed for the completion of a pre-feasi-bility study and has provided the necessary support todeclare our equity portion of Fedorova as a resource.In 2007, we expect to spend $30 million towards thecompletion of a feasibility study, including approxi-mately 60,000 meters of drilling.
Exploration StrategyOur exploration strategy for 2007 will focus on thereplacement of mine production through a combina-tion of exploration, corporate development and projectdevelopment. Our 2007 budget is $170 million and isweighted towards near-term discovery around ourexisting operations while still maintaining a balancedportfolio in order to generate projects for the future.A significant portion of our budget will be spent inNevada, our key district. Exploration will also befocused in the Frontera District around Pascua-Lamaand Veladero. Drill testing of targets in the vicinity ofthe Veladero mine (Filo Sur) is underway, where thegoal is to define reserves and resources close to existingmine infrastructure.
We indirectly own a 37.5% interest in Reko Diqthrough our investment in Atacama. Reko Diq is a largecopper-gold porphyry mineral resource on the Tethyanbelt, located in southwest Pakistan in the province ofBaluchistan. The Tethyan belt is a prospective groundfor large copper-gold porphyries. At December 31,2006, our share of measured and indicated copperresources at Reko Diq was 5.7 billion pounds of cop-per.1 We also had inferred copper resources of 4.3 bil-lion pounds of copper.1 In 2006, 25,030 meters ofexploration drilling was completed. A $30 millionbudget (100% basis) has been approved for 2007,including a scoping study, exploration activities includ-ing 69,000 meters of drilling, preparation of an updatedresource model and construction of an airstrip.
Total Cash Costs Performance MeasuresTotal cash costs include all costs absorbed into inven-tory, including royalties, by-product credits, productiontaxes and accretion expense, and exclude inventorypurchase accounting adjustments and amortization.The presentation of these statistics in this mannerallows us to monitor and manage those factors thatimpact production costs on a monthly basis. We cal-culate total cash costs based on our equity interest in production from our mines. Total cash costs perounce/pound/ton are calculated by dividing the aggre-gate of these costs by gold ounces, copper pounds soldor ore tons processed. Total cash costs and total cashcosts per ounce/pound/ton are calculated on a consis-tent basis for the periods presented. In our incomestatement, we present amortization separately fromcost of sales. Some companies include amortization incost of sales, which results in a different measurementof cost of sales in the income statement. We have pro-vided reconciliations below to illustrate the impact ofexcluding amortization and inventory purchaseaccounting adjustments from total cash costs perounce/pound/ton statistics. Under purchase account-ing rules, we recorded the fair value of acquired workin progress and finished goods inventories as at the dateof the Placer Dome acquisition. As the acquired inven-tory is sold, any purchase accounting adjustmentsreflected in the carrying amount of inventory at acqui-sition impact cost of sales. The method of valuing theseinventories is based on estimated selling prices lesscosts to complete and a reasonable profit margin. Con-sequently, the fair values do not necessarily reflect coststo produce consistent with ore mined and processedinto gold and copper after the acquisition.
34 � Management’s Discussion and Analysis Barrick Financial Report 2006
1. For a breakdown of reserves and resources by category and additional information relating to reserves and resources, see pages 128–136 of thisFinancial Report 2006.

We believe that using an equity interest presenta-tion is a fairer, more accurate way to measure economicperformance than using a consolidated basis. For mineswhere we hold less than a 100% share in the produc-tion, we exclude the economic share of gold productionthat flows to our partners who hold a non-controllinginterest. Consequently, for the South Deep and Tula-waka mines, although we fully consolidated thesemines in our Financial Statements, our production andtotal cash cost statistics only reflect our equity share ofthe production.
In managing our mining operations, we disaggre-gate cost of sales between amortization and the othercomponents of cost of sales. We use total cash costs perounce/pound/ton statistics as a key performance mea-sure internally to monitor the performance of ourregional business units. We use these statistics to assesshow well our regional business units are performingagainst internal plans, and also to assess the overalleffectiveness and efficiency of our mining operations.We also use amortization costs per ounce/pound/tonstatistics to monitor business performance. By disag-gregating cost of sales into these two components andseparately monitoring them, we are able to better iden-tify and address key performance trends. We believethat the presentation of these statistics in this mannerin our MD&A, together with commentary explainingtrends and changes in these statistics, enhances theability of investors to assess our performance. Thesestatistics also enable investors to better understandyear-over-year changes in cash production costs, whichin turn affect our profitability and ability to generatecash flow.
The principal limitation associated with total cashcosts per ounce/pound/ton statistics is that they donot reflect the total costs to produce gold/copper,which in turn impacts the earnings of Barrick. Webelieve that we have compensated for this limitationby highlighting the fact that total cash costs excludeamortization and inventory purchase accountingadjustments as well as providing details of the finan-cial effect. We believe that the benefits of providingdisaggregated information outweigh the limitation inthe method of presentation of total cash costs perounce/pound/ton statistics.
Total cash costs per ounce/pound/ton statistics are intended to provide additional information, do not have any standardized meaning prescribed by USGAAP and should not be considered in isolation or asa substitute for measures of performance prepared inaccordance with US GAAP. The measures are not nec-essarily indicative of operating profit or cash flow fromoperations as determined under US GAAP. Other com-panies may calculate these measures differently.
Management’s Discussion and Analysis � 35Barrick Financial Report 2006

Illustration of Impact of Excluding Certain Costs from Total Cash Costs per Ounce/Pound/Ton
For the three months For the years ended ended December 31 December 31
Gold Copper Gold Copper1
($ millions, except per ounce/pound/ton
information in dollars) 2006 2005 2006 2006 2005 2004 2006
Cost of sales2 $ 652 $ 367 $ 108 $ 2,343 $ 1,214 $ 1,047 $ 393Cost of sales at South Deep included in discontinued operations 12 – – 101 – – –Cost of sales attributable to non-controlling interests3 (11) (2) – (63) (7) – –Inventory purchase accounting adjustments included in cost of sales4 1 – (26) (11) – – (97)
Cost of sales as adjusted 654 365 82 2,370 1,207 1,047 296Amortization at producing mines – consolidated 180 124 31 627 409 425 66Amortization at South Deep included in discontinued operations – – – 18 – – –Amortization at producing mines attributable to
non-controlling interests3 (2) (2) – (16) (5) – –
Amortization at producing mines – equity basis 178 122 31 629 404 425 66Inventory purchase accounting adjustments4 (1) – 26 11 – – 97
Cost of sales including amortization and inventory purchase accounting adjustments – equity basis $ 831 $ 487 $ 139 $ 3,010 $ 1,611 $ 1,472 $ 459
Total cash costs per ounce/pound For the three months For the years ended ended December 31 December 31
Gold Copper Gold Copper1
(Per ounce/pound information in dollars) 2006 2005 2006 2006 2005 2004 2006
Ounces/pounds sold – consolidated (thousands/millions) 2,314 1,663 100 8,566 5,353 4,936 376Sales attributable to non-controlling interests3 (31) (13) – (176) (33) – –
Ounces/pounds sold – equity basis 2,283 1,650 100 8,390 5,320 4,936 376
Total cash costs per ounce/pound – equity basis $ 287 $ 221 $ 0.82 $ 282 $ 227 $ 214 $0.79Amortization per ounce/pound – equity basis 77 74 0.31 76 76 86 0.17Inventory purchase accounting adjustments per ounce/pound – – 0.26 1 – – 0.26Cost of sales and amortization per ounce/pound attributable
to non-controlling interests3 1 – – 2 – – –
Total costs per ounce/pound5 – consolidated basis $ 365 $ 295 $ 1.39 $ 361 $ 303 $ 300 $1.22
Total cash costs per ton For the years ended December 31
Gold Copper1
(Per ton information in dollars) 2006 2005 2004 2006
Tons processed consolidated (millions of tons) 158 98 84 28Tons attributed to non-controlling interests (millions of tons)3 (1) – – –
Tons processed – equity (millions of tons) 157 98 84 28
Cost per ton – equity basis $ 15 $ 12 $ 12 $ 11Amortization per ton 4 4 5 2Inventory purchase accounting adjustments – – – 3Cost of sales and amortization per ton attributable to non-controlling interests3 1 – – –
Cost per ton5 – consolidated basis $ 20 $ 16 $ 17 $ 16
1. The 2005 and 2004 comparative periods for copper have been omitted as we did not produce any significant amounts of copper prior to the production from the copper mines acquired with Placer Dome.
2. The aggregate amount of cost of sales for gold and copper is as per Barrick’s income statement.3. Relates to a 30% interest in Tulawaka and a 50% interest in South Deep.4. Based on our equity interest.5. Includes amortization, amounts attributable to non-controlling interests and inventory purchase accounting adjustments.
36 � Management’s Discussion and Analysis Barrick Financial Report 2006

Other Costs and Expenses
Exploration Expense
($ millions) 2006 2005 2004 Comments on significant variances
Exploration
North America $ 64 $ 34 $ 30 2006 vs. 2005 – Expenditures are higher in 2006 due to activities at Goldstrike, Cortez,Bald Mountain, Round Mountain and Pueblo Viejo.
South America 22 19 20 2006 vs. 2005 – Expenditures are higher in 2006 due to activities at Lagunas Norte and Veladero.
Australia Pacific 44 13 17 2006 vs. 2005 – Expenditures are higher in 2006 due to activities at Porgera and otherPapua New Guinea exploration properties, Cowal, Plutonic and Kalgoorlie.
Africa 22 34 23 2006 vs. 2005 – Lower activity at Buzwagi, partly offset by higher expenditures atNyanzaga. 2005 vs. 2004 – Higher activity at Bulyanhulu.
Other 19 9 6 2006 vs. 2005 – Higher activity in Indonesia and Eurasia.
Total $ 171 $ 109 $ 96
Project Development Expense($ millions) 2006 2005 2004 Comments on significant variances
Mine development $ 78 $ 2 $ 15 2006 vs. 2005 – In 2006, expenditures were higher principally due to activities at acquiredPlacer Dome projects including Donlin Creek, Pueblo Viejo and Sedibelo. 2005 vs. 2004 –In 2004, Lagunas Norte development costs were expensed for part of the year.
Non-capitalizable project costs 24 20 12 Non-capitalizable costs mainly represent items incurred in the development/constructionphase that cannot be capitalized. 2006 vs. 2005 – Costs are higher in 2006 due to higherstart-up costs at Buzwagi, Taseevskoye and Pascua-Lama. 2005 vs. 2004 – Higheramounts for Cowal, Pascua-Lama and Veladero.
Business development/other 17 10 18 In 2006, expenditures were higher due to increase in research and development activity.
Total $ 119 $ 32 $ 45
Management’s Discussion and Analysis � 37Barrick Financial Report 2006
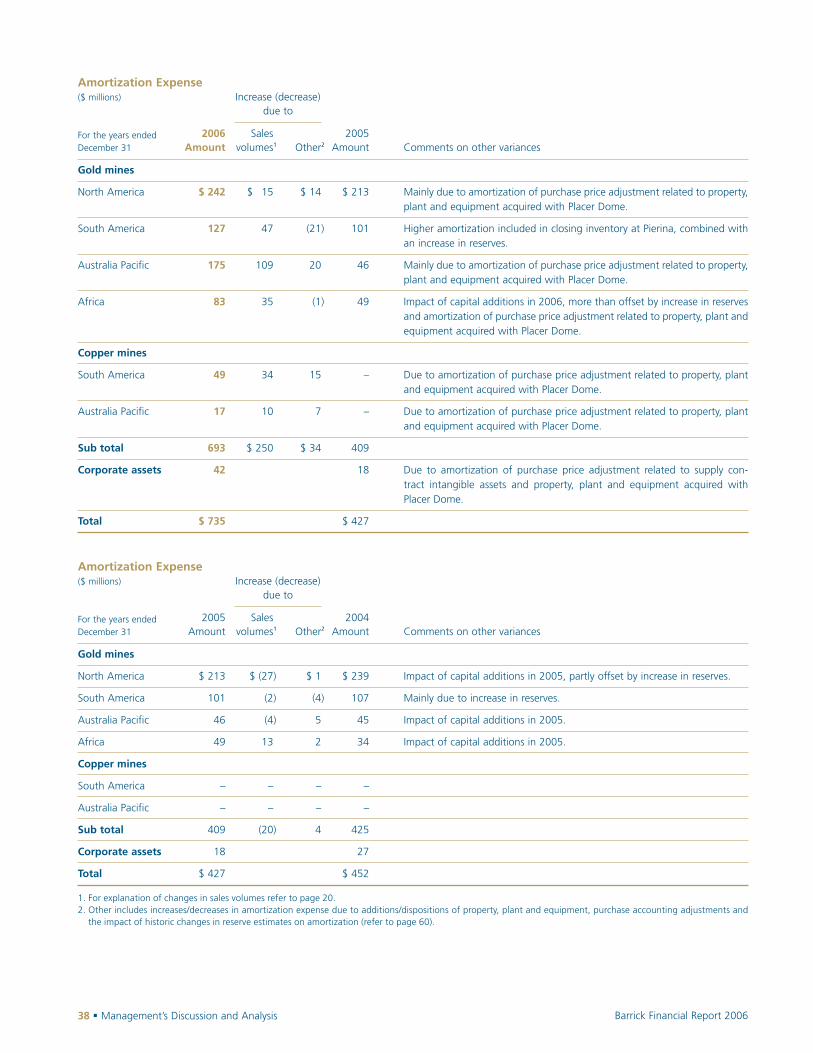
Amortization Expense($ millions) Increase (decrease)
due to
For the years ended 2006 Sales 2005December 31 Amount volumes1 Other2 Amount Comments on other variances
Gold mines
North America $ 242 $ 15 $ 14 $ 213 Mainly due to amortization of purchase price adjustment related to property,plant and equipment acquired with Placer Dome.
South America 127 47 (21) 101 Higher amortization included in closing inventory at Pierina, combined withan increase in reserves.
Australia Pacific 175 109 20 46 Mainly due to amortization of purchase price adjustment related to property,plant and equipment acquired with Placer Dome.
Africa 83 35 (1) 49 Impact of capital additions in 2006, more than offset by increase in reservesand amortization of purchase price adjustment related to property, plant andequipment acquired with Placer Dome.
Copper mines
South America 49 34 15 – Due to amortization of purchase price adjustment related to property, plantand equipment acquired with Placer Dome.
Australia Pacific 17 10 7 – Due to amortization of purchase price adjustment related to property, plantand equipment acquired with Placer Dome.
Sub total 693 $ 250 $ 34 409
Corporate assets 42 18 Due to amortization of purchase price adjustment related to supply con-tract intangible assets and property, plant and equipment acquired withPlacer Dome.
Total $ 735 $ 427
Amortization Expense($ millions) Increase (decrease)
due to
For the years ended 2005 Sales 2004December 31 Amount volumes1 Other2 Amount Comments on other variances
Gold mines
North America $ 213 $ (27) $ 1 $ 239 Impact of capital additions in 2005, partly offset by increase in reserves.
South America 101 (2) (4) 107 Mainly due to increase in reserves.
Australia Pacific 46 (4) 5 45 Impact of capital additions in 2005.
Africa 49 13 2 34 Impact of capital additions in 2005.
Copper mines
South America – – – –
Australia Pacific – – – –
Sub total 409 (20) 4 425
Corporate assets 18 27
Total $ 427 $ 452
1. For explanation of changes in sales volumes refer to page 20.2. Other includes increases/decreases in amortization expense due to additions/dispositions of property, plant and equipment, purchase accounting adjustments and
the impact of historic changes in reserve estimates on amortization (refer to page 60).
38 � Management’s Discussion and Analysis Barrick Financial Report 2006

Corporate Administration, Interest Income and Interest Expense($ millions)For the years ended December 31 2006 2005 2004 Comments on significant trends and variances
Corporate administration $ 142 $ 71 $ 71 2006 vs. 2005 – Increase in 2006 relates to the increase in scale of the Company after
the Placer Dome acquisition, and stock option expense in 2006 of $18 million.
Interest income 101 38 25 2006 vs. 2005 – Higher interest income in 2006 was mainly due to higher cash balancesin 2006. Also, in the first five months of 2006, a $19 million financing fee was paid byGoldcorp representing, in part, compensation for interest costs incurred by us to carrythe cost of financing related to certain operations sold to Goldcorp. 2005 vs. 2004 –Increase in the average cash balance, combined with an increase in market interest rates.
Interest costs
Total incurred 251 125 60 2006 vs. 2005 – Higher interest costs in 2006 were mainly due to $1.3 billion of debtassumed on the acquisition of Placer Dome, combined with interest relating to fundsdrawn under a credit facility that were used for the cash component of the cost of acquisition of Placer Dome and interest paid under our copper-linked notes issued inOctober 2006. 2005 vs. 2004 – Increase mainly due to new financing put in place in2004 and 2005.
Capitalized 102 118 41 2006 vs. 2005 – In 2006, interest was capitalized at our development projects, Pascua-Lama, Cowal and Ruby Hill. Also in 2006, we began to capitalize interest costs atprojects acquired from third parties including Cortez Hills, Donlin Creek, Pueblo Viejo,Sedibelo, Reko Diq and Buzwagi. 2005 vs. 2004 – Increased amounts were capitalizedin 2005 at Pascua-Lama, Cowal, Veladero, and Lagunas Norte development projects asconstruction costs were incurred and capitalized. Capitalization of interest at LagunasNorte ceased in third quarter 2005, while capitalization of interest at Veladero ceasedin fourth quarter 2005.
Interest expense allocated todiscontinued operations 23 – – Primarily relates to interest allocated to South Deep.
Expensed $ 126 $ 7 $ 19 2006 vs. 2005 – Higher interest costs in 2006 were mainly due to higher levels of debt out-standing after debt assumed with the acquisition of Placer Dome combined with loweramounts of interest capitalized to development projects in 2006 compared to 2005.
Management’s Discussion and Analysis � 39Barrick Financial Report 2006
Amortization expense recorded in the first nine monthsof 2006 reflects preliminary purchase price allocationsfor the acquired Placer Dome mines. In fourth quarter2006, valuations for the acquired mines were finalized,at which time amortization calculations were prospec-tively recorded to reflect adjustments to the prelimi-nary allocation. On finalization of the purchase price
allocation, we recorded amortization of purchase priceadjustments related to property plant and equipmenttotaling $29 million in fourth quarter 2006. Theamount recorded for all of 2006 was $47 million.We expect amortization expense to increase in 2007,primarily due to the final purchase price allocation forPlacer Dome mines.

Other Operating Expenses($ millions)For the years ended December 31 2006 2005 2004 Comments on significant trends and variances
Regional business unit overheads $ 88 $ 36 $ 24 2006 vs. 2005 – Higher overhead costs incurred in 2006 due to impact of the acquisi-tion of Placer Dome, including: increase in headcount at regional head offices; IT costsassociated with coordinating and standardizing communications and network systems;and recruitment and relocation costs.
Community development costs 15 – – Relates to amounts accrued for a voluntary contribution to be paid to benefit Peruviancommunities and amounts to be paid under a Mining Development Agreement to theTanzanian Government.
Environmental remediation cost 8 13 14
World Gold Council fees 13 10 9 Higher production levels in 2005 and 2006
Total $ 124 $ 59 $ 47
Impairment of Long-lived Assets($ millions)For the years ended December 31 2006 2005 2004 Comments on significant trends and variances
Eskay Creek $ – $ – $ 58 In 2004, we completed an impairment test for the Eskay Creek mine, due to a downwardrevision to reserves, the continued weakening of the US dollar that impacts Canadian dollar operating costs, and upward revisions in asset retirement obligation costs.
Peruvian exploration properties 17 – 67 In 2006, the carrying amount of Cuerpo Sur, an extension of Pierina, was tested forimpairment on completion of the annual life of mine planning process. An impairmentcharge of $17 million was recorded to reduce the carrying amount to the estimated fairvalue. In 2004, we completed an impairment test on a group of Peruvian exploration-stage properties based on finalization of the exploration program for the year and anupdated assessment of future plans for the property.
Other – – 14 2004 includes write-down on various exploration-stage properties.
Total $ 17 $ – $ 139
40 � Management’s Discussion and Analysis Barrick Financial Report 2006

Other Income($ millions)For the years ended December 31 2006 2005 2004 Comments on significant trends and variances
Non-hedge derivative gains $ – $ 6 $ 5
Gains on asset sales 9 5 36 In 2006, we sold various properties in Canada and Chile. In 2005, we sold certain landpositions in Australia. In 2004, we sold various mining properties, including the Holt-McDermott mine in Canada and certain land positions around our inactive mine sites inthe United States.
Gains on investment sales 6 17 6 $10 million of the gains recorded in 2005 related to the sale of investments held in arabbi trust for a deferred compensation plan. Other gains in all years mainly relate to thesale of various other investments.
Gain on Kabanga transaction – 15 – Gain recorded in 2005 relates to the closing of a transaction with Falconbridge relatingto Kabanga.
Gain on vend-in of assets to Highland Gold 51 – – In 2006 we exchanged various interests in mineral properties for 34.3 million Highland
shares with a fair value that exceeded the carrying amount of assets exchanged by $76 million, resulting in a gain of $51 million.
Royalty income 10 6 2
Sale of water rights 5 – –
Other 8 – –
Total $ 89 $ 49 $ 49
Other Expense($ millions)For the years ended December 31 2006 2005 2004 Comments on significant trends and variances
Impairment charges on investments $ 6 $ 16 $ 5 2006 impairment charge relates to the write-down of two investments, both of which
were considered to be impaired. 2005 impairment charge relates to the write-down oftwo investments which were determined to be impaired.
Changes in AROs at closed mines 53 15 22 In 2006, we recorded charges for changes in estimates of Asset Retirement Obligations(“AROs”) at closed mines of $37 million for the Nickel Plate property in British Columbia,Canada and $16 million for other properties.
Accretion expense at closed mines 8 10 7
Currency translation (gains) losses (2) (3) 1
Placer Dome integration costs 12 – –
Corporate transaction costs 7 – –
Other items 12 18 12 2005 and 2004 include litigation costs for major litigations.
Total $ 96 $ 56 $ 47
Management’s Discussion and Analysis � 41Barrick Financial Report 2006

On September 7, 2006 a fire occurred in the under-ground part of the Central Shaft at Highland’s Darasunmine. Highland’s management is currently uncertain of the amount of damage and potential impairment,
if any, at Darasun as necessary valuations and engi-neering studies have not been completed at the date ofthis MD&A.
Income tax expense increased in 2006 in comparisonto 2005 primarily due to the increase in pre-taxincome. Our underlying tax rate increased to 27% in2006 primarily due to the impact of a higher amountof deliveries into gold sales contracts in a low tax-ratejurisdiction at prices below the prevailing spot marketgold price than in 2005.
The underlying tax rate is expected to be approxi-mately 30% for 2007. This expected underlying rateexcludes the effect of gains and losses on non-hedgederivatives, the effect of delivering into gold sales con-tracts in a low tax-rate jurisdiction at prices below pre-vailing market prices, any tax rate changes, and anyrelease of deferred tax valuation allowances. In firstand second quarter 2006, the expected deliveries intoFloating Spot-Price Gold Sales Contracts are expectedto cause an increase in our reported effective tax ratebecause most of the deliveries will occur in a low tax-rate jurisdiction (see page 54).
We record deferred tax charges or credits if changesin facts or circumstances affect the estimated tax basisof assets and therefore the amount of deferred taxassets or liabilities or because of changes in valuationallowances reflecting changing expectations in our abil-ity to realize deferred tax assets. In 2006, we released$25 million of valuation allowances in the United Statesdue to the estimated effect of higher market gold prices
on the ability to utilize deferred tax assets. We released$9 million of valuation allowances in a Chilean entitydue to the availability of income. We released valuationallowances of $19 million in Canada reflecting utiliza-tion of capital losses. In 2005, we released valuationallowances totaling $32 million, of which $31 millionrelated to Argentina, in anticipation of higher levels offuture taxable income after production began at Vela-dero, and also due to the impact of higher market goldprices. In 2004, we recorded a tax credit of $141 millionon final resolution of a Peruvian tax assessment in ourfavor, as well as the reversal of other accrued costs total-ing $21 million ($15 million post-tax). We also recordedcredits of $81 million due to a change in tax status inAustralia following an election that resulted in a revalu-ation of assets for tax purposes; as well as an election tofile tax returns in US dollars, rather than Australiandollars. In 2005, we revised our estimate of the revalua-tion of assets for tax purposes due to the change in status, and recorded a further deferred tax credit of$5 million.
In 2006, an interpretative decision (“ID”) wasissued by the Australia Tax Office that clarified the taxtreatment of currency gains and losses on foreign cur-rency denominated liabilities. Under certain condi-tions, for taxpayers who have made the functionalcurrency election, and in respect of debt that existed
42 � Management’s Discussion and Analysis Barrick Financial Report 2006
Income Taxes
2006 2005 2004For the years ended December 31($ millions, except percentages)
Income tax Income tax Income taxEffective income tax rates Pre-tax Effective expense Pre-tax Effective expense Pre-tax Effective expenseon elements of income income tax rate (recovery) income tax rate (recovery) income tax rate (recovery)
Income tax expense before elements below $ 1,560 27% $ 420 $ 462 21% $ 97 $ 43 56% $ 24
Change in Australian tax status (31) (5) (81)
Tax rate changes 12 – –
Outcome of tax uncertainties – – (141)
Release of deferred tax valuation allowancesrecorded in prior years (53) (32) (5)
Total $ 348 $ 60 $ (203)

at the time the election was made, the ID providedclarification that unrealized foreign exchange gainsthat currently exist on intercompany debt will notcrystallize upon repayment of the debt. The effect ofthe ID was recorded as a $31 million increase todeferred tax assets.
In second quarter 2006, a new federal rate changewas enacted in Canada that lowered the applicable taxrate. The impact of this rate change was to reduce netdeferred tax assets in Canada by $34 million that wasrecorded as a component of deferred income taxexpense. Also in second quarter 2006, on the change ofthe tax status of a Canadian subsidiary, we recorded a
deferred income tax credit of $22 million, to reflect theimpact on the measurement of deferred income taxassets and liabilities.
The interpretation of tax regulations and legisla-tion and their application to our business is complexand subject to change. We have significant amounts ofdeferred tax assets, including tax loss carry forwards,and also deferred tax liabilities. Potential changes toany of these amounts, as well as our ability to realizedeferred tax assets, could significantly affect net incomeor cash flow in future periods. For more informationon tax valuation allowances, see page 64.
Management’s Discussion and Analysis � 43Barrick Financial Report 2006
Our financial results for the last eight quarters reflectthe following general trends: rising spot gold priceswith a corresponding rise in prices realized from goldsales, rising gold production and sales volumes as ournew mines began production in 2005 and 2006 and, infirst quarter 2006, our acquisition of Placer Dome.Results in 2006 benefited from the contribution ofgold and copper mines acquired in the Placer Domeacquisition. Although these trends continued in thesecond half of 2006, earnings in third quarter 2006were reduced by post-tax adjustments of $25 millionrelated to revisions to the AROs at a closed mine and
$12 million for non-hedge derivative losses. In fourthquarter 2006, sales and earnings were reduced as aresult of the delivery of gold ounces into gold salescontracts at a post-tax opportunity cost of $312 mil-lion. The effect on income of this charge was partiallymitigated by a post-tax gain of $288 million from thesale of the South Deep mine. The historic trends arediscussed elsewhere in this MD&A. The quarterlytrends are consistent with explanations for annualtrends over the last two years. Net income in eachquarter also reflects the timing of various special itemsthat are presented in the table on page 16.
Quarterly Information($ millions, except where indicated) 2006 2005
Q4 Q3 Q2 Q1 Q4 Q3 Q2 Q1
Sales $ 1,348 $ 1,573 $ 1,5111 $ 1,2041 $ 776 $ 627 $ 463 $ 484Net income from continuing operations 132 393 458 226 175 113 47 60Net income from continuing operations per
share – basic (dollars) 0.15 0.46 0.53 0.29 0.33 0.21 0.09 0.11Net income from continuing operations per
share – diluted (dollars) 0.15 0.45 0.52 0.29 0.32 0.21 0.09 0.11Net income 418 405 459 224 175 113 47 66Net income per share – basic (dollars) 0.48 0.47 0.53 0.29 0.33 0.21 0.09 0.12Net income per share – diluted (dollars) 0.48 0.46 0.53 0.29 0.32 0.21 0.09 0.12
1. Adjusted for the impact of reclassifying sales from our South Deep mine to discontinued operations.

Fourth Quarter ResultsIn fourth quarter 2006, we produced 2.4 millionounces of gold at total cash costs of $287 per ouncecompared to 1.6 million ounces at total cash costs of$221 per ounce in the prior-year quarter. We also pro-duced 100 million pounds of copper at total cash costsper pound of $0.82 during the quarter from two cop-per mines acquired with Placer Dome. Revenue forfourth quarter 2006 was $1,348 million on gold salesof 2.3 million ounces and copper sales of 100 millionpounds, compared to $776 million in revenue on justgold sales of 1.7 million ounces for the prior-yearquarter. Sales volumes increased due to the contribu-tion from new mines that began production in 2005and 2006, combined with sales from mines acquiredwith Placer Dome. During the quarter, spot goldprices averaged $614 per ounce. We realized an aver-age price of $461 per ounce during the quarter com-pared to the average spot price of $486 per ounce andan average realized price of $467 per ounce in theprior-year quarter. The realized price of gold was sub-stantially lower than the average spot-price due todelivery of 1.0 million ounces into gold sales contractsat an opportunity cost of approximately $143 perounce. We also recorded hedge accounting adjust-ments of $8 per ounce associated with legacy PlacerDome gold hedges. Earnings for fourth quarter 2006were $418 million ($0.48 per share on a diluted basis),$243 million ($0.16 per share on a diluted basis)higher than the prior-year quarter. The increase inearnings over the prior-year quarter reflects highergold sales volumes and realized gold prices, combinedwith earnings from copper sales, partly offset by theimpact of special items.
In fourth quarter 2006, we closed the sale of theSouth Deep mine to Gold Fields. The considerationwas $1.5 billion, of which $1.2 billion was paid in cashand $308 million in Gold Fields shares. On closing, werecorded a gain of $288 million, representing the con-sideration received less the carrying amount of netassets of South Deep, including goodwill relating toSouth Deep of $651 million. Also in the fourth quar-ter, we recorded a $51 million gain on closing of thevend-in to Highland.
Effect on Earnings Increase (Decrease)($ millions) Three months ended December 31
2006 2005Pre-tax Post-tax Pre-tax Post-tax
Non-hedge derivative gains (losses) $ 5 $ 11 $ (1) $ (1)
Gain on sale of South Deep 288 288 – –
Impairment charges on long-lived assets and investments (23) (18) (13) (13)
Inventory purchase accounting adjustments (25) (21) – –
Change in asset retirement obligation estimates (15) (10) (2) (3)
Deferred tax creditsChange in Australian
tax status – – – 5
Highland vend-in 51 51 – –
Peru voluntary contribution (8) (6) – –
Opportunity cost of deliveries into fixed-price Corporate Gold Sales Contracts (327) (312) (33) (33)
Hedge accounting adjustments related to the acquired Placer Dome gold hedge position (18) (11) – –
Total $ (72) $ (28) $ (49) $ (45)
In fourth quarter 2006, we generated operating cashflow of $337 million compared to operating cash flowof $269 million in the prior-year quarter. The positiveeffects of higher gold sales volumes and higher real-ized gold prices were offset by the $327 million oppor-tunity cost of deliveries into fixed-price CorporateGold Sales Contracts during fourth quarter 2006.
44 � Management’s Discussion and Analysis Barrick Financial Report 2006

Liquidity, Capital Resources and Financial Position
Cash Flow
Operating Activities
Operating cash flow increased by $1,396 million in 2006 to $2,122 million. The key factors that contributed to theyear over year increase are summarized in the table below.
Key Factors Affecting Operating Cash Flow
($ millions)
Impact on comparative operating cash flows
For the years ended 2006 vs. 2005 vs.
December 31 2006 2005 2004 2005 2004 Comments on significant trends and variances
Gold sales volumes (000s oz) 8,390 5,320 4,936 $ 666 $ 75 See page 20
Market gold prices ($/oz) 604 444 409 1,342 186 See page 7
Impact of gold sales contracts 532 56 89 (476) 33 See page 7
Higher copper earnings (millions lbs) 376 – – 833 – See page 20
Total cash costs gold ($/oz) 282 227 214 (461) (69) See page 20
Sub-total 1,904 225
Other inflows (outflows)
Higher expenses1 556 271 259 (285) (12)
Purchase of copper put options 26 – – (26) –
Non-cash working capital 42 (66) (86) 108 20 2006 vs. 2005 – Increase in taxes payable. 2005 vs. 2004 – Increasein accounts payable in 2005 mainly due to timing of payments andfor mines that began production in 2005.
Interest expense 126 7 19 (119) 12 See page 39
Income tax payments 280 80 45 (200) (35) 2006 vs. 2005 – Increased payments in 2006 related to acquisitionof Placer Dome. 2005 vs. 2004 – Increased payments in 2005 relatedto higher gold prices and the start of Lagunas Norte production.
Effect of other factors 14 7
Total $ 1,396 $ 217
1. Includes corporate administration, exploration, project development, and other operating expenses.
Management’s Discussion and Analysis � 45Barrick Financial Report 2006

Investing Activities($ millions)For the years endedDecember 31 2006 2005 2004 Comments
Project capital expenditures11
Pascua-Lama $ 113 $ 98 $ 35 Higher levels of activity since decision in mid-2004 to proceed with the project, as well development costs as capitalized interest since mid-2004.
Cowal construction 104 258 73 Production start-up in second quarter 2006 after a two-year construction phase,which began in second quarter 2004.
Ruby Hill development costs 29 35 – Construction activity started in first quarter 2005.
Cortez Hills 26 – – Construction activity at mine acquired with Placer Dome.
Tulawaka construction – 5 48 Production start-up in first quarter 2005.
Veladero construction – 213 284 Production start-up in fourth quarter 2005.
Lagunas Norte construction – 100 182 Construction activity started in second quarter 2004. Production start-up in second quarter 2005.
Western 102 Power Plant – 80 18 Construction activity started in first quarter 2004. Production start-up in fourth quar-ter 2005.
Other 13 – – Relates primarily to capitalized interest at Donlin Creek, Pueblo Viejo, Reko Diq,Sedibelo and Buzwagi.
Sub total 285 789 640
Regional capital expenditures
North America 202 103 86 2006 vs. 2005 – Higher expenditures due to the impact of Bald Mountain, TurquoiseRidge and Golden Sunlight, partly offset by lower expenditures at Marigold. 2005 vs.2004 – Higher regional capital expenditures at Goldstrike in 2005, in particular, a 100-ton shovel purchase and higher budgeted expenditures in general.
South America 248 114 8 2006 vs. 2005 – Higher expenditures in 2006 due to expenditures at Veladero relatedto capitalized pre-production stripping of the Filo Federico pit, combined with expen-ditures at Lagunas Norte and Zaldívar. 2005 vs. 2004 – Purchases of equipment at new mines.
Australia Pacific 255 50 37 2006 vs. 2005 – Higher expenditures due to the impact of Placer Dome mines, includ-ing $79 million spent at Porgera primarily related to the remediation of the West Wall cutback.
Africa 85 40 46 2006 vs. 2005 – Higher expenditures in 2006 due to the impact of North Mara andhigher expenditures at Bulyanhulu to install a carbon-in-leach plant.
Other 12 8 7
Sub total 802 315 184
Total $ 1,087 $ 1,104 $ 824
1. Includes both construction costs and capitalized interest.
46 � Management’s Discussion and Analysis Barrick Financial Report 2006
Investing activities in 2006 also included $1.3 billionin first quarter 2006 paid for the cash component ofthe cost of the Placer Dome acquisition, which, net ofcash acquired of $1.1 billion, led to a net cash outflowof $160 million. We recorded in cash flows of discon-tinued operations proceeds of $1.6 billion received on
closing of the sale of certain Placer Dome operationsand an intere st in the Pue blo Vie jo project toGoldcorp in second quarter 2006 and $1.2 billionreceived on closing of the sale of the South Deep mineto Gold Fields in fourth quarter 2006.

Financing ActivitiesThe most significant financing cash flows in 2006 were$2.2 billion on issue of long-term debt obligations,$1.8 billion to settle Placer Dome derivative positionsand cash receipts of $74 million received on the exer-cise of employee stock options partly offset by divi-dend payments made totaling $191 million. We alsomade scheduled payments under our long-term debtobligations totaling $1.6 billion in 2006.
LiquidityLiquidity ManagementLiquidity is managed dynamically, and factors thatcould impact liquidity are regularly monitored. Theprimary factors that affect liquidity include produc-tion levels, realized sales prices, cash production costs,future capital expenditure requirements, scheduledrepayments of long-term debt obligations, our creditcapacity and expected future debt market conditions.Working capital requirements have not historicallyhad a material effect on liquidity. Counterparties tothe financial instruments and gold sales contracts thatwe hold do not have unilateral and discretionaryrights to accelerate settlement of financial instrumentsor gold sales contracts, and we are not subject to anymargin calls.
Through the combination of a strong balance sheetand positive operating cash flows, we have been able tosecure financing, as required, to fund our capital proj-ects. We had three new mines start in 2005, with ourfourth and newest mine, Cowal, starting production insecond quarter 2006. The costs of construction forthese projects were financed through a combination ofoperating cash flows and the issuance of long-termdebt financing. Alternatives for sourcing our futurecapital needs include our significant cash position,unutilized credit facilities, future operating cash flow,project financings and public debt financings. Thesealternatives are evaluated to determine the optimal mixof capital resources for our capital needs. We expectthat, absent a material adverse change in a combinationof our sources of liquidity and/or a significant decline
in gold and copper prices, present levels of liquiditywill be adequate to meet our expected capital needs. Ifwe are unable to access project financing due to unfore-seen political or other problems, we expect that we willbe able to access public debt markets as an alternativesource of financing. Any additional indebtedness wouldincrease our debt payment obligations, and may nega-tively impact our results of operations.
Capital ResourcesAdequate funding is in place or available for all oursignificant projects. We plan to put in place projectfinancing for a portion of the expected constructioncost of a number of our projects; however, if we areunable to do so because of unforeseen political or otherchallenges, we expect to be able to fund the capitalrequired through a combination of existing capitalresources and future operating cash flows. For 2007,we expect that any capital required will be funded froma combination of our existing cash position and oper-ating cash flow.
In second quarter 2006, we received $1.6 billionfrom the sale of operations to Goldcorp. In third quar-ter 2006, we increased our $1 billion credit facility to$1.5 billion. In early October 2006, we issued $1 billionof copper-linked notes (the “Notes”) comprised of$400 million of 5.75% notes due 2016 and $600 mil-lion of 6.35% notes due 2036. During the first threeyears of these Notes, the original $1 billion of fundingis to be repaid in the dollar equivalent of approxi-mately 324 million pounds of copper, and is to bereplaced over those three years by $1 billion of fund-ing in the form of conventional interest-bearing notesmaturing in 2016 and 2036. The replacement of thecopper-linked portion of the notes with conventionalinterest-bearing notes during this period occurs simul-taneously such that the total amount outstanding atany time from issue date to maturity is $1 billion. InOctober 2006, we used a portion of the proceeds fromthe Notes to repay debt, and plan to use the remainingproceeds to repay other outstanding debt and to fundour development projects.
Management’s Discussion and Analysis � 47Barrick Financial Report 2006

Capital Resources1
($ millions)For the years ended December 31 2006 2005 2004
Opening capital resources $ 2,084 $ 2,476 $ 1,970
New sourcesOperating cash flow 2,122 726 509New and increases to financing
facilities2 1,550 134 1,056Proceeds from asset sales 2,850 – –
8,606 3,336 3,535Uses
Acquisition of Placer Dome (160) – –Other acquisitions3 (364) – –Settlement of acquired Placer
Dome hedge position andrepayment of debt4 (2,254) – –
Project capital5 (285) (789) (640)Regional capital5 (802) (315) (184)Dividends (191) (118) (118)Share buyback – – (95)Other 48 (30) (22)
Closing capital resources $ 4,598 $ 2,084 $ 2,476
Components of closing capital resources
Cash and equivalents $ 3,043 $ 1,037 $ 1,398Unutilized credit facilities6 1,555 1,047 1,078
Total $ 4,598 $ 2,084 $ 2,476
1. Capital resources include cash balances and sources of financing that havebeen arranged but not utilized.
2. In 2006, includes a second $50 million Peruvian bond offering, $500 millionincrease in our first credit facility and the issuance of $1 billion of copper-linkednotes. In 2005, includes the first $50 million Peruvian bond offering and $84 million lease facility for Lagunas Norte. In 2004, includes the $250 millionVeladero project financing, $750 million bond offering, and $56 million leasefacility for Lagunas Norte.
3. Includes acquisition of equity method investments, changes in available-for-sale securities and other acquisitions, net of cash acquired.
4. Represents $1,840 million paid to settle acquired Placer Dome hedge posi-tions, $337 million repayment of acquired Placer Dome credit facility afterwhich it was terminated, and $77 million related to the redemption of PlacerDome preferred shares.
5. Project capital represents capital invested in new projects to bring new minesinto production. Regional capital represents ongoing capital required at exist-ing mining operations. Sum of project and regional capital equals capitalexpenditures for the year.
6. Represents available amounts under our first credit facility of $1.5 billion and$55 million available on Peruvian lease facilities.
Credit Rating
At February 21, 2007 from major rating agencies:
Standard and Poor’s (“S&P”) A–Moody’s Baa1DBRS A
In 2006, following the acquisition of Placer Dome, ourratings were reviewed and confirmed by Moody’s and DBRS. S&P lowered our rating from “A” to “A–”,reflecting Placer Dome’s lower rating. Our ability toaccess unsecured debt markets and the related cost ofdebt financing is, in part, dependent upon maintain-ing an acceptable credit rating. A deterioration in ourcredit rating would not adversely affect existing debtsecurities or the terms of gold sales contracts, butcould impact funding costs for any new debt financ-ing. The key factors that are important to our creditrating include the following: our market capitaliza-tion; the strength of our balance sheet, including theamount of net debt and our debt-to-equity ratio; ournet cash flow, including cash generated by operatingactivities and expected capital expenditure require-ments; the quantity of our gold reserves; and our geopolitical risk profile.
Financial Position
Key Balance Sheet RatiosAs at December 31 2006 2005
Non-cash working capital ($ millions)1 $ 764 $ 231Net debt ($ millions)2 $ 1,064 $ 764Net debt-to-equity ratio3 0.07:1 0.20:1Current ratio4 4.85:1 3.64:1
1. Represents current assets, excluding cash and equivalents, less current liabil-ities, excluding short-term debt obligations.
2. Represents long-term and short-term debt less cash and equivalents.3. Represents net debt divided by total shareholders’ equity.4. Represents current assets divided by current liabilities, excluding short-term
debt obligations.
Non-cash working capital increased in 2006 mainly due to increases in inventory levels as a result of theacquisition of Placer Dome. Although operating cashflow exceeded capital expenditures in 2006, net debtincreased primarily as a result of settlement of acquiredPlacer Dome hedge positions. Higher cash balancespartly offset by higher short-term debt, caused our cur-rent ratio to increase at the end of 2006.
48 � Management’s Discussion and Analysis Barrick Financial Report 2006

Shareholders’ Equity
Outstanding Share DataConversion for
Shares Barrick commonoutstanding shares
As at February 7, 2007 No. of shares
Common shares 863,957,797Special voting shares 1Exchangeable shares1 1,366,015 723,989Stock options 18,406,815
1. Represents Barrick Gold Inc. (“BGI”) exchangeable shares. Each BGI share isexchangeable for 0.53 Barrick common shares.
For further information regarding the outstandingshares and stock options, please refer to the FinancialStatements and our 2006 Management InformationCircular and Proxy Statement.
Dividend PolicyIn each of the last five years, we paid a total cash divi-dend of $0.22 per common share – $0.11 in mid-Juneand $0.11 in mid-December. The amount and timingof any dividends is within the discretion of our Boardof Directors. The Board of Directors reviews the divi-dend policy semi-annually based on the cash require-ments of our operating assets , exploration anddevelopment activities, as well as potential acquisi-tions, combined with our current and projected finan-cial position.
Comprehensive IncomeComprehensive income consists of net income or loss,together with certain other economic gains and lossesthat collectively are described as “other comprehen-sive income” or “OCI”, and excluded from the incomestatement.
In 2006, other comprehensive income of $150 mil-lion mainly included gains of $17 million on hedgecontracts designated for future periods, caused pri-marily by changes in currency exchange rates, copperprices, gold prices and fuel prices; reclassificationadjustments totaling $77 million for losses on hedgecontracts designated for 2006 that were transferred toearnings in 2006; and a $43 million unrealizedincrease in the fair value of investments.
Included in other comprehensive income atDecember 31, 2006 were unrealized pre-tax gains oncurrency hedge contracts totaling $283 million, basedon December 31, 2006 market foreign exchange rates.The related hedge contracts are designated againstoperating costs and capital expenditures primarilyover the next three years, and are expected to helpprotect against the impact of strengthening of theAustralian and Canadian dollar against the US dollar.The hedge gains are expected to be recorded in earn-ings at the same time as the corresponding hedgedoperating costs and amortization of capital expendi-tures are also recorded in earnings.
Management’s Discussion and Analysis � 49Barrick Financial Report 2006
Contractual Obligations and CommitmentsPayments due
($ millions) 2012 and
At December 31, 2006 2007 2008 2009 2010 2011 thereafter Total
Long-term debt (1)Repayment of principal $ 737 $ 97 $ 101 $ 52 $ 25 $ 2,883 $ 3,895Interest 225 193 185 178 175 2,664 3,620
Asset retirement obligations (2) 42 64 114 79 58 536 893Capital leases 20 16 16 16 16 5 89Operating leases 6 2 1 1 – – 10Restricted share units 6 10 27 – – – 43Other post-retirement obligations 11 6 3 3 3 18 44Derivative liabilities (3) 82 35 2 111 2 – 232Royalty arrangements (4) 167 175 171 158 137 935 1,743Purchase obligations for supplies
and consumables (5) 261 150 33 130 7 – 581Capital commitments (6) 116 1 – – – – 117
Total $ 1,673 $ 749 $ 653 $ 728 $ 423 $ 7,041 $ 11,267

(1) Long-term Debt and InterestOur debt obligations do not include any subjectiveacceleration clauses or other clauses that enable theholder of the debt to call for early repayment, exceptin the event that we breach any of the terms and con-ditions of the debt or for other customary events ofdefault. The Bulyanhulu and Veladero financings arecollateralized by assets at the Bulyanhulu and Veladeromines, respectively. Other than this security, we arenot required to post any collateral under any debtobligations. The terms of our debt obligations wouldnot be affected by deterioration in our credit rating.Projected interest payments on variable rate debt werebased on interest rates in effect at December 31, 2006.Interest is calculated on our long-term debt obliga-tions using both fixed and variable rates.
(2) Asset Retirement ObligationsAmounts presented in the table represent the undis-counted future payments for the expected cost of assetretirement obligations.
(3) Derivative LiabilitiesAmounts presented in the table relate to hedge con-tracts disclosed under notes 18 and 19 to the FinancialStatements. Payments related to derivative contractscannot be reasonably estimated given variable marketconditions.
(4) RoyaltiesVirtually all of the royalty arrangements give rise toobligations as we produce gold. In the event that wedo not produce gold at our mining properties, we haveno payment obligation to the royalty holders. Theamounts disclosed are based on expected future goldproduction, using a spot gold price assumption of$625 per ounce. The most significant royalty agree-ments are disclosed in note 6 to our Financial State-ments. Based on 2006 production levels, an increasein market gold prices by $50 per ounce would resultin an annual increase in royalty payments of approxi-mately $18 million.
(5) Purchase Obligations for Supplies andConsumables
Purchase obligations for supplies and consumablesprimarily include commitments of approximately$180 million related to community development coststo be incurred at the Pascua-Lama project in Chile andArgentina.
(6) Capital CommitmentsPurchase obligations for capital expenditures includeonly those items where binding commitments havebeen entered into. Commitments at the end of 2006mainly related to construction capital at our projects.
Capital Expenditures Not Yet CommittedWe expect to incur capital expenditures during the nextfive years for both projects and producing mines. Theprojects are at various development stages, from pri-marily exploration or scoping studies through to con-struction execution. The ultimate decision to incurcapital at each potential site is subject to positive resultswhich allow the project to advance past decision hur-dles. Primary and significant projects in Barrick’s port-folio at December 31, 2006 include Ruby Hill, CortezHills, Buzwagi, Pascua-Lama, Pueblo Viejo, and DonlinCreek (refer to pages 24 to 34 for further details).
Payments to Maintain Land Tenure and MineralProperty RightsIn the normal course of business, we are required tomake annual payments to maintain title or rights tomine gold at certain of our properties. If we choose toabandon a property or discontinue mining operations,the payments relating to that property can be sus-pended, resulting in our rights to the property lapsing.The validity of mining claims can be uncertain andmay be contested. Although we have attempted toacquire satisfactory title to our properties, some riskexists that some titles, particularly title to undevel-oped properties, may be defective.
50 � Management’s Discussion and Analysis Barrick Financial Report 2006

Contingencies – LitigationWe are currently subject to various litigation as dis-closed in note 27 to the Financial Statements, and wemay be involved in disputes with other parties in thefuture that may result in litigation. If we are unable toresolve these disputes favorably, it may have a materialadverse impact on our financial condition, cash flowand results of operations.
Financial InstrumentsWe use a mixture of cash and long-term debt to main-tain an efficient capital structure and ensure adequateliquidity exists to meet the cash needs of our business.A discussion of our liquidity and capital structure canbe found on page 47. We use interest rate contracts tomitigate interest rate risk that is implicit in our cash
balances and outstanding long-term debt. In the nor-mal course of business, we are inherently exposed tocurrency and commodity price risk. We use currencyand commodity hedging instruments to mitigatethese inherent business risks. We also hold certainderivative instruments that do not qualify for hedgeaccounting treatment. These non-hedge derivativesare described in note 19 to our Financial Statements.For a discussion of certain risks and assumptions thatrelate to the use of derivatives, including market risk,market liquidity risk and credit risk, refer to notes 2and 19 to our Financial Statements. For a discussionof the methods used to value financial instruments, aswell as any significant assumptions, refer to note 19 toour Financial Statements.
Management’s Discussion and Analysis � 51Barrick Financial Report 2006
FinancialInstrument
Principal/Notional Amount
Associated Risks
Amounts Recorded in Earnings
Amounts NotRecorded in
Earnings
Cash and equivalents $3,043 million � Interest rate� Credit
Interest income less hedge gains on cashhedging instruments – 2006 – $102 million;2005 – $32 million; 2004 – $6 million
$Nil
Investments in available-for-sale securities
$646 million � Market Other income/expense – 2006 – $2 million gain; 2005 – $1 million gain; 2004 – $1 million gain
$53 million gainin OCI
Long-term debt $3,244 million � Interest rate Interest costs – 2006 – $126 million expensed($102 million capitalized); 2005 – $7 millionexpensed ($118 million capitalized); 2004 –$19 million expensed ($41 million capitalized)
Carrying valuegreater than fair value by $60 million
Hedging instruments –currency contracts
C$586 millionA$2,867 millionZAR 46 million
� Market/Liquidity� Credit
Hedge gains in cost of sales, corporateadministration and amortization – 2006 – $102 million; 2005 – $120 million;2004 – $112 million
$208 million gainin OCI
Copper hedges 300 millionpounds
� Market/Liquidity� Credit
$28 loss in revenue $57 million gainin OCI
Acquired Placer Dome gold hedges
Nil ounces � Market/Liquidity� Credit
$165 loss in revenue $17 million gainin OCI
Hedging instruments – fuel and propane contracts
Fuel – 4 million barrelsPropane – 18 million gallons
� Market/Liquidity� Credit
Hedge gains in cost of sales – 2006 – $16 million; 2005 – $10 million; 2004 – $4 million
$21 million gainin OCI
Debt hedging instruments –interest rate contracts
$500 million � Market/Liquidity� Credit
Change in fair value recorded in earnings –2006 – $1 million loss; 2005 – $13 millionloss; 2004 – $2 million gain
$17 million loss in OCI
Cash hedging instruments –interest rate contracts
$Nil � Market/Liquidity� Credit
Hedge gains/losses in interest income – 2006 – $1 million loss; 2005 – $6 million gain; 2004 – $19 million gain
$3 million loss in OCI
Non-hedge derivatives Various � Market/Liquidity� Credit
Gains in other income/expense – 2006 – $nil;2005 – $6 million; 2004 – $5 million
$Nil
1. Refer to pages 52 to 55 for information on gold and silver sales contracts.
Summary of Financial Instruments1
As at and for the year ended December 31, 2006

Placer Dome Gold Hedge PositionAt acquisition, Placer Dome had a net obligation todeliver approximately 7.7 million ounces of gold aswell as various other derivative positions. The aggre-gate fair value of these derivative positions wasrecorded as a liability of $1,707 million on January 20,2006. This Placer Dome gold hedge position has beenreduced to zero (on a net economic basis) at Decem-ber 31, 2006. The elimination of these hedges was donevia a combination of financial closeouts and offsettingpositions with 4.7 million ounces eliminated in firstquarter 2006 and 3 million ounces eliminated in sec-ond quarter 2006. The total cash required to settlethese Placer Dome gold hedge positions was approxi-mately $1.8 billion, with approximately $160 million tobe incurred in future periods for positions which havebeen economically offset but not yet settled.
The acquired Placer Dome positions receivedhedge accounting treatment from the date of theacquisition until they were eliminated and, therefore,had a designated date and price against specific futuregold sales. Due to the impact of hedge accounting forthese contracts, revenue recorded in 2006 was based onselling prices that approximated spot gold prices less afixed reduction of $165 million. At December 31, 2006,Barrick’s remaining fixed-price gold sales contractsstood at 1.3 million ounces of Corporate Gold SalesContracts, and a further 9.5 million ounces of ProjectGold Sales Contracts. Subsequent to December 31,2006, we reduced the fixed-price Corporate Gold SalesContract book to zero (see pages 52 to 55).
Off Balance Sheet ArrangementsWe have historically used gold and silver sales contractsas a means of selling a portion of our annual gold andsilver production. The contracting parties are bullionbanks whose business includes entering into contractsto purchase gold or silver from mining companies.Since 2001, we have been focusing on reducing the levelof outstanding gold and silver sales contracts. Theterms of our fixed-price gold and silver sales contractsenable us to deliver gold and silver whenever we chooseover the primarily ten-year term of the contracts.
On acquisition of Placer Dome, we acquired itspre-existing gold hedge position totaling 7.7 millionounces of committed gold obligations, which wasrecorded on our balance sheet at an estimated fairvalue based on a market gold price of $567 per ounceon the date of acquisition. Acquired gold forward salescontracts were designated as cash flow hedges of futuregold production. Changes in the fair value of thesecash flow hedges were recorded each period on thebalance sheet and in OCI to the extent they met ongo-ing accounting hedge effectiveness assessments untilthe hedges were economically closed out. In futureperiods, the hedge gain or loss that occurs between thedate of acquisition and the hedge designation date willbe recorded as a component of revenue on the hedgedesignation date. Revenue reported in each period willrepresent the cash proceeds for either spot sales orunder pre-existing Barrick normal sales contracts plusor minus a hedge gain or loss resulting from the cash flow hedges. The other acquired Placer Domederivative instruments were all classified as non-hedgederivatives from the date of acquisition. The cash settle-ments of liabilities under the acquired Placer Domederivatives positions are classified as financing activitiesin the cash flow statement in the Financial Statements.
52 � Management’s Discussion and Analysis Barrick Financial Report 2006

Project Gold Sales ContractsIn anticipation of building our projects, and in sup-port of any related financing, we have 9.5 millionounces of existing fixed-price gold sales contractsspecifically allocated to these projects. The allocationof these contracts will help reduce gold price risk atthe projects, and are expected to help secure financingfor construction. We expect that the allocation ofthese contracts will eliminate any requirement bylenders to add any incremental gold sales contracts in the future to support any financing requirements.The forward sales prices on our Project Gold SalesContracts have not been fully fixed, and thus remainsensitive to long-term interest rates. For these con-tracts, increasing long-term interest rates in the fourthquarter resulted in a higher expected realizable salesprice for these contracts. If long-term interest ratescontinue to rise, we anticipate the expected realizablesales price to increase.
As par t of our Master Trading Agreements(“MTAs”), Project Gold Sales Contracts are not sub-ject to any provisions regarding any financial go-aheaddecisions with construction, or any possible delay orchange in the project.
Key Aspects of Project Gold Sales ContractsAs of December 31, 2006
Expected delivery dates1 2010–2019, the approximateterms of the expected financing
Future estimated average realizable selling price $391/oz2
Mark-to-market value at December 31, 2006 ($3,187) million3
1. The contract termination dates are in 2016 in most cases, but we currentlyexpect to deliver production against these contracts starting in 2010, subjectto the timing of receipt of approvals of the environmental impact assess-ments, as well as the resolution of other external issues, both of which arelargely beyond our control.
2. Upon delivery of production from 2010–2019, the term of expected financ-ing. Approximate estimated value based on current market US dollar inter-est rates and on an average lease rate assumption of 0.75%.
3. At a spot gold price of $632 per ounce and market interest rates.
The allocation of gold sales contracts to projectsinvolves: i) the identification of contracts in quantitiesand for terms that mitigate gold price risk for the proj-ect during the term of the expected financing (con-tracts were chosen where the existing termination datesare spread between the targeted first year of productionand the expected retirement of financing for the proj-ect); and ii) the eventual settlement of proceeds fromthese contracts for the benefit of production.
Through allocation of these gold sales contracts tothese projects, we reduce capital risk. It protects thegold price during the term of the forecasted financing,while leaving the remaining reserves fully levered tospot gold prices.
Under the Project Gold Sales Contracts, we havean obligation to deliver gold by the termination date(currently 2016 in most cases). However, because wetypically fix the price of gold under our gold sales con-tracts to a date that is earlier than the termination dateof the contract (referred to as the “interim price-set-ting date”), the actual realized price on the contracttermination date depends upon the actual gold mar-ket forward premium (“contango”) between theinterim price-setting date and the termination date.Therefore, the $391/oz price estimate could changeover time due to a number of factors, including, butnot limited to: US dollar interest rates, gold lease rates,spot gold prices, and extensions of the terminationdate. This price, which is an average for the totalProject Gold Sales Contract position, is not necessarilyrepresentative of the prices that may be realized foractual deliveries into gold sales contracts, in particu-lar, if we choose to settle any gold sales contract inadvance of the termination date (which we have theright to do at our discretion). If we choose to acceler-ate gold deliveries, this would likely lead to reducedcontango that would otherwise have built up overtime (and therefore a lower realized price).
Management’s Discussion and Analysis � 53Barrick Financial Report 2006

The gold market forward premium, or contango,is typically closely correlated with the differencebetween US dollar interest rates and gold lease rates.An increase or decrease in US dollar interest rateswould generally lead to a corresponding increase ordecrease in contango, and therefore an increase ordecrease in the estimated future price of the contractat the termination date. Furthermore, the greater thetime period between the interim price-setting dateand the termination date, the greater the sensitivity ofthe final realized price to US dollar interest rates.
A short-term spike in gold lease rates would nothave a material negative impact on us because we arenot significantly exposed under our fixed-price goldsales contracts to short-term gold lease rate variations.A prolonged rise in gold lease rates could result in lower contango (or negative contango, i.e. “back-wardation”). Gold lease rates have historically tendedto be low, and any spikes short-lived, because of thelarge amount of gold available for lending relative to demand.
Corporate Gold Sales Contracts and Floating Spot-Price Gold Sales ContractsIn 2006, we reduced our fixed-price Corporate GoldSales Contracts through the delivery of 1.2 millionounces of production into contracts and convertingthe pricing of 0.5 million ounces into future spot pric-ing. We also reallocated 3.0 million ounces of hedgesto the Project Gold Sales Contracts.
As of February 21, 2007, we fully eliminated theremaining fixed-price Corporate Gold Sales Contracts.We expect to eliminate the entire Floating Spot-PriceGold Sales Contracts position through deliveries ofgold production before the end of the second quarterof 2007. This is expected to result in a reduction to ourpre-tax income and cash flow of $572 million in firstquarter 2007, and a reduction of $76 million in secondquarter 2007.
Fixed-Price Silver Sales ContractsAs of December 31, 2006
Millions of silver ounces 13Current termination date of
silver sales contracts 2016 in most casesAverage estimated realizable
selling price at 2016 termination date $8.42/oz1
Mark-to-market value at December 31, 2006 ($82) million2
1. Approximate estimated value based on current market contango of 2.50%.Accelerating silver deliveries could potentially lead to reduced contango thatwould otherwise have built up over time. Barrick may choose to settle anysilver sales contract in advance of this termination date at any time, at its discretion. Historically, delivery has occurred in advance of the contractualtermination date.
2. At a spot silver price of $12.90 per ounce.
We also have floating spot-price silver sales contractsunder which we are committed to deliver 7 millionounces of silver over the next ten years at spot prices,less an average fixed-price adjustment of $2.53 perounce. These floating spot-price contracts were previ-ously fixed-price contracts, for which, under the price-setting mechanisms of the MTAs, we elected to receivea price based on the market silver spot price at thetime of delivery, adjusted by the difference betweenthe spot price and the contract price at the time ofsuch election.
Key Terms of Gold and Silver Sales ContractsIn all of our MTAs, which govern the terms of goldand silver sales contracts with our 18 counterparties,the following applies:� The counterparties do not have unilateral and
discretionary “right to break” provisions.� There are no credit downgrade provisions.� We are not subject to any margin calls – regardless
of the price of gold or silver.� We have the right to settle our gold and silver sales
contracts on two days notice at any time during thelife of the contracts, or keep these forward gold andsilver sales contracts outstanding for up to 15 years.� At our option, we can sell gold or silver at the
market price or the contract price, whichever ishigher, up to the termination date of the contracts(currently 2016 in most cases).
54 � Management’s Discussion and Analysis Barrick Financial Report 2006

The MTAs with our counterparties do provide forearly close out of certain transactions in the event of amaterial adverse change in our ability or our principalhedging subsidiary’s ability to perform our or its goldand silver delivery and other obligations under theMTAs and related parent guarantees or a lack of goldor silver market, and for customary events of defaultsuch as covenant breaches, insolvency or bankruptcy.The principal financial covenants are:� We must maintain a minimum consolidated net
worth of at least $2 billion; it was $8.3 billion atyear end. The MTAs exclude unrealized mark-to-market valuations in the calculation of consoli-dated net worth.� We must maintain a maximum long-term debt to
consolidated net worth ratio of 2:1; it was 0.5:1 atyear end.
In most cases, under the terms of the MTAs, theperiod over which we are required to deliver gold isextended annually by one year, or kept “evergreen”,regardless of the intended delivery dates, unless oth-erwise notified by the counterparty. This means that,with each year that passes, the termination date ofmost MTAs is extended into the future by one year.
As spot gold prices increase or decrease, the valueof our gold mineral reserves and amount of potentialoperating cash inflows generally increases or decreases.The unrealized mark-to-market loss on our fixed-pricegold sales contracts also increases or decreases. Themark-to-market value represents the cancellation valueof these contracts based on current market levels, anddoes not represent an immediate economic obligationfor payment by us. Our obligations under the gold for-ward sales contracts are to deliver an agreed uponquantity of gold at a contracted price by the termina-tion date of the contracts (currently 2016 in mostcases). Gold sales contracts are not recorded on ourbalance sheet. The economic impact of these contractsis reflected in our Financial Statements within goldsales based on selling prices under the contracts at thetime we record revenue from the physical delivery ofgold and silver under the contracts.
Fair Value of Derivative Positions
As at December 31, 2006 Unrealized($ millions) Gain/(Loss)
Corporate Gold Sales Contracts $ (387)Project Gold Sales Contracts (3,187)Floating Spot-Price Gold Sales Contracts (260)Silver Sales Contracts (82)Floating Spot-Price Silver Sales Contracts (18)Foreign currency contracts 176Interest rate and gold lease contracts 49Fuel contracts 29Gold positions offset but not financially settled1 (160)Copper contracts 81
Total $ (3,759)
1. These are acquired Placer Dome contracts which have been economically off-set, but not yet settled. Upon settlement, there will be a cash impact ofapproximately negative $160 million, but no material impact on earnings asthe contract values were captured as part of the fair value of assets and liabil-ities recorded upon acquisition of Placer Dome.
Critical Accounting Policies and Estimates
Management has discussed the development andselection of our critical accounting estimates with theAudit Committee of the Board of Directors, and theAudit Committee has reviewed the disclosure relatingto such estimates in conjunction with its review of thisMD&A. The accounting policies and methods we uti-lize determine how we report our financial conditionand results of operations, and they may require man-agement to make estimates or rely on assumptionsabout matters that are inherently uncertain.
Our financial condition and results of operationsare reported using accounting policies and methodsprescribed by US GAAP. In certain cases, US GAAPallows accounting policies and methods to be selectedfrom two or more alternatives, any of which might bereasonable yet result in our reporting materially dif-ferent amounts. We exercise judgment in selecting andapplying our accounting policies and methods toensure that, while US GAAP compliant, they reflectour judgment of an appropriate manner in which torecord and report our financial condition and resultsof operations.
Management’s Discussion and Analysis � 55Barrick Financial Report 2006

Accounting Policy Changes in 2006 This section includes a discussion of accountingchanges that were adopted in our 2006 FinancialStatements. On January 1, 2006, we adopted FASBInterpretation No. 47, Accounting for ConditionalAsset Retirement Obligations (“FIN 47”). The adop-tion of FIN 47 did not have a material effect on ourFinancial Statements, and therefore a detailed discus-sion of this accounting change has not been included.
FAS 123R, Share-Based Payment (“FAS 123R”)On January 1, 2006, we adopted FAS 123R, whichincludes in its scope our stock options, RestrictedShare Units (“RSUs”) and Deferred Share Units(“DSUs”). Prior to January 1, 2006, we accounted forstock options granted to employees using an intrinsicvalue method. We recorded compensation cost forstock options based on the excess of the market priceof the stock option at the grant date of an award overthe exercise price. Historically, the exercise price forstock options equaled the market price of stock at the grant date, resulting in no compensation cost.FAS 123R requires us to expense the fair value ofshare-based payment awards over the vesting term.We adopted FAS 123R using the modified prospectivemethod and our Financial Statements for periodsprior to adoption, including the 2005 comparativeFinancial Statements, have not been restated. Totalstock option expense recorded in 2006 was $27 mil-lion. Historically, we have recorded compensationexpense for RSUs and DSUs based on their fair values,and the adoption of FAS 123R had no significantimpact on accounting for RSUs and DSUs.
In September 2006, the SEC released a letter onaccounting for stock options. The letter addresses thedetermination of the grant date and measurement datefor stock option awards. For Barrick, the stock optiongrant date is the date when the details of the award,including the number of options granted by individualand the exercise price, are approved. The application ofthe principles in the letter issued by the SEC did notchange the date that has been historically determinedas the measurement date for stock option grants.
For stock option grants issued after September 30,2005 we used the Lattice valuation model to deter-mine fair value. The most significant assumptionsinvolving judgment that affect a stock option’s valueunder the Lattice model include, but are not limitedto: expected volatility, expected term and expectedexercise behavior of option holders.
In first quarter 2006, we assumed the outstandingfully-vested Placer Dome stock options. These stockoptions are exercisable into an equivalent number ofBarrick shares based on the exchange ratio under theacquisition of Placer Dome. The estimated fair valueof these stock options of $22 million was recorded aspart of the cost of acquisition.
FAS 151, Inventory Costs (“FAS 151”) On January 1, 2006, we adopted FAS 151. Under FAS 151,abnormal amounts of idle facility expense, freight, han-dling costs and wasted materials are recognized as cur-rent period charges rather than capitalized to inventory.FAS 151 also requires that the allocation of fixed pro-duction overhead to the cost of inventory be based onthe normal capacity of production facilities. FAS 151 isapplicable prospectively from January 1, 2006 and wehave modified our inventory accounting policy consis-tent with its requirements. Under our modifiedaccounting policy for inventory, production-type coststhat are abnormal are excluded from inventory andcharged directly to cost of sales. Interruptions to nor-mal activity levels at a mine could occur for a variety ofreasons, including equipment failures and major main-tenance activities, strikes, power supply interruptionsand adverse weather conditions. When such interrup-tions occur we evaluate the impact on the cost of inven-tory produced in the period and, to the extent theactual cost exceeds the cost based on normal capacity,we expense any excess directly to cost of sales. Theadoption of FAS 151 did not have a significant impacton our Financial Statements in 2006.
56 � Management’s Discussion and Analysis Barrick Financial Report 2006

FAS 158, Employers’ Accounting for Defined Benefit Pension and Other Post-retirement Plans(“FAS 158”)In September 2006, the FASB issued FAS 158 that willrequire employers to fully recognize the obligationsassociated with single-employer defined benefit pen-sion, retiree healthcare and other post-retirement plansin their financial statements.
FAS 158 requires an employer to:a) Recognize in its balance sheet an asset for a plan’s
overfunded status or a liability for the plan’s under-funded status.
b) Recognize as a component of other compre-hensive income, the existing unrecognized netgains or losses, unrecognized prior service costs orcredits and unrecognized net transition assets orobligations.
c) Measure defined benefit plan assets and obligationsas of the date of the employer’s fiscal year-end balance sheet (with limited exceptions).
The requirement to recognize the funded status of abenefit plan and the related disclosure requirementsnoted in a) and b) above are effective as of the end ofthe fiscal year ending after December 15, 2006. We haveadopted these provisions effective December 31, 2006.The requirement to measure the plan assets and benefitobligations as of the date of the employer’s fiscal year-end mentioned in c) above is effective for fiscal yearsending after December 15, 2008. The incremental effectof adopting FAS 158 is disclosed in note 26 to theFinancial Statements.
Staff Accounting Bulletin No. 108 – Considering the effects of Prior Year Misstatements whenQuantifying Misstatements in Current YearFinancial Statements (“SAB 108”)In September 2006, the SEC issued SAB 108. SAB 108addresses the multiple methods used to quantify finan-cial statement misstatements and evaluate the accumu-lation of misstatements. SAB 108 requires registrants to evaluate prior period misstatements using both abalance sheet approach (“iron curtain method”) andan income statement approach (“rollover method”).SAB 108 is effective for interim and annual periods
ending after November 15, 2006. SAB 108 allows a one-time transitional cumulative effect adjustment toretained earnings as of January 1, 2006 for errors thatwere previously deemed not material, but would bematerial under the requirements of SAB 108. We havehistorically used the rollover method in quantifyingpotential financial statement misstatements. Asrequired by SAB 108, we re-evaluated prior periodimmaterial misstatements using the iron curtainmethod. Based upon the result of our evaluation, wedid not identify any material errors or misstatementsthat were previously deemed not material under therollover approach. Going forward, we will apply bothmethods in quantifying potential financial statementerrors and misstatements, as required by SAB 108.
Future Accounting Policy ChangesThis section includes a discussion of future account-ing changes that may have a significant impact on ourFinancial Statements.
FASB Interpretation No. 48, Accounting forUncertainty in Income Taxes – an interpretation of FASB Statement No. 109 (“FIN 48”)In June 2006, the FASB issued FIN 48. The interpre-tation has been developed because of diversity inpractice for accounting for uncertain tax positions.Some entities record tax benefits for uncertain taxpositions as they are filed on the income tax return,while others use either gain contingency accountingor a probability threshold.
Under the interpretation, an entity should presumethat a taxing authority will examine all tax positionswith full knowledge of all relevant information. There-fore, when evaluating a tax position for recognition andmeasurement, consideration of the risk of examinationis not appropriate. In applying the provisions of theinterpretation, there will be distinct recognition andmeasurement evaluations. The first step is to evaluatethe tax position for recognition by determining if theweight of available evidence indicates it is more likelythan not, based solely on the technical merits, that theposition will be sustained on audit, including resolu-tion of related appeals or litigation processes, if any.The second step is to measure the appropriate amountof the benefit to recognize. The amount of benefit to
Management’s Discussion and Analysis � 57Barrick Financial Report 2006

recognize will be measured as the maximum amountwhich is more likely than not to be realized. The taxposition should be de-recognized in the first periodwhen it is no longer more likely than not of being sus-tained. On subsequent recognition and measurement,the maximum amount which is more likely than not tobe recognized at each reporting date will representmanagement’s best estimate given the informationavailable at the reporting date, even though the out-come of the tax position is not absolute or final. Sub-sequent recognition, de-recognition, and measurementshould be based on new information. A liability forinterest or penalties or both will be recognized asdeemed to be incurred based on the provisions of thetax law, that is, the period for which the taxing author-ity will begin assessing the interest or penalties or both.The amount of interest expense recognized will bebased on the difference between the amount recog-nized in accordance with this interpretation and the benefit recognized in the tax return. Under thisinterpretation, an entity will disclose its policy on the classification of interest and penalties and also disclose the reconciliation of the total amounts ofunrecognized tax benefits at the beginning to the end of each period. On transition, the change in netassets due to applying the provisions of the final inter-pretation will be considered a change in accountingprinciple with the cumulative effect of the changetreated as an offsetting adjustment to the opening balance of retained earnings in the period of transition.The interpretation is effective by the beginning of thefirst annual period beginning after December 15,2006. We are presently evaluating the impact of thisinterpretation on our Financial Statements.
FAS 157 Fair Value Measurements (“FAS 157”)In September 2006, the FASB issued FAS 157 whichprovides enhanced guidance for using fair value tomeasure assets and liabilities. FAS 157 is meant toremedy the diversity and inconsistency within gener-ally accepted accounting principles in measuring fairvalue. FAS 157 applies whenever other standardsrequire (or permit) assets or liabilities to be measuredat fair value. FAS 157 does not expand the use of fairvalue in any new circumstances.
FAS 157 expands disclosure about the use of fairvalue to measure assets and liabilities in interim and annual periods subsequent to initial recognition.The disclosures focus on the inputs used to measurefair value and for recurring fair value measurementsusing significant unobservable inputs, the effect of measurement on earnings (or changes in net assets)for the period must be disclosed. FAS 157 is effectivefor financial statements issued for fiscal years begin-ning after November 15, 2007, and interim periodswithin those fiscal years. Early adoption is permitted.We are currently assessing the impact on our FinancialStatements.
FSP No. AUG AIR-1 – Accounting for Planned Major Maintenance Activities (“FSP AIR-1”)In September 2006, the FASB issued FSP AIR-1 whichamends guidance from the AICPA Industry AuditGuide, Audits of Airlines with respect to plannedmajor maintenance activities and makes this guidanceapplicable to entities in all industries. Of the threemethods of accounting for planned major mainte-nance allowed by FSP AIR-1, we have chosen the built-in overhaul method. The built-in overhaul method isbased on segregation of plant and equipment costsinto those that should be depreciated over the usefullife of the asset and those that require overhaul at peri-odic intervals. Thus, the estimated cost of the overhaulcomponent included in the purchase price is set upseparately from the cost of the asset and is amortizedto the date of the initial overhaul. The cost of the ini-tial overhaul is then capitalized and amortized to thenext overhaul, at which time the process is repeated.
58 � Management’s Discussion and Analysis Barrick Financial Report 2006

FSP AIR-1 is effective for the first fiscal year begin-ning after December 15, 2006. The provisions shallalso be applied retrospectively for all financial state-ments presented unless it is impractical to do so. Theprovisions of FSP AIR-1 will be applied beginningJanuary 1, 2007. We are in the process of determiningthe effect, if any, that adoption of this FSP will have onprior periods.
Critical Accounting Estimates and Judgments Certain accounting estimates have been identified asbeing “critical” to the presentation of our financialcondition and results of operations because theyrequire us to make subjective and/or complex judg-ments about matters that are inherently uncertain; orthere is a reasonable likelihood that materially differ-ent amounts could be reported under different condi-tions or using different assumptions and estimates.
Reserve Estimates Used to Measure Amortization of Property, Plant and EquipmentWe record amortization expense based on the esti-mated useful economic lives of long-lived assets.Changes in reserve estimates are generally calculatedat the end of each year and cause amortization expenseto increase or decrease prospectively. The estimate thatmost significantly affects the measurement of amorti-zation is quantities of proven and probable gold andcopper reserves, because we amortize a large portionof property, plant and equipment using the units-of-production method. The estimation of quantities ofgold and copper reserves, in accordance with the prin-ciples in Industry Guide No. 7, issued by the USSecurities and Exchange Commission (“SEC”) is com-plex, requiring significant subjective assumptions thatarise from the evaluation of geological, geophysical,engineering and economic data for a given ore body.This data could change over time as a result of numer-ous factors, including new information gained fromdevelopment activities, evolving production historyand a reassessment of the viability of production
under different economic conditions. Changes in dataand/or assumptions could cause reserve estimates tosubstantially change from period to period. Actualgold and copper production could dif fer fromexpected gold and copper production based onreserves, and an adverse change in gold or copperprices could make a reserve uneconomic to mine.Variations could also occur in actual ore grades andgold, silver and copper recovery rates from estimates.
A key trend that could reasonably impact reserveestimates is rising market mineral prices, because themineral price assumption is closely related to the trail-ing three-year average market price. As this assump-tion rises, this could result in an upward revision toreserve estimates as material not previously classifiedas a reserve becomes economic at higher gold prices.Following the recent trend in market gold prices overthe last three years, the mineral price assumption usedto measure reserves has also been rising. The goldprice assumption was $475 per ounce in 2006 (2005:$400 per ounce; 2004: $375 per ounce). The copperprice assumption was $1.50 ($1.75 at Osborne) perpound in 2006.
The impact of a change in reserve estimates isgenerally more significant for mines near the end ofthe mine life because the overall impact on amortiza-tion is spread over a shorter time period. Also, amorti-zation expense is more significantly impacted bychanges in reserve estimates at underground minesthan open-pit mines due to the following factors:� Underground development costs incurred to access
ore at underground mines are significant andamortized using the units-of-production method;and� Reserves at underground mines are often more
sensitive to mineral price assumptions and changesin production costs. Production costs at under-ground mines are impacted by factors such as dilu-tion, which can significantly impact mining andprocessing costs per ounce.
Management’s Discussion and Analysis � 59Barrick Financial Report 2006

Impact of Historic Changes in Reserve Estimates on Amortization
For the years ended December 31 2006 2005($ millions, except reserves in millions of contained oz)
Reserves Amortization Reserves Amortizationincrease increase increase increase
(decrease)1 (decrease) (decrease)1 (decrease)
North America 1.7 $ (6) 2.4 $ (3)South America 0.1 (35) 0.3 (22)Australia Pacific 0.6 (16) 0.2 (3)Africa 3.0 (18) 0.1 –
Total 5.4 $ (75) 3.0 $ (28)
1. Each year we update our reserve estimates as at the end of the year as part of our normal business cycle. Reserve changes presented were calculated at the beginningof the applicable fiscal year and are in millions of contained ounces.
60 � Management’s Discussion and Analysis Barrick Financial Report 2006
Impairment Assessments of InvestmentsEach reporting period we review all available-for-salesecurities whose fair value at the end of period is belowcost to determine whether an other-than-temporaryimpairment has occurred. We consider all relevantfacts or circumstances in this assessment, particularly:the length of time and extent to which fair value hasbeen less than the carrying amount; the financial con-dition and near term prospects of the investee, includ-ing any specific events that have impacted its fair value;both positive and negative evidence that the carryingamount is recoverable within a reasonable period oftime; and our ability and intent to hold the investmentfor a reasonable period of time sufficient for anexpected recovery of the fair value up to or beyond thecarrying amount. Changes in the values of theseinvestments are caused by market factors beyond ourcontrol and could be significant, and the amount ofany impairment charges could materially impact earn-ings. In 2006, we reviewed two investments that wereimpaired, and after concluding that the impairmentswere other-than-temporary, we recorded a pre-taximpairment charge of $6 million (2005: $16 million;2004: $5 million).
Impairment Assessments of Operating Mines,Development Projects and Exploration Stage PropertiesWe review and test the carrying amounts of assetswhen events or changes in circumstances suggest thatthe carrying amount may not be recoverable. We groupassets at the lowest level for which identifiable cashflows are largely independent of the cash flows of otherassets and liabilities. We review each mine and devel-opment project for recoverability by comparing the
total carrying value of the assets of that mine or projectto the expected future cash flows associated with thatmine or project. If there are indications that an impair-ment may have occurred, we prepare estimates ofexpected future cash flows for each group of assets.Expected future cash flows are based on a probability-weighted approach applied to potential outcomes.
Estimates of expected future cash flow reflect:� Estimated sales proceeds from the production and
sale of recoverable ounces of gold or pounds ofcopper contained in proven and probable reserves;� Expected future commodity prices and currency
exchange rates (considering historical and currentprices, price trends and related factors);� Expected future operating costs and capital expen-
ditures to produce proven and probable gold orcopper reserves based on mine plans that assumecurrent plant capacity, but exclude the impact of inflation;� Expected cash flows associated with value beyond
proven and probable reserves, which includes theexpected cash outflows required to develop andextract the value beyond proven and probablereserves; and� Environmental remediation costs excluded from
the measurement of asset retirement obligations.
We record a reduction of a group of assets to fair valueas a charge to earnings if the undiscounted expectedfuture cash flows are less than the carrying amount.We generally estimate fair value by discounting theexpected future cash flows using a discount factor thatreflects the risk-free rate of interest for a term consis-tent with the period of expected cash flows.
Expected future cash flows are inherently uncer-tain and could materially change over time. They aresignificantly affected by reserve estimates, togetherwith economic factors such as gold, copper and silverprices, other commodity and consumable costs andcurrency exchange rates, estimates of costs to producereserves and future regional capital. If a significantadverse change in the market gold price, or the mar-ket copper price, occurred that caused us to revise theprice assumptions downwards, the conclusions on theimpairment tests could change, subject to the effect ofchanges in other factors and assumptions. The assess-ment and measurement of impairment excludes theimpact of derivatives designated in a cash flow hedgerelationship for future cash flows arising from operat-ing mines and development projects.
Because of the significant capital investment thatis required at many mines, if an impairment occurs,it could materially impact earnings. Due to the long-life nature of many mines, the difference between totalestimated discounted net cash flows and fair value canbe substantial. Therefore, although the value of a minemay decline gradually over multiple reporting peri-ods, the application of impairment accounting rulescould lead to recognition of the full amount of thedecline in value in one period. Due to the highlyuncertain nature of future cash flows, the determina-tion of when to record an impairment charge can bevery subjective. We make this determination usingavailable evidence taking into account current expec-tations for each mining property.
For acquired exploration-stage properties, the pur-chase price is capitalized, but post-acquisition explo-ration expenditures are expensed. The future economicviability of exploration-stage properties largelydepends upon the outcome of exploration activity,which can take a number of years to complete for largeproperties. We monitor the results of exploration activ-ity over time to assess whether an impairment mayhave occurred. The measurement of any impairment ismade more difficult because there is not an active mar-ket for exploration properties, and because it is notpossible to use discounted cash flow techniques due tothe very limited information that is available to accu-rately model future cash flows. In general, if an impair-ment occurs at an exploration-stage property, it would
probably have minimal value and most of the acquisi-tion cost may have to be written down. Impairmentcharges are recorded in other income/expense andimpact earnings in the year they are recorded. Prospec-tively, the impairment could also impact the calculationof amortization of an asset.
In 2004, we completed impairment tests for theCowal project, the Eskay Creek mine and variousPeruvian exploration-stage properties. For Cowal, animpairment test was completed, incorporating upwardrevisions to estimated capital and operating costs forthe project and the impact of the US dollar exchangerate on Australian dollar expenditures, measured atmarket prices. On completion of this test, we con-cluded that the project was not impaired. On comple-tion of the impairment test for Eskay Creek, weconcluded that the mine was impaired, and werecorded a pre-tax impairment charge of $58 million.On completion of the exploration program for 2005and updating assessments of future plans, we con-cluded that a group of Peruvian exploration-stageproperties were impaired at the end of 2004 and werecorded a pre-tax impairment charge of $67 million.Throughout 2006, we updated our impairment assess-ments for the Eskay Creek mine and Cowal project and we concluded that they were not impaired at the end of 2006. In 2006, the carrying amount ofCuerpo Sur, an extension of Pierina, was tested forimpairment on completion of the annual life of mineplanning process. An impairment charge of $17 mil-lion was recorded.
Impairment Assessments of GoodwillGoodwill represents the excess of the purchase price ofan acquired business over the fair value of theidentifiable assets acquired and liabilities assumed. Wetest for impairment of goodwill on an annual basis andat any other time if events occur or circumstanceschange that would indicate that it is more likely thannot that the fair value of the reporting unit has beenreduced below its carrying amount. Circumstances thatcould trigger an impairment test include: a significantadverse change in the business climate or legal factors;an adverse action or assessment by a regulator; unan-ticipated competition; the loss of key personnel; changein reportable segments; the likelihood that a reporting
Management’s Discussion and Analysis � 61Barrick Financial Report 2006

unit or significant portion of a reporting unit will besold or otherwise disposed of; adverse results of test-ing for recoverability of a significant asset group withina reporting unit; and the recognition of a goodwillimpairment loss in the financial statements of a sub-sidiary that is a component of a reporting unit. Theimpairment test for goodwill is a two-step process.Step one consists of a comparison of the fair value of areporting unit with its carrying amount, including thegoodwill allocated to the reporting unit. Measurementof the fair value of a reporting unit is based on one ormore fair value measures including present value tech-niques of estimated future cash flows and estimatedamounts at which the unit as a whole could be boughtor sold in a current transaction between willing par-ties. We also consider comparable market capitaliza-tion rates for each reporting unit as of the date of theimpairment test. If the carrying amount of the report-ing unit exceeds the fair value, step two requires thefair value of the reporting unit to be allocated to theunderlying assets and liabilities of that reporting unit, resulting in an implied fair value of goodwill.If the carrying amount of the reporting unit goodwillexceeds the implied fair value of that goodwill, animpairment loss equal to the excess is recorded in netearnings (loss).
At December 31, 2006, the carrying value of good-will was approximately $5.9 billion. Goodwill arose inconnection with our January 2006 acquisition of PlacerDome. The determination of reporting units and allo-cation of goodwill to those reporting units is not yetcomplete. For the initial impairment test in fourthquarter 2006, we considered the impact of allocatinggoodwill to individual mines and to aggregations ofmines within regional business units. On completion ofthis goodwill impairment test, we concluded that therewas no impairment of goodwill in 2006.
Production Start DateWe assess each mine construction project to deter-mine when a mine moves into production stage. Thecriteria used to assess the start date are determinedbased on the unique nature of each mine constructionproject, such as the complexity of a plant or its loca-tion. We consider various relevant criteria to assesswhen the mine is substantially complete and ready forits intended use and moved into production stage.Some of the criteria considered would include, but arenot limited to, the following:� The level of capital expenditures compared to
construction cost estimates� Completion of a reasonable period of testing of
mine plant and equipment� Ability to produce minerals in saleable form
(within specifications)� Ability to sustain ongoing production of minerals
In 2005, we determined the start date for three newmines: Tulawaka, Lagunas Norte and Veladero. In2006, we determined the start date for Cowal. When amine construction project moves into the productionstage, the capitalization of certain mine constructioncosts ceases and costs are either capitalized to inven-tory or expensed, except for capitalizable costs relatedto property, plant and equipment additions orimprovements, underground mine development orreserve development.
Fair Value of Asset Retirement Obligations (“AROs”)AROs arise from the acquisition, development, con-struction and normal operation of mining property,plant and equipment, due to government controls andregulations that protect the environment and publicsafety on the closure and reclamation of mining prop-erties. We record the fair value of an ARO in ourFinancial Statements when it is incurred and capitalizethis amount as an increase in the carrying amount ofthe related asset. At operating mines, the increase in anARO is recorded as an adjustment to the correspon-ding asset carrying amount and results in a prospectiveincrease in amortization expense. At closed mines, anyadjustment to an ARO is charged directly to earnings.
62 � Management’s Discussion and Analysis Barrick Financial Report 2006
The fair values of AROs are measured by discount-ing the expected cash flows using a discount factor thatreflects the credit-adjusted risk-free rate of interest. Weprepare estimates of the timing and amounts ofexpected cash flows when an ARO is incurred, whichare updated to reflect changes in facts and circum-stances, or if we are required to submit updated mineclosure plans to regulatory authorities. In the future,changes in regulations or laws or enforcement couldadversely affect our operations; and any instances ofnon-compliance with laws or regulations that result infines or injunctions or delays in projects, or any unfore-seen environmental contamination at, or related to, ourmining properties could result in us suffering signifi-cant costs. We mitigate these risks through environ-mental and health and safety programs under which wemonitor compliance with laws and regulations and takesteps to reduce the risk of environmental contamina-tion occurring. We maintain insurance for some envi-ronmental risks; however, for some risks coveragecannot be purchased at a reasonable cost. Our coveragemay not provide full recovery for all possible causes ofloss. The principal factors that can cause expected cashflows to change are: the construction of new processingfacilities; changes in the quantities of material inreserves and a corresponding change in the life of mineplan; changing ore characteristics that ultimatelyimpact the environment; changes in water quality thatimpact the extent of water treatment required; andchanges in laws and regulations governing the protec-tion of the environment. In general, as the end of themine life nears, the reliability of expected cash flowsincreases, but earlier in the mine life, the estimation ofan ARO is inherently more subjective. Significant judg-ments and estimates are made when estimating the fairvalue of AROs. Expected cash flows relating to AROscould occur over periods up to 40 years and the assess-ment of the extent of environmental remediation workis highly subjective. Considering all of these factors thatgo into the determination of an ARO, the fair value ofAROs can materially change over time.
At our operating mines, we continued to recordAROs based on disturbance of the environment overtime. It is reasonably possible that circumstances couldarise during or by the end of the mine life that will
require material revisions to AROs. In particular, theextent of water treatment can have a material effect onthe fair value of AROs, and the expected water qualityat the end of the mine life, which is the primary driverof the extent of water tre atment, can changesignificantly. We periodically prepare updated studiesfor our mines, following which it may be necessary toadjust the fair value of AROs. The period of time overwhich we have assumed that water quality monitoringand treatment will be required has a significant impacton AROs at closed mines. The amount of AROsrecorded reflects the expected cost, taking into accountthe probability of particular scenarios. The differencebetween the upper end of the range of these assump-tions and the lower end of the range can be significant,and consequently changes in these assumptions couldhave a material effect on the fair value of AROs andfuture earnings in a period of change.
At one closed mine, the principal uncertainty thatcould impact the fair value of the ARO is the mannerin which a tailings facility will need to be remediated.In measuring the ARO, we have concluded that thereare two possible methods that could be used. We haverecorded the ARO using the more costly method untilsuch time that the less costly method can be proven astechnically feasible and approved.
In 2006, we recorded increases in ARO estimates of$73 million (2005 $91 million: 2004: $68 million) ofwhich $27 million of this increase (2005: $47 million;2004: $14 million) related to new AROs at developmentprojects and mines that commenced production dur-ing 2006. A $7 million reduction (2005: $29 millionincrease; 2004: $32 million increase) relates to updatesof the assessment of the extent of water treatment andother assumptions at our operating mines. We recordedincreases in AROs of $53 million at our closed mines,which were charged to earnings (2005: $15 million;2004: $22 million).
AROs at December 31, 2006($ millions)
Operating mines $ 683Closed mines 200Development projects 10
Total $ 893
Management’s Discussion and Analysis � 63Barrick Financial Report 2006

Deferred Tax Assets and Liabilities Measurement of Temporary DifferencesWe are periodically required to estimate the tax basis ofassets and liabilities. Where applicable tax laws and reg-ulations are either unclear or subject to varying inter-pretations, it is possible that changes in these estimatescould occur that materially affect the amounts ofdeferred income tax assets and liabilities recorded inour Financial Statements. Changes in deferred taxassets and liabilities generally have a direct impact onearnings in the period of changes. The most significantsuch estimate is the tax basis of certain Australian assetsfollowing elections in 2004 under new tax regimes inAustralia. These elections resulted in the revaluation ofcertain assets in Australia for income tax purposes. Partof the revalued tax basis of these assets was estimatedbased on a valuation completed for tax purposes. Thisvaluation is under review by the Australian Tax Office(“ATO”) and the amount finally accepted by the ATOmay differ from the assumption used to measuredeferred tax balances at the end of 2004.
Valuation AllowancesEach period, we evaluate the likelihood of whethersome portion or all of each deferred tax asset will notbe realized. This evaluation is based on historic andfuture expected levels of taxable income, the patternand timing of reversals of taxable temporary timingdifferences that give rise to deferred tax liabilities, andtax planning initiatives. Levels of future taxableincome are affected by, among other things, marketgold prices, production costs, quantities of proven andprobable gold and copper reserves, interest rates andforeign currency exchange rates. If we determine thatit is more likely than not (a likelihood of more than50%) that all or some portion of a deferred tax assetwill not be realized, then we record a valuationallowance against the amount we do not expect torealize. Changes in valuation allowances are recordedas a component of income tax expense or recovery for each period. The most significant recent trendimpacting expected levels of future taxable and valu-ation allowances has been rising gold and copperprices. A continuation of this trend could lead to therelease of some of the valuation allowances recorded,with a corresponding effect on earnings in the periodof release.
In 2006, we released $25 million of valuationallowances in the United States due to the estimatedeffect of higher market gold prices on the ability to utilize deferred tax assets. We released $9 million of valuation allowances in a Chilean entity due to the availability of income. We released valuationallowances of $19 million in Canada reflecting utiliza-tion of capital losses.
In 2005, we released valuation allowances totaling$32 million, which mainly included amounts totaling$31 million in Argentina, relating to the effect of thehigher gold price environment and start-up of pro-duction at Veladero in 2005. We released valuationallowances totaling $5 million in 2004 as a conse-quence of an election to consolidate our Australianoperations into one tax group.
Valuation allowances at December 31($ millions) 2006 2005
United States $ 211 $ 209Chile 110 124Argentina 46 46Canada 59 63Tanzania 217 204Australia 2 2Other 13 8
Total $ 658 $ 656
United States: most of the valuation allowances relateto Alternative Minimum Tax credits, which have anunlimited carry-forward period. Increasing levels offuture taxable income due to higher gold sellingprices and other factors and circumstances may resultin our becoming a regular taxpayer under the USregime, which may cause us to release some, or all, ofthe valuation allowance on the Alternative MinimumTax credits.
Chile and Argentina: the valuation allowances relate tothe full amount of tax assets in subsidiaries that donot have any present sources of gold production ortaxable income. In the event that these subsidiarieshave sources of taxable income in the future, we mayrelease some or all of the allowances.
Canada: substantially all of the valuation allowancesrelate to capital losses that will only be utilized if anycapital gains are realized.
64 � Management’s Discussion and Analysis Barrick Financial Report 2006

Tanzania: considering the local fiscal regime applica-ble to mining companies and expected levels of futuretaxable income from the Bulyanhulu and Tulawakamines, a valuation allowance exists against a portionof the deferred tax assets. If we conclude that expectedlevels of future taxable income from Bulyanhulu andTulawaka will be higher, we may release some or all ofthe valuation allowance.
Cautionary Statement on Forward-Looking Information
Certain information contained or incorporated by reference in this 2006 MD&A, including any informa-tion as to our future financial or operating perfor-mance, constitutes “forward-looking statements”. Allstatements, other than statements of historical fact, areforward-looking statements. The words “believe”,“expect”, “anticipate”, “contemplate”, “target”, “plan”,“intends”, “continue”, “budget”, “estimate”, “may”, “will”,“schedule” and similar expressions identify forward-looking statements. Forward-looking statements arenecessarily based upon a number of estimates andassumptions that, while considered reasonable by us,are inherently subject to significant business, economicand competitive uncertainties and contingencies.Known and unknown factors could cause actual resultsto differ materially from those projected in the for-ward-looking statements. Such factors include, but arenot limited to: fluctuations in the currency markets(such as Canadian and Australian dollars, SouthAfrican rand, Chilean peso and Papua New Guineankina versus US dollar); fluctuations in the spot and for-ward price of gold and copper or certain other com-modities (such as silver, diesel fuel and electricity);changes in US dollar interest rates or gold lease ratesthat could impact the mark-to-market value of out-standing derivative instruments and ongoing pay-ments/receipts under interest rate swaps and variablerate debt obligations; risks arising from holding deriva-tive instruments (such as credit risk, market liquidityrisk and mark-to-market risk); changes in national and
local government legislation, taxation, controls, regula-tions and political or economic developments inCanada, the United States, Dominican Republic,Australia, Papua New Guinea, Chile, Peru, Argentina,South Africa, Tanzania, Russia, Pakistan or Barbados orother countries in which we do or may carry on busi-ness in the future; business opportunities that may bepresented to, or pursued by, us; our ability to success-fully integrate acquisitions; operating or technicaldifficulties in connection with mining or developmentactivities; employee relations; litigation; the speculativenature of exploration and development, including the risks of obtaining necessary licenses and permits;diminishing quantities or grades of reserves; adversechanges in our credit rating; and contests over title toproperties, particularly title to undeveloped properties.In addition, there are risks and hazards associated withthe business of exploration, development and mining,including environmental hazards, industrial accidents,unusual or unexpected formations, pressures, cave-ins,flooding and gold bullion or copper cathode losses(and the risk of inadequate insurance, or inability toobtain insurance, to cover these risks). Many of theseuncertainties and contingencies can affect our actualresults and could cause actual results to differ materi-ally from those expressed or implied in any forward-looking statements made by, or on behalf of, us.Readers are cautioned that forward-looking statementsare not guarantees of future performance. All ofthe forward-looking statements made in this 2006MD&A are qualified by these cautionary statements.Specific reference is made to Barrick’s most recentForm 40-F/Annual Information Form on file with theSEC and Canadian provincial securities regulatoryauthorities for a discussion of some of the factorsunderlying forward-looking statements.
We disclaim any intention or obligation to updateor revise any forward-looking statements whether as aresult of new information, future events or otherwise,except to the extent required by applicable laws.
Management’s Discussion and Analysis � 65Barrick Financial Report 2006

GLOSSARY OF TECHNICAL TERMS
AUTOCLAVE: Oxidation process in which high temper-atures and pressures are applied to convert refractorysulphide mineralization into amenable oxide ore.
BACKFILL: Primarily waste sand or rock used to support the roof or walls after removal of ore from a stope.
BY-PRODUCT: A secondary metal or mineral productrecovered in the milling process such as copper and silver.
CONCENTRATE: A very fine, powder-like product con-taining the valuable ore mineral from which most ofthe waste mineral has been eliminated.
CONTAINED OUNCES: Represents ounces in the groundbefore reduction of ounces not able to be recovered bythe applicable metallurgical process.
CONTANGO: The positive difference between the spotmarket gold price and the forward market gold price.It is often expressed as an interest rate quoted with ref-erence to the difference between inter-bank depositrates and gold lease rates.
DEVELOPMENT: Work carried out for the purpose ofopening up a mineral deposit. In an undergroundmine this includes shaft sinking, crosscutting, driftingand raising. In an open pit mine, developmentincludes the removal of overburden.
DILUTION: The effect of waste or low-grade ore whichis unavoidably included in the mined ore, lowering therecovered grade.
DORÉ: Unrefined gold and silver bullion bars usuallyconsisting of approximately 90 percent precious met-als that will be further refined to almost pure metal.
DRILLING:
Core: drilling with a hollow bit with a diamond cuttingrim to produce a cylindrical core that is used for geo-logical study and assays. Used in mineral exploration.
In-fill: any method of drilling intervals between exist-ing holes, used to provide greater geological detail andto help establish reserve estimates.
EXPLORATION: Prospecting, sampling, mapping, dia-mond-drilling and other work involved in searchingfor ore.
GRADE: The amount of metal in each ton of ore,expressed as troy ounces per ton or grams per tonnefor precious metals and as a percentage for most othermetals.
Cut-off grade: the minimum metal grade at which anorebody can be economically mined (used in the cal-culation of ore reserves).
Mill-head grade: metal content of mined ore goinginto a mill for processing.
Recovered grade: actual metal content of ore deter-mined after processing.
Reserve grade: estimated metal content of an orebody,based on reserve calculations.
HEAP LEACHING: A process whereby gold is extractedby “heaping” broken ore on sloping impermeable padsand continually applying to the heaps a weak cyanidesolution which dissolves the contained gold. The gold-laden solution is then collected for gold recovery.
HEAP LEACH PAD: A large impermeable foundation orpad used as a base for ore during heap leaching.
MILL: A processing facility where ore is finely groundand thereafter undergoes physical or chemical treat-ment to extract the valuable metals.
66 � Management’s Discussion and Analysis Barrick Financial Report 2006

MINERAL RESERVE: See page 128 – “Gold MineralReserves and Mineral Resources.”
MINERAL RESOURCE: See page 128 – “Gold MineralReserves and Mineral Resources.”
MINING CLAIM: That portion of applicable minerallands that a party has staked or marked out in accor-dance with applicable mining laws to acquire the rightto explore for and exploit the minerals under the surface.
MINING RATE: Tons of ore mined per day or evenspecified time period.
OPEN PIT: A mine where the minerals are minedentirely from the surface.
ORE: Rock, generally containing metallic or non-metallic minerals, which can be mined and processedat a profit.
ORE BODY: A sufficiently large amount of ore that canbe mined economically.
OUNCES: Troy ounces of a fineness of 999.9 parts per1,000 parts.
RECLAMATION: The process by which lands disturbedas a result of mining activity are modified to supportbeneficial land use. Reclamation activity may includethe removal of buildings, equipment, machinery andother physical remnants of mining, closure of tailingsstorage facilities, leach pads and other mine features,and contouring, covering and re-vegetation of wasterock and other disturbed areas.
RECOVERY RATE: A term used in process metallurgy toindicate the proportion of valuable material physicallyrecovered in the processing of ore. It is generally statedas a percentage of the material recovered compared tothe total material originally present.
REFINING: The final stage of metal production inwhich impurities are removed from the molten metal.
STRIPPING: Removal of overburden or waste rockoverlying an ore body in preparation for mining byopen pit methods. Expressed as the total number oftons mined or to be mined for each ounce of gold.
TAILINGS: The material that remains after all econom-ically and technically recoverable precious metals havebeen removed from the ore.
Management’s Discussion and Analysis � 67Barrick Financial Report 2006

68 � Management’s Responsibility Barrick Financial Report 2006
Management’s Responsibility
Management’s Responsibility for Financial Statements
The accompanying consolidated financial statements have been prepared by and are the responsibility of the Board of
Directors and Management of the Company.
The consolidated financial statements have been prepared in accordance with United States generally accepted accounting
principles and reflect Management’s best estimates and judgments based on currently available information. The company has
developed and maintains a system of internal accounting controls in order to ensure, on a reasonable and cost effective basis,
the reliability of its financial information.
The consolidated financial statements have been audited by PricewaterhouseCoopers LLP, Chartered Accountants. Their
report outlines the scope of their examination and opinion on the consolidated financial statements.
Jamie C. Sokalsky
Executive Vice President
and Chief Financial Officer
Toronto, Canada
February 21, 2007

Management’s Report on InternalControl Over Financial Reporting
Barrick’s management is responsible for establishing and maintaining adequate internal control over financial reporting.
Barrick’s management assessed the effectiveness of the Company’s internal control over financial reporting as of December 31,
2006. Barrick’s management used the Committee of Sponsoring Organizations of the Treadway Commission (COSO) frame-
work to evaluate the effectiveness of Barrick’s internal control over financial reporting. Based on that evaluation, Barrick’s
management concluded that the Company’s internal control over financial reporting was effective as of December 31, 2006.
Based on Barrick management’s assessment, there were no material weaknesses in Barrick’s internal control over financial
reporting as of December 31, 2006.
Barrick acquired control of Placer Dome Inc. (“Placer Dome”) in January 2006. Barrick’s management excluded the mines
sites and the development projects of the former Placer Dome (the “Placer Dome Operations”) from its assessment of the effec-
tiveness of Barrick’s internal control over financial reporting. The Placer Dome Operations represent approximately
$6.2 billion of the total assets and approximately $2.4 billion of the total revenue of Barrick’s consolidated financial statement
amounts as at December 31, 2006.
PricewaterhouseCoopers LLP, independent auditors, who have audited and issued a report on the consolidated financial
statements of Barrick for the year ended December 31, 2006, have also issued an attestation report on Barrick management’s
assessment of Barrick’s internal control over financial reporting. This attestation report is located on pages 70–72 of Barrick’s
Financial Report 2006.
Management’s Report on Internal Control Over Financial Reporting � 69Barrick Financial Report 2006

70 � Independent Auditors’ Report Barrick Financial Report 2006
IndependentAuditors’ Report
Independent Auditors’ Report
To the Shareholders of
Barrick Gold Corporation
We have completed an integrated audit of the consolidated financial statements and internal control over financial reporting
of Barrick Gold Corporation (the “Company”) as of December 31, 2006 and audits of its 2005 and 2004 consolidated financial
statements. Our opinions, based on our audits, are presented below.
Consolidated financial statements We have audited the accompanying consolidated balance sheets of Barrick Gold Corporation as of December 31, 2006 and
2005, and the related consolidated statements of income, cash flow, shareholders’ equity and comprehensive income for each
of the three years in the period ended December 31, 2006. These financial statements are the responsibility of the Company’s
management. Our responsibility is to express an opinion on these financial statements based on our audits.
We conducted our audit of the Company’s financial statements as of December 31, 2006 and for the year then ended in
accordance with Canadian generally accepted auditing standards and the standards of the Public Company Accounting
Oversight Board (United States). We conducted our audits of the Company’s financial statements as of December 31, 2005 and
December 31, 2004 and for each of the two years in the period ended 31 December, 2005 in accordance with Canadian gener-
ally accepted auditing standards. Those standards require that we plan and perform an audit to obtain reasonable assurance
about whether the financial statements are free of material misstatement. An audit of financial statements includes examining,
on a test basis, evidence supporting the amounts and disclosures in the financial statements. A financial statement audit also
includes assessing the accounting principles used and significant estimates made by management, and evaluating the overall
financial statement presentation.
In our opinion, the consolidated financial statements referred to above present fairly, in all material respects, the financial
position of the Company as of December 31, 2006 and 2005 and the results of its operations and its cash flows for each of the
three years in the period ended December 31, 2006 in accordance with accounting principles generally accepted in the United
States of America.

Independent Auditors’ Report � 71Barrick Financial Report 2006
Internal control over financial reporting We have also audited management’s assessment, included in Management’s Report on Internal Control over Financial
Reporting appearing on page 69 of Barrick’s Financial Report 2006, that the Company maintained effective internal control
over financial reporting as of December 31, 2006, based on criteria established in Internal Control – Integrated Framework
issued by the Committee of Sponsoring Organizations of the Treadway Commission (COSO). The Company’s management is
responsible for maintaining effective internal control over financial reporting and for its assessment of the effectiveness of
internal control over financial reporting. Our responsibility is to express opinions on management’s assessment and on the
effectiveness of the Company’s internal control over financial reporting based on our audit.
We conducted our audit of internal control over financial reporting in accordance with the standards of the Public
Company Accounting Oversight Board (United States). Those standards require that we plan and perform the audit to obtain
reasonable assurance about whether effective internal control over financial reporting was maintained in all material respects.
An audit of internal control over financial reporting includes obtaining an understanding of internal control over financial
reporting, evaluating management’s assessment, testing and evaluating the design and operating effectiveness of internal con-
trol, and performing such other procedures as we consider necessary in the circumstances. We believe that our audit provides
a reasonable basis for our opinions.
A company’s internal control over financial reporting is a process designed to provide reasonable assurance regarding the
reliability of financial reporting and the preparation of financial statements for external purposes in accordance with generally
accepted accounting principles. A company’s internal control over financial reporting includes those policies and procedures
that (i) pertain to the maintenance of records that, in reasonable detail, accurately and fairly reflect the transactions and dispo-
sitions of the assets of the company; (ii) provide reasonable assurance that transactions are recorded as necessary to permit
preparation of financial statements in accordance with generally accepted accounting principles, and that receipts and expen-
ditures of the company are being made only in accordance with authorizations of management and directors of the company;
and (iii) provide reasonable assurance regarding prevention or timely detection of unauthorized acquisition, use, or disposition
of the company’s assets that could have a material effect on the financial statements.
Because of its inherent limitations, internal control over financial reporting may not prevent or detect misstatements.
Also, projections of any evaluation of effectiveness to future periods are subject to the risk that controls may become inade-
quate because of changes in conditions, or that the degree of compliance with the policies or procedures may deteriorate.
As described in Management’s Report on Internal Control over Financial Reporting, management has excluded the mine
sites and development projects of the former Placer Dome Inc. (the “Placer Dome Operations”) from its assessment of inter-
nal control over financial reporting as of December 31, 2006 because Placer Dome Inc. was acquired by the Company in a pur-
chase business combination during 2006. We have also excluded the Placer Dome Operations from our audit of internal
control over financial reporting. These excluded Placer Dome Operations represent total assets and total revenues of $6.2 bil-
lion and $2.4 billion, respectively, of the related consolidated financial statement amounts of Barrick Gold Corporation as of
and for the year ended December 31, 2006.
In our opinion, management’s assessment that the Company maintained effective internal control over financial report-
ing as of December 31, 2006 is fairly stated, in all material respects, based on criteria established in Internal Control –
Integrated Framework issued by the COSO. Furthermore, in our opinion, the Company maintained, in all material respects,
effective internal control over financial reporting as of December 31, 2006 based on criteria established in Internal Control –
Integrated Framework issued by the COSO.
Chartered Accountants
Toronto, Canada
February 21, 2007

Comments by Auditors On Canada-US Reporting Differences
In the United States, reporting standards for auditors require the addition of an explanatory paragraph (following the opinion
paragraph) when there is a change in accounting principles that has a material effect on the comparability of the Company’s
financial statements, such as the changes described in Note 2e to these consolidated financial statements. Our report to the
shareholders dated February 21, 2007 is expressed in accordance with Canadian reporting standards which do not require a
reference to such a change in accounting principles in the Auditors’ report when the change is properly accounted for and
adequately disclosed in the financial statements.
Chartered Accountants
Toronto, Canada
February 21, 2007
72 � Independent Auditors’ Report Barrick Financial Report 2006

Financial Statements � 73Barrick Financial Report 2006
Consolidated Statements of IncomeBarrick Gold CorporationFor the years ended December 31 (in millions of United States dollars) 2006 2005 2004
Sales (notes 4 and 5) $ 5,636 $ 2,350 $ 1,932
Costs and expensesCost of sales1 (note 6) 2,736 1,214 1,047Amortization (note 4) 735 427 452Corporate administration 142 71 71Exploration (note 4) 171 109 96Project development expense 119 32 45Other operating expenses (note 7a) 124 59 47Impairment of long-lived assets (note 7b) 17 – 139
4,044 1,912 1,897
Interest income 101 38 25Interest expense (note 19b) (126) (7) (19)Other income (note 7c) 89 49 49Other expense (note 7d) (96) (56) (47)
(32) 24 8
Income from continuing operations before income taxes and other items 1,560 462 43Income tax (expense) recovery (note 8) (348) (60) 203Non-controlling interests 1 (1) 2Equity in investees (note 11) (4) (6) –
Income from continuing operations 1,209 395 248Discontinued operations (note 3b)
Income from discontinued operations 297 – –Income taxes – – –
Income before cumulative effect of changes in accounting principles 1,506 395 248Cumulative effect of changes in accounting principles (note 2e) – 6 –
Net income for the year $ 1,506 $ 401 $ 248
Earnings per share data (note 9)
Income from continuing operationsBasic $ 1.44 $ 0.74 $ 0.47Diluted $ 1.42 $ 0.73 $ 0.46
Net incomeBasic $ 1.79 $ 0.75 $ 0.47Diluted $ 1.77 $ 0.75 $ 0.46
1. Exclusive of amortization (note 6).The accompanying notes are an integral part of these consolidated financial statements.
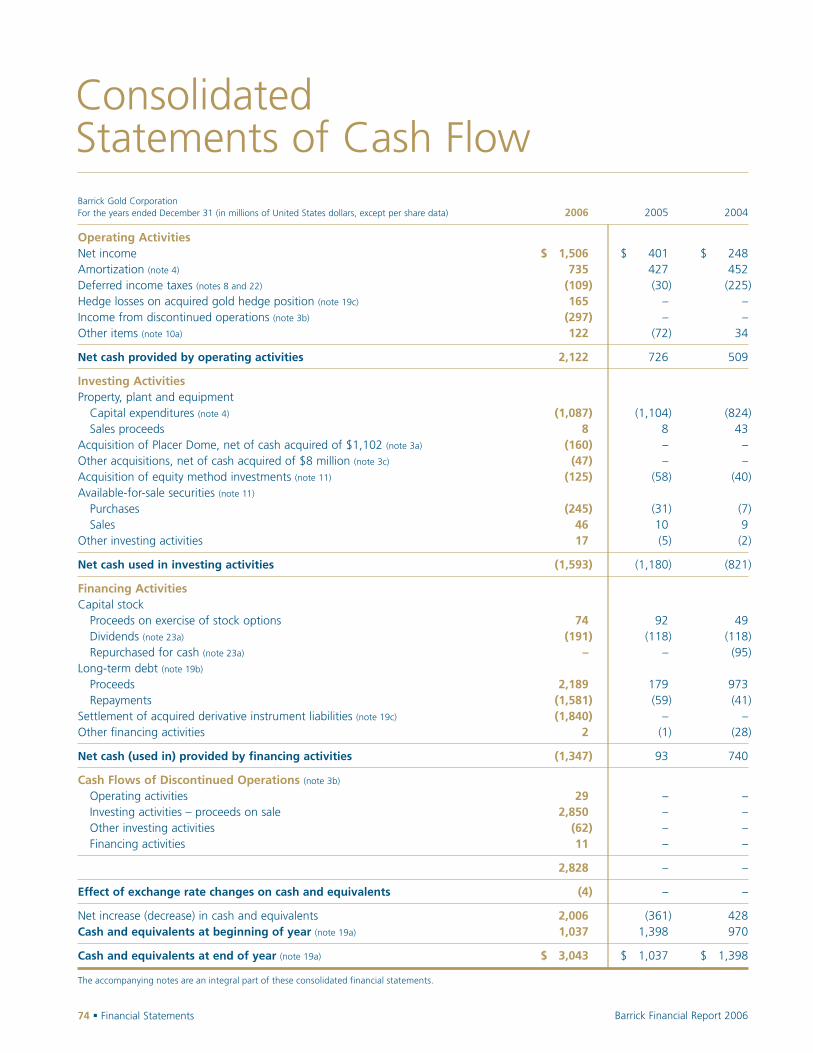
Barrick Gold CorporationFor the years ended December 31 (in millions of United States dollars, except per share data) 2006 2005 2004
Operating ActivitiesNet income $ 1,506 $ 401 $ 248Amortization (note 4) 735 427 452Deferred income taxes (notes 8 and 22) (109) (30) (225)Hedge losses on acquired gold hedge position (note 19c) 165 – –Income from discontinued operations (note 3b) (297) – –Other items (note 10a) 122 (72) 34
Net cash provided by operating activities 2,122 726 509
Investing ActivitiesProperty, plant and equipment
Capital expenditures (note 4) (1,087) (1,104) (824)Sales proceeds 8 8 43
Acquisition of Placer Dome, net of cash acquired of $1,102 (note 3a) (160) – –Other acquisitions, net of cash acquired of $8 million (note 3c) (47) – –Acquisition of equity method investments (note 11) (125) (58) (40)Available-for-sale securities (note 11)
Purchases (245) (31) (7)Sales 46 10 9
Other investing activities 17 (5) (2)
Net cash used in investing activities (1,593) (1,180) (821)
Financing ActivitiesCapital stock
Proceeds on exercise of stock options 74 92 49Dividends (note 23a) (191) (118) (118)Repurchased for cash (note 23a) – – (95)
Long-term debt (note 19b)
Proceeds 2,189 179 973Repayments (1,581) (59) (41)
Settlement of acquired derivative instrument liabilities (note 19c) (1,840) – –Other financing activities 2 (1) (28)
Net cash (used in) provided by financing activities (1,347) 93 740
Cash Flows of Discontinued Operations (note 3b)
Operating activities 29 – –Investing activities – proceeds on sale 2,850 – –Other investing activities (62) – –Financing activities 11 – –
2,828 – –
Effect of exchange rate changes on cash and equivalents (4) – –
Net increase (decrease) in cash and equivalents 2,006 (361) 428Cash and equivalents at beginning of year (note 19a) 1,037 1,398 970
Cash and equivalents at end of year (note 19a) $ 3,043 $ 1,037 $ 1,398
The accompanying notes are an integral part of these consolidated financial statements.
Consolidated Statements of Cash Flow
74 � Financial Statements Barrick Financial Report 2006

Financial Statements � 75Barrick Financial Report 2006
Consolidated Balance SheetsBarrick Gold CorporationAt December 31 (in millions of United States dollars) 2006 2005
AssetsCurrent assets
Cash and equivalents (note 19a) $ 3,043 $ 1,037Accounts receivable (note 13) 234 54Inventories (note 12) 931 402Other current assets (note 13) 588 255
4,796 1,748Non-current assets
Available-for-sale securities (note 11) 646 62Equity method investments (note 11) 327 138Property, plant and equipment (note 14) 8,335 4,146Intangible assets (note 15) 75 –Goodwill (note 16) 5,855 –Other assets (note 17) 1,339 768
Total assets $ 21,373 $ 6,862
Liabilities and Shareholders’ EquityCurrent liabilities
Accounts payable $ 686 $ 386Short-term debt (note 19b) 863 80Other current liabilities (note 18) 303 94
1,852 560Non-current liabilities
Long-term debt (note 19b) 3,244 1,721Asset retirement obligations (note 20) 843 409Deferred income tax liabilities (note 22) 798 114Other liabilities (note 21) 436 208
Total liabilities 7,173 3,012
Non-controlling interests 1 –
Shareholders’ equityCapital stock (note 23) 13,106 4,222Retained earnings (deficit) 974 (341)Accumulated other comprehensive income (loss) (note 24) 119 (31)
Total shareholders’ equity 14,199 3,850
Contingencies and commitments (notes 14 and 27)
Total liabilities and shareholders’ equity $ 21,373 $ 6,862
The accompanying notes are an integral part of these consolidated financial statements.
Signed on behalf of the Board,
Gregory C. Wilkins, Director Steven J. Shapiro, Director

76 � Financial Statements Barrick Financial Report 2006
Barrick Gold CorporationFor the years ended December 31 (in millions of United States dollars) 2006 2005 2004
Common shares (number in millions)
At January 1 538 534 535Issued on exercise of stock options (note 25a) 3 4 3Issued on acquisition of Placer Dome 323 – –Repurchased (note 23a) – – (4)
At December 31 864 538 534
Common sharesAt January 1 $ 4,222 $ 4,129 $ 4,115
Issued on exercise of stock options (note 25a) 74 93 49Issued on acquisition of Placer Dome (note 3a) 8,761 – –Repurchased (note 23a) – – (35)Options issued on acquisition of Placer Dome (note 3a) 22 – –Recognition of stock option expense (note 25a) 27 – –
At December 31 13,106 4,222 4,129
Retained earnings (deficit)At January 1 (341) (624) (694)
Net income 1,506 401 248Dividends (note 23a) (191) (118) (118)Adjustment on repurchase of common shares (note 23a) – – (60)
At December 31 974 (341) (624)
Accumulated other comprehensive income (loss) (note 24) 119 (31) 69
Total shareholders’ equity at December 31 $ 14,199 $ 3,850 $ 3,574
Consolidated Statements of Comprehensive IncomeBarrick Gold CorporationFor the years ended December 31 (in millions of United States dollars) 2006 2005 2004
Net income $ 1,506 $ 401 $ 248Other comprehensive income (loss), net of tax (note 24) 150 (100) 9
Comprehensive income $ 1,656 $ 301 $ 257
The accompanying notes are an integral part of these consolidated financial statements.
Consolidated Statements of Shareholders’ Equity

Notes to Consolidated Financial Statements � 77Barrick Financial Report 2006
1 � Nature of Operations
Barrick Gold Corporation (“Barrick” or the “Company”)principally engages in the production and sale of gold,as well as related activities such as exploration and minedevelopment. In 2006, we acquired Placer Dome Inc. (seenote 3a), which resulted in a substantial increase in the scaleof our mining operations. We also produce some copperand hold interests in a platinum group metals developmentproject and a nickel development project, both located inAfrica and a platinum project located in Russia. Our min-ing operations are concentrated in our four regional busi-ness units: North America, South America, Africa andAustralia Pacific. We sell our gold and copper productioninto the world market.
2 � Significant Accounting Policies
a) Basis of PreparationThese financial statements have been prepared under UnitedStates generally accepted accounting principles (“USGAAP”). In 2006, we amended the classification of certainexpense items on the face of our income statement to pro-vide enhanced disclosure of significant business activitiesand reflect the increasing significance of amounts spent onthose activities. Previously exploration expense and projectdevelopment expenses were grouped as a single line item.In 2006, we began to present these items separately to enablethe amounts spent and trends in each type of expense to bemore easily identified. Also in 2006, we began to presentoverheads incurred at our regional business units as a sepa-rate line item under “other operating expenses” to provideincreased visibility of the amounts incurred. Previously theseexpenses were included in “other expense” and not separa-tely identified. To ensure comparability of financial informa-tion, prior-year amounts have been reclassified to conformwith the current year presentation.
b) ConsolidationThese consolidated financial statements include the accountsof Barrick Gold Corporation and those entities we have theability to control either through voting rights or meansother than voting rights. For incorporated joint ventureswhere we have the ability to control the joint venture,subject in some cases to protective rights held by our jointventure partners, we consolidate the joint venture andrecord a non-controlling interest for the interest held by ourjoint venture partner. In 2006 we finalized a joint ventureagreement for the Pueblo Viejo project, which is heldthrough an incorporated joint venture. Under the terms ofthe joint venture agreement, we have the ability to controlthe operating, investing and financing decisions and there-fore we consolidate this joint venture.
FIN 46R provides guidance on the identification andreporting of entities controlled through means other thanvoting rights and defines such entities as variable interestentities (“VIEs”). We apply this guidance to all entities,including those in the development stage, except for unin-corporated joint ventures, which are outside the scope ofFIN 46R. The principal entity that is a VIE is the entity thatowns the Reko Diq project. Neither ourselves nor the otherowners are the primary beneficiary for financial reportingpurposes and we use the equity method of accounting forour interest in this entity (note 11).
For unincorporated joint ventures under which wehold an undivided interest in the assets and liabilities of thejoint venture, we include our interest in the assets and lia-bilities in our financial statements. Through the acquisitionof Placer Dome in 2006 we acquired interests in the Cortez,Donlin Creek, Turquoise Ridge and Porgera mines whichare held through unincorporated joint ventures underwhich we hold an undivided interest in the revenues,expenses, assets and liabilities. For further information referto note 28.
Notes to Consolidated Financial Statements
Barrick Gold Corporation. Tabular dollar amounts in millions of United States dollars, unless otherwise shown. References to C$, A$, and ZAR are to Canadian dollars, Australian dollars, and South African Rands respectively.

The Donlin Creek property is being explored anddeveloped under a Mining Venture Agreement that isbetween NovaGold and Barrick entered into in November2002. Under the terms of the agreement, we currently holda 30% interest in the project with the right to increase thatinterest to 70% by satisfying the following conditions on orbefore November 12, 2007: (1) funding of $32 million ofexploration and development expenditures on the project;(2) delivering a feasibility study to NovaGold; and (3)obtaining the approval of our Board of Directors to con-struct a mine on the property. At the end of March 2006, wehad satisfied the funding condition. We are currently takingthe steps necessary to complete the feasibility study. Werecord our 70% share of project expenditures each period,together with an account receivable for Nova Gold’s shareof those of expenditures. Under a shareholders agreement,Calista Corporation has the right to acquire a 5% to 15%interest in the Donlin Creek project by paying a correspond-ing percentage of capitalized costs within 90 days of receiptof a completed feasibility study.
c) Foreign Currency TranslationThe functional currency of all our operations is the US dol-lar. We translate non-US dollar balances into US dollars asfollows:
� non-monetary assets and liabilities using historical rates;
� monetary assets and liabilities using closing rates withtranslation gains and losses recorded in earnings; and
� income and expenses using average exchange rates, exceptfor expenses that relate to non-monetary assets and liabilities measured at historical rates, which are trans-lated using the same historical rate as the associatednon-monetary assets and liabilities.
d) Use of EstimatesThe preparation of these financial statements requires us tomake estimates and assumptions. The most significant onesare: quantities of proven and probable gold and copperreserves; the value of mineralized material beyond provenand probable reserves; future costs and expenses to produceproven and probable reserves; future commodity prices andforeign currency exchange rates; the future cost of assetretirement obligations; amounts of contingencies; and thefair value of acquired assets and liabilities including pre-acquisition contingencies. Using these estimates andassumptions, we make various decisions in preparing thefinancial statements including:
� The treatment of mine development costs as either an asset or an expense;
� whether long-lived assets are impaired, and if so,estimates of the fair value of those assets and anycorresponding impairment charge;
� our ability to realize deferred income tax assets;
� the useful lives of long-lived assets and the measurementof amortization;
� the fair value of asset retirement obligations;
� the likelihood of loss contingencies occurring and the amount of any potential loss;
� whether investments are impaired;
� the amount of income tax expense;
� allocations of the purchase price in business combinations to assets and liabilities acquired; and
� the valuation of reporting units used in the initial allocation of goodwill and subsequent goodwill impairment tests.
As the estimation process is inherently uncertain, actualfuture outcomes could differ from present estimates andassumptions, potentially having material future effects onour financial statements.
Significant Changes in EstimatesGold and Copper Mineral ReservesAt the end of each fiscal year, as part of our annual businesscycle, we prepare estimates of proven and probable gold andcopper mineral reserves for each mineral property. We pro-spectively revise calculations of amortization of property,plant and equipment beginning in the first quarter of thenext fiscal year. The effect of changes in reserve estimates onamortization expense for 2006 was a decrease of $75 million(2005: $28 million decrease; 2004: $15 million decrease).
Asset Retirement Obligations (AROs)Each quarter we update cost estimates, and other assump-tions used in the valuation of AROs, for AROs at each ofour mineral properties to reflect new events, changes in cir-cumstances and any new information that is available.Changes in these cost estimates and assumptions have acorresponding impact on the fair value of the ARO. Forclosed mines any change in the fair value of AROs results ina corresponding charge or credit within other expense.A charge of $53 million was recorded in 2006 for changesin cost estimates for AROs at closed mines (2005: $15 mil-lion expense; 2004: $22 million expense). For further detailssee note 20.
78 � Notes to Consolidated Financial Statements Barrick Financial Report 2006

Notes to Consolidated Financial Statements � 79Barrick Financial Report 2006
Deferred Tax Valuation AllowancesFor a description of changes in valuation allowances, referto note 8.
Placer Dome Purchase Price AllocationIn fourth quarter 2006, we finalized the valuations of assetsand liabilities acquired on the acquisition of Placer Dome.In the final purchase price allocation, the significantchanges from the preliminary allocation were an increase inthe value of property, plant and equipment by $2,104 mil-lion; recognition of intangible assets with a value of$85 million; an increase in asset retirement obligations by$215 million; and an increase in net deferred income tax liabilities by $574 million. Goodwill arising in the final purchase price allocation amounted to $6,506 million. Infourth quarter 2006, we prospectively revised the measure-ment of amortization to reflect the final values of property,plant and equipment and intangible assets. We recorded anincrease in amortization expense in fourth quarter 2006 of$30 million for property, plant and equipment and $10 mil-lion for intangible assets. We also revised the measurementof interest capitalized for fourth quarter 2006 to reflect finalvaluations of acquired qualifying assets that resulted in anincrease in interest capitalized by $14 million.
e) Accounting ChangesEITF 04-6 Accounting for Stripping Costs IncurredDuring Production in the Mining IndustryIn 2005, we adopted EITF 04-6 and changed our accountingpolicy for stripping costs incurred in the production phase.Prior to adopting EITF 04-6, we capitalized stripping costsincurred in the production phase, and we recorded amorti-zation of the capitalized costs as a component of the cost ofinventory produced each period. Under EITF 04-6, strip-ping costs are recorded directly as a component of the costof inventory produced each period. Using an effective dateof adoption of January 1, 2005, we recorded a decrease incapitalized mining costs of $226 million; an increase in thecost of inventory of $232 million; and a $6 million credit toearnings for the cumulative effect of this change. For 2005,the effect of adopting EITF 04-6 compared to the prior pol-icy was an increase in net income of $44 million ($0.08 pershare), excluding the cumulative effect on prior periods.
FAS 123R, Accounting for Stock-Based CompensationOn January 1, 2006, we adopted FAS 123R. Prior to this datewe applied FAS 123 and accounted for stock options underthe intrinsic value method, recording compensation cost forstock options as the excess of the market price of the stockat the grant date of an award over the exercise price. Histori-cally, the exercise price of stock options equaled the marketprice of the stock at the grant date resulting in no recordedcompensation cost. We provided pro forma disclosure of theeffect of expensing the fair value of stock options.
In September 2006, the SEC released a letter onaccounting for stock options. The letter addresses the deter-mination of the grant date and measurement date for stockoption awards. For Barrick, the stock option grant date isthe date when the details of the award, including the num-ber of options granted by individual and the exercise price,are approved. The application of the principles in the letterissued by the SEC did not change the date that has been his-torically determined as the measurement date for stockoption grants.
We adopted FAS 123R using the modified prospectivemethod, which meant that financial statements for periodsprior to adoption were not restated. From January 1, 2006we record compensation expense for all new stock optiongrants based on the grant date fair value, amortized on astraight-line basis over the vesting period. We also recordcompensation expense for the unvested portion of stockoption grants occurring prior to January 1, 2006, based onthe grant date fair value that was previously estimated andused to provide for pro forma disclosures for financial state-ment periods prior to 2006, amortized on a straight-linebasis over the remaining vesting period for those unvestedstock options.
Compensation expense for stock options was $27 mil-lion in 2006, and is presented as a component of cost ofsales, corporate administration and other expense, consis-tent with the classification of other elements of compensa-tion expense for those employees who had stock options.The recognition of compensation expense for stock optionsreduced earnings per share for 2006 by $0.03 per share. Theapplication of FAS 123R to Restricted Share Units (RSUs)and Deferred Share Units (DSUs) did not result in anysignificant change in the method of accounting for RSUs orDSUs. See note 25 for further information on stock-basedcompensation.

FAS 151, Inventory CostsFAS 151 specifies the general principles applicable to thepricing and allocation of certain costs to inventory. FAS 151is the result of a broader effort by the Financial AccountingStandards Board (FASB) to improve the comparability ofcross-border financial reporting by working with theInternational Accounting Standards Board (IASB) towarddevelopment of a single set of high-quality accounting standards. As part of that effort, the FASB and the IASBidentified opportunities to improve financial reporting byeliminating certain narrow differences between their exist-ing accounting standards. The accounting for inventorycosts, in particular, abnormal amounts of idle facilityexpense, freight, handling costs, and spoilage, is one suchnarrow difference that the FASB decided to address by issu-ing FAS 151. As historically worded in ARB 43, Chapter 4,the term “abnormal” was not defined and its applicationcould lead to unnecessary noncomparability of financialreporting. FAS 151 eliminates that term. Under FAS 151,abnormal amounts of idle facility expense, freight, handlingcosts and wasted materials are recognized as current periodcharges rather than capitalized to inventory. FAS 151 alsorequires that the allocation of fixed production overhead tothe cost of inventory be based on the normal capacity ofproduction facilities.
FAS 151 was applicable prospectively from January 1,2006 and we modified our inventory accounting policy con-sistent with its requirements. Under our modified account-ing policy for inventory, production-type costs that areabnormal are excluded from inventory and charged directlyto the cost of sales. Interruptions to normal activity levelsat a mine could occur for a variety of reasons includingequipment failures and major maintenance activities,strikes, power supply interruptions and adverse weatherconditions. When such interruptions occur we evaluate theimpact on the cost of inventory produced in the period, andto the extent the actual cost exceeds the cost based on nor-mal capacity we expense any excess directly to cost of sales.The adoption of FAS 151 did not have any significant effecton our financial statements.
FAS 158, Employers’ Accounting for Defined BenefitPension and Other Post-retirement PlansIn September 2006, the FASB issued FAS 158 that requiresemployers to fully recognize the obligations associated withsingle-employer defined benefit pension, retiree health careand other post-retirement plans in their financial state-ments. FAS 158 was developed to respond to concerns thatpast accounting standards needed to be revisited to improvethe transparency and usefulness of the informationreported about them. Under past accounting standards, thefunded status of an employer’s post-retirement benefit plan(i.e., the difference between the plan assets and obligations)was not always completely reported in the balance sheet.Employers reported an asset or liability that almost alwaysdiffered from the plan’s funded status because previousaccounting standards allowed employers to delay recogni-tion of certain changes in plan assets and obligations thataffected the costs of providing such benefits. Past standardsonly required an employer to disclose the complete fundedstatus of its plans in the notes to the financial statements.
FAS 158 requires recognition of the funded status of abenefit plan on the balance sheet – measured as the differ-ence between plan assets at fair value (with limited excep-tions) and the benefit obligation, as at the fiscal year-end.For a pension plan, the benefit obligation is the projectedbenefit obligation; for any other post-retirement benefitplan, such as a retiree health care plan, the benefit obliga-tion is the accumulated post-retirement benefit obligation.FAS 158 also requires recognition, as a component of othercomprehensive income, net of tax, of the gains or losses andprior service costs or credits that arise during the periodbut are not recorded as components of net periodic benefitcost. Amounts recorded in accumulated other comprehen-sive income are adjusted as they are subsequently recordedas components of net periodic cost. FAS 158 requires dis-closure of information about certain effects of net periodicbenefit cost for the next fiscal year that arise from delayedrecognition of the gains or losses, prior service costs orcredits, and transition asset or obligation.
We adopted the provisions of FAS 158 in 2006, asrequired, except for the requirement to measure the planassets and benefit obligations at the fiscal year-end, whichis effective in fiscal years ending after December 15, 2008.The adoption of FAS 158 did not significantly impact ourfinancial statements, and is disclosed in note 26.
80 � Notes to Consolidated Financial Statements Barrick Financial Report 2006

Notes to Consolidated Financial Statements � 81Barrick Financial Report 2006
SEC Staff Accounting Bulletin No. 108 – Considering the Effects of Prior Year Misstatementswhen Quantifying Misstatements in Current Year Financial Statements (SAB 108)In September 2006, the SEC issued SAB 108. SAB 108addresses the multiple methods used to quantify financialstatement misstatements and evaluate the accumulation ofmisstatements on the balance sheet. SAB 108 requires reg-istrants to evaluate prior period misstatements using botha balance sheet approach (“the iron curtain method”) andan income statement approach (“the rollover method”).SAB 108 is effective for interim and annual periods endingafter November 15, 2006. SAB 108 allows a one-time transi-tional cumulative effect adjustment to retained earnings asof January 1, 2006 for errors that were previously deemednot material, but would be material under the requirementsof SAB 108. Barrick has historically used the rollovermethod in quantifying potential financial statement mis-statements. As required by SAB 108, we re-evaluated priorperiod immaterial errors using the iron curtain method.Based upon the result of our evaluation, we did not identifyany material errors or misstatements that were previouslydeemed not material under the rollover approach. Goingforward, we will be applying both methods in quantifyingpotential financial statement errors and misstatements, asrequired by SAB 108.
f) Accounting DevelopmentsFASB Interpretation No. 48 – Accounting forUncertainty in Tax Positions (FIN 48)In June 2006, the FASB issued FIN 48 – Accounting forUncertainty in Income Taxes, an interpretation of FASBStatement No. 109. The interpretation has been developedbecause of diversity in practice for accounting for uncertaintax positions. Some entities record tax benefits for uncer-tain tax positions as they are filed on the income tax return,while others use either gain contingency accounting or a probability threshold.
Under FIN 48, an entity should presume that a taxingauthority will examine all tax positions with full knowledgeof all relevant information. Therefore, when evaluating a tax
position for recognition and measurement, considerationof the risk of examination is not appropriate. In applyingthe provisions of FIN 48, there are distinct recognition andmeasurement evaluations. The first step is to evaluate thetax position for recognition by determining if the weight ofavailable evidence indicates it is more likely than not, basedsolely on the technical merits, that the position will be sus-tained on audit, including resolution of related appeals orlitigation processes, if any. The second step is to measurethe appropriate amount of the benefit to recognize. Theamount of benefit to recognize will be measured as themaximum amount which is more likely than not to be real-ized. The tax position should be de-recognized in the firstperiod when it is no longer more likely than not of beingsustained. On subsequent recognition and measurement,the maximum amount which is more likely than not to berecognized at each reporting date will represent manage-ment’s best estimate given the information available at thereporting date, even though the outcome of the tax positionis not absolute or final. Subsequent recognition, de-recog-nition, and measurement should be based on new informa-tion. A liability for interest or penalties or both will berecognized as deemed to be incurred based on the provi-sions of the tax law, that is, the period for which the taxingauthority will begin assessing the interest or penalties orboth. The amount of interest expense recognized will bebased on the difference between the amount recognized inaccordance with this interpretation and the benefit recog-nized in the tax return.
Under FIN 48, an entity must disclose its policy on theclassification of interest and penalties and also disclose areconciliation of the total amounts of unrecognized taxbenefits at the beginning and the end of each period. Ontransition, the change in net assets due to applying the pro-visions of the interpretation will be considered a change inaccounting principle with the cumulative effect of thechange treated as an offsetting adjustment to the openingbalance of retained earnings in the period of transition. Theinterpretation is effective beginning January 1, 2007. We arepresently evaluating the impact of this interpretation on ourfinancial statements.
82 � Notes to Consolidated Financial Statements Barrick Financial Report 2006
FAS 157, Fair Value MeasurementsIn September 2006, the FASB issued FAS 157 that providesenhanced guidance for using fair value to measure assetsand liabilities. FAS 157 is meant to ensure that the measure-ment of fair value is more comparable and consistent, andimprove disclosure about fair value measures. As a result ofFAS 157 there is now a common definition of fair value tobe used throughout US GAAP. FAS 157 applies wheneverUS GAAP requires (or permits) measurement of assets orliabilities at fair value. FAS 157 does not address when theuse of fair value measurements is required.
FAS 157 defines fair value as “the price that would bereceived to sell an asset or paid to transfer a liability in anorderly transaction between market participants at the mea-surement date.” This definition of fair value retains theexchange-price notion contained (either explicitly or implic-itly) in many earlier US GAAP definitions of fair value.However, FAS 157 clarifies that the basis for a fair valuemeasure is the price at which a company would sell or other-wise dispose of its assets or pay to settle a liability (i.e., anexit price), not the market price at which a company acquiresits assets or assumes a liability (i.e., not an entry price). Theexit price concept is based on current expectations about thefuture inflows associated with the asset and the futureoutflows associated with the liability from the perspective ofmarket participants. Under FAS 157, a fair value measureshould reflect all of the assumptions that market participantswould use in pricing the asset or liability including, forexample, an adjustment for risk inherent in a particular val-uation technique used to measure fair value.
In measuring fair value for a financial statement item,FAS 157 gives the highest priority to quoted prices in activemarkets. However, FAS 157 also permits the use of unob-servable inputs for situations in which there is little, if any,market activity for the asset or liability being measured.Whether there is significant market activity or not, theobjective is a market-based measure, rather than an entity-specific measure. FAS 157 also provides guidance on theeffect of changes in credit risk on a fair value measure;investment blocks; and restricted securities.
FAS 157 expands disclosure about the use of fair valueto measure assets and liabilities. FAS 157 requires disclo-sures intended to provide information about (1) the extentto which companies measure assets and liabilities at fairvalue, (2) the methods and assumptions used to measurefair value, and (3) the effect of fair value measures on earn-ings. FAS 157 is effective for financial statements issued forfiscal years beginning after November 15, 2007. Early adop-tion is permitted. We are currently assessing the impact ofFAS 157 on our financial statements.
FSP AUG AIR-1 – Accounting for Planned MajorMaintenance Activities (FSP Air-1)In September 2006, the FASB issued FSP AIR-1 whichamends guidance from the AICPA Industry Audit Guide,Audits of Airlines (“Airline Guide”) with respect to plannedmajor maintenance activities and makes this guidanceapplicable to entities in all industries. Of the three methodsof accounting for planned major maintenance allowed byFSP AIR-1, we plan to use the built-in overhaul method.The built-in overhaul method is based on segregation ofplant and equipment costs into those that should be depre-ciated over the useful life of the asset and those that requireoverhaul at periodic intervals. Thus, the estimated cost ofthe overhaul component included in the purchase price ofan asset is set up separately from the cost of the asset and isamortized to the date of the initial overhaul. The cost of theinitial overhaul is then capitalized and amortized to thenext overhaul, at which time the process is repeated.
FSP AIR-1 is effective for the first fiscal year beginningafter December 15, 2006. The provisions are applied retro-spectively for all financial statements presented unless it isimpractical to do so. We intend to apply the provisions ofFSP AIR-1 beginning January 1, 2007. We are in the processof determining the effect that adoption of this FSP will haveon prior periods.
Notes to Consolidated Financial Statements � 83Barrick Financial Report 2006
g) Other Significant Accounting Policies
Note Page
Acquisitions and divestitures 3 83Segment information 4 88Revenue and gold sales contracts 5 90Cost of sales 6 92Other (income) expense 7 92Income tax (recovery) expense 8 94Earnings per share 9 96Operating cash flow – other items 10 97Investments 11 97Inventories 12 100Accounts receivable, and other current assets 13 101Property, plant and equipment 14 102Intangible assets 15 104Goodwill 16 104Other assets 17 105Other current liabilities 18 105Financial instruments 19 105Asset retirement obligations 20 115Other non-current liabilities 21 116Deferred income taxes 22 116Capital stock 23 117Other comprehensive income (loss) 24 118Stock-based compensation 25 119Post-retirement benefits 26 121Litigation and claims 27 125Unincorporated joint ventures 28 127
3 � Acquisitions and Divestitures
a) Acquisition of Placer Dome Inc. (“Placer Dome”)Placer Dome Offer and AcceptanceIn first quarter 2006 we acquired 100% of the outstandingcommon shares of Placer Dome. Placer Dome was one ofthe world’s largest gold mining companies. It had 12 min-ing operations based in North America, South America,Africa and Australia/Papua New Guinea, as well as fourprojects that are in various stages of exploration/develop-ment. Its most significant mines were Cortez in the UnitedStates, Zaldívar in Chile, Porgera in Papua New Guinea,North Mara in Tanzania and South Deep in South Africa.The most significant projects are Cortez Hills and Donlin
Creek in the United States , and Pueblo Viejo in theDominican Republic. The business combination betweenourselves and Placer Dome was an opportunity to create aCanadian-based leader in the global gold mining industry,which strengthens our competitive position, including inrespect of gold reserves, gold production, growth opportu-nities, and balance sheet strength.
Accounting for the Placer Dome AcquisitionThe Placer Dome acquisition has been accounted for as a purchase business combination, with Barrick as theaccounting acquirer. We acquired Placer Dome on Janu-ary 20, 2006, with the results of operations of Placer Domeconsolidated from January 20, 2006 onwards. The purchasecost was $10 billion and was funded through a combinationof common shares issued, the drawdown of a $1 billioncredit facility, and cash resources.
Value of 322.8 million Barrick common shares issued at $27.14 per share1 $ 8,761
Value of 2.7 million fully vested stock options 22Cash 1,239Transaction costs 32
$10,054
1. The measurement of the common share component of the purchase consid-eration represents the average closing price on the New York Stock Exchangefor the two days prior to and two days after the public announcement onDecember 22, 2005 of our final offer for Placer Dome.
In accordance with the purchase method of accounting, thepurchase cost was allocated to the underlying assetsacquired and liabilities assumed based primarily upon theirestimated fair values at the date of acquisition. The esti-mated fair values were based on a combination of inde-pendent appraisals and internal estimates. We concludedthat the excess of purchase cost over the net identifiable tan-gible and intangible assets acquired represents goodwill.Goodwill arising on the acquisition of Placer Dome princi-pally represents the ability for the company to continue asa going concern by finding new mineral reserves as well asthe value of synergies that we expect to realize as a directconsequence of the acquisition of Placer Dome.

84 � Notes to Consolidated Financial Statements Barrick Financial Report 2006
The principal valuation methods for major classes of assetsand liabilities were:
Summary Purchase Price Allocation
Cash $ 1,102Inventories 428Other current assets 198Property, plant and equipment
Buildings, plant and equipment 2,946Proven and probable reserves 1,571Value beyond proven and probable reserves 419
Intangible assets (note 15) 85Assets of discontinued operations1 1,744Other assets 347Goodwill 6,506
Total assets 15,346
Current liabilities 669Liabilities of discontinued operations1 107Derivative instrument liabilities 1,729Long-term debt 1,252Asset retirement obligations 387Deferred income tax liabilities 686
Total liabilities 4,830
Non-controlling interests 462
Net assets acquired $ 10,054
1. Includes operations that were sold to Goldcorp.
Severance Costs
Amounts recorded at acquisition $ 48Settlements in 2006 45
Amounts outstanding at December 31, 2006 $ 3
At acquisition we recorded liabilities totaling $48 millionthat primarily relate to employee severance at Placer Domeoffices that were closed during the year. We expect to pay allthe outstanding amounts by second quarter 2007.
Inventory Finished goods and work in processvalued at estimated selling prices lessdisposal costs, costs to complete and areasonable profit allowance for thecompleting and selling effort.
Building andequipment
Reproduction and/or replacement cost ormarket value for current function andservice potential, adjusted for physical,functional and economic obsolescence.
Proven and probablereserves and valuebeyond proven andprobable reserves atproducing mines
Multi-period excess earnings approachconsidering the prospective level of cashflows and fair value of other assets at each mine.
Development projects
Exploration properties
Discounted future cash flows consideringthe prospective level of cash flows fromfuture operations and necessary capital cost expenditures.
Appraised values considering costs incurred,earn-in agreements and comparablemarket transactions, where applicable.
Intangible assets Value based on potential cost savings, price differential, discounted future cashflows, or comparable market transactions, as applicable.
Long-term debt andderivative instruments
Estimated fair values consistent with themethods disclosed in note 19d.
Asset retirementobligations
Estimated fair values consistent with themethods disclosed in note 20.

Notes to Consolidated Financial Statements � 85Barrick Financial Report 2006
Pro Forma Information (Unaudited)
Pro Forma Consolidated Statement of Income
For the year ended December 31, 2005($ millions of US dollars, Pro forma
except per share data in dollars) consolidated Pro formaBarrick before adjustments forsale of certain sale of certain
As reported Pro forma operations to operations to Pro formapurchase Goldcorp and Goldcorp and consolidated
Barrick Placer Dome adjustments1 Gold Fields Gold Fields2 Barrick
Sales $ 2,350 $ 1,978 $ 4,328 (352) (f) $ 3,976
Costs and expensesCost of sales3 1,214 1,271 2,485 (265) (f) 2,220Amortization 427 264 131 (a) 822 (50) (f) 772Corporate administration 71 68 139 139Exploration 109 91 200 (28) (f) 172Project development expense 32 81 113 113Other operating expenses 59 6 65 65Impairment of long-lived assets – – – –
1,912 1,781 131 3,824 (343) 3,481
Interest income 38 39 5 (b) 82 82Interest expense (7) (92) 1 (c) (98) (98)Other income 49 44 93 (2) (f) 91Other expense (56) (79) 21 (d) (114) (114)
24 (88) 27 (37) (2) (39)
Income from continuing operations before income taxes and other items 462 109 (104) 467 (11) 456
Income tax (expense) recovery (60) (21) (8) (e) (89) 4 (g) (85)Non-controlling interests (1) 2 1 1Equity in investees (6) 4 (2) (4) (f) (6)
Income before cumulative effect of changes in accounting principles 395 94 (112) 377 (11) 366
Cumulative effect of changes in accounting principles 6 (14) (8) (8)
Net income for the year $ 401 $ 80 $ (112) $ 369 $ (11) $ 358
Earnings per share data:Net income
Basic and diluted $ 0.75 $ 0.18 $ 0.42
1. Adjustments to reflect certain estimated effects of purchase accounting.2. Adjustments to reflect the estimated effects of the sale of certain Placer Dome operations to Goldcorp and Gold Fields.3. Exclusive of amortization.

Basis of PresentationThis unaudited pro forma consolidated financial statementinformation has been prepared by us for illustrative purposesonly to show the effect of the acquisition of Placer Dome byBarrick. The unaudited pro forma consolidated statementinformation assumes that Barrick acquired Placer Domeeffective January 1, 2005. In conjunction with the offer toacquire Placer Dome, Barrick entered into an agreementwith Goldcorp Inc. (“Goldcorp”) for the sale of certain opera-tions and projects of Placer Dome. This unaudited pro formaconsolidated financial statement information assumes thatsale of these operations to Goldcorp occurred on January 1,2005. Pro forma adjustments for the assumed effect of thesale of these operations to Goldcorp on the results of opera-tions of Barrick have been reflected in this unaudited proforma consolidated financial statement information. Proforma adjustments also reflect the sale of the South Deepmine in South Africa to Gold Fields Limited (“Gold Fields”),had the sale occurred on January 1, 2005 (note 3b).
The unaudited pro forma consolidated financial state-ment information is not intended to be indicative of theresults that would actually have occurred, or the resultsexpected in future periods, had the events reflected hereinoccurred on the dates indicated. Any potential synergiesthat may be realized and integration costs that may beincurred have been excluded from the unaudited pro formafinancial statement information, including Placer Dometransaction costs and amounts payable under change ofcontrol agreements to certain members of managementthat are estimated at a combined total of $93 million. Theinformation prepared is only a summary.
Pro Forma Assumptions and AdjustmentsCertain adjustments have been reflected in this unauditedpro forma consolidated statement of income to illustratethe effects of purchase accounting and to reflect the impactof the sale of certain Placer Dome operations to Goldcorp,where the impact could be reasonably estimated. The principal purchase accounting adjustments relate to amor-tization, income taxes and interest expense, that have beenadjusted to the accounting base recognized for each in the business combination.
Pro Forma AdjustmentsThe unaudited pro forma consolidated statement ofincome reflects the following adjustments as if the acquisi-tion of 100% of Placer Dome and subsequent sale of cer-tain operations to Goldcorp and Gold Fields had occurredon January 1, 2005:(a) An increase in amortization expense by $131 million
to reflect the value assigned to property, plant andequipment and intangible assets in the purchase priceallocation.
(b) An increase in interest income by $5 million for theyear ended December 31, 2005 to reflect interestincome earned on cash proceeds generated by theassumed exercise of Placer Dome stock options.
(c) An increase in interest expense by $48 million for theyear ended December 31, 2005 to reflect the interestcosts (net of amounts that would have been capitalizedto Barrick development projects) relating to the cashcomponent of the Offer that was financed throughtemporary credit facilities. A decrease in interestexpense by $49 million for the year ended December31, 2005 to reflect the assumed avoidance of interest onthe temporary financing for the cash component of theOffer assuming the repayment of such financing fromthe receipt of cash proceeds from the sale of certainPlacer Dome operations to Goldcorp.
(d) A decrease in other expense by $21 million to de-rec-ognize non-recurring transaction costs recorded byPlacer Dome relating to the Barrick offer.
(e) A debit to tax expense of $8 million for the year endedDecember 31, 2005 to reflect the tax effect of the proforma purchase adjustments in (a) through (d).
(f) Adjustments to de-recognize the revenues and ex-penses for the year ended December 31, 2005 relatingto the Placer Dome operations that were sold toGoldcorp and Gold Fields.
(g) Adjustments to de-recognize income tax expense forthe operations that were sold to Goldcorp and GoldFields for the year ended December 31, 2005 and torecord the tax effect of other pro forma adjustmentsrelating to the sale of certain Placer Dome operationsto Goldcorp and Gold Fields.
Pro Forma Earnings Per Share
For the year ended December 31, 2005(millions of shares or US dollars, except per share data in dollars)
Actual weighted average number of Barrick common shares outstanding 536
Assumed number of Barrick common sharesissued to Placer Dome shareholders 323
Pro forma weighted average number of Barrick common shares outstanding 859
Pro forma net income $ 358
Pro forma earnings per share – basic $ 0.42
Pro forma weighted average number ofBarrick common shares outstanding 859
Dilutive effect of stock options 2
Pro forma weighted average number of Barrick common shares outstanding – diluted 861
Pro forma earnings per share – diluted $ 0.42
86 � Notes to Consolidated Financial Statements Barrick Financial Report 2006

Notes to Consolidated Financial Statements � 87Barrick Financial Report 2006
b) Discontinued Operations
Results of Discontinued Operations
For the years ended December 31 2006 2005
Gold salesSouth Deep operations $ 158 $ –Operations sold to Goldcorp 83 –
$ 241 $ –
Income (loss) before taxSouth Deep1 8 –Gain on sale of South Deep 288Operations sold to Goldcorp 1 –
$ 297 $ –
1. Amounts are disclosed net of non-controlling interests of $24 million.
South DeepOn December 1, 2006, we sold our 50% interest in the South Deep mine in South Africa to Gold Fields. GoldFields is responsible for all liabilities relating solely to theassets of the mine, including employment commitmentsand environmental, closure and reclamation liabilities. Theconsideration on closing was $1,517 million, of which$1,209 million was received in cash and $308 million in Gold Fields shares. On closing we recorded a gain of$288 million, representing the consideration received lesstransaction costs and the carrying amount of net assets ofSouth Deep, including goodwill relating to South Deep of$651 million.
The results of the operations of South Deep in 2006 arepresented under “discontinued operations” in the incomestatement and cash flow statement. As required by account-ing rules applicable to discontinued operations, amortiza-tion of property, plant and equipment at South Deep ceasedon September 1, 2006, the date when they were classified asheld for sale, and we allocated interest expense of $2 mil-lion to these discontinued operations.
In second quarter 2006, a loaded skip and 6.7 kilome-ters of rope fell 1.6 kilometers down the South Deep mine’sTwin Shaft complex during routine maintenance, causingextensive damage but no injuries. Repair costs for assetsthat were damaged were expensed as incurred. We wereinsured for property damage and a portion of businessinterruption losses. Insurance recoveries of $12 million(based on our 50% interest in South Deep) were recordedwithin income from discontinued operations for the periodto December 1, 2006.
Operations Sold to GoldcorpIn second quarter 2006, we sold all of Placer Dome’sCanadian properties and operations (other than PlacerDome’s office in Vancouver), including all mining, reclama-tion and exploration properties, Placer Dome’s interest inthe La Coipa mine in Chile, 40% of Placer Dome’s interestin the Pueblo Viejo project in the Dominican Republic, cer-tain related assets and, our share in Agua de la Falda S.A.,which included our interest in the Jeronimo project, toGoldcorp Inc. (“Goldcorp”) (collectively, the ‘‘Operationssold to Goldcorp’’). Goldcorp is responsible for all liabili-ties relating solely to these properties and operations,including employment commitments and environmental,closure and reclamation liabilities.
The sales proceeds for the operations sold to Goldcorpwere $1,641 million. The aggregate net amount of assets andliabilities of these operations were recorded in the purchaseprice allocation at $1,641 million based on the terms of asale agreement with Goldcorp that was in place at the timewe acquired Placer Dome. The results of the operations soldto Goldcorp were included under “discontinued opera-tions” in the income statement and cash flow statementuntil closing. Interest expense of $21 million was allocatedto the results from the operations sold to Goldcorp. No gainor loss arose on closing of the sale.
c) Acquisition of Pioneer Metals Inc. (“Pioneer”)In 2006, we acquired control of Pioneer through the acqui-sition of 59.2 million shares, representing approximately91% of the outstanding shares of Pioneer. Total cash consid-eration paid was $53 million. Pioneer has a portfolio ofexploration properties and interests, including the Graceproperty which is adjacent to NovaGold Resources Inc.’sGalore Creek project. This transaction represents a pur-chase of assets, and we allocated the purchase price to theassets acquired.
d) Sale of Paddington OperationsIn November 2006, we signed a sale agreement for thePaddington operations in Australia, under which we willreceive cash proceeds of $39 million. The Paddington oper-ations, which form part of the Kanowna mine acquired inthe acquisition of Placer Dome, consist of the Paddingtonmill and certain land tenements in the area near the mill.We expect the transaction to close in first quarter 2007.
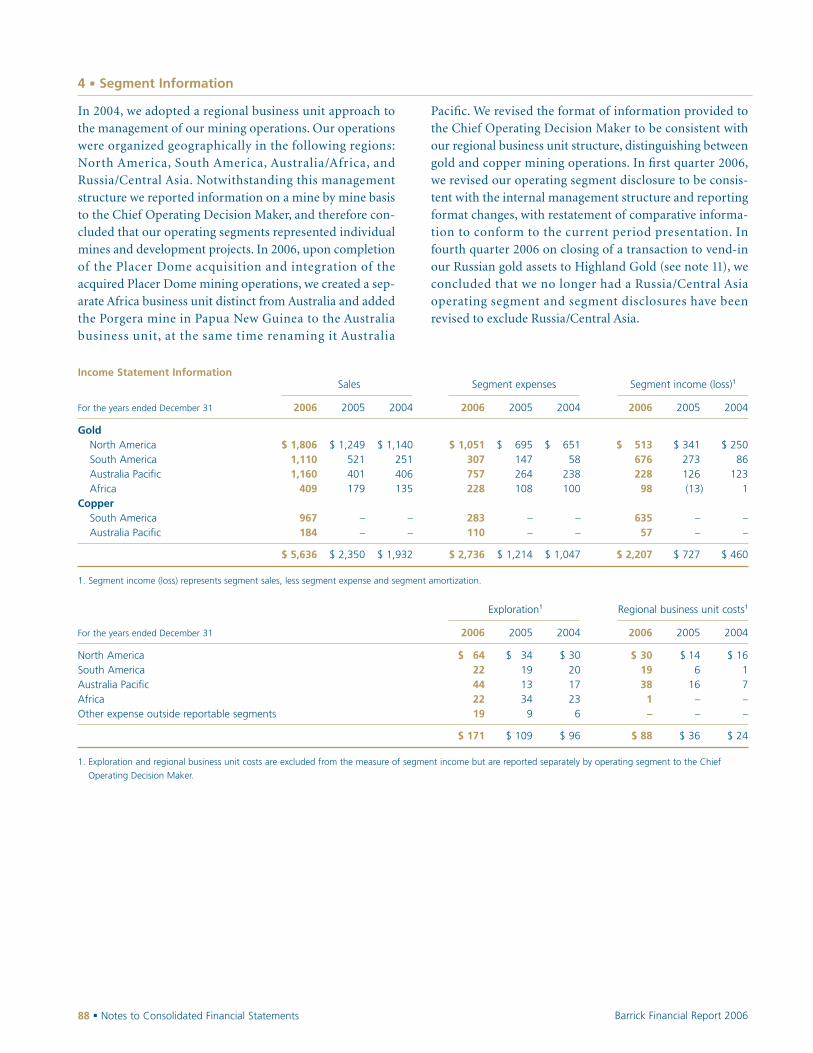
In 2004, we adopted a regional business unit approach tothe management of our mining operations. Our operationswere organized geographically in the following regions:North America, South America, Australia/Africa, andRussia/Central Asia. Notwithstanding this managementstructure we reported information on a mine by mine basisto the Chief Operating Decision Maker, and therefore con-cluded that our operating segments represented individualmines and development projects. In 2006, upon completionof the Placer Dome acquisition and integration of theacquired Placer Dome mining operations, we created a sep-arate Africa business unit distinct from Australia and addedthe Porgera mine in Papua New Guinea to the Australiabusiness unit, at the same time renaming it Australia
Pacific. We revised the format of information provided tothe Chief Operating Decision Maker to be consistent withour regional business unit structure, distinguishing betweengold and copper mining operations. In first quarter 2006,we revised our operating segment disclosure to be consis-tent with the internal management structure and reportingformat changes, with restatement of comparative informa-tion to conform to the current period presentation. Infourth quarter 2006 on closing of a transaction to vend-inour Russian gold assets to Highland Gold (see note 11), weconcluded that we no longer had a Russia/Central Asiaoperating segment and segment disclosures have beenrevised to exclude Russia/Central Asia.
88 � Notes to Consolidated Financial Statements Barrick Financial Report 2006
Income Statement InformationSales Segment expenses Segment income (loss)1
For the years ended December 31 2006 2005 2004 2006 2005 2004 2006 2005 2004
GoldNorth America $ 1,806 $ 1,249 $ 1,140 $ 1,051 $ 695 $ 651 $ 513 $ 341 $ 250South America 1,110 521 251 307 147 58 676 273 86Australia Pacific 1,160 401 406 757 264 238 228 126 123Africa 409 179 135 228 108 100 98 (13) 1
CopperSouth America 967 – – 283 – – 635 – –Australia Pacific 184 – – 110 – – 57 – –
$ 5,636 $ 2,350 $ 1,932 $ 2,736 $ 1,214 $ 1,047 $ 2,207 $ 727 $ 460
1. Segment income (loss) represents segment sales, less segment expense and segment amortization.
Exploration1 Regional business unit costs1
For the years ended December 31 2006 2005 2004 2006 2005 2004
North America $ 64 $ 34 $ 30 $ 30 $ 14 $ 16South America 22 19 20 19 6 1Australia Pacific 44 13 17 38 16 7Africa 22 34 23 1 – –Other expense outside reportable segments 19 9 6 – – –
$ 171 $ 109 $ 96 $ 88 $ 36 $ 24
1. Exploration and regional business unit costs are excluded from the measure of segment income but are reported separately by operating segment to the Chief
Operating Decision Maker.
4 � Segment Information

Notes to Consolidated Financial Statements � 89Barrick Financial Report 2006
Geographic Information
Long-lived assets2 Sales1
For the years endedDecember 31 2006 2005 2006 2005 2004
North AmericaUnited States $ 2,518 $ 1,431 $ 1,638 $ 1,073 $ 934Canada 921 313 168 176 206Dominican
Republic 78 – – – –South America
Peru 492 540 852 521 251Chile 1,599 269 967 – –Argentina 1,014 843 258 – –
Australia Pacific Australia 2,142 815 1,147 401 406Papua
New Guinea 438 – 197 – –Africa
Tanzania 993 669 409 179 135Other 452 234 – – –
$ 10,647 $ 5,114 $ 5,636 $ 2,350 $ 1,932
1. Presented based on the location in which the sale originated.
2. Long-lived assets include property, plant and equipment, and other tangible
non-current assets.
Reconciliation of Segment Income
For the years ended December 31 2006 2005 2004
Segment income $ 2,207 $ 727 $ 460Amortization of corporate assets (42) (18) (27)Exploration (171) (109) (96)Project development expense (119) (32) (45)Corporate administration (142) (71) (71)Other operating expenses (124) (59) (47)Impairment of long-lived assets (17) – (139)Other income (expense) (32) 24 8
Income from continuing operations before income taxes and other items $ 1,560 $ 462 $ 43
Asset Information Segment Segmentlong-lived assets Amortization capital expenditures
For the years ended December 31 2006 2005 2006 2005 2004 2006 2005 2004
GoldNorth America $ 3,517 $ 1,744 $ 242 $ 213 $ 239 $ 260 $ 218 $ 104South America 1,829 1,652 127 101 107 343 525 509Australia Pacific 2,142 815 175 46 45 340 308 110Africa 993 669 83 49 34 93 45 94
CopperSouth America 1,276 – 49 – – 18 – –Australia Pacific 438 – 17 – – 21 – –
Segment total 10,195 4,880 693 409 425 1,075 1,096 817Cash and equivalents 3,043 1,037 – – – – – –Accounts receivable, inventories,
other current assets 1,753 711 – – – – – –Intangible assets 75 – – – – – – –Goodwill 5,855 – – – – – – –
Other items not allocated to segments 452 234 42 18 27 12 8 7
Enterprise total $ 21,373 $ 6,862 $ 735 $ 427 $ 452 $ 1,087 $ 1,104 $ 824

5 � Revenue and Gold Sales Contracts
For the years ended December 31 2006 2005 2004
Gold bullion sales1
Spot market sales $ 3,949 $ 1,940 $ 1,111Gold sales contracts 369 300 709
4,318 2,240 1,820Concentrate sales 167 110 112
$ 4,485 $ 2,350 $ 1,932
Copper sales1
Copper cathode sales $ 951 $ – $ –Concentrate sales 200 – –
$ 1,151 $ – $ –
1. Revenues include amounts transferred from OCI to earnings for commoditycash flow hedges (see note 19c and 24).
ProductsAll of our gold mining operations produce gold in doré form,except Eskay Creek, which produces gold concentrate andgold ore; Bulyanhulu which produces both gold doré andgold concentrate; and Osborne which produces a concentratethat contains both gold and copper. Gold doré is unrefinedgold bullion bars usually consisting of 90% gold that isrefined to pure gold bullion prior to sale to our customers.Gold concentrate is a processing product containing thevaluable ore mineral (gold) from which most of the wastemineral has been eliminated, that undergoes a smeltingprocess to convert it into gold bullion. Gold bullion is soldprimarily in the London spot market or under gold salescontracts. Gold concentrate is sold to third-party smelters.
At our Zaldívar mine we produce pure copper cathode,which consists of 99.9% copper, a form that is deliverablefor sale in world metals exchanges.
Accounting PolicyWe record revenue when the following conditions are met:persuasive evidence of an arrangement exists; delivery andtransfer of title (gold revenue only) have occurred under theterms of the arrangement; the price is fixed or deter-minable; and collectability is reasonably assured. Revenueis presented net of direct sales taxes of $16 million (2005:$nil; 2004: $nil).
Gold Bullion SalesWe record revenue from gold and silver bullion sales at thetime of physical delivery, which is also the date that title tothe gold or silver passes. The sales price is fixed at the deliv-ery date based on either the terms of gold sales contracts or the gold spot price. Incidental revenues from the sale ofby-products such as silver are classified within cost of sales.
Gold Sales ContractsAt December 31, 2006, we had fixed-price gold sales contracts with various customers for a total of 10.8 millionounces of future gold production and floating spot pricegold sales contracts for a total of 1.2 million ounces. We hadallocated 9.5 million ounces of the fixed-price gold salescontracts to our development projects (“Project Gold SalesContracts”). In addition to the gold sales contracts allocatedto the development projects, we had 1.3 million ounces ofCorporate gold sales contracts that we intend to settlethrough delivery of future gold production from our oper-ating mines.
In 2007, in the period through February 21, 2007, wedelivered a total of 0.9 million ounces of our 2007 gold production into fixed-price Corporate Gold Sales Contractsat an average price of $340 per ounce. In 2007, we also converted 0.4 million ounces of fixed-price Corporate GoldSales Contracts into floating spot price contracts, for a totalof 1.6 million ounces of floating spot price contracts,whereby the price realized will represent spot less an aver-age fixed reduction of about $240 per ounce.
The terms of gold sales contracts are governed by mas-ter trading agreements (MTAs) that we have in place withcustomers. The contracts have final delivery dates primarilyover the next 10 years, but we have the right to settle thesecontracts at any time over this period. Contract prices areestablished at inception through to an interim date.If we do not deliver at this interim date, a new interim dateis set. The price for the new interim date is determined inaccordance with the MTAs which have contractually agreedprice adjustment mechanisms based on the market goldprice. The MTAs have both fixed and floating price mecha-nisms. The fixed-price mechanism represents the marketprice at the start date (or previous interim date) of the con-tract plus a premium based on the difference between theforward price of gold and the current market price. If at aninterim date we opt for a floating price, the floating pricerepresents the spot market price at the time of delivery of
90 � Notes to Consolidated Financial Statements Barrick Financial Report 2006

Notes to Consolidated Financial Statements � 91Barrick Financial Report 2006
gold adjusted based on the difference between the previ-ously fixed price and the market gold price at that interimdate. The final realized selling price under a contract prima-rily depends upon the timing of the actual future deliverydate, the market price of gold at the start of the contract andthe actual amount of the premium of the forward price ofgold over the spot price of gold for the periods that fixedselling prices are set.
Mark-to-Market ValueTotal At Dec. 31,
ounces in 2006$ millions millions value1
Project Gold Sales Contracts 9.5 $(3,187)Corporate Gold Sales Contracts 1.3 (387)Floating Spot Price Gold Sales Contracts 1.2 (260)
12.0 $(3,834)
1. At a spot gold price of $632 per ounce.
The difference between the forward price of gold and thecurrent market price, referred to as contango, can beexpressed as a percentage that is closely correlated to thedifference between US dollar interest rates and gold leaserates. Historically short-term gold lease rates have generallybeen lower than longer-term rates. We use gold lease rateswaps to achieve a more economically optimal term struc-ture for gold lease rates implicit in contango. Under theswaps we receive a fixed gold lease rate, and pay a floatinggold lease rate, on a notional 0.5 million ounces of goldspread from 2007 to 2013. The swaps are associated withfixed-price gold sales contracts with expected delivery datesbeyond 2007. Lease rate swaps are classified as non-hedgederivatives (note 19c) and had a positive fair value of$64 million at December 31, 2006 (2005: $66 million).
Floating spot price sales contracts were previouslyfixed-price forward sales contracts for which, in accordancewith the terms of our MTAs, we have elected to receive float-ing spot gold and silver prices, adjusted based on the differ-ence between the spot price and the contract price at thetime of such election. Floating prices were elected for thesecontracts so that we could economically regain spot goldprice leverage under the terms of delivery into these con-tracts. Furthermore, floating price mechanisms were electedfor these contracts at a time when the then current marketprice was higher than the fixed price in the contract. The
mark-to-market value of these contracts (at December 31,2006) was negative $260 million, which equates to an aver-age reduction to the future spot sales price of approximately$221 per ounce, when we deliver gold at spot prices againstthese contracts.
At December 31, 2006, one counterparty made up 12%of the total ounces committed under gold sales contracts.
Concentrate SalesUnder the terms of concentrate sales contracts with inde-pendent smelting companies, gold and copper sales pricesare set on a specified future date after shipment based onmarket prices. We record revenues under these contracts atthe time of shipment, which is also when title passes to thesmelting companies, using forward market gold and copperprices on the expected date that final sales prices will befixed. Variations between the price recorded at the shipmentdate and the actual final price set under the smelting con-tracts are caused by changes in market gold and copperprices, and result in an embedded derivative in the accountsreceivable. The embedded derivative is recorded at fair valueeach period until final settlement occurs, with changes infair value classified as a component of revenue. The notionalamount typically outstanding in accounts receivable isbetween ten and fifteen thousand ounces of gold and 4 and7 million pounds of copper.
Copper Cathode SalesUnder the terms of copper cathode sales contracts, copperprices are set on a specified future date based upon marketcommodity prices plus certain price adjustments. Revenueis recognized at the time of shipment when risk of loss passes to the customer, and collectability is reasonablyassured. Revenue is measured using forward market priceson the expected date that final selling prices will be fixed.Variations occur between the price recorded on the date ofrevenue recognition and the actual final price under theterms of the contracts due to changes in market copperprices, which result in the existence of an embedded deriv-ative in the accounts receivable. This embedded derivativeis recorded at fair value each period until final settlementoccurs, with changes in fair value classified as a componentof revenue. The notional amount typically outstanding in accounts receivable is between 20 and 30 million poundsof copper.

92 � Notes to Consolidated Financial Statements Barrick Financial Report 2006
6 � Cost of Sales
Gold Copper
For the years ended December 31 2006 2005 2004 2006 2005 2004
Cost of goods sold1 $ 2,289 $ 1,265 $ 1,128 $ 390 $ – $ –By-product revenues2 (123) (132) (146) (1) – –Royalty expense 150 63 53 4 – –Mining production taxes 27 18 12 – – –
$ 2,343 $ 1,214 $1,047 $ 393 $ – $ –
1. Cost of goods sold includes accretion expense at producing mines of $31 million (2005: $11 million; 2004: $11 million). Cost of goods sold includes charges toreduce the cost of inventory to net realizable value as follows: $28 million in 2006; $12 million in 2005 and $9 million in 2004. The cost of inventory sold in theperiod reflects all components capitalized to inventory, except that, for presentation purposes, the component of inventory cost relating to amortization of property,plant and equipment is classified in the income statement under “amortization.” Some companies present this amount under “cost of sales.” The amount presentedin amortization rather than cost of sales was $693 million in 2006; $409 million in 2005 and $425 million in 2004. In 2004, cost of goods sold includes the reversalof $15 million of accrued costs on resolution of the Peruvian tax assessment (see note 8).
2. We use silver sales contracts to sell a portion of silver produced as a by-product. Silver sales contracts have similar delivery terms and pricing mechanisms as goldsales contracts. At December 31, 2006, we had fixed-price commitments to deliver 13.1 million ounces of silver at an average price of $6.45 per ounce and floatingspot price silver sales contracts for 7.0 million ounces over periods primarily of up to 10 years. The mark-to-market on silver sales contracts at December 31, 2006 wasnegative $100 million (2005: negative $52 million).
Royalties
Certain of our properties are subject to royalty arrange-ments based on mineral production at the properties. Themost significant royalties are at the Goldstrike, Bulyanhuluand Veladero mines and the Pascua-Lama project. The pri-mary type of royalty is a net smelter return (NSR) royalty.Under this type of royalty we pay the holder an amount cal-culated as the royalty percentage multiplied by the value ofgold production at market gold prices less third-partysmelting, refining and transportation costs. Most Goldstrikeproduction is subject to an NSR or net profits interest (NPI)royalty. The highest Goldstrike royalties are a 5% NSR and a6% NPI royalty. Bulyanhulu is subject to an NSR-type roy-alty of 3%. Pascua-Lama gold production from the areaslocated in Chile is subject to a gross proceeds sliding scaleroyalty, ranging from 1.5% to 9.8%, and a 2% NSR on copper production. For areas located in Argentina, Pascua-Lama is subject to a 3% NSR on extraction of all gold, sil-ver and other minerals. Production at Veladero is subject toa 3.75% NSR on extraction of all gold, silver and other min-erals. Production at Lagunas Norte is subject to a 2.51%NSR on extraction of all gold and other minerals. Throughthe acquisition of Placer Dome we assumed various royaltyobligations at the Placer Dome mines. All production atCortez is subject to a 1.5% gross smelter return (“GSR”)royalty, with a further GSR royalty over the Pipeline/SouthPipeline deposit (graduating from 0.4% to 5.0% based onthe price of gold) and a net value royalty of 5% over a por-tion of the Pipeline/South Pipeline deposit. Production atthe Pueblo Viejo project is subject to a 3.2% NSR from thesale of minerals less costs incurred on mining extraction or
removal of minerals from the leased properties. Productionat Donlin Creek project is subject to a 1.5% net smelter roy-alty for the first five years, and a 4.5% net smelter royaltythereafter. Production at the North Mara mine is subject toan NSR-type royalty of 3% on extraction of all minerals,and an additional 1.1% land tenement royalty for produc-tion out of the Gokona pit that is payable to the TanzanianRevenue Authority. Production at the Porgera mine is sub-ject to a 2% net smelter royalty payable to the NationalGovernment Department of Mining, which then distributesit to the Enga Provincial government, the Porgera DistrictAuthority, and local landowners. Production in Queenslandand Western Australia is subject to a royalty ranging from2.5% to 2.7% of gold revenues.
Royalty expense is recorded at the time of sale of goldproduction, measured using the applicable royalty percent-age for NSR royalties or estimates of NPI amounts.
7 � Other (Income) Expense
a) Other Operating ExpensesFor the years ended December 31 2006 2005 2004
Regional business unit costs1 $ 88 $ 36 $ 24Community development costs2 15 – –Environmental remediation costs 8 13 14World Gold Council fees 13 10 9
$ 124 $ 59 $ 47
1. Relates to costs incurred at regional business unit offices.2. In 2006, we paid amounts relating to new community programs in Peru
and Tanzania.

Notes to Consolidated Financial Statements � 93Barrick Financial Report 2006
Environmental Remediation CostsDuring the production phases of a mine, we incur andexpense the cost of various activities connected with envi-ronmental aspects of normal operations, including compli-ance with and monitoring of environmental regulations;disposal of hazardous waste produced from normal opera-tions; and operation of equipment designed to reduce oreliminate environmental effects. In limited circumstances,costs to acquire and install plant and equipment are capital-ized during the production phase of a mine if the costs areexpected to mitigate risk or prevent future environmentalcontamination from normal operations.
When a contingent loss arises from the improper useof an asset, a loss accrual is recorded if the loss is probableand reasonably estimable. Amounts recorded are measuredon an undiscounted basis, and adjusted as further informa-tion develops or if circumstances change. Recoveries ofenvironmental remediation costs from other parties arerecorded as assets when receipt is deemed probable.
b) Impairment of Long-lived AssetsFor the years ended December 31 2006 2005 2004
Eskay Creek1 $ – $ – $ 58Peruvian exploration properties2,3 17 – 67Other – – 14
$ 17 $ – $ 139
1. The asset group that comprises the Eskay Creek mine was tested for impair-ment effective December 31, 2004. The principal factors that caused us totest this asset group for impairment included: downward revisions to provenand probable reserves; the impact of the continued strengthening of the C$against the US$ and upward revisions to expected asset retirement costs inthe fourth quarter of 2004. An impairment charge of $58 million wasrecorded, which represents the amount by which the carrying amount of theasset group exceeds its estimated fair value. Fair value was estimated usingthe method described in note 14c.
2. In 2006, the carrying amount of Cuerpo Sur, an extension of Pierina, wastested for impairment on completion of the annual life of mine planningprocess. An impairment charge of $17 million was recorded to reduce thecarrying amount to the estimated fair value.
3. At the end of 2004, upon completion of the exploration program for theyear, we assessed the results and updated our future plans for various explo-ration properties in Peru that were originally acquired through the Arequipaacquisition in 1996. We concluded that the results and future potential didnot merit any further investment for these properties. The assets were testedfor impairment, and an impairment charge of $67 million was recorded thatreflects the amounts by which their carrying amounts exceed their estimatedfair values. The fair value of this group of assets was judged to be minimaldue to the unfavorable results of exploration work on the properties.
c) Other IncomeFor the years ended December 31 2006 2005 2004
Non-hedge derivative gains (note 19d) $ – $ 6 $ 5Gains on sale of assets1 9 5 36Gains on sale of investments (note 11) 6 17 6Gain on Kabanga transaction – 15 –Gain on vend-in to Highland
Gold (note 11) 51 – –Royalty income 10 6 2Sale of water rights 5 – –Other 8 – –
$ 89 $ 49 $ 49
1. In 2006, we sold certain properties in Canada and Chile. In 2005, we soldsome land positions in Australia. In 2004 we sold various mining properties,including the Holt-McDermott mine in Canada and certain land positionsaround our inactive mine sites in the United States.
Kabanga TransactionIn April 2005, we entered into a joint venture agreementwith Falconbridge Limited (“Falconbridge”) with respect to the Kabanga nickel deposit and related concession in Tanzania. In 2006, Xstrata Plc (“Xstrata”) acquiredFalconbridge. Xstrata is the operator of the joint ventureand the project is currently in the pre-feasibility study stage.Kabanga, which is one of the largest undeveloped nickelsulphide deposits in the world, is located in northwestTanzania. The property is approximately 385 kilometersfrom Bulyanhulu and approximately 200 kilometers west ofTulawaka and is accessible by a paved/gravel road. In 2006,ongoing diamond drilling, exploration and other projectdevelopment engineering activities being managed byXstrata have been performed as part of a work plan to pre-pare an updated resource model and scoping study. Xstratahas recently completed the $50 million work plan that was contemplated in the joint venture agreement. In 2007, Xstrata plans to prepare a pre-feasibility study. Inaccordance with the joint venture agreement, Xstrata has committed to spend an additional $95 million, which willbe used to fund the pre-feasibility study with funds remain-ing for other subsequent activities. After the $95 millionspent by Xstrata, funding will be shared equally by Barrick and Xstrata.

d) Other ExpenseFor the years ended December 31 2006 2005 2004
Changes in AROs at closed mines $ 53 $ 15 $ 22Accretion expense at closed
mines (note 20) 8 10 7Impairment charges on
investments (note 11) 6 16 5Legal costs for major litigation – 8 5Placer Dome integration costs 12 – –Corporate transaction costs 7 – –Currency translation (gains) losses (2) (3) 1Pension and other post-retirement
benefit expense (notes 26b and 26e)1 3 8 2Other items 9 2 5
$ 96 $ 56 $ 47
1. For the year ended December 31, 2006, $4 million of pension credit that relates to active employees at producing mines is included in cost ofsales (2005: $nil), and $2 million is included in corporate administration(2005: $nil).
8 � Income Tax Expense (Recovery)
For the years ended December 31 2006 2005 2004
CurrentCanada $ 13 $ (3) $ 19International 444 93 24
$ 457 $ 90 $ 43
DeferredCanada $ (117) $ (15) $ (26)International 80 22 7
$ (37) $ 7 $ (19)
Income tax expense before elements below1 $ 420 $ 97 $ 24
Outcome of tax uncertainties – – (141)Change in tax status in Australia (31) (5) (81)Tax rate changes 12 – –Release of beginning of year
valuation allowances (53) (32) (5)
Total expense (recovery) $ 348 $ 60 $(203)
1. All amounts are deferred tax items except for a $21 million portion of the$141 million recovery on resolution of the Peruvian tax assessment in 2004,which is a current tax item.
Outcome of Tax UncertaintiesPeruvian Tax AssessmentOn September 30, 2004, the Tax Court of Peru issued adecision in our favor in the matter of our appeal of a 2002income tax assessment of $32 million, excluding interestand penalties. The 2002 income tax assessment related to atax audit of our Pierina mine for the 1999 and 2000 fiscalyears. The assessment mainly related to the validity of arevaluation of the Pierina mining concession, which affectsits tax basis. Under the valuation proposed by the Peruviantax agency, SUNAT, the tax basis of the Pierina mining con-cession would have changed from what we previouslyassumed with a resulting increase in current and deferredincome taxes. The full life-of-mine effect on current anddeferred income tax liabilities totaling $141 million wasfully recorded at December 31, 2002, as well as other relatedcosts of about $21 million ($15 million post-tax).
In January 2005, we received confirmation in writingthat there would be no appeal of the September 30, 2004Tax Court of Peru decision. The confirmation concludedthe administrative and judicial appeals process with resolu-tion in Barrick’s favor. In 2004, we recorded a $141 millionreduction in current and deferred income tax liabilities anda $21 million reduction in other accrued costs in 2004,$15 million of which was classified in cost of sales and $6 million of which was classified in other (income)expense. Notwithstanding the favorable Tax Court decisionwe received in 2004 on the 1999 to 2000 revaluation matter,on audit, SUNAT has reassessed us on the same issue for2001 to 2003. We believe that the audit reassessment has nomerit, that we will prevail, and accordingly no provision hasbeen booked for this reassessment.
94 � Notes to Consolidated Financial Statements Barrick Financial Report 2006
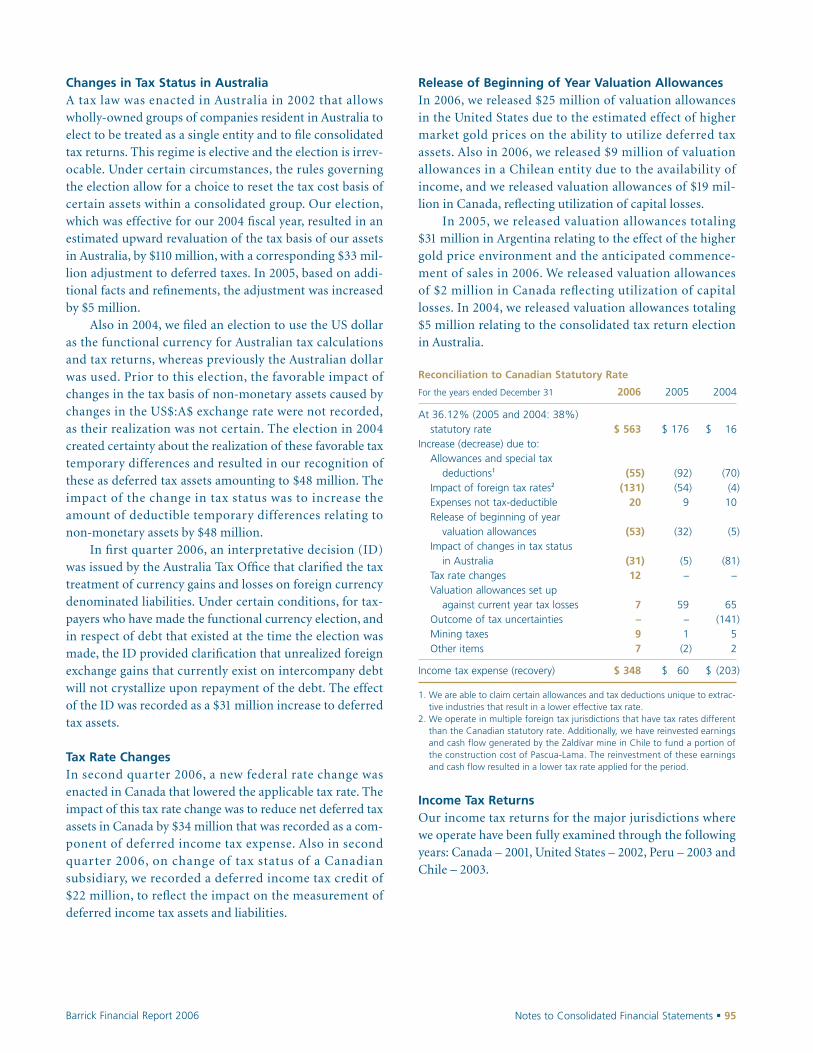
Notes to Consolidated Financial Statements � 95Barrick Financial Report 2006
Changes in Tax Status in AustraliaA tax law was enacted in Australia in 2002 that allowswholly-owned groups of companies resident in Australia toelect to be treated as a single entity and to file consolidatedtax returns. This regime is elective and the election is irrev-ocable. Under certain circumstances, the rules governingthe election allow for a choice to reset the tax cost basis ofcertain assets within a consolidated group. Our election,which was effective for our 2004 fiscal year, resulted in anestimated upward revaluation of the tax basis of our assetsin Australia, by $110 million, with a corresponding $33 mil-lion adjustment to deferred taxes. In 2005, based on addi-tional facts and refinements, the adjustment was increasedby $5 million.
Also in 2004, we filed an election to use the US dollaras the functional currency for Australian tax calculationsand tax returns, whereas previously the Australian dollarwas used. Prior to this election, the favorable impact ofchanges in the tax basis of non-monetary assets caused bychanges in the US$:A$ exchange rate were not recorded,as their realization was not certain. The election in 2004created certainty about the realization of these favorable taxtemporary differences and resulted in our recognition ofthese as deferred tax assets amounting to $48 million. Theimpact of the change in tax status was to increase theamount of deductible temporary differences relating tonon-monetary assets by $48 million.
In first quarter 2006, an interpretative decision (ID)was issued by the Australia Tax Office that clarified the taxtreatment of currency gains and losses on foreign currencydenominated liabilities. Under certain conditions, for tax-payers who have made the functional currency election, andin respect of debt that existed at the time the election wasmade, the ID provided clarification that unrealized foreignexchange gains that currently exist on intercompany debtwill not crystallize upon repayment of the debt. The effectof the ID was recorded as a $31 million increase to deferredtax assets.
Tax Rate ChangesIn second quarter 2006, a new federal rate change wasenacted in Canada that lowered the applicable tax rate. Theimpact of this tax rate change was to reduce net deferred taxassets in Canada by $34 million that was recorded as a com-ponent of deferred income tax expense. Also in secondquarter 2006, on change of tax status of a Canadian subsidiary, we recorded a deferred income tax credit of$22 million, to reflect the impact on the measurement ofdeferred income tax assets and liabilities.
Release of Beginning of Year Valuation AllowancesIn 2006, we released $25 million of valuation allowances in the United States due to the estimated effect of highermarket gold prices on the ability to utilize deferred taxassets. Also in 2006, we released $9 million of valuationallowances in a Chilean entity due to the availability ofincome, and we released valuation allowances of $19 mil-lion in Canada, reflecting utilization of capital losses.
In 2005, we released valuation allowances totaling $31 million in Argentina relating to the effect of the highergold price environment and the anticipated commence-ment of sales in 2006. We released valuation allowances of $2 million in Canada reflecting utilization of capitallosses. In 2004, we released valuation allowances totaling $5 million relating to the consolidated tax return electionin Australia.
Reconciliation to Canadian Statutory Rate
For the years ended December 31 2006 2005 2004
At 36.12% (2005 and 2004: 38%) statutory rate $ 563 $ 176 $ 16
Increase (decrease) due to:Allowances and special tax
deductions1 (55) (92) (70)Impact of foreign tax rates2 (131) (54) (4)Expenses not tax-deductible 20 9 10Release of beginning of year
valuation allowances (53) (32) (5)Impact of changes in tax status
in Australia (31) (5) (81)Tax rate changes 12 – –Valuation allowances set up
against current year tax losses 7 59 65Outcome of tax uncertainties – – (141)Mining taxes 9 1 5Other items 7 (2) 2
Income tax expense (recovery) $ 348 $ 60 $ (203)
1. We are able to claim certain allowances and tax deductions unique to extrac-tive industries that result in a lower effective tax rate.
2. We operate in multiple foreign tax jurisdictions that have tax rates differentthan the Canadian statutory rate. Additionally, we have reinvested earningsand cash flow generated by the Zaldívar mine in Chile to fund a portion ofthe construction cost of Pascua-Lama. The reinvestment of these earningsand cash flow resulted in a lower tax rate applied for the period.
Income Tax ReturnsOur income tax returns for the major jurisdictions wherewe operate have been fully examined through the followingyears: Canada – 2001, United States – 2002, Peru – 2003 andChile – 2003.

96 � Notes to Consolidated Financial Statements Barrick Financial Report 2006
9 � Earnings per share
For the years ended December 31 2006 2005 2004($ millions, except shares in millionsand per share amounts in dollars) Basic Diluted Basic Diluted Basic Diluted
Income from continuing operations $ 1,209 $ 1,209 $ 395 $ 395 $ 248 $ 248Plus: interest on convertible debentures – 4 – – – –
Income available to common shareholders and after assumed conversions 1,209 1,213 395 395 248 248
Income from discontinued operations 297 297 – – – –
Income before cumulative effect of changes in accounting principles 1,506 1,510 395 395 248 248
Cumulative effect of change in accounting principles – – 6 6 – –
Net income $ 1,506 $ 1,510 $ 401 $ 401 $ 248 $ 248
Weighted average shares outstanding 842 842 536 536 533 533Effect of dilutive securities
Stock options – 4 – 2 – 1Convertible debentures – 9 – – – –
842 855 536 538 533 534
Earnings per shareIncome from continuing operations $ 1.44 $ 1.42 $ 0.74 $ 0.73 $ 0.47 $ 0.46Income before cumulative effect of changes in accounting principles $ 1.79 $ 1.77 $ 0.74 $ 0.73 $ 0.47 $ 0.46Net income $ 1.79 $ 1.77 $ 0.75 $ 0.75 $ 0.47 $ 0.46
Accounting PolicyEarnings per share is computed by dividing net incomeavailable to common shareholders by the weighted averagenumber of common shares outstanding for the period.Diluted earnings per share reflects the potential dilutionthat could occur if additional common shares are assumedto be issued under securities that entitle their holders toobtain common shares in the future. For stock options, thenumber of additional shares for inclusion in diluted earn-ings per share calculations is determined using the treasurystock method. Under this method, stock options, whoseexercise price is less than the average market price of ourcommon shares, are assumed to be exercised and the
proceeds are used to repurchase common shares at theaverage market price for the period. The incremental num-ber of common shares issued under stock options andrepurchased from proceeds is included in the calculation of diluted earnings per share. For convertible debentures,the number of additional shares for inclusion in dilutedearnings per share calculations is determined using the ifconverted method. The incremental number of commonshares issued is included in the number of weighted aver-age shares outstanding and interest on the convertibledebentures is excluded from the calculation of income.

Notes to Consolidated Financial Statements � 97Barrick Financial Report 2006
10 � Operating Cash Flow – Other Items
a) Reconciliation of Net Income from Continuing Operations to Cash Flow from Operating Activities
For the years ended December 31 2006 2005 2004
Adjustments for non-cash income statement items:Currency translation (gains)
losses (note 7d) (2) (3) 1Accretion expense (note 20) 39 21 18Cumulative accounting
changes (note 2e) – (6) –Amortization of discount/premium
on debt securities (note 19b) (12) – –Amortization of debt issue
costs (note 19b) 12 2 3Stock option expense (note 25) 27 – –Non-hedge derivative copper options 14 – –Gains on sale of investments (note 7c) (6) (17) (6)Gain on Highland vend-in (note 7c) (51) – –Impairment charges on
investments (note 11) 4 16 5Gain on Kabanga transaction (note 7c) – (15) –Gain on sale of long-lived assets (note 7c) (9) (5) (36)Impairment of long-lived assets (note 7b) 17 – 139Revisions to AROs at closed
mines (note 7d) 53 15 22Losses on write-down of inventory 28 15 9Non-controlling interests (1) 1 (2)
Cash flow arising from changes in:Accounts receivable (78) 4 (2)Goods and services taxes recoverable (20) (16) (68)Inventories (193) (151) (51)Accounts payable 29 74 2Accrued interest (note 19b) 28 6 2Income taxes payable 161 24 –Derivative assets and liabilities 97 49 (12)Other assets and liabilities 17 (56) 43
Settlement of AROs (note 20) (32) (30) (33)
Other net operating activities $ 122 $ (72) $ 34
Operating cash flow includes payments for:Income taxes $ 280 $ 80 $ 45Pension plan contributions (note 26a) $ 36 $ 20 $ 19Interest (net of amounts capitalized) $ 211 $ 112 $ 57
b) Non-Cash Investing and Financing ActivitiesPlacer Dome AcquisitionWe purchased all of the common shares of Placer Dome in2006 for $10,054 million (see note 3a). In conjunction withthe acquisition, liabilities were assumed as follows:
Fair value of assets acquired1 $ 15,346Consideration paid 10,054
Liabilities assumed2 $ 4,830
1. Includes cash of $1,102 million.2. Includes debt obligations of $1,252 million (note 19b).
Vend-in of Assets to Highland Gold (“Highland”)In 2006 we exchanged various interests in mineral propertiesfor 34.3 million Highland shares with a value of $95 millionat the time of closing of the transaction (see note 11).
Sale of South DeepIn 2006 we sold the South Deep mine to Gold Fields Limited(“Gold Fields”) for $1,517 million. The proceeds included18.7 million Gold Fields common shares with a value of$308 million (see note 3b).
11 � Investments
Available-for-Sale Securities
At December 31 2006 2005
GainsFair (losses) Fair Gains in
value in OCI value OCI
Securities in an unrealized gain position
Benefit plans:1
Fixed-income securities $ 5 $ – $ 4 $ –Equity securities 16 2 17 1
Other investments:NovaGold 231 13 – –Gold Fields 314 6 – –Celtic 12 1 12 –Other equity securities 65 32 26 11
Restricted cash – – 3 –
643 54 62 12Securities in an unrealized
loss positionOther equity securities2 3 (1) – –
$ 646 $ 53 $ 62 $ 12
1. Under various benefit plans for certain former Homestake executives, a port-folio of marketable fixed-income and equity securities are held in a rabbi trustthat is used to fund obligations under the plans.
2. Other equity securities in a loss position consist of investments in various junior mining companies.

Purchases of Available-for-Sale Securities for Cash
For the years ended December 31 2006 2005 2004
NovaGold $ 218 $ – $ –Celtic – 30 –Other 27 1 7
$ 245 $ 31 $ 7
Accounting Policy for Available-for-Sale SecuritiesAvailable-for-sale securities are recorded at fair value withunrealized gains and losses recorded in other comprehen-sive income (“OCI”). Realized gains and losses are recordedin earnings when investments mature or on sale, calculatedusing the average cost of securities sold. If the fair value ofan investment declines below its carrying amount, weundertake an assessment of whether the impairment isother-than-temporary. We consider all relevant facts andcircumstances in this assessment, particularly: the length oftime and extent to which fair value has been less than thecarrying amount; the financial condition and near-termprospects of the investee, including any specific events thathave impacted its fair value; both positive and negative evi-dence that the carrying amount is recoverable within a rea-sonable period of time; and our ability and intent to holdthe investment for a reasonable period of time sufficient foran expected recovery of the fair value up to or beyond thecarrying amount. We record in earnings any unrealizeddeclines in fair value judged to be other than temporary.
NovaGold Resources Inc. (“NovaGold”)In fourth quarter 2006, we acquired a 14.8% interest inNovaGold for cash consideration of $218 million as part ofa tender offer.
Gold Fields Limited (“Gold Fields”)The investment in Gold Fields was acquired on December 1,2006 as partial consideration for the sale of our interest inSouth Deep (note 3b). At acquisition, we recorded a liquiditydiscount of $48 million to reflect a restriction on our abilityto trade the shares for a period of 120 days from closing. As ofDecember 31, 2006, the discount is approximately $39 mil-lion for the remaining 90 days of the restriction period.
Celtic Resources Holdings Inc. (“Celtic”)On January 5, 2005, we completed a subscription for3,688,191 units of Celtic for a price of $7.562 per unit for atotal cost of $30 million. Each unit consisted of one ordi-nary share of Celtic and one-half of one share purchasewarrant. On June 1, 2005, the number of warrants held
increased under the terms of the subscription agreement by922,048 warrants to 2,766,143 warrants. Each whole warrantentitles us to acquire one ordinary share of Celtic for $7.562,expiring on December 31, 2007. We allocated $25 million tothe ordinary shares and $5 million to the share purchasewarrants based on their relative fair values at acquisition. AtDecember 31, 2006, we held a 9% (2005: 9%) combineddirect and indirect interest in Celtic’s outstanding commonshares. The investment in common shares is classified as anavailable-for-sale security. We concluded that the share pur-chase warrants are derivative instruments as defined by FAS 133. The warrants, which are classified as non-hedgederivatives, are recorded at their estimated fair value in thebalance sheet with changes in fair value recorded in non-hedge derivative gains/losses. The fair value of the sharepurchase warrants was $0.5 million at December 31, 2006(2005: $0.5 million). At the time of the initial subscription,Celtic granted us the right to acquire 50% of any interest inany mineral property in Kazakhstan that Celtic acquires inthe future for a period of 12 months after any such acquisi-tion for an amount equal to 50% of the cost to Celtic of itsinterest in the mineral property. No such rights have beenexercised since the initial subscription.
Gains (Losses) on Investments Recorded in Earnings
For the years ended December 31 2006 2005 2004
Gains realized on sales $ 6 $ 17 $ 6Impairment charges (4) (16) (5)
$ 2 $ 1 $ 1
Cash proceeds from sales $ 46 $ 10 $ 9
In the second half of 2005, the fair value of our investmentin Celtic declined below cost and at the end of 2005 we con-cluded that the impairment was “other-than-temporary”and recorded a $12 million impairment charge.
Equity Method Investments
At December 31 2006 2005
Fair Carrying Fair Carryingvalue1 amount value1 amount
Highland $ 207 $ 199 $ 134 $ 131Diamondex 5 5 6 7Atacama2 n/a 123 – –
$ 327 $ 138
1. Based on the closing market stock price.2. As Atacama Copper Pty Limited is not a publicly traded company, there is no
readily determinable fair value.
98 � Notes to Consolidated Financial Statements Barrick Financial Report 2006

Notes to Consolidated Financial Statements � 99Barrick Financial Report 2006
Purchases of Equity Method Investment for Cash
For the years ended December 31 2006 2005 2004
Highland $ – $ 50 $ 40Diamondex 2 8 –Atacama 123 – –
$ 125 $ 58 $ 40
Accounting Policy for Equity Method InvestmentsUnder the equity method, we record our equity share of theincome or loss of equity investees each period. On acquisi-tion of an equity investment, the underlying identifiableassets and liabilities of an equity investee are recorded atfair value and the income or loss of equity investees is basedon these fair values. If the cost of any equity investmentexceeds the total amount of the fair value of identifiableassets and liabilities, any excess is accounted for in a man-ner similar to goodwill, with the exception that an annualgoodwill impairment test is not required. The carryingamount of each investment in an equity investee is evalu-ated for impairment using the same method as an available-for-sale security.
Highland Gold Mining Ltd. (“Highland”)Our 34% interest in Highland was acquired in four tranches:11.1 million common shares for cash of $46 million in 2003;9.3 million common shares for cash of $40 million in 2004;11 million common shares in 2005 for cash of $50 million;and 34.3 million shares as part of a vend-in transaction in 2006.
On November 17, 2006, we entered into an agreementwith Highland to transfer ownership of certain companiesholding Russian and Kyrgyz licenses in return for 34.3 mil-lion Highland common shares increasing our ownership ofHighland from 20% to 34%. In effect, we are contributingour 50% interest in the Taseevskoye deposit, as well as otherexploration properties in Russia and Central Asia, toHighland, thereby consolidating ownership of these prop-erties under one company. As part of the transaction, weseconded several of our employees to Highland, and willreceive two additional Board seats. Completion of the trans-action occurred on December 15, 2006. On closing, the fairvalue of Highland common shares exceeded the carryingamount of assets exchanged by $76 million. We recordedthis difference as a gain of $51 million in other income/expense to the extent of the ownership in Highland held byindependent third parties, and the balance of $25 million asa reduction in the carrying amount of our investment inHighland. The Fedorova PGM deposit was not included inthis transaction.
The difference between the cost of our investment inHighland and the underlying historic cost of net assets was$111 million at June 30, 2006. The difference between thecost of our investment and the underlying fair value ofassets and liabilities essentially represents an asset similarto goodwill.
On September 7, 2006 a fire occurred in the under-ground part of the Central Shaft at Highland’s Darasun mine(“Darasun”). Highland’s management is evaluating theamount of damage and the possibility of asset impairment,if any, at Darasun. Valuations and engineering studies are inprogress, but were not complete at the date of issuance ofthese financial statements. On finalization of these valuationsand studies, it is reasonably possible that an impairmentcharge may be recorded by Highland which would impactthe equity investment in our financial statements.
Diamondex Resources Limited (“Diamondex”)We completed a subscription for 11,111,111 units ofDiamondex for cash of $8 million in 2005. Each unit con-sists of one ordinary share of Diamondex and one sharepurchase warrant. We allocated the cost as follows: $7 mil-lion to the ordinary shares and $1 million to the share pur-chase warrants.
We completed a subscription for a further 3,358,300units of Diamondex for cash of $2 million in 2006. Eachunit consists of one ordinary share of Diamondex and one-half share purchase warrant. As of December 31, 2006, wehave 14,469,411 common shares and 12,790,261 share pur-chase warrants. We hold a 15% interest in the outstandingcommon shares of Diamondex (28% assuming exercise ofthe share purchase warrants). We record our equity share ofthe income or loss of Diamondex each period based on ourtotal 15% interest in outstanding common shares. AtDecember 31, 2006, we determined that our investment in Diamondex was “other than temporarily” impaired by $2 million, due to a sustained decline in fair value of thecommon shares relative to their carrying amount.
Atacama Copper Pty Limited (“Atacama”) In September 2006, in connection with the previouslyannounced agreement with Antofagasta plc (“Antofagasta”)to acquire 50% of Tethyan Copper Company’s (“Tethyan”)Reko Diq project and associated mineral interests, weacquired a 50% interest in Atacama Copper Pty Limited(“Atacama”), a company incorporated under the laws ofAustralia. We paid cash of $93 million for 50% of the issuedand outstanding share capital. The difference between the amount paid and underlying equity in net assets was $93 million. This difference represents the incremental fair

value of the Reko Diq project and is not being amortizedwhile the project is in the development stage. In November2006, we paid approximately $30 million for our 50% shareof the costs to terminate BHP Billiton’s interest in certainTethyan mineral interests. In return, we received additionalshares in proportion to our ownership interest, such that our50% interest in Atacama is retained.
We determined that Atacama is a variable interest entityand consequently we have used the principles of FIN 46R to determine how to account for our ownership interest.We concluded that neither ourselves nor Antofagasta are aprimary beneficiary and consequently we evaluated whethereither ourselves or Antofagasta have the right to controlAtacama under the joint venture agreement. We determinedthat we share joint control with Antofagasta, so becauseAtacama is a corporate joint venture we use the equitymethod of accounting for our investment in Atacama. Ourmaximum exposure to loss in this entity is limited to ourinvestment in Atacama, which totaled $123 million as ofDecember 31, 2006, and amounts we are committed to fundAtacama’s interim exploration program. The cost of ourinvestment in Atacama at acquisition approximated theunderlying fair value of tangible net assets.
12 � Inventories
Gold Copper
At December 31 2006 2005 2006 2005
Raw materialsOre in stockpiles $ 485 $ 360 $ 51 $ –Ore on leach pads 104 34 76 –
Mine operating supplies 284 133 16 –Work in process 89 47 25 –Finished products
Gold doré/bullion 98 32 – –Copper cathode – – 17 –Gold concentrate 54 47 – –
1,114 653 185 –Non-current ore in stockpiles1 (298) (251) (70) –
$ 816 $ 402 $ 115 $ –
1. Ore that we do not expect to process in the next 12 months.
Accounting Policy for InventoryMaterial extracted from our mines is classified as either oreor waste. Ore represents material that we expect can beprocessed into a saleable form, and sold at a profit. Ore isrecorded as an asset that is classified within inventory at thepoint it is extracted from the mine. Ore is accumulated instockpiles that are subsequently processed into gold/copperin a saleable form under a mine plan that takes into consid-eration optimal scheduling of production of our reserves,present plant capacity, and the market price of gold/copper.Gold/copper in process represents gold/copper in the pro-cessing circuit that has not completed the productionprocess, and is not yet in a saleable form.
Gold ore stockpiles are measured by estimating thenumber of tons added and removed from the stockpile, thenumber of contained ounces (based on assay data) and the estimated metallurgical recovery rates (based on theexpected processing method). Copper ore stockpiles aremeasured estimating the number of tons added andremoved from the stockpile. Stockpile ore tonnages areverified by periodic surveys. Costs are allocated to a stock-pile based on relative values of material stockpiled andprocessed using current mining costs incurred up to thepoint of stockpiling the ore, including applicable overhead,depreciation, depletion and amortization relating to min-ing operations, and removed at each stockpile’s average costper recoverable unit.
We record gold in process, gold doré and gold in con-centrate form at average cost, less provisions required toreduce inventory to market value. Average cost is calculatedbased on the cost of inventory at the beginning of a period,plus the cost of inventory produced in a period. Costs capi-talized to inventory include direct and indirect materialsand consumables; direct labor; repairs and maintenance;utilities; amortization of property, plant and equipment;waste stripping costs; and local mine administrativeexpenses. Costs are removed from inventory and recordedin cost of sales and amortization expense based on the aver-age cost per ounce of gold in inventory. Mine operating sup-plies are recorded at purchase cost.
We record provisions to reduce inventory to net realiz-able value, to reflect changes in economic factors that impactinventory value or to reflect present intentions for the use ofslow moving and obsolete supplies inventory.
For the years ended December 31 2006 2005 2004
Inventory impairment charges $ 28 $ 15 $ 9
100 � Notes to Consolidated Financial Statements Barrick Financial Report 2006

Notes to Consolidated Financial Statements � 101Barrick Financial Report 2006
Heap Leach InventoryThe recovery of gold and copper from certain oxide ores isachieved through the heap leaching process. Our Pierina,Lagunas Norte, Veladero, Cortez, Bald Mountain, RoundMountain and Marigold mines all use a heap leachingprocess for gold and our Zaldívar mine uses a heap leachingprocess for copper. Under this method, ore is placed on leachpads where it is treated with a chemical solution, which dis-solves the gold or copper contained in the ore. The resulting“pregnant” solution is further processed in a plant where thegold or copper is recovered. For accounting purposes, costsare added to ore on leach pads based on current mining andleaching costs, including applicable depreciation, depletionand amortization relating to mining operations. Costs areremoved from ore on leach pads as ounces or pounds arerecovered based on the average cost per recoverable ounce ofgold or pound of copper on the leach pad.
Estimates of recoverable gold or copper on the leachpads are calculated from the quantities of ore placed on theleach pads (measured tons added to the leach pads), thegrade of ore placed on the leach pads (based on assay data)and a recovery percentage (based on ore type). In general,leach pads recover between 35% and 95% of the ounces orpounds placed on the pads.
Although the quantities of recoverable gold or copperplaced on the leach pads are reconciled by comparing thegrades of ore placed on pads to the quantities of gold or cop-per actually recovered (metallurgical balancing), the natureof the leaching process inherently limits the ability to pre-cisely monitor inventory levels. As a result, the metallurgicalbalancing process is constantly monitored and estimates arerefined based on actual results over time. Historically, ouroperating results have not been materially impacted by vari-ations between the estimated and actual recoverable quanti-ties of gold or copper on our leach pads. At December 31,2006, the weighted average cost per recoverable ounce ofgold and recoverable pound of copper on leach pads was$180 per ounce and $0.45 per pound, respectively (2005:$134 per ounce of gold). Variations between actual and esti-mated quantities resulting from changes in assumptionsand estimates that do not result in write-downs to net real-izable value are accounted for on a prospective basis.
The ultimate recovery of gold or copper from a leachpad will not be known until the leaching process is con-cluded. Based on current mine plans, we expect to place thelast ton of ore on our current leach pads at dates for goldranging from 2009 to 2021 and for copper ranging from2022 to 2027. Including the estimated time required forresidual leaching, rinsing and reclamation activities, weexpect that our leaching operations will terminate within aperiod of up to six years following the date that the last tonof ore is placed on the leach pad.
The current portion of ore inventory on leach pads isdetermined based on estimates of the quantities of gold orcopper at each balance sheet date that we expect to recoverduring the next 12 months.
Ore in Stockpiles
At December 31 2006 2005
GoldGoldstrike
Ore that requires roasting $ 239 $ 182Ore that requires autoclaving 84 98
Kalgoorlie 58 53Turquoise Ridge 14 –Porgera 17 –Other 73 27
CopperZaldívar 51 –
$ 536 $ 360
At Goldstrike, we expect to fully process the autoclavestockpile by 2008 and the roaster stockpile by 2023. AtKalgoorlie, we expect to fully process the stockpile by 2017.At Zaldívar we expect to fully process the stockpile by 2027.
13 � Accounts Receivable, and Other Current Assets
At December 31 2006 2005
Accounts receivableAmounts due from concentrate sales $ 24 $ 18Amounts due from copper cathode sales 83 –Other receivables 127 36
$ 234 $ 54
Other current assetsDerivative assets (note 19c) $ 201 $ 128Goods and services taxes recoverable 137 101Restricted cash 150 –Prepaid expenses 32 23Other 68 3
$ 588 $ 255

14 � Property, Plant and Equipment
At December 31 2006 2005
Assets not subject to amortizationAcquired mineral properties and capitalized
mine development costs1 $ 1,621 $ 883Amortized assets
Capitalized mineral property acquisition and mine development costs 6,616 3,976
Buildings, plant and equipment2 7,017 4,057
15,254 8,916Accumulated amortization3 (6,919) (4,770)
$ 8,335 $ 4,146
1. Assets in the exploration or development stage that are not subject to amortization.
2. Includes $131 million (2005: $122 million) of assets under capital leases.3. Includes $41 million (2005: $18 million) of accumulated amortization for
assets under capital leases.
a) Unamortized Assets
Acquired Mineral Properties and Capitalized Mine Development Costs
Carrying amountat December 31, 2006
Exploration projects and other land positions $ 287Value beyond proven and probable
reserves at producing mines 401Development stage projects
Ruby Hill 49Pascua-Lama 459Cortez Hills 78Pueblo Viejo 173Donlin Creek 66Buzwagi 108
$ 1,621
AcquisitionsWe capitalize the cost of acquisition of land and mineralrights. On acquiring a mineral property, we estimate the fairvalue of proven and probable reserves as well as the valuebeyond proven and probable reserves and we record theseamounts as assets at the date of acquisition. At the timemineralized material is converted into proven and probablereserves, we classify the capitalized acquisition cost asso-ciated with those reserves as a component of acquired mineral properties, which are subject to amortization. Whenproduction begins, capitalized acquisition costs that are subject to amortization are amortized to operations usingthe units-of-production method.
Development Stage ProjectsWe capitalize development costs incurred at developmentprojects that meet the definition of an asset after mineral-ization is classified as proven and probable gold reserves (asdefined by United States reporting standards). Before clas-sifying mineralization as proven and probable reserves,development costs incurred at development projects areconsidered project development expenses that are expensedas incurred. Development costs include: drilling, engineer-ing studies, metallurgical test, permitting and sample min-ing. At new mines, the cost of start-up activities such asrecruiting and training is expensed as incurred.
Interest CostsInterest cost is considered an element of the historical costof an asset when a period of time is necessary to prepare itfor its intended use. We capitalize interest costs to assetsunder development or construction while activities are inprogress. We also capitalize interest costs on the valueassigned to projects acquired from third parties if activitiesthat are necessary to get the asset ready for its intended useare underway. This may be before the mineralization isclassified as proven and probable reserves (as defined byUnited States reporting standards).
In 2006, amortization of property plant and equipmentbegan at our Cowal mine after it moved from constructioninto the production phase. In 2005, amortization of prop-erty, plant and equipment at our Tulawaka, Lagunas Norte,and Veladero mines began after the mines moved from construction into the production phase. Amortization alsobegan in 2005 at the Western 102 power plant in Nevadathat was built to supply power for the Goldstrike mine as itmoved from construction into the production phase.
b) Amortized AssetsCapitalized Mineral Property Acquisition and MineDevelopment CostsWe start amortizing capitalized mineral property acquisi-tion and mine development costs when production begins.Amortization is calculated using the “units-of-production”method, where the numerator is the number of ounces pro-duced and the denominator is the estimated recoverableounces of gold contained in proven and probable reserves.
102 � Notes to Consolidated Financial Statements Barrick Financial Report 2006

Notes to Consolidated Financial Statements � 103Barrick Financial Report 2006
During production at underground mines, we incurdevelopment costs to build new shafts, drifts and rampsthat will enable us to physically access ore underground.The time over which we will continue to incur these costsdepends on the mine life, and in some cases could be up to25 years. These underground development costs are capi-talized as incurred. Costs incurred and capitalized to enableaccess to specific ore blocks or areas of the mine, and whichonly provide an economic benefit over the period of miningthat ore block or area, are attributed to earnings using theunits-of-production method where the denominator is esti-mated recoverable ounces of gold contained in proven andprobable reserves within that ore block or area. If capitalizedunderground development costs provide an economicbenefit over the entire mine life, the costs are attributed toearnings using the units-of-production method, where thedenominator is the estimated recoverable ounces of goldcontained in total accessible proven and probable reserves.
Buildings, Plant and EquipmentWe record buildings, plant and equipment at cost. We capi-talize costs that extend the productive capacity or usefuleconomic life of an asset. Costs incurred that do not extendthe productive capacity or useful economic life of an assetare considered repairs and maintenance and expensed asincurred. We amortize the capitalized cost of assets less anyestimated residual value, using the straight-line methodover the estimated useful economic life of the asset basedon their expected use in our business. The longest esti-mated useful economic life for buildings and equipment atore processing facilities is 25 years and for mining equip-ment is 15 years.
In the normal course of our business, we have enteredinto certain leasing arrangements whose conditions meetthe criteria for the leases to be classified as capital leases.For capital leases, we record an asset and an obligation at anamount equal to the present value at the beginning of thelease term of minimum lease payments over the lease term.In the case of our capital leasing arrangements, there istransfer of ownership of the leased assets to us at the end ofthe lease term and therefore we amortize these assets on abasis consistent with our other owned assets.
c) Impairment EvaluationsProducing Mines and Development ProjectsWe review and test the carrying amounts of assets whenevents or changes in circumstances suggest that the carry-ing amount may not be recoverable. We group assets at the lowest level for which identifiable cash flows are largelyindependent of the cash flows of other assets and liabilities.For operating mines and development projects, all assets are included in one group. If there are indications that animpairment may have occurred, we prepare estimates ofexpected future cash flows for each group of assets. Ex-pected future cash flows are based on a probability-weightedapproach applied to potential outcomes.
Estimates of expected future cash flow reflect:
� Estimated sales proceeds from the production and saleof recoverable ounces of gold/copper contained inproven and probable reserves;
� Expected future commodity prices and currency exchange rates (considering historical and currentprices, price trends and related factors);
� Expected future operating costs and capital expendituresto produce proven and probable gold/copper reservesbased on mine plans that assume current plant capacity,and exclude the impact of inflation;
� Expected cash flows associated with value beyondproven and probable reserves, which includes theexpected cash outflows required to develop and extractthe value beyond proven and probable reserves; and
� Environmental remediation costs excluded from themeasurement of asset retirement obligations.
We record a reduction of a group of assets to fair value as acharge to earnings if expected undiscounted future cashflows are less than the carrying amount. We estimate fairvalue by discounting the expected future cash flows using a discount factor that reflects the risk-free rate of interest fora term consistent with the period of expected cash flows.

Exploration ProjectsAfter acquisition, various factors can affect the recoverabil-ity of the capitalized cost of land and mineral rights, partic-ularly the results of exploration drilling. The length of timebetween the acquisition of land and mineral rights andwhen we undertake exploration work varies based on theprioritization of our exploration projects and the size of ourexploration budget. If we conclude that the carryingamount of land and mineral rights is impaired, we reducethis carrying amount to estimated fair value through animpairment charge.
d) Capital CommitmentsIn addition to entering into various operational commit-ments in the normal course of business, we had commit-ments of approximately $117 million at December 31, 2006for construction activities at our development projects.
e) InsuranceWe purchase insurance coverage for certain insurablelosses, subject to varying deductibles, at our mineral prop-erties including losses such as property damage and busi-ness interruption. We record losses relating to insurableevents as they occur. Proceeds receivable from insurancecoverage are recorded at such time as receipt is probableand the amount receivable is fixed or determinable.Proceeds from insurance claims totaled $12 million in 2006(2005: $nil, 2004: $nil).
104 � Notes to Consolidated Financial Statements Barrick Financial Report 2006
15 � Intangible Assets
For the years ended December 31 2006 2005
Gross carrying Accumulated Gross carrying Accumulatedamount amortization amount amortization
Water rights $ 28 $ – $ – $ –Technology3 17 – – –Supply contracts1 23 9 – –Royalties2 17 1 – –
$ 85 $ 10 $ – $ –
Aggregate amortization expense $ – $ 10 $ – $ –
For the years ended December 31 2007 2008 2009 2010 2011
Estimated aggregate amortization expense $ 7 $ 5 $ 3 $ 1 $ 1
1. Supply contracts are being amortized over the weighted average contract lives of 4–8 years, with no assumed residual value.2. Royalties are being amortized using the units of production method over the total ounces subject to royalty payments under the agreement.3. The acquired technology will be used at the Pueblo Viejo project, which has been estimated to start up at a date later than 2010. The amount will be amortized
using the units-of-production method over the estimated proven and probable reserves of the mine, with no assumed residual value.
16 � Goodwill
At January 1, 2006 $ –Additions 6,506Disposals 651
At December 31, 2006 $ 5,855
We allocate goodwill arising from business combinations to reporting units acquired by preparing estimates of thefair value of the entire reporting unit and comparing thisamount to the fair value of assets and liabilities (includingintangibles) in the reporting unit. The difference representsthe amount of goodwill allocated to each reporting unit.

Notes to Consolidated Financial Statements � 105Barrick Financial Report 2006
We test goodwill for impairment annually in the fourthquarter of our fiscal year. This impairment assessmentinvolves estimating the fair value of each reporting unit thatincludes goodwill. We compare this fair value to the totalcarrying amount of each reporting unit (including good-will). If the carrying amount exceeds this fair value, then weestimate the fair values of all identifiable assets and liabili-ties in the reporting unit, and compare this net fair value ofassets less liabilities to the estimated fair value of the entirereporting unit. The difference represents the fair value ofgoodwill, and if necessary, we reduce the carrying amountof goodwill to this fair value.
Circumstances that could trigger an impairment ofgoodwill include: a significant adverse change in the busi-ness climate or legal factors; an adverse action or assess-ment by a regulator; unanticipated competition; the loss ofkey personnel; change in reportable segments; the likeli-hood that a reporting unit or significant portion of areporting unit will be sold or otherwise disposed of; theresults of testing for recoverability of a significant assetgroup within a reporting unit; and the recognition of agoodwill impairment loss in the financial statements of asubsidiary that is a component of a reporting unit.Measurement of the fair value of a reporting unit is basedon one or more fair value measures including present valuetechniques of estimated future cash flows and estimatedamounts at which the unit as a whole could be bought orsold in a current transaction between willing parties. Wealso consider comparable market capitalization rates foreach reporting unit as of the date of the impairment test.
Goodwill arising on the acquisition of Placer Domewas $6,506 million. In 2006 we determined that goodwillshould be allocated to reporting units that would either represent individual mineral properties, or aggregations of mineral properties, limited to aggregation at a regionalbusiness unit level. Determination of appropriate reportingunits is ongoing and consequently the allocation of good-will to reporting units was not completed at December 31,2006. In fourth quarter 2006 we completed impairmenttests of goodwill assuming both no aggregation of mineralproperties into reporting units, and aggregation of mineralproperties up to the regional business unit level. On com-pletion of these impairment tests we concluded that noimpairment of goodwill had occurred by December 31,2006. On the disposal of the South Deep mine in December2006, we concluded that goodwill totaling $651 millionshould be attributed to the operation and reflected in thecalculation of the gain on sale.
17 � Other Assets
At December 31 2006 2005
Non-current ore in stockpiles $ 368 $ 251Derivative assets (note 19d) 209 177Goods and services taxes recoverable 48 46Deferred income tax assets (note 22) 528 141Debt issue costs 36 35Deferred share-based compensation (note 25b) 36 13Other 114 105
$ 1,339 $ 768
Debt Issue CostsAdditions to debt issue costs in 2006 of $11 million princi-pally relate to new debt financings put in place during theyear. Amortization of debt issue costs is calculated using theinterest method over the term of each debt obligation, andclassified as a component of interest cost (see note 19b).
18 � Other Current Liabilities
At December 31 2006 2005
Asset retirement obligations (note 20) $ 50 $ 37Derivative liabilities (note 19d) 82 42Post-retirement benefits (note 26) 11 6Deferred revenue – 8Income taxes payable 159 –Other 1 1
$ 303 $ 94
19 � Financial Instruments
Financial instruments include cash; evidence of ownershipin an entity; or a contract that imposes an obligation on oneparty and conveys a right to a second entity to deliver/receivecash or another financial instrument. Information on certaintypes of financial instruments is included elsewhere in thesefinancial statements as follows: accounts receivable – note 13;investments – note 11; restricted share units – note 25b.
a) Cash and EquivalentsCash and equivalents include cash, term deposits, commer-cial paper and treasury bills with original maturities of lessthan 90 days. Cash and equivalents include $605 millionheld in Argentinean and Chilean subsidiaries that havebeen designated for use in funding construction costs at ourPascua-Lama development project.

Series B Preferred SecuritiesOn December 18, 2006, we redeemed all of the outstanding8.5% Series B Preferred Securities due December 31, 2045for cash at a redemption price of $1,039.43 per $1,000 aggre-gate principal amount, for total cash of $80 million. Theredemption price was comprised of the outstanding princi-pal amount of $77 million plus accrued and unpaid inter-est to December 17, 2006 of $3 million.
Senior Convertible DebenturesThe convertible senior debentures (the “Securities”) maturein 2023 and had an aggregate principal amount of $230 mil-lion outstanding as at the end of 2006. Holders of theSecurities may, upon the occurrence of certain circum-stances and within specified time periods, convert theirSecurities into common shares of Barrick. These circum-stances are: if the closing price of our common sharesexceeds 120% of the conversion price for at least 20 tradingdays in the 30 consecutive trading days ending on the lasttrading day of the immediately preceding fiscal quarter;
106 � Notes to Consolidated Financial Statements Barrick Financial Report 2006
b) Long-Term Debt6
2006 2005 2004
Assumedon acqui-
At Repay- Amorti- sition of At Repay- Amorti- At Repay- Amorti-Dec. 31 Proceeds ments zation55 Placer Dome Dec. 31 Proceeds ments zation5 Dec. 31 Proceeds ments zation5
7.50% debentures1 $ 498 $ – $ – $ – $ – $ 490 $ – $ – $ – $ 495 $ – $ – $ –5.80%/4.875% notes 745 – – – – 745 – – – 745 745 – –Veladero financing 220 13 30 – – 237 39 – – 198 198 – –Bulyanhulu financing 85 – 34 – – 119 – 31 – 150 – 24 –Other debt2 1,024 50 – 6 867 113 50 – – 63 – 17 –Copper-linked notes 908 995 87 – – – – – – – – – –US dollar notes 87 87 – – – – – – – – – – –Senior convertible
debentures 296 – – 4 300 – – – – – – – –Capital leases 94 7 16 – 6 97 90 28 – 35 30 – –Series B Preferred
Securities – – 77 2 79 – – – – – – – –First credit facility3 – 1,000 1,000 – – – – – – – – – –
3,957 2,152 1,244 12 1,252 1,801 179 59 – 1,686 973 41 –Less: current portion (713) – – – – (80) – – – (31) – – –
$ 3,244 $ 2,152 $ 1,244 $ 12 $ 1,252 $ 1,721 $ 179 $ 59 $ – $ 1,655 $ 973 $ 41 $ –
Short-term debtDemand financing
facility 150 – – – 150 – – – – – – – –Second credit facility4 – 37 337 – 300 – – – – – – – –
$ 150 $ 37 $ 337 $ – $ 450 $ – $ – $ – $ – $ – $ – $ – $ –
1. The 71/2% debentures have a principal amount of $500 million and mature on May 1, 2007. The debentures have been designated in a fair value hedge relationshipand consequently the carrying amount represents the estimated fair value.
2. The debt has an aggregate principal amount of $1,024 million, of which $163 million is subject to floating interest rates and $861 million is subject to fixed interestrates ranging from 6.37% to 8.05%. The notes mature at various times between 2007 and 2035.
3. We have a credit and guarantee agreement with a group of banks (the “Lenders”), which requires the Lenders to make available to us a credit facility of up to $1.5 billion or the equivalent amount in Canadian currency. The credit facility, which is unsecured, has an interest rate of Libor plus 0.25% to 0.35% on drawn downamounts, and a commitment rate of 0.07% to 0.08% on undrawn amounts. We increased the limit of this facility from $1 billion in August 2006. The facility currentlymatures in 2011.
4. During third quarter 2006, we terminated a second credit facility which consisted of unused bank lines of credit of $850 million with an international consortium of banks.
5. Amortization of debt discount/premium.6. The agreements which govern our long-term debt each contain various provisions which are not summarized herein. In certain cases, these provisions allow Barrick
to, at its option, redeem indebtedness prior to maturity at specified prices and also may permit redemption of debt by Barrick upon the occurrence of certain speci-fied changes in tax legislation.

Notes to Consolidated Financial Statements � 107Barrick Financial Report 2006
if certain credit ratings assigned to the Securities fall belowspecified levels or if the Securities cease to be rated byspecified rating agencies or such ratings are suspended orwithdrawn; if for each of five consecutive trading days, thetrading price per $1,000 principal amount of the Securitieswas less than 98% of the product of the closing price of ourcommon shares and the then current conversion rate; ifthe Securities have been called for redemption providedthat only such Securities called for redemption may be con-verted and upon the occurrence of specified corporatetransactions. On December 31, 2006 the conversion rate per each $1,000 principal amount of Securities was 39.75common shares and the effective conversion price was$25.16 per common share. The conversion rate is subject toadjustment in certain circumstances. As such, the effectiveconversion price may also change.
No circumstance permitting conversion was in exis-tence on December 31, 2006. However, if such a circum-stance had existed and all the Securities were converted, andsettlement occurred on December 31, 2006, we would haveissued 9.14 million common shares with an aggregate fairvalue of $281 million based on our closing share price onDecember 31, 2006.
We may redeem the Securities at any time on or afterOctober 20, 2010 and prior to maturity, in whole or in part,at a prescribed redemption price that varies dependingupon the date of redemption from 100.825% to 100% of theprincipal amount, plus accrued and unpaid interest. Themaximum amount we could be required to pay to redeemthe securities is $232 million plus accrued interest. Holdersof the Securities can require the repurchase of the Securitiesfor 100% of their principal amount, plus accrued andunpaid interest, on October 15, 2013 and October 15, 2018.In addition, if specified designated events occur prior tomaturity of the Securities, we will be required to offer topurchase all outstanding Securities at a repurchase priceequal to 100% of the principal amount, plus accrued andunpaid interest. For accounting purposes the Securities are classified as a “conventional convertible debenture” and the conversion feature has not been bifurcated from thehost instrument.
Demand Financing FacilityWe have a demand financing facility that permits borrow-ings of up to $150 million. The terms of the facility requireus to maintain cash on deposit with the lender as a com-pensating balance equal to the amount outstanding underthe facility, which is restricted as to use. The net effectiveinterest rate is 0.4% per annum. At December 31, 2006,$150 million had been drawn on the facility and an equalamount had been placed on deposit that is included inrestricted cash (see note 13).
Copper-Linked Notes/US Dollar NotesIn October 2006, we issued $1,000 million of Copper-LinkedNotes. During the first three years, the full $1,000 millionobligation of these notes is to be repaid through the deliveryof (the US dollar equivalent of) 324 million pounds of cop-per. At December 31, 2006, 285 million pounds of copperremained (2007 – 129 million pounds, 2008 – 103 millionpounds, 2009 – 53 million pounds). Coincident with therepayment of (the US dollar equivalent of ) 324 millionpounds of copper, we will reborrow $1,000 million. Over thenext three years, the total amount outstanding under thesenotes will be $1,000 million, with a portion repayable in acopper-linked equivalent and a portion repayable in a fixedamount of US dollars at the maturity of the notes (2016 and2036). As the copper-linked equivalent is repaid, the fixedUS dollar obligation will increase. After 2009, only the fixedUS dollar obligation will remain. The accounting principlesapplicable to these Copper-Linked Notes require separateaccounting for the future delivery of copper (a fixed-priceforward sales contract that meets the definition of a deriva-tive that must be separately accounted for) and for theunderlying bond (see note 19d).
5.80%/4.875% NotesOn November 12, 2004, we issued $400 million of deben-tures at a $3 million discount that mature on November 15,2034 and $350 million of debentures at a $2 million dis-count that mature on November 15, 2014.
Veladero FinancingOne of our wholly owned subsidiaries, Minera ArgentinaGold S.A. in Argentina has a limited recourse amortizingloan facility for $250 million, the majority of which has avariable interest rate. We have guaranteed the loan untilcompletion occurs, after which it will become non-recourseto the parent company. As at December 31, 2006, comple-tion as defined in the loan agreement has not occurred. Theloan is insured for political risks by branches of theCanadian and German governments.

108 � Notes to Consolidated Financial Statements Barrick Financial Report 2006
Interest
For the years ended December 31
2006 2005 2004
Interest Effective Interest Effective Interest Effectivecost rate1 cost rate1 cost rate1
7.50% debentures $ 49 9.8% $ 41 8.2% $ 31 6.1%5.80%/4.875% notes 41 5.5% 42 5.6% 5 5.4%Veladero financing 25 10.2% 20 8.6% 4 7.5%Bulyanhulu financing 6 5.5% 10 7.5% 14 8.0%Other debt 53 5.4% 3 4.1% 1 1.2%Copper-linked notes/US dollar notes 13 5.8% – – – –Senior convertible debentures 6 2.0% – – – –Capital leases 6 6.7% 6 6.2% – –Series B Preferred Securities 3 4.4% – – – –Demand financing facility 12 8.8% – – – –First credit facility 29 7.4% – – – –Second credit facility 6 5.0% – – – –Other interest 2 3 5
251 125 60
Less: interest allocated to discontinued operations (23) – –Less: interest capitalized (102) (118) (41)
$ 126 $ 7 $ 19
Cash interest paid $ 211 $ 112 $ 57Amortization of debt issue costs 12 2 3Amortization of discount/premium (12) – –Losses (gains) on interest rate hedges 12 5 (2)Increase in interest accruals 28 6 2
Interest cost $ 251 $ 125 $ 60
1. The effective rate includes the stated interest rate under the debt agreement, amortization of debt issue costs and debt discount/premium and the impact of interestrate contracts designated in a hedging relationship with long-term debt.
Scheduled Debt Repayments 2011 and2007 2008 2009 2010 thereafter
7.50% debentures $ 500 $ – $ – $ – $ –5.80%/4.875% notes – – – – 750Veladero financing 58 48 53 30 32Bulyanhulu financing 34 34 17 – –Copper-linked notes/US dollar notes – – – – 1,000Other debt 100 – 16 7 836Senior convertible debentures – – – – 230Demand financing facility 45 15 15 15 60
$ 737 $ 97 $ 101 $ 52 $ 2,908
Minimum annual payments under capital leases $ 20 $ 16 $ 16 $ 16 $ 21

Notes to Consolidated Financial Statements � 109Barrick Financial Report 2006
c) Use of Derivative Instruments (“Derivatives”) in Risk Management
In the normal course of business, our assets, liabilities andforecasted transactions are impacted by various marketrisks including:
Under our risk management policy, we seek to mitigate theimpact of these market risks to provide certainty for a por-tion of our revenues and to control costs and enable us toplan our business with greater certainty. The timeframe andmanner in which we manage these risks varies for each itembased upon our assessment of the risk and available alterna-tives for mitigating risk. For these particular risks, we believethat derivatives are an effective means of managing risk.
The primary objective of the hedging elements of ourderivative positions is that changes in the values of hedgeditems are offset by changes in the values of derivatives. Mostof the derivatives we use meet the FAS 133 hedge effective-ness criteria and are designated in a hedge accounting rela-tionship. Some of the derivative positions are effective inachieving our risk management objectives but they do notmeet the strict FAS 133 hedge effectiveness criteria, andthey are classified as “non-hedge derivatives”.
Our use of derivatives is based on established practicesand parameters, which are subject to the oversight of theFinance Committee of the Board of Directors. A compli-ance function independent of the Corporate TreasuryGroup monitors derivative transactions and has responsi-bility for recording and accounting for derivatives.
Accounting Policy for DerivativesWe record derivatives on the balance sheet at fair valueexcept for gold and silver sales contracts , which areexcluded from the scope of FAS 133, because the obligationswill be met by physical delivery of our gold and silver pro-duction and they meet the other requirements set out inparagraph 10(b) of FAS 133. In addition, our past sales prac-tices, productive capacity and delivery intentions are con-sistent with the definition of a normal sales contract.Accordingly, we have elected to designate our gold and silver sales contracts as “normal sales contracts” with theresult that the principles of FAS 133 are not applied tothem. Instead we apply revenue recognition accountingprinciples as described in note 5.
On the date we enter into a derivative that is accountedfor under FAS 133, we designate it as either a hedginginstrument or a non-hedge derivative. A hedging instru-ment is designated in either:
� a fair value hedge relationship with a recognized asset or liability; or
� a cash flow hedge relationship with either a forecastedtransaction or the variable future cash flows arising from a recognized asset or liability.
At the inception of a hedge, we formally document all rela-tionships between hedging instruments and hedged items,including the related risk-management strategy. This docu-mentation includes linking all hedging instruments toeither: specific assets and liabilities, specific forecastedtransactions or variable future cash flows. It also includesthe method of assessing retrospective and prospectivehedge effectiveness. In cases where we use regression analy-sis to assess prospective effectiveness, we consider regres-s ion outputs for the coeffic ient of determination(R-squared), the slope coefficient and the t-statistic to assesswhether a hedge is expected to be highly effective. Each
Item Impacted by
■ Sales ■ Prices of gold and copper
■ Cost of sales
■ Consumption of diesel fuel and propane
■ Prices of diesel fuel, propaneand natural gas
■ Local currency denominatedexpenditures
■ Currency exchange rates – US dollar versus A$ and C$
■ Administration, exploration and business development costs in local currencies
■ Currency exchange rates – US dollar versus A$, C$, and ZAR
■ Capital expenditures in localcurrencies
■ Currency exchange rates – US dollar versus A$ and C$
■ Interest earned on cash ■ US dollar interest rates
■ Fair value of fixed-rate debt ■ US dollar interest rates

period, using a dollar offset approach, we retrospectivelyassess whether hedging instruments have been highly effec-tive in offsetting changes in the fair value of hedged itemsand we measure the amount of any hedge ineffectiveness.We also assess each period whether hedging instrumentsare expected to be highly effective in the future. If a hedg-ing instrument is not expected to be highly effective, westop hedge accounting prospectively. In this case accumu-lated gains or losses remain in OCI until the hedged itemaffects earnings. We also stop hedge accounting prospec-tively if:
� a derivative is settled;
� it is no longer highly probable that a forecasted transac-tion will occur; or
� we de-designate a hedging relationship.
If we conclude that it is probable that a forecasted transac-tion will not occur in the originally specified time frame, orwithin a further two-month period, gains and losses accu-mulated in OCI are immediately transferred to earnings. Inall situations when hedge accounting stops, a derivative isclassified as a non-hedge derivative prospectively. Cashflows from derivatives accounted for in designated hedgingrelationships are classified in the same category as the cashflows from the item being hedged. Cash flows resultingfrom derivatives not designated in hedging relationships arerecorded as operating cash flows. If a derivative has a nega-tive fair value at inception, the resulting cash flows arerecorded as financing activities.
Changes in the fair value of derivatives each period arerecorded as follows:
� Fair value hedges: recorded in earnings as well as changesin fair value of the hedged item.
� Cash flow hedges: recorded in OCI until earnings areaffected by the hedged item, except for any hedge ineffec-tiveness which is recorded in earnings immediately.
� Non-hedge derivatives: recorded in earnings.
d) Derivative Instruments (“Derivatives”)Placer Dome AcquisitionThrough the acquisition of Placer Dome in first quarter2006 we assumed the following derivative positions:
Notional Fair value at amount January 20, 2006
Gold sold forward contracts(millions of ounces) 7.0 $ (1,544)
Gold bought forward contracts(millions of ounces) 0.3 14
Gold options (millions of ounces) 1.0 (188)Silver contracts (millions of ounces) 6.5 (11)A$ currency contracts (A$ millions) 133 22
$ (1,707)
Gold sold forward contracts were designated as cash flowhedges at the date of acquisition. The acquired Placer goldcash flow hedge position was eliminated in 2006. Approx-imately 6.2 million ounces of the acquired Placer Domepositions received hedge accounting treatment for theperiod from the date of acquisition to the date they wereeliminated, and under which they had a designated dateand price against specific future gold sales.
Gold sold forward contracts acquired through thePlacer Dome acquisition were designated in first quarter2006 against forecasted gold sales as a hedge of the variabil-ity in market prices on future sales. Hedged items areidentified as the first stated quantity of ounces of forecastedsales in a future month. Prospective and retrospective hedgeeffectiveness is assessed with a dollar offset method usingintrinsic values. The effective portion of changes in fairvalue of the gold contracts is recorded in OCI until the fore-casted gold sale impacts earnings. Upon settlement of thecontracts during 2006, hedge accounting was terminatedand the accumulated gain/loss will remain in OCI until the forecasted transactions to which these contracts weredesignated occurs and impacts earnings.
110 � Notes to Consolidated Financial Statements Barrick Financial Report 2006

Notes to Consolidated Financial Statements � 111Barrick Financial Report 2006
US Dollar Interest Rate ContractsFair Value HedgesReceive-fixed swaps totaling $500 million have been desig-nated against the 71/2% debentures as a hedge of the vari-ability in the fair value of the debentures caused by changesin Libor. We have concluded that the hedges are 100% effec-tive under FAS 133, because the critical terms (including:notional amount, maturity date, interest payment andunderlying interest rate – i.e. Libor) of the swaps and thedebentures are the same. Changes in fair value of the swaps,together with an equal corresponding change in fair valueof the debentures, caused by changes in Libor, are recordedin earnings each period. Also, as interest payments on thedebentures are recorded in earnings, an amount equal tothe difference between the fixed-rate interest received underthe swap less the variable-rate interest paid under the swapis recorded in earnings as a component of interest costs.
Non-hedge ContractsWe use gold lease rate swaps as described in note 5. The val-uation of gold lease rate swaps is impacted by market USdollar interest rates. Our non-hedge pay-fixed swap posi-tion mitigates the impact of changes in US dollar interestrates on the valuation of gold lease rate swaps.
Currency ContractsCash Flow HedgesCurrency contracts totaling C$586 million, A$2,863 million,and ZAR46 million have been designated against forecastedlocal currency denominated expenditures as a hedge of thevariability of the US dollar amount of those expenditurescaused by changes in currency exchange rates over the nextfour years. Hedged items are identified as the first statedquantity of dollars of forecasted expenditures in a futuremonth. For a C$533 million and A$2,776 and ZAR46 millionportion of the contracts, we have concluded that the hedgesare 100% effective under FAS 133 because the critical terms(including notional amount and maturity date) of thehedged items and currency contracts are the same. For theremaining C$53 million and A$87 million portions, prospec-tive and retrospective hedge effectiveness is assessed usingthe hypothetical derivative method under FAS 133. Theprospective test involves comparing the effect of a theoreti-cal shift in forward exchange rates on the fair value of boththe actual and hypothetical derivative. The retrospective testinvolves comparing the effect of historic changes in exchangerates each period on the fair value of both the actual andhypothetical derivative using a dollar offset approach.The effective portion of changes in fair value of the currency
Summary of Derivatives at December 31, 20061 Accountingclassification by
Notional amount by term to maturity notional amount Fair value
Within 2 to 5 Over 5 Cash flow Fair value Non-1 year years years Total hedge hedge hedge
US dollar interest rate contractsReceive-fixed swaps (millions) $ 500 $ 50 $ – $ 550 $ – $ 500 $ 50 $ (5)Pay-fixed swaps (millions) – 125 – 125 – – 125 (10)
Net notional position $ 500 $ (75) $ – $ 425 $ – $ 500 $ (75) $ (15)
Currency contractsC$:US$ contracts (C$ millions) C$ 310 C$ 276 C$ – C$ 586 C$ 586 C$ – C$ –2 $ 34A$:US$ contracts (A$ millions) A$1,100 A$1,767 A$ – A$2,867 A$2,863 A$ – A$ 4 142ZAR:US$ contracts (ZAR millions) ZAR 46 ZAR – ZAR – ZAR 46 ZAR 46 ZAR – ZAR – –
Commodity contractsGold sold forward contracts (thousands of ounces) 178 364 – 542 – – 542 $ (184)Gold bought forward contracts
(thousands of ounces) 542 – – 542 – – 542 23Copper purchased put option contracts
(millions of pounds) 32 – – 32 15 – 17 –Copper sold forward contracts (millions of pounds) 129 156 – 285 285 – – 81WTI forward and option contracts
(thousands of barrels) 991 2,281 920 4,192 3,754 – 438 30Propane bought forward contracts
(millions of gallons) 18 – – 18 18 – – (1)Natural gas bought forward contracts
(millions of Btu) 1 – – 1 – – 1 –
1. Excludes gold sales contracts (see note 5), gold lease rate swaps (see note 5), Celtic Resources & Midway Gold share purchase warrants (see note 11).2. C$23 million of non-hedge currency contracts were economically closed out by entering into offsetting positions, albeit with differing counterparties.

contracts is recorded in OCI until the forecasted expenditureimpacts earnings. For expenditures capitalized to the cost ofinventory, this is upon sale of inventory, and for capitalexpenditures, this is when amortization of the capital assetsis recorded in earnings.
If it is probable that a hedged item will no longer occurin the originally specified time frame or within a further two-month period, the accumulated gains or losses in OCI for theassociated currency contract are reclassified to earningsimmediately. The identification of which currency contractsare associated with these hedged items uses a last-in, first-out(“LIFO”) approach, based on the order in which currencycontracts were originally designated in a hedging relationship.
Commodity ContractsCash Flow HedgesCommodity contracts totaling 3,754 thousand barrels ofdiesel fuel and 18 million gallons of propane have been des-ignated against forecasted purchases of the commodities forexpected consumption at our mining operations. The con-tracts act as a hedge of the impact of variability in marketprices on the cost of future commodity purchases over thenext seven years. Hedged items are identified as the firststated quantity in millions of barrels/gallons of forecastedpurchases in a future month. Prospective and retrospectivehedge effectiveness is assessed using the hypothetical deriva-tive method under FAS 133. The prospective test is based onregression analysis of the month-on-month change in fairvalue of both the actual derivative and a hypothetical deriva-tive caused by actual historic changes in commodity pricesover the last three years. The retrospective test involves com-paring the effect of historic changes in commodity priceseach period on the fair value of both the actual and hypo-thetical derivative using a dollar offset approach. The effec-tive portion of changes in fair value of the commoditycontracts is recorded in OCI until the forecasted transactionimpacts earnings. The cost of commodity consumption iscapitalized to the cost of inventory, and therefore this is uponthe sale of inventory.
The terms of a series of copper-linked notes result in anembedded fixed-price forward copper sales contract thatmeets the definition of a derivative and must be separatelyaccounted for. The resulting copper derivative has been des-ignated against future copper sales as a cash flow hedge ofthe variability in market prices on those future sales.Hedged items are identified as the first stated quantity ofpounds of forecasted sales in a future month. Prospectivehedge effectiveness is assessed using a dollar offset method.The prospective assessment involves comparing the effect oftheoretical shifts in forward copper prices on the fair valueof both the actual hedging derivative and a hypotheticalderivative. The retrospective assessment involves comparing
the effect of historic changes in copper prices each periodon the fair value of both the actual and hypothetical deriva-tive. The effective portion of changes in fair value of the cop-per contracts is recorded in OCI until the forecasted coppersale impacts earnings.
If it is probable that a hedged item will no longer occurin the originally specified time frame, or within a further two-month period, the accumulated gains or losses in OCI for theassociated contract are reclassified to earnings immediately.The identification of which commodity contracts are asso-ciated with these hedged items uses a LIFO approach, basedon the order in which commodity contracts were originallydesignated in a hedging relationship.
Non-hedge ContractsNon-hedge fuel contracts are used to mitigate the risk of oilprice changes on consumption at the Pierina, Eskay Creekand Lagunas Norte mines. On completion of regressionanalysis, we concluded that the contracts do not meet the“highly effective” criterion in FAS 133 due to currency andbasis differences between contract prices and the pricescharged to the mines by oil suppliers. Despite not qualifyingas an accounting hedge, the contracts protect the Companyto a significant extent from the effects of oil price changes.
Derivative Assets and Liabilities
2006 2005
At January 1 $ 204 $ 359Acquired with Placer Dome (1,707) –Derivatives settled (inflow) outflow –
Operating activities (184) (183)Financing activities 1,840 –
Change in fair value of:Non-hedge derivatives (3) 4Cash flow hedges
Effective portion 17 23Ineffective portion 3 1
Share purchase warrants – 5Fair value hedges 8 (5)
At December 31 $ 178 $ 2041
Classification:Other current assets $ 201 $ 128Other assets 209 177Other current liabilities (82) (42)Other long-term obligations (150) (59)
$ 178 $ 204
Derivative liabilities assumed in Placer acquisition (160) –Other derivative assets and liabilities 338 204
$ 178 $ 204
1. Derivative assets and liabilities are presented net by offsetting related amountsdue to/from counterparties if the conditions of FIN No. 39, Offsetting ofAmounts Related to Certain Contracts, are met. Amounts receivable fromcounterparties netted against derivative liabilities totaled $5 million atDecember 31, 2006.
112 � Notes to Consolidated Financial Statements Barrick Financial Report 2006
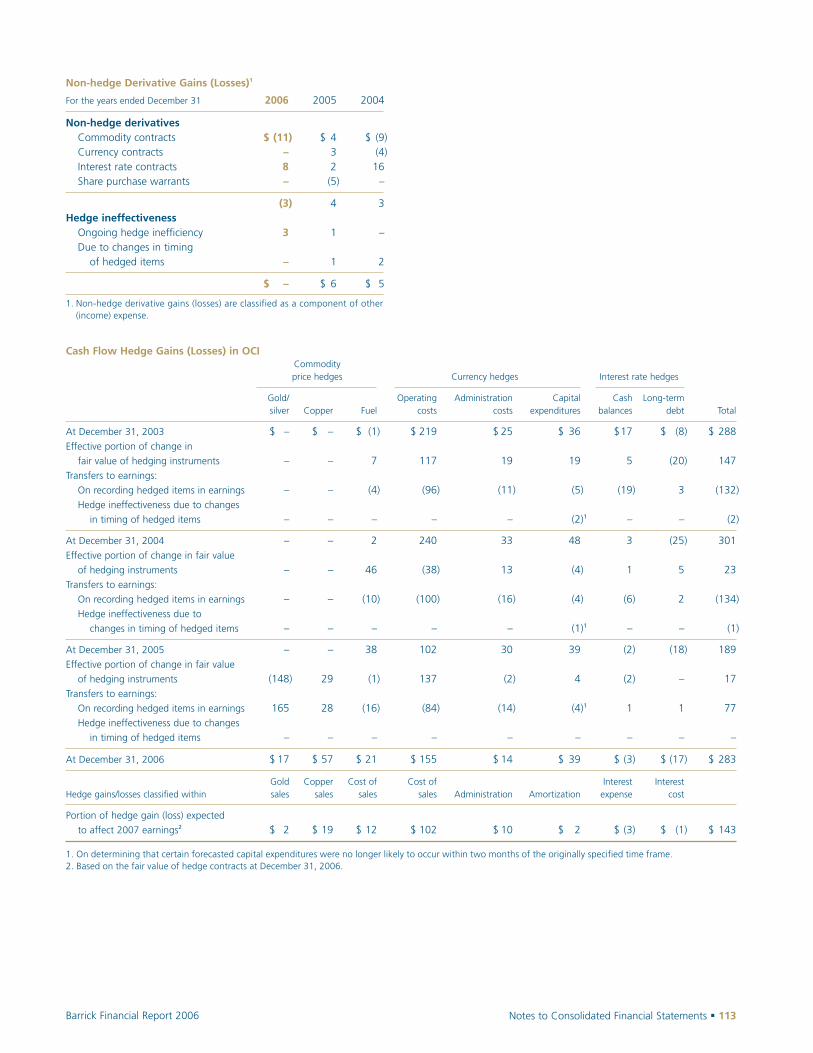
Notes to Consolidated Financial Statements � 113Barrick Financial Report 2006
Cash Flow Hedge Gains (Losses) in OCICommodity price hedges Currency hedges Interest rate hedges
Gold/ Operating Administration Capital Cash Long-termsilver Copper Fuel costs costs expenditures balances debt Total
At December 31, 2003 $ – $ – $ (1) $ 219 $ 25 $ 36 $17 $ (8) $ 288Effective portion of change in
fair value of hedging instruments – – 7 117 19 19 5 (20) 147Transfers to earnings:
On recording hedged items in earnings – – (4) (96) (11) (5) (19) 3 (132)Hedge ineffectiveness due to changes
in timing of hedged items – – – – – (2)1 – – (2)
At December 31, 2004 – – 2 240 33 48 3 (25) 301Effective portion of change in fair value
of hedging instruments – – 46 (38) 13 (4) 1 5 23Transfers to earnings:
On recording hedged items in earnings – – (10) (100) (16) (4) (6) 2 (134)Hedge ineffectiveness due to
changes in timing of hedged items – – – – – (1)1 – – (1)
At December 31, 2005 – – 38 102 30 39 (2) (18) 189Effective portion of change in fair value
of hedging instruments (148) 29 (1) 137 (2) 4 (2) – 17Transfers to earnings:
On recording hedged items in earnings 165 28 (16) (84) (14) (4)1 1 1 77Hedge ineffectiveness due to changes
in timing of hedged items – – – – – – – – –
At December 31, 2006 $ 17 $ 57 $ 21 $ 155 $ 14 $ 39 $ (3) $ (17) $ 283
Gold Copper Cost of Cost of Interest InterestHedge gains/losses classified within sales sales sales sales Administration Amortization expense cost
Portion of hedge gain (loss) expected
to affect 2007 earnings2 $ 2 $ 19 $ 12 $ 102 $ 10 $ 2 $ (3) $ (1) $ 143
1. On determining that certain forecasted capital expenditures were no longer likely to occur within two months of the originally specified time frame.2. Based on the fair value of hedge contracts at December 31, 2006.
Non-hedge Derivative Gains (Losses)1
For the years ended December 31 2006 2005 2004
Non-hedge derivativesCommodity contracts $ (11) $ 4 $ (9)Currency contracts – 3 (4)Interest rate contracts 8 2 16Share purchase warrants – (5) –
(3) 4 3Hedge ineffectiveness
Ongoing hedge inefficiency 3 1 –Due to changes in timing
of hedged items – 1 2
$ – $ 6 $ 5
1. Non-hedge derivative gains (losses) are classified as a component of other(income) expense.

e) Fair Value of Financial InstrumentsFair value is the value at which a financial instrument couldbe closed out or sold in a transaction with a willing andknowledgeable counterparty over a period of time consis-tent with our risk management or investment strategy. Fairvalue is based on quoted market prices, where available. Ifmarket quotes are not available, fair value is based on inter-nally developed models that use market-based or independ-ent information as inputs. These models could produce a fair value that may not be reflective of future fair value.
Fair Value Information
At December 31 2006 2005
Estimated EstimatedCarrying fair Carrying fairamount value amount value
Financial assetsCash and equivalents1 $ 3,043 $ 3,043 $ 1,037 $ 1,037Accounts receivable1 234 234 54 54Available-for-sale securities2 646 646 62 62Equity-method investments3 204 212 138 140Derivative assets4 410 410 305 305
$ 4,537 $ 4,545 $ 1,596 $ 1,598
Financial liabilitiesAccounts payable1 $ 686 $ 686 $ 386 $ 386Long-term debt5 3,957 3,897 1,801 1,827Derivative liabilities4 232 232 101 101Restricted share units6 42 42 17 17Deferred share units6 2 2 1 1
$ 4,919 $ 4,859 $ 2,306 $ 2,332
1. Recorded at cost. Fair value approximates the carrying amounts due to theshort-term nature and generally negligible credit losses.
2. Recorded at fair value. Quoted market prices are used to determine fair value.3. Recorded at cost, adjusted for our share of income/loss and dividends of
equity investees. Excludes the investment in Atacama Pty for which there isno readily determinable fair value.
4. Recorded at fair value based on internal valuation models that reflect forwardmarket commodity prices, currency exchange rates and interest rates, and adiscount factor that is based on market US dollar interest rates. If a forwardmarket does not exist, we obtain broker-dealer quotations. Valuationsassume all counterparties have an AA credit rating.
5. Long-term debt is generally recorded at cost except for obligations that aredesignated in a fair-value hedge relationship, which are recorded at fair valuein periods where a hedge relationship exists. The fair value of long-term debtis calculated by discounting the future cash flows under a debt obligation bya discount factor that is based on US dollar market interest rates adjusted forour credit quality.
6. Recorded at fair value based on our period end closing market share price.
f) Credit RiskCredit risk is the risk that a third party might fail to fulfillits performance obligations under the terms of a financialinstrument. For cash and equivalents and accounts receiv-able, credit risk represents the carrying amount on the bal-ance sheet, net of any overdraft positions.
For derivatives, when the fair value is positive, this creates credit risk. When the fair value of a derivative is negative, we assume no credit risk. In cases where we havea legally enforceable master netting agreement with a coun-terparty, credit risk exposure represents the net amount ofthe positive and negative fair values for similar types ofderivatives. For a net negative amount, we regard credit riskas being zero. A net positive amount for a counterparty is areasonable measure of credit risk when there is a legallyenforceable master netting agreement. We mitigate creditrisk by:
� entering into derivatives with high credit-quality counterparties;
� limiting the amount of exposure to each counterparty;and
� monitoring the financial condition of counterparties.
Location of credit risk is determined by physical location ofthe bank branch, customer or counterparty.
Credit Quality of Financial Assets
At December 31, 2006 S&P Credit rating
AA– or A– or higher higher B to BBB Total
Cash and equivalents $ 3,069 $ 21 $ 4 $ 3,094Derivatives1 291 88 – 379Accounts receivable – – 234 234
$ 3,360 $109 $ 238 $ 3,707
Number of counterparties2 17 9 –
Largest counterparty (%) 34% 65% –
Concentrations of Credit Risk Other United Inter-
At December 31, 2006 States Canada national Total
Cash and equivalents $ 2,479 $ 513 $ 102 $ 3,094Derivatives1 159 136 84 379Accounts receivable 23 27 184 234
$ 2,661 $ 676 $ 370 $ 3,707
1. The amounts presented reflect the net credit exposure after considering theeffect of master netting agreements.
2. For cash and equivalents and derivatives combined.
114 � Notes to Consolidated Financial Statements Barrick Financial Report 2006

Notes to Consolidated Financial Statements � 115Barrick Financial Report 2006
g) Risks Relating to the Use of DerivativesBy using derivatives, in addition to credit risk, we areaffected by market risk and market liquidity risk. Marketrisk is the risk that the fair value of a derivative might beadversely affected by a change in commodity prices, interestrates, gold lease rates, or currency exchange rates, and thatthis in turn affects our financial condition. We managemarket risk by establishing and monitoring parameters thatlimit the types and degree of market risk that may beundertaken. We mitigate this risk by establishing tradingagreements with counterparties under which we are notrequired to post any collateral or make any margin calls onour derivatives. Our counterparties cannot require settle-ment solely because of an adverse change in the fair valueof a derivative.
Market liquidity risk is the risk that a derivative cannotbe eliminated quickly, by either liquidating it or by establishing an offsetting position. Under the terms of ourtrading agreements, counterparties cannot require us toimmediately settle outstanding derivatives, except upon theoccurrence of customary events of default such as covenantbreaches, including financial covenants, insolvency orbankruptcy. We generally mitigate market liquidity risk byspreading out the maturity of our derivatives over time.
20 � Asset Retirement Obligations
Asset Retirement Obligations (AROs)
2006 2005
At January 1 $ 446 $ 367AROs acquired with Placer Dome 387 –AROs arising in the period 27 47Impact of revisions to expected cash flows
Revisions to carrying amount of assets (7) 29Recorded in earnings1 53 15
SettlementsCash payments (32) (30)Settlement gains (4) (3)
AROs reclassified under “Liabilities ofdiscontinued operations” (16) –
Accretion 39 21
At December 31 893 446Current portion (50) (37)
$ 843 $ 409
1. In 2006, we recognized an increase of $37 million for a change in estimate ofthe ARO at the Nickel Plate property in British Columbia, Canada. The adjust-ment was made on receipt of an environmental study that indicated a require-ment to treat ground water for an extended period of time. The increase wasrecorded as a component of other expense (note 7d).
AROs arise from the acquisition, development, constructionand normal operation of mining property, plant and equip-ment, due to government controls and regulations that pro-tect the environment on the closure and reclamation ofmining properties. The major parts of the carrying amountof AROs relate to tailings and heap leach pad closure/reha-bilitation; demolition of buildings/mine facilities; ongoingwater treatment; and ongoing care and maintenance ofclosed mines. The fair values of AROs are measured by dis-counting the expected cash flows using a discount factor thatreflects the credit-adjusted risk-free rate of interest.We prepare estimates of the timing and amount of expectedcash flows when an ARO is incurred. We update expectedcash flows to reflect changes in facts and circumstances. Theprincipal factors that can cause expected cash flows tochange are: the construction of new processing facilities;changes in the quantities of material in reserves and a cor-responding change in the life of mine plan; changing orecharacteristics can impact required environmental protec-tion measures and related costs; changes in water qualitythat impact the extent of water treatment required; andchanges in laws and regulations governing the protection ofthe environment. When expected cash flows increase, therevised cash flows are discounted using a current discountfactor whereas when expected cash flows decrease the addi-tional cash flows are discounted using a historic discountfactor, and then in both cases any change in the fair value ofthe ARO is recorded. We record the fair value of an AROwhen it is incurred. At producing mines AROs incurred andchanges in the fair value of AROs are recorded as an adjust-ment to the corresponding asset carrying amounts. Atclosed mines, any adjustment to the fair value of an ARO ischarged directly to earnings. AROs are adjusted to reflect thepassage of time (accretion) calculated by applying the dis-count factor implicit in the initial fair-value measurement tothe beginning-of-period carrying amount of the AROs. Forproducing mines, accretion is recorded in the cost of goodssold each period. For development projects and closedmines, accretion is recorded as part of environmental reme-diation costs in other (income) expense. Upon settlement ofan ARO, we record a gain or loss if the actual cost differsfrom the carrying amount of the ARO. Settlement gains areclassified as environmental remediation costs in other(income) expense. Other environmental remediation coststhat are not AROs as defined by FAS 143 are expensed asincurred (see note 7).

21 � Other Non-current Liabilities
At December 31 2006 2005
Pension benefits (note 26) $ 85 $ 54Other post-retirement benefits (note 26) 33 28Derivative liabilities (note 19d) 150 59Restricted share units (note 25b) 42 16Other 126 51
$ 436 $ 208
22 � Deferred Income Taxes
Recognition and MeasurementWe record deferred income tax assets and liabilities wheretemporary differences exist between the carrying amounts ofassets and liabilities in our balance sheet and their tax bases.The measurement and recognition of deferred income taxassets and liabilities takes into account: enacted rates thatwill apply when temporary differences reverse; interpreta-tions of relevant tax legislation; tax planning strategies;estimates of the tax bases of assets and liabilities; and thedeductibility of expenditures for income tax purposes. Werecognize the effect of changes in our assessment of theseestimates and factors when they occur. Changes in deferredincome tax assets, liabilities and valuation allowances areallocated between net income and other comprehensiveincome based on the source of the change.
Deferred income taxes have not been provided on theundistributed earnings of foreign subsidiaries, which areconsidered to be reinvested indefinitely outside Canada.The determination of the unrecorded deferred income taxliability is not considered practicable.
Sources of Deferred Income Tax Assets and Liabilities
At December 31 2006 2005
Deferred tax assetsTax loss carry forwards $ 798 $ 252Capital tax loss carry forwards 30 42Alternative minimum tax (“AMT”) credits 198 135Asset retirement obligations 303 175Property, plant and equipment 333 297Inventory 95 57Post-retirement benefit obligations 40 5Other 3 11
1,800 974Valuation allowances (658) (656)
Net deferred tax assets 1,142 318Deferred tax liabilities
Property, plant and equipment (1,377) (230)Derivative instruments (9) (61)Other (26) –
$ (270) $ 27
Classification:Non-current assets (note 17) $ 528 $ 141Non-current liabilities (798) (114)
$ (270) $ 27
Expiry Dates of Tax Losses and AMT Credits Noexpiry
2007 2008 2009 2010 2011+ date Total
Tax losses1
Canada $ 5 $ 3 $ 5 $ 1 $1,490 $ – $1,504Australia – – – – – 241 241Barbados – – – – 619 – 619Chile – – – – – 706 706Tanzania – – – – – 98 98U.S. – – – – 162 – 162Other – – 5 6 24 17 52
$ 5 $ 3 $ 10 $ 7 $2,295 $1,062 $3,382
AMT credits2 – – – – – $ 198 $ 198
1. Represents the gross amount of tax loss carry forwards translated at closingexchange rates at December 31, 2006.
2. Represents the amounts deductible against future taxes payable in yearswhen taxes payable exceed “minimum tax” as defined by United States taxlegislation.
116 � Notes to Consolidated Financial Statements Barrick Financial Report 2006
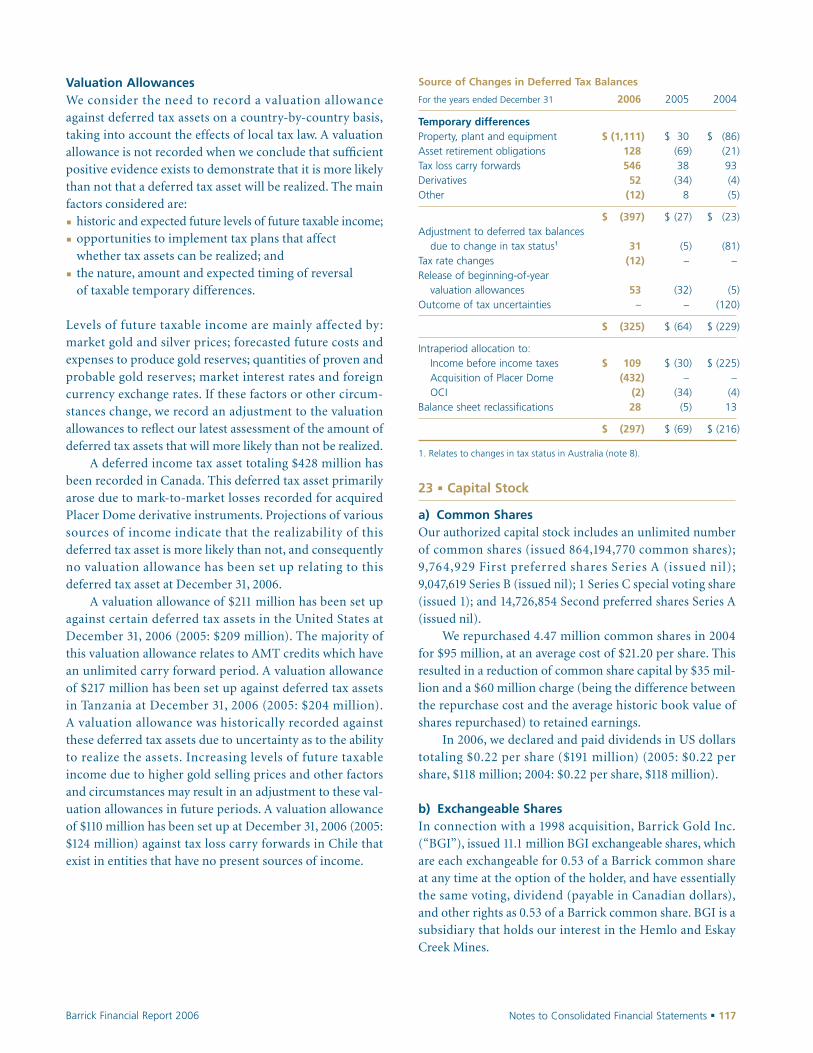
Notes to Consolidated Financial Statements � 117Barrick Financial Report 2006
Valuation AllowancesWe consider the need to record a valuation allowanceagainst deferred tax assets on a country-by-country basis,taking into account the effects of local tax law. A valuationallowance is not recorded when we conclude that sufficientpositive evidence exists to demonstrate that it is more likelythan not that a deferred tax asset will be realized. The mainfactors considered are:
� historic and expected future levels of future taxable income;
� opportunities to implement tax plans that affectwhether tax assets can be realized; and
� the nature, amount and expected timing of reversal of taxable temporary differences.
Levels of future taxable income are mainly affected by:market gold and silver prices; forecasted future costs andexpenses to produce gold reserves; quantities of proven andprobable gold reserves; market interest rates and foreigncurrency exchange rates. If these factors or other circum-stances change, we record an adjustment to the valuationallowances to reflect our latest assessment of the amount ofdeferred tax assets that will more likely than not be realized.
A deferred income tax asset totaling $428 million hasbeen recorded in Canada. This deferred tax asset primarilyarose due to mark-to-market losses recorded for acquiredPlacer Dome derivative instruments. Projections of varioussources of income indicate that the realizability of thisdeferred tax asset is more likely than not, and consequentlyno valuation allowance has been set up relating to thisdeferred tax asset at December 31, 2006.
A valuation allowance of $211 million has been set upagainst certain deferred tax assets in the United States atDecember 31, 2006 (2005: $209 million). The majority ofthis valuation allowance relates to AMT credits which havean unlimited carry forward period. A valuation allowanceof $217 million has been set up against deferred tax assetsin Tanzania at December 31, 2006 (2005: $204 million).A valuation allowance was historically recorded againstthese deferred tax assets due to uncertainty as to the abilityto realize the assets. Increasing levels of future taxableincome due to higher gold selling prices and other factorsand circumstances may result in an adjustment to these val-uation allowances in future periods. A valuation allowanceof $110 million has been set up at December 31, 2006 (2005:$124 million) against tax loss carry forwards in Chile thatexist in entities that have no present sources of income.
Source of Changes in Deferred Tax Balances
For the years ended December 31 2006 2005 2004
Temporary differencesProperty, plant and equipment $ (1,111) $ 30 $ (86)Asset retirement obligations 128 (69) (21)Tax loss carry forwards 546 38 93Derivatives 52 (34) (4)Other (12) 8 (5)
$ (397) $ (27) $ (23)Adjustment to deferred tax balances
due to change in tax status1 31 (5) (81)Tax rate changes (12) – –Release of beginning-of-year
valuation allowances 53 (32) (5)Outcome of tax uncertainties – – (120)
$ (325) $ (64) $ (229)
Intraperiod allocation to:Income before income taxes $ 109 $ (30) $ (225)Acquisition of Placer Dome (432) – –OCI (2) (34) (4)
Balance sheet reclassifications 28 (5) 13
$ (297) $ (69) $ (216)
1. Relates to changes in tax status in Australia (note 8).
23 � Capital Stock
a) Common SharesOur authorized capital stock includes an unlimited numberof common shares (issued 864,194,770 common shares);9,764,929 First preferred shares Series A (issued nil);9,047,619 Series B (issued nil); 1 Series C special voting share(issued 1); and 14,726,854 Second preferred shares Series A(issued nil).
We repurchased 4.47 million common shares in 2004for $95 million, at an average cost of $21.20 per share. Thisresulted in a reduction of common share capital by $35 mil-lion and a $60 million charge (being the difference betweenthe repurchase cost and the average historic book value ofshares repurchased) to retained earnings.
In 2006, we declared and paid dividends in US dollarstotaling $0.22 per share ($191 million) (2005: $0.22 pershare, $118 million; 2004: $0.22 per share, $118 million).
b) Exchangeable SharesIn connection with a 1998 acquisition, Barrick Gold Inc.(“BGI”), issued 11.1 million BGI exchangeable shares, whichare each exchangeable for 0.53 of a Barrick common shareat any time at the option of the holder, and have essentiallythe same voting, dividend (payable in Canadian dollars),and other rights as 0.53 of a Barrick common share. BGI is asubsidiary that holds our interest in the Hemlo and EskayCreek Mines.

At December 31, 2006, 1.4 million (2005 – 1.4 million)BGI exchangeable shares were outstanding, which are equiv-alent to 0.7 million Barrick common shares (2005 – 0.7 mil-lion common shares), and are reflected in the number ofcommon shares outstanding. We have the right to require theexchange of each outstanding BGI exchangeable share for0.53 of a Barrick common share. While there are exchange-able shares outstanding, we are required to present summaryconsolidated financial information relating to BGI.
Summarized Financial Information for BGI
For the years ended December 31 2006 2005 2004
Total revenues and other income $ 233 $ 181 $ 216Less: costs and expenses1 215 186 287
Income (loss) before taxes $ 18 $ (5) $ (71)
Net income (loss) $ 33 $ 21 $ (41)
At December 31 2006 2005
AssetsCurrent assets $ 112 $ 119Non-current assets 50 88
$ 162 $ 207
Liabilities and shareholders’ equityOther current liabilities 25 25Intercompany notes payable 387 390Other long-term liabilities 80 55Deferred income tax liabilities (15) –Deficit (315) (263)
$ 162 $ 207
1. 2006 includes a $37 million increase in the ARO at the Nickel Plate property(see note 20).
24 � Other Comprehensive Income (Loss) (“OCI”)
2006 2005 2004
Accumulated OCI at January 1Cash flow hedge gains, net of tax of $61, $95, $99 $ 128 $ 206 $ 189Investments, net of tax of $nil, $nil, $nil 12 21 25Currency translation adjustments, net of tax of $nil, $nil, $nil (143) (146) (147)Additional pension liability, net of tax of $nil, $nil, $nil (28) (12) (7)
$ (31) $ 69 $ 60
Other comprehensive income (loss) for the period:Changes in fair value of cash flow hedges 17 23 147Changes in fair value of investments 43 (8) (3)Currency translation adjustments – 3 1Pension plans and other post-retirement benefits:
Adjustments to minimum pension liability prior to adoption of FAS 158 15 (16) (5)FAS 158 adjustments (note 26):
Elimination of minimum pension liability 13 – –Net actuarial loss (9) – –Transition obligation (2) – –
Less: reclassification adjustments for gains/losses recorded in earnings:Transfers of cash flow hedge (gains) losses to earnings:
On recording hedged items in earnings 77 (134) (132)Hedge ineffectiveness due to changes in timing of hedged items – (1) (2)
Investments:Other than temporary impairment charges 4 16 5Gains realized on sale (6) (17) (6)
Other comprehensive income (loss), before tax 152 (134) 5Income tax recovery (expense) related to OCI (2) 34 4
Other comprehensive income (loss), net of tax $ 150 $(100) $ 9
Accumulated OCI at December 31Cash flow hedge gains, net of tax of $60, $61, $95 223 128 206Investments, net of tax of $7, $nil, $nil 46 12 21Currency translation adjustments, net of tax of $nil, $nil, $nil (143) (143) (146)Pension plans and other post-retirement benefits, net of tax of $4, $nil, $nil (7) (28) (12)
$ 119 $ (31) $ 69
118 � Notes to Consolidated Financial Statements Barrick Financial Report 2006

Notes to Consolidated Financial Statements � 119Barrick Financial Report 2006
a) Stock OptionsUnder Barrick’s stock option plan certain officers and keyemployees of the Corporation may purchase commonshares at an exercise price that is equal to the closing shareprice on the day before the grant of the option. Stockoptions vest evenly over four years, beginning in the yearafter granting. Options granted in July 2004 and prior areexercisable over 10 years, whereas options granted sinceDecember 2004 are exercisable over 7 years. At December 31
25 � Stock-based Compensation
2006, 13 million (2005: 12 million; 2004: 13 million) com-mon shares, in addition to those currently outstanding, wereavailable for granting options.
Total recorded compensation cost relating to stockoptions was $27 million in 2006. Total intrinsic value relat-ing to options exercised in 2006 was $27 million (2005:$22 million; 2004: $12 million).
Employee Stock Option Activity (Number of Shares in Millions)
2006 2005 2004
Average Average AverageShares price Shares price Shares price
C$ optionsAt January 1 14.7 $ 28 19.4 $ 28 21.5 $ 27
Granted – $ – – $ – 0.8 $ 28Issued on acquisition of Placer Dome 1.7 $ 34 – $ – – $ –Exercised (2.4) $ 26 (3.8) $ 25 (1.7) $ 25Forfeited (0.2) $ 27 (0.8) $ 27 (0.7) $ 26Cancelled/expired (1.9) $ 40 (0.1) $ 40 (0.5) $ 31
At December 31 11.9 $ 28 14.7 $ 28 19.4 $ 28
US$ optionsAt January 1 6.9 $ 24 5.9 $ 22 2.2 $ 19
Granted 1.1 $ 30 2.1 $ 25 4.9 $ 24Issued on acquisition of Placer Dome 1.0 $ 19 – $ – – $ –Exercised (0.9) $ 21 (0.3) $ 15 (1.0) $ 15Forfeited (0.4) $ 24 (0.4) $ 28 – –Cancelled/expired – $ 25 (0.4) $ 26 (0.2) $ 32
At December 31 7.7 $ 25 6.9 $ 24 5.9 $ 22
Stock Options Outstanding (Number of Shares in Millions)
Outstanding Exercisable
Intrinsic IntrinsicAverage Average value1 Average value1
Range of exercise prices Shares price life (years) ($ millions) Shares price ($ millions)
C$ options$ 22 – $ 27 4.9 $ 24 6 $ 57 4.8 24 $ 55$ 28 – $ 31 5.6 $ 29 6 37 4.5 29 30$ 32 – $ 43 1.4 $ 36 1 – 1.3 36 –
11.9 $ 28 5 $ 94 10.6 28 $ 85
US$ options$ 9 – $ 19 0.3 $ 12 6 $ 5 0.2 12 $ 5$ 20 – $ 27 6.2 $ 24 6 42 2.7 23 20$ 28 – $ 37 1.2 $ 30 10 1 0.1 28 –
7.7 $ 25 7 $ 48 3.0 23 $ 25
1. Based on the closing market share price on December 31, 2006 of C$35.85 and US$30.70.

120 � Notes to Consolidated Financial Statements Barrick Financial Report 2006
Option Information
For the years ended December 31(per share and per option amounts in dollars) 2006 2005 2004
Valuation assumptions Lattice1,2 Black-Scholes1 Lattice2 Black-ScholesExpected term (years) 4.5–5 5 5 5Expected volatility2 30%–38% 23%–30% 31%–38% 30%Weighted average expected volatility2 31.6% n/a 33.3% n/aExpected dividend yield 0.7%–0.9% 0.8%–1.0% 0.9% 1.0%Risk-free interest rate2 4.3%–5.1% 3.8%–4.0% 4.3%–4.5% 3.8%
Options granted (in millions)3 1.1 1.1 1.0 5.7Weighted average fair value per option $ 9.42 $ 7.30 $ 8.13 $ 6.87
1. Different assumptions were used for the multiple stock option grants during the year.2. Stock option grants issued after September 30, 2005 were valued using the Lattice valuation model. The volatility and risk-free interest rate assumption varied over the
expected term of these stock option grants.3. Excludes 2.7 million fully vested options issued on the acquisition of Placer Dome.
We changed the model used to value stock option grantsfrom the Black-Scholes model to the Lattice valuationmodel for stock options granted after September 30, 2005.We believe the Lattice valuation model provides a more rep-resentative fair value because it incorporates more attrib-utes of stock options such as employee turnover andvoluntary exercise patterns of option holders. For optionsgranted before September 30, 2005, fair value was deter-mined using the Black-Scholes method. The expectedvolatility assumptions have been developed taking into con-sideration both historical and implied volatility of our USdollar share price. The risk-free rate for periods within thecontractual life of the option is based on the US Treasuryyield curve in effect at the time of the grant.
We use the straight-line method for attributing stockoption expense over the vesting period. Stock option expenseincorporates an expected forfeiture rate. The expected forfei-ture rate is estimated based on historical forfeiture rates andexpectations of future forfeitures rates. We make adjustmentsif the actual forfeiture rate differs from the expected rate.
Under the Black-Scholes model the expected termassumption takes into consideration assumed rates ofemployee turnover and represents the estimated averagelength of time stock options remain outstanding beforethey are either exercised or forfeited. Under the Lattice val-uation model, the expected term assumption is derivedfrom the option valuation model and is in part based onhistorical data regarding the exercise behavior of optionholders based on multiple share-price paths. The Latticemodel also takes into consideration employee turnover andvoluntary exercise patterns of option holders.
As at December 31, 2006, there was $39 million (2005:$56 million; 2004: $69 million) of total unrecognized com-pensation cost relating to unvested stock options. We expectto recognize this cost over a weighted average period of2 years (2005: 2 years; 2004: 2 years).
For years prior to 2006, we utilized the intrinsic valuemethod of accounting for stock options, which resulted inno compensation expense. If compensation expense hadbeen determined in accordance with the fair value provisionsof SFAS No. 123 pro-forma net income and net income pershare would have been as follows:
Stock Option Expense
For the years ended December 31($ millions, except per share amounts in dollars) 2006 2005
Pro forma effectsNet income, as reported 401 248Stock option expense (26) (29)
Pro forma net income 375 219
Net income per share:As reported – basic $ 0.75 $ 0.47As reported – diluted $ 0.75 $ 0.46
Pro forma1 $ 0.70 $ 0.41
1. Basic and diluted.

Notes to Consolidated Financial Statements � 121Barrick Financial Report 2006
b) Restricted Share Units (RSUs) and Deferred Share Units (DSUs)
In 2005, following a review of various types of stock-basedcompensation arrangements, we introduced a new stock-based compensation plan for employees. Under the newplan, selected employees are granted restricted share units(RSUs). Each RSU has a value equal to one Barrick com-mon share. RSUs vest and will be settled in cash on thethird anniversary of the grant date. Additional RSUs arecredited to reflect dividends paid on Barrick commonshares. We expect that the volume of options granted eachyear will decline compared to historical volumes, with agreater number of RSUs issued instead.
RSUs are recorded at fair value on the grant date, with acorresponding amount recorded as deferred compensationthat is amortized on a straight-line basis over the vestingperiod. Changes in the fair value of the RSUs are recorded,with a corresponding adjustment to deferred compensa-tion. Compensation expense for 2006 was $6 million (2005:$2 million; 2004: $4 million). At December 31, 2006, theweighted average remaining contractual life of RSUs was 2.5 years.
Under our DSU plan, Directors must receive a speci-fied portion of their basic annual retainer in the form ofDSUs, with the option to elect to receive 100% of suchretainer in DSUs. Each DSU has the same value as oneBarrick common share. DSUs must be retained until theDirector leaves the Board, at which time the cash value ofthe DSUs will be paid out. Additional DSUs are credited to reflect dividends paid on Barrick common shares. DSUsare recorded at fair value on the grant date and are adjustedfor changes in fair value. The fair value of amounts grantedeach period together with changes in fair value are expensed.
DSU and RSU ActivityFair Fair
DSUs value RSUs value(thousands) (millions) (thousands) (millions)
At December 31, 2003 8 $ 0.2 452 $ 10.4Settled – – (293) (7.3)Granted 23 0.5 131 3.1Forfeited – – (58) (1.3)Credits for dividends – – 3 0.1Change in value – – – 0.6
At December 31, 2004 31 $ 0.7 235 $ 5.6Settled (3) (0.1) – –Forfeited – – (38) (0.9)Granted 19 0.5 415 11.1Converted to stock options – – (3) (0.1)Credits for dividends – – 2 0.1Change in value – 0.3 – 0.6
At December 31, 2005 47 $ 1.4 611 $ 16.4Settled – – (82) (2.5)Forfeited – – (58) (1.6)Granted1 22 0.7 893 27Converted to stock options – – (18) (0.5)Credits for dividends – – 8 0.2Change in value – – – 2.6
At December 31, 2006 69 $ 2.1 1,354 $ 41.6
1. In January 2006, under our RSU plan, 18,112 restricted share units were con-verted to 72,448 stock options, and 9,395 units were forfeited.
26 � Post-retirement Benefits
a) Defined Contribution Pension PlansCertain employees take part in defined contribution em-ployee benefit plans. We also have a retirement plan for cer-tain officers of the Company, under which we contribute15% of the officer’s annual salary and bonus. Our share of contributions to these plans, which is expensed in theyear it is earned by the employee, was $36 million in 2006,$20 million in 2005 and $19 million in 2004.
b) Defined Benefit Pension PlansWe have qualified defined benefit pension plans that covercertain of our United States, Canadian and Australianemployees and provide benefits based on employees’ yearsof service. Through the acquisition of Placer Dome, weacquired pension plans in the United States, Canada andAustralia. Our policy is to fund the amounts necessary on anactuarial basis to provide enough assets to meet the benefitspayable to plan members. Independent trustees administerassets of the plans, which are invested mainly in fixed-income and equity securities. On December 31, 2004, one ofour qualified defined benefit plans was amended to freezebenefit accruals for all employees, resulting in a curtailmentgain of $2 million. On January 31, 2006, actuarial assump-tions were amended for one of our qualified defined benefit

plans in Canada; no curtailment gain or loss resulted. OnJune 30, 2006, one of our plans in Canada was partiallywound-up; no curtailment gain or loss resulted. OnDecember 31, 2006, one of our qualified defined benefitplans was amended to freeze benefits in the United Statesaccruals for all employees, resulting in a curtailment gain of$8 million.
As well as the qualified plans, we have non-qualifieddefined benefit pension plans covering certain employeesand former directors of the Company. An irrevocable trust(“rabbi trust”) was set up to fund these plans. The fair valueof assets held in this trust was $21 million in 2006 (2005:$22 million), and is recorded in our consolidated balancesheet under available-for-sale securities.
Actuarial gains and losses arise when the actual returnon plan assets differs from the expected return on plan assetsfor a period, or when the expected and actuarial accruedbenefit obligations differ at the end of the year. We amortizeactuarial gains and losses over the average remaining lifeexpectancy of plan participants, in excess of a 10% corridor.
Pension Expense (Credit)
For the years ended December 31 2006 2005 2004
Expected return on plan assets $ (20) $ (11) $ (11)Service cost 4 – –Interest cost 22 12 12Actuarial losses 1 – 1Curtailment gains (8) – (2)
$ (1) $ 1 $ –
c) Pension Plan Information
Fair Value of Plan Assets
For the years ended December 31 2006 2005 2004
Balance at January 1 $ 166 $ 170 $ 166Increase for plans assumed on
acquisition of Placer Dome 127 – –Actual return on plan assets 35 10 14Company contributions 10 10 6Benefits paid (37) (24) (16)
Balance at December 31 $ 301 $ 166 $ 170
At December 31 2006 2005
Target Actual Actual Actual
Composition of plan assets:Equity securities 60% 59%–63% $ 180 $ 81Debt securities 40% 23%–41% 106 85Real estate – 3%–9% 9 –Other – 2%–9% 6 –
100% 100% $ 301 $ 166
Projected Benefit Obligation (PBO)
For the years ended December 31 2006 2005
Balance at January 1 $ 224 $ 218Increase for plans assumed on acquisition of
Placer Dome 191 –Service cost 4 –Interest cost 22 13Actuarial (gains) losses (7) 17Benefits paid (37) (24)Curtailments (8) –
Balance at December 31 $ 389 $ 224
Funded status1 $ (88) $ (58)Actuarial losses n/a 29
Net benefit liability recorded n/a $ (29)
ABO 2,3 $ 386 $ 222
1. Represents the fair value of plan assets less projected benefit obligations. Planassets exclude investments held in a rabbi trust that are recorded separately onour balance sheet under Investments (fair value $21 million at December 31,2006). In the year ending December 31, 2007, we do not expect to make anyfurther contributions.
2. For 2006, we used a measurement date of December 31, 2006 to calculateaccumulated benefit obligations.
3. Represents the accumulated benefit obligation (“ABO”) for all plans. The ABO for plans where the PBO exceeds the fair value of plan assets was$110 million (2005: $222 million).
Pension Plan Assets/Liabilities
At December 31 2006
Non-current assets $ 5Current liabilities (8)Non-current liabilities (85)Other comprehensive income1 6
$ (82)
1. Amounts represent actuarial losses.
The projected benefit obligation and fair value of plan assetsfor pension plans with a projected benefit obligation inexcess of plan assets at December 31, 2006 and 2005 were as follows:
For the years ended December 31 2006 2005
Projected benefit obligation, end of year $ 111 $ 224Fair value of plan assets, end of year $ 62 $ 166
122 � Notes to Consolidated Financial Statements Barrick Financial Report 2006
Notes to Consolidated Financial Statements � 123Barrick Financial Report 2006
The projected benefit obligation and fair value of plan assetsfor pension plans with an accumulated benefit obligation in excess of plan assets at December 31, 2006 and 2005 wereas follows:
For the years ended December 31 2006 2005
Projected benefit obligation, end of year $ 111 $ 224Accumulated benefit obligation, end of year $ 110 $ 222Fair value of plan assets, end of year $ 62 $ 166
Effect of Adopting FAS 158We adopted provisions of FAS 158 in 2006 (see note 2e).FAS 158 requires employers to fully recognize the obliga-tions for defined benefit pension and other post-retirementplans in their financial statements; past standards onlyrequired note disclosure. FAS 158 requires recognition ofthe funded status of a benefit plan on the balance sheet,which is measured as the difference between the fair valueof plan assets and the benefit obligation, as at the fiscal year-end. For pension plans, the benefit obligation is the pro-jected benefit obligation; for other post-retirement benefits,the benefit obligation is the accumulated post-retirementbenefit obligation.
Pre- Adjust- Post-For the years ended December 31, 20061 FAS 158 ments FAS 158
Liability for plansPension plans $ 82 $ 6 $ 88Other post-retirement benefits 31 5 36Additional minimum liability2 13 (13) –
Total recognized benefit liability $ 126 $ (2) $ 124
Liability for plansNet actuarial loss $ – $ 9 $ 9Transition obligation – 2 2
$ – $ 11 $ 11
1. Includes incremental effect for other post-retirement benefits.2. Elimination of historically recorded amounts in OCI.
Expected Future Benefit Payments
For the years ending December 31
2007 $ 332008 282009 272010 362011 272012 – 2016 $ 134
d) Actuarial AssumptionsFor the years ended December 31 2006 2005 2004
Discount rate1
Benefit obligation 4.40%–5.90% 5.50% 5.50%Pension cost 4.40%-5.90% 5.50% 6.25%
Return on plan assets1 7.00%–7.25% 7.00% 7.00%Wage increases 3.5%–5.00% 5.00% 5.00%
1. Effect of a one-percent change: Discount rate: $33 million decrease in ABOand $2 million increase in pension cost; Return on plan assets: $3 milliondecrease in pension cost.
Pension plan assets, which consist primarily of fixed-income and equity securities, are valued using current mar-ket quotations. Plan obligations and the annual pensionexpense are determined on an actuarial basis and areaffected by numerous assumptions and estimates includingthe market value of plan assets, estimates of the expectedreturn on plan assets, discount rates, future wage increasesand other assumptions. The discount rate, assumed rate ofreturn on plan assets and wage increases are the assump-tions that generally have the most significant impact on ourpension cost and obligation.
The discount rate for benefit obligation and pensioncost purposes is the rate at which the pension obligationcould be effectively settled. This rate was developed bymatching the cash flows underlying the pension obligationwith a spot rate curve based on the actual returns availableon high-grade (Moody’s AA) US corporate bonds. Bondsincluded in this analysis were restricted to those with aminimum outstanding balance of $50 million. Only non-callable bonds, or bonds with a make-whole provision, wereincluded. Finally, outlying bonds (highest and lowest 10%)were discarded as being non-representative and likely to be subject to a change in investment grade. The resultingdiscount rate from this analysis was rounded to the nearest25 basis points. The procedure was applied separately forpension and post-retirement plan purposes, and producedthe same rate in each case.
The assumed rate of return on assets for pension costpurposes is the weighted average of expected long-termasset return assumptions. In estimating the long-term rateof return for plan assets, historical markets are studied andlong-term historical returns on equities and fixed-income

investments reflect the widely accepted capital market prin-ciple that assets with higher volatility generate a greaterreturn over the long run. Current market factors such asinflation and interest rates are evaluated before long-termcapital market assumptions are finalized.
Wage increases reflect the best estimate of merit increases to be provided, consistent with assumed infla-tion rates.
e) Other Post-retirement BenefitsWe provide post-retirement medical, dental, and life insur-ance benefits to certain employees. We use the corridorapproach in the accounting for post-retirement benefits.Actuarial gains and losses resulting from variances betweenactual results and economic estimates or actuarial assump-tions are deferred and amortized over the average remain-ing life expectancy of participants when the net gains orlosses exceed 10% of the accumulated post-retirementbenefit obligation.
Other Post-retirement Benefits Expense
For the years ended December 31 2006 2005 2004
Interest cost $ 2 $ 2 $ 2Other – 5 –
$ 2 $ 7 $ 2
Fair Value of Plan Assets
For the years ended December 31 2006 2005 2004
Balance at January 1 $ – $ – $ –Contributions 3 4 2Benefits paid (3) (4) (2)
Balance at December 31 $ – $ – $ –
Accumulated Post-retirement Benefit Obligation (APBO)
For the years ended December 31 2006 2005 2004
Balance at January 1 $ 39 $ 29 $ 24Interest cost 2 2 2Actuarial losses (1) 11 5Benefits paid (3) (3) (2)
Balance at December 31 $ 37 $ 39 $ 29
Funded status (37) (38) (29)Unrecognized net transition obligation n/a 1 –Unrecognized actuarial losses n/a 6 1
Net benefit liability recorded n/a $ (31) $ (28)
Other Post-retirement Assets/Liabilities
For the year ended December 31 2006
Current liability $ (3)Non-current liability (33)Accumulated other comprehensive income 5
$ (31)
Amounts recognized in accumulated other comprehensiveincome consist of:1
For the year ended December 31 2006
Net actuarial loss (gain) $ 3Transition obligation (asset) 2
$ 5
1. The estimated amounts that will be amortized into net periodic benefit costin 2007.
We have assumed a health care cost trend of 10% in 2007,decreasing ratability to 5% in 2012 and thereafter. Theassumed health care cost trend had a minimal effect on theamounts reported. A one percentage point change in theassumed health care cost trend rate at December 31, 2006would have increased the post-retirement obligation by $4 million or decreased the post-retirement benefit obliga-tion by $3 million and would have had no significant effecton the benefit expense for 2006.
Expected Future Benefit Payments
For the years ending December 31
2007 $ 32008 32009 32010 32012 32012 – 2016 14
124 � Notes to Consolidated Financial Statements Barrick Financial Report 2006

Notes to Consolidated Financial Statements � 125Barrick Financial Report 2006
27 � Litigation and Claims
Certain conditions may exist as of the date the financialstatements are issued, which may result in a loss to theCompany but which will only be resolved when one ormore future events occur or fail to occur. In assessing losscontingencies related to legal proceedings that are pendingagainst us or unasserted claims that may result in such pro-ceedings, the Company and its legal counsel evaluate theperceived merits of any legal proceedings or unassertedclaims as well as the perceived merits of the amount of reliefsought or expected to be sought.
If the assessment of a contingency suggests that a lossis probable, and the amount can be reliably estimated, thena loss is recorded. When a contingent loss is not probablebut is reasonably possible, or is probable but the amount ofloss cannot be reliably estimated, then details of the contin-gent loss are disclosed. Loss contingencies consideredremote are generally not disclosed unless they involve guar-antees, in which case we disclose the nature of the guaran-tee. Legal fees incurred in connection with pending legalproceedings are expensed as incurred.
Wagner ComplaintOn June 12, 2003, a complaint was filed against Barrick andseveral of its current or former officers in the U.S. DistrictCourt for the Southern District of New York. The complaintis on behalf of Barrick shareholders who purchased Barrickshares between February 14, 2002 and September 26, 2002.It alleges that Barrick and the individual defendants vio-lated U.S. securities laws by making false and misleadingstatements concerning Barrick’s projected operating resultsand earnings in 2002. The complaint seeks an unspecifiedamount of damages. Other parties filed several other com-plaints, making the same basic allegations against the samedefendants. In September 2003, the cases were consolidatedinto a single action in the Southern District of New York.The plaintiffs filed a Third Amended Complaint on January6, 2005. On May 23, 2005, Barrick filed a motion to dismisspart of the Third Amended Complaint. On January 31,2006, the Court issued an order granting in part and deny-ing in part Barrick’s motion to dismiss. Both parties movedfor reconsideration of a portion of the Court’s January 31,2006 Order. On December 12, 2006, the Court issued itsorder denying the parties’ motions for reconsideration. TheCourt denied both parties’ motions. Discovery is ongoing.We intend to defend the action vigorously. No amounts havebeen accrued for any potential loss under this complaint.
Wilcox ComplaintOn September 8, 2004, two of our U.S. subsidiaries,Homestake Mining Company of California (“HomestakeCalifornia”) and Homestake Mining Company (“Home-stake”) were served with a First Amended Complaint bypersons alleging to be current or former residents of a ruralarea near the former Grants Uranium Mill. The Complaint,which was filed in the U.S. District Court for the District ofNew Mexico, named Homestake and Homestake California,along with an unspecified number of unidentified defen-dants, as defendants. The plaintiffs allege that they have suf-fered a variety of physical, emotional and financial injuriesas a result of exposure to radioactive and other hazardoussubstances. The Complaint seeks an unspecified amount ofdamages. On November 25, 2005, the Court issued an ordergranting in part and denying in part a motion to dismiss theclaim. The Court granted the motion and dismissed plain-tiffs’ claims based on strict and absolute liability and ruledthat plaintiffs’ state law claims are pre-empted by the Price-Anderson Act. Plaintiffs filed a Third Amended Complainton April 10, 2006, which increased the number of plaintiffsfrom 26 to 28 and omitted the claims previously dismissedby the Court, but otherwise did not materially alter theclaims asserted. An Initial Scheduling Order has beenissued by the Court. We intend to defend the action vigor-ously. No amounts have been accrued for any potential lossunder this complaint.
Cowal MineOpponents of Barrick’s Cowal mine continue to pursue var-ious claims, legal proceedings and complaints against themine and the Company’s compliance with its permits andlicenses. Barrick has and will continue to vigorously defendsuch actions. No amounts have been accrued for any poten-tial loss under these complaints.

Marinduque ComplaintPlacer Dome has been named the sole defendant in aComplaint filed on October 4, 2005, by the ProvincialGovernment of Marinduque, an island province of thePhilippines (“Province”), with the District Court in ClarkCounty, Nevada. The action was removed to the NevadaFederal District Court on motion of Placer Dome. TheComplaint asserts that Placer Dome is responsible foralleged environmental degradation with consequent eco-nomic damages and impacts to the environment in thevicinity of the Marcopper mine that was owned and oper-ated by Marcopper Mining Corporation (“Marcopper”).Placer Dome indirectly owned a minority shareholding of39.9% in Marcopper until the divestiture of its shareholdingin 1997. The Province seeks “to recover damages for injuriesto the natural, ecological and wildlife resources within itsterritory”, but “does not seek to recover damages for indi-vidual injuries sustained by its citizens either to their per-sons or their property”. In addition to damages for injury tonatural resources, the Province seeks compensation for thecosts of restoring the environment, an order directing PlacerDome to undertake and complete “the remediation, envi-ronmental cleanup, and balancing of the ecology of theaffected areas,” and payment of the costs of environmentalmonitoring. The Complaint addresses the discharge of minetailings into Calancan Bay, the 1993 Maguila-guila dambreach, the 1996 Boac river tailings spill, and alleged pastand continuing damage from acid rock drainage.
At the time of the amalgamation of Placer Dome andBarrick Gold Corporation, a variety of motions were pend-ing before the District Court, including motions to dismissthe action for lack of personal jurisdiction and for forumnon conveniens (improper choice of forum). However, onJune 29, 2006, the Province filed a Motion to join BarrickGold Corporation as an additional named Defendant andfor leave to file a Third Amended Complaint. The Companyhas filed oppositions to these new motions from theProvince. The District Court has not yet ruled on thesemotions. On November 13, 2006, the District Court issuedan order permitting the Province to conduct ‘limited’ juris-dictional discovery. The Company has interposed objec-tions to the scope of the discovery that the Province hasrequested. The District Court has not yet ruled on theobjections. We will challenge the claims of the Province onvarious grounds and otherwise vigorously defend theaction. No amounts have been accrued for any potentialloss under this complaint.
Calancan Bay (Philippines) ComplaintOn July 23, 2004, a complaint was filed against Marcopperand Placer Dome Inc. (“PDI”) in the Regional Trial Courtof Boac, on the Philippine island of Marinduque, on behalfof a putative class of fishermen who reside in the commu-nities around Calancan Bay, in northern Marinduque. Thecomplaint alleges injuries to health and economic damagesto the local fisheries resulting from the disposal of minetailings from the Marcopper mine. The total amount ofdamages claimed is approximately US$900 million.
On October 16, 2006, the court granted the plaintiffs’application for indigent status, allowing the case to proceedwithout payment of filing fees. On January 17, 2007, theCourt issued a summons to Marcopper and PDI. To date,we are unaware of any attempts to serve the summons onPDI, nor do we believe that PDI is properly amenable toservice in the Philippines. If service is attempted, theCompany intends to defend the action vigorously.
Pakistani Constitutional LitigationOn November 28, 2006, a Constitutional Petition was filedin the High Court of Balochistan by three Pakistan citizensagainst: Barrick, the governments of Balochistan andPakistan, the Balochistan Development Authority (“BDA”),Tethyan Copper Company (“TCC”), Antofagasta Plc(“Antofagasta”), Muslim Lakhani and BHP (Pakistan) PvtLimited (“BHP”).
The Petition alleges, among other things, that the entryby the BDA into the 1993 Joint Venture Agreement (“JVA”)with BHP to facilitate the exploration of the Reko Diq areaand the grant of related exploration licenses were illegal andthat the subsequent transfer of the interests of BHP in theJVA and the licenses to TCC was also illegal and shouldtherefore be set aside. Barrick currently indirectly holds50% of the shares of TCC, with Antofagasta indirectly hold-ing the other 50%.
On December 27, 2006, the Court issued an order pro-viding that the respondents may continue to conduct min-ing exploration in the area, but that no change shall bemade in the ownership of TCC without the consent of theprovincial government and prior intimation to the Court.The original order of the Court, which was granted onNovember 28, 2006, provided that status quo in respect ofthe mining lease (of which there are none) be maintained.The matter was adjourned to March 20, 2007 at which timeit is expected to be heard by the Court. Barrick intends todefend this action vigorously.
126 � Notes to Consolidated Financial Statements Barrick Financial Report 2006

Notes to Consolidated Financial Statements � 127Barrick Financial Report 2006
NovaGold LitigationOn August 24, 2006, during the pendency of Barrick’s unso-licited bid for NovaGold Resources Inc., NovaGold filed acomplaint against Barrick in the United States DistrictCourt for the District of Alaska. The complaint has beenamended on several occasions with the most recent amend-ment having been filed in January 2007. The complaint, asamended, seeks a declaration that Barrick will be unable tosatisfy the requirements of the Mining Venture Agreementbetween NovaGold and Barrick which would allow Barrickto increase its interest in the Donlin Creek joint venturefrom 30% to 70%. NovaGold also asserts that Barrickbreached its fiduciary and contractual duties to NovaGold,including its duty of good faith and fair dealing, by misus-ing confidential information of NovaGold regardingNovaGold’s Galore Creek project in British Columbia.NovaGold seeks declaratory relief, an injunction and anunspecified amount of damages. Barrick’s Motion toDismiss NovaGold’s amended complaint was heard onFebruary 9, 2007, and is currently pending before the Court.
On August 11, 2006, NovaGold filed a complaintagainst Barrick in the Supreme Court of British Columbia.The complaint asserts that in the course of discussions withNovaGold of a potential joint venture for the developmentof the Galore Creek project, Barrick misused confidentialinformation of NovaGold regarding that project to, amongother things, wrongfully acquire Pioneer Metals, a companythat holds mining claims adjacent to NovaGold’s project.NovaGold asserts that Barrick breached fiduciary dutiesowed to NovaGold, intentionally and wrongfully interferedwith NovaGold’s interests and has been unjustly enriched.NovaGold seeks a constructive trust over the shares inPioneer acquired by Barrick and an accounting for anyprofits of Barrick’s conduct, as well as an unspecifiedamount of damages. To date, NovaGold has taken no sub-stantive action to pursue this complaint.
Barrick intends to vigorously defend both of theNovaGold complaints. No amounts have been accrued forany potential loss under these complaints.
28 � Unincorporated Joint Ventures
Our major interests in unincorporated joint ventures wherewe share joint control with our partners and use the pro-portionate consolidation method are a 50% interest in theKalgoorlie mine in Australia; a 50% interest in the RoundMountain mine in the United States; a 50% interest in theHemlo mine in Canada; and a 33% interest in the Marigoldmine in the United States. In first quarter 2006 we alsoacquired interests in similar unincorporated joint venturesthrough the acquisition of Placer Dome, including: a 60%interest in the Cortez Mine; a 75% interest in the TurquoiseRidge mine, both in the United States; and a 75% interest inthe Porgera mine in Papua New Guinea.
Summary Financial Information (100%)
Income Statement and Cash Flow Information
For the years ended December 31 2006 2005 2004
Revenues $ 1,776 $ 1,009 $ 946Costs and expenses (1,447) (796) (702)
Net income $ 329 $ 213 $ 244
Operating activities1 $ 473 $ 318 $ 316Investing activities1 $ (284) $ (75) $ (81)Financing activities1,2 $ (185) $ (237) $ (236)
1. Net cash inflow (outflow).2. Includes cash flows between the joint ventures and joint venture partners.
Balance Sheet Information
At December 31 2006 2005
AssetsInventories $ 365 $ 176Property, plant and equipment 2,478 504Other assets 126 87
$ 2,969 $ 767
LiabilitiesCurrent liabilities $ 205 $ 123Long-term obligations 202 105Deferred tax 42 –
$ 449 $ 228
128 � Mineral Reserves and Mineral Resources Barrick Financial Report 2006
Gold Mineral Reserves and Mineral ResourcesThe table on the next two pages sets forth Barrick’s interest in the total proven and probable gold mineral reserves at each property.For further details of proven and probable mineral reserves and measured, indicated and inferred mineral resources by category,see pages 129 and 130.
The Company has carefully prepared and verified the mineral reserve and mineral resource figures and believes that its methodof estimating mineral reserves has been verified by mining experience. These figures are estimates, however, and no assurance can begiven that the indicated quantities of gold will be produced. Gold price fluctuations may render mineral reserves containing relativelylower grades of gold mineralization uneconomic. Moreover, short-term operating factors relating to the mineral reserves, such as theneed for orderly development of ore bodies or the processing of new or different ore grades, could affect the Company’s profitabilityin any particular accounting period.
A mineral resource is a concentration or occurrence of dia-monds, natural solid inorganic material, or natural solid fos-silized organic material including base and precious metals,coal, and industrial minerals in or on the Earth’s crust in suchform and quantity and of such a grade or quality that it hasreasonable prospects for economic extraction. The location,quantity, grade, geological characteristics and continuity of amineral resource are known, estimated or interpreted fromspecific geological evidence and knowledge. Mineral resourcesare sub-divided, in order of increasing geological confidence,into inferred, indicated and measured categories.
An inferred mineral resource is that part of a mineral resourcefor which quantity and grade or quality can be estimated onthe basis of geological evidence and limited sampling and rea-sonably assumed, but not verified, geological and grade conti-nuity. The estimate is based on limited information andsampling gathered through appropriate techniques from loca-tions such as outcrops, trenches, pits, workings and drill holes.
An indicated mineral resource is that part of a mineral resourcefor which quantity, grade and quality, densities, shape andphysical characteristics, can be estimated with a level ofconfidence sufficient to allow the appropriate application oftechnical and economic parameters, to support mine planningand evaluation of the economic viability of the deposit. Theestimate is based on detailed and reliable exploration and test-ing information gathered through appropriate techniques fromlocations such as outcrops, trenches, pits, workings and drillholes that are spaced closely enough for geological and gradecontinuity to be reasonably assumed.
A measured mineral resource is that part of a mineral resourcefor which quantity, grade or quality, densities, shape and physi-cal characteristics are so well established that they can be esti-mated with confidence sufficient to allow the appropriate
application of technical and economic parameters, to supportproduction planning and evaluation of the economic viabilityof the deposit. The estimate is based on detailed and reliableexploration, sampling and testing information gatheredthrough appropriate techniques from locations such as out-crops, trenches, pits, workings and drill holes that are spacedclosely enough to confirm both geological and grade continuity.
Mineral resources, which are not mineral reserves, do not havedemonstrated economic viability.
A mineral reserve is the economically mineable part of a measured or indicated mineral resource demonstrated by atleast a preliminary feasibility study. This study must includeadequate information on mining, processing, metallurgical,economic and other relevant factors that demonstrate, at thetime of reporting, that economic extraction can be justified.A mineral reserve includes diluting materials and allowancesfor losses that may occur when the material is mined. Mineralreserves are sub-divided in order of increasing confidence intoprobable mineral reserves and proven mineral reserves.
A probable mineral reserve is the economically mineable part ofan indicated and, in some circumstances, a measured mineralresource demonstrated by a least a preliminary feasibilitystudy. This study must include adequate information on min-ing, processing, metallurgical, economic and other relevantfactors that demonstrate, at the time of reporting, that eco-nomic extraction can be justified.
A proven mineral reserve is the economically mineable part of a measured mineral resource demonstrated by at least a pre-liminary feasibility study. This study must include adequateinformation on mining, processing, metallurgical, economicand other relevant factors that demonstrate, at the time ofreporting, that economic extraction can be justified.
Definitions

Mineral Reserves and Mineral Resources � 129Barrick Financial Report 2006
Summary Gold Mineral Reserves and Mineral Resources1
For the years ended December 31 2006 2005
Tons Grade Ounces Tons Grade OuncesBased on attributable ounces (000s) (oz/ton) (000s) (000s) (oz/ton) (000s)
North AmericaGoldstrike Open Pit (proven and probable) 105,206 0.125 13,122 114,512 0.128 14,603
(mineral resource) 20,184 0.050 1,013 21,115 0.050 1,054
Goldstrike Underground (proven and probable) 7,662 0.370 2,834 7,320 0.379 2,773
(mineral resource) 4,143 0.338 1,400 3,234 0.386 1,247
Goldstrike Property Total (proven and probable) 112,868 0.141 15,956 121,832 0.143 17,376
(mineral resource) 24,327 0.099 2,413 24,349 0.095 2,301
Pueblo Viejo (60%) (proven and probable) 118,574 0.092 10,873
(mineral resource) 16,316 0.078 1,280
Cortez (60%) (proven and probable) 110,411 0.061 6,691
(mineral resource) 26,680 0.041 1,087
Bald Mountain (proven and probable) 109,922 0.031 3,457
(mineral resource) 23,289 0.035 824
Turquoise Ridge (75%) (proven and probable) 6,327 0.544 3,443
(mineral resource) 3,601 0.432 1,556
Round Mountain (50%) (proven and probable) 113,042 0.017 1,952 137,804 0.017 2,338
(mineral resource) 13,067 0.020 263 17,706 0.017 296
Ruby Hill (proven and probable) 19,479 0.055 1,080 17,093 0.059 1,011
(mineral resource) 601 0.088 53 3,049 0.061 187
Hemlo (50%) (proven and probable) 9,046 0.079 718 10,382 0.091 944
(mineral resource) 2,900 0.111 322 1,980 0.151 299
Marigold (33%) (proven and probable) 34,290 0.021 708 32,546 0.021 689
(mineral resource) 31,529 0.018 555 19,906 0.020 389
Golden Sunlight (proven and probable) 4,683 0.080 376
(mineral resource) 1,020 0.060 61
Eskay Creek (proven and probable) 136 0.757 103 268 0.810 217
(mineral resource) 36 0.694 25 676 0.315 213
South Arturo (proven and probable) – – – – – –
(mineral resource) 12,644 0.060 754 2,965 0.053 158
Donlin Creek (30%) (proven and probable) – – –
(mineral resource) 82,041 0.072 5,926
South AmericaPascua-Lama (proven and probable) 390,985 0.043 16,988 397,441 0.046 18,349
(mineral resource) 75,828 0.041 3,099 61,412 0.038 2,304
Veladero (proven and probable) 371,563 0.031 11,368 386,137 0.033 12,641
(mineral resource) 5,179 0.038 195 2,771 0.005 14
Lagunas Norte (proven and probable) 205,833 0.043 8,804 227,140 0.036 8,266
(mineral resource) 85,114 0.028 2,394 47,964 0.035 1,699
Pierina (proven and probable) 32,634 0.037 1,209 65,440 0.029 1,916
(mineral resource) 500 0.044 22 3,578 0.019 67
1. See accompanying footnote #1

130 � Mineral Reserves and Mineral Resources Barrick Financial Report 2006
Summary Gold Mineral Reserves and Mineral Resources1
For the years ended December 31 2006 2005
Tons Grade Ounces Tons Grade OuncesBased on attributable ounces (000s) (oz/ton) (000s) (000s) (oz/ton) (000s)
Australia PacificPorgera (75%) (proven and probable) 63,876 0.111 7,067
(mineral resource) 33,286 0.053 1,756
Kalgoorlie (50%) (proven and probable) 87,675 0.058 5,090 84,883 0.058 4,894
(mineral resource) 5,771 0.067 387 4,265 0.062 265
Cowal (proven and probable) 86,687 0.037 3,187 63,600 0.039 2,495
(mineral resource) 23,508 0.036 856 57,208 0.034 1,966
Plutonic (proven and probable) 18,646 0.121 2,247 16,554 0.145 2,399
(mineral resource) 19,708 0.148 2,913 18,208 0.151 2,753
Kanowna (proven and probable) 12,890 0.149 1,924
(mineral resource) 7,182 0.127 909
Darlot (proven and probable) 5,654 0.136 768 6,343 0.144 914
(mineral resource) 3,421 0.110 377 3,446 0.112 385
Granny Smith (proven and probable) 7,395 0.093 690
(mineral resource) 1,681 0.076 127
Lawlers (proven and probable) 3,276 0.130 426 3,760 0.126 472
(mineral resource) 7,506 0.172 1,293 6,246 0.169 1,054
Henty (proven and probable) 741 0.266 197
(mineral resource) 56 0.196 11
Osborne (proven and probable) 7,817 0.020 155
(mineral resource) 4,626 0.027 127
Reko Diq (37.5%)2 (proven and probable) – – –
(mineral resource) 525,797 0.007 3,610
AfricaBulyanhulu (proven and probable) 30,456 0.367 11,185 25,916 0.414 10,732
(mineral resource) 1,202 0.483 580 3,776 0.469 1,770
North Mara (proven and probable) 31,791 0.103 3,276
(mineral resource) 7,225 0.085 614
Buzwagi (proven and probable) 45,168 0.058 2,640 39,231 0.061 2,403
(mineral resource) 7,219 0.056 407 18,720 0.043 809
Tulawaka (70%) (proven and probable) 926 0.356 330 973 0.387 377
(mineral resource) 204 0.505 103 – – –
Other3 (proven and probable) 363 0.435 158 363 0.435 158
(mineral resource) 165 0.400 66 165 0.400 66
Total (proven and probable) 2,043,154 0.060 123,066 1,637,705 0.054 88,591
(mineral resource) 1,053,229 0.033 34,965 298,390 0.057 16,995
1. See accompanying footnote #12. See accompanying footnote #23. See accompanying footnote #3

Mineral Reserves and Mineral Resources � 131Barrick Financial Report 2006
Gold Mineral Reserves1
As at December 31, 2006 Proven Probable Total
Tons Grade Ounces Tons Grade Ounces Tons Grade OuncesBased on attributable ounces (000s) (oz/ton) (000s) (000s) (oz/ton) (000s) (000s) (oz/ton) (000s)
North AmericaGoldstrike Open Pit 62,699 0.117 7,336 42,507 0.136 5,786 105,206 0.125 13,122 Goldstrike Underground 3,108 0.495 1,538 4,554 0.285 1,296 7,662 0.370 2,834
Goldstrike Property Total 65,807 0.135 8,874 47,061 0.150 7,082 112,868 0.141 15,956 Pueblo Viejo (60%) 12,684 0.088 1,112 105,890 0.092 9,761 118,574 0.092 10,873 Cortez (60%) 40,240 0.075 3,020 70,171 0.052 3,671 110,411 0.061 6,691 Bald Mountain 75,366 0.033 2,470 34,556 0.029 987 109,922 0.031 3,457 Turquoise Ridge (75%) 3,516 0.544 1,913 2,811 0.544 1,530 6,327 0.544 3,443 Round Mountain (50%) 40,462 0.021 845 72,580 0.015 1,107 113,042 0.017 1,952 Ruby Hill 8,812 0.059 522 10,667 0.052 558 19,479 0.055 1,080 Hemlo (50%) 5,417 0.084 454 3,629 0.073 264 9,046 0.079 718 Marigold (33%) 16,664 0.022 360 17,626 0.020 348 34,290 0.021 708 Golden Sunlight 4,399 0.081 357 284 0.067 19 4,683 0.080 376 Eskay Creek 104 0.731 76 32 0.844 27 136 0.757 103 South Arturo – – – – – – – – – Donlin Creek (30%) – – – – – – – – –
South AmericaPascua-Lama 38,227 0.053 2,029 352,758 0.042 14,959 390,985 0.043 16,988 Veladero 24,581 0.032 791 346,982 0.030 10,577 371,563 0.031 11,368 Lagunas Norte 10,853 0.051 553 194,980 0.042 8,251 205,833 0.043 8,804Pierina 13,784 0.042 582 18,850 0.033 627 32,634 0.037 1,209
Australia PacificPorgera (75%) 45,952 0.102 4,703 17,924 0.132 2,364 63,876 0.111 7,067 Kalgoorlie (50%) 47,603 0.053 2,536 40,072 0.064 2,554 87,675 0.058 5,090Cowal 12,684 0.038 476 74,003 0.037 2,711 86,687 0.037 3,187 Plutonic 984 0.119 117 17,662 0.121 2,130 18,646 0.121 2,247 Kanowna 5,241 0.179 938 7,649 0.129 986 12,890 0.149 1,924 Darlot 2,145 0.113 242 3,509 0.150 526 5,654 0.136 768 Granny Smith 4,370 0.055 242 3,025 0.148 448 7,395 0.093 690 Lawlers 874 0.106 93 2,402 0.139 333 3,276 0.130 426 Henty – – – 741 0.266 197 741 0.266 197 Osborne 3,653 0.025 90 4,164 0.016 65 7,817 0.020 155 Reko Diq (37.5%)2 – – – – – – – – –
AfricaBulyanhulu 1,325 0.411 544 29,131 0.365 10,641 30,456 0.367 11,185 North Mara 19,224 0.106 2,030 12,567 0.099 1,246 31,791 0.103 3,276 Buzwagi 95 0.063 6 45,073 0.058 2,634 45,168 0.058 2,640 Tulawaka (70%) 259 0.116 30 667 0.450 300 926 0.356 330
Other – – – 363 0.435 158 363 0.435 158
Total 505,325 0.071 36,005 1,537,829 0.057 87,061 2,043,154 0.060 123,066
Copper Mineral Reserves2
As at December 31, 2006 Proven Probable Total
Contained Contained ContainedTons Grade lbs Tons Grade lbs Tons Grade lbs
Based on attributable ounces (000s) (%) (millions) (000s) (%) (millions) (000s) (%) (millions)
Zaldívar 199,406 0.570 2,274 317,749 0.538 3,416 517,155 0.550 5,690 Osborne 3,653 2.190 160 4,164 1.873 156 7,817 2.021 316
Total 203,059 0.599 2,434 321,913 0.555 3,572 524,972 0.572 6,006
1. See accompanying footnote #12. See accompanying footnote #2

132 � Mineral Reserves and Mineral Resources Barrick Financial Report 2006
Gold Mineral Resources1,2
As at December 31, 2006 Measured (M) Indicated (I) (M) + (I) Inferred
Tons Grade Ounces Tons Grade Ounces Ounces Tons Grade OuncesBased on attributable ounces (000s) (oz/ton) (000s) (000s) (oz/ton) (000s) (000s) (000s) (oz/ton) (000s)
North AmericaGoldstrike Open Pit 12,168 0.054 655 8,016 0.045 358 1,013 489 0.078 38 Goldstrike Underground 1,185 0.393 466 2,958 0.316 934 1,400 2,159 0.301 650
Goldstrike Property Total 13,353 0.084 1,121 10,974 0.118 1,292 2,413 2,648 0.260 688 Pueblo Viejo (60%) 496 0.085 42 15,820 0.078 1,238 1,280 32,528 0.082 2,674 Cortez (60%) 7,506 0.038 287 19,174 0.042 800 1,087 3,925 0.131 516 Bald Mountain 15,037 0.035 527 8,252 0.036 297 824 17,290 0.023 398 Turquoise Ridge (75%) 1,973 0.430 849 1,628 0.434 707 1,556 1,471 0.493 725 Round Mountain (50%) 4,799 0.021 103 8,268 0.019 160 263 16,449 0.013 216 Ruby Hill 190 0.100 19 411 0.083 34 53 – – – Hemlo (50%) 1,461 0.108 158 1,439 0.114 164 322 2,854 0.142 405 Marigold (33%) 12,683 0.018 222 18,846 0.018 333 555 88,212 0.011 1,012 Golden Sunlight 952 0.061 58 68 0.044 3 61 207 0.130 27 Eskay Creek 22 0.636 14 14 0.786 11 25 56 0.357 20 South Arturo (60%) – – – 12,644 0.060 754 754 786 0.053 42 Donlin Creek (30%) 4,296 0.061 260 77,745 0.073 5,666 5,926 8,196 0.058 476
South AmericaPascua-Lama 7,681 0.048 366 68,147 0.040 2,733 3,099 12,949 0.040 513 Veladero 543 0.020 11 4,636 0.040 184 195 5,051 0.231 1,165 Lagunas Norte 2,267 0.034 78 82,847 0.028 2,316 2,394 37,639 0.030 1,135 Pierina 122 0.033 4 378 0.048 18 22 76 0.039 3
Australia PacificPorgera (75%) 17,083 0.058 997 16,203 0.047 759 1,756 11,419 0.081 926 Kalgoorlie (50%) 2,649 0.065 172 3,122 0.069 215 387 986 0.193 190 Cowal 805 0.041 33 22,703 0.036 823 856 5,215 0.029 150 Plutonic 250 0.220 55 19,458 0.147 2,858 2,913 6,729 0.188 1,263 Kanowna 2,746 0.145 397 4,436 0.115 512 909 13,358 0.117 1,561 Darlot 479 0.113 54 2,942 0.110 323 377 98 0.184 18 Granny Smith 181 0.177 32 1,500 0.063 95 127 11,543 0.195 2,251 Lawlers 53 0.113 6 7,453 0.173 1,287 1,293 761 0.179 136 Henty – – – 56 0.196 11 11 151 0.245 37 Osborne 2,271 0.028 64 2,355 0.027 63 127 2,797 0.019 52 Reko Diq (37.5%)3 – – – 525,797 0.007 3,610 3,610 448,085 0.010 4,376
AfricaBulyanhulu – – – 1,202 0.483 580 580 7,355 0.504 3,708 North Mara 3,647 0.096 349 3,578 0.074 265 614 1,134 0.086 97 Buzwagi 15 0.067 1 7,204 0.056 406 407 1,153 0.058 67 Tulawaka (70%) – – – 204 0.505 103 103 97 0.082 8
Other – – – 165 0.400 66 66 266 0.301 80
Total 103,560 0.061 6,279 949,669 0.030 28,686 34,965 741,484 0.034 24,935
Copper Mineral Resources1,2
As at December 31, 2006 Measured (M) Indicated (I) (M) + (I) Inferred
Contained Contained Contained ContainedTons Grade lbs Tons Grade lbs lbs Tons Grade lbs
Based on attributable ounces (000s) (%) (millions) (000s) (%) (millions) (millions) (000s) (%) (millions)
Zaldívar 21,898 0.470 206 60,262 0.431 520 726 69,119 0.468 647 Osborne 2,271 2.356 107 2,355 1.656 78 185 2,797 1.448 81 Reko Diq (37.5%) – – – 525,797 0.540 5,675 5,675 448,085 0.482 4,319
Total 24,169 0.648 313 588,414 0.533 6,273 6,586 520,001 0.485 5,047
1. Resources which are not reserves do not have demonstrated economic viability.2. See accompanying footnote #13. See accompanying footnote #2

Mineral Reserves and Mineral Resources � 133Barrick Financial Report 2006
Contained Silver Within Reported Gold Reserves1
For the year ended In proven In probableDecember 31, 2006 gold reserves gold reserves Total
ProcessTons Grade Ounces Tons Grade Ounces Tons Grade Ounces recovery
(000s) (oz/ton) (000s) (000s) (oz/ton) (000s) (000s) (oz/ton) (000s) %
North AmericaPueblo Viejo (60%) 6,504 0.59 3,843 105,890 0.46 48,794 112,394 0.47 52,637 85.0%
Eskay Creek 104 38.66 4,021 32 40.19 1,286 136 39.02 5,307 89.7%
South AmericaPascua-Lama 38,227 1.90 72,471 352,758 1.75 616,850 390,985 1.76 689,321 78.5%
Lagunas Norte 10,853 0.11 1,175 194,980 0.10 20,016 205,833 0.10 21,191 19.4%
Veladero 24,581 0.46 11,272 346,982 0.49 170,322 371,563 0.49 181,594 6.7%
Pierina 13,784 0.20 2,690 18,850 0.16 3,013 32,634 0.17 5,703 36.1%
AfricaBulyanhulu 1,325 0.22 289 29,131 0.27 7,896 30,456 0.27 8,185 65.0%
Total 95,378 1.00 95,761 1,048,623 0.83 868,177 1,144,001 0.84 963,938 63.7%
1. Silver is accounted for as a by-product credit against reported or projected gold production costs.
Contained Copper Within Reported Gold Reserves1
For the year ended In proven In probableDecember 31, 2006 gold reserves gold reserves Total
Contained Contained Contained ProcessTons Grade lbs Tons Grade lbs Tons Grade lbs recovery
(000s) (%) (millions) (000s) (%) (millions) (000s) (%) (millions) %
North AmericaPueblo Viejo (60%) 6,504 0.111 14 105,890 0.095 200 112,394 0.096 215 88.1%
South AmericaPascua-Lama 38,227 0.093 71 352,758 0.070 494 390,985 0.072 565 56.0%
AfricaBuzwagi 95 0.153 0.3 45,073 0.131 118 45,168 0.131 119 77.6%
Bulyanhulu 1,325 0.426 11 29,131 0.580 338 30,456 0.574 349 85.0%
Total 46,151 0.105 97 532,852 0.108 1,151 579,003 0.108 1,248 71.7%
1. Copper is accounted for as a by-product credit against reported or projected gold production costs.
Contained Zinc Within Reported Gold Reserves1
For the year ended In proven In probableDecember 31, 2006 gold reserves gold reserves Total
Contained Contained Contained ProcessTons Grade lbs Tons Grade lbs Tons Grade lbs recovery
(000s) (%) (millions) (000s) (%) (millions) (000s) (%) (millions) %
North AmericaPueblo Viejo (60%) 6,504 0.864 112 105,890 0.681 1,442 112,394 0.692 1,555 88.1%
1. Zinc is accounted for as a by-product credit against reported or projected gold production costs.

134 � Mineral Reserves and Mineral Resources Barrick Financial Report 2006
Contained Silver Within Reported Gold Resources
For the year ended December 31, 2006 Measured (M) Indicated (I) (M) + (I) Inferred
Tons Grade Ounces Tons Grade Ounces Ounces Tons Grade OuncesBased on attributable ounces (000s) (oz/ton) (000s) (000s) (oz/ton) (000s) (000s) (000s) (oz/ton) (000s)
North AmericaEskay Creek 22 30.41 669 14 45.36 635 1,304 56 8.57 480
Pueblo Viejo (60%) 496 0.37 183 15,820 0.28 4,363 4,546 32,528 0.12 3,981
South AmericaLagunas Norte 808 0.16 126 16,817 0.12 2,027 2,153 767 0.09 70
Pascua-Lama 7,681 0.49 3,793 68,147 0.52 35,685 39,478 12,949 0.87 11,242
Pierina 122 0.27 33 378 0.24 89 122 76 0.08 6
Veladero 543 0.17 91 4,636 0.06 259 350 5,051 7.32 36,983
AfricaBulyanhulu – – – 1,202 0.30 366 366 7,355 0.50 3,708
Total 9,672 0.51 4,895 107,014 0.41 43,424 48,319 58,782 0.96 56,470
Contained Copper Within Reported Gold Resources
For the year ended December 31, 2006 In measured (M) In indicated (I)gold resources gold resources (M) + (I) Inferred
Contained Contained Contained ContainedTons Grade lbs Tons Grade lbs lbs Tons Grade lbs
Based on attributable ounces (000s) (%) (millions) (000s) (%) (millions) (millions) (000s) (%) (millions)
North AmericaPueblo Viejo (60%) 496 0.058 0.6 15,820 0.053 17 17 32,528 0.031 20
South AmericaPascua-Lama 7,681 0.070 10.8 68,147 0.072 99 109 12,949 0.026 6.8
AfricaBuzwagi 15 0.223 0.1 7,204 0.162 23 23 1,153 0.251 6
Total 8,192 0.070 11.5 91,171 0.076 139 150 46,630 0.035 33
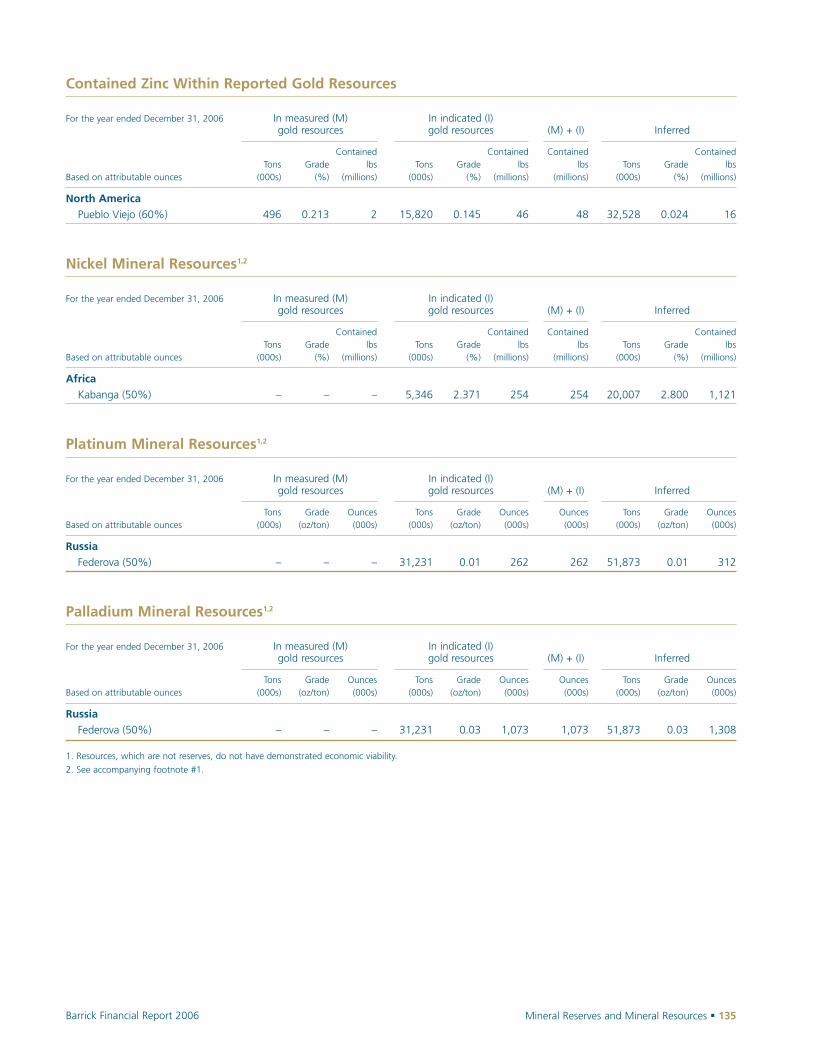
Mineral Reserves and Mineral Resources � 135Barrick Financial Report 2006
Contained Zinc Within Reported Gold Resources
For the year ended December 31, 2006 In measured (M) In indicated (I)gold resources gold resources (M) + (I) Inferred
Contained Contained Contained ContainedTons Grade lbs Tons Grade lbs lbs Tons Grade lbs
Based on attributable ounces (000s) (%) (millions) (000s) (%) (millions) (millions) (000s) (%) (millions)
North AmericaPueblo Viejo (60%) 496 0.213 2 15,820 0.145 46 48 32,528 0.024 16
Nickel Mineral Resources1,2
For the year ended December 31, 2006 In measured (M) In indicated (I)gold resources gold resources (M) + (I) Inferred
Contained Contained Contained ContainedTons Grade lbs Tons Grade lbs lbs Tons Grade lbs
Based on attributable ounces (000s) (%) (millions) (000s) (%) (millions) (millions) (000s) (%) (millions)
AfricaKabanga (50%) – – – 5,346 2.371 254 254 20,007 2.800 1,121
Platinum Mineral Resources1,2
For the year ended December 31, 2006 In measured (M) In indicated (I)gold resources gold resources (M) + (I) Inferred
Tons Grade Ounces Tons Grade Ounces Ounces Tons Grade OuncesBased on attributable ounces (000s) (oz/ton) (000s) (000s) (oz/ton) (000s) (000s) (000s) (oz/ton) (000s)
RussiaFederova (50%) – – – 31,231 0.01 262 262 51,873 0.01 312
Palladium Mineral Resources1,2
For the year ended December 31, 2006 In measured (M) In indicated (I)gold resources gold resources (M) + (I) Inferred
Tons Grade Ounces Tons Grade Ounces Ounces Tons Grade OuncesBased on attributable ounces (000s) (oz/ton) (000s) (000s) (oz/ton) (000s) (000s) (000s) (oz/ton) (000s)
RussiaFederova (50%) – – – 31,231 0.03 1,073 1,073 51,873 0.03 1,308
1. Resources, which are not reserves, do not have demonstrated economic viability.
2. See accompanying footnote #1.

136 � Mineral Reserves and Mineral Resources Barrick Financial Report 2006
Mineral Reserves and Resources Notes
1. Mineral reserves (“reserves”) and mineral resources (“resources”) have been calculated as at December 31, 2006 in accordance with National Instrument 43-101 as required by Canadian securities regulatory authorities. For United States reporting purposes, Industry Guide 7 (under the Securities and Exchange Act of 1934), as interpreted by Staff of the SEC, applies different standards in order to classify mineralization as a reserve. Accordingly, for U.S. reporting purposes, 1.88 mil-lion ounces of the Cortez reserve, Buzwagi and Pueblo Viejo are classified as mineralized material. In addition, while the terms “measured”, “indicated” and“inferred” mineral resources are required pursuant to National Instrument 43-101, the U.S. Securities and Exchange Commission does not recognize such terms.Canadian standards differ significantly from the requirements of the U.S. Securities and Exchange Commission, and mineral resource information contained hereinis not comparable to similar information regarding mineral reserves disclosed in accordance with the requirements of the U.S. Securities and ExchangeCommission. U.S. investors should understand that “inferred” mineral resources have a great amount of uncertainty as to their existence and great uncertaintyas to their economic and legal feasibility. In addition, U.S. investors are cautioned not to assume that any part or all of Barrick’s mineral resources constitute orwill be converted into reserves. Calculations have been prepared by employees of Barrick, its joint venture partners or its joint venture operating companies, asapplicable, under the supervision of Jacques McMullen, Vice President, Metallurgy and Process Development of Barrick, Rick Allan, Director – Engineering andMining Support of Barrick, and Rick Sims, Manager Corporate Reserves of Barrick. Reserves have been calculated using an assumed long-term average gold priceof $US 475 ($Aus. 640) per ounce, a silver price of $US 8.50 per ounce, a copper price of $US 1.50 per pound and exchange rates of $1.21 $Can/$US and $0.74$US/$Aus. Reserves at the Kalgoorlie property assumed a gold price of $US 500 ($Aus. 675). Copper reserves at the Osborne property assumed a copper priceof $US 1.75 per pound. Reserve calculations incorporate current and/or expected mine plans and cost levels at each property. Varying cut-off grades have beenused depending on the mine and type of ore contained in the reserves. Barrick’s normal data verification procedures have been employed in connection with thecalculations. Resources as at December 31, 2006 have been estimated using varying cut-off grades, depending on both the type of mine or project, its maturityand ore types at each property. For a breakdown of reserves and resources by category and for a more detailed description of the key assumptions, parametersand methods used in calculating Barrick’s reserves and resources, see Barrick’s most recent Annual Information Form/Form 40-F on file with Canadian provincialsecurities regulatory authorities and the U.S. Securities and Exchange Commission.
2. Gold and copper resource estimates for Reko Diq have been prepared by employees and consultants of Tethyan Copper Company Limited (“Tethyan”) in accor-dance with the JORC Code. For additional information related to Reko Diq resources reported by Tethyan, including related assumptions, see Tethyan’s pressrelease dated January 11, 2006 and its 2005 Fourth Quarter Report. Such resource estimates have been reviewed by Jacques McMullen, Vice President, Metallurgyand Process Development of Barrick, Rick Allan, Director – Engineering and Mining Support of Barrick, and Rick Sims, Manager Corporate Reserves of Barrick.The inferred and indicated mineral resource amounts reported under the JORC Code are substantially similar to the inferred and indicated mineral resourceamounts that would be reported in accordance with National Instrument 43-101.
3. 2005 “Other” resources have been restated to reflect the sale of the Jeronimo deposit in 2006, representing 559,000 ounces in 2005, and the separate presen-tation of the South Arturo deposit, representing 158,000 ounces in 2005.

Corporate Governance and Committees of the Board � 137Barrick Financial Report 2006
Corporate Governance andCommittees of the Board
should manage its affairs and perform its responsibilities.Barrick has also adopted a Code of Business Conduct and Ethics that is applicable to all directors, officers andemployees of Barrick. In conjunction with the adoption ofthe Code, Barrick established a toll-free compliance hotlineto allow for anonymous reporting of any suspected Codeviolations, including concerns regarding accounting, inter-nal accounting controls or other auditing matters. A copy ofthe Corporate Governance Guidelines, the Code of BusinessConduct and Ethics and the mandates of the Board ofDirectors and each of the Committees of the Board, includ-ing the Audit Committee, the Compensation Committeeand the Corporate Governance and Nominating Committee,is posted on Barrick’s website at www.barrick.com and isavailable in print from the Company to any shareholderupon request.
Corporate Governance
Over the past several years, there has been an increasedfocus on corporate governance in both the United Statesand Canada. Among other regulatory initiatives, the New York Stock Exchange added corporate governancestandards to its listing rules. Although, as a regulatory matter, the vast majority of the NYSE corporate gover-nance standards are not directly applicable to Barrick as a Canadian company, Barrick has implemented a numberof structures and procedures to comply with the NYSEstandards. There are no significant differences betweenBarrick’s corporate governance practices and the NYSEstandards applicable to U.S. companies.
The Board of Directors has approved a set of CorporateGovernance Guidelines to promote the effective functioningof the Board of Directors and its Committees and to setforth a common set of expectations as to how the Board
Audit Committee(S.J. Shapiro, D.J. Carty, P.A. Crossgrove, J.W. Crow)Reviews the Company’s financial statements and manage-ment’s discussion and analysis of financial and operatingresults, and assists the Board in its oversight of the integrity ofBarrick’s financial statements and other relevant public disclo-sures, the Company’s compliance with legal and regulatoryrequirements relating to financial reporting, the external audi-tors’ qualifications and independence, and the performance ofthe internal and external auditors.
Compensation Committee(P.C. Godsoe, M.A. Cohen, J.B. Harvey, J.L. Rotman)Assists the Board in monitoring, reviewing and approvingBarrick’s compensation policies and practices, and adminis-tering Barrick’s share compensation plans. The Committeeis responsible for reviewing and recommending directorand senior management compensation and for successionplanning with respect to senior executives.
Corporate Governance and Nominating Committee(M.A. Cohen, R.M. Franklin, P.C. Godsoe, S.J. Shapiro)Assists the Board in establishing Barrick’s corporate gover-nance policies and practices. The Committee also identifiesindividuals qualified to become members of the Board, andreviews the composition and functioning of the Board andits Committees.
Environmental, Health and Safety Committee(P.A. Crossgrove, C.W.D. Birchall, R.M. Franklin, J.B. Harvey)Reviews environmental and health and safety policies andprograms, oversees the Company’s environmental andhealth and safety performance, and monitors current andfuture regulatory issues.
Finance Committee(C.W.D. Birchall, J.W. Crow, A. Munk, G.C. Wilkins)Reviews the Company’s investment strategies, hedging program and general debt and equity structure.
Committees of the Board

138 � Shareholder Information Barrick Financial Report 2006138 � Shareholder Information Barrick Financial Report 2006
Shareholder Information
Barrick shares are traded on:Toronto and New York Stock Exchanges – ABXLondon Stock Exchange – BGD
Number of Registered Shareholders19,830
Index ListingsS&P/TSX Composite IndexS&P/TSX 60 IndexS&P Global 1200 IndexS&P Global Gold IndexPhiladelphia Gold/Silver IndexCBOE Gold IndexAMEX Gold Miners Index
2006 Dividend Per ShareUS$0.22
Common Shares
(millions)
Outstanding at December 31, 2006 864*
Weighted average 2006Basic 842*Fully diluted 855*
The Company’s shares were split on a two-for-one basis in 1987, 1989 and 1993.
* Includes shares issuable upon conversion of Barrick Gold Inc. exchangeable shares.
Volume of Shares Traded
(millions) 2006 2005
TSX 699 418NYSE 827 459
Closing Price of SharesDecember 31, 2006
TSX C$35.85NYSE US$30.70
Share Trading Information
New York Stock Exchange
Share Volume(millions) High Low
Quarter 2006 2005 2006 2005 2006 2005
First 234 88 US$32.14 US$26.32 US$25.13 US$21.27Second 238 93 35.93 25.90 26.70 21.09Third 176 115 34.47 29.95 27.61 23.35Fourth 179 163 31.63 29.12 27.64 24.58
827 459
Toronto Stock Exchange
Share Volume(millions) High Low
Quarter 2006 2005 2006 2005 2006 2005
First 216 90 C$37.22 C$31.71 C$29.25 C$26.54Second 180 85 39.69 31.80 29.68 26.80Third 146 104 38.11 35.05 31.33 28.55Fourth 157 140 36.08 34.01 31.15 28.96
699 419

Shareholder Information � 139Barrick Financial Report 2006Barrick Financial Report 2006
Dividend PaymentsIn 2006, the Company paid a cash dividend of $0.22 per share – $0.11 on June 15 and December 15. A cash dividend of$0.22 per share was paid in 2005 – $0.11 on June 15 and $0.11 on December 15.
Dividend PolicyThe Board of Directors reviews the dividend policy semi-annually based on the cash requirements of the Company’soperating assets, exploration and development activities,as well as potential acquisitions, combined with the current and projected financial position of the Company.
Form 40-FThe Company’s Annual Report on Form 40-F is filed with the United States Securities and Exchange Commission.The Company’s most recently filed Form 40-F included asexhibits the certifications of our Chief Executive Officer andChief Financial Officer as required by Sections 302 and 90b of the United States Sarbanes-Oxley Act of 2002. This report is available on Barrick’s website www.barrick.com and will be made available to shareholders, without charge, uponwritten request to the Secretary of the Company at theCorporate Office.
Other Language ReportsFrench and Spanish versions of this annual report are available from Investor Relations at the Corporate Office and on Barrick’s website www.barrick.com.
Shareholder ContactsShareholders are welcome to contact the Company forinformation or questions concerning their shares. For generalinformation on the Company, contact the Investor RelationsDepartment. For information on such matters as sharetransfers, dividend cheques and change of address, inquiriesshould be directed to the Transfer Agents.
Transfer Agents and RegistrarsCIBC Mellon Trust CompanyP.O. Box 7010Adelaide Street Postal StationToronto, Ontario M5C 2W9Telephone: (416) 643-5500Toll-free within the United States and Canada:1-800-387-0825Fax: 416-643-5501Email: [email protected] site: www.cibcmellon.com
Mellon Investor Services, L.L.C.480 Washington Boulevard 27th FloorJersey City, NJ 07310Telephone: (201) 680-3748Fax: (201) 680-4665Email: [email protected]: www.melloninvestor.com
AuditorsPricewaterhouseCoopers LLPToronto, Canada
Annual and Special MeetingThe Annual and Special Meeting of Shareholders will be held on Wednesday, May 2, 2007 at 10:00 a.m. in the John Bassett Theatre,Metro Toronto Convention Centre,255 Front Street West, Lower Level,Toronto, Canada.
140 � Board of Directors and Senior Officers Barrick Financial Report 2006
Board of Directors andSenior Officers
Board of Directors
Howard L. Beck, Q.C.Toronto, OntarioCorporate Director
C.William D. BirchallToronto, OntarioVice Chairman,
Barrick Gold Corporation
Donald J. Carty, O.C.Dallas, TexasVice Chairman and
Chief Financial Officer,
Dell, Inc.
Gustavo CisnerosCaracas, VenezuelaChairman and
Chief Executive Officer,
Cisneros Group of Companies
Marshall A. Cohen, O.C.Toronto, OntarioCounsel,
Cassels Brock & Blackwell LLP
Peter A. Crossgrove, O.C.Toronto, OntarioCorporate Director
John W. CrowToronto, OntarioPresident, J&R Crow Inc.
Robert M. FranklinToronto, OntarioPresident, Signalta Capital
Corporation
Peter C. Godsoe, O.C.Toronto, OntarioCorporate Director
J. Brett HarveyVenetia, PennsylvaniaPresident, Chief Executive
Officer and Director,
CONSOL Energy Inc.
The Right HonourableBrian Mulroney, P.C.,C.C., LL.D.Montreal, QuebecSenior Partner, Ogilvy Renault
Anthony MunkNew York, New YorkManaging Director,
Onex Investment Corp.
Peter Munk, O.C.Toronto, OntarioFounder and Chairman,
Barrick Gold Corporation
Joseph L. Rotman, O.C.Toronto, OntarioChairman,
Roy-L Capital Corporation
Steven J. ShapiroHouston, TexasCorporate Director
Gregory C. WilkinsToronto, OntarioPresident and
Chief Executive Officer,
Barrick Gold Corporation
Senior Officers
Peter MunkFounder and Chairman
C. William D. BirchallVice Chairman
Gregory C. WilkinsPresident and Chief Executive Officer
Alexander J. DavidsonExecutive Vice President,Exploration and Corporate Development
Gordon F. FifeExecutive Vice President,Organizational Effectiveness
Patrick J. GarverExecutive Vice President and General Counsel
Peter J. KinverExecutive Vice President and Chief Operating Officer
Jamie C. SokalskyExecutive Vice President and Chief Financial Officer
Vincent BorgSenior Vice President,Corporate Communications
Kelvin DushniskySenior Vice President,Corporate Affairs
International Advisory Board
The International Advisory Board was established to provide advice to Barrick’s Board of Directors and management as the Companyexpands internationally.
Chairman
The Right HonourableBrian MulroneyFormer Prime Minister of Canada
Members
Gustavo CisnerosVenezuela
Secretary William S. CohenUnited States
The Honourable Paul G. Desmarais, Sr.Canada
Vernon E. Jordan, Jr.United States
Andrónico LuksicChile
Angus A. MacNaughtonUnited States
Peter MunkCanada
Karl Otto PöhlGermany
Lord Charles Powell ofBayswater KCMGUnited Kingdom
The Honourable Nathaniel RothschildUnited Kingdom
The Honorable Andrew YoungUnited States


![Global standards used locally worldwide - ISO...ST RK ISO 15590-2:2007 (ISO 15590-2:2003, IDT) EN 14870-2:2004 [ISO 15590-2:2003 modified] GSO ISO 15590-2:2008 ISO 15590-3:2004 ed.](https://static.documents.pub/doc/80x56/5fdcf8b6fe47d56bc17cc8c9/global-standards-used-locally-worldwide-iso-st-rk-iso-15590-22007-iso-15590-22003.jpg)


