56
159.410/710 User ~ 2 ~ 159.410/710 User Interface Design © Paul Lyons 2010
| Date post: | 28-Dec-2015 |
| Category: |
Documents |
| Upload: | julie-gilmore |
| View: | 232 times |
| Download: | 1 times |
159.410/710 User Interface Design~ 2 ~
159.410/710 User Interface Design
© Paul Lyons 2010
159.410/710 User Interface Design~ 3 ~ 159.410/710 User Interface Design~ 3 ~
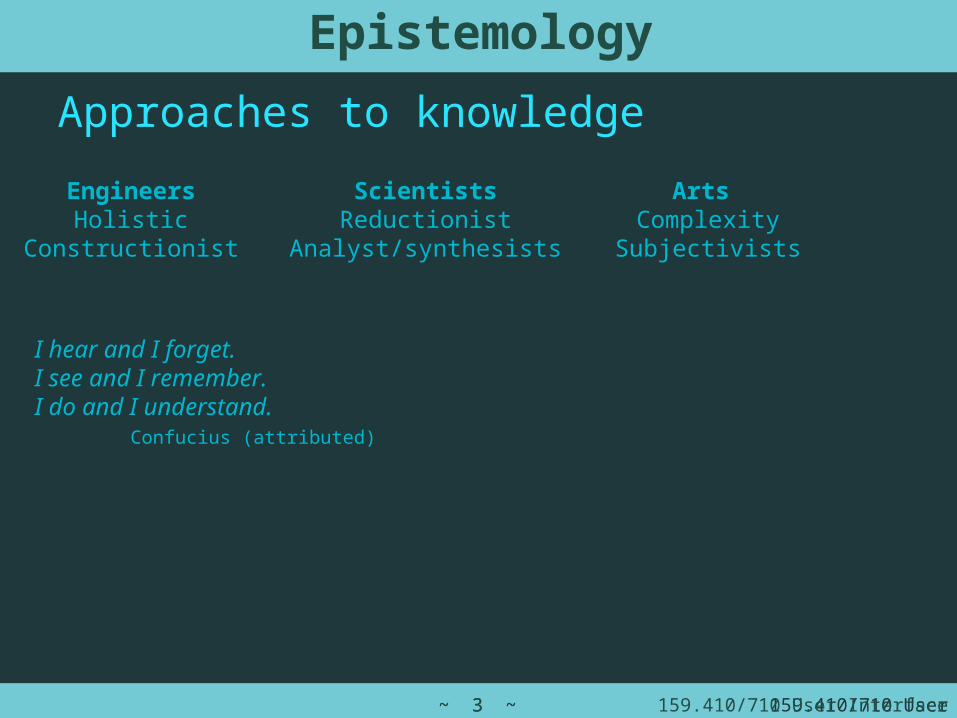
EngineersHolistic
Constructionist
ScientistsReductionist
Analyst/synthesists
Arts Complexity
Subjectivists
Epistemology
I hear and I forget. I see and I remember. I do and I understand.
Confucius (attributed)
Approaches to knowledge
159.410/710 User Interface Design~ 4 ~ 159.410/710 User Interface Design~ 4 ~
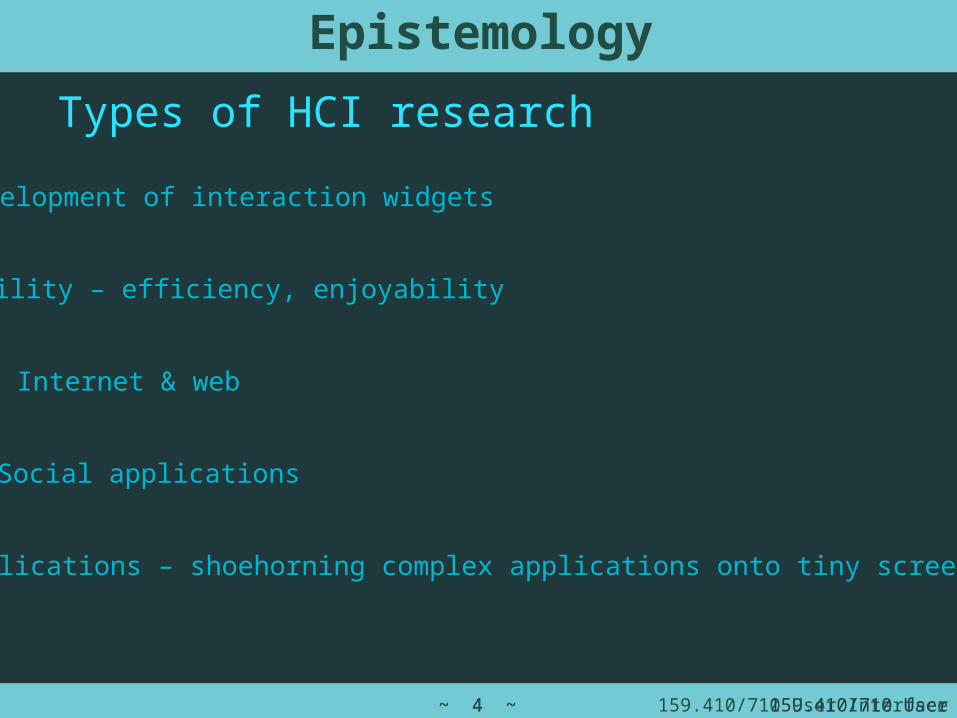
Types of HCI research
Development of interaction widgets
Usability – efficiency, enjoyability
Internet & web
Social applications
Mobile applications – shoehorning complex applications onto tiny screens
Epistemology
159.410/710 User Interface Design~ 5 ~ 159.410/710 User Interface Design~ 5 ~
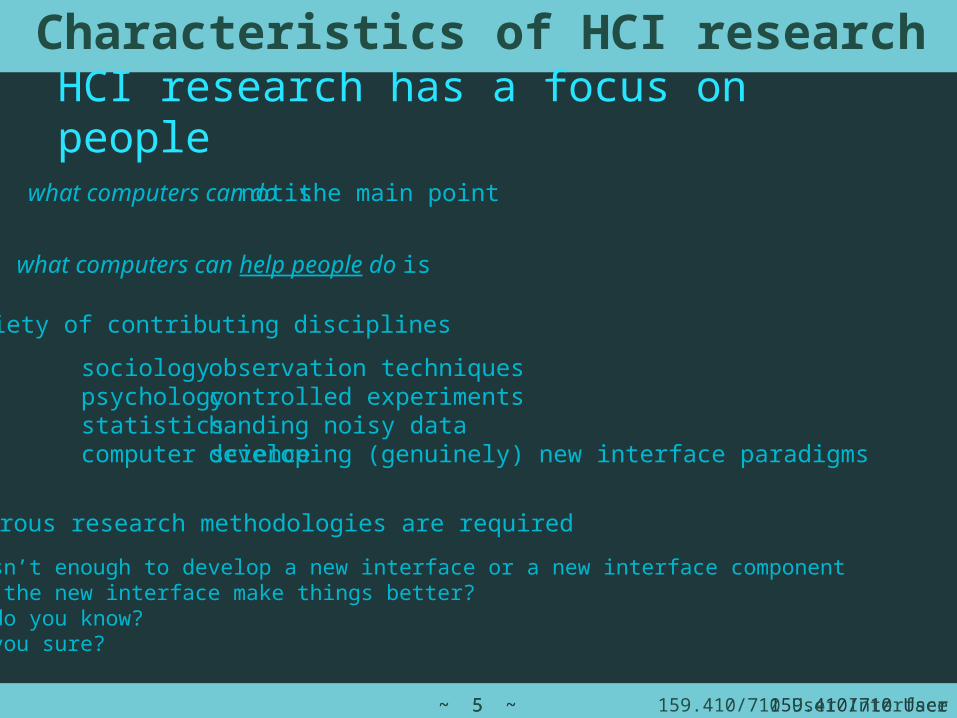
HCI research has a focus on people
Characteristics of HCI research
what computers can do is
what computers can help people do is
sociology psychologystatisticscomputer science
rigorous research methodologies are required
it isn’t enough to develop a new interface or a new interface componentdoes the new interface make things better?how do you know?are you sure?
observation techniquescontrolled experimentshanding noisy datadeveloping (genuinely) new interface paradigms
not the main point
variety of contributing disciplines
159.410/710 User Interface Design~ 6 ~ 159.410/710 User Interface Design~ 6 ~
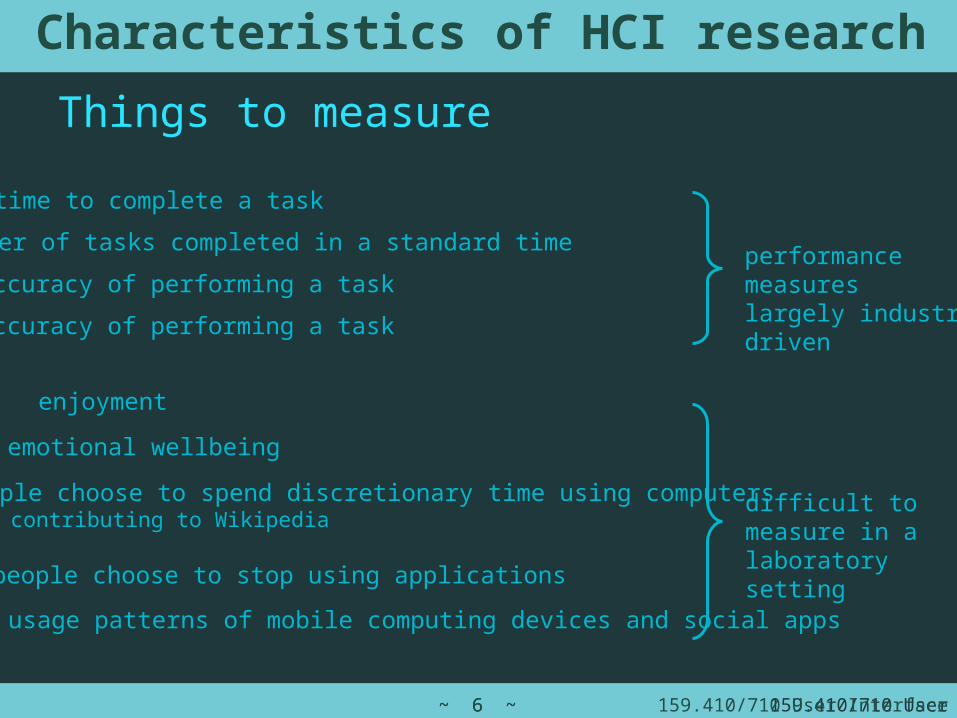
Things to measure
Characteristics of HCI research
time to complete a task
number of tasks completed in a standard time
accuracy of performing a task
accuracy of performing a task
performance measureslargely industry-driven
enjoyment
emotional wellbeing
why people choose to spend discretionary time using computerse.g. contributing to Wikipedia
why people choose to stop using applications
people’s usage patterns of mobile computing devices and social apps
difficult to measure in a laboratory setting
159.410/710 User Interface Design~ 7 ~ 159.410/710 User Interface Design~ 7 ~
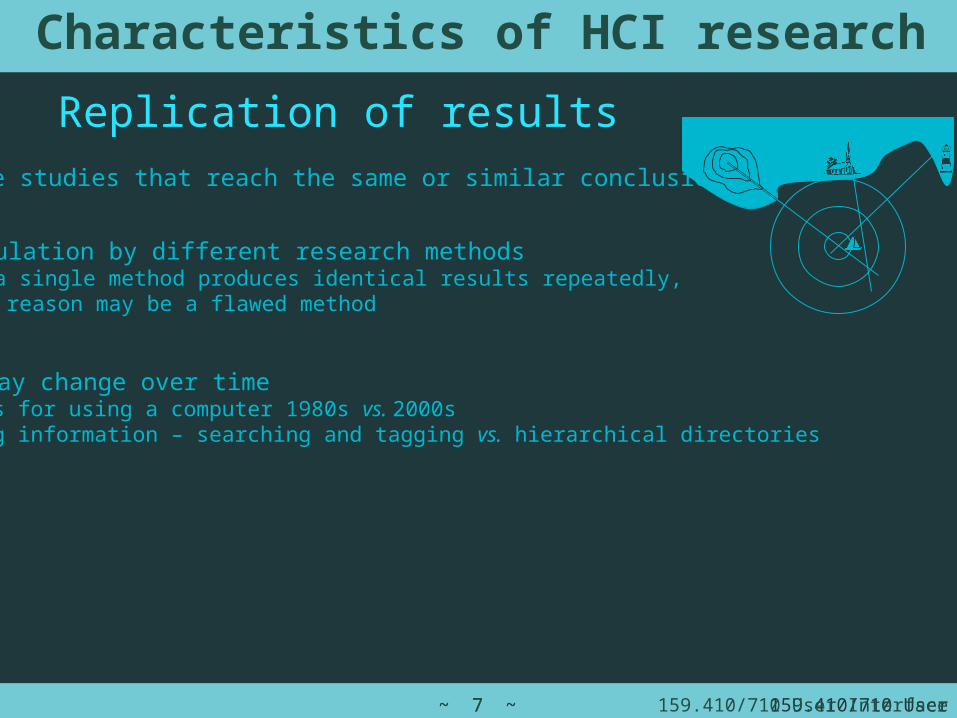
Replication of resultsMultiple studies that reach the same or similar conclusion
Triangulation by different research methodsif a single method produces identical results repeatedly,the reason may be a flawed method
Characteristics of HCI research
Results may change over timereasons for using a computer 1980s vs. 2000sfinding information – searching and tagging vs. hierarchical directories

159.410/710 User Interface Design~ 8 ~ 159.410/710 User Interface Design~ 8 ~
Tradeoffs
Characteristics of HCI research
speed vs accuracy (Fitt’s Law)
better interface vs. familiar interface
more efficient keyboard vs. QWERTY keyboard
iPad is cool and newit’s the coolth that persuades people to adopt ithow do you measure that?
security vs. usabilityeye-scans and fingerprints?
a revolutionary, undeniably better computer vs. environmental costs of computer disposal
159.410/710 User Interface Design~ 9 ~ 159.410/710 User Interface Design~ 9 ~
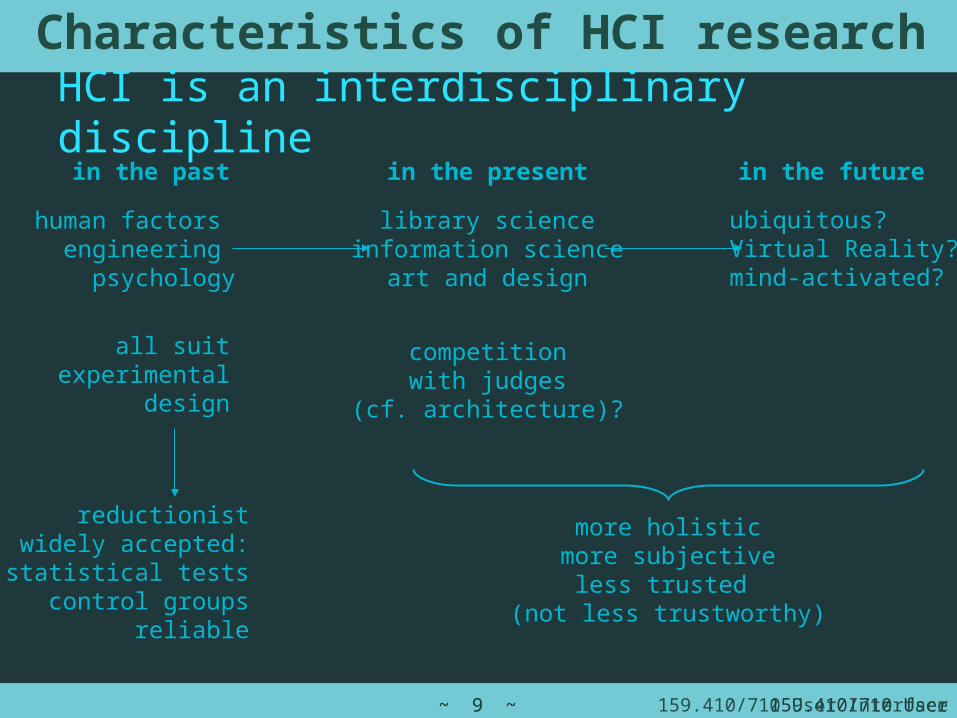
HCI is an interdisciplinary discipline
Characteristics of HCI research
human factors engineering psychology
library scienceinformation science
art and design
in the past in the present in the future
ubiquitous?Virtual Reality?mind-activated?
all suitexperimental
design
competitionwith judges
(cf. architecture)?
reductionistwidely accepted:
statistical testscontrol groups
reliable
more holisticmore subjective
less trusted (not less trustworthy)

159.410/710 User Interface Design~ 10 ~ 159.410/710 User Interface Design~ 10 ~
generative
prescriptive
predictive
explanatory
descriptive
Types of model
Epistemology
generalisations about the data – allow us to see order amidst chaos
explain what causes the data that have been observed
allow us to plan for the future
suggest ways of building things (e.g. patterns)
produce principles and guidelines or actual systems (e.g. Colour Harmoniser)
159.410/710 User Interface Design~ 11 ~ 159.410/710 User Interface Design~ 11 ~
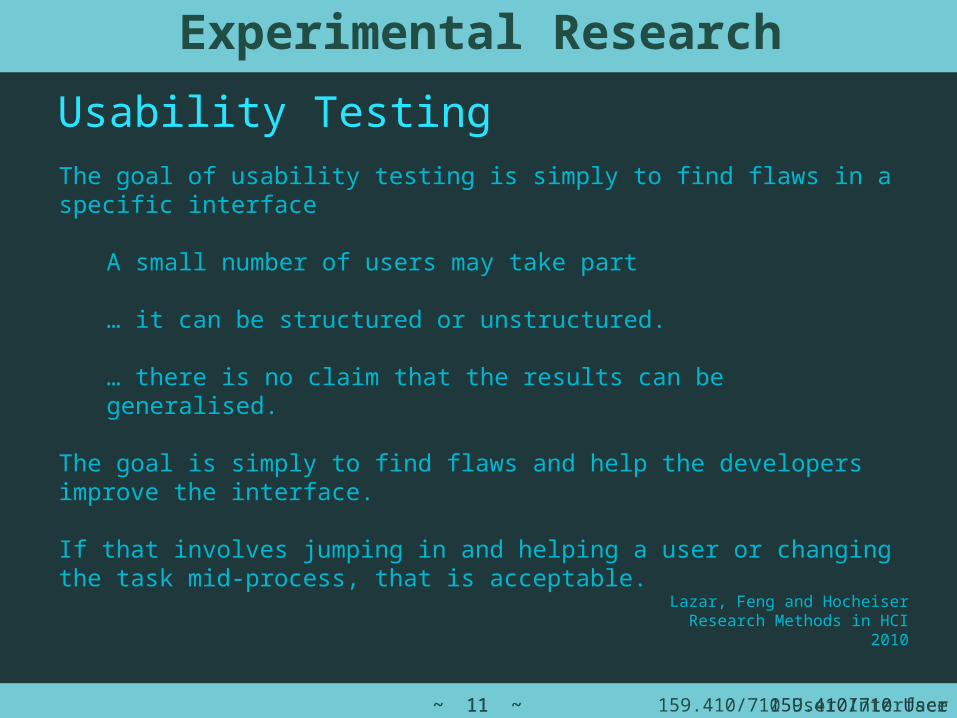
Usability TestingThe goal of usability testing is simply to find flaws in a specific interface
A small number of users may take part
… it can be structured or unstructured.
… there is no claim that the results can be generalised.
The goal is simply to find flaws and help the developers improve the interface.
If that involves jumping in and helping a user or changing the task mid-process, that is acceptable.Lazar, Feng and Hocheiser
Research Methods in HCI2010
Experimental Research
159.410/710 User Interface Design~ 12 ~ 159.410/710 User Interface Design~ 12 ~
HCI research – 57 varieties
Experimental Research
observationsfield studiessurveysusability studiesinterviewsfocus groupscontrolled experiments
rich, not reproducible
reproducible, reductionist
descriptive research; observations – may be quantitative and accurate
relational research; establishes correlations between factors – does not establish causalitytyping speed correlated with hours spent gamingdoes time spent gaming improve typing?are good typists successful gamers?
experimental research; can establish causalityallocate users to two groups randomlyexpose one group to games, the other notmeasure typing ability of groups after a suitable interval
159.410/710 User Interface Design~ 13 ~ 159.410/710 User Interface Design~ 13 ~
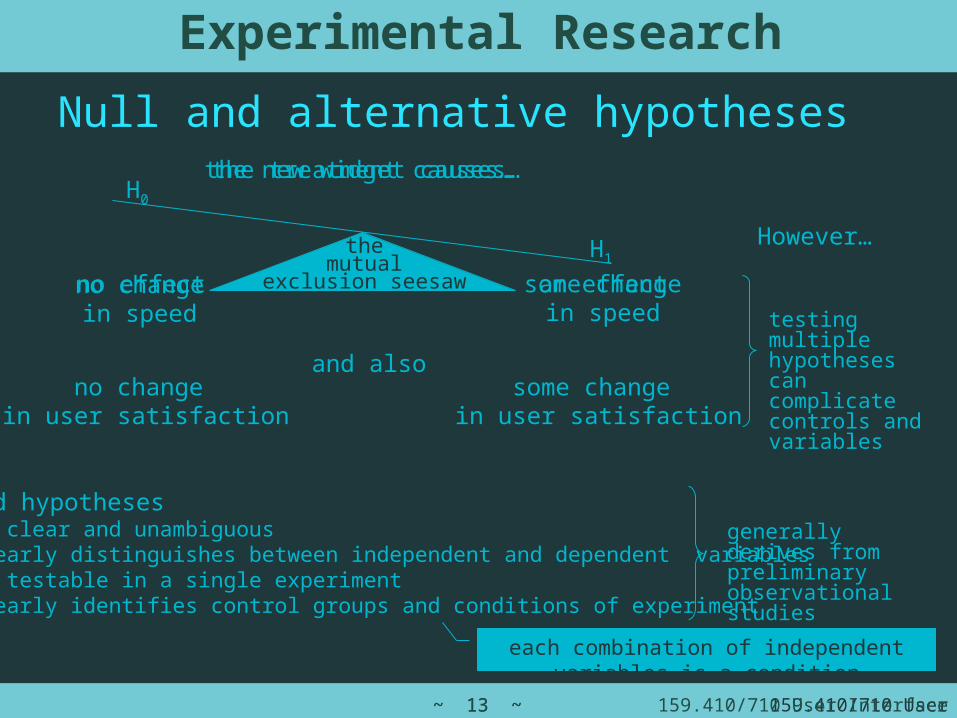
Null and alternative hypotheses
Experimental Research
H0
H1
no effect an effect
the treatment causes…
themutual
exclusion seesaw
the new widget causes…
no changein speed
some changein speed
no change in user satisfaction
some change in user satisfaction
testing multiplehypothesescan complicate controls and variables
a good hypothesesis clear and unambiguousclearly distinguishes between independent and dependent variablesis testable in a single experimentclearly identifies control groups and conditions of experiment
generally derives from preliminary observational studies
and also
However…
each combination of independent variables is a condition
159.410/710 User Interface Design~ 14 ~ 159.410/710 User Interface Design~ 14 ~
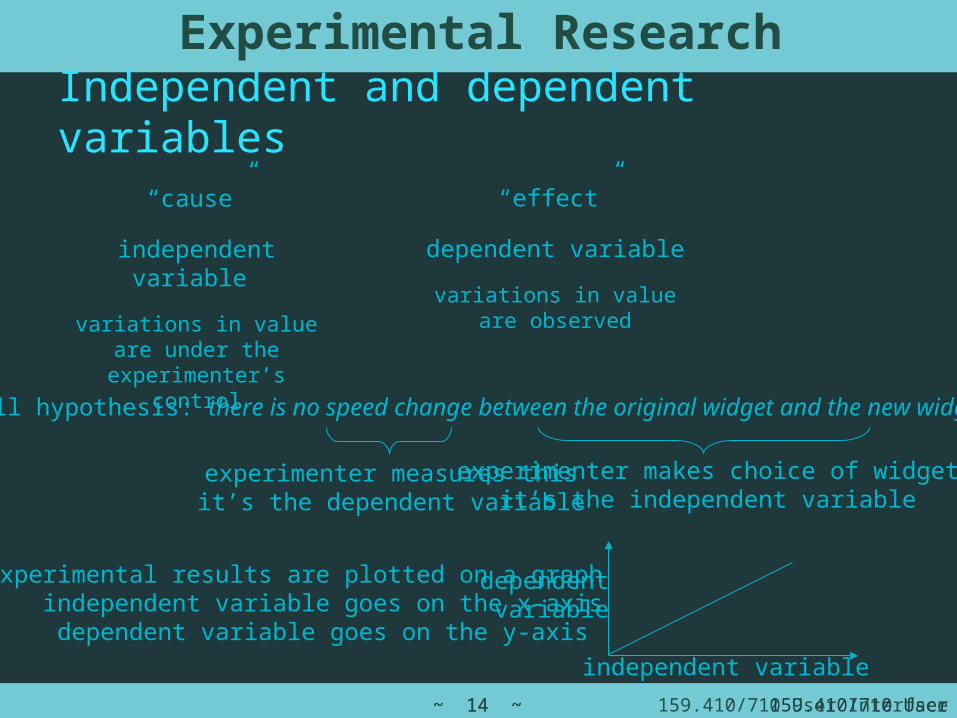
Independent and dependent variables
Experimental Research
independent variable
variations in value are under the experimenter’s control
dependent variable
variations in value are observed
“cause” “effect”
Null hypothesis: there is no speed change between the original widget and the new widget
experimenter makes choice of widgetit’s the independent variable
experimenter measures thisit’s the dependent variable
independent variable
if the experimental results are plotted on a graphindependent variable goes on the x-axisdependent variable goes on the y-axis
dependentvariable
159.410/710 User Interface Design~ 15 ~ 159.410/710 User Interface Design~ 15 ~
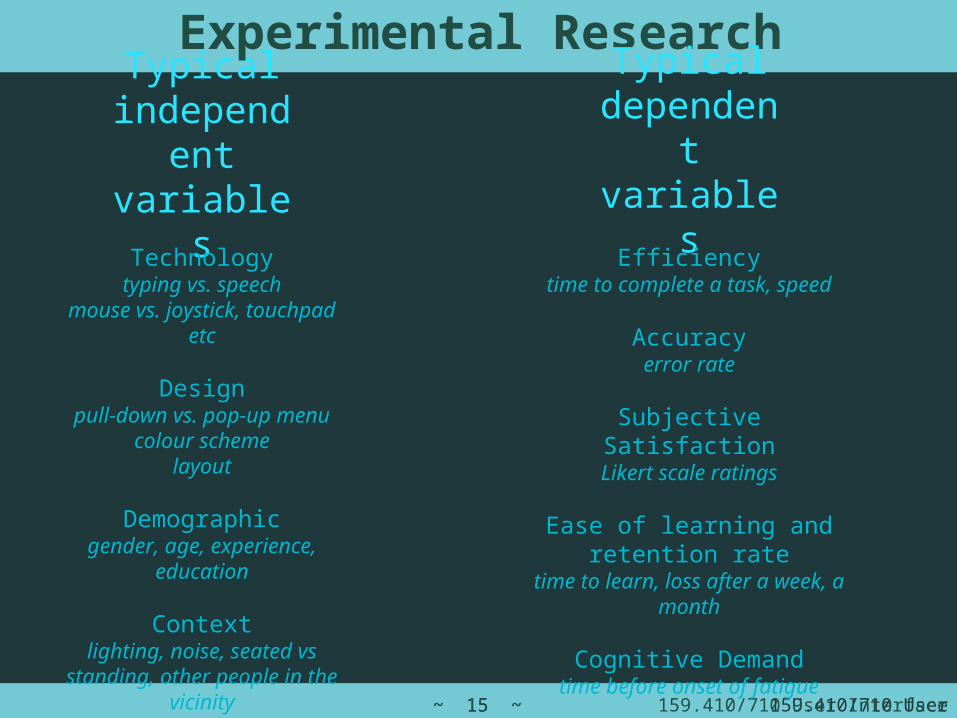
Typicalindependent
variables
Experimental Research
Typicaldependentvariables
Technologytyping vs. speech
mouse vs. joystick, touchpad etc
Designpull-down vs. pop-up menu
colour schemelayout
Demographicgender, age, experience,
education
Contextlighting, noise, seated vs standing,
other people in the vicinity
Efficiencytime to complete a task, speed
Accuracyerror rate
Subjective SatisfactionLikert scale ratings
Ease of learning and retention ratetime to learn, loss after a week, a month
Cognitive Demandtime before onset of fatigue
159.410/710 User Interface Design~ 16 ~ 159.410/710 User Interface Design~ 16 ~
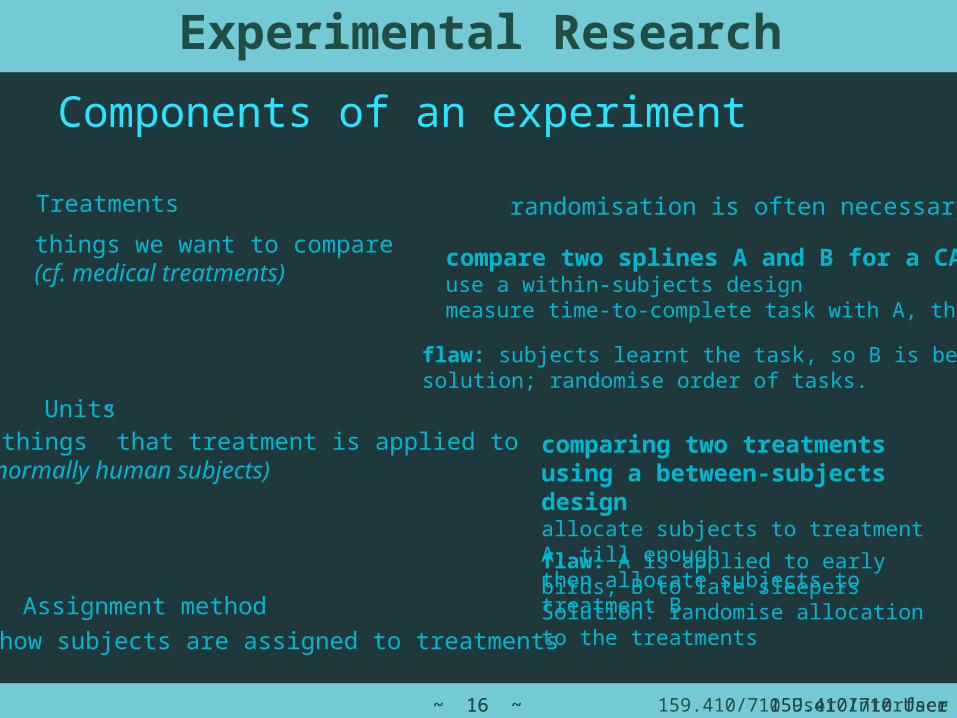
Components of an experiment
Experimental Research
Treatments
things we want to compare (cf. medical treatments)
Units“things” that treatment is applied to(normally human subjects)
Assignment methodhow subjects are assigned to treatments
randomisation is often necessary
compare two splines A and B for a CAD tooluse a within-subjects designmeasure time-to-complete task with A, then B
flaw: subjects learnt the task, so B is bestsolution; randomise order of tasks.
comparing two treatments using a between-subjects designallocate subjects to treatment A, till enoughthen allocate subjects to treatment B
flaw: A is applied to early birds, B to late sleepersSolution: randomise allocation to the treatments
159.410/710 User Interface Design~ 17 ~ 159.410/710 User Interface Design~ 17 ~
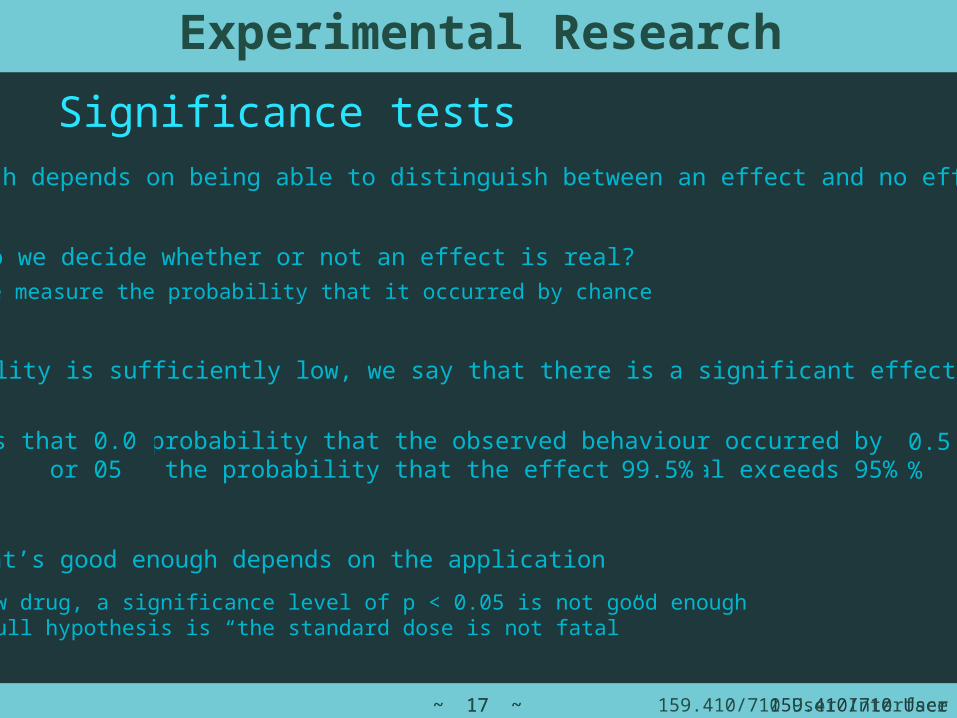
Significance tests
Experimental Research
how do we decide whether or not an effect is real?we measure the probability that it occurred by chance
this approach depends on being able to distinguish between an effect and no effect
if that probability is sufficiently low, we say that there is a significant effect.
p < 0.05 says that the probability that the observed behaviour occurred by chance is less than 5% or that the probability that the effect is real exceeds 95%
whether that’s good enough depends on the application
for a new drug, a significance level of p < 0.05 is not good enough if the null hypothesis is “the standard dose is not fatal”
0.005 0.5%99.5%
159.410/710 User Interface Design~ 18 ~ 159.410/710 User Interface Design~ 18 ~
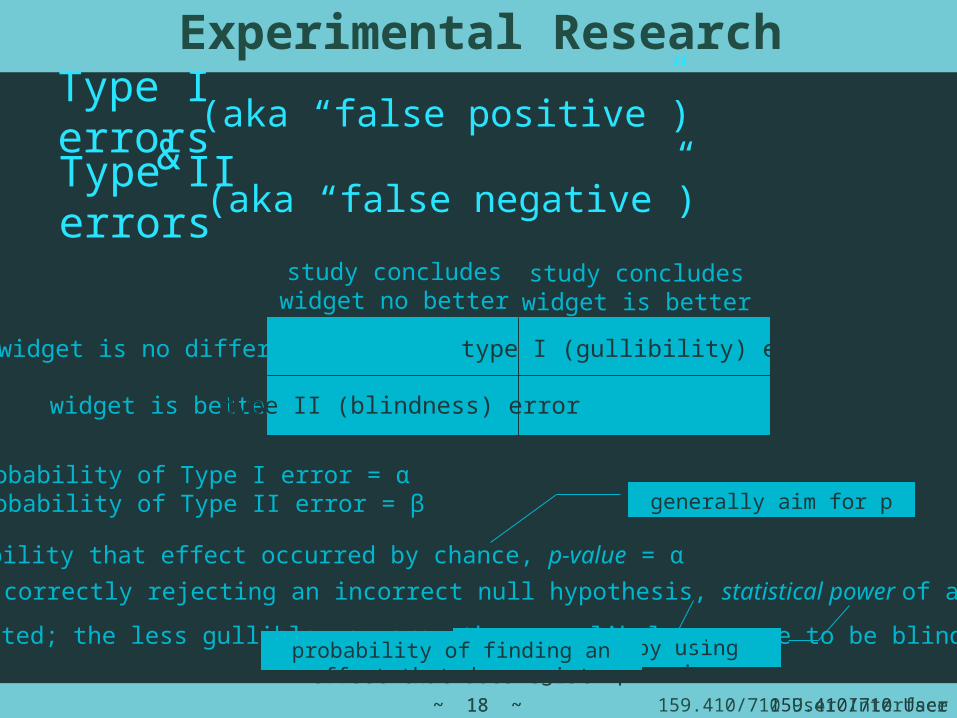
Type I errors
Experimental Research
&Type II errors
(aka “false positive”)
(aka “false negative”)
widget is no different
widget is better
study concludeswidget no better
study concludeswidget is better
type I (gullibility) error
type II (blindness) error
probability of Type I error = αprobability of Type II error = β
probability of correctly rejecting an incorrect null hypothesis, statistical power of a test = 1- β
probability that effect occurred by chance, p-value = α
generally aim for p < 0.05
keep β low by using large sample sizesα and β are related; the less gullible you are, the more likely you are to be blind to improvements probability of finding an effect that does exist
159.410/710 User Interface Design~ 19 ~ 159.410/710 User Interface Design~ 19 ~
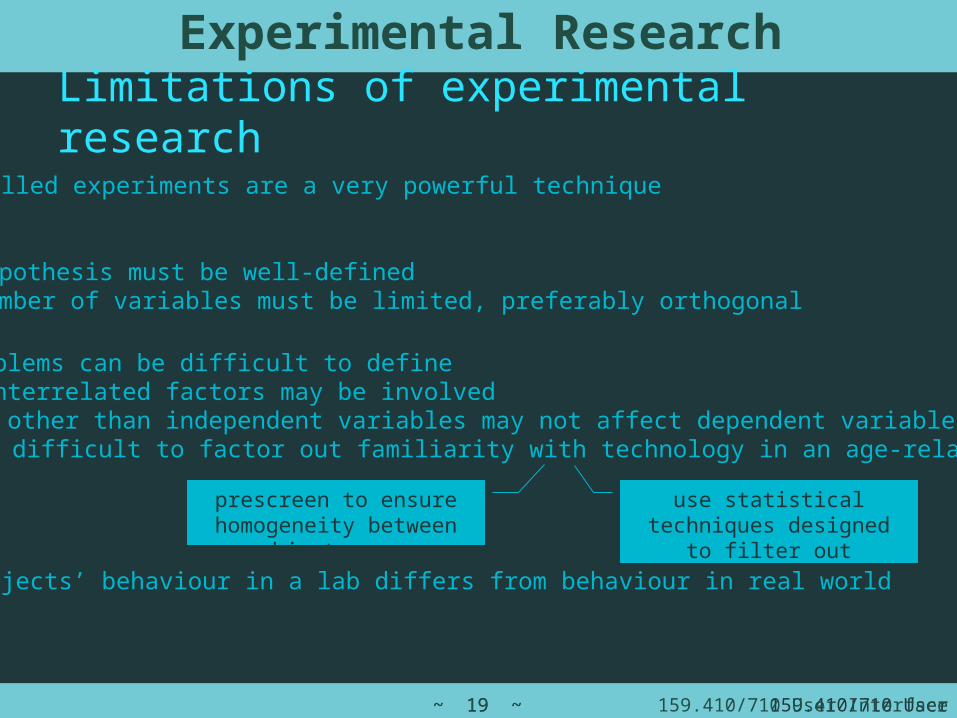
Limitations of experimental research
Experimental Research
controlled experiments are a very powerful technique
but hypothesis must be well-definednumber of variables must be limited, preferably orthogonal
HCI problems can be difficult to definemany, interrelated factors may be involvedfactors other than independent variables may not affect dependent variables
e.g. difficult to factor out familiarity with technology in an age-related study
prescreen to ensure homogeneity between subject groups
use statistical techniques designed to filter out confounding factors
(analysis of covariables)subjects’ behaviour in a lab differs from behaviour in real world
159.410/710 User Interface Design~ 20 ~
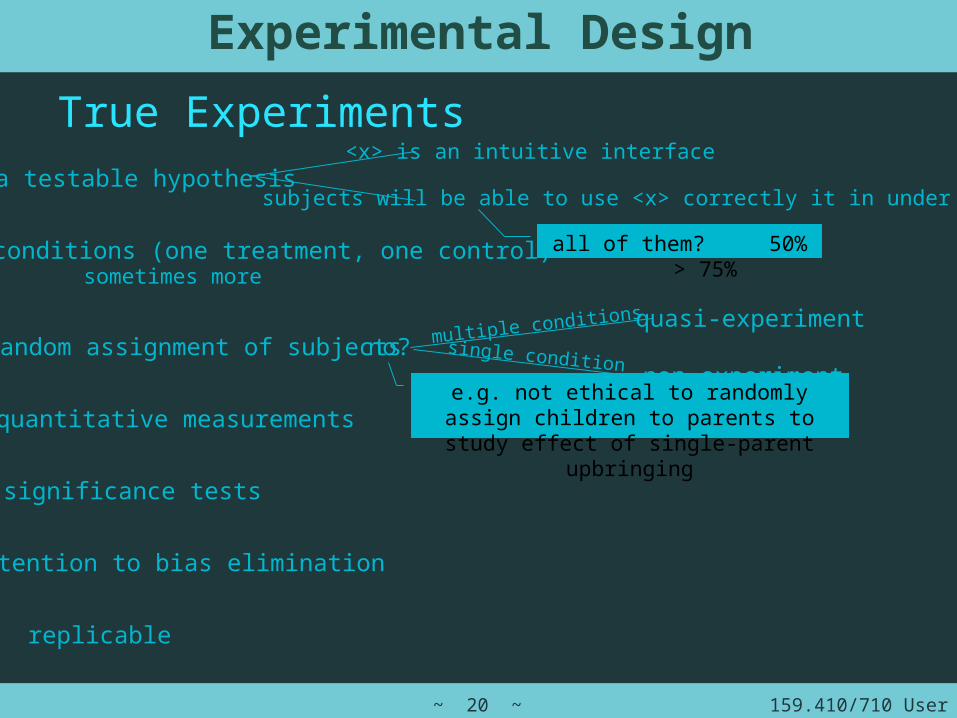
True Experiments
Experimental Design
a testable hypothesis
two conditions (one treatment, one control)sometimes more
quantitative measurements
significance tests
attention to bias elimination
replicable
subjects will be able to use <x> correctly it in under 1 minute
<x> is an intuitive interface
all of them? 50% > 75%
random assignment of subjects no?quasi-experimentmultiple conditions
non-experimentsingle condition
e.g. not ethical to randomly assign children to parents to study effect of single-parent upbringing
159.410/710 User Interface Design~ 21 ~
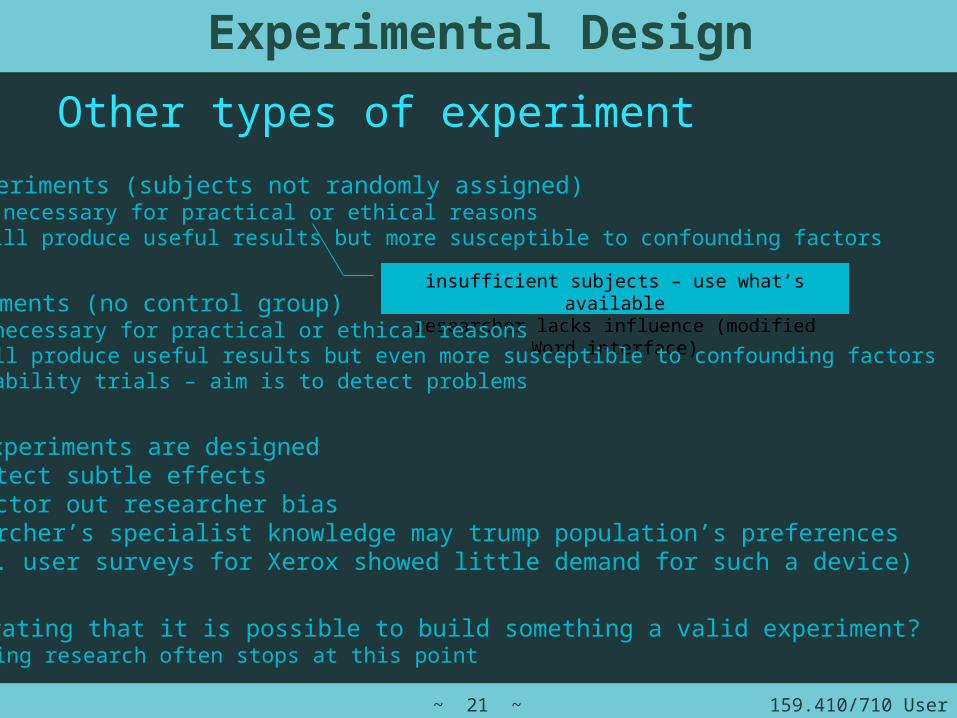
Other types of experiment
Experimental Design
quasi-experiments (subjects not randomly assigned)may be necessary for practical or ethical reasonscan still produce useful results but more susceptible to confounding factors
insufficient subjects – use what’s availableresearcher lacks influence (modified Word interface)non-experiments (no control group)
may be necessary for practical or ethical reasonscan still produce useful results but even more susceptible to confounding factorse.g. usability trials – aim is to detect problems
formal experiments are designed to detect subtle effectsto factor out researcher biasresearcher’s specialist knowledge may trump population’s preferences (e.g. user surveys for Xerox showed little demand for such a device)
is demonstrating that it is possible to build something a valid experiment?engineering research often stops at this point
159.410/710 User Interface Design~ 22 ~
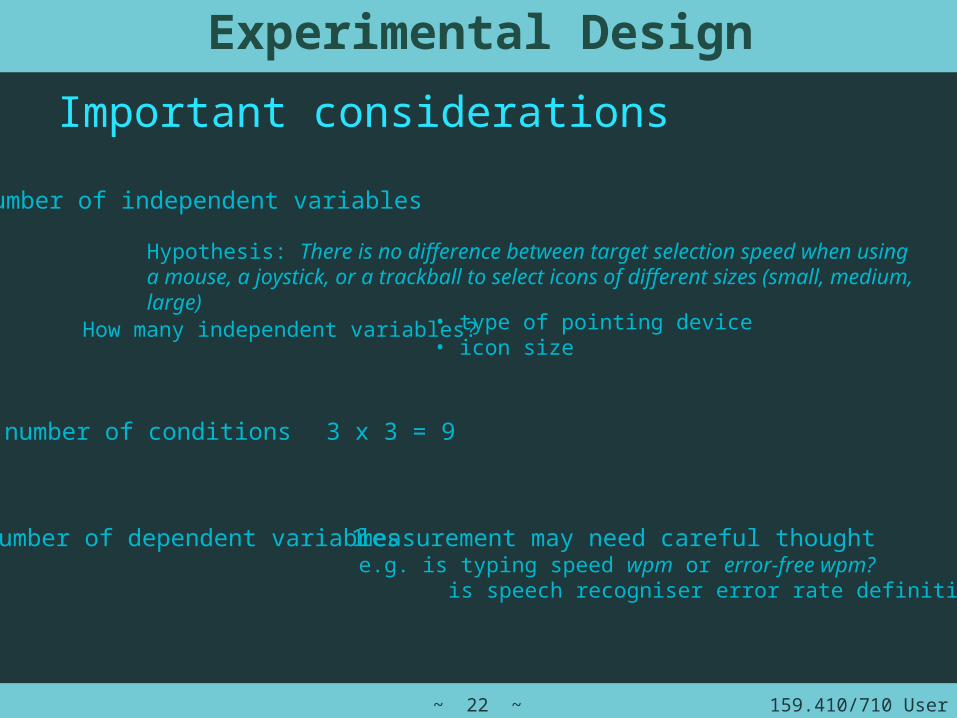
Important considerations
Experimental Design
number of independent variables
Hypothesis: There is no difference between target selection speed when using a mouse, a joystick, or a trackball to select icons of different sizes (small, medium, large)
How many independent variables? • type of pointing device• icon size
number of conditions 3 x 3 = 9
number of dependent variables 1 measurement may need careful thoughte.g. is typing speed wpm or error-free wpm? is speech recogniser error rate definitive?
159.410/710 User Interface Design~ 23 ~
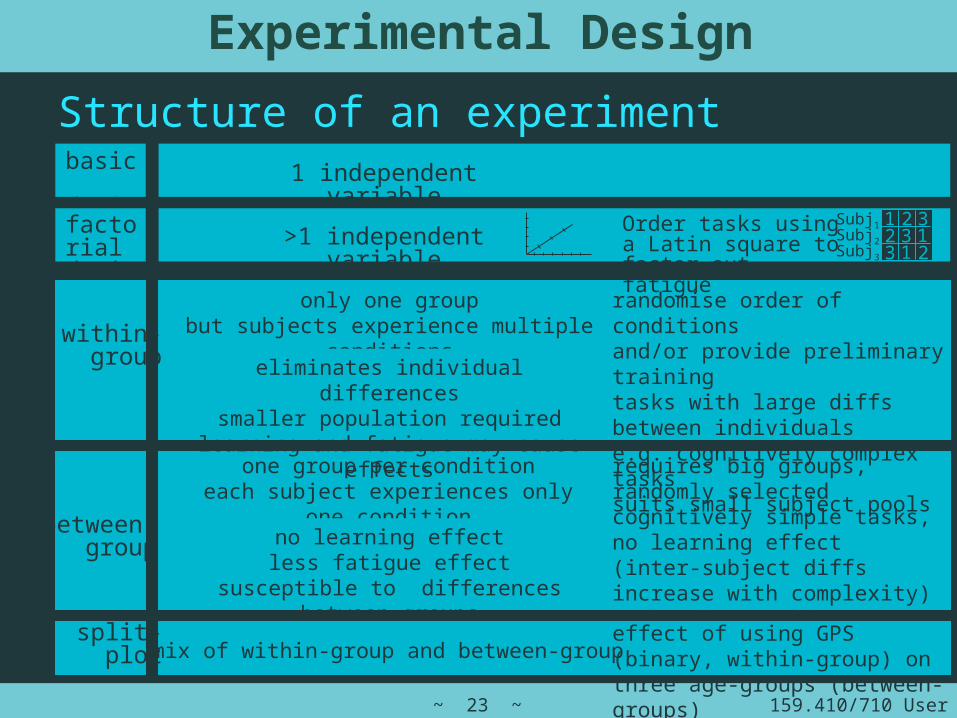
one group per conditioneach subject experiences only one condition
Structure of an experiment
Experimental Design
basic design
factorial
design
no learning effectless fatigue effect
susceptible to differences between groups
only one groupbut subjects experience multiple conditions
eliminates individual differencessmaller population required
learning and fatigue may cause effects
requires big groups, randomly selected cognitively simple tasks, no learning effect(inter-subject diffs increase with complexity)tasks where subject difference is indep var.
randomise order of conditions and/or provide preliminary trainingtasks with large diffs between individualse.g. cognitively complex taskssuits small subject pools
mix of within-group and between-groupeffect of using GPS (binary, within-group) on three age-groups (between-groups)
between-group
within-group
split-plot
1 independent variable
>1 independent variable Order tasks using a Latin square to factor out fatigue
1 2 32 3
1 231
Subj1Subj2Subj3
159.410/710 User Interface Design~ 24 ~
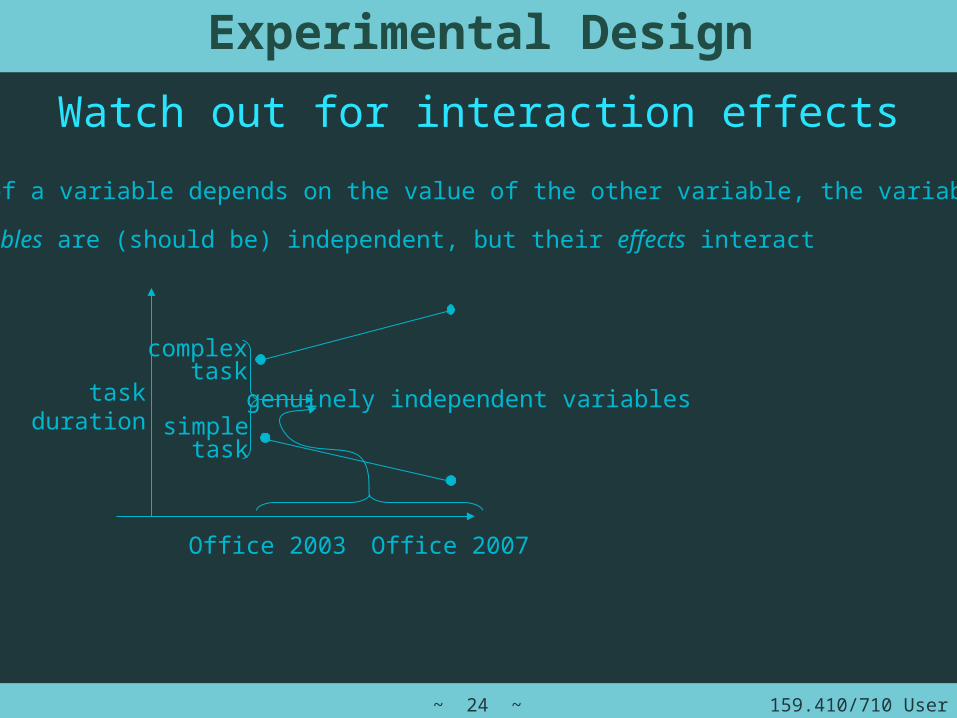
Watch out for interaction effects
Experimental Design
if the effect of a variable depends on the value of the other variable, the variables interact
the variables are (should be) independent, but their effects interact
Office 2003 Office 2007
taskduration simple
task
complextask
genuinely independent variables
159.410/710 User Interface Design~ 25 ~
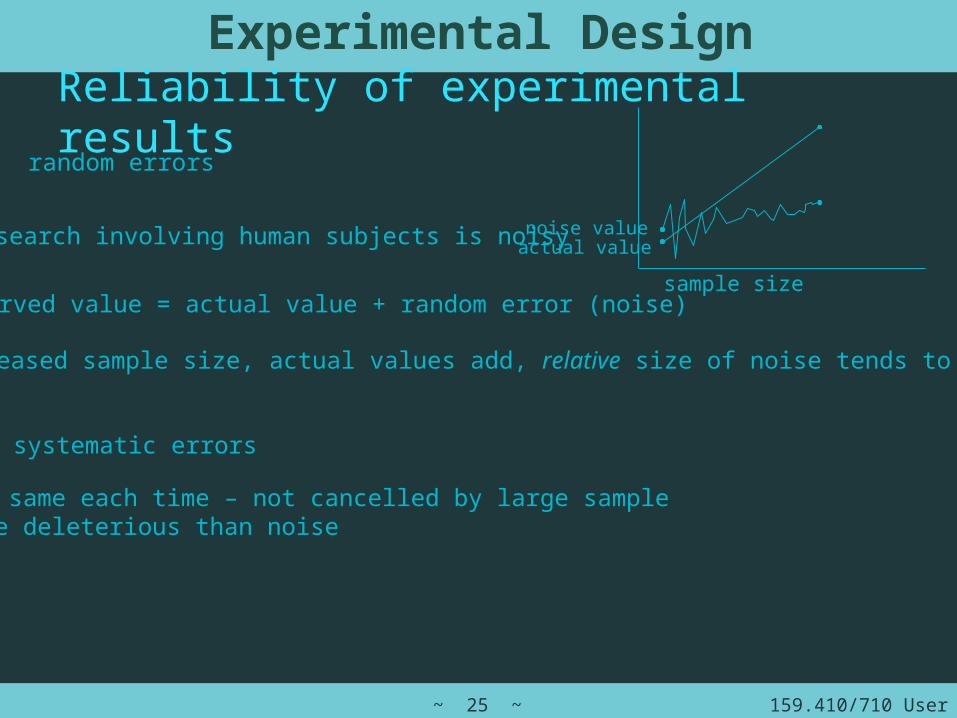
Reliability of experimental results
Experimental Design
research involving human subjects is noisy
observed value = actual value + random error (noise)
with increased sample size, actual values add, relative size of noise tends to 0
sample size
actual valuenoise value
random errors
systematic errors
the same each time – not cancelled by large samplemore deleterious than noise
159.410/710 User Interface Design~ 26 ~
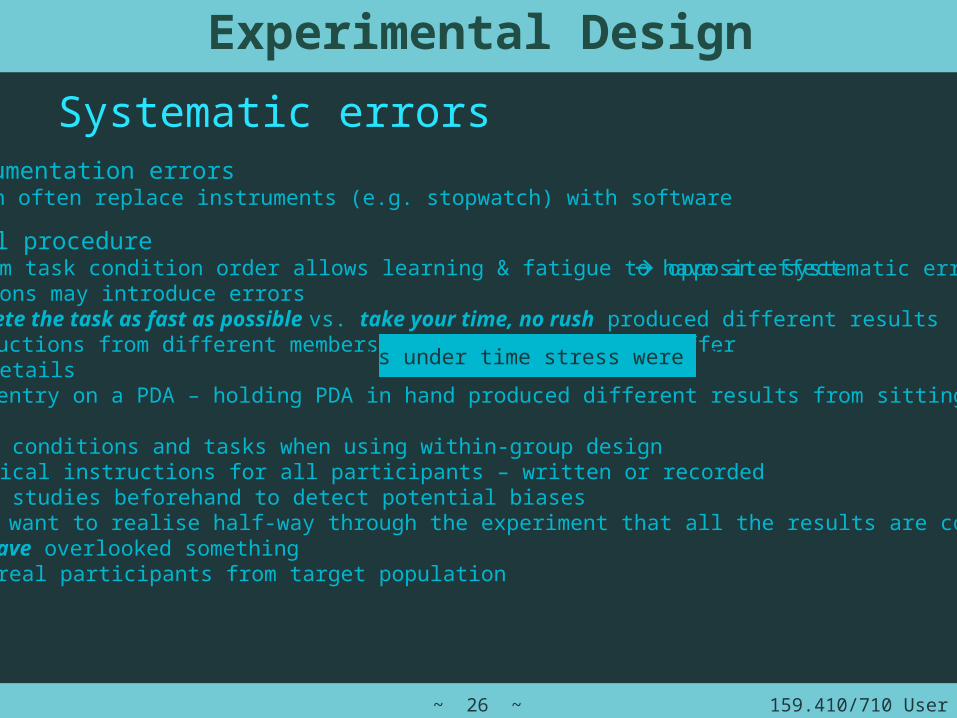
Systematic errorsinstrumentation errors
can often replace instruments (e.g. stopwatch) with software
experimental procedure non-random task condition order allows learning & fatigue to have an effectinstructions may introduce errors
complete the task as fast as possible vs. take your time, no rush produced different resultsinstructions from different members of research team may differ
trivial detailsdata entry on a PDA – holding PDA in hand produced different results from sitting PDA on table
randomise conditions and tasks when using within-group designuse identical instructions for all participants – written or recordedrun pilot studies beforehand to detect potential biases
don’t want to realise half-way through the experiment that all the results are compromised you have overlooked something use real participants from target population
Experimental Design
subjects under time stress were slower!
opposite systematic errors
159.410/710 User Interface Design~ 27 ~
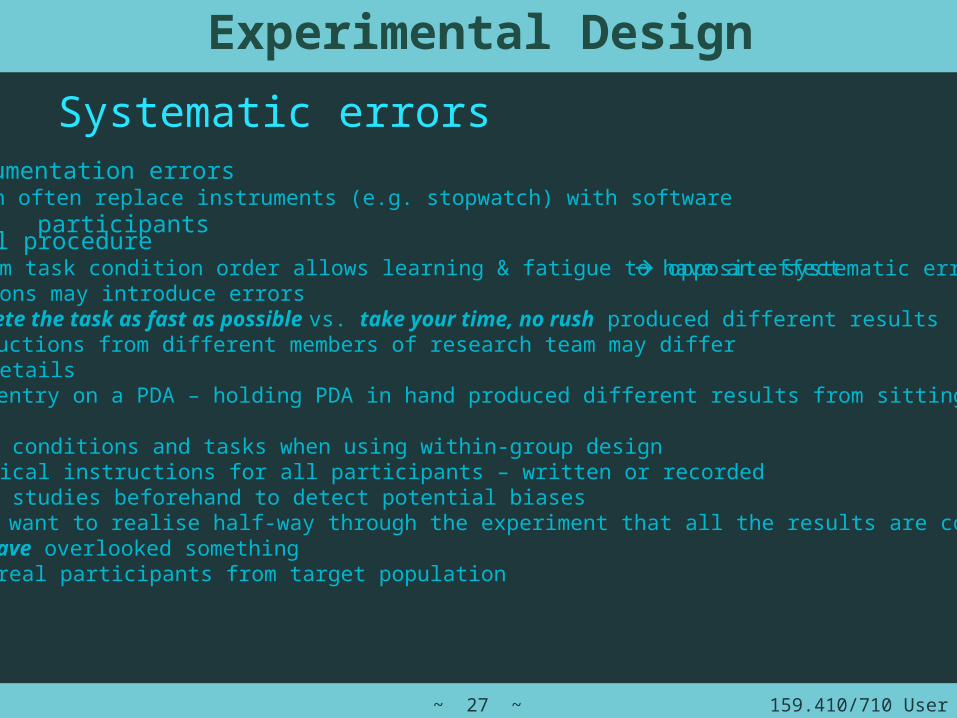
Systematic errorsinstrumentation errors
can often replace instruments (e.g. stopwatch) with software
experimental procedure non-random task condition order allows learning & fatigue to have an effectinstructions may introduce errors
complete the task as fast as possible vs. take your time, no rush produced different resultsinstructions from different members of research team may differ
trivial detailsdata entry on a PDA – holding PDA in hand produced different results from sitting PDA on table
randomise conditions and tasks when using within-group designuse identical instructions for all participants – written or recordedrun pilot studies beforehand to detect potential biases
don’t want to realise half-way through the experiment that all the results are compromised you have overlooked something use real participants from target population
participants
Experimental Design
opposite systematic errors
159.410/710 User Interface Design~ 28 ~
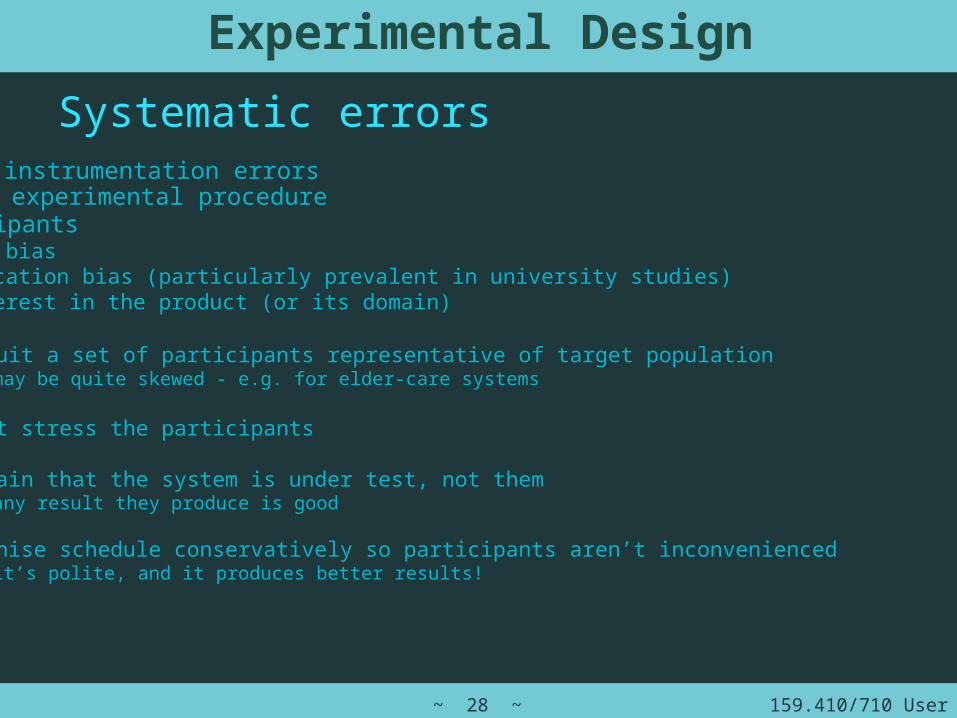
instrumentation errors
Experimental Design
Systematic errors
participantsage biaseducation bias (particularly prevalent in university studies)interest in the product (or its domain)
experimental procedure
recruit a set of participants representative of target populationmay be quite skewed - e.g. for elder-care systems
don’t stress the participants
explain that the system is under test, not themany result they produce is good
organise schedule conservatively so participants aren’t inconvenienced it’s polite, and it produces better results!
159.410/710 User Interface Design~ 29 ~
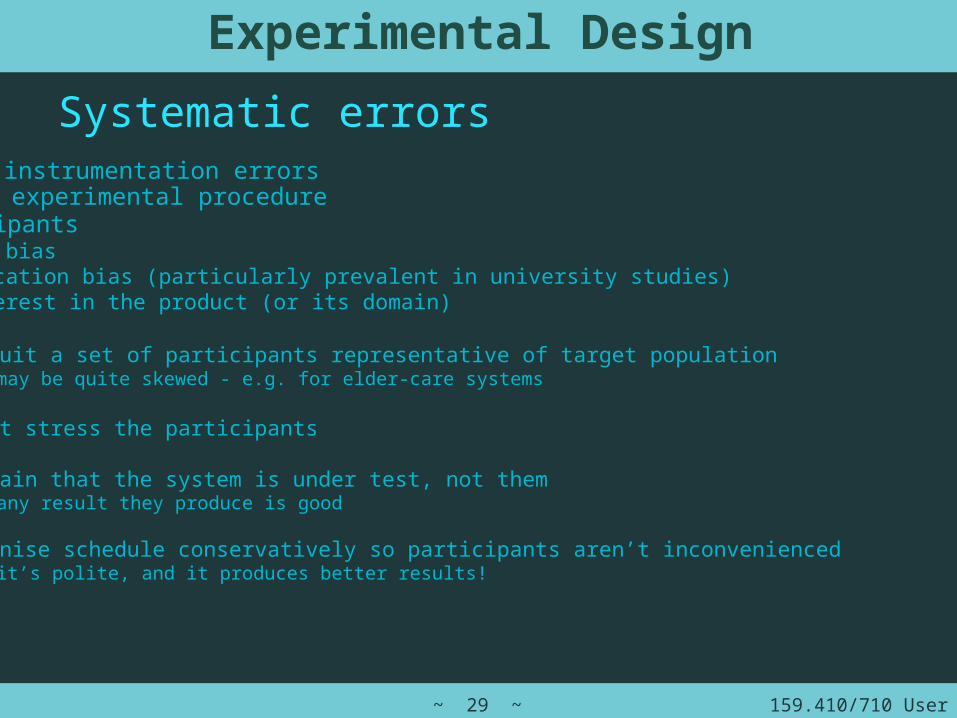
instrumentation errors
Experimental Design
Systematic errors
participantsage biaseducation bias (particularly prevalent in university studies)interest in the product (or its domain)
experimental procedure
recruit a set of participants representative of target populationmay be quite skewed - e.g. for elder-care systems
don’t stress the participants
explain that the system is under test, not themany result they produce is good
organise schedule conservatively so participants aren’t inconveniencedit’s polite, and it produces better results!
159.410/710 User Interface Design~ 30 ~
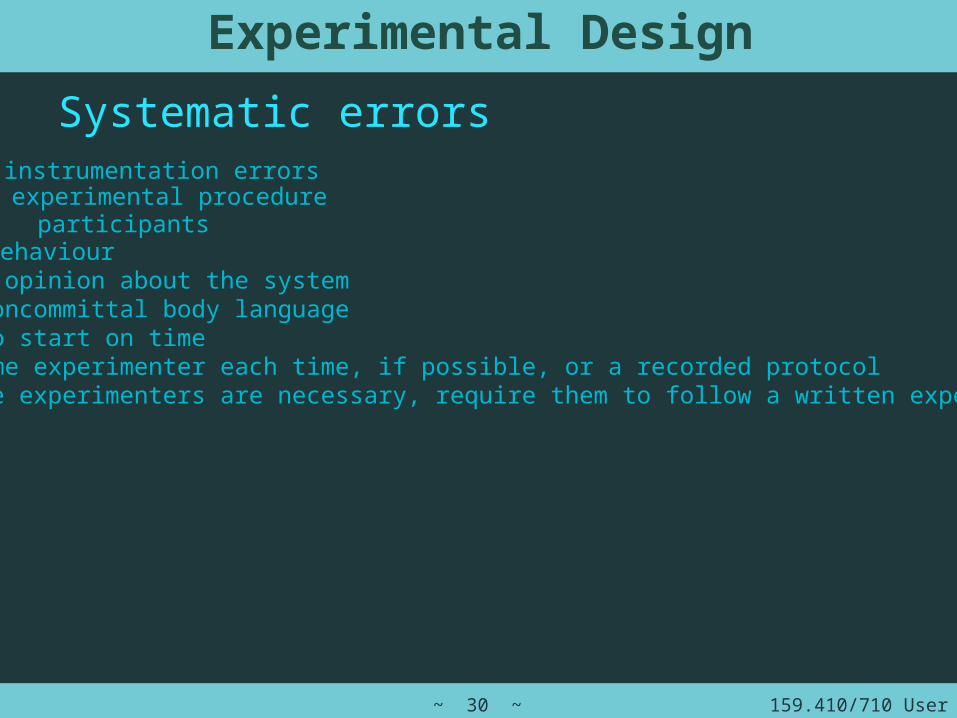
Experimental Design
Systematic errorsinstrumentation errors
participantsexperimental procedure
experimenter behaviourexpress no opinion about the systemmaintain noncommittal body languagebe ready to start on timeuse the same experimenter each time, if possible, or a recorded protocolif multiple experimenters are necessary, require them to follow a written experimental protocol

159.410/710 User Interface Design~ 31 ~
Experimental Design
Systematic errorsinstrumentation errors
participantsexperimental procedure
experimenter behaviourexpress no opinion about the systemmaintain noncommittal body languagebe ready to start on timeuse the same experimenter each time, if possible, or a recorded protocolif multiple experimenters are necessary, require them to follow a written experimental protocol
159.410/710 User Interface Design~ 32 ~
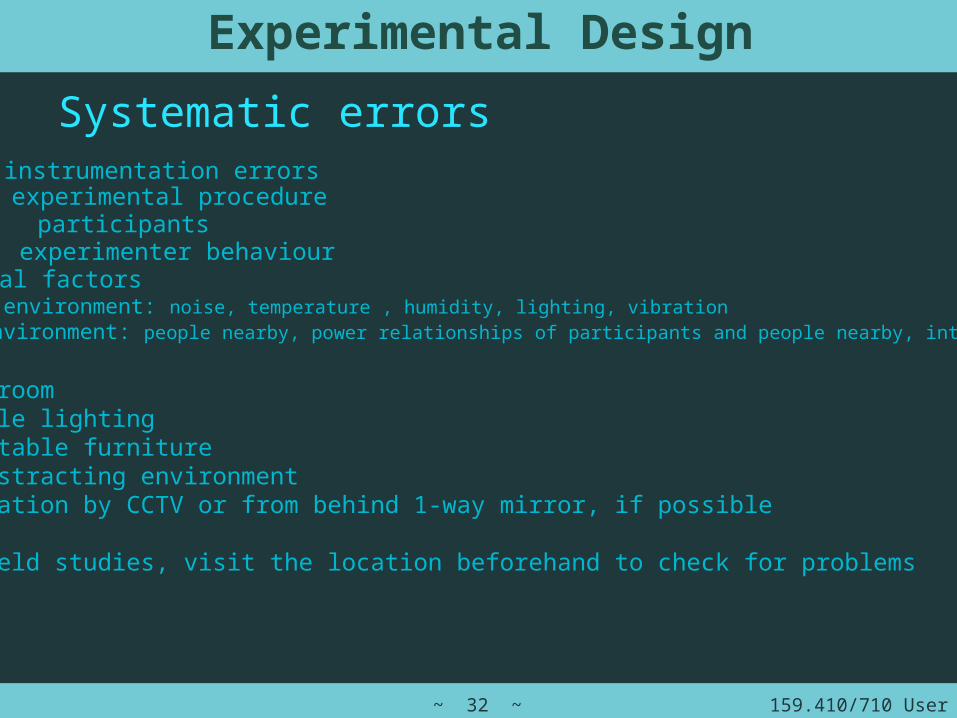
Experimental Design
Systematic errorsinstrumentation errors
participantsexperimental procedure
experimenter behaviourenvironmental factors
physical environment: noise, temperature , humidity, lighting, vibrationsocial environment: people nearby, power relationships of participants and people nearby, interruptions
quiet roomsuitable lightingcomfortable furniturenon-distracting environmentobservation by CCTV or from behind 1-way mirror, if possible
for field studies, visit the location beforehand to check for problems
159.410/710 User Interface Design~ 33 ~
Experimental Procedures
Experimental Design
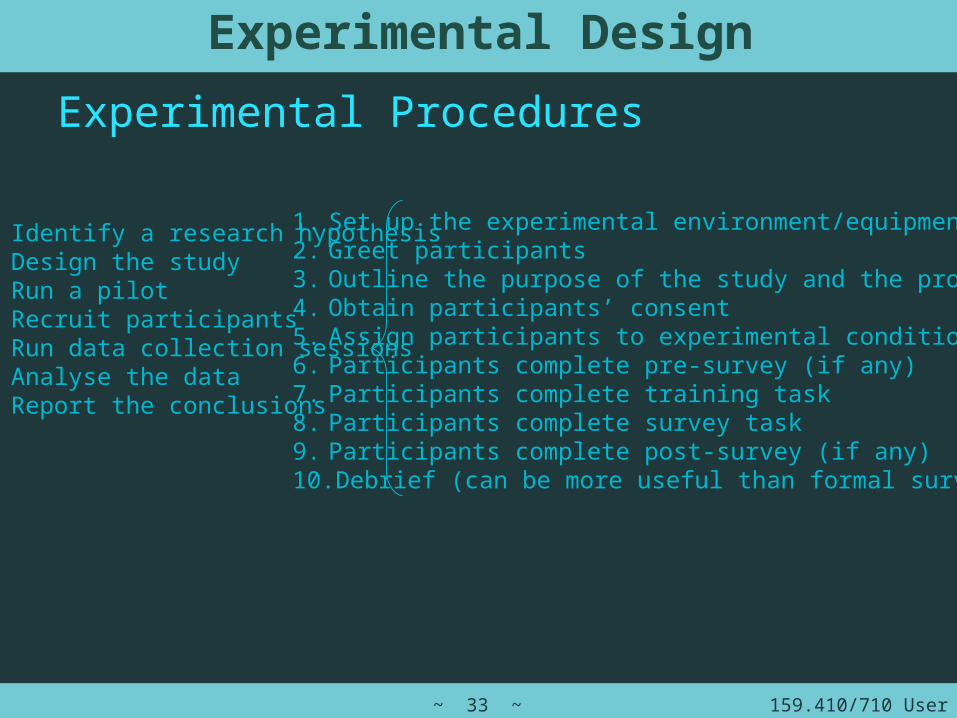
1. Identify a research hypothesis2. Design the study3. Run a pilot4. Recruit participants5. Run data collection sessions6. Analyse the data7. Report the conclusions
1. Set up the experimental environment/equipment2. Greet participants3. Outline the purpose of the study and the procedures4. Obtain participants’ consent5. Assign participants to experimental condition6. Participants complete pre-survey (if any)7. Participants complete training task8. Participants complete survey task9. Participants complete post-survey (if any)10. Debrief (can be more useful than formal survey)

159.410/710 User Interface Design~ 34 ~
There are many analytical tools
Analysing the Data
t-test
ANOVA
paired-samples
independent samples
correlation
regression
Chi-square
one-way
factorial
repeated measures
(e.g. before/after tests)
159.410/710 User Interface Design~ 35 ~
Data Preparation
Analysing the Data
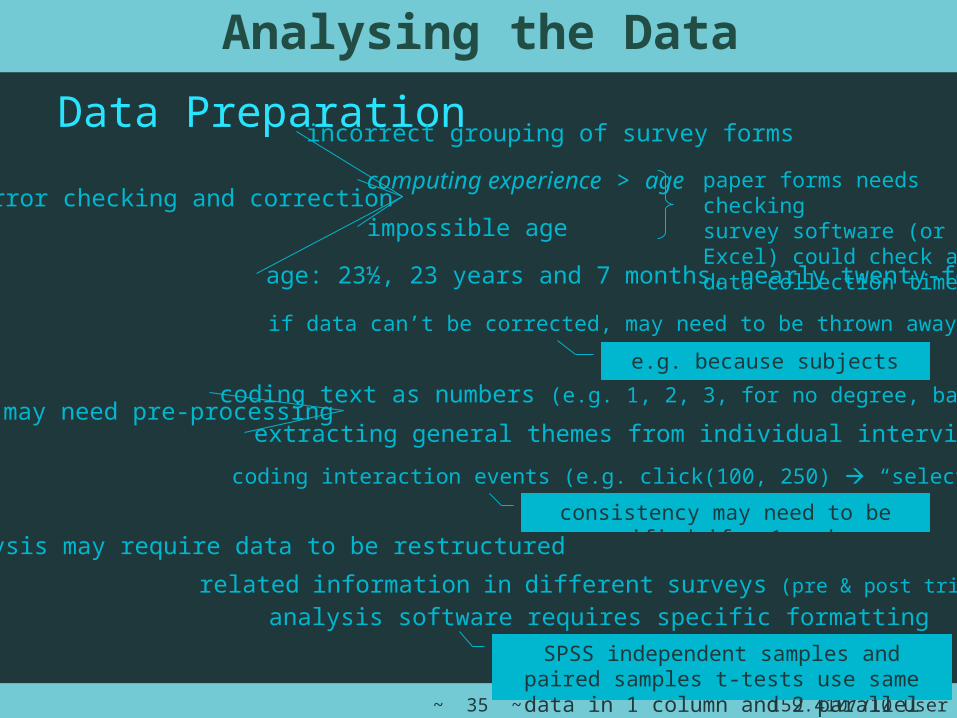
error checking and correction
may need pre-processing
analysis may require data to be restructured
impossible age
computing experience > age paper forms needs checkingsurvey software (or Excel) could check at data collection time
incorrect grouping of survey forms
if data can’t be corrected, may need to be thrown away
age: 23½, 23 years and 7 months, nearly twenty-four
e.g. because subjects are anonymous
coding text as numbers (e.g. 1, 2, 3, for no degree, bachelors, P/G)
extracting general themes from individual interviews
coding interaction events (e.g. click(100, 250) “select book”)
consistency may need to be verified if > 1 coder
related information in different surveys (pre & post trial, for example)
analysis software requires specific formattingSPSS independent samples and paired samples t-tests
use same data in 1 column and 2 parallel columns

159.410/710 User Interface Design~ 36 ~
datamax – datamin (crude – likely to increase with sample size & sensitive to outliers)
Start with an exploratory analysis
Analysing the Data
Get a feel for the data mean, median, moderange, variance, standard deviation
good for initial comparison between groups
measures of central tendencymeasures of spread
50th percentile - good for skewed (e.g. Pareto) distribution and when outliers may be errorsmost popular
∑i = 1
n
(xi – x)2(n – 1)
variance
estimates spread around mean: sign-independent, but has different units from samplesestimates spread around mean: sign-independent, but has different units from samplesestimates spread around mean: sign-independent, but has different units from samples
more complex measures of spread assume a normal distributionmay be necessary to modify data to conform
Histograms Box-and-whisker plots
159.410/710 User Interface Design~ 37 ~
Start with an exploratory analysis
Analysing the Data
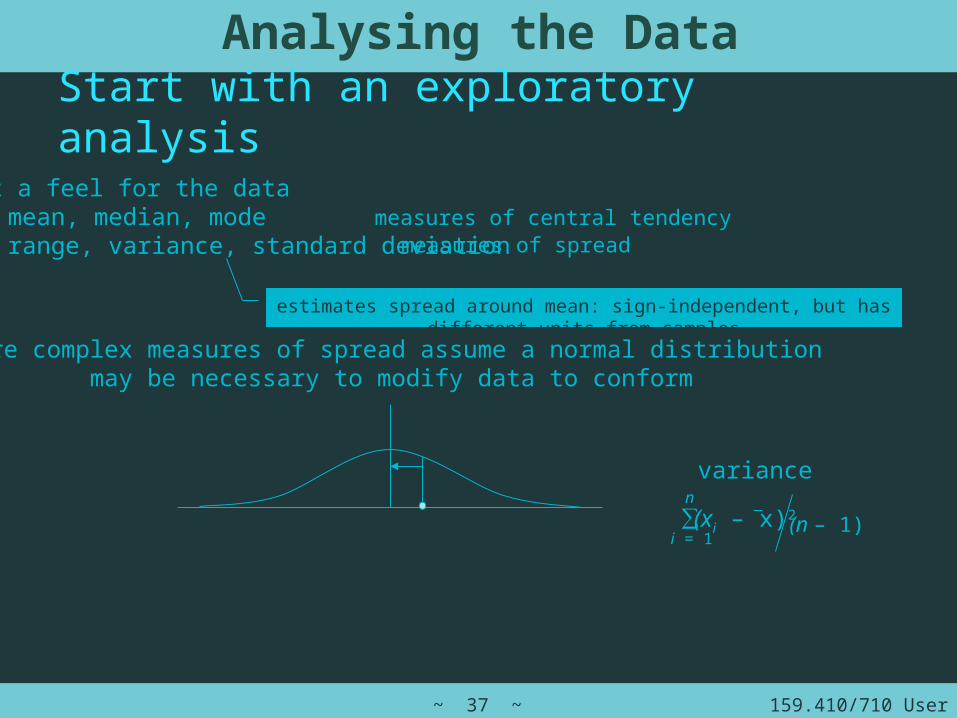
Get a feel for the data mean, median, moderange, variance, standard deviation
measures of central tendencymeasures of spread
∑i = 1
n
(xi – x)2(n – 1)
estimates spread around mean: sign-independent, but has different units from samples
variance
more complex measures of spread assume a normal distributionmay be necessary to modify data to conform
159.410/710 User Interface Design~ 38 ~
Start with an exploratory analysis
Analysing the Data
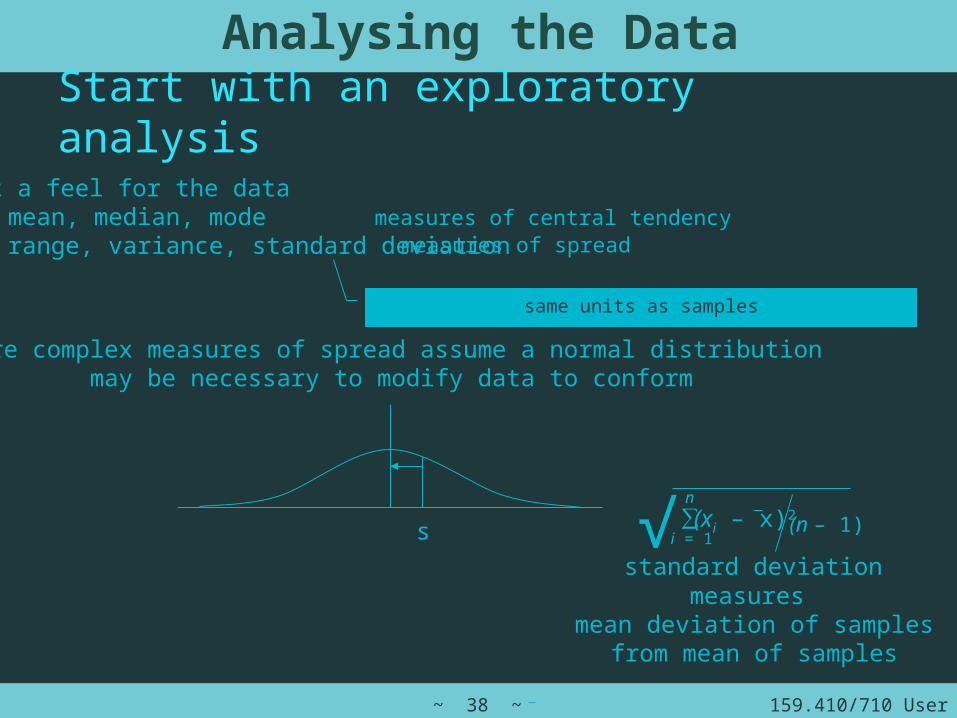
Get a feel for the data mean, median, moderange, variance, standard deviation
measures of central tendencymeasures of spread
∑i = 1
n
(xi – x)2(n – 1)
same units as samples
s √standard deviation
more complex measures of spread assume a normal distributionmay be necessary to modify data to conform
measures mean deviation of samples
from mean of samples
159.410/710 User Interface Design~ 39 ~
Analysing the Data
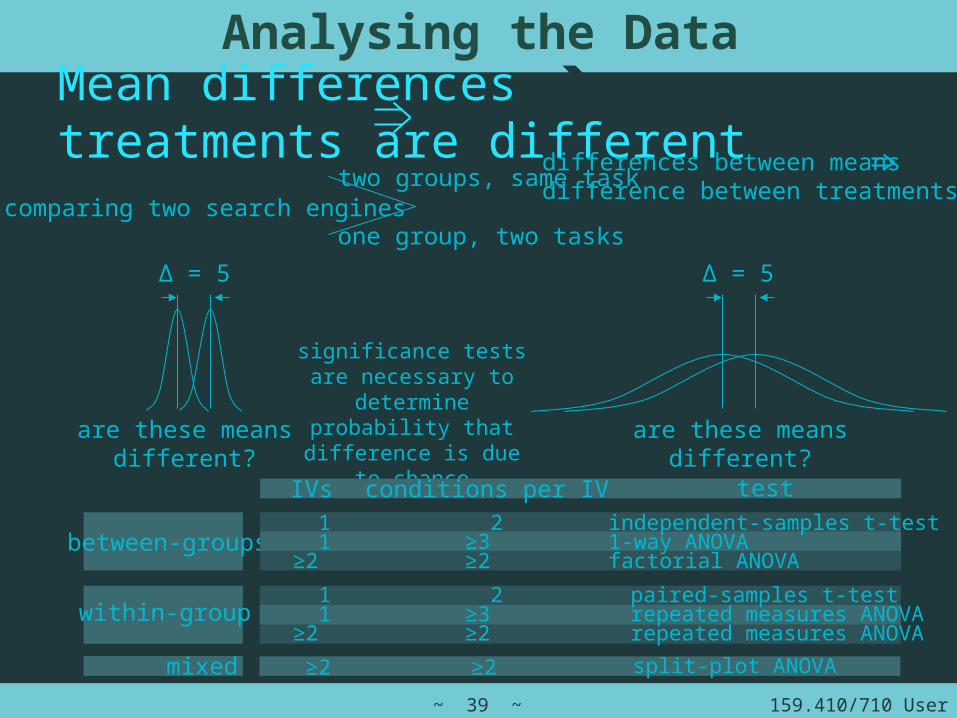
Mean differences treatments are different
comparing two search enginestwo groups, same task
one group, two tasks
differences between meansdifference between treatments
Δ = 5 Δ = 5
are these meansdifferent?
are these meansdifferent?
significance tests are necessary to determine probability that difference is due to chance
between-groups
within-group
mixed
IVs conditions per IV test 1 1≥2
1 1≥2
≥2
2≥3≥2
2≥3≥2
≥2
independent-samples t-test1-way ANOVAfactorial ANOVA
paired-samples t-testrepeated measures ANOVArepeated measures ANOVA
split-plot ANOVA
159.410/710 User Interface Design~ 40 ~
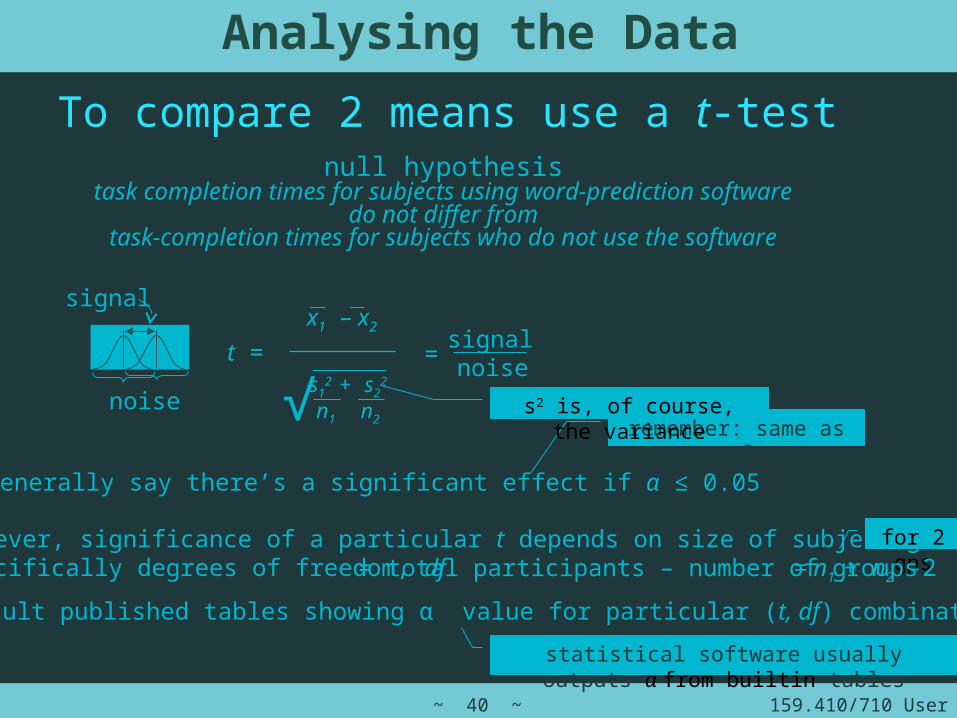
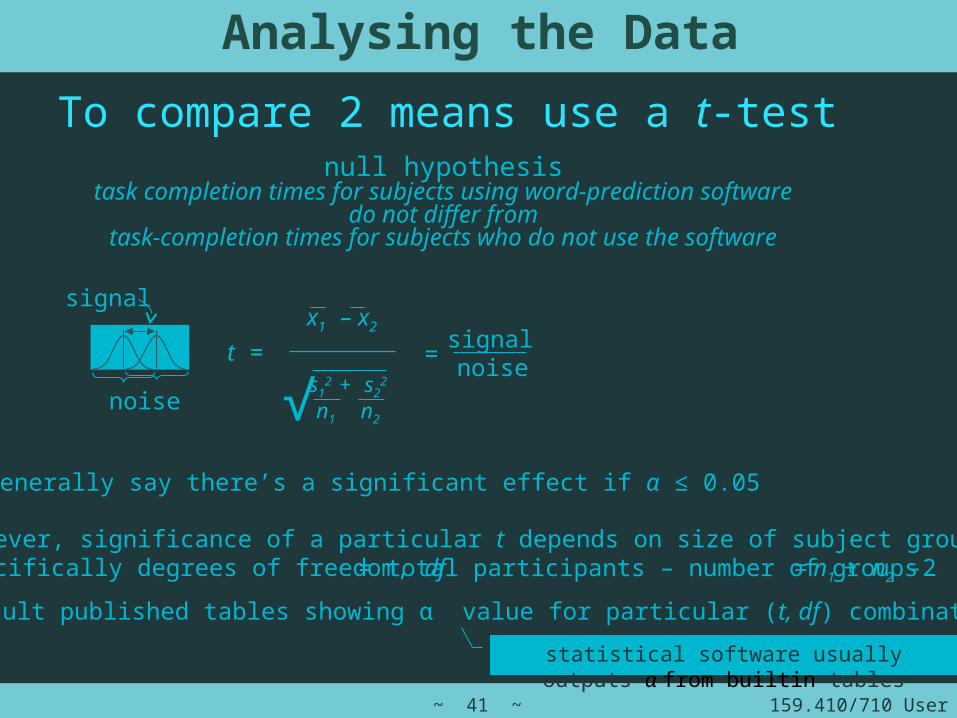
To compare 2 means use a t-test
Analysing the Data
null hypothesistask completion times for subjects using word-prediction software
do not differ fromtask-completion times for subjects who do not use the software
signal
noises1
2 + s22
n1 n2√t =
however, significance of a particular t depends on size of subject groupsspecifically degrees of freedom, df
generally say there’s a significant effect if α ≤ 0.05
x1 – x2
=signalnoise
remember: same as p-value
consult published tables showing α value for particular (t, df) combinations
statistical software usually outputs α from builtin tables
s2 is, of course, the variance
for 2 gps= total participants – number of groups = n1 + n2 -2
159.410/710 User Interface Design~ 41 ~
To compare 2 means use a t-test
Analysing the Data
null hypothesistask completion times for subjects using word-prediction software
do not differ fromtask-completion times for subjects who do not use the software
signal
noises1
2 + s22
n1 n2√t =
however, significance of a particular t depends on size of subject groupsspecifically degrees of freedom, df
generally say there’s a significant effect if α ≤ 0.05
x1 – x2
=signalnoise
consult published tables showing α value for particular (t, df) combinations
statistical software usually outputs α from builtin tables
= total participants – number of groups = n1 + n2 -2
159.410/710 User Interface Design~ 42 ~
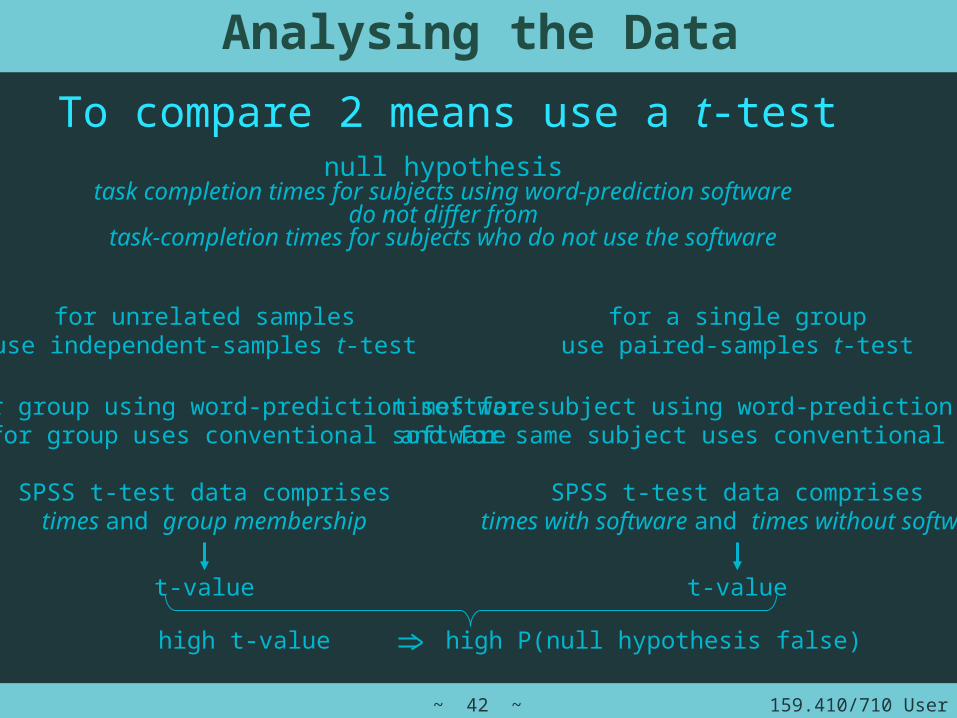
To compare 2 means use a t-test
Analysing the Data
for unrelated samplesuse independent-samples t-test
for a single groupuse paired-samples t-test
null hypothesistask completion times for subjects using word-prediction software
do not differ fromtask-completion times for subjects who do not use the software
times for group using word-prediction softwaretimes for group uses conventional software
SPSS t-test data comprisestimes and group membership
t-value
times for subject using word-prediction softwareand for same subject uses conventional software
SPSS t-test data comprisestimes with software and times without software
t-value
high t-value high P(null hypothesis false)
159.410/710 User Interface Design~ 43 ~
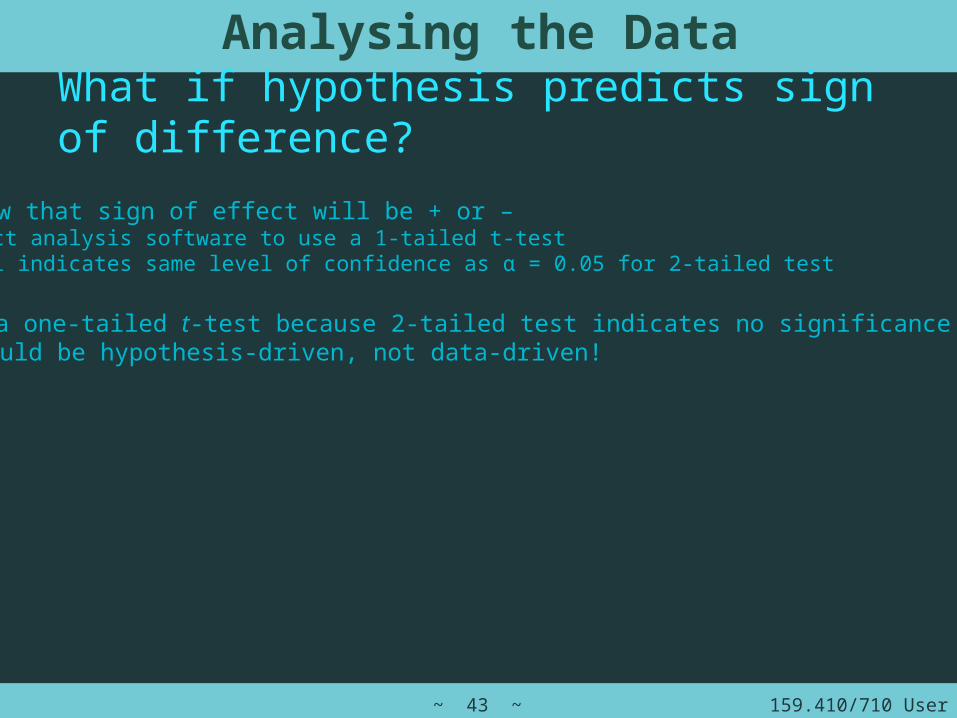
What if hypothesis predicts sign of difference?
Analysing the Data
if we know that sign of effect will be + or –instruct analysis software to use a 1-tailed t-testα = 0.1 indicates same level of confidence as α = 0.05 for 2-tailed test
Do NOT use a one-tailed t-test because 2-tailed test indicates no significancetest should be hypothesis-driven, not data-driven!
159.410/710 User Interface Design~ 44 ~
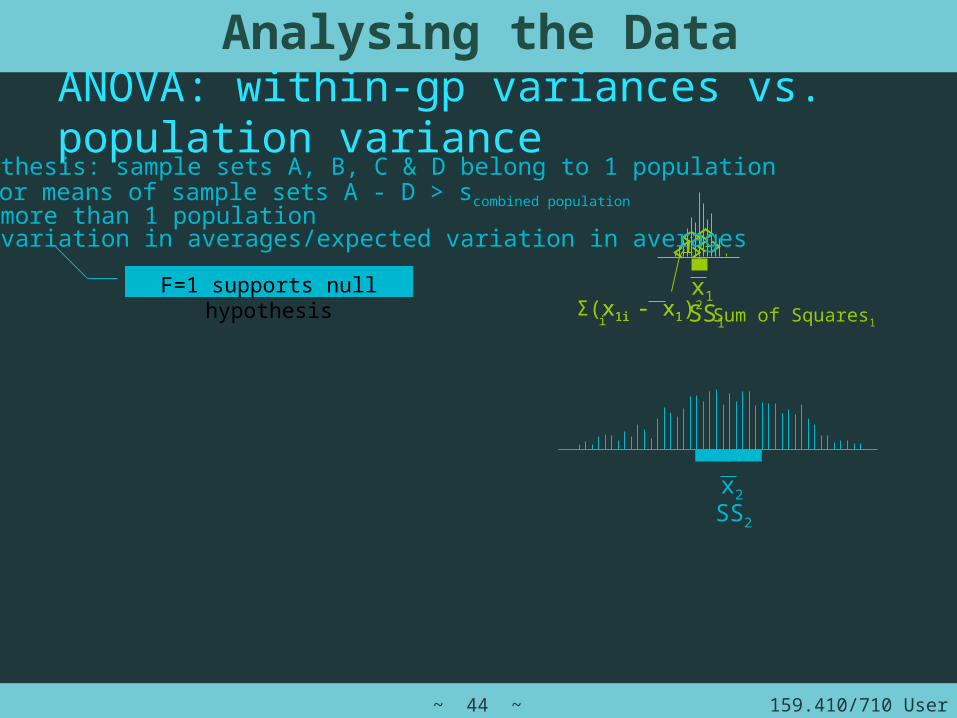
Σ(x1i - x1)2i
x1i - x1
ANOVA: within-gp variances vs. population variance
Analysing the Data
x1
x2
SS1 Sum of Squares1
SS2
null hypothesis: sample sets A, B, C & D belong to 1 populationif smeans for means of sample sets A - D > scombined populationthere is more than 1 populationF= found variation in averages/expected variation in averages
F=1 supports null hypothesis
159.410/710 User Interface Design~ 45 ~
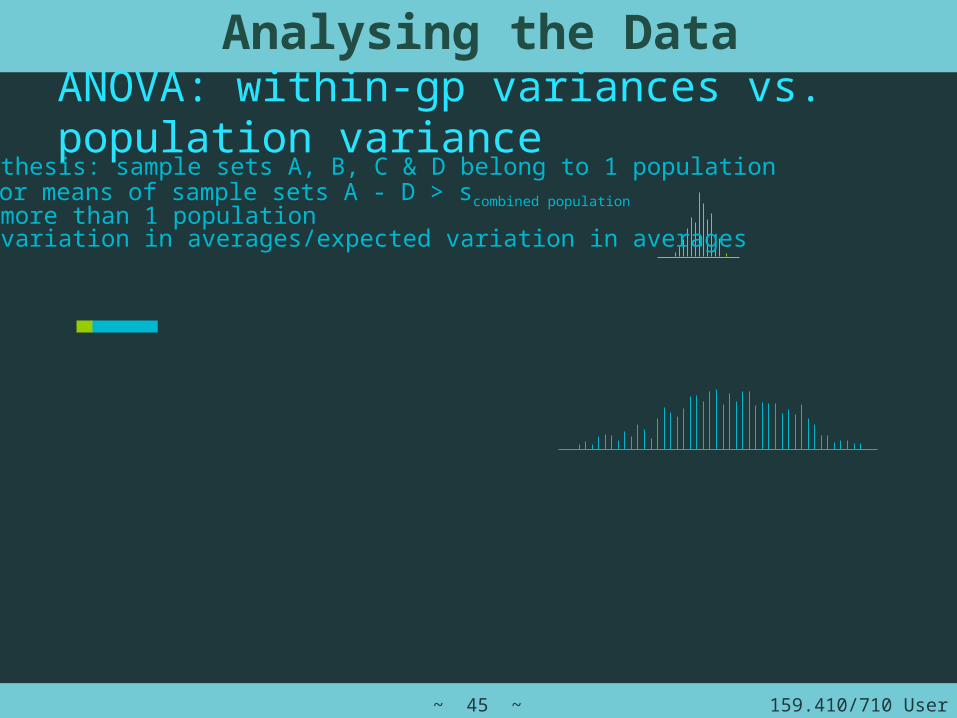
Analysing the Data
ANOVA: within-gp variances vs. population variancenull hypothesis: sample sets A, B, C & D belong to 1 populationif smeans for means of sample sets A - D > scombined populationthere is more than 1 populationF= found variation in averages/expected variation in averages
159.410/710 User Interface Design~ 46 ~
Analysing the Data
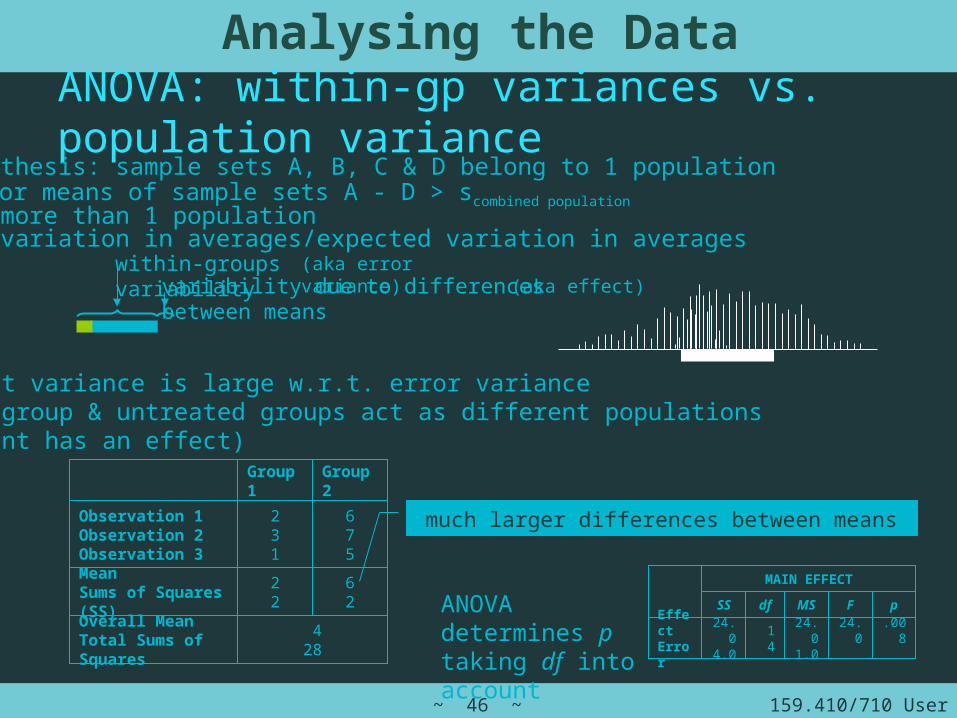
ANOVA: within-gp variances vs. population variance
if effect variance is large w.r.t. error variance treated group & untreated groups act as different populations (treatment has an effect)
within-groups variability (aka error variance)variability due to differences between means (aka effect)
428
62
22
MeanSums of Squares (SS)
Overall MeanTotal Sums of Squares
675
231
Observation 1Observation 2Observation 3
Group 2Group 1
.008
24.0
24.01.0
14
24.04.0
EffectError
pFMS df SS
MAIN EFFECT
much larger differences between means than in the diagram
ANOVA determines ptaking df into account
null hypothesis: sample sets A, B, C & D belong to 1 populationif smeans for means of sample sets A - D > scombined populationthere is more than 1 populationF= found variation in averages/expected variation in averages
159.410/710 User Interface Design~ 47 ~
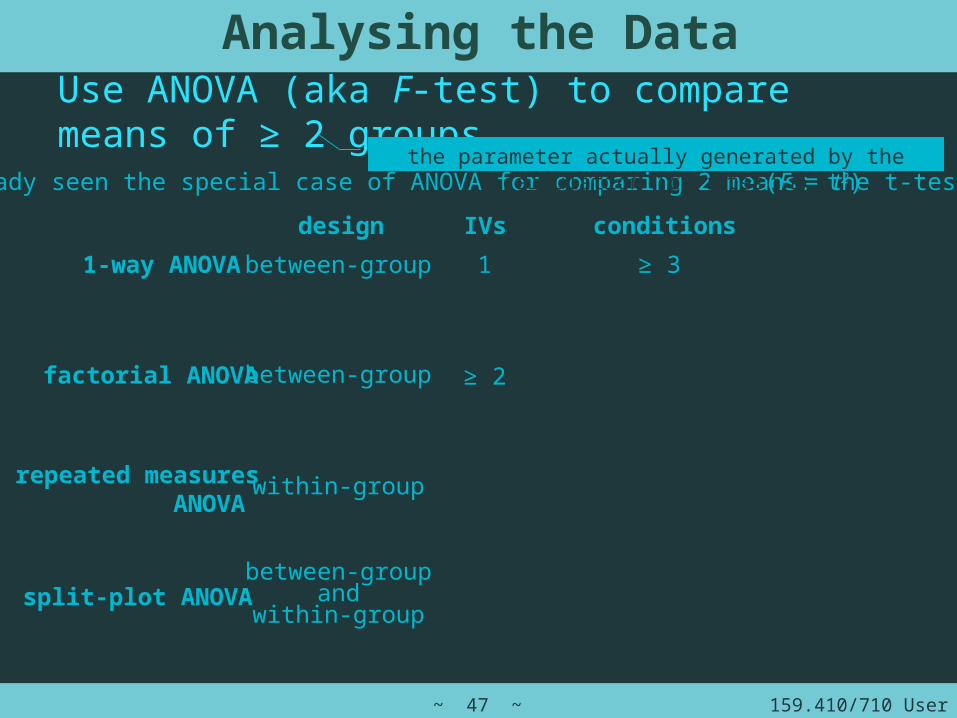
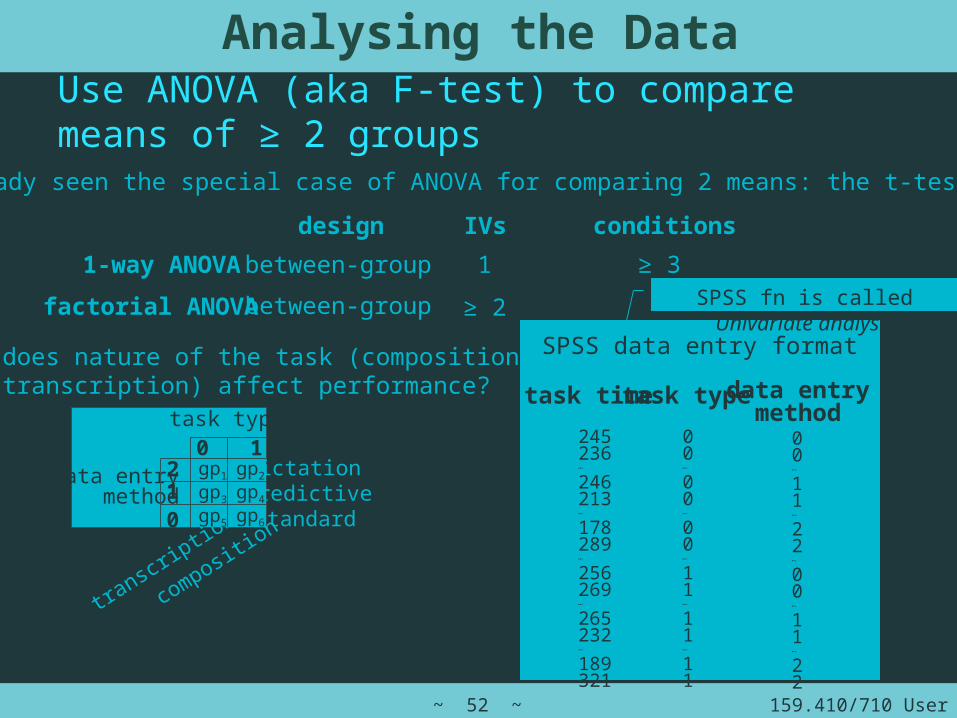
Use ANOVA (aka F-test) to compare means of ≥ 2 groups
Analysing the Data
we’ve already seen the special case of ANOVA for comparing 2 means: the t-test
1-way ANOVA
factorial ANOVA
repeated measuresANOVA
split-plot ANOVA
design
between-group
IVs
1
conditions
≥ 3
between-group ≥ 2
within-group
between-groupand
within-group
the parameter actually generated by the calculation (cf t-test t)(F = t2)
159.410/710 User Interface Design~ 48 ~
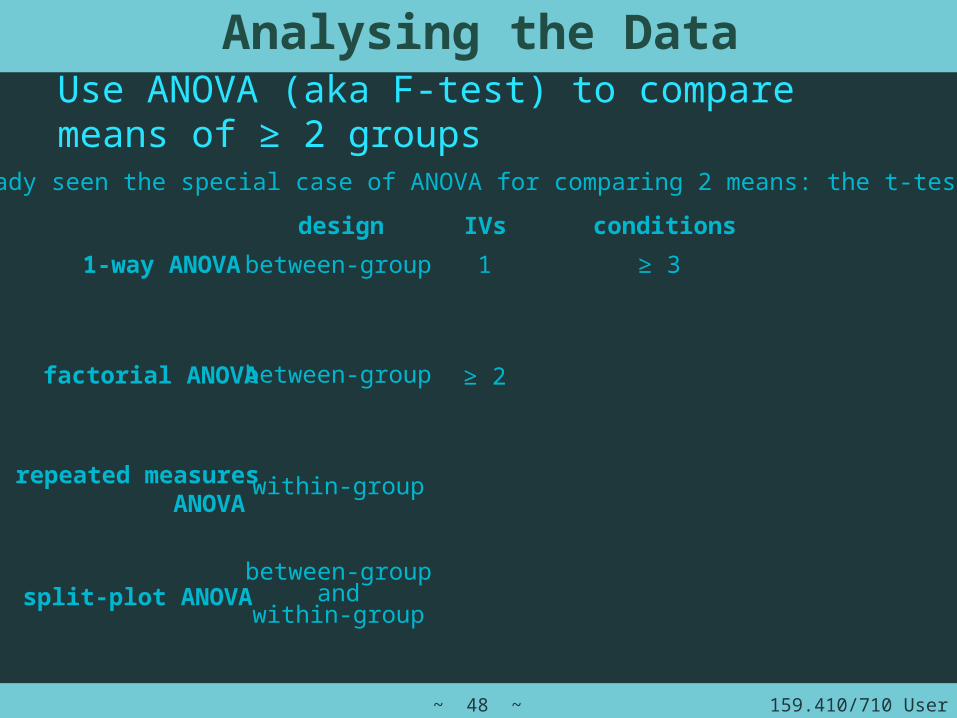
Use ANOVA (aka F-test) to compare means of ≥ 2 groups
Analysing the Data
we’ve already seen the special case of ANOVA for comparing 2 means: the t-test
1-way ANOVA
factorial ANOVA
repeated measuresANOVA
split-plot ANOVA
design
between-group
IVs
1
conditions
≥ 3
between-group ≥ 2
within-group
between-groupand
within-group
159.410/710 User Interface Design~ 49 ~
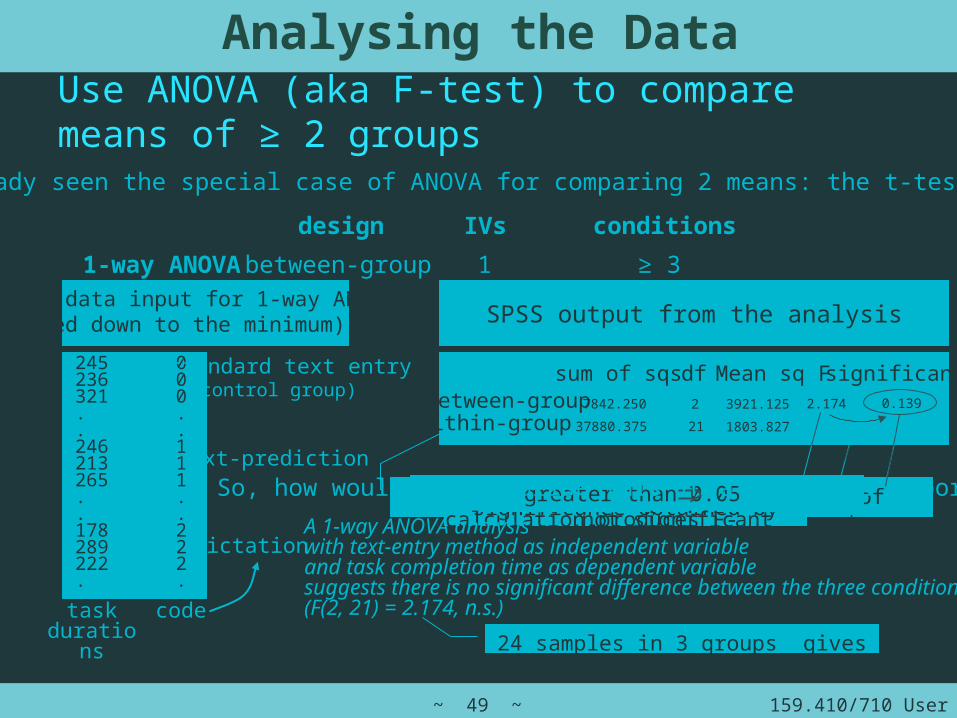
same calculation produces 2 sets of results – these aren’t relevantsignificance obtained by table lookup
taskdurations
text-prediction
dictation
code
245236321..246213265..178289222.
000..111..222.
standard text entry(control group)
SPSS data input for 1-way ANOVA (pared down to the minimum)
Analysing the Data
we’ve already seen the special case of ANOVA for comparing 2 means: the t-test
1-way ANOVA
design
between-group
IVs
1
conditions
≥ 3
Use ANOVA (aka F-test) to compare means of ≥ 2 groups
between-groupwithin-group
sum of sqs df Mean sq F significance7842.250
37880.375
2
21
3921.125
1803.827
2.174 0.139
SPSS output from the analysis
the statistical calculation produces F-valuegreater than 0.05 not significant
A 1-way ANOVA analysiswith text-entry method as independent variable and task completion time as dependent variablesuggests there is no significant difference between the three conditions:(F(2, 21) = 2.174, n.s.)
24 samples in 3 groups gives df = 21
So, how would we summarise this in a thesis or report?
159.410/710 User Interface Design~ 50 ~
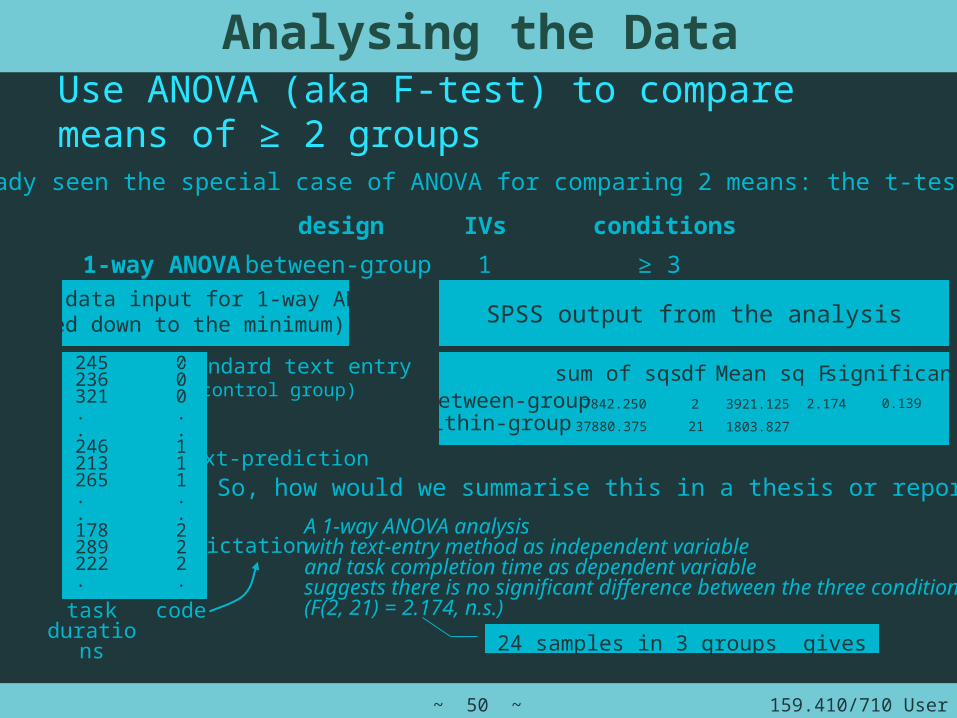
taskdurations
text-prediction
dictation
code
245236321..246213265..178289222.
000..111..222.
standard text entry(control group)
SPSS data input for 1-way ANOVA (pared down to the minimum)
Analysing the Data
we’ve already seen the special case of ANOVA for comparing 2 means: the t-test
1-way ANOVA
design
between-group
IVs
1
conditions
≥ 3
Use ANOVA (aka F-test) to compare means of ≥ 2 groups
between-groupwithin-group
sum of sqs df Mean sq F significance7842.250
37880.375
2
21
3921.125
1803.827
2.174 0.139
SPSS output from the analysis
A 1-way ANOVA analysiswith text-entry method as independent variable and task completion time as dependent variablesuggests there is no significant difference between the three conditions:(F(2, 21) = 2.174, n.s.)
24 samples in 3 groups gives df = 21
So, how would we summarise this in a thesis or report?

159.410/710 User Interface Design~ 51 ~
Analysing the Data
Use ANOVA (aka F-test) to compare means of ≥ 2 groups
we’ve already seen the special case of ANOVA for comparing 2 means: the t-test
1-way ANOVA
factorial ANOVA
design
between-group
IVs
1
conditions
≥ 3
between-group ≥ 2
Q: does nature of the task (composition or transcription) affect performance?
00…
11…
22…
00…
11…
22
data entrymethod
00…
00…
00…
11…
11…
11
task type
245236…
246213…
178289…
256269…
265232…
189321
task time
SPSS data entry format
SPSS fn is called Univariate analysis
standardpredictivedictation
transcription
composition
data entrymethod
task type
gp2
gp4
gp6
gp1
gp3
gp5
0 1
012
159.410/710 User Interface Design~ 52 ~
Use ANOVA (aka F-test) to compare means of ≥ 2 groups
Analysing the Data
we’ve already seen the special case of ANOVA for comparing 2 means: the t-test
1-way ANOVA
factorial ANOVA
design
between-group
IVs
1
conditions
≥ 3
between-group ≥ 2
Q: does nature of the task (composition or transcription) affect performance?
245236…
246213…
178289…
256269…
265232…
189321
00…
00…
00…
11…
11…
11
00…
11…
22…
00…
11…
22
data entrymethod
task typetask time
SPSS data entry format
data entrymethod
standardpredictivedictation
transcription
task type
composition
gp2
gp4
gp6
gp1
gp3
gp5
0 1
012
SPSS fn is called Univariate analysis
159.410/710 User Interface Design~ 53 ~
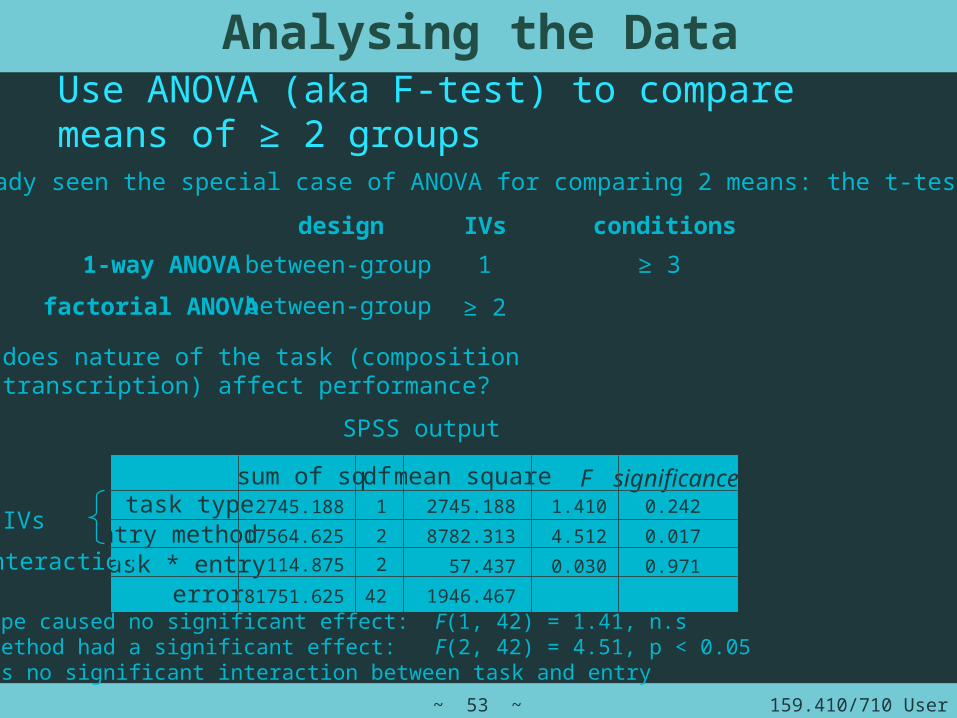
Use ANOVA (aka F-test) to compare means of ≥ 2 groups
Analysing the Data
we’ve already seen the special case of ANOVA for comparing 2 means: the t-test
1-way ANOVA
factorial ANOVA
design
between-group
IVs
1
conditions
≥ 3
between-group ≥ 2
Q: does nature of the task (composition or transcription) affect performance?
task typeentry method
task * entryerror
sum of sq2745.188
17564.625
114.875
81751.625
df1
2
2
42
mean square2745.188
8782.313
57.437
1946.467
F1.410
4.512
0.030
significance0.242
0.017
0.971
IVs
interaction
task type caused no significant effect: F(1, 42) = 1.41, n.sentry method had a significant effect: F(2, 42) = 4.51, p < 0.05there is no significant interaction between task and entry
SPSS output
159.410/710 User Interface Design~ 54 ~
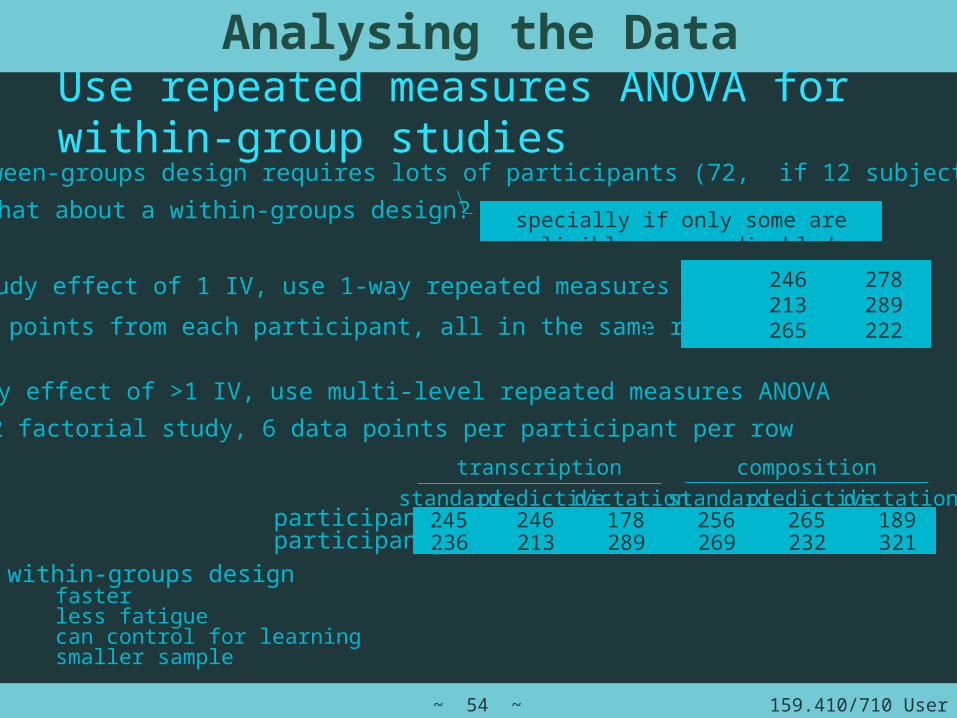
Analysing the Data
Use repeated measures ANOVA for within-group studiesprevious between-groups design requires lots of participants (72, if 12 subjects/group)
what about a within-groups design? specially if only some are eligible – e.g. disabled
to study effect of 1 IV, use 1-way repeated measures ANOVA
3 data points from each participant, all in the same row
245 246 278246 213 289321 265 222
to study effect of >1 IV, use multi-level repeated measures ANOVA
for 3 x 2 factorial study, 6 data points per participant per row
transcription compositionstandard predictive dictation standard predictive dictation245 246 178 256 265 189236 213 289 269 232 321
participant1participant2
within-groups design fasterless fatiguecan control for learningsmaller sample
159.410/710 User Interface Design~ 55 ~
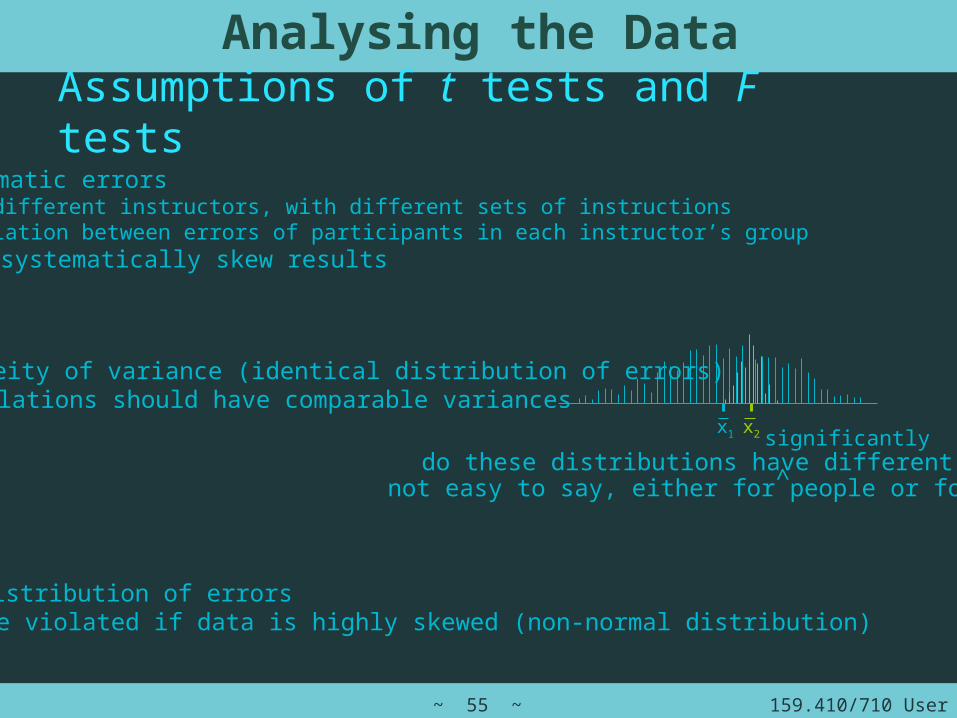
Assumptions of t tests and F tests
Analysing the Data
no systematic errorse.g. different instructors, with different sets of instructionscorrelation between errors of participants in each instructor’s groupwill systematically skew results
homogeneity of variance (identical distribution of errors)populations should have comparable variances
do these distributions have different means?
x2x1
normal distribution of errorsmay be violated if data is highly skewed (non-normal distribution)
significantly
^not easy to say, either for people or for software
159.410/710 User Interface Design~ 56 ~
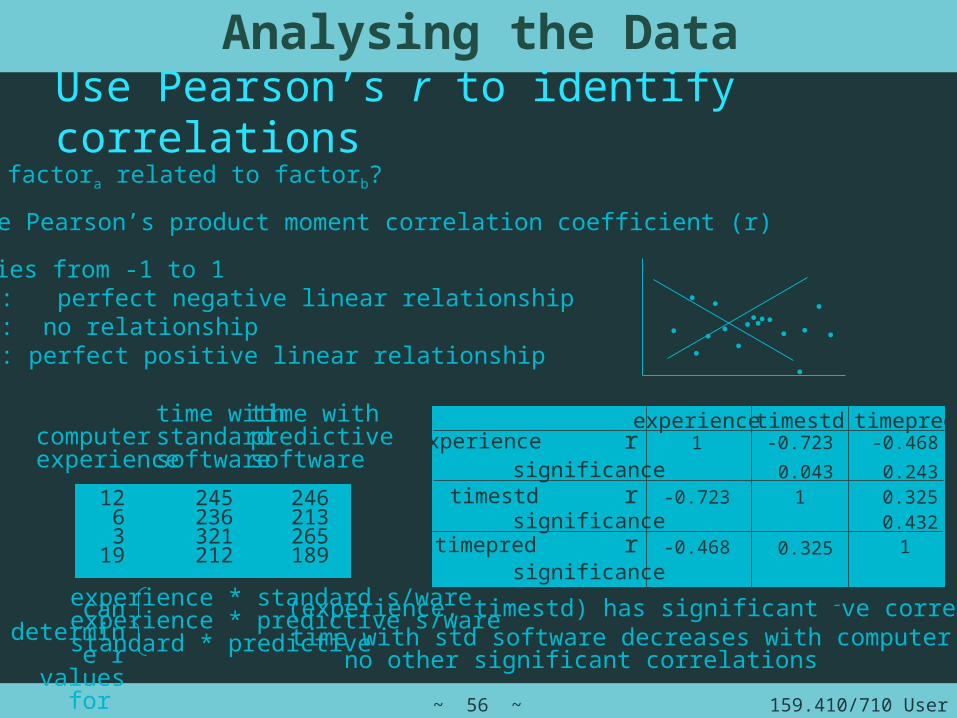
Use Pearson’s r to identify correlations
Analysing the Data
r varies from -1 to 1 -1: perfect negative linear relationship 0: no relationship+1: perfect positive linear relationship
is factora related to factorb?
determine Pearson’s product moment correlation coefficient (r)
12 245 246 6 236 213 3 321 26519 212 189
computerexperience
time withstandardsoftware
time withpredictivesoftware
can determine r values for
experience * standard s/wareexperience * predictive s/warestandard * predictive
experience timestd timepredexperience
timestd
timepred
(experience, timestd) has significant –ve correlationtime with std software decreases with computer experienceno other significant correlations
r
r
r
1
1
1
-0.723
-0.723
-0.468
0.325
-0.468 0.325
significance
significance
significance
0.043
0.432
0.243
159.410/710 User Interface Design~ 57 ~
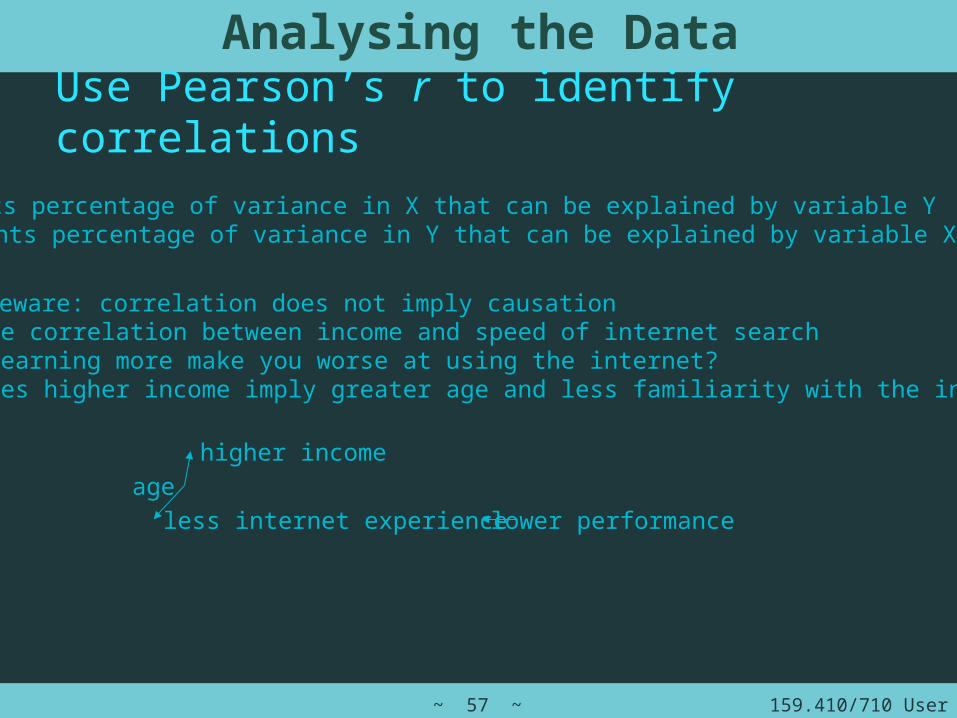
Use Pearson’s r to identify correlations
Analysing the Data
r2 represents percentage of variance in X that can be explained by variable Y represents percentage of variance in Y that can be explained by variable X
but beware: correlation does not imply causatione.g. negative correlation between income and speed of internet search does earning more make you worse at using the internet? or does higher income imply greater age and less familiarity with the internet?
agehigher income
less internet experience lower performance


