63. Show that is not defined for all values of x. 64. Show that is not defined for all values of x. 65. For and g(x) x 3 1.2, find f(g(2.3)). Use two decimal places. 66. For and g(x) x 3 1.2, find g( f(4.8)). Use two decimal places. Graphs have visual impact. They also reveal information that may not be evident from verbal or algebraic descriptions. Two graphs depicting practical relationships are shown in Figure 1.3. The graph in Figure 1.3a describes the variation in total industrial production in a certain country over a 4-year period of time. Notice that the highest point on the graph occurs near the end of the third year, indicating that production was greatest at that time. The graph in Figure 1.3b represents population growth when environmental fac- tors impose an upper bound on the possible size of the population. It indicates that the rate of population growth increases at first and then decreases as the size of the population gets closer and closer to the upper bound. To represent a function y f(x) geometrically as a graph, it is common practice to use a rectangular coordinate system on which units for the independent variable x are marked on the horizontal axis and those for the dependent variable y are marked on the vertical axis. FIGURE 1.3 (a) A production function. (b) Bounded population growth. Production Highest point 0 0 2 1 4 3 Time (years) Moment of maximum production Population Time Moment of most rapid growth (a) (b) Upper bound f(x) 2x 1 f(x) 2x 1 y 7x 2 4 x 3 2x 4 y 4x 2 3 2x 2 x 3 16 Chapter 1 Functions, Graphs, and Limits The Graph of a Function 2
Transcript
63. Show that is not defined for all values of x.
64. Show that is not defined for all values of x.
65. For and g(x) � x3 � 1.2, find f(g(2.3)). Use two decimal places.
66. For and g(x) � x3 � 1.2, find g( f(4.8)). Use two decimal places.
Graphs have visual impact. They also reveal information that may not be evident fromverbal or algebraic descriptions. Two graphs depicting practical relationships areshown in Figure 1.3.
The graph in Figure 1.3a describes the variation in total industrial production in acertain country over a 4-year period of time. Notice that the highest point on the graphoccurs near the end of the third year, indicating that production was greatest at that time.
The graph in Figure 1.3b represents population growth when environmental fac-tors impose an upper bound on the possible size of the population. It indicates thatthe rate of population growth increases at first and then decreases as the size of thepopulation gets closer and closer to the upper bound.
To represent a function y � f(x) geometrically as a graph, it is common practiceto use a rectangular coordinate system on which units for the independent variable xare marked on the horizontal axis and those for the dependent variable y are markedon the vertical axis.
FIGURE 1.3 (a) A production function. (b) Bounded population growth.
Production
Highest point
0 021 43Time (years)
Moment of maximum production
Population
Time
Moment of most rapid growth
(a) (b)
Upperbound
f(x) � 2�x � 1
f(x) � 2�x � 1
y �7x2 � 4
x3 � 2x � 4
y �4x2 � 3
2x2 � x � 3
16 Chapter 1 Functions, Graphs, and Limits
The Graph of aFunction
2
In Chapter 3, you will see efficient techniques involving calculus that can be usedto draw accurate graphs of functions. For many functions, however, you can make afairly good sketch by the elementary method of plotting points, which can be sum-marized as follows.
Graph the function f(x) � x2.
SolutionBegin by constructing the table
x �3 �2 �1 0 1 2 3
y � x2 9 4 1 0 1 4 9
Then plot the points (x, y) and connect them with the smooth curve shown in Figure1.4a.
1
4
1
4
1
2�
1
2
How to Sketch the Graph of a Function f by Plotting Points
1. Choose a representative collection of numbers x from the domain of f andconstruct a table of function values y � f(x) for those numbers.
2. Plot the corresponding points (x, y).
3. Connect the plotted points with a smooth curve.
The Graph of a Function � The graph of a function f consists ofall points (x, y) where x is in the domain of f and y � f(x); that is, all points ofthe form (x, f(x)).
Chapter 1 � Section 2 The Graph of a Function 17
EXAMPLE 2 .1EXAMPLE 2 .1E x p l o r e !E x p l o r e !Graph f(x) � x2, f(x) � x2 � 2,
and f(x) � x2 � 3 on your
graphing calculator. Compare
these graphs with those of
f(x � 2) � (x � 2)2
and
f(x � 3) � (x � 3)2.
Many different curves pass through the points in Example 2.1. Several ofthese curves are shown in Figure 1.4b. There is no way to guarantee that thecurve we pass through the plotted points is the actual graph of f. However,in general, the more points that are plotted, the more likely the graph is tobe reasonably accurate.
The next example illustrates how to sketch the graph of a function defined bymore than one formula.
Graph the function
SolutionWhen making a table of values for this function, remember to use the formula thatis appropriate for each particular value of x. Using the formula f(x) � 2x when
0 � x � 1, the formula f(x) � when 1 � x � 4, and the formula f(x) � 3 when
x � 4, you can compile the following table:
2
x
f(x) � �2x
2/x
3
if 0 � x < 1
if 1 � x < 4
if x � 4
x
y
(b)
x
y
x
y
18 Chapter 1 Functions, Graphs, and Limits
x
y
(a)
FIGURE 1.4 (a) The graph of y � x2. (b) Other graphs through the points in Example 2.1.
EXAMPLE 2 .2EXAMPLE 2 .2
Note
E x p l o r e !E x p l o r e !Certain functions must be en-
tered into the graphing calcula-
tor in sections. For example, the
absolute value function
can be represented by
Y1 � X(X � 0) � X(X � 0)
Similarly, the function f(x) in Ex-
ample 2.2 can be represented by
Y2 � 2X(0 � X)(X � 1) �
(2/X)(1 � X)(X � 4) � 3(X � 4)
Graph Y2 using an appropriate
viewing rectangle.
g(x) � �x
�x
if x � 0
if x � 0
Now plot the corresponding points (x, f(x)) and draw the graph as in Figure 1.5. Noticethat the pieces for 0 � x � 1 and 1 � x � 4 are connected to one another at (1, 2)but that the piece for x � 4 is separated from the rest of the graph. [The “open dot”
at indicates that the graph approaches this point but that the point is not
actually on the graph.]
The points (if any) where a graph crosses the x axis are called x intercepts, and sim-ilarly, the y intercepts are where the graph crosses the y axis. Intercepts are key fea-tures of a graph and can be determined using algebra or technology in conjunctionwith the following criteria.
How to Find the x and y Intercepts � To find any y interceptof y � f(x), set x � 0 and solve for y. To find any x intercept of y � f(x), sety � 0 and solve for x. Finding y intercepts is usually easy, but x intercepts maybe hard to obtain.
INTERCEPTS
FIGURE 1.5 The graph of f (x) �
x
y
3
1
0 1 2 3 4 5 6
2
�4, 1
2�
Chapter 1 � Section 2 The Graph of a Function 19
x 0 1 2 3 4 5 6
f(x) 0 1 2 1 3 3 32
3
1
2
�2x2x3
0 � x � 1
1 � x � 4
x � 4.
Graph the function f(x) � �x2 � x � 2. Include all x and y intercepts.
SolutionThe y intercept is f(0) � 2. To find the x intercepts, solve the equation f(x) � 0. Fac-toring, we find that
Thus, the x intercepts are (�1, 0) and (2, 0).
Next, make a table of values and plot the corresponding points (x, f(x)).
x �3 �2 �1 0 1 2 3 4
f(x) �10 �4 0 2 2 0 �4 �10
The graph of f is shown in Figure 1.6.
The factoring in Example 2.3 is fairly straightforward, but in other problems,you may need to review the factoring procedure provided in Appendix A2.
Graph the function f(x) � x3 � x2 � 6x. Include all x and y intercepts.
SolutionThe y intercept is f(0) � 0. To find the x intercepts, set f(x) equal to 0 and solve forx by factoring the equation as follows:
so that
It follows that the x intercepts are (0, 0), (3, 0), and (�2, 0).
x � 0, x � 3, or x � �2
� x(x � 3)(x � 2)
0 � x3 � x2 � 6x � x(x2 � x � 6)
x � �1, x � 2
�(x � 1)(x � 2) � 0
�x2 � x � 2 � 0
20 Chapter 1 Functions, Graphs, and Limits
EXAMPLE 2 .3EXAMPLE 2 .3
EXAMPLE 2 .4EXAMPLE 2 .4
Note
x
y
(0, 2) (1, 2)
(–1, 0) (2, 0)
(–2, –4) (3, –4)
(–3, –10) (4, –10)
FIGURE 1.6 The graph of f (x) � �x2 � x � 2.
E x p l o r e !E x p l o r e !Using your graphing utility,
locate the x intercepts of f(x) �
�x2 � x � 2. These intercepts
can be located by first using the
ZOOM button and then con-
firmed by using the root finding
feature of the graphing utility.
Do the same for g(x) � x2 �
x � 4. What radical form do
these roots have?
Chapter 1 � Section 2 The Graph of a Function 21
Next, make a table of values (including the intercepts) and plot the correspond-ing points (x, f(x)):
x �3 �2 �1 0 1 2 3 4
f(x) �18 0 4 0 �6 �8 0 24
The graph is shown in Figure 1.7.
The graphs in Figures 1.4a and 1.6 are called parabolas. In general, the graph of y �Ax2 � Bx � C is a parabola as long as A � 0. All parabolas have a “U shape,” andthe parabola y � Ax2 � Bx � C opens up if A 0 and down if A � 0. The “peak”
or “valley” of the parabola is called its vertex, and it always occurs where
(Figure 1.8; see also Problem 41). These features of the parabola are derived by the methods of calculus developed in Chapter 3. Note that to get a reasonable sketch ofthe parabola y � Ax2 � Bx � C, you need only determine three key features:
1. The location of the vertex
2. Whether the parabola opens up (A 0) or down (A � 0)
3. Any intercepts
�where x ��B
2A �
x ��B
2A
GRAPHING PARABOLAS
FIGURE 1.7 The graph of the function y � x3 � x2 � 6x.
x
y
–2 –1 1 2 3 4
–10
–5
5
10
15
For instance, in Example 2.3, the parabola y � �x2 � x � 2 opens downward (since
A � �1 is negative) and has its vertex (high point) at .
Parabolas play a useful role in applications involving business and economics.For instance, suppose it is known that 60 � x units of a certain commodity will besold when the price is x dollars per unit. Then the revenue derived from selling theunits is given by the function
R(x) � x(60 � x) � �x2 � 60x
whose graph is a downward opening parabola with vertex (top point) at x �
(see Figure 1.9). You can interpret this result as saying that the largest
possible revenue may be obtained by charging $30 per unit. Optimization problemssuch as this will be examined further in Section 4 and again in Chapter 3.
FIGURE 1.9 A revenue function.
x (units)
R (dollars)
300 60
R � x (60 � x)
�60
2(�1)� 30
FIGURE 1.8 The graph of the parabola y � Ax2 � Bx � C. (a) If A 0, the parabola opensup. (b) If A � 0, the parabola opens down.
x
y
x
y
(a) (b)Vertex
x =2A–Bx =
2A–B
Vertex
x ��B
2A�
�1
2(�1)�
1
2
22 Chapter 1 Functions, Graphs, and Limits
E x p l o r e !E x p l o r e !Refer to the graph in Example
2.4. Consider the function g(x)
� x3 � x2 � 6x � 3. Conjecture
what the value of the x inter-
cepts and y intercept will be for
g(x). Use your graphing utility
to check your conjecture.
Sometimes it is necessary to determine when two functions are equal. For instance,an economist may wish to compute the market price at which the consumer demandfor a commodity will be equal to supply. Or a political analyst may wish to predicthow long it will take for the popularity of a certain challenger to reach that of theincumbent. We shall examine some of these applications in Section 4.
In geometric terms, the values of x for which two functions f(x) and g(x) are equalare the x coordinates of the points where their graphs intersect. In Figure 1.10, thegraph of y � f(x) intersects that of y � g(x) at two points, labeled P and Q. To findthe points of intersection algebraically, set f(x) equal to g(x) and solve for x. This pro-cedure is illustrated in Example 2.5.
The quadratic formula is used in Example 2.5. Recall that this result saysthat the equation Ax2 � Bx � C � 0 has real solutions if and only if D �B2 � 4AC � 0, in which case, the solutions are
and
A review of the quadratic formula may be found in Appendix A2.
Find all points of intersection of the graphs of f(x) � 3x � 2 and g(x) � x2.
SolutionYou must solve the equation x2 � 3x � 2. Rewrite the equation as x2 � 3x � 2 � 0and apply the quadratic formula to obtain
r2 ��B � �B2 � 4AC
2Ar1 �
�B � �B2 � 4AC
2A
FIGURE 1.10 The graphs of y � f (x) and y � g(x) intersect at P and Q.
x
y
P
Q
y = f(x)
y = g(x)
0
INTERSECTIONS OF GRAPHS
Chapter 1 � Section 2 The Graph of a Function 23
E x p l o r e !E x p l o r e !Use your graphing utility to find
all points of intersection of the
graphs of f(x) � 3x � 2 and g(x)
� x2.
Note
EXAMPLE 2 .5EXAMPLE 2 .5
The solutions are
and
(The computations were done on a calculator, with results rounded off to two deci-mal places.)
Computing the corresponding y coordinates from the equation y � x2, you findthat the points of intersection are approximately (3.56, 12.67) and (�0.56, 0.31). (Asa result of round-off errors, you will get slightly different values for the y coordinatesif you substitute into the equation y � 3x � 2.) The graphs and the intersection pointsare shown in Figure 1.11.
A power function is a function of the form f(x) � xn, where n is a real number. For example, f(x) � x2, f(x) � x�3, and f(x) � x1/2 are all power functions. So are f(x)
� and f(x) � since they can be rewritten as f(x) � x�2 and f(x) � x1/3, respectively.
A polynomial is a function of the form
p(x) � a0 � a1x � a2x2 � . . . � anxn
where n is a nonnegative integer and a0, a1, . . . , an are constants. If an � 0, the inte-ger n is called the degree of the polynomial. For example, the function f(x) � 3x5 �6x2 � 7 is a polynomial of degree 5. It can be shown that the graph of a polynomialof degree n is an unbroken curve that crosses the x axis no more than n times. Toillustrate some of the possibilities, the graphs of three polynomials of degree 3 areshown in Figure 1.12.
FIGURE 1.12 Three polynomials of degree 3.
y = x3y = x3 – 2x2
y = x3 – 4x
y y y
x x x
�3 x1
x2
POWER FUNCTIONS,POLYNOMIALS, AND RATIONAL
FUNCTIONS
x �3 � �17
2� �0.56x �
3 � �17
2� 3.56
x ��(�3) � �(�3)2 � 4(1)(�2)
2(1)�
3 � �17
2
24 Chapter 1 Functions, Graphs, and Limits
x
y
(–0.56, 0.31)
(3.56, 12.67)
0
FIGURE 1.11 The intersection ofthe graphs of f (x) � 3x � 2 andg(x) � x2.
A quotient of two polynomials p(x) and q(x) is called a rational function.
Such functions appear throughout this text in examples and exercises. Graphs of threerational functions are shown in Figure 1.13. You will learn how to sketch such graphsin Section 3 of Chapter 3.
It is important to realize that not every curve is the graph of a function (Figure 1.14).For instance, suppose the circle x2 � y2 � 5 were the graph of some function y �f(x). Then, since the points (1, 2) and (1, �2) both lie on the circle, we would havef(1) � 2 and f(1) � �2, contrary to the requirement that a function assigns one andonly one value to each number in its domain. This example suggests the followinggeometric rule for determining whether a curve is the graph of a function.
FIGURE 1.14 The vertical line test.
y
x
(a) The graph of a function
y
x
(b) Not the graph of a function
The Vertical Line Test � A curve is the graph of a function if andonly if no vertical line intersects the curve more than once.
THE VERTICAL LINE TEST
FIGURE 1.13 Graphs of three rational functions.
y
x
y
x
y
x
y = xx – 1
y = xx2 + 1
y = 1x2
p(x)
q(x)
Chapter 1 � Section 2 The Graph of a Function 25
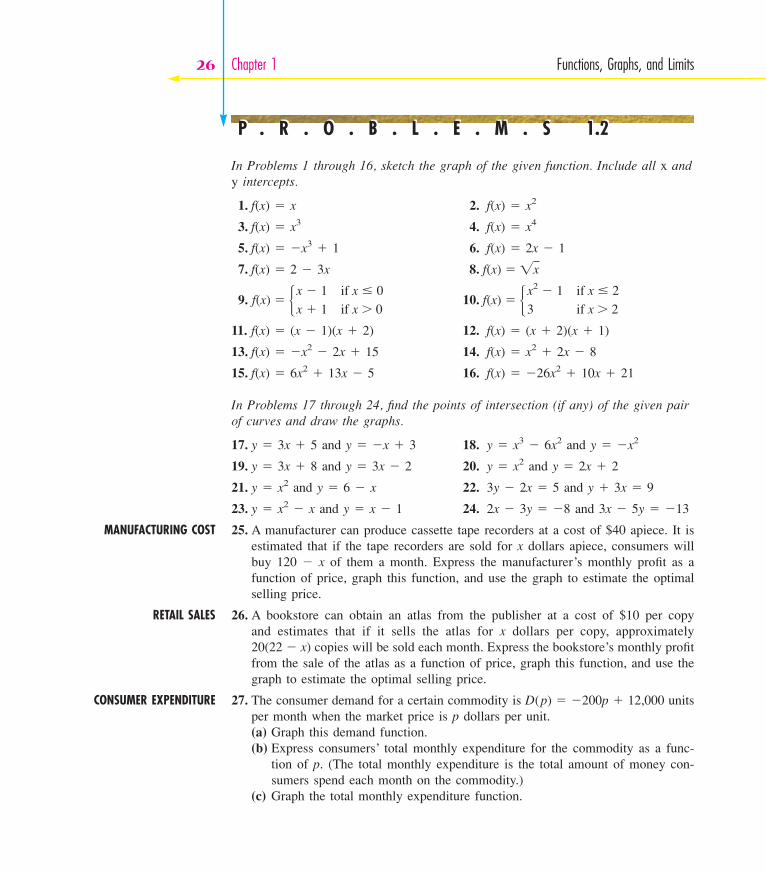
In Problems 1 through 16, sketch the graph of the given function. Include all x andy intercepts.
In Problems 17 through 24, find the points of intersection (if any) of the given pairof curves and draw the graphs.
17. y � 3x � 5 and y � �x � 3 18. y � x3 � 6x2 and y � �x2
19. y � 3x � 8 and y � 3x � 2 20. y � x2 and y � 2x � 2
21. y � x2 and y � 6 � x 22. 3y � 2x � 5 and y � 3x � 9
23. y � x2 � x and y � x � 1 24. 2x � 3y � �8 and 3x � 5y � �13
MANUFACTURING COST 25. A manufacturer can produce cassette tape recorders at a cost of $40 apiece. It isestimated that if the tape recorders are sold for x dollars apiece, consumers willbuy 120 � x of them a month. Express the manufacturer’s monthly profit as afunction of price, graph this function, and use the graph to estimate the optimalselling price.
RETAIL SALES 26. A bookstore can obtain an atlas from the publisher at a cost of $10 per copy and estimates that if it sells the atlas for x dollars per copy, approximately 20(22 � x) copies will be sold each month. Express the bookstore’s monthly profitfrom the sale of the atlas as a function of price, graph this function, and use thegraph to estimate the optimal selling price.
CONSUMER EXPENDITURE 27. The consumer demand for a certain commodity is D(p) � �200p � 12,000 unitsper month when the market price is p dollars per unit.(a) Graph this demand function.(b) Express consumers’ total monthly expenditure for the commodity as a func-
tion of p. (The total monthly expenditure is the total amount of money con-sumers spend each month on the commodity.)
(c) Graph the total monthly expenditure function.
f(x) � �x2 � 1
3
if x � 2
if x 2f(x) � �x � 1
x � 1
if x � 0
if x 0
f(x) � �x
26 Chapter 1 Functions, Graphs, and Limits
P . R . O . B . L . E . M . S 1.2P . R . O . B . L . E . M . S 1.2
(d) Discuss the economic significance of the p intercepts of the expenditurefunction.
(e) Use the graph in part (c) to estimate the market price that generates the great-est consumer expenditure.
MOTION OF A PROJECTILE 28. If an object is thrown vertically upward from the ground with an initial speed of160 feet per second, its height (in feet) t seconds later is given by the functionH(t) � �16t2 � 160t.(a) Graph the function H(t).(b) Use the graph in part (a) to determine when the object will hit the ground.(c) Use the graph in part (a) to estimate how high the object will rise.
AVERAGE COST 29. Suppose the total cost of manufacturing x units of a certain commodity is C(x) �
x3 �2x�5 dollars. Express the average cost per unit as a function of the number
of units produced and, on the same set of axes, sketch the total cost and averagecost functions. [Hint: Average cost is total cost divided by the number of unitsproduced.]
POISEUILLE’S LAW 30. Recall from Problem 53, Section 1.1, that the speed of blood located r centime-ters from the central axis of an artery is given by the function S(r) � C(R2 � r2),where C is a constant and R is the radius of the artery.* What is the domain ofthis function? Sketch the graph of S(r).
MICROBIOLOGY 31. A spherical cell of radius r has volume V � �r3 and surface area S � 4�r2.
Express V as a function of S. If S is doubled, what happens to V?
32. (a) Graph the functions y � x2 and y � x2 � 3. How are the graphs related?(b) Without further computation, graph the function y � x2 � 5.(c) Suppose g(x) � f(x) � c, where c is a constant. How are the graphs of f and
g related? Explain.
33. (a) Graph the functions y � x2 and y � �x2. How are the graphs related?(b) Suppose g(x) � �f(x). How are the graphs of f and g related? Explain.
34. (a) Graph the functions y � x2 and y � (x � 2)2. How are the graphs related?(b) Without further computation, graph the function y � (x � 1)2.(c) Suppose g(x) � f(x � c), where c is a constant. How are the graphs of f and
g related? Explain.
35. It costs $90 to rent a piece of equipment plus $21 for every day of use.(a) Make a table showing the number of days the equipment is rented and the cost
of renting for 2 days, 5 days, 7 days, and 10 days.
4
3
1
6
Chapter 1 � Section 2 The Graph of a Function 27
* E. Batschelet, Introduction to Mathematics for Life Scientists, 2nd ed., New York: Springer-Verlag,1976, pp. 102–103.
(b) Write an algebraic expression representing the cost y as a function of the num-ber of days x.
(c) Graph the expression in part (b).
36. Graph g(x) � �3x2 � 7x � 4 and find the x intercepts.
37. Use your graphing utility to graph y � x4, y � x4 � x, y � x4 � 2x, and y �x4 � 3x on the same coordinate axes, using [�2, 2]1 by [�2, 5]1. What effectdoes the added term involving x have on the shape of the graph? Repeat using y� x4, y � x4 � x3, y � x4 � 2x3, and y � x4 � 3x3. Adjust the viewing rectan-gle appropriately.
38. In each of the cases shown in the figure, use the vertical line test to determinewhether the given curve is the graph of a function.
39. Show that the distance d between the two points (x1, y1) and (x2, y2) is given bythe formula
[Hint: Apply the Pythagorean theorem to the right triangle whose hypotenuse isthe line segment joining the two given points.] Then use the distance formula tofind the distance between these points:(a) (5, �1) and (2, 3)(b) (2, 6) and (2, �1)
40. Use the distance formula in Problem 39 to show that the circle with center (a, b)and radius R has the equation
(x � a)2 � (y � b)2 � R2
d � �(x2 � x1)2 � ( y2 � y1)2
y y y
x x x
(a) (b) (c)
28 Chapter 1 Functions, Graphs, and Limits
x
y
d
(x2, y2)
(x1, y1)
PROBLEM 39
41. Show that the vertex of the parabola y � Ax2 � Bx � C (A � 0) occurs at the
point where x � . [Hint: First verify that
Then note that the largest or smallest value of
f(x) � Ax2 � Bx � C
must occur where x � .
42. Graph . Determine the values of x for which the function
is defined.
43. Graph . Determine the values of x for which the function is
defined.
In many practical situations, the rate at which one quantity changes with respect toanother is constant. Here is a simple example from economics.
A manufacturer’s total cost consists of a fixed overhead of $200 plus production costsof $50 per unit. Express the total cost as a function of the number of units producedand draw the graph.