21
Page 1 of 21 Clinical Movement Analysis Society of UK and Ireland 16th Annual Meeting MediaCity University of Salford 6 th & 7 th April 2017 Premier sponsors

Page 1 of 21
Clinical Movement Analysis Society
of UK and Ireland
16th Annual Meeting
MediaCity
University of Salford
6th & 7th April 2017
Premier sponsors

Page 2 of 21
Meeting Sponsors

Page 3 of 21
Prizes Two prizes will be awarded at the conference.
The VICON prize for the best overall presentation at the conference. This prize is the registration fee for the ESMAC conference in Trodheim in September.
The BTS prize for the best student presentation. This is awarded to a presentation either presented by a student or which has been conducted primarily by a student.
It is a BTS G-WALK accelerometer based gait analysis system.
Both prizes will be awarded by a committee of three judges.

Page 4 of 21
Keynote Speakers
BTS Keynote – Thomas Dreher
Thomas Dreher is Head of Department of Paediatric Orthopaedics and Medical Director of Movement Analysis at the University Hospital in Heidelberg.
He is now Editor in Chief of Gait and Posture and a Board Member of the European Society for Movement Analysis in Adults and Children with special responsibilities for course organisation. He has over 90 publications in peer-reviewed journals, most of them focussing on aspects of paediatric orthopaedics and clinical gait analysis.
Does gait analysis really affects clinical decision making?
Three-dimensional gait analysis has a long tradition as a diagnostic tool in paediatric orthopaedics, especially in the treatment of cerebral palsy. Furthermore, it is established as an objective tool to report and monitor outcomes of interventions. However, despite three-dimensional gait analysis is effective in refining indications and dosage of interventions and in further understanding different gait pathologies to optimize treatment recommendations, many clinicians still ignore these findings and rely only on findings of clinical and radiographic evaluation.
In my lecture, I will focus on advances in patient treatment as a result of using gait analysis. Furthermore, I will discuss lessons we have learned from outcome evaluations using gait analysis and resulting changes in strategies of treatment. Another part of this talk will emphasize strategies to encourage clinicians to use gait analysis data to optimize their results and as a way to standardize indications and treatment principles.
In this context, the role of a journal like Gait and Posture to be responsible in sharing this experience within the interdisciplinary team is discussed and highlighted.

Page 5 of 21
Andy Ries
Engineer and Researcher at the Center for Gait and Motion Analysis – Gillette Children’s Specialty Healthcare, St Paul, MN, USA.
Andy will receive his PhD degree in Mechanical Engineering from the University of Minnesota in early 2017 and has focused his research work on investigating the efficacy of ankle foot orthoses for gait outcomes. In addition he manages the gait lab’s clinical database which is comprised of over 20 years’ worth of clinical gait data.
The critical importance of big data in clinical gait analysis
Clinical gait analysis relies on the collection of high quality motion capture, physical exam, and survey data. This mix of data seems a natural fit for the emerging field of big data analytics. However, the power of big data cannot be realistically harnessed without leveraging data management techniques.
In this talk, I will discuss with you the design and functionality of an established clinical gait database that was built to support both clinical and research tasks. I will demonstrate how a well-designed database can be utilized for day-to-day clinical tasks such as improving data reliability, speeding up data collection and processing, and enhancing data reporting. I will also demonstrate how the clinical gait database can be utilized for research tasks such as generating study samples, collating large datasets for big data analytics, and monitoring overall data quality. Finally, I will discuss some interesting scientific findings that challenging existing gait analysis paradigms, which could only have been discovered by leveraging nearly two decades worth of clinical gait data.
Nicola Fry One Small Step Gait Lab, Guy's and St Thomas' NHS Foundation Trust.
Following an engineering degree at Durham university Nicola completed the Clinical Scientist Training Programme. For her MSc project she developed an ultrasonic anatomical pointer for measuring the length of muscles. This led to her PhD in musculo-skeletal deformity in cerebral palsy. Nicola currently works part-time in a mainly clinical role with involvement in the some of the research projects.
Is standing just walking without moving?
Cerebral palsy is often considered to be a disorder of movement, and yet many of our interventions primarily aim to change the structure of the musculo-skeleton to improve alignment. Alignment of the skeleton is important in walking because it reduces muscle forces and therefore the energy cost of walking. Correct alignment may be even more important in standing since we need to stand for prolonged periods to carry out many of the activities of daily living. However, little is known of the 'dynamics' of standing in cerebral palsy or of the impact of surgical intervention on skeletal alignment in standing. In this talk I will look at the relationships between standing and walking in terms of joint angles and moments and the impact of surgical intervention on these.

Page 6 of 21
Thursday 6th April
10:00-12:00 CMAS Committee meeting Room 3.10
10:00-12:00 CMAS Standards Group meeting Room 3.08
12:00-1:00 Lunch 3.06
1:00-1:45 CMAS business (standards and education issues)
Rory O’Sullivan Recurrent Internal Hip Rotation- what do we do? 3.10/3.11
1:45-2:00 Clinical Data Interpretation Workshop: Introduction 3.10/3.11
2:00-3:00 Clinical Data Interpretation Workshop: Case 1 3.10/3.11 & 3.07/3.08
3:00-3:30 Coffee 3.06
3:30-4:30 Clinical Data Interpretation Workshop: Case 2 3.10/3.11 & 3.07/3.08
4:30-5:30 User groups
Vicon
3.10/3.11
7:00 Drinks Renaissance Manchester City
Centre Hotel 7:30 Conference Banquet

Page 7 of 21
Friday 7th April
9:00-9:45 Keynote 1: Dr Thomas Dreher 3.10/3.11
9:45-10:35
Free presentations
Frederic Chantraine Clinical gait analysis as a validation tool for a new classification of chronic hemiparetic stroke patients.
Hannah Shepherd Gait deviations in a European cohort with Alkaptonuria
Tariq Kwaees Exploring the Effects of a Non-mechanical Knee Brace on Lower Limb Kinematics & Kinetics in Healthy Individuals & its Implications for Patients with Osteoarthritis
Bruce Carse Energy expenditure during gait with unilateral transfemoral amputees: differences between military and civilian populations
Andrew Lewis Gait analysis - comparison of patient EMG to normal reference data – the need to normalise timings
3.10/3.11
10:30-11:00 Coffee 3.06
11:00-11:40
Free presentations
Claudiane Fukuchi A modified Gait Profile Score considering the effect of gait speed
Celine Schreiber The importance of accounting for the contribution of walking speed on kinematics in clinical gait analysis: an example based on the stiff knee gait pattern observed in stroke patients
Elene Eusterwiemann Is that a Vicon in your pocket? An evaluation of the Leap Motion capturing finger movements
Alex Mbuli The Biomechanical Effects of Using an adjustable Incline Device for Lower Limb Stretching Exercises
3.10/3.11
11:40-12:30 Keynote 2: Dr. Nicky Fry 3.10/3.11
12:30-13:30 Lunch 3.06
1:15-1:45 AGM 3.10/3.11
1:45-2:30 Keynote 3: Andy Ries 3.10/3.11
2.30-3.30 Movement analysis across the ICF 3.10/3.11
3:30-3:50 Clinical Data Interpretation Workshop: Feedback 3.10/3.11
3:50-4:00 Prize giving and close 3.10/3.11

Page 8 of 21
Page 9 of 21
Case Study – for Education session Recurrent Internal Hip Rotation- what do we do?
Rory O’Sullivan Central Remedial Clinic, Dublin, Ireland.
Internal hip rotation in cerebral palsy (CP) is typically treated surgically with a femoral derotation osteotomy (FDRO). This is largely a successful intervention with good long-term outcomes but recurrence rates up to 33% have been reported. Risk factors for recurrence include younger age (<10 years old), reduced hip joint impulse and ankle plantar-flexion1.
In clinical practice these patients present a significant challenge both to identify before intervention is planned and then to decide how best to intervene, if at all.
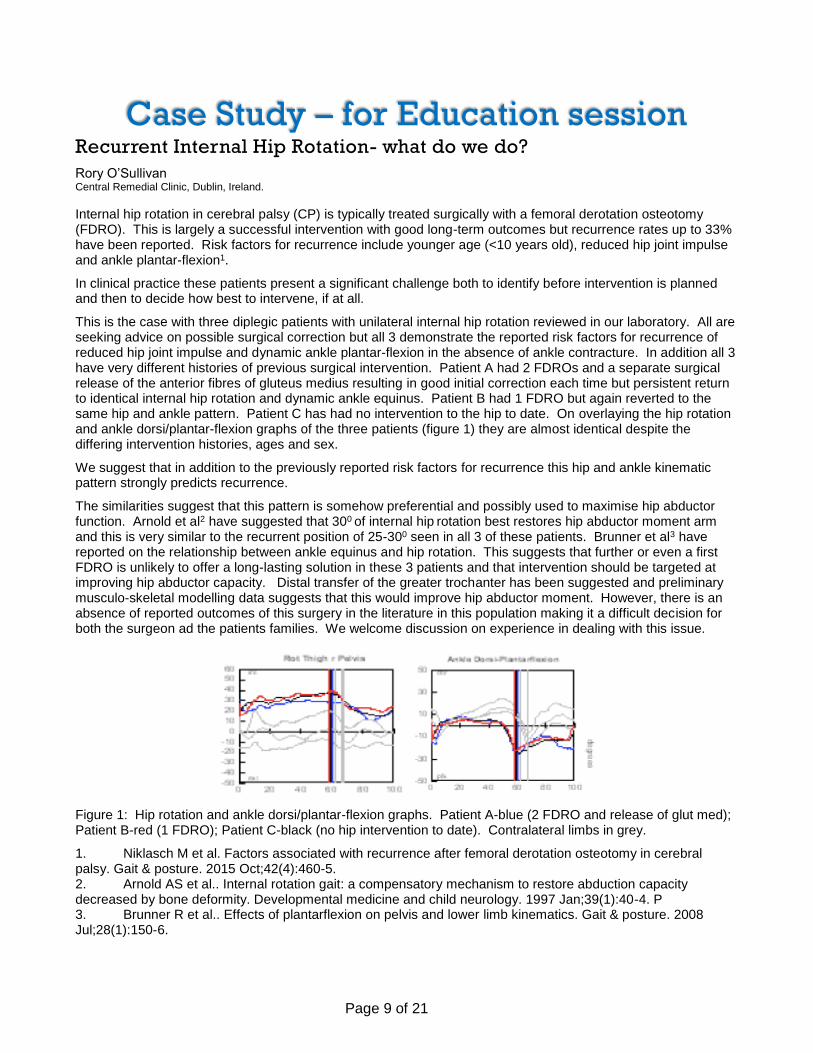
This is the case with three diplegic patients with unilateral internal hip rotation reviewed in our laboratory. All are seeking advice on possible surgical correction but all 3 demonstrate the reported risk factors for recurrence of reduced hip joint impulse and dynamic ankle plantar-flexion in the absence of ankle contracture. In addition all 3 have very different histories of previous surgical intervention. Patient A had 2 FDROs and a separate surgical release of the anterior fibres of gluteus medius resulting in good initial correction each time but persistent return to identical internal hip rotation and dynamic ankle equinus. Patient B had 1 FDRO but again reverted to the same hip and ankle pattern. Patient C has had no intervention to the hip to date. On overlaying the hip rotation and ankle dorsi/plantar-flexion graphs of the three patients (figure 1) they are almost identical despite the differing intervention histories, ages and sex.
We suggest that in addition to the previously reported risk factors for recurrence this hip and ankle kinematic pattern strongly predicts recurrence.
The similarities suggest that this pattern is somehow preferential and possibly used to maximise hip abductor function. Arnold et al2 have suggested that 300 of internal hip rotation best restores hip abductor moment arm and this is very similar to the recurrent position of 25-300 seen in all 3 of these patients. Brunner et al3 have reported on the relationship between ankle equinus and hip rotation. This suggests that further or even a first FDRO is unlikely to offer a long-lasting solution in these 3 patients and that intervention should be targeted at improving hip abductor capacity. Distal transfer of the greater trochanter has been suggested and preliminary musculo-skeletal modelling data suggests that this would improve hip abductor moment. However, there is an absence of reported outcomes of this surgery in the literature in this population making it a difficult decision for both the surgeon ad the patients families. We welcome discussion on experience in dealing with this issue.
Figure 1: Hip rotation and ankle dorsi/plantar-flexion graphs. Patient A-blue (2 FDRO and release of glut med); Patient B-red (1 FDRO); Patient C-black (no hip intervention to date). Contralateral limbs in grey.
1. Niklasch M et al. Factors associated with recurrence after femoral derotation osteotomy in cerebral palsy. Gait & posture. 2015 Oct;42(4):460-5. 2. Arnold AS et al.. Internal rotation gait: a compensatory mechanism to restore abduction capacity decreased by bone deformity. Developmental medicine and child neurology. 1997 Jan;39(1):40-4. P 3. Brunner R et al.. Effects of plantarflexion on pelvis and lower limb kinematics. Gait & posture. 2008 Jul;28(1):150-6.
Page 10 of 21
Abstracts Clinical gait analysis as a validation tool for a new classification of
chronic hemiparetic stroke patients
F. Chantraine1, P. Filipetti1, C. Schreiber1, A. Remacle1, E.Kolanowski1, F. Moissenet1
1 Centre National de Rééducation Fonctionnelle et de Réadaptation – Rehazenter, Laboratoire d’Analyse du Mouvement et de la Posture (LAMP), Luxembourg
Introduction: Classification is a common clinical tool easing intra and inter-team communication, as well as the development of pathology management algorithms. Especially, it has been intensively applied to describe the gait pattern of cerebral palsy children. In the case of hemiparetic adults (following stroke or any central nervous system lesion), the primary gait abnormalities to be managed are those observed during the swing phase: 1) a decrease in the range of hip flexion/extension, 2) an abnormality in knee flexion, 3) a reduced ankle dorsiflexion. Indeed, these abnormalities impact foot clearance and thus increase the risk of fall. Several classifications have been proposed to describe the gait pattern of hemiparetic adults. Some of them are clinically driven and conduct to meaningful groups. However, none has demonstrated the existence of a statistical evidence validating a difference between groups. On the other hand, statistically driven classifications have been introduced but failed to identify the three primary gait abnormalities defined above.
Research question: This study aimed to define a new classification of adult patients with hemiparesis in chronic phase [1]. This classification, based on clinical knowledge and not requiring complex apparatus, aims to be used in clinical routine and is interested in the restoration of a functional gait. Clinical gait analysis was used as a validation tool to evaluate the potential of this classification to define groups with clear functional differences.
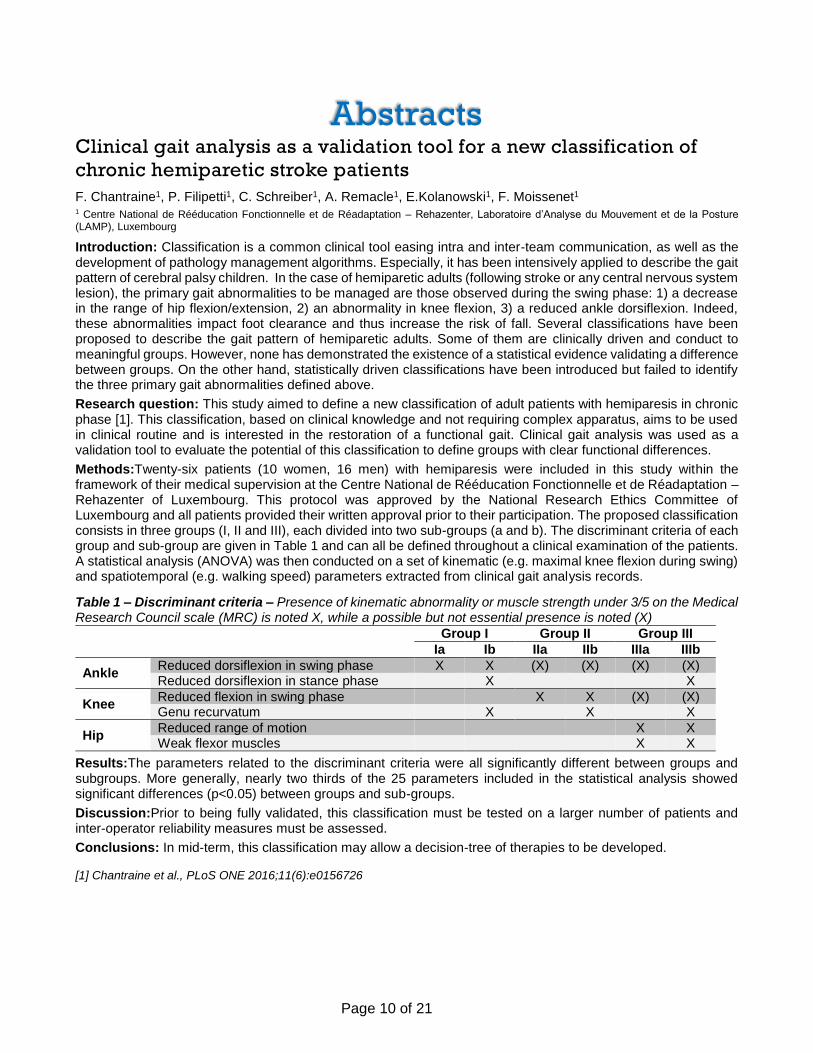
Methods:Twenty-six patients (10 women, 16 men) with hemiparesis were included in this study within the framework of their medical supervision at the Centre National de Rééducation Fonctionnelle et de Réadaptation – Rehazenter of Luxembourg. This protocol was approved by the National Research Ethics Committee of Luxembourg and all patients provided their written approval prior to their participation. The proposed classification consists in three groups (I, II and III), each divided into two sub-groups (a and b). The discriminant criteria of each group and sub-group are given in Table 1 and can all be defined throughout a clinical examination of the patients. A statistical analysis (ANOVA) was then conducted on a set of kinematic (e.g. maximal knee flexion during swing) and spatiotemporal (e.g. walking speed) parameters extracted from clinical gait analysis records.
Table 1 – Discriminant criteria – Presence of kinematic abnormality or muscle strength under 3/5 on the Medical Research Council scale (MRC) is noted X, while a possible but not essential presence is noted (X)
Group I Group II Group III
Ia Ib IIa IIb IIIa IIIb
Ankle Reduced dorsiflexion in swing phase X X (X) (X) (X) (X) Reduced dorsiflexion in stance phase X X
Knee Reduced flexion in swing phase X X (X) (X) Genu recurvatum X X X
Hip Reduced range of motion X X Weak flexor muscles X X
Results:The parameters related to the discriminant criteria were all significantly different between groups and subgroups. More generally, nearly two thirds of the 25 parameters included in the statistical analysis showed significant differences (p<0.05) between groups and sub-groups.
Discussion:Prior to being fully validated, this classification must be tested on a larger number of patients and inter-operator reliability measures must be assessed.
Conclusions: In mid-term, this classification may allow a decision-tree of therapies to be developed.
[1] Chantraine et al., PLoS ONE 2016;11(6):e0156726

Page 11 of 21
Gait deviations in a European cohort with Alkaptonuria
Hannah R Shepherd1, Lakshminarayan R Ranganath2, Mark A Robinson1, Gabor J Barton1 1Research Institute for Sport and Exercise Sciences, Liverpool John Moores University, Liverpool L3 3AF. 2National Alkaptonuria Centre, Royal Liverpool University Hospital, Liverpool L7 8XP.
Introduction: Alkaptonuria (AKU) is an ultra-rare inherited autosomal recessive metabolic disorder [1]. The defected copy of the HGD gene results in a build-up of homogentisic acid (HGA). After the oxidation of HGA, a melanin-like polymer is produced which binds to effectively all fibrous connective tissues and cartilage leading to joint ochronosis [1]. There appears to be a rapid increase of symptoms including ochronosis levels, joint pain [1, 2] and a subsequent decline in gait [3] at the age of ~30 years.
Research Question: How do gait deviations from normality change as a function of age in Alkaptonuria when
evaluating a European group of patients?
Methods: A 3D gait analysis using motion capture (Vicon Oxford, UK) was performed on 36 AKU patients (age range: 16 – 70 years, 16 females, 21 males). At the time of testing patients were not taking nitisinone treatment which might have had an effect on their gait. Reflective markers were placed on the lower limbs in accordance with the Helen Hayes model [5]. Patients were asked to walk at a self-selected speed across a 10m walkway. Data were analysed using the Movement Deviation Profile (MDP) [6], by processing each patient’s mean corrected marker coordinate data through a self-organising neural network which gave the deviation of gait from normality derived from 10 healthy controls. The MDPmean was used to represent each patient’s overall deviation from normality. MDPmean values of the 36 patients were median filtered with a sliding window size of 7 samples.
Results: All but one AKU patients had higher gait deviations from normality than the mean of controls (1.63) and most of them were outside the mean+SD of controls. While the MDPmean values are noisy, the median filtered curve shows an incline of gait deviation around 50 years of age (Figure 1).
Figure 1: Gait deviations (MDPmean) of Alkaptonuria (AKU) patients and controls as a function of their age. The MDPmean values of patients were median filtered to visualise any trends.
Discussion: Our results show a minimally elevated level of gait deviation between 16 and 50 years of age and a delayed onset of major gait deviations over 50 years. Previous results showed a similar increase of gait deviations in younger patients but an earlier major increase around 35 years of age [3]. Our explanations of the differences are speculative at this stage because only incomplete information is available about the patients to allow a blind evaluation in a larger study. One factor may be that the current cohort is from Europe and not only from the UK and so their genetic profile may be different. The level of protein intake may influence disease progression in AKU and so their dietary habits may also account for the differences. Their physical activity levels and related circulatory load are also unknown and this may also be a factor affecting the timing of symptoms’ onset.
Conclusions: Minor gait deviations develop in Alkaptonuria from young age and the rapid onset of major gait deviations can vary depending on the cohort examined, given the multifactorial causation of the onset of symptoms. For a more refined analysis a joint specific deviation of gait from normality is planned.
References: [1] Introne & Ghal, 2003. [2] Ranganath & Cox, JIMD (2011) 34:1141-1151. [3] Barton et al., JIMD Rep (2015) 24:39-44. [4] Maly, Curr Opin Rheumatol (2008) 59:547-552. [5] Davis et al., Hum Mov Sci (1991) 10:575–587. [6] Barton et al., Hum Mov Sci (2012) 31:284-294.

Page 12 of 21
Exploring the Effects of a Non-mechanical Knee Brace on Lower Limb
Kinematics & Kinetics in Healthy Individuals & its Implications for
Patients with Osteoarthritis
T. Kwaees(1, 2), A. Chohan(1), G. Rawlinson(1), J. Richards(1) 1 Allied Health Research Unit, University of Central Lancashire, UK 2 Health Education Northwest, Merseyside, UKBackground:
The use of knee braces for osteoarthritis (OA) is rarely recommended [1, 2] but represents a possible treatment
for patients not suited for surgery. Although deemed effective biomechanically, braces can be unattractive.
Controlling symptomology by altering neuromuscular control mechanisms with non-mechanical (proprioceptive)
knee braces have been previously shown in patellofemoral pain [3]. Such a device could greatly improve patient
acceptance of such devices for knee OA, however little research has examined their efficacy and symptom relief.
This study explores the biomechanical and subjective affects of a proprioceptive brace for knee OA.
Methods: 13 healthy participants and three OA cases aged 30 to 60 years volunteered for the study. They were asked to perform a 10cm stepdown tasks with and without the OA Reaction Brace (fig 1). The dominant or osteoarthritic knee was examined along with the ipsilateral ankle and hip. Kinetic and kinematic data was collected using a 10 camera Qualisys system and lower limb calibrated anatomical system technique. OA cases with mild/moderate knee OA were scored using the Knee Osteoarthritis Outcome Score (KOOS) prior to testing and after 4 weeks of use.
Figure 1: Donjoy OA Reaction Web. Anterior (A), lateral (B) and
posterior (C) aspects of the brace, under sleeve (S), Silicone (R),
fabric/Velcro (F) and metallic component.
Results: Significant changes in biomechanics during step descent were seen in both groups with the use of the brace. Knee kinematics demonstrated reductions in maximum internal rotation (p=0.005), transverse range of movement (p=0.001) and in transverse angular velocity (p=0.001) when wearing the brace in healthy participants. In the OA cases the maximum internal rotation angular velocity (p=0.006) was reduced. At the hip, healthy participants showed a reduction in maximum internal rotation angular velocity (p=0.025). However, ankle inversion angle in healthy participants increased (p=0.049) with the brace, as did the maximum supination angular velocity (p=0.010), while the maximum inversion angular velocity was reduced (p=0.024) when wearing the brace. In the OA cases only the maximum angular velocity during pronation was reduced (p=0.042). Healthy participants had increased knee flexion moment at heel strike (p = 0.019). 84.6% of healthy and all OA participants gave positive feedback on wearability of the brace. All OA participants demonstrated improvements in KOOS at four weeks across all tested parameters and were on average 85.5% in pain, 57.6% in symptomology, 81.2% in activities of daily living, 255.2% for sports and recreation and 127.7% for quality of life.
Conclusion:Significant positive changes in kinematic and kinetic variables in multiple planes can be achieved with proprioceptive bracing alongside improved patient outcome. These changes occur at the knee but analysis of other weight bearing joints should not be overlooked in future studies. This study supports the concept of neuromuscular reinforcement and re-education through proprioceptive bracing as an alternative to mechanical correction. Future studies should aim to couple the mechanism of action of a brace with the clinical grade of OA.
References:
1. NICE. (2014). National Institute for Health and Care Excellence 2014. doi:978-1-4731-0426-6
2. AAOS. (2013). Treatment of osteoarthritis of the knee (2nd ed.) American Academy of Orthopaedic Surgeons.
3. Selfe, J., et al (2011). Gait & Posture,34(1), 92-96. doi:10.1016/j.gaitpost.2011.03.019 [doi]

Page 13 of 21
Energy expenditure during gait with unilateral transfemoral
amputees: differences between military and civilian populations
Bruce Carse1, Hannah Jarvis2, John Colvin1
1 WestMARC, Queen Elizabeth University Hospital, Glasgow, 2 Dept. of Exercise and Sport Science, Manchester Metropolitan University
Introduction: Studies have shown that unilateral transfemoral (UTF) amputees walk with a less efficient gait in comparison to a normal healthy population [1]. This can cause a reduction their activity levels which can in turn reduce their ability to participate fully [2,3]. Much of the published research tends to focus on data from younger cohort, with trauma as the most prevalent reason for amputation [1]. Research Question: How does energy expenditure differ between civilian and military UTF amputees? Methods: Data was collected as part of an audit for the Scottish Specialist Prosthetics Service Subjects, with 44 UTF amputees included. Civilian UTF amputees had the following levels of mobility [4]; K1 (n=1), K2 (n=10), K3 (n=20), K4 (n=13). Military UTF data was taken from a published study [1] and normal healthy adult data was collected locally with descriptive data for all three groups given in Table 1. Metabolic energy expenditure measurements were taken using a Cosmed K4B2 system, and net oxygen utilisation data were normalised using a nondimensional scheme [5]. Measurements were taken during five minutes quiet standing followed by five minutes walking at a self-selected pace where a ‘steady state’ was achieved. Table 1 Descriptive data
Civilian UTF (n=44) Military UTF (n=10) Normal adults (n=10)
Age (years) 55 (14) 29 (3) 51 (9)
BMI 27 (5) 27 (2) 27 (3)
Time since amputation (years) 19.5 (15.9) 3.3 (2.3) -
Results: Normal healthy adults had an oxygen cost of 0.26 (0.05), military UTF amputees 0.25 (0.07) and civilian UTF amputees 0.4 (0.14) as shown in Figure 1. Civilian amputees have a higher oxygen cost than normal adults (p<0.005) and military amputees (p<0.005). Civilian amputees, on average, have a 47% higher oxygen cost during walking than age and BMI-matched healthy adults. Discussion and Conclusions: The civilian UTF amputees demonstrated a significantly greater oxygen cost of walking compared to both military amputees and normal adults, which indicates a less efficient gait pattern. Greater variation in age, time since amputation, BMI and reason for amputation are factors likely to influence this finding. Military UTF amputees also received more rehabilitation than the civilian group, suggesting that increasing the amount of rehabilitation could improve gait efficiency in the civilian group. The between-group differences described here suggest that the validity of previous studies may not be applicable to civilian populations routinely using NHS prosthetics services. References
1. Jarvis et al. Arch Phys Med Rehab. (2016) 4. Gailey et al., Arch Phys Med Rehab. 83(5):613-27 (2002) 2. Lin et al. Gait Posture. 40(1): 140-4 (2014) 5. Schwartz et al. Gait Posture. 24:14-22 (2006) 3. Deans et al. Prosthet Orthot Int 322:186–200. (2008)
Figure 2 Oxygen cost of walking

Page 14 of 21
Gait analysis - comparison of patient EMG to normal reference data –
the need to normalise timings
Lewis, AP Oxford Gait Laboratory, Oxford University Hospitals NHS Foundation Trust
Introduction: Electromyography (EMG) can be a useful complementary dataset for use during clinical gait analysis. Due to the practical difficulties of collecting representative EMG and the complexity of the signal, often EMG interpretation is limited to the identification of muscle contraction timings and comparison to normal reference data. The use of standard software tools for the processing, presentation and reporting of EMG data often limits the temporal normalisation to the whole gait cycle. Indeed, some of the standard reference books (Gage, Perry) make limited or no reference to how temporal normalisation of EMG should be performed, particularly in the comparison of patient EMG to reference data. However, it is clear that muscle action timing is associated more specifically with gait periods/phases rather than the whole gait cycle, particularly when timings of phases are abnormal. There is therefore a potential need to time-normalise reference data more appropriately than is available in many standard motion capture software packages.
Research Question: Does temporal normalisation of reference EMG data to the timing of an individual’s gait phases (stance and swing) rather than their whole gait cycle alter interpretation of whether muscle timing is appropriate?
Methods: Four recent patients to the Oxford Gait Laboratory (OGL) who walked with a prolonged stance phase were selected retrospectively. EMG data was collected and processed following local protocols (Cometa ZeroWire Wave+, sampling: 1000Hz, Gain: x1000, filter: 4th Order Butterworth HP 30Hz). Data was presented both with OGL standard aged matched reference data (mean foot-off timing at 60% gait cycle, data normalised to whole gait cycle) and with the reference data re-normalised to the patient foot-off timing i.e. reference data normalised to stance and swing phases independently.
Results:
(a) reference data normalised to whole gait cycle (b) reference data normalised to patient St/Sw phase timing
Fig. 1 - Example comparison: EMG data over 3 consecutive gait cycles from 4 muscles. Mean patient foot-off timing at 90% gait cycle (solid lines – EMG, dotted line – foot-off, shaded region – OGL child reference EMG, St/Sw = stance/swing)
Discussion: Clear differences in the interpretation of appropriate muscle timing between the two normalisation methods can be seen in Figure 1. For example, hamstring activity appears prolonged in stance and mostly absent in swing but is actually entirely appropriate when compared to the time-adjusted reference data. Limitations in standard software packages may prevent use of such normalisation schemes and so care must be taken when making clinical interpretations from the data presented using such tools.
References: Gage (2009 2nd Ed.); Perry (1992)

Page 15 of 21
A modified Gait Profile Score considering the effect of gait speed
Claudiane A. Fukuchi1, Marcos Duarte1, and Richard Baker2
1 Neuroscience and Cognition, Federal University of ABC, Brazil 2School of Health Science, University of Salford, United Kingdom
Introduction: Gait scores such as the Gait Profile Score (GPS) [1] have been proposed as a measurement of
the overall gait quality in Clinical Gait Analysis (CGA). In a typical CGA, a patient performs gait trials at his or her comfortable speed and the gait pattern is compared with a reference database. However, it is known that patients with certain pathologies tend to walk slower than able-bodied individuals, and despite of this, gait scores typically do not account for the effect of gait speed. In this work, we report a modification of the GPS, the Gait Profile Score velocity (GPSv), which considers the effect of gait speed.
Methods: To derive the GPSv, we parameterized the effect of speed on each of the nine kinematic variables employed in the conventional GPS [1] by analyzing the gait of 25 able-bodied adults walking at eight different pre-selected dimensionless speeds (based on the subject’s comfortable gait speed) to create a database. The parametrization algorithm consists in: 1. Each kinematic variable is discretized as 51 points from 0 to 100% of the gait cycle for each subject and speed; and 2. For each of these 51 points, the data of all subjects are plotted versus the corresponding eight speeds and a quadratic equation is fitted to these data. These fitted equations (51 for each kinematic variable) can then be used to predict the value of the kinematic variable of the normative database at the speed of any subject we want to compare employing the metric GPS, but now based on the speed-adjusted kinematic data (GPSv). We tested the effectivity of the GPSv versus the GPS with two samples of data. First, we compared the results of each subject of the database with several gait speeds versus the remaining subjects; this test was necessary to verify that the GPSv indeed captures the effect of speed on a population where this effect is known. And second, we applied the GPSv to evaluate the gait of 16 patients with a history of stroke, where some of the patients presented slower comfortable gait speeds, versus an age-matched normative database. Results: In the test with the subjects in the database, the effect of speed on the gait score was decreased on average by 50% when GPSv was computed versus the conventional GPS (the highest difference between the gait scores was 1.7° at the slowest walking speed). In the evaluation of the post-stroke patients, higher the difference between the gait speeds of the patients and control individuals, greater the difference between the gait scores. Conclusion: The GPSv allows a more unbiased estimation of the overall gait pattern than the conventional GPS because it considers the effect of speed on the gait kinematics. The GPSv might be a useful clinical outcome measure in evaluations where gait speed changes across populations. Acknowledgments: Claudiane is thankful to FAPESP for her scholarship (#2014/13502-7). References: 1. Baker, R. et al. (2009) Gait and Posture, 30(3):265-269.
Page 16 of 21
About the importance of taking into account the contribution of
walking speed on kinematics in clinical gait analysis: an example
based on the stiff knee gait pattern observed in stroke patients
Céline Schreiber1, Frédéric Chantraine1, Florent Moissenet1
1 Centre National de Rééducation Fonctionnelle et de Réadaptation – Rehazenter, Laboratoire d’Analyse du Mouvement et de la Posture (LAMP), Luxembourg
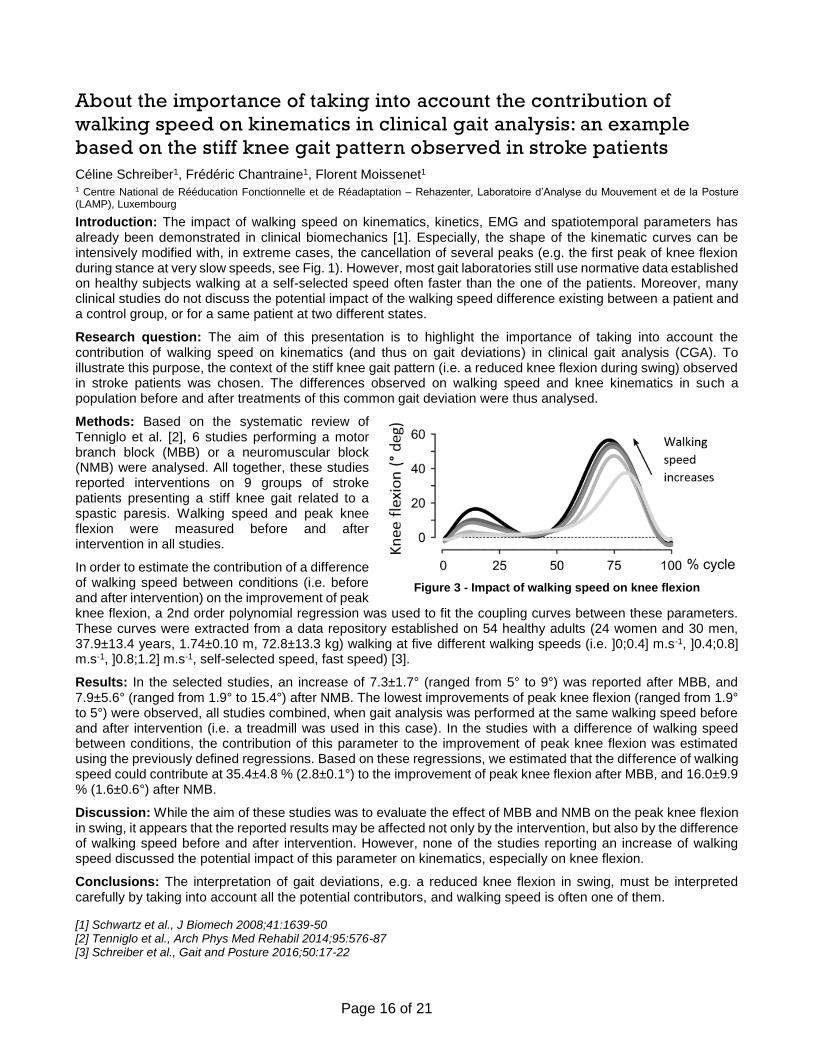
Introduction: The impact of walking speed on kinematics, kinetics, EMG and spatiotemporal parameters has already been demonstrated in clinical biomechanics [1]. Especially, the shape of the kinematic curves can be intensively modified with, in extreme cases, the cancellation of several peaks (e.g. the first peak of knee flexion during stance at very slow speeds, see Fig. 1). However, most gait laboratories still use normative data established on healthy subjects walking at a self-selected speed often faster than the one of the patients. Moreover, many clinical studies do not discuss the potential impact of the walking speed difference existing between a patient and a control group, or for a same patient at two different states.
Research question: The aim of this presentation is to highlight the importance of taking into account the contribution of walking speed on kinematics (and thus on gait deviations) in clinical gait analysis (CGA). To illustrate this purpose, the context of the stiff knee gait pattern (i.e. a reduced knee flexion during swing) observed in stroke patients was chosen. The differences observed on walking speed and knee kinematics in such a population before and after treatments of this common gait deviation were thus analysed.
Methods: Based on the systematic review of Tenniglo et al. [2], 6 studies performing a motor branch block (MBB) or a neuromuscular block (NMB) were analysed. All together, these studies reported interventions on 9 groups of stroke patients presenting a stiff knee gait related to a spastic paresis. Walking speed and peak knee flexion were measured before and after intervention in all studies.
In order to estimate the contribution of a difference of walking speed between conditions (i.e. before and after intervention) on the improvement of peak knee flexion, a 2nd order polynomial regression was used to fit the coupling curves between these parameters. These curves were extracted from a data repository established on 54 healthy adults (24 women and 30 men, 37.9±13.4 years, 1.74±0.10 m, 72.8±13.3 kg) walking at five different walking speeds (i.e. ]0;0.4] m.s-1, ]0.4;0.8] m.s-1, ]0.8;1.2] m.s-1, self-selected speed, fast speed) [3].
Results: In the selected studies, an increase of 7.3±1.7° (ranged from 5° to 9°) was reported after MBB, and 7.9±5.6° (ranged from 1.9° to 15.4°) after NMB. The lowest improvements of peak knee flexion (ranged from 1.9° to 5°) were observed, all studies combined, when gait analysis was performed at the same walking speed before and after intervention (i.e. a treadmill was used in this case). In the studies with a difference of walking speed between conditions, the contribution of this parameter to the improvement of peak knee flexion was estimated using the previously defined regressions. Based on these regressions, we estimated that the difference of walking speed could contribute at 35.4±4.8 % (2.8±0.1°) to the improvement of peak knee flexion after MBB, and 16.0±9.9 % (1.6±0.6°) after NMB.
Discussion: While the aim of these studies was to evaluate the effect of MBB and NMB on the peak knee flexion in swing, it appears that the reported results may be affected not only by the intervention, but also by the difference of walking speed before and after intervention. However, none of the studies reporting an increase of walking speed discussed the potential impact of this parameter on kinematics, especially on knee flexion.
Conclusions: The interpretation of gait deviations, e.g. a reduced knee flexion in swing, must be interpreted carefully by taking into account all the potential contributors, and walking speed is often one of them.
[1] Schwartz et al., J Biomech 2008;41:1639-50 [2] Tenniglo et al., Arch Phys Med Rehabil 2014;95:576-87 [3] Schreiber et al., Gait and Posture 2016;50:17-22
Figure 3 - Impact of walking speed on knee flexion

Page 17 of 21
Is that a Vicon in your pocket? An evaluation of the Leap Motion
capturing finger movements
Elena Eusterwiemann1, Marina Anderson2, Mark A Robinson1, Gabor J Barton1 1Research Institute for Sport and Exercise Sciences, Liverpool John Moores University, Liverpool, UK. 2Department of Rheumatology, Aintree University Hospitals NHS Foundation Trust, Liverpool, UK.
Introduction: The Leap Motion controller is a markerless, portable method for capturing hand and finger movements. It accurately and precisely registers positions of finger tips under static and dynamic conditions [1,2] and computes joint angles between finger bones. Yet, the accuracy of the angle computation is unknown in comparison to a gold standard optoelectronic system. The aim of this study was to compare angles measured with the Leap Motion controller and a Vicon system and assess if an artificial neural network can predict true finger movements from joint positions calculated by the Leap Motion device.
Methods: A Leap Motion sensor (£49.99) was positioned under a hand to capture 3D coordinates of the carpometacarpal, metacarpophalangeal (MCPJ), proximal interphalangeal (PIPJ), distal interphalangeal (DIPJ) joints and the fingertip. Joint coordinates were streamed into D-Flow (Motek Forcelink, Amsterdam) via its Network module using a custom made C# program. 3D coordinates of retro-reflective markers dorsal to the CMCJ, MCPJ, PIPJ and DIPJ joint centre and Tip were streamed simultaneously from Vicon (16MX cameras, Vicon Nexus 2.5) into D-Flow. Data of five flexion/extension cycles (8.3 s) was sampled at 300Hz. Joint angles were computed between two adjacent segments and the offset was removed by subtracting the mean LMC angle from the Vicon angle [3]. Following principal component analysis of the marker coordinates, a backpropagation neural network (Matlab Neural Network Toolbox) was trained with 75% of the decorrelated principal scores to estimate the nonlinear function between the Leap Motion and Vicon. The remaining data were used to test the function with unseen data. Three 3D models of the finger were created in Visual3D (Leap Motion, Neural Net, Vicon). The root mean square errors (RMSE) of joint angles were calculated between the Leap Motion and Vicon, and the Neural Net estimation and Vicon.
Results: The raw differences of the angles between Leap Motion and Vicon ranged from 1.96° to 34.54° reducing to an RMSE of 3.44° to 15.43° after offset correction. The RMSE between angles of the Neural Net estimation and Vicon were 1.7°, 2.4° and 1.9° in the MCPJ (Figure 1), PIPJ and DIPJ respectively.
Figure 1: Left Index finger MCPJ angles from Leap Motion, with offset correction, Vicon, and Neural Net.
Discussion and Conclusion: Raw data angles measured by the Leap Motion controller are not sufficiently close to a gold standard optoelectronic system, but an offset correction improves this error. A close match with a Vicon system was achieved by appropriate pre-processing and function estimation with an artificial neural network. The large difference between the Leap Motion and Vicon finger model is due to the Leap Motion reconstructing joints from the video image of the palmar surface while the Vicon markers are on the dorsal side and that the Leap Motion calculated joint positions based on an algorithm. Future research will compare angle profiles from the Leap Motion controller to data acquired using a validated six-degrees-of-freedom model.
References 1. Weichert F et al.. (2013) Analysis of the Accuracy and Robustness of the Leap Motion Controller. Sensors. 13:6380-93.
2. Guna J et al.. (2014) An Analysis of the Precision and Reliability of the Leap Motion Sensor and Its Suitability for Static and Dynamic Tracking. Sensors. 14:3702-20.
3. Ferrari A et al.. (2010) First in vivo assessment of ‘Outwalk’: a novel protocol for clinical gait analysis based on inertial and magnetic sensors. Medical and Biological Engineering and Computing. 48:1.
-10
10
30
50
70
90
110
-80
-30
20
0 500 1000 1500 2000 2500
Dif
fere
nce
(d
egre
e)
An
gle
(deg
ree)
Frame number
Metacarpophalangeal joint flexion/extensionLeap Motion
Vicon
Neural Net
Leap Motion offset
Difference (NN-V)

Page 18 of 21
The Biomechanical Effects of Using an Adjustable Incline Device for
Lower Limb Stretching Exercises
Jim Richards1, Gavin Thomas2, Alex Mbuli1, Laurence Smith1, Martin Levermore3, James Selfe4
1University of Central Lancashire, Preston, UK. 2Robert Gordon University, Aberdeen, UK, 3Medical Devices Technology International Ltd, Wolverhampton, UK. 4Manchester Metropolitan University, Manchester, UK.
Introduction: Within athletic training it is widely acknowledged that stretching is important in order to increase flexibility, joint range of motion and muscle [1-2]. In ankle equines’ the compensation for reduced flexibility of the gastrocnemius causes the subtalar joint to use up what little sagittal plane motion it has. The common conservative management of these conditions aims to improve flexibility, specifically around the ankle joint by stretching the gastrocnemius and soleus muscle complex. A systematic review of randomised trials examining static calf muscle stretches concluded that stretching does provide a small but statistically significant increase in ankle dorsiflexion [3]. The aim of this study was to investigate the biomechanical effects of applying different “stretching loads” using a variable incline board.
Methods: Eighteen healthy participants (aged:20-46) performed weight bearing stretches for the gastrocnemius muscle on the Rehab Angel (Fig. 1) at 6 different incline angles (0°, 5°, 10°, 15°, 20°,25°). Participants performed one 35 sec stretch at each angle of inclination, which represented a typical time used in clinical practice. Kinematic data was collected using a 10 camera Qualisys 3D motion analysis cameras (Qualisys Medical AB, SE). The calibrated anatomical systems technique (CAST) was used to model the lower body participants [4]. Electromyography (EMG) was collected from the gastrocnemius using a Delsys Bagnoli system (Delsys. Inc. USA). Force data was collected using an AMTI force plate (Advanced Mechanical Technology, Inc. USA).
Results: The ankle angle in the sagittal plane shows a significant trend towards an increase in dorsiflexion with greater angle incline, with the exception of 20 and 25° where the increase in the level of dorsiflexion reduces (P<0.05). Significant differences were seen in the iEMG at the gastrocnemius between 0, 5, 10, 15 compared to 25° (P>0.05).
Discussion: Using an incline board at angles of inclination up to 20° moves the ankle into greater dorsiflexion, whilst increasing moments but without any significant increase in iEMG values in the gastrocnemius. This is supported by previous research which showed that applying stretching forces which do not increase muscle activity are still sufficient to increase joint range of movement [5,6]. Above 20° at maximum dorsiflexion, the knee moves into extension, and the dorsiflexion moments rise to their maximum. In contrast to the lower incline angles (0-15°), this change in joint angle and increase in force applied to the posterior structures causes the iEMG value for gastrocnemius to rise significantly. Using stretching techniques which increase the muscle activity has also been associated with increased pain [7-8] therefore applying a stretching load to a muscle which has significant tonic EMG activity may lead to stretch induced injury.
Conclusion:The Rehab Angel provides passively induced moments, and allows a graduated rehabilitation environment for stretching. Increasing the angle of inclination beyond 15° produces significant increases in muscle activity with a marked increase between 20 and 25°, which would appear to relate to co-contractions around the knee and ankle. The purpose of this device is to enable a predicable delivery of lower limb rehabilitation in the community. This may in turn reduce the number of outpatient visits to acute clinics and improve efficiency of practitioners when managing relevant conditions. An incline board could be used to redesign the clinical pathways for community rehabilitation, and offer an opportunity for greater self-management of a variety of conditions.
References 1. [1] Cureton. Res Quart, 12, 381. 194. [2] Madding, et al. J Orthop Sp. Phys Ther, 8, 409. 1987. [3] Radford et
al. Br J Sports Med, 40(10), 870–75. 2006. [4] Cappozzo et al. Clin Biomech, 10(4), 171-78. 1995. [5] Magnusson et al. J Physiol, 497(1), 291–98. 1996. [6] Osternig et al. Am J Phys Med, 66(5), 298-307. 1987 [7] Condon et al. (1987) Phys Ther, 67, 24–30. 1987. [8] Moore et al. Med. Sci. Sports Exerc, 12(5), 322-9. 1980.
Rehab Angel device (MDTi, UK)

Page 19 of 21
Notes

Page 20 of 21
Notes

Page 21 of 21
Notes


