1 7 INTEGRATION OF DISTRIBUTED Room 6.1 1.7 INTEGRATION OF DISTRIBUTED GENERATION Thursday, 15th September (8 30 10 30) (8.30 - 10.30) Chair: Paola Petroni R: Stefano Massucco 171 Integration of variable generation into the grid - Scheduling aspects - P. Batra 172 Strategies and methods for the optimal integration of distributed genereration plants into the LV and MV distribution network: ENEL distribuzione experience and future prospectives - S. Botton, F. Cazzato, M. Di Clerico, D. Di Martino, F. Marmeggi 173 The distribution networks and the large diffusion of renewables power plants: the situation of Italian electric system . - S. Botton, F. Cazzato, M. Di Clerico 174 Performance evaluation of an auxiliary distributed control scheme for overvoltage mitigation - A. Mehrizi- Sani, R. Iravani 175 Active distribution networks: definition, present status of implementation and operation practices - C. D’Adamo, C. Abbey, S. Jupe, B. Buchholz, F. Pilo 176 Intelligent platform for supervision and control of distributed generation and customer demands in active distribution networks - T. Pfajfar, A. Souvent, J. Smid, M. Sepic, M. Jerele, F. Katrasnik, I. Papic 177 Monitoring and control of a smart distribution network in extended real-time DMS framework - S. Bruno, M. La Scala, U. Stecchi 178 Active distribution networks: MV voltage profi les and loading limits for a large penetration of renewable GD - M. Cresta, F.M. Gatta, A. Geri, L. Landolfi, S. Lauria, M. Maccioni, M. Paulucci
171 Integration of variable generation into the grid - Scheduling aspects - P. Batra
172 Strategies and methods for the optimal integration of distributed genereration plants into the LV and MV distribution network: ENEL distribuzione experience and future prospectives - S. Botton, F. Cazzato, M. Di Clerico, D. Di Martino, F. Marmeggi
173 The distribution networks and the large diffusion of renewables power plants: the situation of Italian electric system. - S. Botton, F. Cazzato, M. Di Clerico
174 Performance evaluation of an auxiliary distributed control scheme for overvoltage mitigation - A. Mehrizi-Sani, R. Iravani
175 Active distribution networks: definition, present status of implementation and operation practices - C. D’Adamo, C. Abbey, S. Jupe, B. Buchholz, F. Pilo
176 Intelligent platform for supervision and control of distributed generation and customer demands in active distribution networks - T. Pfajfar, A. Souvent, J. Smid, M. Sepic, M. Jerele, F. Katrasnik, I. Papic
177 Monitoring and control of a smart distribution network in extended real-time DMS framework - S. Bruno, M. La Scala, U. Stecchi,
178 Active distribution networks: MV voltage profi les and loading limits for a large penetration of renewable GD - M. Cresta, F.M. Gatta, A. Geri, L. Landolfi, S. Lauria, M. Maccioni, M. Paulucci
Strategies and methods for the optimal integration of distributed generation plants into the LV and MV distributed generation plants into the LV and MV distribution network: Enel Distribuzione experience and future prospectives
Simone Botton, Fabio Cazzato, Domenico Di Martino, Marco Di Clerico, Federico Marmeggi
Enel Distribuzione SpA
CIGRE’ International Symposium, 13-15 September 2011 - Bologna (Italy)
Uso: Interno
i f i iStrategies for DG integration
MV and LV networks designed to distribute
energy from HV t k t d
Growth of DG due to high incentives
network to end users
DG NEEDED TO BE DG NEEDED TO BE CONNECTED AND
INTEGRATED TO THE DISTRIBUTION
NETWORKS
DEVELOPMENT OF DETAILED METHODS AND STRATEGIES FOR THE IDENTIFICATION OF THE STRATEGIES FOR THE IDENTIFICATION OF THE
CONNECTION SOLUTIONS TO THE NETWORK
2
Uso: Interno
h i f h i l iChoice of the connection solution
Basic principlesTechnical standards and
regulatory requirements
saturation level of the network
requirements must be fulfilled
i l d l f h krational development of the network
quality of supply
3
Uso: Interno
h i f h i l iChoice of the connection solution
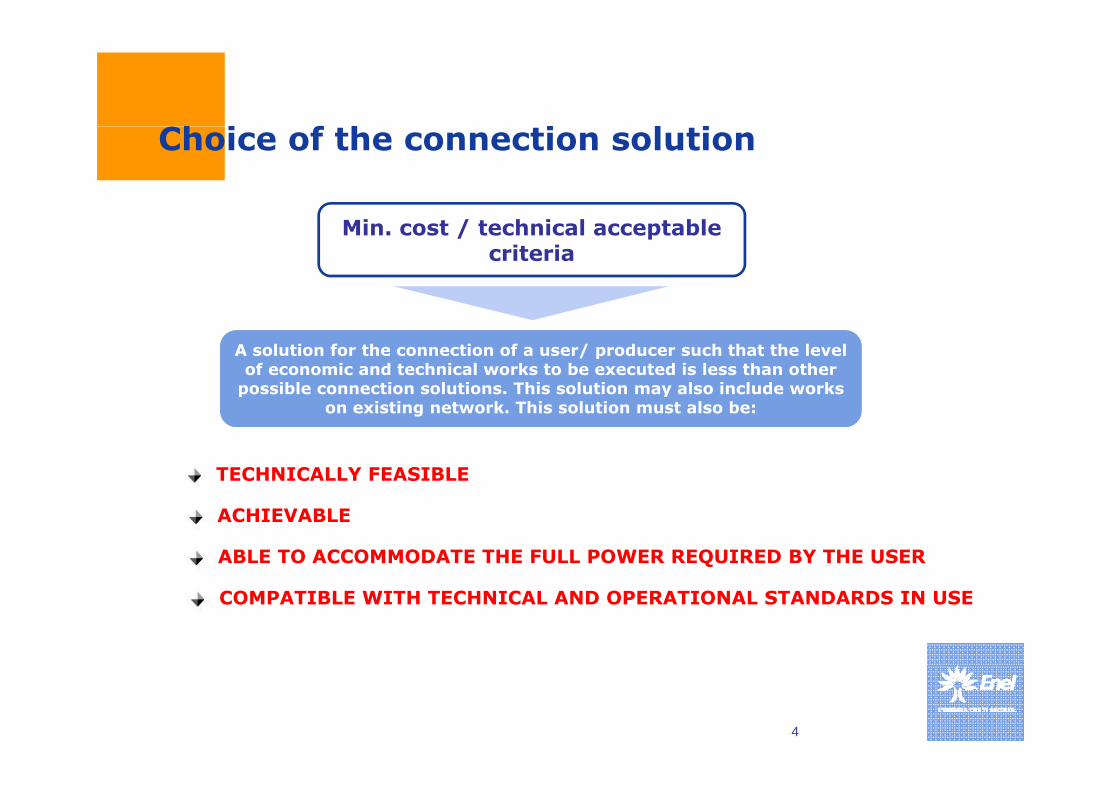
Min. cost / technical acceptable criteria
A solution for the connection of a user/ producer such that the level of economic and technical works to be executed is less than other
possible connection solutions. This solution may also include works p yon existing network. This solution must also be:
TECHNICALLY FEASIBLE
ACHIEVABLE
ABLE TO ACCOMMODATE THE FULL POWER REQUIRED BY THE USER
COMPATIBLE WITH TECHNICAL AND OPERATIONAL STANDARDS IN USE
4
Uso: Interno
h i f h i l iChoice of the connection solutionCharacteristics of the DG to be connected
Detection of load / generation scenarioPlanned network
CHOICE OF CONNECTION POINT AND SCHEME
Regulatory constraints on voltage level of the connection
SOLUTION IDENTIFIED
feasibilty study
successful?YESYES
CHOICE OF ANOTHER CONNECTION POINT NONO
level of the connection
IDENTIFIEDsuccessful?
EVALUATION OF POSSIBLE NETWORK REINFORCEMENTS
EVALUATION OF NEW NETWORK
INFRASTRUCTURES
5
REINFORCEMENTS INFRASTRUCTURES
Uso: Interno
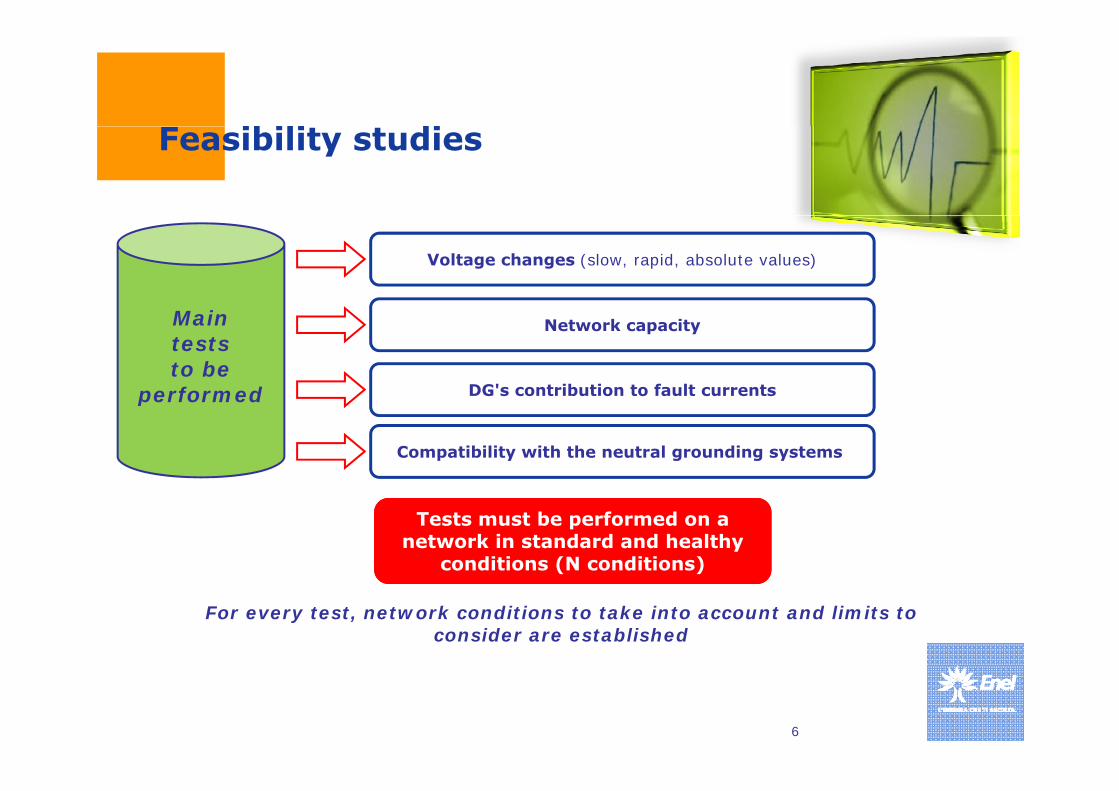
ibili diFeasibility studies
Voltage changes (slow, rapid, absolute values)
Main tests to be
performed
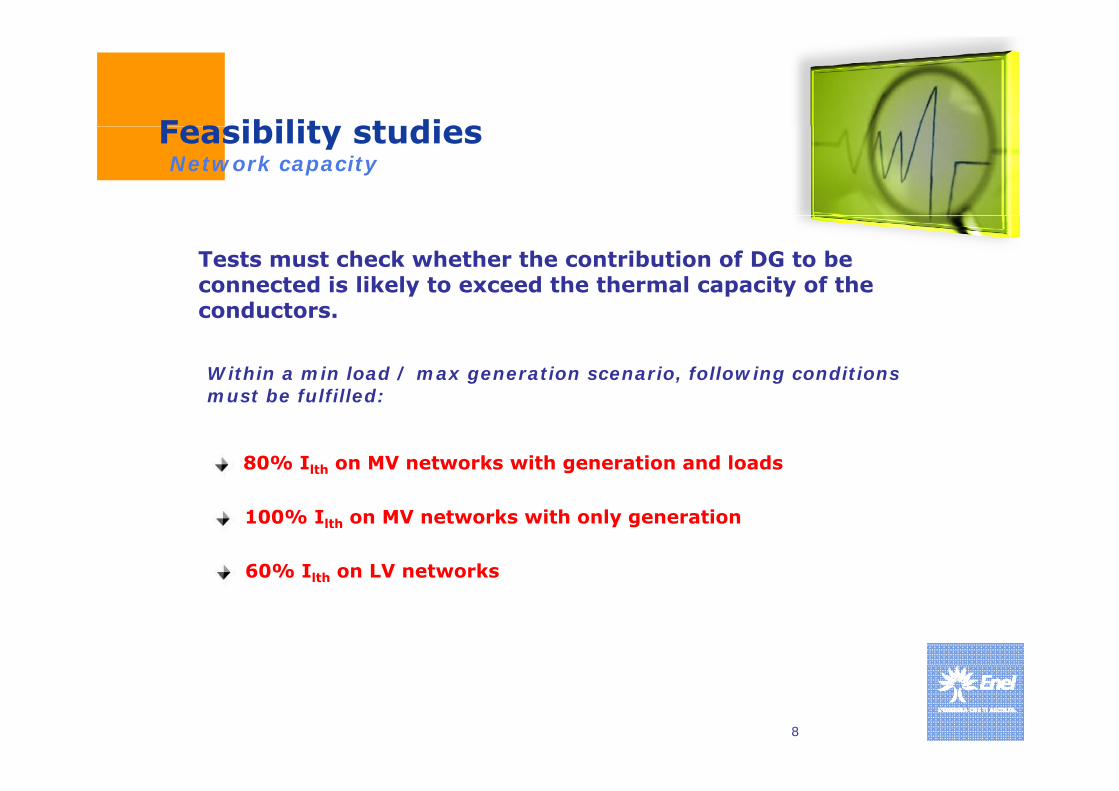
Network capacity
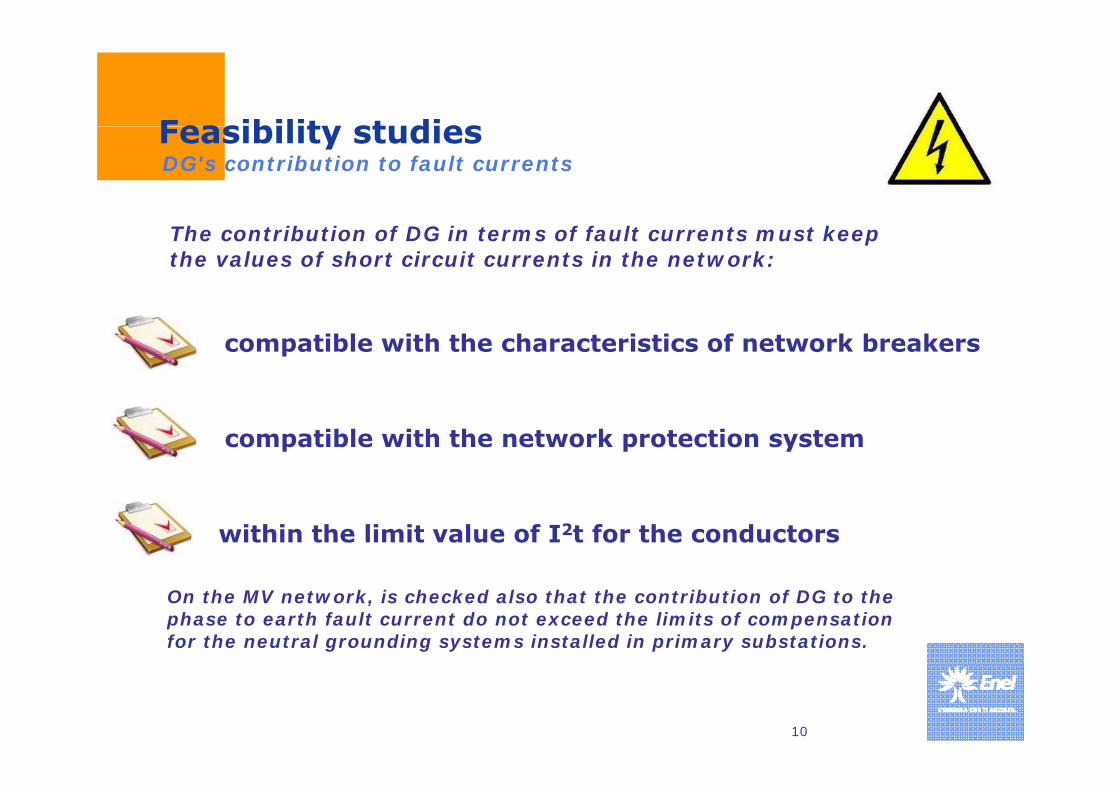
DG's contribution to fault currentsperformed DG s contribution to fault currents
Compatibility with the neutral grounding systems
Tests must be performed on a network in standard and healthy
conditions (N conditions)
For every test, network conditions to take into account and limits to consider are established
Tests must check whether the contribution of DG to be connected is likely to exceed the thermal capacity of the cond cto sconductors.
Within a min load / max generation scenario, following conditions must be fulfilled:must be fulfilled:
80% Ilth on MV networks with generation and loads
100% Ilth on MV networks with only generation
60% Ilth on LV networks60% Ilth on LV networks
8
Uso: Interno
Feasibility studiesFeasibility studiesSaturation of transformers
Th fl th h th t f t t d th 90% f The power flow through the transformer must not exceed the 90% of its rated power in networks where the power flows from low to higher
voltage levels
Yearly minimum power on the transformer
( )Power expected to be injected on
the network by DG (P )(Pcmin) the network by DG (Pimm)
Pimm-Pcmin < 0,9 Pn
9
Uso: Interno
Feasibility studiesFeasibility studiesDG's contribution to fault currents
The contribution of DG in terms of fault currents must keep the values of short circuit currents in the network:
compatible with the characteristics of network breakers
compatible with the network protection system
within the limit value of I2t for the conductors
On the MV network, is checked also that the contribution of DG to the phase to earth fault current do not exceed the limits of compensation for the neutral grounding systems installed in primary substations.
10
Uso: Interno
d di d i fDG dedicated infrastructures
In order to better integrate the DG, in conditionof network’s saturation, DSO has to:
design new networks (primary substations and underlying grid) with the main purpose to collect DG
build MV networks with underground or overhead cables, in order to achieve less environmental impact and a better quality of supplyimpact and a better quality of supply
install innovative protection systems able to manage informations from DG plants
install optic fibres, in order to implement a fast and reliable communication system
11
Uso: Riservato
Thanks for your attention!
12
Thanks for your attention!
The distribution networks and the large diffusion of The distribution networks and the large diffusion of renewables power plants: the situation of Italian electric system
Simone Botton, Fabio Cazzato, Marco Di Clerico
Enel Distribuzione SpA
CIGRE’ International Symposium, 13-15 September 2011 - Bologna (Italy)
Uso: Interno
h l iThe Regulatory Scenario
AEEG Res. 99/08 and 179/08
(Code for Active Connections)since
1/01/2009
• MV/LV connection fees are calculated on a lump-sum basis
Big penalties to SOs
• Producers with HV or MV connection can build network plants for their connection
• Big penalties to SOs for connection delays
AEEG Res. 125/10since /
(Modification to Code for Active Connections)since
1/01/2011
• Actions to avoid opportunistic behaviour by • Actions to avoid opportunistic behaviour by “developer” of connection requests
• Introduction of “Open Season” in order to allow an organic development of the network
2
Uso: Interno
h h i l iThe Technical Scenario
Technical Scenario on distribution networks is substantially unchanged since 2008:
• Connection rules: Italian Standard “CEI 0-16”HV / MV Connection rules: Italian Standard CEI 0 16
• Approved extension to the CEI 0-16 issued by single operators
HV / MV connections
Evolution of Technical Scenario on distribution networks is in progress:
• At this time connection rules are issued by single network operators
N It li St d d t b bli h d
LVconnections
• New Italian Standard to be published
3
Uso: Interno
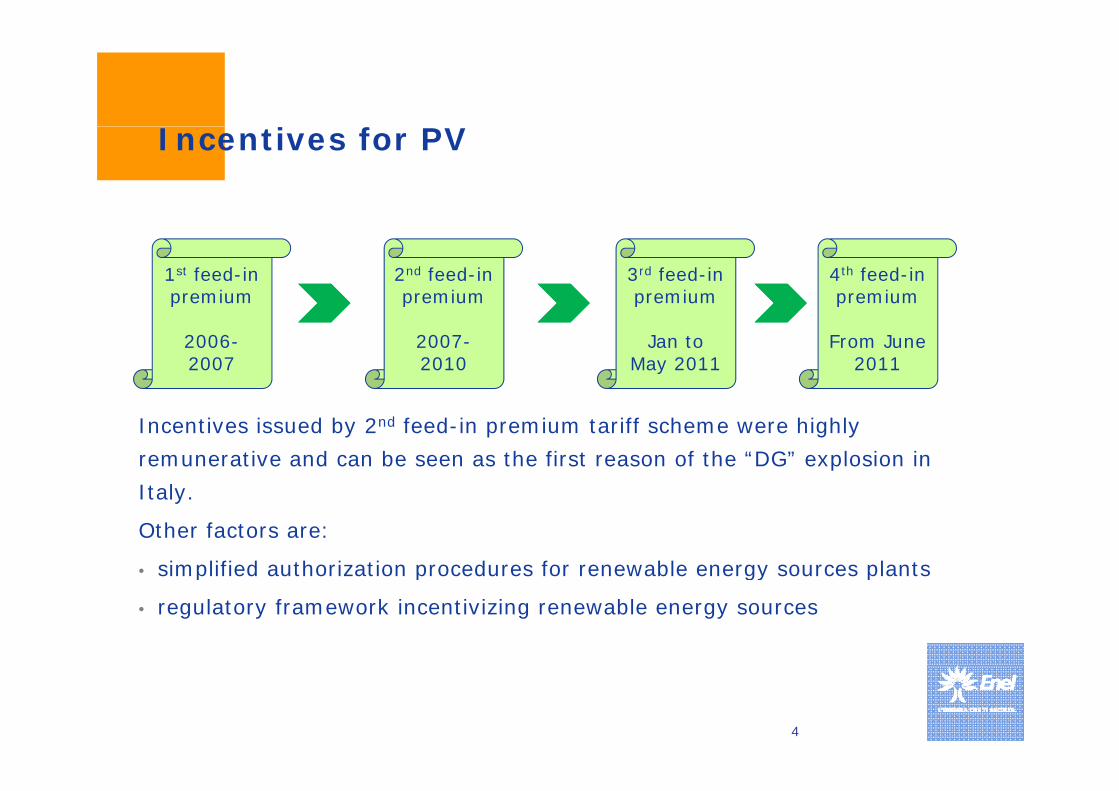
i fIncentives for PV
1st feed-in premium
2nd feed-in premium
3rd feed-in premium
4th feed-in premiump
2006-2007
p
2007-2010
p
Jan to May 2011
p
From June 2011
Incentives issued by 2nd feed-in premium tariff scheme were highly remunerative and can be seen as the first reason of the “DG” explosion in It lItaly.
Other factors are:
• simplified authorization procedures for renewable energy sources plantssimplified authorization procedures for renewable energy sources plants
• regulatory framework incentivizing renewable energy sources
4
Uso: Interno
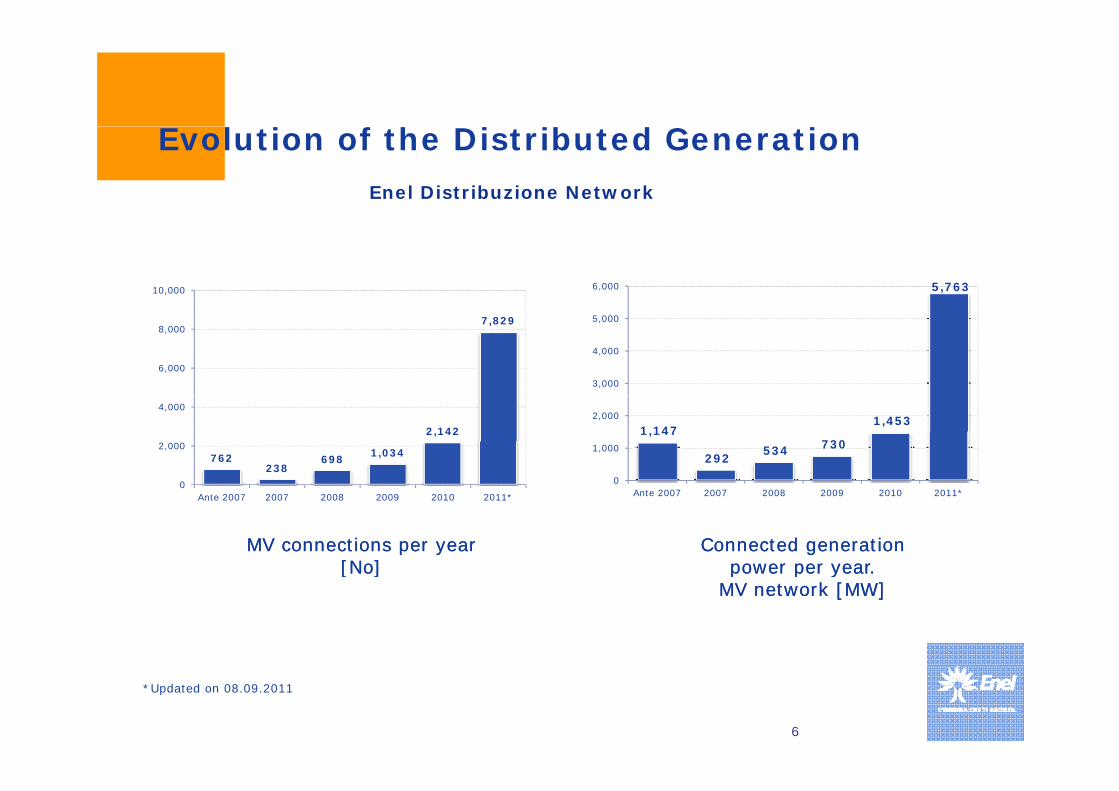
l i f h i ib d iEvolution of the Distributed GenerationEnel Distribuzione Network – no. of connection requests vs
l i f h i ib d iEvolution of the Distributed GenerationOn going connection requests on Enel Distribuzione Network
31.859 MW
Total
86 852 on going requests
13.494 MW
86.852 on going requests
53.492 MW
5.884 MW
927 MW 1.328 MW
PV Wind Biomassesand biogas Hydro
Other / not renewable
78 879 4 208 2 616 822 327N b
8Updated on 12.09.2011
78.879 4.208 2.616 822 327Number
Uso: Interno
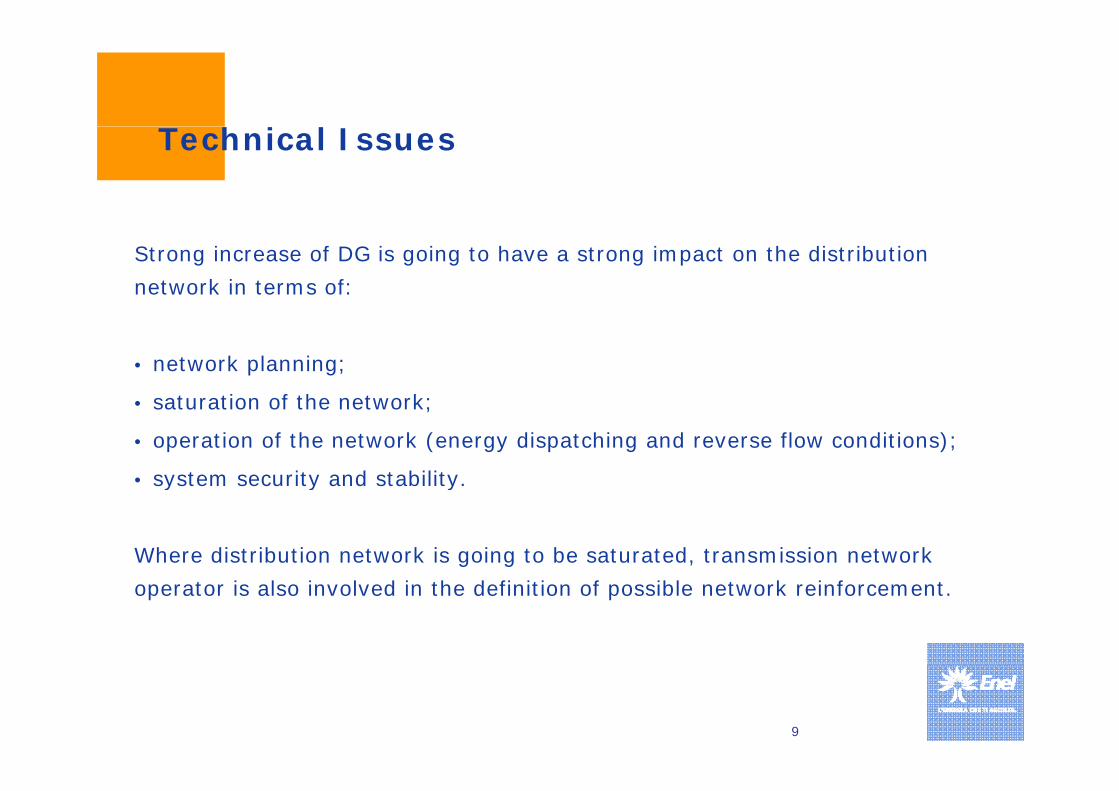
h i lTechnical Issues
Strong increase of DG is going to have a strong impact on the distribution network in terms of:
• network planning;
t ti f th t k• saturation of the network;
• operation of the network (energy dispatching and reverse flow conditions);
• system security and stability.system security and stability.
Where distribution network is going to be saturated, transmission network operator is also involved in the definition of possible network reinforcement.
9
Uso: Interno
di i b dCoordination between DSO and TSO
The spread of DG is going to have a growing impact even on National
Transmission Network 80
100
08
2009 2010
Transmission Network.
40
60
80
20
0
Revpow
e
Dedica
infrast Hconne
5 2 179
60
32
67 65 67
0
20
verse er flow
s
ated DG
tructures
HV
ections
Coordination between the DSO and the TSO needed in order to ensure
Connection requests to TSO for Connection requests to TSO for new MV/HV transformations new MV/HV transformations
dedicated for DGdedicated for DG[No vs. quarters of the year][No vs. quarters of the year]
that network security and continuity of the electrical system are not
compromised
10
compromised.
Uso: Interno
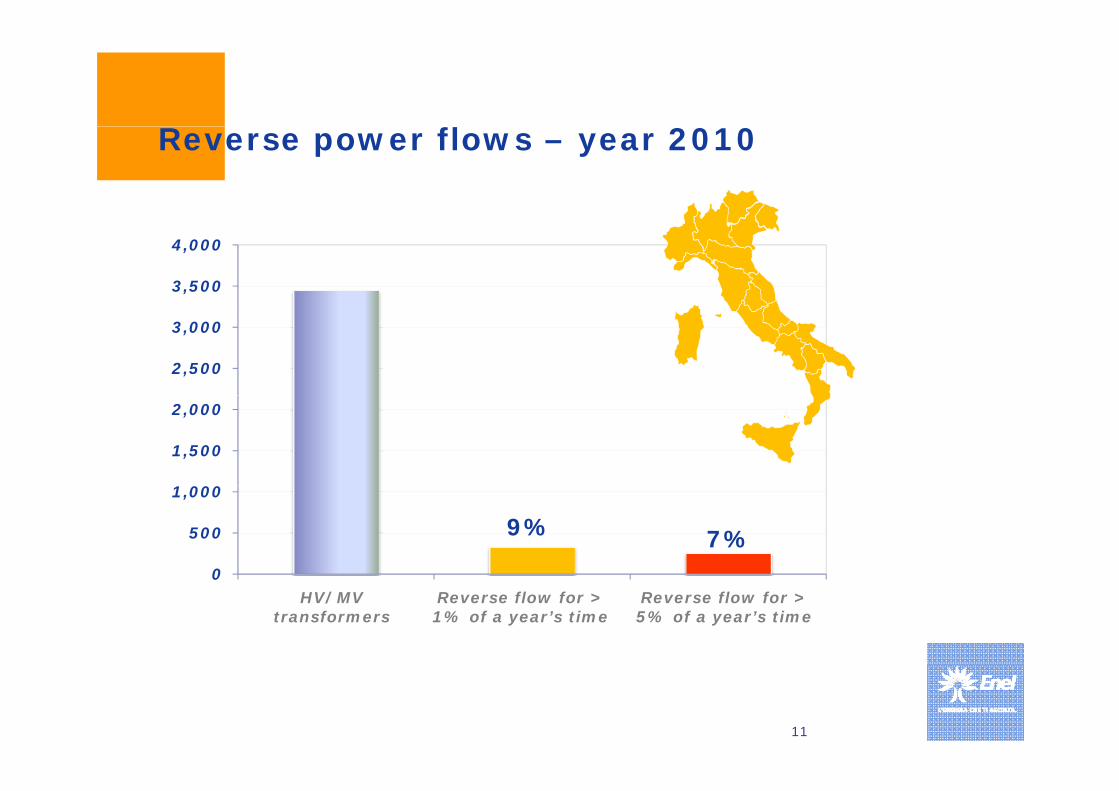
flReverse power flows – year 2010
3,500
4,000
2,500
3,000
1,500
2,000
0
500
1,000
9% 7%0
Totale sezioni AT/MT Italia
Inversione >1% Inversione >5%HV/MV transformers
Reverse flow for > 1% of a year’s time
Reverse flow for > 5% of a year’s time
11
Uso: Interno
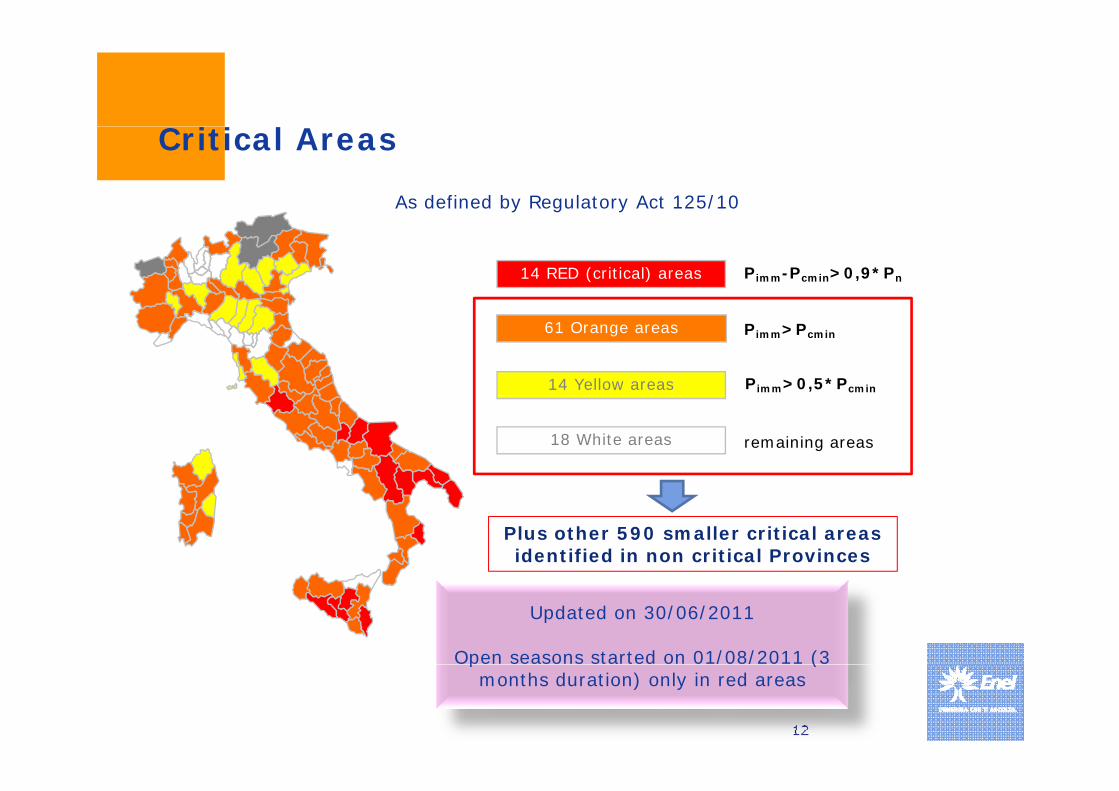
i i lCritical Areas
As defined by Regulatory Act 125/10
14 RED (critical) areas Pimm-Pcmin>0,9*Pn
61 Orange areas
14 Yellow areas
Pimm>Pcmin
Pimm>0,5*Pcmin
18 White areas remaining areas
Plus other 590 smaller critical areas identified in non critical Provinces
Updated on 30/06/2011
Open seasons started on 01/08/2011 (3
12
p / / (months duration) only in red areas
Uso: Interno
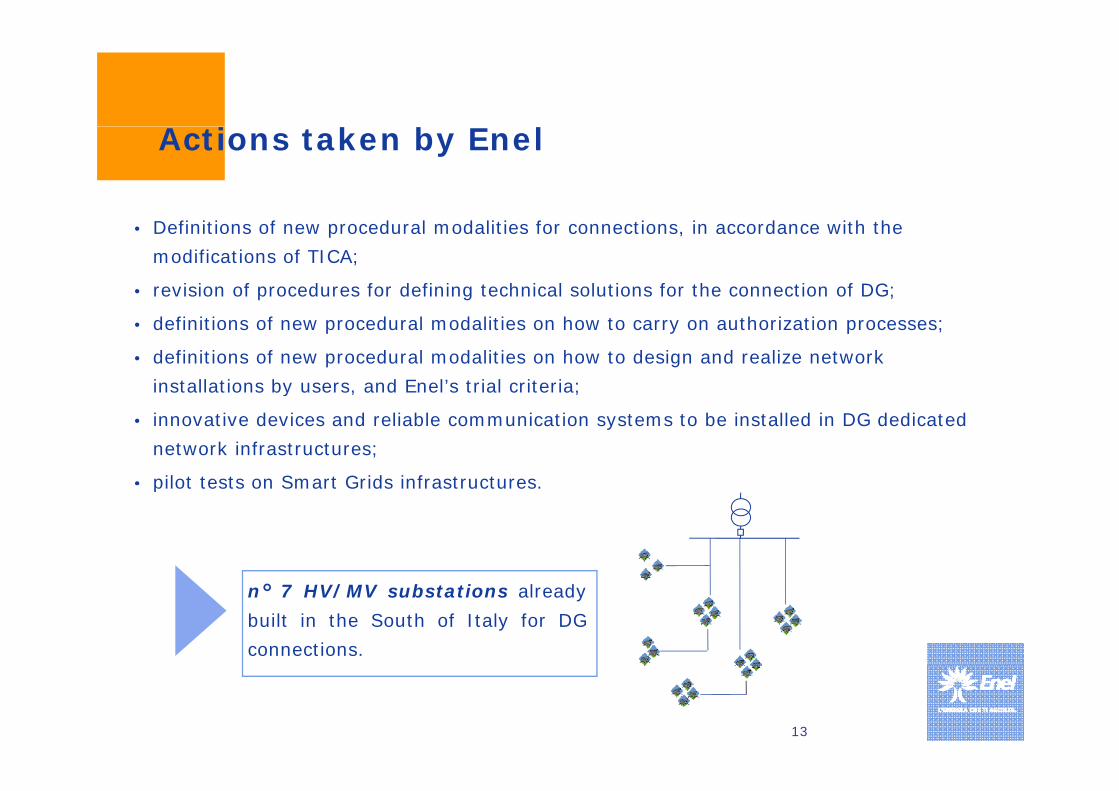
i k b lActions taken by Enel
• Definitions of new procedural modalities for connections, in accordance with the modifications of TICA;
• revision of procedures for defining technical solutions for the connection of DG;
• definitions of new procedural modalities on how to carry on authorization processes;
• definitions of new procedural modalities on how to design and realize network installations by users, and Enel’s trial criteria;y , ;
• innovative devices and reliable communication systems to be installed in DG dedicated network infrastructures;
• pilot tests on Smart Grids infrastructurespilot tests on Smart Grids infrastructures.
n° 7 HV/MV substations alreadybuilt in the South of Italy for DGconnections.
13
Uso: Interno
Thanks for your attention!
14
Thanks for your attention!
Performance Evaluation of an Auxiliary Distributed Control
Scheme for Overvoltage MitigationScheme for Overvoltage Mitigation
Motivation and Control ObjectivesMotivation and Control Objectives
P d C t l St t iProposed Control Strategiy
Results and Applications
Conclusions and Contributions
2 of 20
MotivationMotivation
Microgrid controllers should ensure thatMicrogrid controllers should ensure that– Trajectory does not violate the operational constraints– Each unit tracks its set point as closely as possibleEach unit tracks its set point as closely as possible
Existing strategies are not sufficient because microgridsO t l t th i li it d h li it d– Operate close to their limits and have limited resources
– Embed entities susceptible to overcurrents and overvoltages– Experience frequent topology changesExperience frequent topology changes– Do not possess well‐utilized characteristics of large systems
3 of 20
Proposed Strategy
A strategy to mitigate the transients of a unit to ensure
Proposed Strategy
A strategy to mitigate the transients of a unit to ensure independent and close tracking of its set point– Not based on communicationNot based on communication
4 of 20
Trajectory ShapingTrajectory Shaping
Consideration of Dynamic Limits of DevicesConsideration of Dynamic Limits of Devices
ChallengesAvoid violating dynamic limits– Avoid violating dynamic limits• With a small overshoot
– Achieve a fast response
5 of 20
• Without changing the existing controller
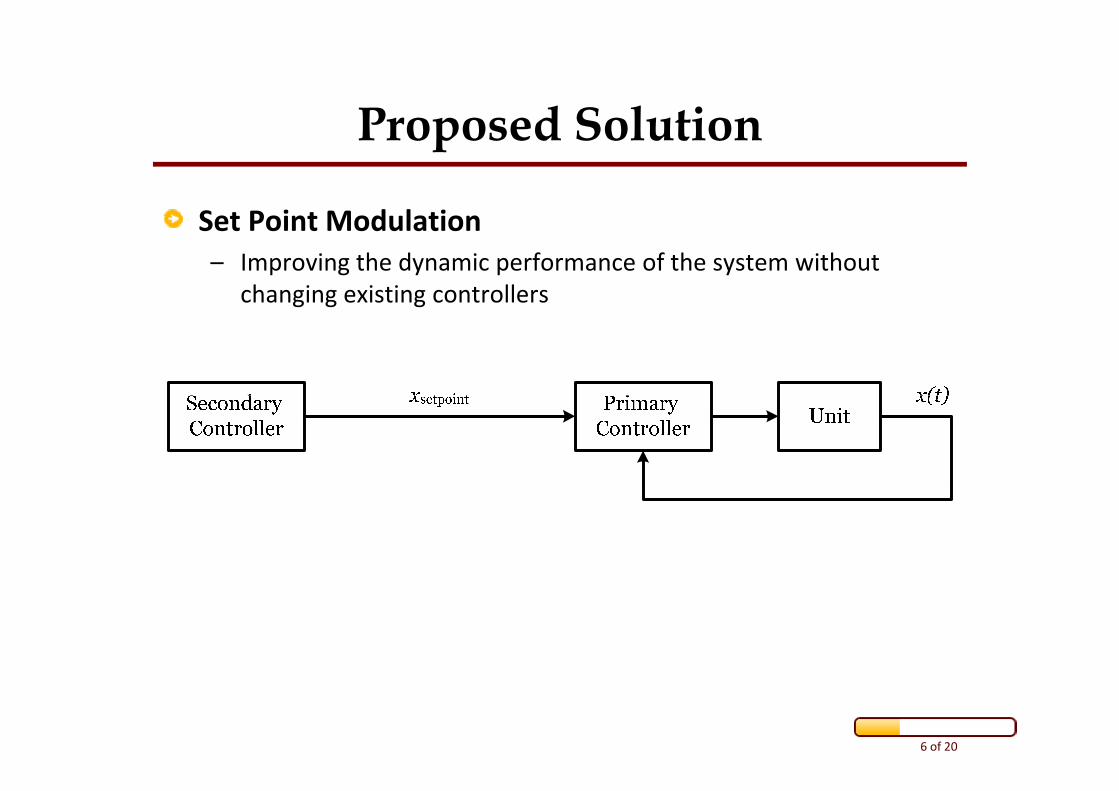
Proposed SolutionProposed Solution
Set Point ModulationSet Point Modulation– Improving the dynamic performance of the system without
changing existing controllersg g g
6 of 20
Proposed SolutionProposed Solution
Set Point ModulationSet Point Modulation– Improving the dynamic performance of the system without
changing existing controllersg g g
7 of 20
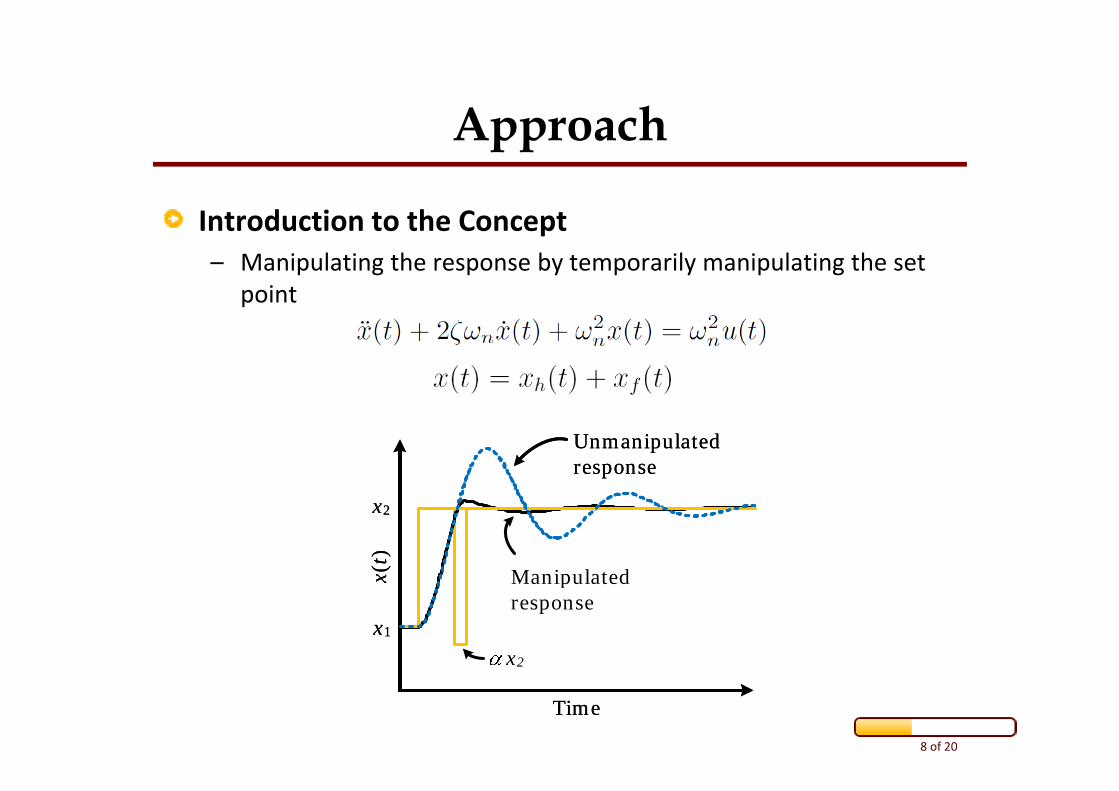
ApproachApproach
Introduction to the ConceptIntroduction to the Concept– Manipulating the response by temporarily manipulating the set
pointp
Unmanipulated responseUnmanipulated response
x(t)
x2
Manipulated x(t)
x2
x
x1
x2
Manipulated response
x
x1
8 of 20
Time
x2
Time
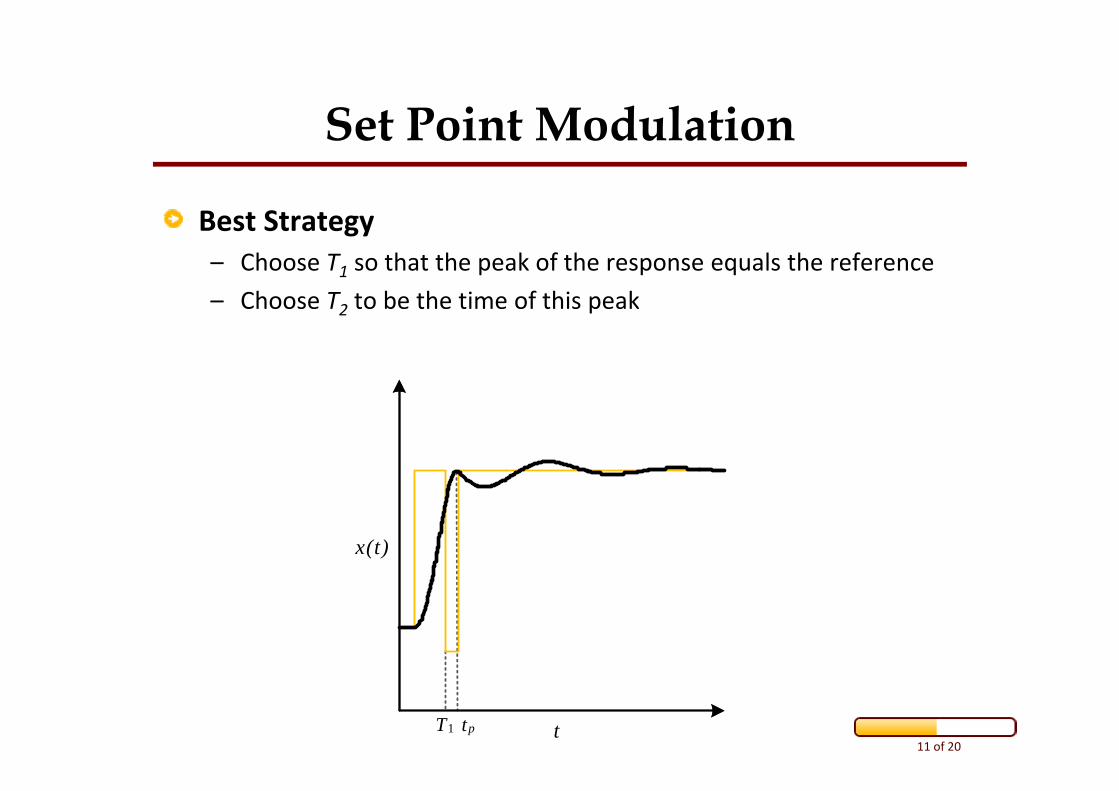
Set Point Modulation
Best Strategy
Set Point Modulation
Best Strategy– Choose T1 so that the peak of the response equals the reference– Choose T2 to be the time of this peakChoose T2 to be the time of this peak
x(t)
9 of 20t
Set Point Modulation
Best Strategy
Set Point Modulation
Best Strategy– Choose T1 so that the peak of the response equals the reference– Choose T2 to be the time of this peakChoose T2 to be the time of this peak
x(t)
10 of 20T1 tp t
Set Point Modulation
Best Strategy
Set Point Modulation
Best Strategy– Choose T1 so that the peak of the response equals the reference– Choose T2 to be the time of this peakChoose T2 to be the time of this peak
x(t)
11 of 20T1 tp t
Set Point Modulation
Best Strategy
Set Point Modulation
Best Strategy– Choose T1 so that the peak of the response equals the reference– Choose T2 to be the time of this peakChoose T2 to be the time of this peak
x(t)
12 of 20T1 tp t
Set Point Modulation
Best Strategy
Set Point Modulation
Best Strategy– Choose T1 so that the peak of the response equals the reference– Choose T2 to be the time of this peakChoose T2 to be the time of this peak
x(t)
13 of 20T1 tp t
Alternate StrategyAlternate Strategy
Finite State MachineFinite‐State Machine– Manipulate the set point based on the trend of response and its
sampled valuesp
SPAACE /speɪs/: Set Point Automatic Adjustment with Correction Enabled– Based on local signals– Independent of model
Robust with respect to changes in system parameters– Robust with respect to changes in system parameters
14 of 20
Study System IStudy System I
IEEE 34 Bus Test FeederIEEE 34‐Bus Test Feeder– Added 3 DG units– Is operated in grid‐connected modeIs operated in grid connected mode
846
848
844
846
DG2
800 816 824858
834 860 836 840
842
DG3
DG2
828 830 854 852
832888 890
3
DG1
15 of 20
Case Study ACase Study A
Set Point ChangeSet Point Change– Step change for DG2 from 0.91 pu to 1.09 pu– DG1 and DG3 unchangedDG1 and DG3 unchanged
16 of 20
Study System IIStudy System II
IEEE 13 Bus Unbalanced Test FeederIEEE 13‐Bus Unbalanced Test Feeder
17 of 20
Case Study BCase Study B
Load SwitchingLoad Switching– Resistive 1 pu load switched off
1.5
0 5
1
V (p
u)
0 0.2 0.4 0.6 0.8 10.5
Time (s)
18 of 20
ConclusionsConclusions
By appropriately designing its trajectory it is possibleBy appropriately designing its trajectory, it is possible and safe for a system to operate closer to its limits.
SPAACE is effective in mitigating transients:– Step change in current: Mitigating an overshoot of 37%Step change in current: Mitigating an overshoot of 37%– Load energization: Eliminating a peak of 1.15 pu– Load de‐energization: Stabilizing oscillatory behavior of voltage– Black start‐up: Reducing the settling time by 45%
19 of 20
A ti Di t ib ti N t k D fi iti Active Distribution Networks: Definition, present status of implementation and
operational practices
Dr Samuel Jupe (Parsons Brinckerhoff)On behalf of CIGRE Working Group C6.11
Convenor: Christian D’AdamoSecretary: Chad Abbey
Session 1.7: Integration of distributed generation
Bologna, 15 September 2011 0
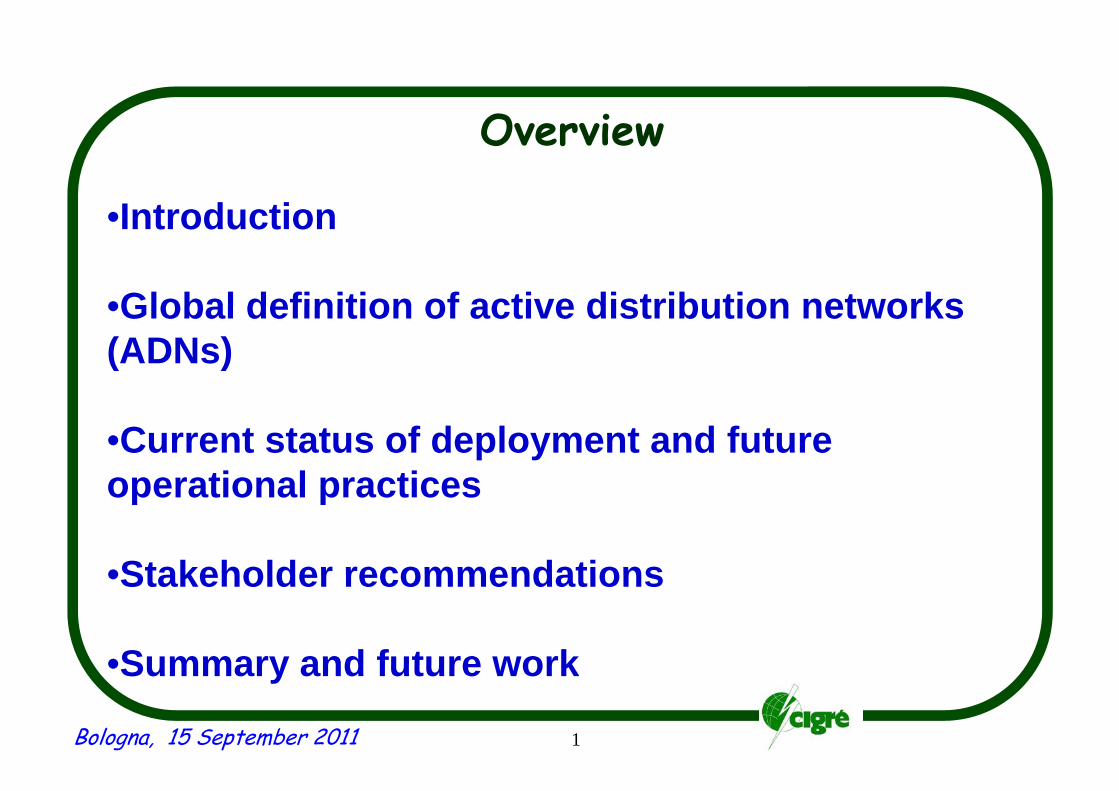
OverviewOverview
•Introduction•Introduction
•Global definition of active distribution networks•Global definition of active distribution networks (ADNs)
•Current status of deployment and future operational practicesoperational practices
W ki G C6 11•Working Group C6.11•August 2006 – August 2010•27 members and experts representing 14 countries
•Terms of Reference:•Global definition of Active Distribution Networks (ADNs)( )•Current status of deployment•Stakeholder recommendations
Bologna, 15 September 2011 2
Shared global definition• Active distribution networks (ADNs) have systems in
Shared global definitionActive distribution networks (ADNs) have systems in place to control a combination of distributed energy resources (DERs).
• DERs are defined as generators, loads and storage.
Distribution system operators (DSOs) have the• Distribution system operators (DSOs) have the possibility of managing the electricity flows using a flexible network topology.flexible network topology.
• DERs take some degree of responsibility for system support which will depend on a suitable regulatorysupport, which will depend on a suitable regulatory environment and connection agreement.
Bologna, 15 September 2011 3
Actual status of deploymentActual status of deployment• 24 flagship projects across the worldags p p ojects ac oss t e o d• Analysed according to:
• Integration level
• Enabling technologies
• Application
• Benefits
• Research and development needs
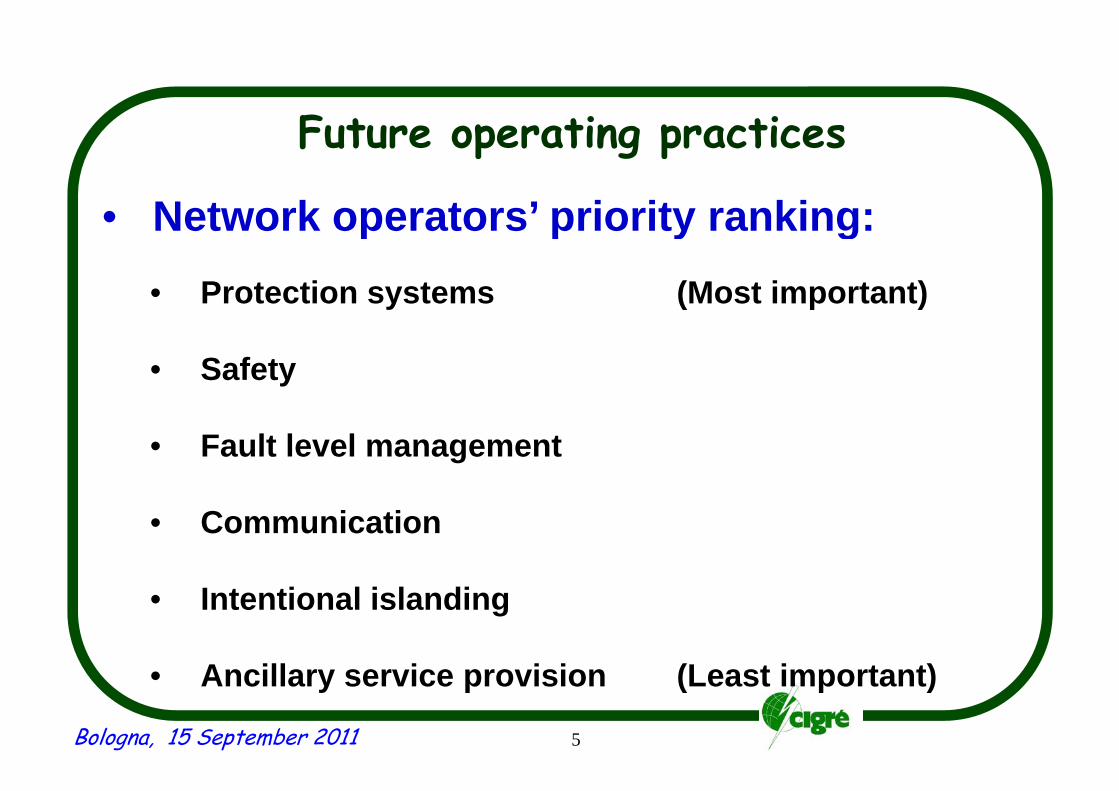
K fi di• Key findings: • Limited use of communications for DER remote operation
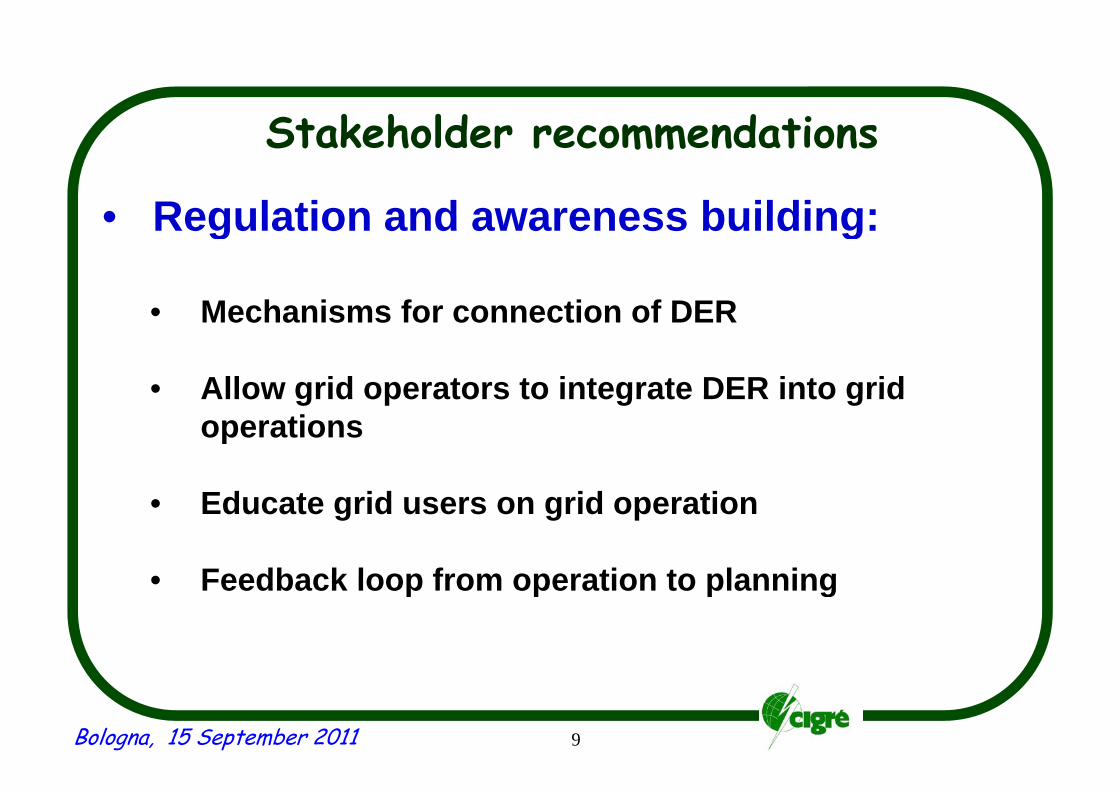
• Regulation and awareness building:• Regulation and awareness building:
Mechanisms for connection of DER• Mechanisms for connection of DER
• Allow grid operators to integrate DER into gridAllow grid operators to integrate DER into grid operations
• Educate grid users on grid operation
Feedback loop from operation to planning• Feedback loop from operation to planning
Bologna, 15 September 2011 9
Summary and future workSummary and future work
• Overview of activities of CIGRE WG• Overview of activities of CIGRE WG C6.11:
Global definition of acti e distrib tion net orks• Global definition of active distribution networks• Actual status of deployment and future operation• Stakeholder recommendationsStakeholder recommendations
• Activities countinued in CIGRE Working• Activities countinued in CIGRE Working Group C6.19:
The planning and optimisation of active distribution• The planning and optimisation of active distribution systems, Convenor: Fabrizio Pilo
Bologna, 15 September 2011 10
Thank you for listening!Thank you for listening!
• Full report now available:• Full report now available:
CIGRE Working Gro p C6 11 “De elopment and• CIGRE Working Group C6.11: “Development and Operation of Active Distribution Networks”, Technical Brochure No. 457, April 2011Technical Brochure No. 457, April 2011
• Any questions?Any questions?
• Contact: Samuel Jupe jupes@pbworld com• Contact: Samuel Jupe [email protected]
Bologna, 15 September 2011 11
I t lli t l tf f i i d t l fI t lli t l tf f i i d t l fIntelligent platform for supervision and control of Intelligent platform for supervision and control of distributed generation and customer demands in distributed generation and customer demands in
active distribution networksactive distribution networks-- SUPERMEN SUPERMEN --
Tomaž Pfajfar, 2e A d j S t EIMVAndrej Souvent, EIMVJanez Šmid, Iskra MIS
Marko Šepič, Solvera LynxMarjan Jerele, Elektro Gorenjska
Franci Katrašnik, University of LjubljanaIgor Papič, University of Ljubljanag p y j j
Cigrè International Symposium THE ELECTRIC POWER SYSTEM OF THE FUTUREIntegrating supergrids and microgrids ,13-15 September 2011 - Bologna
11
Elektroinštitut Milan Vidmar, Ljubljana, SloveniaElektroinštitut Milan Vidmar, Ljubljana, Slovenia
The SUPERMEN projectThe SUPERMEN projectThe SUPERMEN projectThe SUPERMEN project
The project addresses distributed generation impacts on distribution network by implementing the concept of virtual power plant.
1. Study, development and demonstration of smart grid infrastructure.
The main objectives of the project:
2. Demonstration of basic applications for supervision and control of distributed resources and energy management.
3. To build an ICT infrastructure for further development and demonstration pof new services and applications.
The project focuses mostly on small distributed energy resources in LV and p j y gyMV distribution networks.
22
Elektroinštitut Milan Vidmar, Ljubljana, SloveniaElektroinštitut Milan Vidmar, Ljubljana, Slovenia
System ArchitectureSystem ArchitectureSystem ArchitectureSystem Architecture
The system consists of:
• Point-of-Common-Coupling Interfaces (PCCI)• Virtual Power Plant Control C t (VPP CC)Centre (VPP CC)
Standard protocols are used:
PCCI - VPP CC: IEC 61850VPP CC - DSO/TSO CC: IEC 60870-5-104/101, IEC 60870-6 ICCP VPP CC - users: HTTP / HTTPS (WEB services, WEB portal)
33
Elektroinštitut Milan Vidmar, Ljubljana, SloveniaElektroinštitut Milan Vidmar, Ljubljana, Slovenia
PointPoint ofof CommonCommon Coupling InterfaceCoupling InterfacePointPoint--ofof--CommonCommon--Coupling InterfaceCoupling InterfaceVPP CC
PCCIPCCI is used for a standardized connection ofmicro and small generation of electricity from
MiBox
IP,IEC 61850
bus,
SPA
,...
Otherdevices
micro and small generation of electricity fromdistributed resources to the distribution network.
PCCI functionalities include:• Remote monitoring and control
Mod
Modbus
Modbus
de ces
g• Power quality monitoring according to EN50160• Communication with the control center
Measuring Centre
Modbus
• Possibility of controlling compensation devices• Various protection functions
I/O Analog
44
I/ODI / DO
Analog input
Elektroinštitut Milan Vidmar, Ljubljana, SloveniaElektroinštitut Milan Vidmar, Ljubljana, Slovenia
Virtual Power Plant Control CentreVirtual Power Plant Control Centre softwaresoftwareVirtual Power Plant Control Centre Virtual Power Plant Control Centre softwaresoftware
The main functions of the VPP CCThe main functions of the VPP CC software:• Two-way communications with PCCinterfaces (data acquisition controlsinterfaces (data acquisition, controls, alarms)• Two-way communications with DSO’s or TSO’s control center’s systemsTSO s control center s systems (EMS/SCADA/DMS)• Applications and user interfaces for:
• DG operatorsDG operators• VPP operators
• System configuration and usermanagementmanagement• Data archiving and event logging
55
The concept of aggregation allows joint appearance on the energy and ancillary services market.
Elektroinštitut Milan Vidmar, Ljubljana, SloveniaElektroinštitut Milan Vidmar, Ljubljana, Slovenia
Demo system configurationDemo system configurationDemo system configurationDemo system configuration
66
Elektroinštitut Milan Vidmar, Ljubljana, SloveniaElektroinštitut Milan Vidmar, Ljubljana, Slovenia
ResultsResultsResultsResults
PCCI was developed using protocolIEC 61850 including two way DGIEC 61850, including two-way DGunit control and data acquisition.
Vi t l l t ftVirtual power plant software wasdeveloped using service orientedarchitecture.
The demo system was set up forfurther development and testing ofp gnew services and applications.
77
Elektroinštitut Milan Vidmar, Ljubljana, SloveniaElektroinštitut Milan Vidmar, Ljubljana, Slovenia
Thank you for your attention!Thank you for your attention!Thank you for your attention!Thank you for your attention!
Andrej SouventAndrej SouventEE--mailmail: : [email protected]@eimv.si
Sergio Bruno, Massimo La Scala, Ugo Stecchig , , g
Dipartimento di Elettrotecnica ed ElettronicaPolitecnico di Bari ItalyPolitecnico di Bari – Italy
Smart Grids at Politecnico di Bari This paper presents some preliminary results of an on This paper presents some preliminary results of an on-
going project on smart grids partially funded by Regione Puglia (3 years, about 1.3 M€ budget)Puglia (3 years, about 1.3 M€ budget)
It involves the Politecnico, two local energy distribution utilities (gas and electricity), and one SMEutilities (gas and electricity), and one SME
AMGAS is the local distributor for natural gas in the city of Bari (around 350 000 inhabitants and 115 000of Bari (around 350,000 inhabitants and 115,000 customers, 80,000 m3/h)
AMET is the electricity DisCo for the city of Trani about AMET is the electricity DisCo for the city of Trani, about 65,000 inhabitants and 35,000 customers
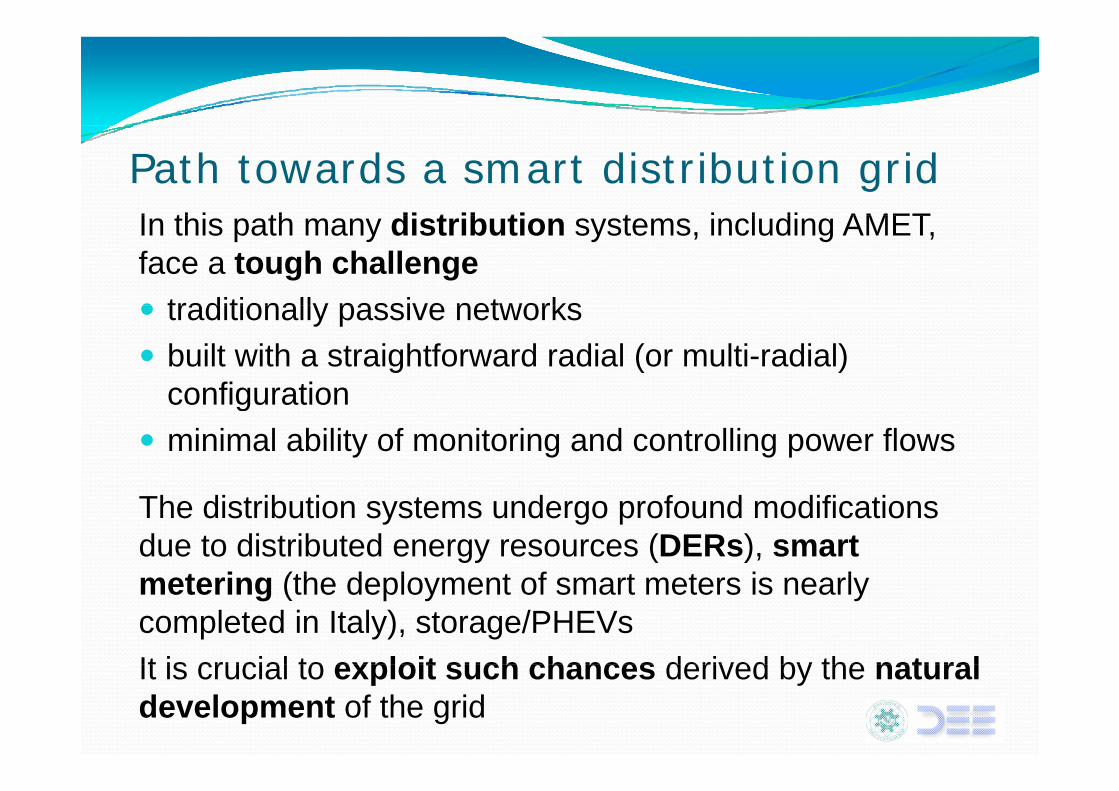
Path towards a smart distribution gridI thi th di t ib ti t i l di AMETIn this path many distribution systems, including AMET, face a tough challenge traditionally passive networks traditionally passive networks built with a straightforward radial (or multi-radial)
configurationconfiguration minimal ability of monitoring and controlling power flows
The distribution systems undergo profound modifications due to distributed energy resources (DERs), smart
t i (th d l t f t t i lmetering (the deployment of smart meters is nearly completed in Italy), storage/PHEVs It is crucial to exploit such chances derived by the naturalIt is crucial to exploit such chances derived by the natural development of the grid
In the next future…M i f ti t ICT t l More information, sensors, measurements, ICT, control resources and actuators will be available to Distribution Network Operators (DNOs)Network Operators (DNOs) allowing to implement advanced monitoring and control functionscontrol functions
SCADA/EMS (or DMS-Distribution Management System) is naturally fit for dealing with all these new elementsy g
Advanced DMS can be the core of a smart distribution grid, but most of monitoring and control tools must be re-adapted
new operative and technical requirements and availability of new control resources must be taken into account
Proposed scheme for AMETADMSADMS
• CVR: Conservative Voltage Regulation• SE: State Estimator• VVO: Voltage – Var Optimization• SMS: Storage Management System• ODPF: Optimal Distribution Power Flow
• MDI: Meter Data Integration• AMR: Automatic Meter Reading
GIS INTERFACE
CONTROL CENTER
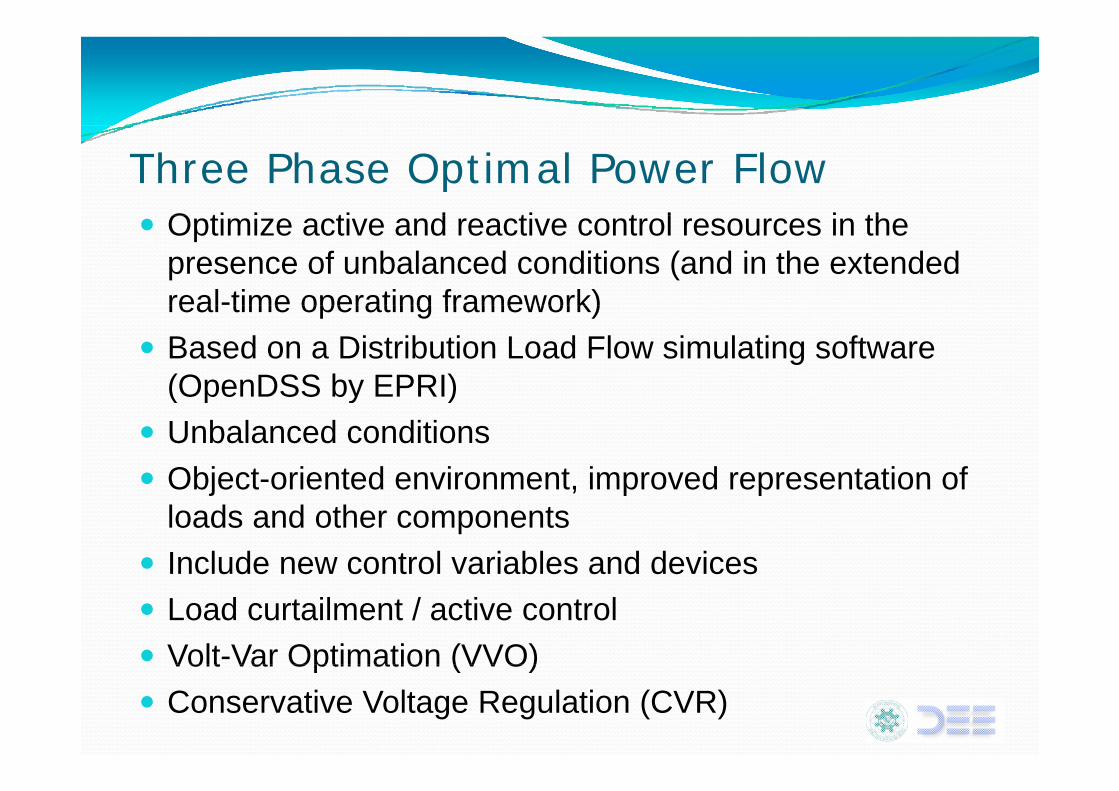
Three Phase Optimal Power FlowO ti i ti d ti t l i th Optimize active and reactive control resources in the presence of unbalanced conditions (and in the extended real-time operating framework)real time operating framework)
Based on a Distribution Load Flow simulating software (OpenDSS by EPRI)(OpenDSS by EPRI)
loads and other components Include new control variables and devices Load curtailment / active control Volt-Var Optimation (VVO)Volt Var Optimation (VVO) Conservative Voltage Regulation (CVR)
AMET distribution gridHV/MV t ti l 900 b 1000 li 500 HV/MV representation only, 900 buses, 1000 lines, 500 load nodes, 100 switches (60 controllable)
About 35 MW peak load demand About 35 MW peak load demand Scarce penetration of DERs, but fast growth of
photovoltaics (more than 60MW requested)photovoltaics (more than 60MW requested) Deployment of smart meters is 95% completed (AMI is a
proprietary system)proprietary system)Feeder
#Transfor
merImax[A]
Smax[kVA]
1 TRA 187 64702 TRA 187 6470DISTRIBUTION
SUBSTATION
SUBTRANSMISSION NETWORK
SLACK 150kV
3 TRA 187 64704 TRA 187 64705 TRB 85 29406 TRB 104 36007 TRB 85 2940
SUBSTATION
BUS B 20kV
BUS A 20kV
TR A30 MVA
TR B25 MVA
7 TRB 85 29408 TRB 187 64709 TRB 85 294010 TRA 128 443011 TRA 128 4430
FEED
ER 2
FEED
ER 4
FEED
ER 6
FEED
ER 9
FEED
ER 10
FEED
ER 11
FEED
ER 3
FEED
ER 1
FEED
ER 7
FEED
ER 5
FEED
ER 8
Load control35% l d i ti TRA d f d #3 35% load increase, congestion on TRA and feeders #3, #5 and #8
Penalty functions constraint power flows on transformers Penalty functions constraint power flows on transformers and currents on each feeder
convergence after 12 iterations about 3540 kW to be convergence after 12 iterations, about 3540 kW to be curtailed (about 8.4% of total active power)
S1 S2 I1 I2 I3 I4 I I6 I I8 I9 I10 I11iter S1[kVA]
Conservative Voltage RegulationMi i i ti f ti h d t th b t ti Minimization of active power exchanged at the substation
Load models: 50% fixed impedance model, 25% constant active power and quadratic reactive 25% linear activeactive power and quadratic reactive, 25% linear active power and quadratic reactive
Volt-Var OptimizationI f di t ib t d i j ti l d t Increase of distributed power injections can lead to counter-flows and be cause of overvoltages
VVO aimed at constraining voltages in 1 0 1 05 VVO aimed at constraining voltages in 1.0-1.05 Control variables: reactive power outputs and tap
changers setpointschangers setpoints1,08
u.]
Before VVO
After VVO
1,08
.u.]
1,04
1,06
ge m
agni
tude
[p.u
1,04
1,06
age
mag
nitu
de [p
.
1
1,02
min
imum
vol
tag
1
1,02m
axim
um v
olta
Before VVO
After VVO
0,981 2 3 4 5 6 7 8 9 10 11
Feeder #
0,981 2 3 4 5 6 7 8 9 10 11
Feeder #
After VVO
ConclusionsS t id ll t b i ti it i d Smart grids allow to embrace innovative monitoring and control schemes
Most of approaches can be derived by standard Most of approaches can be derived by standard methodologies (OPF) that must be adapted for integrating new operative requirements and resourcesintegrating new operative requirements and resources
Smart meters are probably the most innovative contribution to smart distribution systemsy
Computation is never an issue, especially in extended real-time domain, but time requirements of the communication system can be a relevant bottleneck
The transition from simulation to implementation is the hardest step because of interoperability issues
A ti Di t ib ti N t k MVActive Distribution Networks: MV Voltage Profiles and LoadingVoltage Profiles and Loading
Limits for a Large Penetration of ts o a a ge e et at o oDG
M Cresta F M Gatta A Geri L Landolfi S LauriaM. Cresta, F.M. Gatta, A. Geri, L. Landolfi, S. Lauria, M. Maccioni, M. Paolucci
Page: 1 of 13
Paper: Active Distribution Networks: MV Voltage Profiles and Loading … Authors: M. Cresta, F.M. Gatta, A. Geri, L. Landolfi, S. Lauria,
M. Maccioni, M. PaolucciPresented by: Marco Maccioni
Outline
1 I t d ti1. Introduction2. Simulated distribution network3. Case studies4 C l i4. Conclusions
Page: 2 of 13
Paper: Active Distribution Networks: MV Voltage Profiles and Loading … Authors: M. Cresta, F.M. Gatta, A. Geri, L. Landolfi, S. Lauria,
M. Maccioni, M. PaolucciPresented by: Marco Maccioni
Introduction - 1• Nowadays, a continuously growing amount of DG has to
be integrated in MV and LV distribution networksbe integrated in MV and LV distribution networks• At individual MV network level, installed DG can cause
strongly variable bidirectional power flows on MV feedersstrongly variable bidirectional power flows on MV feeders,if it is comparable to network load
• Active MV networks pose new problems to DistributionActive MV networks pose new problems to DistributionSystem Operators:
– protective relaying– short circuit current increase– sustained feeder operation (islanding) after line dropping
l d MV d LV f d– overloads on MV and LV feeders– variability of MV and LV voltage profiles– low power factor at the interface of bulk power system
Page: 3 of 13
Paper: Active Distribution Networks: MV Voltage Profiles and Loading … Authors: M. Cresta, F.M. Gatta, A. Geri, L. Landolfi, S. Lauria,
M. Maccioni, M. PaolucciPresented by: Marco Maccioni
low power factor at the interface of bulk power system
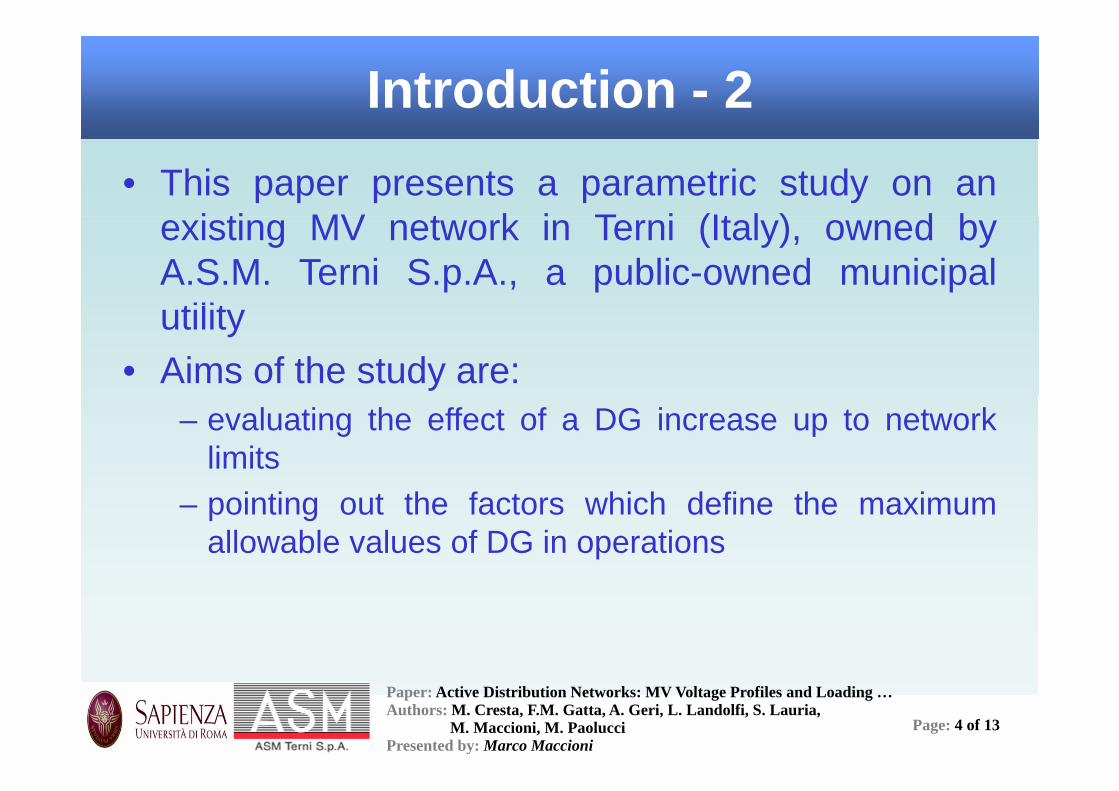
Introduction - 2• This paper presents a parametric study on an
i ti MV t k i T i (It l ) d bexisting MV network in Terni (Italy), owned byA.S.M. Terni S.p.A., a public-owned municipal
tilitutility• Aims of the study are:
– evaluating the effect of a DG increase up to networklimits
– pointing out the factors which define the maximumallowable values of DG in operations
Page: 4 of 13
Paper: Active Distribution Networks: MV Voltage Profiles and Loading … Authors: M. Cresta, F.M. Gatta, A. Geri, L. Landolfi, S. Lauria,
M. Maccioni, M. PaolucciPresented by: Marco Maccioni
Simulated Distribution Network• 20/10 kV network owned by A.S.M. Terni S.p.A.:
three primary substations 156 MVA transformerU U
P.S . Terni Ovest
– three primary substations, 156 MVA transformercapacity612 km network extension (35% underground cables)– 612 km network extension (35% underground cables),570 MV/LV substations supplying 64000 customerswith 250 MW contractual power and 500 MWh average
G
GG
G G
G
GU U U U U
P.S . Villa Valle P .S . Ex S it
p gdaily energy demand
– loads supplied at MV level are essentiallyresidential/tertiary. Maximum load, registered in 2010,was 47 MW
– installed DG connected at MV level is about 45 MW(60% of it biomass or gas-fired thermal cycle, 36% PV,4% hydro) while 2 5 MW (PV) is connected at LV level
Page: 5 of 13
Paper: Active Distribution Networks: MV Voltage Profiles and Loading … Authors: M. Cresta, F.M. Gatta, A. Geri, L. Landolfi, S. Lauria,
M. Maccioni, M. PaolucciPresented by: Marco Maccioni
4% hydro), while 2.5 MW (PV) is connected at LV level
Case Study I – 1• Potential upper constraints for DG penetration:
maximum loading of feeders– maximum loading of feeders– alteration of voltage profiles along the feeders– increase of short-circuit currents (not considered in this study)increase of short circuit currents (not considered in this study)
• DG penetration was investigated starting from themaximum load condition and DG disconnected
• Four cases reported:– max load + 25% of DG installed– max load + 50% of DG installed– max load + 100% of DG installed
i DG ( dditi t th d f h f d f ti– maximum DG (addition at the end of each feeder of an activepower injection, up to the limits defined by constraints above)
Page: 6 of 13
Paper: Active Distribution Networks: MV Voltage Profiles and Loading … Authors: M. Cresta, F.M. Gatta, A. Geri, L. Landolfi, S. Lauria,
M. Maccioni, M. PaolucciPresented by: Marco Maccioni
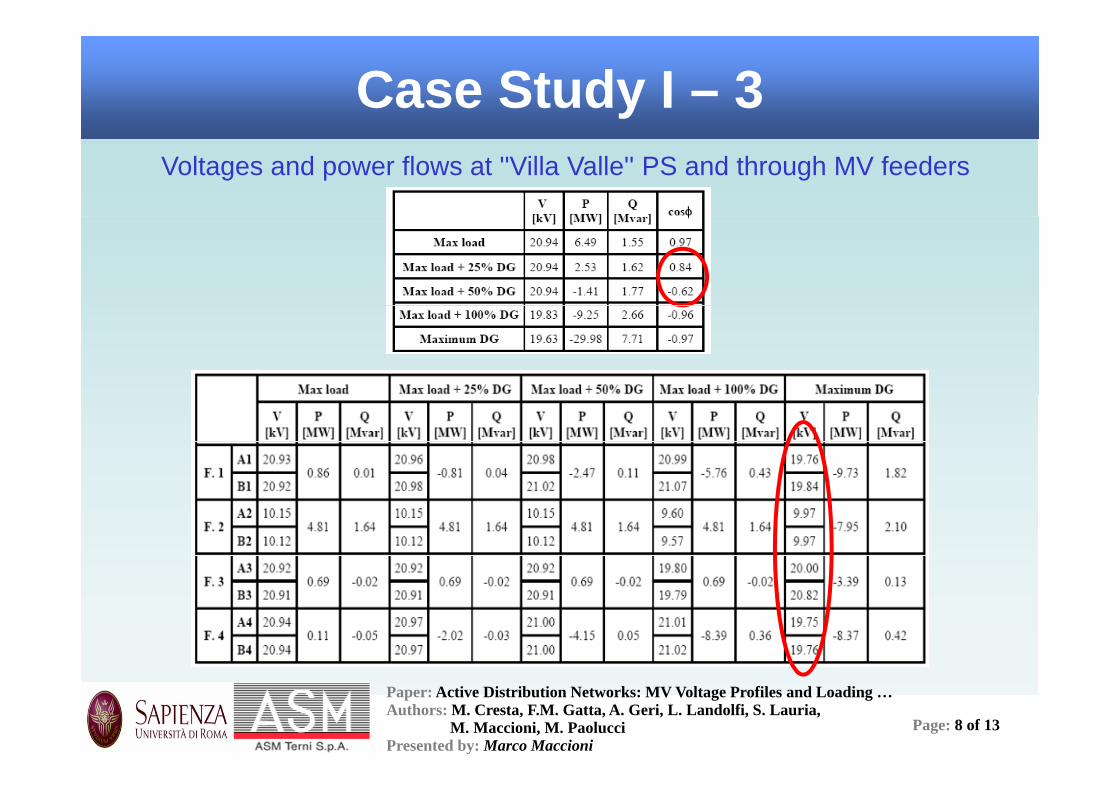
Case Study I – 2• Results refer to the MV network originated by ‘Villa Valle’
PS (40 MVA 150/20 kV transformer four main MV feeders)PS (40 MVA 150/20 kV transformer, four main MV feeders)
Page: 7 of 13
Paper: Active Distribution Networks: MV Voltage Profiles and Loading … Authors: M. Cresta, F.M. Gatta, A. Geri, L. Landolfi, S. Lauria,
M. Maccioni, M. PaolucciPresented by: Marco Maccioni
Case Study I – 3Voltages and power flows at ''Villa Valle'' PS and through MV feeders
Page: 8 of 13
Paper: Active Distribution Networks: MV Voltage Profiles and Loading … Authors: M. Cresta, F.M. Gatta, A. Geri, L. Landolfi, S. Lauria,
M. Maccioni, M. PaolucciPresented by: Marco Maccioni
Case Study II – 1• Loadability evaluation carried out on a 20 kV feeder
belonging to ''Terni Ovest'' PSbelonging to Terni Ovest PS• Three line loading patterns, obtained adding at different
locations six DG blocks each rated 2 16 MW arelocations six DG blocks, each rated 2.16 MW, arecompared:
– Case A: the whole 13 MW DG installed at the end of feeder– Case B: two DG blocks installed every third of the feeder– Case C: a single DG block installed every sixth of the feeder
Page: 9 of 13
Paper: Active Distribution Networks: MV Voltage Profiles and Loading … Authors: M. Cresta, F.M. Gatta, A. Geri, L. Landolfi, S. Lauria,
M. Maccioni, M. PaolucciPresented by: Marco Maccioni
Case Study II – 2
Page: 10 of 13
Paper: Active Distribution Networks: MV Voltage Profiles and Loading … Authors: M. Cresta, F.M. Gatta, A. Geri, L. Landolfi, S. Lauria,
M. Maccioni, M. PaolucciPresented by: Marco Maccioni
Conclusions - 1• Considering steady-state constraints only, the
A S M t d t DG i fA.S.M. system can accommodate DG in excess ofnetwork load, and actually it can afford a 100 MW
fl ( di t 150 MW f MVreverse flow (corresponding to 150 MW of MV-and LV-connected DG)
• The main limiting factor in steady-state conditionsis the presence of bottlenecks in practically all thefeeders of the network
• Assuming constant active power injection by theg p j yDG, voltage profiles can be kept under control bymeans of the HV/MV transformer load tap changer
Page: 11 of 13
Paper: Active Distribution Networks: MV Voltage Profiles and Loading … Authors: M. Cresta, F.M. Gatta, A. Geri, L. Landolfi, S. Lauria,
M. Maccioni, M. PaolucciPresented by: Marco Maccioni
p g
Conclusions - 2• Because of the variable nature of several types of
DG t ti ti l l i d t l tDG, statistical analyses are required to evaluatevoltage fluctuations at MV and LV level
• The power factor seen at HV bulk delivery pointbecomes lower than 0.9 as soon as DG injectionattained 25% of planned capacity, involvingsignificant potential costs for the distributioncompany
Page: 12 of 13
Paper: Active Distribution Networks: MV Voltage Profiles and Loading … Authors: M. Cresta, F.M. Gatta, A. Geri, L. Landolfi, S. Lauria,
M. Maccioni, M. PaolucciPresented by: Marco Maccioni
Thanks for the attention!
Page: 13 of 13
Paper: Active Distribution Networks: MV Voltage Profiles and Loading … Authors: M. Cresta, F.M. Gatta, A. Geri, L. Landolfi, S. Lauria,
M. Maccioni, M. PaolucciPresented by: Marco Maccioni