17 Marine Water & Sediment Quality 1 HINKLEY POINT C PRE-APPLICATION CONSULTATION – STAGE 2 | ENVIRONMENTAL APPRAISAL – VOLUME 2 17 MARINE WATER AND SEDIMENT QUALITY 17.1 Scope of Assessment 17.1.1 This chapter examines the potential effects on water quality of non-radiological discharges during the construction and operational phases of the proposed development. 17.1.2 Consideration of current water quality conditions within local marine waters is important to provide a robust understanding of baseline environmental conditions against which potential change may be assessed. To define the baseline conditions, a series of terrestrial marine water monitoring campaigns and analysis of marine sediments have been undertaken in 2009 and 2010. 17.1.3 Activities and operations that may lead to change in baseline water quality conditions are presented and assessed against environmental standards. Where appropriate, measures that would be implemented to deal with any significant effects on water quality that may result from project activities are described and the predicted outcomes assessed. 17.2 Key Features 17.2.1 The water quality regime normal to the waters off Hinkley Point is determined primarily by the highly dynamic physical characteristics associated with the extreme tidal range. A consideration of the key features of the physical environment, and their implications, can be found in the Hydrodynamics and Coastal Geomorphology chapter (Chapter 16). 17.3 Objectives of Assessment 17.3.1 For the purpose of this assessment, the following objectives were developed: identify the extent and quality of marine waters within the study area that potentially may be affected by the proposed development; determine the presence and nature of any potential contaminants present within marine sediments in areas likely to be affected by development activities; assess the potential for contaminants within sediments to be disturbed during development activities and identify measures to reduce potential effects if these are determined as potentially significant; assess the effect of the development during construction and operation on marine water quality; and develop appropriate management / mitigation measures to deal with potentially significant effects on water quality likely to arise as a result of the development. 17.3.2 In some instances mitigation measures have been an integral aspect of initial project design (e.g. avoidance of localised need for chlorination through appropriate design of cooling water intake).
Transcript
17 Marine Water & Sediment Quality
1HINKLEY POINT C PRE-APPLICATION CONSULTATION – STAGE 2 |
ENVIRONMENTAL APPRAISAL – VOLUME 2
17 MARINE WATER AND SEDIMENT QUALITY
17.1 Scope of Assessment
17.1.1 This chapter examines the potential effects on water quality of non-radiological discharges during the construction and operational phases of the proposed development.
17.1.2 Consideration of current water quality conditions within local marine waters is important to provide a robust understanding of baseline environmental conditions against which potential change may be assessed. To define the baseline conditions, a series of terrestrial marine water monitoring campaigns and analysis of marine sediments have been undertaken in 2009 and 2010.
17.1.3 Activities and operations that may lead to change in baseline water quality conditions are presented and assessed against environmental standards. Where appropriate, measures that would be implemented to deal with any significant effects on water quality that may result from project activities are described and the predicted outcomes assessed.
17.2 Key Features
17.2.1 The water quality regime normal to the waters off Hinkley Point is determined primarily by the highly dynamic physical characteristics associated with the extreme tidal range. A consideration of the key features of the physical environment, and their implications, can be found in the Hydrodynamics and Coastal Geomorphology chapter (Chapter 16).
17.3 Objectives of Assessment
17.3.1 For the purpose of this assessment, the following objectives were developed:
identify the extent and quality of marine waters within the study area that potentially may be affected by the proposed development;
determine the presence and nature of any potential contaminants present within marine sediments in areas likely to be affected by development activities;
assess the potential for contaminants within sediments to be disturbed during development activities and identify measures to reduce potential effects if these are determined as potentially significant;
assess the effect of the development during construction and operation on marine water quality; and
develop appropriate management / mitigation measures to deal with potentially significant effects on water quality likely to arise as a result of the development.
17.3.2 In some instances mitigation measures have been an integral aspect of initial project design (e.g. avoidance of localised need for chlorination through appropriate design of cooling water intake).
17 Marine Water & Sediment Quality
2 | HINKLEY POINT C PRE-APPLICATION CONSULTATION – STAGE 2
ENVIRONMENTAL APPRAISAL – VOLUME 2
17.4 Legislation, Policy And Guidance
17.4.1 The legislation applicable to water quality in the marine environment is largely similar to that of relevance to the freshwater environment and a full description of much of this legislative material is provided in Chapter 15 on surface waters. There are, however, several pieces of legislation that are of particular relevance to the marine environment or solely concerned with the management of activities in marine waters. These are listed below and a description is provided.
a) European Legislation
17.4.2 Many standards for water quality are regulated at EU level through a range of environmental directives. The most relevant of these are:
EC Water Framework Directive (2000/60/EC) and Priority Substances Directive (2008/105/EC);
17.4.3 There is no specific regulation of sediment quality. In the marine environment, deposits in the sea anywhere below Mean High Water Spring tide mark are managed under Part 2 of the Food & Environment Protection Act 1985 by the Marine Management Organisation.
i) Water Framework Directive
17.4.4 The Water Framework Directive (2000/60/EC) (WFD) is a key piece of legislation relating to the protection of water quality and ecological status of freshwaters and coastal waters. A specific framework directive aimed at protecting marine waters was also passed in 2008 and is known as the Marine Strategy Framework Directive (2008/56/EC).
17.4.5 The WFD provides a mechanism by which disparate regulatory controls on human activities that have the potential to impact on water quality may be managed effectively and consistently. In addition to a range of inland surface and groundwaters, WFD covers transitional waters (estuaries and lagoons) and coastal waters up to 1 nautical mile from mean low water (the baseline from which territorial waters are measured). Existing regulations that will eventually be subsumed by the WFD and that have a bearing on transitional and coastal waters include the Freshwater Fish Directive (78/659/EC), Shellfish Waters Directive (79/923/EC), and Dangerous Substances Directive (76/464/EC). The WFD is implemented in England and Wales primarily through the Water Environment (Water Framework Directive) (England and Wales) Regulations 2003 (the Water Framework Regulations). UK surface waters have been divided into a number of discrete units termed ‘water bodies’, with meaningful typologies that relate to physical and ecological characteristics. Based upon ecology and water quality, these water bodies have been classified as falling into different status classes. The WFD requires that all inland and coastal waters must reach at least ‘good status’ by 2015 and that the status of all surface water bodies should not deteriorate. Individual water bodies may be categorised as Heavily Modified Water Bodies (HMWB). The WFD water bodies local to Hinkley Point are shown in Figure 17.1.
ii) Dangerous Substances Directive
17.4.6 The EC Dangerous Substances Directive (76/464/EC) is implemented through the Surface Waters (Dangerous Substances) Regulations 1989. It sets EQS for a range of substances in water. The regulation of ‘Priority Substances’ under the WFD effectively supersedes many of these standards, although standards for some substances remain in force.
17 Marine Water & Sediment Quality
3HINKLEY POINT C PRE-APPLICATION CONSULTATION – STAGE 2 |
ENVIRONMENTAL APPRAISAL – VOLUME 2
b) National Legislation
17.4.7 The Environment Agency is the principal regulator of water quality in the UK. The Environment Agency has regulatory authority under the following water related legislation, which is summarised in Chapter 15:
Environment Act 1995; Water Resources Act 1991; Environmental Protection Act 1990; Pollution Prevention and Control Act 1999 (Statutory Instrument 1973/2000); Surface Waters (Dangerous Substances) Regulations 1989; and Water Environment (Water Framework Directive) (England and Wales) Regulations 2003 (the
Water Framework Regulations).
17.4.8 The Marine Management Organisation (MMO) and statutory port and harbour authorities can also have important roles in managing some aspects of water quality.
i) UK Marine and Coastal Access Act
17.4.9 The UK Marine and Coastal Access Act 2009 (Marine Act) gained Royal Assent on 12 November 2009 and provides the legal mechanism to help ensure clean, healthy, safe, productive and biologically diverse oceans and seas by putting in place new systems for improved management and protection of the marine and coastal environment. Of particular interest in the context of this assessment is that the Marine Act will supersede the two existing Acts which set the framework for the current marine licensing system i.e. the Food and Environment Protection Act 1985 (FEPA) and the Coast Protection Act 1949. The Marine Management Organisation (MMO) is responsible for delivering licensing arrangements under the Marine Act.
ii) Food and Environment Protection Act
17.4.10 FEPA licences mainly permit construction within the marine environment, or the deposition of materials at sea following an assessment of whether the specific activities are likely to cause harm to the food chain thus impacting on human and environmental health. FEPA licences will soon be replaced by Marine Licences under the Marine Act, however the requirements in terms of sampling and environmental assessment are not likely to change considerably.
17.4.11 Guidance of relevance to water quality issues include Environment Agency ‘Planning Policy Guidance’ notes and their replacement ‘Planning Policy Statements’. These policy and guidance documents have been used in the assessment process described in this chapter and are referred to in the text where appropriate.
17.5 Methodology
a) Summary Of Approach
17.5.1 The approach to assessing potential water quality change relates to evaluating the existing water quality and determining how quality may be affected by the development activities during construction and operation.
17.5.2 For marine non-radiological discharges the potential change in water quality conditions has been determined through the standard modelling approach for assessing the risk posed by industrial aqueous emissions. This is the H1 Environmental Risk Assessment process (Environment Agency, 2010 (Ref 17.1)) and has been adopted here to assess discharges to the marine environment during all phases of the proposed development of the Hinkley Point C power station. The H1 methodology relies on the use of environmental quality standards (EQSs)
17 Marine Water & Sediment Quality
4 | HINKLEY POINT C PRE-APPLICATION CONSULTATION – STAGE 2
ENVIRONMENTAL APPRAISAL – VOLUME 2
to assess the significance of specific chemicals within a discharge. Where no EQS is available for a particular chemical an alternative approach has been adopted. Full details of the H1 assessment calculations and modelling results are presented within AMEC, 2010 (Ref. 17.2), subsequently referred to herein as the Modelling Report.
17.5.3 Results from the Modelling Report (Ref. 17.2) have been primarily used in defining the significance of potential change for individual chemical parameters and, through the use of available EQSs, whether potential water quality attributes may be exceeded or not. The basic guidelines that have been adopted in assessing the level of significance of change are set out in Table 17.2.
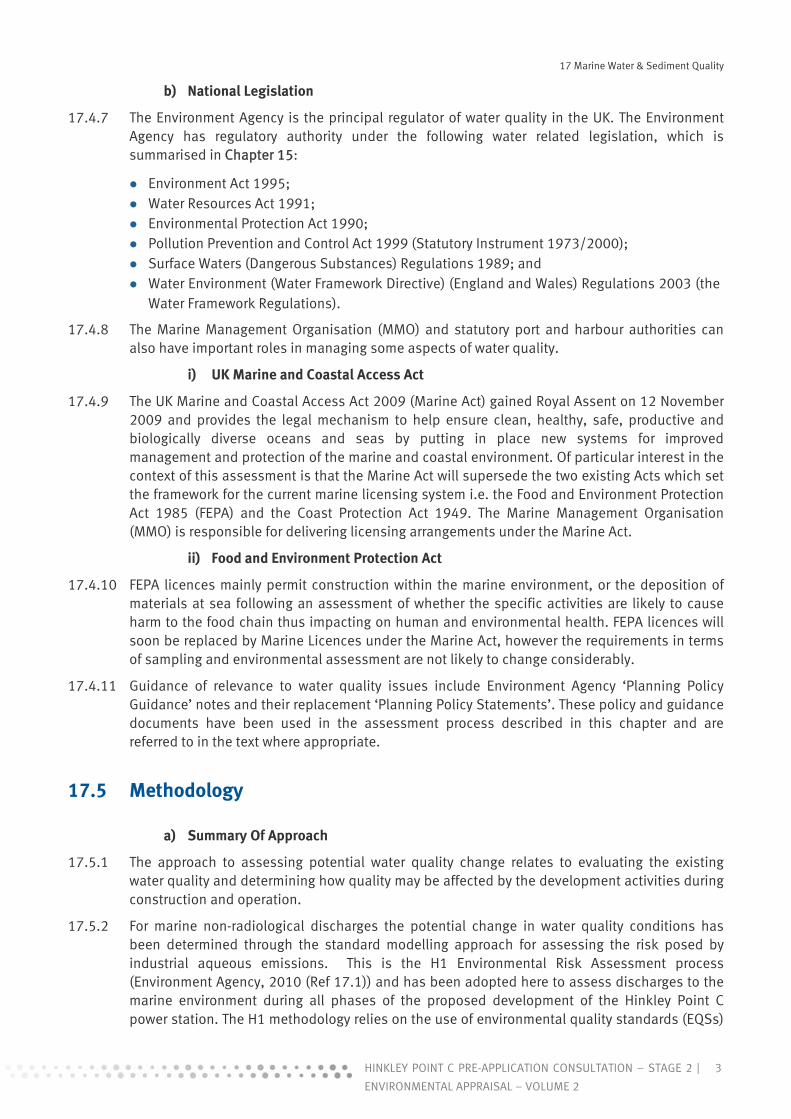
17.5.4 It should be made clear that for the purposes of this assessment, a change in water quality in its own right is not viewed as an impact in the same manner as many of the other environmental parameters covered in this chapter. However, the predicted change in quality conditions, largely with respect to chemical and physical properties, may have implications (i.e. impact upon) other environmental interests, particularly marine flora and fauna. The significance of the change in water quality conditions is therefore assessed with respect to these other parameters. Reference to these potential linkages where the change in water quality has been assessed is provided where relevant.
Table 17.1: Criteria Used To Determine Importance And Sensitivity Of Water Quality Receptors
Importance and Sensitivity Description
High Water quality of specific receptor site supports or contributes towards the designation of a nationally important feature. Very low capacity to accommodate any change to current water quality status, compared to baseline conditions.
Medium Water quality of receptor site supports high biodiversity (not designated). Receptor has low capacity to accommodate change to water quality status.
Low Baseline conditions define an environment that has a high capacity to accommodate proposed change to water quality status due, for example, to the large relative size of receiving water feature and effect of dilution. Baseline water quality status generally poor.
Very Low Specific water quality conditions of receptor water feature likely to be able to tolerate proposed change with very little or no impact upon the baseline conditions.
17 Marine Water & Sediment Quality
5HINKLEY POINT C PRE-APPLICATION CONSULTATION – STAGE 2 |
ENVIRONMENTAL APPRAISAL – VOLUME 2
Table 17.2 Generic Guidelines Relating To H1 Methodology Used In The Assessment Of Significance Of Change To Baseline Water Quality Condition
Significance Guideline
High Very significant change to key characteristics of the water quality status of the receiving water feature e.g. modelled as significant under the Environment Agency H1 Assessment or thermal plume modelling. Water quality status degraded to the extent that permanent change and inability to meet EQSs likely
Medium Significant changes to key characteristics of water quality status taking account of the receptor volume, mixing capacity/flow rate etc. Water quality status likely to take considerable time to recover to baseline conditions.
Low Noticeable but not considered significant changes to water quality status of receptor water feature. Activity not likely to alter local status to the extent that water quality characteristics change considerably or EQSs are compromised. Activities are likely to lead to change for a short time scale (e.g. relative to turnover of water feature) and baseline water quality conditions would be maintained.
Negligible Although there may be some change in water quality status, this would occur over a short period of time. Any change to water quality status will be quickly reversed once activity ceases.
b) Limitations
17.5.5 The assessment of potential changes in water quality assessed in this chapter is based on the proposed engineering options and information available at the time of writing. Expected discharges during the operational phase have been sourced from the Pre-Construction Environmental Report (PCER) (EDF Energy, 2009 (Ref. 17.3)) documentation and from initial information on desalination and demineralisation plant discharges made available by EDF Energy. These data are generally based upon experience with the Flamanville 3 site, in north-western France, an understanding of site specific needs for Hinkley Point, and UK policy and practice for the management of such processes and allied waste streams.
c) Data And Information Sources
17.5.6 In preparing this assessment, two key documents have been identified and utilised as primary data sources. The first is BEEMS Technical Report 070, ‘Predicted Effects of New Nuclear Build on Water Quality at Hinkley Point’ (BEEMS, 2010 (Ref. 17.4)). The second is Marine Biological Association Occasional Publication No. 13, ‘Site Characterisation of the South West European Marine Sites – Severn Estuary pSAC, SPA' (Langston et al., 2003 (Ref. 17.5)).
17.5.7 Information available in publicly available scientific literature and in particular those sources identified above, has been used to characterise the wider marine environment. Results from the offshore marine water quality sampling campaigns undertaken in 2009 (see below) offer a complimentary source of more localised water quality data (offshore of Hinkley Point). For the purpose of the assessment the discharges from the existing Hinkley Point nuclear power stations are considered to represent existing baseline conditions.
d) Water And Sediment Quality Surveys And Sampling
i) Summary Of 2009 Marine Monitoring Surveys
17.5.8 Requests to the Environment Agency for historical water quality information indicated that no historical data were available for the marine waters off Hinkley Point. Therefore a marine water
17 Marine Water & Sediment Quality
6 | HINKLEY POINT C PRE-APPLICATION CONSULTATION – STAGE 2
ENVIRONMENTAL APPRAISAL – VOLUME 2
quality programme was developed and undertaken during 2009. A brief summary of this programme is provided here.
17.5.9 The sampling approach adopted for the study was to obtain a ‘snap shot’ of water quality conditions from four sampling visits. The sampling visits were carried out in January, May, June and September 2009. The timing of each campaign was co-ordinated so that the complete data set contains data collected across a range of tidal conditions e.g. Neap/Spring tides and also during different seasons. The sampling approach, proposed suite of parameters to be analysed and a minimum list of surface water testing parameters was agreed with the Environment Agency. Sampling events targeted both neap and spring tide conditions so that the range of water quality conditions could be established. The monitoring campaigns were conducted on the following dates:
27 – 28 January 2009 – Spring tidal conditions. 1 – 2 May 2009 – Neap tidal conditions. 27 – 28 June 2009 – Spring tidal conditions. 12 – 13 September 2009 – Neap tidal conditions.
17.5.10 The location of marine sampling points was initially defined in relation to initial engineering design assumptions on proposed locations for the cooling water intake and discharge structures, in late 2008. One sampling zone was established within a polygon around a point approximately 2.5 km and another wider area around a point approximately 6 km offshore.
17.5.11 Subsequent to the development of this study and its deployment in the field, numerical hydrodynamic modelling outputs resulted in a revision to the intake and outfall locations under test. A decision was taken to conserve the offshore water quality survey design nonetheless as it (a) bracketed the area of interest and (b) conserved and took best advantage of the baseline already partially established.
17.5.12 Within each of the two sampling zones, ten water quality sampling point locations and eight water profiling point locations were originally identified. Following the review described above, additional intermediate sampling location points were added.
17.5.13 The sample collection methodology and handling of samples was undertaken according to the methods described in the British Standard for Water Quality Sampling (Ref. 17.6).
17.5.14 At each monitoring location, three water samples were collected: one from approximately 0.5 m below the surface, one at mid-water and one just above the sea bed (according to the depth identified at each location by the survey vessels echo sounder).
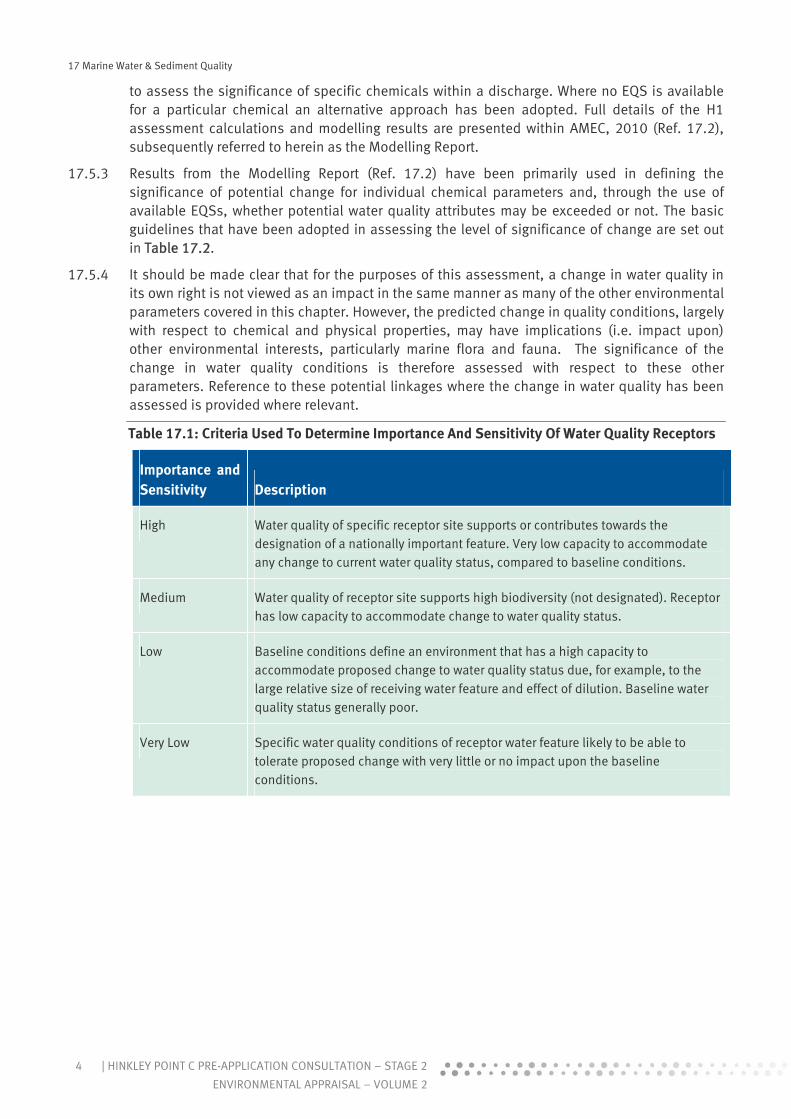
17.5.15 The suite of chemical analysis testing for all marine water samples is given in Table 17.3.
17.5.16 In-situ water quality parameter profiling was undertaken at five monitoring stations in the offshore sampling area, at five locations within the near shore sampling area and at four of the intermediate locations added after the first sampling campaign. At each monitoring profile location, the water temperature, dissolved oxygen (as percentage saturation and concentration in mg/l) and salinity were measured. Measurements were recorded using a pre-calibrated multi-probe sonde and meter.
17.5.17 A replicate set of samples was collected from a single sampling location at random during campaigns 2-6. One blank sample (ultra-pure water) was also submitted for analysis, to act as further quality assurance of the laboratory testing. Quality assurance samples returned laboratory results that corresponded very closely with the relevant replicate sample. Further information on the sampling programme, procedures and sample handling (labelling, chain of custody procedures etc) may be found in the ‘Surface Water Quality, Groundwater Quality and Ground Gas Quality Monitoring Plan’.
17 Marine Water & Sediment Quality
7HINKLEY POINT C PRE-APPLICATION CONSULTATION – STAGE 2 |
ENVIRONMENTAL APPRAISAL – VOLUME 2
Table 17.3 Suite Of Chemical Determinands Tested During Marine Water Quality Sampling.
Determinand MRV Units Accreditation
Salinity 1 ppt N
pH 0.1 units Y
Turbidity 2 mg/l N
Arsenic (total and dissolved) 1 g/l Y
Boron (total and dissolved) 5 g/l Y
Cadmium (total) 1 g/l Y
Cadmium (dissolved) 1 g/l Y
Chromium (total and dissolved) 1 g/l Y
Copper (total and dissolved) 1 g/l Y
Iron (total and dissolved) 5 g/l Y
Lead (total and dissolved) 1 g/l Y
Nickel (total and dissolved) 1 g/l Y
Mercury (total) 0.1 g/l Y
Mercury (dissolved) 0.1 g/l Y
Zinc (total) 1 g/l Y
Aluminium 5 g/l Y
Manganese 5 g/l Y
Lithium 10 g/l N
Sodium 1 mg/l Y
Chloride 1 mg/l Y
Nitrite 0.05 mg/l N
Nitrate 1 mg/l Y
Ammonium as NH4 (mg/l) 0.03 mg/l N
Sulphate 1 mg/l Y
BOD 2 mg/l N
17 Marine Water & Sediment Quality
8 | HINKLEY POINT C PRE-APPLICATION CONSULTATION – STAGE 2
ENVIRONMENTAL APPRAISAL – VOLUME 2
Determinand MRV Units Accreditation
COD 2 mg/l N
Total Suspended Solids 5 mg/l N
Phosphates 5 mg/l N
Orthophosphate as PO4 0.02 g/l N
Silicates 5 g/l N
Residual chlorine 100 g/l Y
Detergents 100 g/l N
Hydrazine 0.1 mg/l N
Ethanolamine 0.01 mg/l N
Morpholine 0.01 mg/l N
Trihalomethanes 1 g/l N
Dichloromethane 1 g/l N
Dibromoacetic Acid 1 g/l N
Dibromochloromethane 1 g/l N
Chloroform 1 g/l N
Dibromoacetonitrile 1 g/l N
Total TPH (C8-C36) 10 g/l Y
Note: testing of ‘Total Boron’ was added to the suite of analysis following marine campaign 2 in order to fill a recognised gap in survey coverage.
e) Marine Water Environmental Quality Standards (EQS)
17.5.18 In December 2009, Directions were issued by the UK Government which allowed the revised water quality environmental standards developed by UKTAG for the WFD to be implemented. The area sampled for marine water quality for the Hinkley Point C studies falls within the Bridgwater Bay WFD water body which is classed as a coastal water body. A description of this water body is provided in Annex B of the Environment Agency’s South West River Basin District Management Plan. The water body is currently indicated to have a moderate overall quality with the objective of reaching ‘Good Status’ by 2027. Dissolved oxygen and dissolved inorganic nitrogen provide supporting elements to the water body’s assigned moderate status with the current conditions described as high and moderate (uncertain) respectively. The moderate status of dissolved inorganic nitrogen, although indicated to be uncertain, is one of the causal reasons why ‘Good Status’ is unlikely to be achieved by 2015.
17.5.19 Environmental standards used to assess the water quality offshore of Hinkley Point are those provided within the Directions for Transitional and Coastal (‘TraC’) Waters. The previously
17 Marine Water & Sediment Quality
9HINKLEY POINT C PRE-APPLICATION CONSULTATION – STAGE 2 |
ENVIRONMENTAL APPRAISAL – VOLUME 2
applicable saltwater EQS values derived from the previous version of H1 Guidance and have been retained for comparative purposes (see Table 17.4).
Table 17.4 Water Quality Standards used to assess the water quality of marine surface waters and EPR discharges at Hinkley Point.
Determinands Units
Pre-WFD Saltwater EQS Values
WFD Transitional and Coastal Waters EQS Values4
Total Boron (μg/l) 7000AT -
Dissolved Chromium (μg/l) 151AD 0.6A, 32MAC (P) for chromium VI
Dissolved Lead (μg/l) 251AD 7.2AD
Dissolved Nickel (μg/l) 301AD 20AD
Dissolved Copper (μg/l) 51AD 5AD
Dissolved Iron (μg/l) 10001AD 1000AD
Dissolved Zinc (μg/l) 401AD
Dissolved Boron (μg/l) - -
Dissolved Aluminium (μg/l) - -
Dissolved Manganese (μg/l) - -
Dissolved Arsenic (μg/l) 25AD
Dissolved Cadmium (μg/l) 0.2AD and 1.5MAC
Dissolved Lithium (μg/l) - -
pH units 6 – 8.51(P95) -
Sulphate (mg/l) - -
Chloride (mg/l) - -
Dissolved Inorganic Nitrogen
(μg/l) - 180 – 270(P99)5
Unionised Ammonia as N (μg/l) - 21 A
Phosphate (mg/l) - -
Sodium (mg/l) - -
Suspended Solids (mg/l) - -
17 Marine Water & Sediment Quality
10 | HINKLEY POINT C PRE-APPLICATION CONSULTATION – STAGE 2
ENVIRONMENTAL APPRAISAL – VOLUME 2
Determinands Units
Pre-WFD Saltwater EQS Values
WFD Transitional and Coastal Waters EQS Values4
BOD (mg/l) - -
COD (mg/l) - -
Free Chlorine (mg/l) 102 (TRO) MAC 102 (TRO) MAC (P95)
Total Petroleum Hydrocarbons
(μg/l) - -
Non-ionic detergents (mg/l) - -
Cationic detergents (mg/l) - -
Trihalomethanes (μg/l) - -
Dichloromethane (μg/l) - 20A
Dichlorobromomethane (μg/l) - -
Dibromochloromethane (μg/l) - -
Chloroform (μg/l) 123A 2.5A
Dibromoacetonitrile (μg/l) - -
Dibromo Acetic Acid (μg/l) - -
Hydrazine (mg/l) - -
Ethanolamine (mg/l) - -
Morpholine (mg/l) - -
Notes: A – Annual Average; (P95) – 95 Percentile; (P99) – 99 percentile; MAC – Maximum allowable concentration; TRO – As total residual oxidants; 1. National Environmental Quality Standards (EQS) – For List II substances DoE Circular 7/89. 2. Surface Waters (Dangerous Substances) (Classification) Regulations 1997 3. Surface Waters (Dangerous Substances) (Classification) Regulations 1989. 4. River Basin Districts Typology, Standards and Groundwater Threshold Values (Water Framework Directive (England and Wales)) Directions 2009. 5. Standard is for winter dissolved inorganic nitrogen for WFD good status for medium to high turbidity coastal waters.
17.5.20 A number of the chemicals that will be present within the expected marine discharges during the commissioning and operational phases of the new build development have no assigned saltwater EQS or Environmentally Acceptable Level (EAL) value. The assessment approach for those chemicals that do not have a saltwater EQS consists of a hierarchical approach where a saltwater EQS is utilised if available, followed by a background mean ambient concentration
17 Marine Water & Sediment Quality
11HINKLEY POINT C PRE-APPLICATION CONSULTATION – STAGE 2 |
ENVIRONMENTAL APPRAISAL – VOLUME 2
and finally a Predicted No Effect Concentration (PNEC) benchmark if no other benchmark is available.
17.5.21 Table 17.5 lists the parameters that have been included in the analysis of samples collected during the marine surface water monitoring campaigns for which there are no EQSs and for which PNEC values have been developed, based on EDF Energy ecotoxicity studies.
Table 17.5. Proposed PNEC Values For Chemical Parameters Based On EDF Energy Research & Development Review Of Ecotoxicity Studies
Chemical Parameter Acute Marine PNEC Chronic Marine PNEC
Hydrazine 0.004 μg/l 0.0004 μg/l
Ethanolamine 160 μg/l 160 μg/l
Morpholine 28 μg/l 17 μg/l
f) Marine Sediment Quality
17.5.22 During November and December 2009 sampling of the sea bed sediments in the vicinity of the proposed temporary jetty and cooling water intake and outfall locations was undertaken by Fugro Seacore Ltd. This effort was primarily for subseabed geophysical appraisal but advantage was taken of this in order to obtain sediment samples for chemical analysis both at surface and depth. Samples returned to the laboratory were subject to detailed inorganic and organic chemical testing for a wide range of determinands, including standard radiochemical parameters.
17.5.23 Unlike water quality, there are no quantified EQSs for in-situ sediment quality in the UK. The only pertinent guidance for sediment quality is given for most of the EC Dangerous Substances Directive List 1 substances and is defined as "standstill (no deterioration)". In the absence of any quantified UK standards, common practice used to characterise baseline sediment quality conditions is to compare against two separate criteria sets:
CEFAS Guideline Action Levels for the disposal of dredged material; and Canadian Sediment Quality Guidelines for the Protection of Aquatic Life (Ref. 17.7).
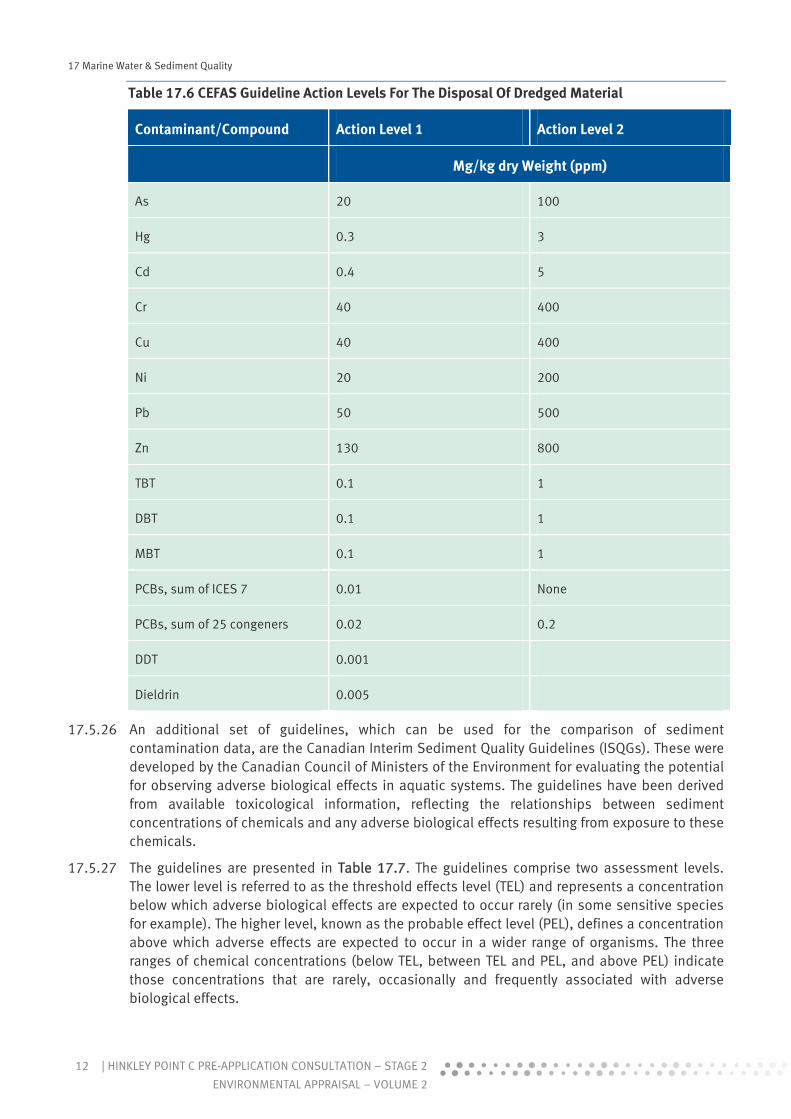
17.5.24 CEFAS Guideline Action Levels are used as part of a ‘weight of evidence’ approach to assessing material suitability for placement in the sea and are not statutory contaminant standards. The vast majority of the materials considered arise from dredging activities. These Action Levels are used in conjunction with a range of other assessment methods e.g. bioassays, as well as historical data and knowledge regarding the dredging site, the material’s physical characteristics, the disposal/construction site characteristics and other relevant data, to make management decisions regarding the potential to harm the environment. Current Action Levels are set out in Table 17.6.
17.5.25 CEFAS guidance in relation to the application of these Action Levels indicates that in general, contaminant levels in dredged material below Action Level 1 are of no concern and are unlikely to influence the licensing decision. However, dredged material with contaminant levels above Action Level 2 is generally considered unsuitable for disposal/placement at sea. The latter situation most often applies only to a part of a proposed dredging area so that area can be excluded from disposal at sea and disposed by other routes, e.g. landfill. Dredged material with contaminant levels between Action Levels 1 and 2 requires further consideration and testing before a decision can be made. The standards should not be viewed, therefore, as pass/fail thresholds.
17 Marine Water & Sediment Quality
12 | HINKLEY POINT C PRE-APPLICATION CONSULTATION – STAGE 2
ENVIRONMENTAL APPRAISAL – VOLUME 2
Table 17.6 CEFAS Guideline Action Levels For The Disposal Of Dredged Material
17.5.26 An additional set of guidelines, which can be used for the comparison of sediment contamination data, are the Canadian Interim Sediment Quality Guidelines (ISQGs). These were developed by the Canadian Council of Ministers of the Environment for evaluating the potential for observing adverse biological effects in aquatic systems. The guidelines have been derived from available toxicological information, reflecting the relationships between sediment concentrations of chemicals and any adverse biological effects resulting from exposure to these chemicals.
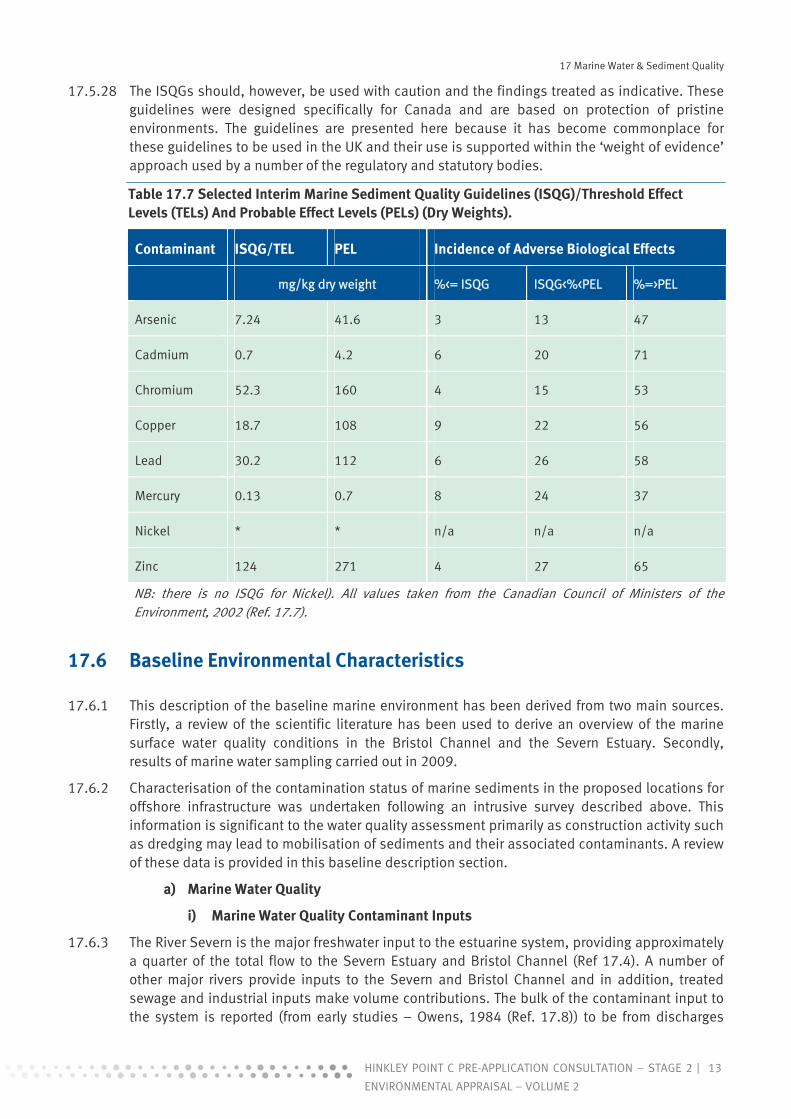
17.5.27 The guidelines are presented in Table 17.7. The guidelines comprise two assessment levels. The lower level is referred to as the threshold effects level (TEL) and represents a concentration below which adverse biological effects are expected to occur rarely (in some sensitive species for example). The higher level, known as the probable effect level (PEL), defines a concentration above which adverse effects are expected to occur in a wider range of organisms. The three ranges of chemical concentrations (below TEL, between TEL and PEL, and above PEL) indicate those concentrations that are rarely, occasionally and frequently associated with adverse biological effects.
17 Marine Water & Sediment Quality
13HINKLEY POINT C PRE-APPLICATION CONSULTATION – STAGE 2 |
ENVIRONMENTAL APPRAISAL – VOLUME 2
17.5.28 The ISQGs should, however, be used with caution and the findings treated as indicative. These guidelines were designed specifically for Canada and are based on protection of pristine environments. The guidelines are presented here because it has become commonplace for these guidelines to be used in the UK and their use is supported within the ‘weight of evidence’ approach used by a number of the regulatory and statutory bodies.
Contaminant ISQG/TEL PEL Incidence of Adverse Biological Effects
mg/kg dry weight %<= ISQG ISQG<%<PEL %=>PEL
Arsenic 7.24 41.6 3 13 47
Cadmium 0.7 4.2 6 20 71
Chromium 52.3 160 4 15 53
Copper 18.7 108 9 22 56
Lead 30.2 112 6 26 58
Mercury 0.13 0.7 8 24 37
Nickel * * n/a n/a n/a
Zinc 124 271 4 27 65
NB: there is no ISQG for Nickel). All values taken from the Canadian Council of Ministers of the Environment, 2002 (Ref. 17.7).
17.6 Baseline Environmental Characteristics
17.6.1 This description of the baseline marine environment has been derived from two main sources. Firstly, a review of the scientific literature has been used to derive an overview of the marine surface water quality conditions in the Bristol Channel and the Severn Estuary. Secondly, results of marine water sampling carried out in 2009.
17.6.2 Characterisation of the contamination status of marine sediments in the proposed locations for offshore infrastructure was undertaken following an intrusive survey described above. This information is significant to the water quality assessment primarily as construction activity such as dredging may lead to mobilisation of sediments and their associated contaminants. A review of these data is provided in this baseline description section.
a) Marine Water Quality
i) Marine Water Quality Contaminant Inputs
17.6.3 The River Severn is the major freshwater input to the estuarine system, providing approximately a quarter of the total flow to the Severn Estuary and Bristol Channel (Ref 17.4). A number of other major rivers provide inputs to the Severn and Bristol Channel and in addition, treated sewage and industrial inputs make volume contributions. The bulk of the contaminant input to the system is reported (from early studies – Owens, 1984 (Ref. 17.8)) to be from discharges
17 Marine Water & Sediment Quality
14 | HINKLEY POINT C PRE-APPLICATION CONSULTATION – STAGE 2
ENVIRONMENTAL APPRAISAL – VOLUME 2
upstream of the River Parrett. Industrial and sewage inputs combined contributed a slightly larger proportion of the mercury, cadmium and unionised ammonia and orthophosphate, but riverine inputs accounted for most of the total oxidised and inorganic nitrogen (Ref.17.8).
17.6.4 The Severn Estuary has historically received large loadings of contaminants from sewage and industrial inputs. Indeed many of the industries were located in the area due to the assumed assimilation capacity of the Estuary and Bristol Channel. Historical contaminants are highly varied in type and include metals, organo-metals, hydrocarbons, nutrients, mineral acids, solvents, biocides, fungicides, PCBs, pesticides and radionuclides.
17.6.5 In addition to point source contaminant inputs, diffuse chemical inputs to the Severn and Bristol Channel are likely to arise from runoff from agricultural land and that of tributaries such as the Avon, Usk and River Parrett (Ref 17.5), runoff from urban centres, and deposition from aerial emissions.
17.6.6 BEEMS, 2010 (Ref.17.4) report a decreasing concentration trend of the majority of dissolved metals measured (arsenic, cadmium, chromium, copper, iron, nickel, lead, zinc, mercury), with most values below quality standards as defined for the Dangerous Substances Directive for each metal, for various sites from the Severn through to the Bristol Channel. Some EQS values for inner sites (Severn Estuary in particular), were reported in Langston et al., 2003 (Ref 17.5) to be exceeded by occasional maximum values for arsenic, cadmium, copper, nickel, lead, zinc and mercury, but in all cases average values were below the respective EQS. Data for 2005 to 2008 for an outer Severn site reported in the MERMAN database (as reported in Langston et al. 2007) (Ref. 17.9) indicate that dissolved cadmium and mercury concentrations are one to two orders of magnitude below their respective EQS values. Although the datasets indicate that the concentrations of some metals show a marked decrease from values reported in the 1970s, Langston et al., 2007 (Ref 17.9) suggest that the high variability in measured dissolved concentrations of metals may be attributable to sediment remobilisation and resuspension at the time of sampling.
ii) 2009 Marine Water Quality Monitoring Results
17.6.7 The key findings from the marine water quality monitoring results were that:
All chemicals for which there are assigned WFD EQSs had average values below the threshold values. Concentrations of the organic chemicals expected to be discharged from the EPR plants were below the laboratory’s minimum reporting values (MRV) on each of the four campaigns.
The marine waters off Hinkley Point are characterised by high concentrations of suspended solids with a mean value of 264 mg/l and show increasing concentrations with depth. The maximum recorded value during the four sampling campaigns was 1,795 mg/l. The high suspended solids concentrations arise from sediment mobilisation under bed scouring flows associated with the high tidal range (and associated tidal currents). There is corresponding low water transparency which restricts light availability for primary productivity by marine algae.
There was a general trend of increasing mean total metals concentrations (i.e. inclusive of dissolved and particulate fractions) with depth, such that the highest values were recorded for samples collected from the lower water column. This is likely to result from metal adsorption to sediment particles which display a corresponding increased concentration with water depth.
Exceedance of the EQS threshold level for dissolved copper, of 5 μg/l, was recorded at numerous sites across the sampling area on each of the sampling campaigns. The number of sampling sites where EQS exceedances were recorded for each campaign were:
17 Marine Water & Sediment Quality
15HINKLEY POINT C PRE-APPLICATION CONSULTATION – STAGE 2 |
ENVIRONMENTAL APPRAISAL – VOLUME 2
i. Campaign 1 (27 and 28 January 2009). 13
ii. Campaign 2 (1 and 2 May 2009). 17
iii. Campaign 3 (27 and 28 June 2009). 8
iv. Campaign 4 (12 and 13 September 2009). 1
Comparison with the dissolved copper EQS has been made using an annual averaged value. The mean value calculated from the combined data for all campaigns and at all sampling locations for dissolved copper was 3.95 μg/l and was below the EQS threshold value.
Exceedance of the Maximum Acceptable Concentration (MAC) EQS for dissolved mercury of 0.07 μg/l was recorded at a limited number of sites during the sampling campaign. The number of sampling sites where MAC-EQS exceedances were recorded for each campaign were:
i. Campaign 1 (27 and 28 January 2009). 3
ii. Campaign 2 (1 and 2 May 2009). 1
iii. Campaign 3 (27 and 28 June 2009). 0
iv. Campaign 4 (12 and 13 September 2009). 0
The mean value calculated from the combined data for all campaigns and at all sampling locations for dissolved mercury was 0.02 μg/l which is below the Annual Average EQS threshold value of 0.05 μg/l.
pH values were typical of seawater with a mean overall value of 7.83 and a range of 7.04 to 8.05 pH units.
Salinity varied between the sampling campaigns according to tidal state and the level of freshwater runoff. The overall mean value was 30.4 ppt, thus less than the full strength sea water of 32 to 34 ppt. The range of salinity values recorded during the sampling campaigns was 23.3 to 33.3 ppt.
Under the WFD, the assessment of dissolved inorganic nitrogen status requires a mean Winter concentration in micromoles per litre to be calculated for samples collected between 1 November and 28 March. Within the present campaign only one sample was collected during this period in Campaign 1 (27 and 28 January 2009). As this data has only been obtained from one monitoring visit it needs to be viewed with caution when comparing to the WFD EQS for Winter dissolved inorganic nitrogen. The WFD EQS for dissolved inorganic nitrogen in transitional and coastal waters varies with both salinity and turbidity. Under the WFD criteria the sampling areas included in the monitoring campaign would be classed as high turbidity (i.e. a mean value greater than 300 mg/l) based on the mean suspended solids concentration for the January 2009 sampling campaign being 494 mg/l. The EQS threshold values for ‘high’ and ‘good’ dissolved inorganic nitrogen status in very turbid waters are 18 and 270 μM/l respectively to which comparison of a 99th percentile results value is made. This calculated percentile value for dissolved inorganic nitrogen in the January 2009 campaign was 130.1 μM/l which is between the ‘high’ and ‘good’ status standards.
17.6.8 Analyses were undertaken of the water quality dataset to determine if there were significant spatial or tidal differences in the mean concentrations of tested parameters. For the purpose of comparison, statistical analyses were undertaken on the overall mean concentrations at each site. A statistical ‘F-test’ was applied to the data for each parameter to determine if there was a significant difference in the variances of the two data sets being compared. Following this initial
17 Marine Water & Sediment Quality
16 | HINKLEY POINT C PRE-APPLICATION CONSULTATION – STAGE 2
ENVIRONMENTAL APPRAISAL – VOLUME 2
testing an appropriate two-tailed ‘t-test’ (i.e. test selected for equal or unequal variances depending upon the results of the F-test) was applied to determine if there was a significant difference (with 95% confidence) between the mean values for either inshore and offshore sampling areas or Neap and Spring tide conditions. The key findings from the comparison of inshore and offshore water chemistry are:
Metals: There was spatial (inshore and offshore) and depth variability for the range of total and dissolved metals that were analysed. However, statistical analysis of the overall mean values showed that the only significant difference detected was for total lead for which higher concentrations were recorded within the inshore sampling area. Overall the data indicate that the water quality conditions, in terms of dissolved and total metal concentrations, are relatively homogenous in the marine waters off Hinkley Point.
General Water Quality Parameters: These results showed a degree of variability across the sampling area and with depth. Statistical comparison of the overall mean values across the range of tested parameters indicated that the only significant difference occurred for chemical oxygen demand (COD). COD concentrations were higher in the inshore sampling area with a mean concentration of 16.4 mg/l.
Expected Organic Discharge Chemicals: no results above laboratory minimum reporting values were recorded for these chemicals at any of the sampling sites across all four sampling campaigns (see Table 17.3 for listing).
17.6.9 The comparison of the water quality data for inshore and offshore sampling areas indicates a high degree of homogeneity when considered as a whole across all sampling sites and campaigns. Some local spatial and depth variations are evident within data collected for each campaign. The high degree of homogeneity is likely to be associated with the high tidal flow velocities creating well mixed water quality conditions in the marine waters off Hinkley Point. The key findings from the comparison of water chemistry over Neap and Spring tide conditions are:
Metals: Statistical analysis of the water quality data sets comparing overall mean concentrations from Neap and Spring tide periods found four total metal and two dissolved metal parameters that showed significant differences. For Neap tide periods higher mean concentrations of total copper, iron and boron were found. It should be noted that total boron was only analysed in samples from two sampling campaigns (campaigns 3 and 4). During Spring tide periods higher mean concentrations of total chromium, dissolved nickel and dissolved boron were recorded.
General Water Quality Parameters: Seven general water quality parameters differed significantly between Neap and Spring tide periods. During Neap tide periods higher overall mean levels of pH and concentrations of orthophosphate were recorded. Under Spring tidal states higher mean values of nitrate, phosphate, suspended solids, BOD and COD were found. There is a significant difference in suspended solid concentrations during Neap and Spring tide periods with respective mean concentrations of 185 and 351 mg/l. The higher suspended solids concentrations under Spring tide conditions are associated with higher tidal flow velocities causing greater mobilisation of bed sediment deposits.
Expected Organic Discharge Chemicals: No results above laboratory minimum reporting values were recorded for these chemicals at any of the sampling sites across all four sampling campaigns.
17.6.10 Marine water quality parameters exhibited greater significant variability between Neap and Spring tide periods than between inshore and offshore sampling areas. This suggests that tidal
17 Marine Water & Sediment Quality
17HINKLEY POINT C PRE-APPLICATION CONSULTATION – STAGE 2 |
ENVIRONMENTAL APPRAISAL – VOLUME 2
conditions may have a greater influence on local marine water quality off Hinkley Point than spatial variations between inshore and offshore areas (see Key Features, in Chapter 16).
iii) In-Situ Monitoring Results
17.6.11 The high degree of water mixing resulting from the strong tidal currents, see Chapter 16, is reflected in the in-situ profiling data with readings for dissolved oxygen, salinity and temperature being consistent throughout the depth of the water column at each monitoring location on each campaign visit (see for example the in-situ data taken at sample location W during the second campaign). The profile data shown in Figure 17.2 by way of example shows no evidence of stratification (either in temperature or salinity) and this pattern is consistent across all locations and for all campaigns.
17.6.12 The monitoring data indicate that dissolved oxygen levels, temperature and salinity were within a normal range for coastal waters. There was no evidence of thermal or saline stratification and in-situ measurements of dissolved oxygen concentration were consistent throughout the depth of the water column at each sampling location. These data are indicative of a system that is well mixed by high tidal velocities. Stratification may potentially occur under some conditions, for example under heat wave conditions or certain tidal states. Such stratification was not detected within the four sampling campaigns which were conducted across a range of tidal flood and ebb states.
17.6.13 The WFD EQS now includes threshold values for dissolved oxygen for transitional and coastal waters. For marine waters with salinity lower than 35 the ‘high’ category threshold is defined by a calculated oxygen concentration of (7 mg/l – (0.037 x salinity)). The most stringent (and therefore most precautionary) EQS threshold applicable to this High Status waterbody unit is calculated by selecting the lowest monitored salinity of 23.5, which produces a threshold value of 6.13 mg/l. Comparison is made to this threshold value using a 5th percentile calculated for the entire monitoring data set which is 6.40 mg/l. Therefore the dissolved oxygen levels within the sampling area have a High Status which accords with the current status indicated in the Bridgwater Bay waterbody description.
17.6.14 The results of the first in-situ sampling campaign (January 2009) indicated relatively low salinity conditions (in the range of 23 to 25) in the sampling area in comparison to subsequent campaigns.
b) Sediment Chemistry
17.6.15 The chemistry of marine sediments in the vicinity of Hinkley Point is of importance as activities associated with the development of the proposed HPC, such as dredging and construction of marine infrastructure, may lead to the mobilisation of sediments and any associated contaminants. The disturbance of sediments may therefore lead to localised affects on water quality conditions. The sediments of the Severn Estuary and Bristol Channel have been subject to historical research and these studies have been summarised. To supplement this information sediment samples were collected for contamination testing during offshore geotechnical surveys undertaken in the vicinity of Hinkley Point during November and December 2009.
i) Historical Information Review
Metals Associated With Suspended Particulate Materials
17.6.16 Results from Environment Agency surveys undertaken in 2004 indicated a strong linear or power relationship between total metal concentrations and total suspended solids concentrations for copper, iron, mercury, lead, zinc, chromium and nickel. The total metals concentrations in the water column may therefore be assumed to show variability relating to the tidal cycle with higher concentrations expected during spring tide periods when suspended
17 Marine Water & Sediment Quality
18 | HINKLEY POINT C PRE-APPLICATION CONSULTATION – STAGE 2
ENVIRONMENTAL APPRAISAL – VOLUME 2
solid concentrations are higher due to mobilisation of bed sediments and reduced settlement under higher flow velocities. For dissolved metals the relationship with suspended sediments is less clear although elevated concentrations of dissolved cadmium and iron in the lower water column of Bridgwater Bay have been reported and associated with re-suspension of particulates by Hamilton et al., 1979 (Ref. 17.10). Similar effects were suggested in the results of the Environment Agency assessment in 2004 for dissolved iron, zinc and chromium.
17.6.17 It should be noted that no significant correlation between total metal concentrations and suspended solids concentrations for any of the metals discussed above was found during the 2009 marine surveys, conducted in the area directly off Hinkley Point.
Marine Sediments
17.6.18 Sediment type and distribution within the estuarine system are considered to heavily influence the distribution of contaminants and therefore water quality. A variety of sea bed sediments are found in the Bristol Channel ranging from clays (or fine grained sediment i.e. <0.002 mm particle diameter) to pebbles (of greater than 100 mm diameter). The high tidal range and existence of strong tidal currents in particular ensures that the sea bed sediment deposits are subject to much reworking. Contaminants entering the Severn Estuary and Bristol Channel from anthropogenic sources may become associated with particulates (in particular the fine fractions) through adsorption and complexation. For these reasons, the spatial distribution of contaminants is often associated with the complex sediment processes and sediment distribution patterns within the Severn Estuary and Bristol Channel.
17.6.19 The distribution and movement of sediment (of all fractions) across the Channel is highly complex and the subject of much discussion and debate in the literature. Exposed bedrock covers extensive sections of the Channel bottom, particularly across the central Channel. The tidal flow velocity is an important factor influencing the distribution of sea bed sediment and respective grain size within the Bristol Channel and large areas of the Channel are characterised by thin veneers of sand and gravel that are mobile on the bed (see Chapter 16 on Hydrodynamics and Coastal Geomorphology for further detail). Of particular note with respect to this assessment is the very high concentration of suspended sediments that are a characteristic of the Bristol Channel.
Sediment Chemistry
17.6.20 Langston et al., 2003 & 2007 (Refs. 17.5 & 17.9) provide a thorough overview of sediment contaminant trends in the Severn Estuary and Bristol Channel. Most of the studies of contaminants that these reports are based upon were undertaken during the 1970s and 1980s. More recent data to characterise contaminant status, incorporated in Langston et al., 2003 & 2007 (Refs.17.5 & 17.9), are generally limited to surveys undertaken by the Environment Agency in the Autumn / Winter period of 2004 that included a sampling location in Bridgwater Bay to the east of Hinkley Point. Samples collected during these surveys were analysed for a range of metal contaminants. Further testing has been undertaken in the immediate vicinity of Hinkley Point as part of an offshore borehole survey.
17.6.21 One of the particular factors influencing the cycling of metals within estuaries and coastal areas is their interaction with sediment and their relationships with particle size and composition. Dissolved metals tend to be sequestered from the water by fine grained particulate material in the suspended load or settling or in bed sediments. Langston et al., 2003 (Ref. 17.5) report that contamination of the Severn Estuary with cadmium and zinc from industrial discharges in the Avonmouth area, to the north-east of the Hinkley Point site, is well documented by a large number of other studies (e.g. Little & Smith, 1994 (Ref. 17.11)). They also report that broader contamination of finer sediment fractions with lead, copper, silver and mercury is also well recorded in a range of studies. There is a general consensus amongst the studies that the
17 Marine Water & Sediment Quality
19HINKLEY POINT C PRE-APPLICATION CONSULTATION – STAGE 2 |
ENVIRONMENTAL APPRAISAL – VOLUME 2
majority of metal contamination is associated with clay particle fractions. Some contamination is associated with coarser sand fractions particularly for organic matter and aluminium (Ref. 17.11).
17.6.22 The association of metals with finer fractions of bed deposits leads to an interesting feature of the Bristol Channel / Severn Estuary according to Langston et al., 2003 (Ref. 17.5), in that contamination tends to be widely dispersed at low levels rather than forming distinct hotspots. This is suggested to be associated with the formation of fluidised bed layers under strong tidal conditions.
17.6.23 Langston et al., 2003 (Ref 17.5) found little difference between the major element composition of benthic silts in comparison to suspended particulates, which is not surprising given the extremely strong tidal currents and constant recirculation of sediments. However, some enrichment of suspended particles, particularly for lead and zinc was noted (Ref 17.9).
ii) Results Of Sediment Chemistry Analysis
17.6.24 A summary of the analytical data compared to the relevant threshold values is provided below. Further analysis of this data, specifically with regard to metals entering the dissolved phase and comparison with marine water EQS values is provided in the assessment section of this chapter.
Metals
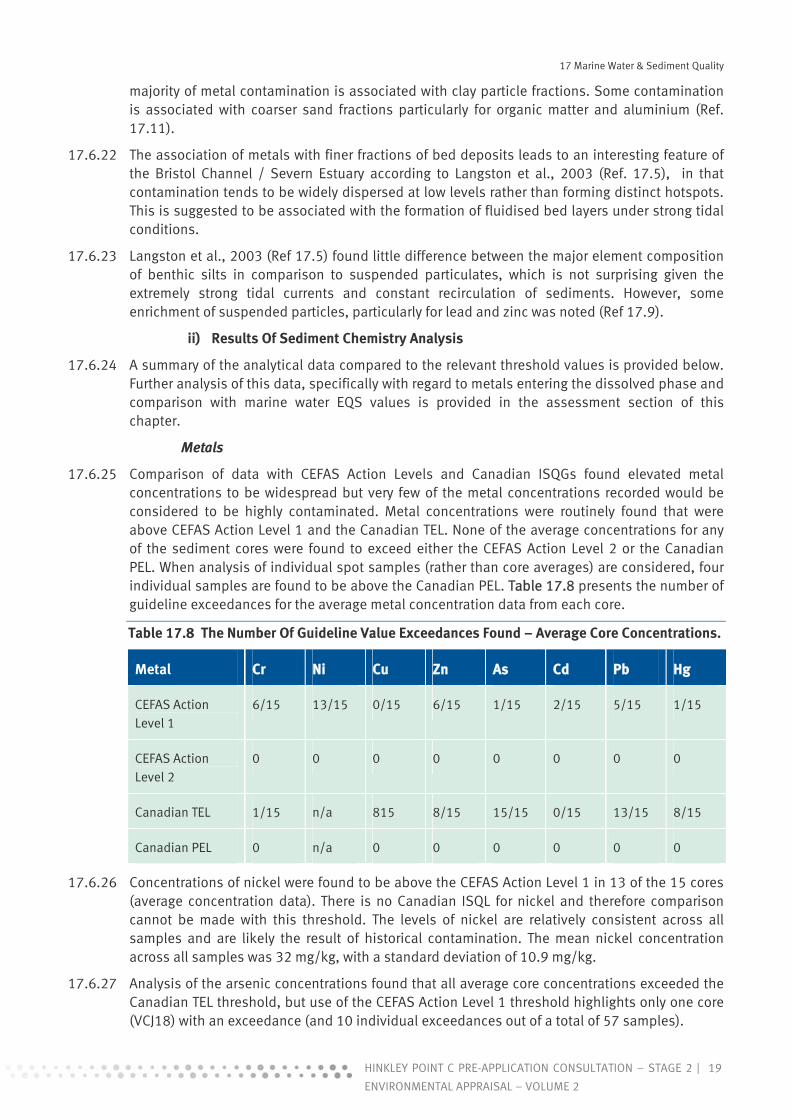
17.6.25 Comparison of data with CEFAS Action Levels and Canadian ISQGs found elevated metal concentrations to be widespread but very few of the metal concentrations recorded would be considered to be highly contaminated. Metal concentrations were routinely found that were above CEFAS Action Level 1 and the Canadian TEL. None of the average concentrations for any of the sediment cores were found to exceed either the CEFAS Action Level 2 or the Canadian PEL. When analysis of individual spot samples (rather than core averages) are considered, four individual samples are found to be above the Canadian PEL. Table 17.8 presents the number of guideline exceedances for the average metal concentration data from each core.
Table 17.8 The Number Of Guideline Value Exceedances Found – Average Core Concentrations.
Metal Cr Ni Cu Zn As Cd Pb Hg
CEFAS Action Level 1
6/15 13/15 0/15 6/15 1/15 2/15 5/15 1/15
CEFAS Action Level 2
0 0 0 0 0 0 0 0
Canadian TEL 1/15 n/a 815 8/15 15/15 0/15 13/15 8/15
Canadian PEL 0 n/a 0 0 0 0 0 0
17.6.26 Concentrations of nickel were found to be above the CEFAS Action Level 1 in 13 of the 15 cores (average concentration data). There is no Canadian ISQL for nickel and therefore comparison cannot be made with this threshold. The levels of nickel are relatively consistent across all samples and are likely the result of historical contamination. The mean nickel concentration across all samples was 32 mg/kg, with a standard deviation of 10.9 mg/kg.
17.6.27 Analysis of the arsenic concentrations found that all average core concentrations exceeded the Canadian TEL threshold, but use of the CEFAS Action Level 1 threshold highlights only one core (VCJ18) with an exceedance (and 10 individual exceedances out of a total of 57 samples).
17 Marine Water & Sediment Quality
20 | HINKLEY POINT C PRE-APPLICATION CONSULTATION – STAGE 2
ENVIRONMENTAL APPRAISAL – VOLUME 2
17.6.28 With the exception of relatively few sites (Cr at VCJ9 and VCJ6, nickel CEFAS results and arsenic ISQG results), there is no location (with multiple depth samples) that exhibits contamination above either CEFAS Action Level 1 or the Canadian TEL throughout its entire depth.
17.6.29 At least seven of the locations (VCJ10, VCJ17, VCJ18, VJC21, VC33, VCJ6 and VCJ7) were found to show generally decreasing contamination with depth. At these locations, highest contaminant concentrations were found within the top metre of sediment. This upper portion of the sediment is known to be highly mobile and constantly reworked by strong currents within the channel. It may be postulated therefore that the level of contamination that is present in these upper sediment layers may:
be representative of wider baseline concentrations; be the result of contaminant redistribution from elsewhere in the Channel; and if disturbed (via dredging etc), not be any different to contaminant concentrations that are
mobilised on an almost constant basis within the Channel.
Polycyclic Aromatic Hydrocarbons (PAHs)
17.6.30 Polycyclic Aromatic Hydrocarbons (PAHs) occur throughout the environment and may be derived from natural sources (e.g. coal) but are usually associated with anthropogenic activity. Concentrations of PAHs are usually higher in sediments compared to water, because of their affinity (particulaly higher molecular weight PAHs) to particulates. Lower molecular weight PAHs are toxic to marine organisms and the metabolites of higher weight PAHs sometimes exhibit carcinogenic properties. Langston et al., 2003 (Ref 17.5) conclude that PAH concentrations in the Severn often exceed ISQG TEL and occasionally PEL criteria. The primary source for PAHs in the Severn is considered by Langston et al., 2003 (Ref 17.5) to be anthropogenic, and large contributions offshore of Hinkley Point are thought to derive from coal dust, as recently confirmed by BEEMS, 2010c (Ref. 17.19).
17.6.31 Elevated concentrations, relative to the CEFAS Action Level 1 of all selected PAHs were found in the surface sediments but no elevated concentrations were found below approximately one metre, supporting further the suggestion that surface contamination:
is representative of wider baseline concentrations; is the result of contaminant redistribution from elsewhere in the Channel; and if disturbed (via dredging etc), would be no different to the contaminant concentrations that
are mobilised during every tidal cycle within the Bristol Channel.
17.6.32 PAH concentrations were also compared against the Canadian threshold guidance values and there were a number of exceedances of both the TEL and the PEL values. The Canadian threshold values are evidently more stringent (thresholds set at lower concentrations), but these should be viewed as purely indicative. There were no elevated concentrations of PAHs, compared against the Canadian threshold guidance values for those samples taken from below approximately one metre.
Organotins
17.6.33 Organotin substances, such as Tributyltin (TBT) and Dibutyltin (DBT) have well known toxic properties and act as endocrine disruptors in the marine environment and in higher concentrations as immunosuppresants. They are highly toxic and even at low concentrations may cause mortality of marine planktonic larvae. Organotins may originate from preservatives and antifouling agents used historically on marine traffic for example. Analysis of sediments in dredge disposal sites around the Severn Estuary suggest that there may be localised reservoirs of elevated TBT concentrations to be found near major conurbations, such as Newport and Cardiff (Langston et al., 2003 (Ref 17.5)).
17 Marine Water & Sediment Quality
21HINKLEY POINT C PRE-APPLICATION CONSULTATION – STAGE 2 |
ENVIRONMENTAL APPRAISAL – VOLUME 2
17.6.34 All sediment chemistry results from offshore of Hinkley Point showed organotin concentrations below CEFAS Action Level 1 and were therefore screened out of any further investigation.
Polychlorinated Biphenyls (PCBs)
17.6.35 PCBs have low water solubility and a high affinity to suspended solids, particularly those with high organic carbon content. PCBs are one of the most persistent of environmental contaminants. Due to their high solubility in fats, PCBs accumulate in organisms. In marine organisms, PCBs generally lead to chronic (rather than acute) effects of the endocrine system and suppression of the immune system.
17.6.36 For some years the International Committee for the Exploration of the Sea (ICES) has routinely analysed a limited set of seven PCB congeners (PCB congeners 28, 52, 101, 118, 138, 153 and 180) in fish. A CEFAS Action Level exists for the sum of ‘ICES 7’ and also the sum of 25 congeners.
17.6.37 Comparing average core data with the sum of 25 congeners CEFAS thresholds, no sampling location was found to contain elevated PCB concentrations. Comparison with the ICES 7 threshold did find six cores with PCB concentrations above the CEFAS Action Level 1 threshold. Analysis of individual spot sediment samples, which as discussed above is less appropriate in the context of the silt disturbances anticipated during this Project, found multiple samples in excess of the CEFAS Action Level 1. All spot samples with elevated concentrations were found in the top metre of each core. A single spot sample (1 of 57) was to have a PCB concentration in excess of the CEFAS Action Level 2, this being sampling location VCJ9. Spot sample VCJ9-1.0 m depth also showed relatively high metals, THC and PAH concentrations and is considered to be an isolated pocket of relatively high contamination. The levels of contamination that have been identified at this one spot sample are not considered to be at concentrations that would merit a difference in management approach.
Organochlorine Pesticides (OCP)
17.6.38 OCPs have similar properties to PCB in that they are very persistent in the environment and can bioaccumulate. Many OCPs are toxic to the marine environment and some are considered endocrine disrupters. Dichlorodiphenyltrichloroethane (DDT) and its degradation products/metabolites have been tested for in this study.
17.6.39 Generally concentrations were found to be low across all samples. Three individual spot sediment samples were found to be above the CEFAS Action Level 1 and the Canadian ISQG/TEL for DDT. Further analysis of these individual samples shows that an average concentration across the same sediment cores exhibits a concentration below the guideline value. No individual spot samples exceeded the Canadian PEL threshold.
17.7 Assessment Of Potential Changes To Marine Water Quality Status
a) Introduction
17.7.1 In this section, potential influences on marine water quality (including the effect of mobilisation of sediment-bound contaminants) resulting from activities undertaken during the preliminary works, main construction and operational phases of the proposed development are assessed. Potential effects during all phases are considered separately and assessed in the context of the baseline description presented above. It should be noted that the benchmark against which potential changes in water quality are assessed are the various EQSs that are available for individual chemical and physical properties. It is also important to note that legislative compliance dictates that a discharge consent will be required by the site operator for certain discharges to be released. By definition of compliance to a consent to discharge (under the
17 Marine Water & Sediment Quality
22 | HINKLEY POINT C PRE-APPLICATION CONSULTATION – STAGE 2
ENVIRONMENTAL APPRAISAL – VOLUME 2
Water Resources Act 1991), a legal discharge will not significantly adversely affect the receiving environment. However, given that the setting of conditions on discharge consents is subject to agreement and liaison with the Environment Agency, discharge consenting and the conditions applied (both in terms of quantity and chemical quality) as part of a discharge consent are considered to be mitigation, not legislative compliance.
17.7.2 The key elements of the development during the preliminary works phase for which associated environmental impacts are to be assessed are:
discharges to foreshore (surface drainage system, dewatering of groundwater and discharge of grey and blackwater treated effluent);
construction of temporary marine aggregates jetty and aggregates storage area (disturbance of marine sediments from piling activities and capital dredging works for berthing pocket); and
construction of temporary soil retention ‘sea wall’ (discharges of surface drainage of construction site drainage to foreshore).
17.7.3 The key elements of the development during the main construction phase for which the associated environmental impacts are to be assessed are:
discharges to foreshore (as for preliminary works, but also including discharge of horizontal tunnelling wastewater);
interactions with the marine environment associated with vertical drilling (sediment disturbance, discharges from drilling platform and disposal of drill cuttings);
interactions with the marine environment associated with the marine aggregates jetty (sediment disturbance in subtidal areas from scour effects, surface drainage runoff from jetty, sediment disturbance from maintenance dredging and vessel movements and use of concrete to fill piles during jetty decommissioning); and
interactions with the marine environment associated with the Sea Wall (use of concrete, sediment generated during excavation works and groundwater drainage via the seawall drainage system).
17.7.4 The key elements of the development during the operational phase for which the associated environmental impacts are assessed include:
discharges to foreshore (groundwater drainage via the seawall); operational cooling water system discharges from surface drainage system (via operational
cooling water); thermal cooling water discharges; discharge of process water chemicals, including hydrazine and chlorination products; discharges from desalination and demineralisation plant; and disturbance of seabed sediments associated with scour effects from marine cooling water
system infrastructure and from maintenance dredging around intake structures.
17.7.5 In addition, potential accidents and incidents during construction and operation may have an adverse effect upon marine water quality. Many of these potential incidents cannot be assessed as the scale and nature of such incidents is effectively unknown. However, they can be managed and controlled through the use of good practice measures during construction and operation. These measures will also be included in the Environmental Management and Monitoring Plan (EMMP) or other associated construction management plans, for the development.
17.7.6 The potential environmental issues associated with some emergency situations can be managed through the application of appropriate design and management measures. In respect
17 Marine Water & Sediment Quality
23HINKLEY POINT C PRE-APPLICATION CONSULTATION – STAGE 2 |
ENVIRONMENTAL APPRAISAL – VOLUME 2
of water quality effects, the following aspects have been identified as being of concern and are briefly considered in the assessment section:
discharges during fire fighting; and emergency overflow and discharge from the ‘Discharge Holding Pond’.
b) Preliminary Works Phase Impacts
i) Discharges To Foreshore
17.7.7 A surface drainage system will be developed during the preliminary works phase that will drain the northern area of the Built Development Area including the temporary aggregates storage area. This drainage system is described in more detail in the chapter on Surface Waters (Chapter 15). This northern drainage system will have two distinct phases:
Phase 1: Surface drainage is collected from across the northern area, attenuated by storage basins and discharged at greenfield run-off rates through the existing Hinkley Point C drainage ditch to the foreshore.
Phase 2: Three deep spine drains will be installed to provide the drainage system during the main construction phase. Surface drainage will be directed towards these principal drains which will discharge to marine waters.
17.7.8 There are currently two options being considered for discharges from the spine drains to the foreshore. The two options are:
the three spine drains would discharge through a seawall to the foreshore; and The three spine drains would discharge into a collector drain with a single discharge point to
the foreshore approximately at the location of the existing Hinkley Point C drainage ditch discharge.
17.7.9 Further options are also currently being assessed in terms of examining the feasibility of direct discharge of these surface drainage waters to the subtidal area via a pipe buried into the foreshore. Drainage to the foreshore would consist of surface run-off that is collected from Zone 1 and 5 (see Chapter 15). Run-off rates may be expected to be higher from these areas following preliminary works earthworks due to factors such as soil compaction and therefore attenuation of the drainage will be required.
17.7.10 Grey and blackwater generated from the contractors’ compound facilities, which will be treated in the existing British Energy wastewater infrastructure, will be discharged to the foreshore initially through an existing drainage ditch and subsequently through the eastern spine drain.
17.7.11 Prior to the construction of the new sea defence wall (to be installed during the main site construction phase) a soil retaining structure, known as a retaining wall, will need to be constructed along the edge of the main platform where the actual ground level will be raised to 14m AOD. A number of options are being considered, each would be constructed on top and set back (approximately 10 m) from the existing cliff line, depending on structural and geotechnical constraints. The potential options comprise a gabion wall, reinforced earth wall and a crib wall using concrete, steel or timber blocks.
17.7.12 The main expected components of discharges to the foreshore will be suspended solids, trace hydrocarbons and treated grey and blackwater effluent. Discharges from the site surface drainage system to the foreshore will be subject to consent in terms of rates of discharge volume and chemical quality. Therefore the main potential impact is likely to be associated with the point of discharge of freshwater into an intertidal marine habitat during periods of low tide rather than the chemical quality of this discharge.
17 Marine Water & Sediment Quality
24 | HINKLEY POINT C PRE-APPLICATION CONSULTATION – STAGE 2
ENVIRONMENTAL APPRAISAL – VOLUME 2
17.7.13 The feasibility of managing discharges from the treatment works during the preliminary works using the existing sewage infrastructure in place for the Hinkley Point A and B stations is currently being assessed. The treatment works would take water from toilet facilities, the crushing plant and testing laboratories, for example. If it is not possible to incorporate this water into the existing infrastructure, it is proposed that it will be directed to the foreshore along with the other surface drainage, via an existing drainage ditch. This type of treatment works discharge has the potential to be contaminated with regards to microbiological parameters and high BOD for example. Such poor quality freshwater discharged to the foreshore has the potential to impact upon intertidal communities. A full discussion of this potential impact is provided in the marine ecology chapter (Chapter 19).
ii) Construction Of The Temporary Jetty
17.7.14 During the preliminary works phase a temporary aggregates jetty and an associated aggregates storage area will be constructed adjacent to the jetty root, for the offloading of aggregates and cement during the main construction phase of the proposed HPC station. The concept and basic design development for the proposed temporary aggregates jetty is presented elsewhere. The jetty will be a temporary structure with an expected operational lifespan of seven years, after which it will be dismantled and removed.
17.7.15 A berthing pocket will need to be subject to capital dredging of superficial deposits adjacent to the jetty head to accommodate vessels delivering materials. This dredged area is estimated to be 220 m in length and 40 m in width with sediments removed to a depth of approximately 2 m below existing seabed (4.5 m BCD).
17.7.16 The potential impact upon marine water quality during the preliminary works phase will be associated with marine sediment disturbance resulting from piling and dredging activities during construction of the temporary aggregates jetty. This will principally result from piling works in the subtidal areas and dredging of the berthing pocket that may increase suspended solids concentrations and lead to localised mobilisation of sediment contaminants. Such potential impacts need to be assessed in the context of the existing baseline conditions of the Bristol Channel which are characterised by high concentrations of suspended solids and highly mobile sediments under strong tidal currents. In addition to the presentation of sediment core chemistry data in the baseline section, further analysis of the off-shore geochemical testing results is provided below.
17.7.17 Disturbed sediment may cause temporary localised water quality changes with respect to the suspended solids concentrations. The following approach has been taken in order to investigate further the potential affect of contaminant mobilisation on water quality:
estimate the maximum increase in suspended solids concentrations as a result of dredging activities;
multiply the maximum value recorded in sediment cores with the estimated concentration increase to give a concentration of pollutant released into the water column;
use partition coefficients to estimate the concentration of pollutant that is likely to enter the dissolved phase; and
compare estimated maximum values with marine water EQSs.
Estimate Of Maximum Suspended Solids Concentration Increase
17.7.18 Capital dredging needed to create the temporary jetty berthing pocket is likely to cause the greatest disturbance of sediment into the water column. The approximate increase in suspended sediment concentration is dependent upon the exact nature of the dredged silts (for example, the specific grain size), the dredging techniques employed and the exact current conditions at the time of dredging. The dredging technique to be used is not known at present
17 Marine Water & Sediment Quality
25HINKLEY POINT C PRE-APPLICATION CONSULTATION – STAGE 2 |
ENVIRONMENTAL APPRAISAL – VOLUME 2
because this is dependent upon the dredging contractor employed. In order to obtain an approximation of the increase in suspended sediment concentrations for subsequent calculations a review of other sediment disturbance studies has been undertaken.
17.7.19 Information on the effects of dredging from the Environmental Statement for the Bristol Deep Sea Container Terminal (BDSCT) shows that the type of sediment present at the dredging sites was found to be varied, containing sands through to mud sediment fractions. Focus upon the fine sediment fractions is appropriate in the context of the Hinkley Point investigations because the smaller grain sizes are those that are most associated with contaminant adsorption. The BDSCT simulated the release of fines into the Estuary from the anticipated capital dredging works. The maximum predicted, depth averaged suspended sediment concentration above background levels was found to be between 100-500 mg/l.
17.7.20 It is proposed that the upper end value of the BDSCT predicted maximum range i.e. 500 mg/l (500 mg/l above background levels) is used as a proxy value within estimates made at Hinkley Point. This proxy value is conservative in nature and should be viewed as such during the consideration of results based upon it. This predicted concentration should be compared with the naturally occurring high levels of suspended solids which are a feature of the Bristol Channel. The mean suspended solids concentration across the entire 2009 marine water quality sampling programme, in the area offshore of Hinkley Point was found to be 264 mg/l and the maximum concentration to be 1795 mg/l. Many sources quote concentrations for the Bristol Channel in excess of these values; the BDSCT compare their sediment modelling to “naturally occurring high levels of suspended solids which generally exceed 2,000 mg/l at the water surface and are an order of magnitude larger at the bed”.
Use Of Partition Coefficients
17.7.21 Under normal circumstances, very small concentrations of pollutants such as metals enter the dissolved phase; the vast majority remaining adhered to the sediment particles that have been disturbed temporarily into the water column. Partition coefficients may be applied to estimate the concentration of pollutant entering the dissolved phase. Partition coefficients vary based upon multiple factors such as pH. The partition coefficients used in calculations are the same as those used in the marine dredging assessment undertaken by ABPmer, 2010 (Ref. 17.12) and which are based upon information drawn from WFD EQS data sheets and from reviews undertaken by WRc in relation to Specified Pollutants. The concentrations of metals entering the dissolved phase are generally four or five orders of magnitude lower than the concentrations associated with suspended sediment (see Table 17.9).
17.7.22 Table 17.9 presents the maximum calculated concentrations of metals entering the water column as a result of sediment disturbance caused by marine dredging, according to the methods and approximations discussed above (based on ABPmer, 2010 (Ref 17.12) partition coefficients). The background mean concentration values are taken from the 2009 marine monitoring data campaigns.
17 Marine Water & Sediment Quality
26 | HINKLEY POINT C PRE-APPLICATION CONSULTATION – STAGE 2
ENVIRONMENTAL APPRAISAL – VOLUME 2
Table 17.9 Estimated Maximum Concentrations Of Metals Entering The Water Column And The Dissolved Phase From Disturbance As A Result Of Marine Sediment Dredging.
Determinand
Max Overall Conc. (Mg/Kg)
Total Conc. In Suspension (μg/L)
Partition Coefficient
Conc. Entering Dissolved Phase (μg/L)
Background Mean Concentration (μg/L)
WFD Marine EQS
Chromium 67 0.0335 191000 1.75E-07 0.02 0.6 AD*
Nickel 59 0.0295 80000 3.69E-07 0.19 20 AD
Copper 51 0.0255 61000 4.18E-07 3.95 5 AD
Zinc 307 0.1535 4860 3.16E-05 39.27T 40 AD
Arsenic 30 0.015 10000 1.50E-06 2.3 25 AD
Cadmium 1.5 0.00075 130000 5.77E-09 0.00 0.2AD
Lead 141 0.0705 882000 7.99E-08 0.02 N/A
Mercury 0.67 0.000335 100000 3.35E-09 0.02 0.07 AD
A = Average; D = Dissolved; T = Total; * = chromiumVI
17.7.23 After application of partition coefficients the values of metal contaminants are orders of magnitude below the annual marine EQSs set by the WFD and the Dangerous Substances Directive.
17.7.24 It should be noted that the total concentrations in suspension as calculated above are based upon a worst-case scenario for which the assumptions are extremely conservative. In particular, it is not realistic that all the sediment disturbed in one dredging episode would be contaminated to the maximum concentration value that has been used in the calculations.
17.7.25 Further potential water quality impacts may arise from hydrocarbon contamination from the jetty construction plant and vessels and also leachate from the use of concrete during installation of the jetty head deck. These potential sources of pollutants would be managed and controlled through appropriate working measures, which will be detailed in the EMMP, and as such are not assessed as activities in their own right. However, it is considered that with the implementation of appropriate control and management the potential risk of incidents and accidents can be managed to a level such that significant and adverse changes to marine water quality can be avoided.
c) Construction Phase Impacts
i) Discharge Of Waters To The Foreshore
17.7.26 Plant to treat grey and blackwater produced from the workforce toilet facilities and other amenities will be required. Waste water from the concrete building works, workshops, crushing plant and testing laboratories will also be discharged to the treatment works. Discharges from the treatment works are proposed to be directed into the existing Hinkley Point B wastewater drainage infrastructure where possible. If this cannot be implemented (for example due to volume capacity limitations) then discharges of treated effluent may be made to the local marine waters. This discharge will initially take place via an existing drainage ditch and subsequently via the eastern and western deep spine drains. This type of treatment works discharge has the potential to be contaminated with regards to microbiological parameters and high BOD for example. Consent will be required for discharge and limits on the parameters to be
17 Marine Water & Sediment Quality
27HINKLEY POINT C PRE-APPLICATION CONSULTATION – STAGE 2 |
ENVIRONMENTAL APPRAISAL – VOLUME 2
discharged would be set such that the discharge would not significantly affect the receiving environment (i.e. the Bristol Channel). Assessment of this impact is provided in Chapter 19 - Marine Ecology.
17.7.27 Sub-chapter 4.3 of the PCER documentation provides information on the consumption of raw and potable freshwater during the construction phase. These consumption figures give an indication of the likely expected volume of wastewater that may be generated from site activities and the treatment plant.
17.7.28 The estimated monthly volumes are detailed in Table 17.10, but do not include the production of demineralised water. A proportion of the water volume detailed in Table 17.10 may be discharged to the foreshore (during the construction phase) as effluent from the onsite treatment of grey and black waste waters. Three additional package treatment plants will be established in the western area of the site. Discharges from these units will be connected into the western spine drain for marine discharge. The discharge concentration of effluent will vary according to the flows of water passing through the surface drainage system under different rainfall events.
Table 17.10 Estimates Of Monthly Maximum Raw And Potable Water Use During The Construction Phase (excluding any production of demineralised water).
Construction Activity Freshwater Requirements per month
Concreting Work 4000 cubic metres1
Cleaning equipment and spraying tracks 2880 cubic metres
Crushing Unit 15000 cubic metres
Equipment Maintenance 1800 cubic metres
Potable Water Use (Staff Welfare) 3500 cubic metres2
Data extracted from EDF Energy, 2009 (Ref 17.3).
Notes: 1 – Value based on maximum monthly concrete use of 20000 cubic metres with each cubic metre of poured concrete requiring 200 litres of water. It is likely that only a small volume of this water will require disposal. 2 – Maximum expected value based on peak numbers of construction staff.
17.7.29 The surface drainage system will collect drainage water generated from general site construction and earthworks areas during the construction phase. Pumped excavation groundwater and treatment works discharges, for example, may also be contained within surface water drainage system discharges. It is proposed that the drainage system will discharge to the foreshore via an existing drainage ditch and subsequently via the deep spine drains when installed. This freshwater discharge would be unlikely to have an effect upon marine water quality status but such inputs to the foreshore may have an impact upon intertidal ecological communities; assessment of this potential impact is provided in the chapter on Marine Ecology (Chapter 19).
ii) Seawall Construction
17.7.30 Excavation of the existing cliff face and foreshore during construction or the seawall could lead to the generation of relatively large quantities of sediment and high concentrations of suspended solids. Construction activities, specifically the use of concrete, have the potential to impact on water quality status given that concrete discharges can cause sharp increases in pH.
17 Marine Water & Sediment Quality
28 | HINKLEY POINT C PRE-APPLICATION CONSULTATION – STAGE 2
ENVIRONMENTAL APPRAISAL – VOLUME 2
17.7.31 A drainage system will be installed into the filled ground behind the wall to intercept groundwater and prevent hydrostatic pressure build up from the landward side of the structure. It is proposed that the collected groundwater will be discharged at two points along the foreshore through the Sea Wall. There is not likely to be any impact on water quality associated with this discharge, however due to the fact that the fresh water from 760 m of existing cliff face is being concentrated for discharge at two points on the upper foreshore, potential impacts upon the local marine ecology are considered in Chapter 19 on marine ecology.
iii) Water Quality Effects Associated With The Operation And Decommissioning Of The Temporary Jetty
17.7.32 During the construction phase the temporary aggregates jetty (constructed during the preliminary works phase) will be operational for the delivery of aggregates and cement to the site. After a period of seven years the jetty will be dismantled and removed.
17.7.33 The potential exists for physical disturbance of sediments during operation and dismantling of the jetty due to access that is required by machinery and particularly within the subtidal area. Sediment disturbance may occur throughout the working life of the jetty, due to a likely requirement for maintenance dredging of the jetty vessel berthing area.
17.7.34 The presence of the jetty will cause localised changes in flow patterns leading to scour of soft seabed sediments. The extent of potential scour has been assessed (BEEMS, 2010b (Ref. 17.13)) and is described in the chapter on Hydrodynamics and Coastal Geomorphology (Chapter 16). On the basis of that assessment any impact on water quality resulting from scour would be negligible.
17.7.35 The geotechnical properties of the seabed around the proposed aggregates jetty area show clays to be present in the upper 3 – 4 metres of the seabed with some lamination of fine sands. Information on the contaminant loadings that occur in these sediments is provided in the Baseline Environmental section above.
17.7.36 The potential effect of the release of this sediment through scour can be determined with reference to the analysis work undertaken in relation to the dredging for the jetty berth. This analysis, as described above, shows that during dredging likely values of metal contaminants mobilised into the marine environment would be orders of magnitude below the annual marine EQSs set by the WFD and the Dangerous Substances Directive. This work suggests that, likewise, the release of sediment through scour around the jetty piles would also be highly unlikely to lead to any adverse change in water quality.
17.7.37 Management measures would be put in place during the operation of the jetty to ensure that runoff from the jetty deck, which may include fuels and oils from machinery, is adequately treated and processed so as to ensure that an adverse effect on water quality status would not occur.
17.7.38 Similarly, during decommissioning, some of the jetty piles on the foreshore will be filled with concrete once they have been cut off at bed level. Appropriate measures, in line with PPG guidance, will be put in place to ensure that potential spills and leakages are managed during this process.
iv) Cooling Water Tunnel Construction
17.7.39 During the construction phase, the horizontal tunnels that are associated with the proposed cooling water system will be excavated and constructed. Two intake tunnels are proposed at a length of 3.3 km offshore with a finished internal diameter of 6 m. Tunnel boring will be undertaken using a ‘mud assisted’ drill technique. The estimate is that this process would generate, following treatment, approximately 60 cubic metres of waste water per hour with a suspended solids concentration of 1 g/l (including 5% bentonite), pH adjusted to a maximum
17 Marine Water & Sediment Quality
29HINKLEY POINT C PRE-APPLICATION CONSULTATION – STAGE 2 |
ENVIRONMENTAL APPRAISAL – VOLUME 2
of 9.5 and an organic polymer concentration of 0.7 mg/l. The produced waste water would be discharged to the foreshore. The potential effect of this discharge on marine life is considered in Chapter 19 on Marine Ecology.
v) Vertical Shaft Construction
17.7.40 During the construction phase of the development, the vertical shafts associated with the intake and outfall tunnels will be drilled using a wet drill technique. A wet shaft construction involves drilling a shaft straight down to base level under wet/submerged conditions. This option consists of a large diameter drill bit (up to 5 - 6 m) mounted on a jack up platform which is driven into the rock to the required depth. As the drill works progress, spoil can be pumped up to the surface and discharged to a barge. Installation works for the drilling would be likely to require preparation of the sea bed, which is likely to involve dredging of marine silts before a concrete foundation pad and potentially supporting walls are installed.
17.7.41 Around the cooling water intake structures the seabed is characterised by surficial very soft clay with an underlying fine silt sand. At 2.5 metres below the seabed the substrate becomes a stiff fissured clay. Analysis of potential scour at the outfall (BEEMS, 2010b (Ref. 17.13)) assumed a worst-case approach, where the structure occupies the full depth of water column which is likely to be the case only on certain tidal events and is based on the obstruction presented to tidal flows by the headworks. For the outfall the total scour depth is predicted to be 2.1 m and predictions of deeper scour may be curtailed by underlying rock formations. The predicted total scour depth around the intake head is 0.6 metres due to curtailment by underlying rock, although it may be appropriate to assume that the 2m of silt overlying the bedrock would be scoured locally to the intake structures (BEEMS, 2010b (Ref. 17.13)).
vi) Management Measures During Construction
17.7.42 The Bristol Channel in the area off Hinkley Point is characterised by high suspended solids concentrations associated in particular with mobilisation of bed sediments under high tidal velocities. Given this feature and the dynamic nature of sediment movements, the marine waters have a relatively low sensitivity to potential change associated with sediment disturbance and discharges of sediment-laden water during the preliminary works and construction phase.
17.7.43 Discharges of surface drainage water from the construction site and process water from any mud-assisted drilling of horizontal tunnels would be discharged to the foreshore area. These discharges may potentially impact upon foreshore ecology through both temporary accumulation of sediment across the rock platform and inundation of the marine foreshore and intertidal habitats with freshwater. Any such discharges to the foreshore would be likely to be subject to discharge consent in terms of their discharge volume, rate and chemical quality. A range of measures could be incorporated into the design of the drainage system (see Chapter 15 on Surface Water for further discussion) in order to reduce drainage water volume and suspended sediment concentrations and to ensure that any marine discharge consents are met. In addition, the treatment works for the processing of waste water from any mud-assisted drilling of the horizontal cooling water tunnel (if adopted as the excavation technique) will be designed and operated to meet the discharge consent set by the Environment Agency.
17.7.44 Mitigation of the potential impacts of these freshwater discharges on the foreshore area may be achieved through either providing a piped discharge to the sub tidal area, a designated discharge channel across the foreshore or through timed discharges to occur over high water periods.
17.7.45 A timed discharge approach would require storage facilities to be made available for the surface drainage and waste water, although these would likely require an emergency overflow to the foreshore in the event of extreme rainfall events. Current proposals allow for the discharged
17 Marine Water & Sediment Quality
30 | HINKLEY POINT C PRE-APPLICATION CONSULTATION – STAGE 2
ENVIRONMENTAL APPRAISAL – VOLUME 2
waste water from the horizontal tunnelling (after treatment) to have a pH of 9.5. In order to protect the water quality status of the receiving water and specifically meet the requirements of marine EQSs, a maximum pH of 8.5 should be maintained at all times.
17.7.46 Consideration of the most appropriate means of securing the drainage needs described above remain subject to detailed discussion and agreement with the Environment Agency.
17.7.47 Construction of the offshore vertical wells and associated cooling water intake and outfall heads will be undertaken using a wet-drill technique. Arisings are to undergo primary separation of solids; liquids would be removed to a barge and solids disposed to a licensed area under permit, thus removing potential sources of contaminants to a site where any potential effects are acceptable. The use of precast concrete units would mitigate potential water quality effects associated with concrete during construction of the headworks.
d) Commissioning Phase Impacts
17.7.48 Commissioning of the EPRs requires a range of tests as well as conditioning of the circuits to be undertaken involving both demineralised water and a number of chemical additives. The commissioning tests would be undertaken over a 2 year period and require the production of approximately 72,500 m3 of demineralised water for each EPR unit.
17.7.49 The H1 analysis of the commissioning phase concentrations employed a worst case scenario of maximum 24 hour chemical loadings. The potential water quality effects are reviewed within the operational phase impact discussions below.
e) Operational Phase Impacts
i) Discharges To Foreshore
17.7.50 During the operational phase of the proposed development the surface drainage system will collect all surface runoff and water treatment works effluent from the operational site i.e. from the Nuclear Island. This water will be collected and discharged into the cooling water outflow (via the Discharge Holding Pond).
17.7.51 Groundwater drainage from behind the seawall will continue to be discharged to the foreshore and no additional effects to those identified for the construction phase are identified.
ii) Sediment Disturbance Associated With The Cooling Water Discharge
17.7.52 Large quantities of water will be required for cooling. It is proposed that cooling water will be abstracted from, and discharged to, the Bristol Channel at an operational rate ranging between 116 to 134 m3/s depending on tidal state. The worst-case discharge scenario used in the H1 Assessment (worst-case because of reduced dilution) is 116 m3/s for annual discharges. This flow rate corresponds to normal operation (i.e. two operating pumps per EPR unit) during low tide periods. For 24 hour discharges a reduced flow rate of 64 m3/s has been adopted to represent a worst-case scenario which equates to a single cooling water pump operating for each EPR unit under low tide conditions.
17.7.53 In upper estuarine and riverine waters an abstraction of this magnitude would be associated with impacts upon water resources. Given the high salinity regime involved an abstraction from this location is considered to have no adverse impact on such resources.
17.7.54 A discharge of 116 to 134 m3/s from a the twin outfall headworks has the potential to mobilise and redistribute local sediment deposits through the force of the discharge flow. Mobilisation of bed sediments due to the localised high volume discharges in terms of their potential impacts upon water quality status are assessed here.
17.7.55 An increase in the suspended solids concentration has the potential to have a negative impact upon marine water quality status through the mobilisation of contaminated sediments or
17 Marine Water & Sediment Quality
31HINKLEY POINT C PRE-APPLICATION CONSULTATION – STAGE 2 |
ENVIRONMENTAL APPRAISAL – VOLUME 2
sediments that are organically or nutrient rich. The release of potentially organic rich sediments can result in the localised removal of oxygen from the surrounding water, although this effect does tend to be temporary in nature where effective mixing is the norm.
17.7.56 As described previously, the Bristol Channel is characterised by high concentrations of suspended solids and constant reworking of its bed sediments under normal conditions. The majority of the sediments that would be mobilised through scour are of relatively recent origin and, while they are known to contain a range of contaminants (e.g. see Langston et. al., 2003 (Ref 17.5)), these sediments are reworked on a regular basis, leading to redistribution and deposition of contaminants within the system. As such, it is apparent that the release of sediment from the scour hole associated with the discharge would be unlikely to raise contaminant levels in the water column or suspended sediment loads by an amount that would be considered to be significant with regard to existing EQSs. This effect is therefore considered to be of low significance.
17.7.57 The potential for significant scour and localised sediment mobilisation has been minimised as far as possible by raising the discharge head above the sea bed.
17.7.58 During the operational phase of the development, there may be a need to periodically dredge sediments from around the cooling water intake and outfall structures. These intermittent dredging works would lead to the temporary physical mobilisation of suspended sediments and associated contaminants that may potentially impact on water quality status. The effect of this dredging on water quality status is predicted to be negligible as the sediment that would be removed during maintenance would comprise material that is already in suspension or transport as part of the natural sediment system of the Estuary. As such no further contaminant loadings would be introduced into the water column.
iii) Temperature Effects Associated With The Cooling Water Discharge
17.7.59 The primary characteristic of the discharged cooling water will be its higher temperature relative to the surrounding water body. A tidally oscillating thermally buoyant plume, thus relatively superficial in the water column, will result. The current understanding is that water will be discharged at temperatures up to 12.5 oC above ambient. The thermal impacts of the plume are assessed, as appropriate, both in the Hydrodynamics and Coastal Geomorphology (Chapter 16) and Marine Ecology (Chapter 19) of this Environmental Appraisal.
17.7.60 BEEMS, 2010a (Ref. 17.4) discusses in greater detail the thermal effects on local water quality conditions. Much of the concern related to thermal plume generation is related specifically to impacts upon fish and other marine species (e.g. elevated temperatures or depressed dissolved oxygen may present a barrier to fish migration) and a discussion of impacts upon these receptors is presented in the Chapter 19 on Marine Ecology.
17.7.61 Two models (in order to better understand the level of uncertainty involved in their separate estimates) are being used (BEEMS, 2010a (Ref 17.4)) to predict the extent of the thermal discharge of HPC, and the output is considered in relation to a number of temperature thresholds stated as recommended guidance values and regulatory standards. The thermal modelling assumed that a mean discharge rate of 120 m3/s would be discharged at 12oC above ambient. The proposed discharge location has taken into account the environmental impacts considered via these simulations. Information and results from thermal plume models referenced here can be found in the Marine Ecology chapter (Chapter 19) of this Environment Appraisal.
17.7.62 Environmental thresholds in relation to temperature are broadly derived from WFD standards and Habitats Directive standards (including cross-sectional area assessment). These standards are summarised below in Table 17.11 and provide a summary of the BEEMS modelling
17 Marine Water & Sediment Quality
32 | HINKLEY POINT C PRE-APPLICATION CONSULTATION – STAGE 2
ENVIRONMENTAL APPRAISAL – VOLUME 2
outcomes from the three assessments of thermal effects upon species and habitats and WFD standards.
Table 17.11 Summary Of Thermal Plume Legislation Relating To Activities Which May Result From Thermal Discharge
Cooling Water Discharge - Water Framework Directive Temperature Standards
17.7.63 These standards are intended to supersede existing UK standards based on the European Freshwater Fish Directive (78/659/EEC), which arose from European Inland Fisheries Advisory Commission (EIFAC) water quality criteria first published in the 1960s (Alabaster & Lloyd, 1980 (Ref. 17.14)). Other relevant thermal criteria are associated with the Shellfish Directive, for which a guideline value recommends that for shellfish waters, no more than a 2oC rise above natural background should result from a thermal input.
17.7.64 Coastal and transitional waters have been split into defined spatial water bodies by the WFD. The two water bodies concerned are Bridgwater Bay (Coastal Water) and the Parrett Estuary
17 Marine Water & Sediment Quality
33HINKLEY POINT C PRE-APPLICATION CONSULTATION – STAGE 2 |
ENVIRONMENTAL APPRAISAL – VOLUME 2
(Transitional Water). Relevant assessments include determination of average maximum temperature increase across the water body and the predicted 98 percentile value based on historical temperature data and modelled excess values.
Cooling Water Discharge - Habitats Directive Temperature Standards
17.7.65 Guidance on marine protected sites (derived from Turnpenny & Liney, 2006 (Ref. 17.15)) adopts a 2˚C rise as a maximum allowable increase at the edge of a mixing zone (see mixing zone discussion below) for SPAs and SACs.
17.7.66 The second assessment of temperature criteria in relation to habitat designations relates to the thermal influence upon the cross-sectional area of a water body and its potential to impact migratory species. In this case the thermal influence upon the Severn Estuary and the Parrett Estuary were considered. Four cross sections were considered (see Ref 17.4), one across the Severn Estuary itself and three across the Parrett Estuary, one at its mouth and two slightly upriver. This assessment relates to guidance that states that a maximum excess temperature of >2˚C should not prevail across more than 25% of a water body subject to the passage of migratory fish for more than 5% of the time.
17.7.67 Table 17.12 and Table 17.13 present a series of environmental standards in relation to assessing temperature influence on designated areas and on WFD waterbodies. Different threshold measures, e.g. temperature uplift at the edge of a mixing zone or use of cross-sectional analysis, are used by different approaches.
17 Marine Water & Sediment Quality
34 | HINKLEY POINT C PRE-APPLICATION CONSULTATION – STAGE 2
ENVIRONMENTAL APPRAISAL – VOLUME 2
Table 17.12 Different Maximum Temperature Standards Applied To Transitional And Coastal Waters Under Various Directives And Guidance.
Designation Maximum Temperature Models And Configurations For Which Modelled Data Meet Designation Needs Discharge 120 M3s-1
Special Protection Area
(when both SPA and SAC most
stringentlyapply)
28C as an annual 98 percentile
at the edge of the mixing zone
Delft3D (1, 2, 3, 4)a; General Estuarine
Transport Model, GETM (1)a
Dependent upon mixing zone Interpretation
the following may comply: GETM (2, 3, 4)
Special Area Conservation (any
designated for estuary or
embayment habitat and/or
salmonid species)
Not > 21.5C as an annual 98
percentile at the edge of the
mixing zone
Not met for predictions from Delft3D or
GETMa
Dependent upon mixing zone
interpretation, all configurations may
comply
WFD High/Good Status 20 C as an annual 98 percentilex Based on historic 98% value all models
and configurations indicate that this value
may be exceededb
WFD
Good/Moderate Status
23 C as an annual 98 percentilex Based on historic 98% value all models
and configurations indicate a value below
thisb.
Based upon this criterion Good status
would be achieved for all of the modelled
configurations
Table extracted from BEEMS, 2010a (Ref 17.4).
Notes: x: based on heat increase in the WFD Parrett and Bridgwater Bay water bodies; a All models compared heat elevation predicted in proximity to known sensitivities at 82 sites. b Based on heat increase in the WFD Parrett and Bridgwater Bay water bodies.
17 Marine Water & Sediment Quality
35HINKLEY POINT C PRE-APPLICATION CONSULTATION – STAGE 2 |
ENVIRONMENTAL APPRAISAL – VOLUME 2
Table 17.13 Different temperature standards and guidance applied to temperature deviations and cross-sectional area affected for transitional and coastal waters under various directives and guidance.
Designation Deviation From Ambient
Models And Configurations For Which Modelled Data Meet Designation Needs
Discharge 120 M3s-1
Special Protection Area
(when both SPA and SAC most
stringently apply)
2C as a Maximum Allowable
Concentration at the edge of the
mixing zone
(Turnpenny & Liney, 2006 (Ref
17.15))
Dependent upon mixing zone
interpretation,
Delft3D (1,3)
Special Area Conservation (any
designated for estuary or
embayment habitat and/or
salmonid species)
2C as a MAC at the edge of the
mixing zone (Turnpenny & Liney,
2006 (Ref 17.15))
Cross sectional guidance 2oC
25% of the Estuary for 95% of the
time
Dependent upon mixing zone
interpretation,
Delft3D (1,3)a
Delft3D (3, 4)b
WFD High/Good Status 2C uplift c Delft3D (1,2,3,4); GETM (1,2,3,4)
Based upon this criterion High status
would be achieved for all of the modelled
configurations
WFD
Good/Moderate Status
3C uplift c All models and configurations meet the
High status criterion
Table extracted from BEEMS (2010) (Ref 17.4).
Notes: a <2.0°C above background – all models compared heat elevation predicted in proximity to known sensitivities at 82 sites. For some configurations, habitats in close proximity to the discharges that exceed the maximum value may be judged to be within the mixing zone when guidance is fully developed and hence these too could be acceptable. b Cross-sectional guidance �2°C as a maximum increase across 25% of the Estuary for 95% of the time. c Uplift was considered for the water body by modelling average temperature increase in the WFD Parrett and Bridgwater Bay water bodies.
Cooling Water Discharge - Mixing Zone Concept
17.7.68 The concept of a mixing zone is applied to allow consent conditions to be related to environmental temperatures. In regulatory terms, the mixing zone is an area of receiving water around a discharge point within which temperature may be allowed to exceed a standard value. The mixing zone principle acknowledges that dilution will be sufficiently rapid to avoid an impact upon the biology of the receiving water beyond the point of initial dilution. The specific application of a mixing zone, in terms of spatial area for example, is subject to interpretation. Turnpenny & Liney, 2006 (Ref 17.15) provide the most comprehensive guidance available on mixing zones for temperature applications (most of the focus within the regulatory guidance is
17 Marine Water & Sediment Quality
36 | HINKLEY POINT C PRE-APPLICATION CONSULTATION – STAGE 2
ENVIRONMENTAL APPRAISAL – VOLUME 2
on chemical inputs, rather than temperature); however, there is still a lack of clarity about the definition of mixing zones within tidal waters such as the Bristol Channel.
Additional Temperature Interactions
17.7.69 Elevated temperature discharges have the potential to impact upon water quality status in a number of ways. Water temperature and dissolved oxygen concentration have a close relationship – warmer water (at the same air pressure) has the potential to hold less oxygen than it would at lower temperature. Temperature changes also affect the solubility, and in turn the toxicity, of many other parameters. Generally, the solubility of solids (including for example metal contaminants) increases with increasing temperature and therefore elevated temperature has implications for the mobilisation of sediment pollutants into the water column.
17.7.70 Ammonia enters freshwater and marine water bodies from sewage effluent inputs, from industrial and agricultural activities and from the breakdown of organic matter. Temperature is a factor in determining the dominant chemical species of ammonia in the environment i.e. temperature affects ammonia ionisation. Increased temperature generally results in a higher proportion of total ammonia being present as unionized ammonia, NH3 (which is toxic to fish for example) rather than the relatively non-toxic ammonium or ionized ammonia, NH4+ species (Hoffman, 2003 (Ref. 17.16)). At higher pH values, un-ionised ammonia represents a greater proportion of the total ammonia concentration.
17.7.71 Two approaches were used to derive un-ionised ammonia concentrations from the total ammonia values using the Environment Agency calculator:
To model the effect of the maximum temperature increase in the cooling water predicted by GETM, a 12 oC increment was applied to all measured temperature data. Table 17.14 shows the annual average unionised ammonia concentration that would be derived from the measured total ammonia concentration, based on the highest temperature (plus 12 oC increment) and highest pH together with the lowest salinity measured for each sampling point and depth. The annual average unionised ammonia concentration was then calculated from the average unionised ammonia concentration for January, May, June and September from sampling data collected in 2009 (this latter approach was considered to be in keeping with that recommended, e.g. Guidance on surface water chemical monitoring under the WFD 2008).
For the second approach (Table 17.15) the same temperature data as presented in Table 17.14 was applied but the highest pH (8.11) for any sampling point and lowest salinity (23.3) for any sampling point together with total ammonia measurement for each sampling point were used to derive the annual average unionised ammonia concentration.
17 Marine Water & Sediment Quality
37HINKLEY POINT C PRE-APPLICATION CONSULTATION – STAGE 2 |
ENVIRONMENTAL APPRAISAL – VOLUME 2
Table 17.14: Derivation of mean unionised ammonia value based on data collected in 2009 and applying the conditions likely to produce the highest unionised ammonia concentrations e.g. the lowest salinity, and highest pH for a given sample point and average temperature plus an increase of 12 oC.
Month Temperature (oC) Salinity pH Total ammonia
Unionised Ammonia NH3 –N mg l-1
January 17.27 Lowest value* Highest value* Highest value* 0.004
May 23.48 Lowest value Highest value Highest value 0.005
June 29.48 Lowest value Highest value Highest value 0.006
September 28.85 Lowest value Highest value Highest value 0.012
Mean 0.007
Taken from BEEMS, 2010a (Ref 17.4).
Notes: *The value measured at each depth at a given sampling point that will result in the maximum derived unionised ammonia value is used to calculate the unionised ammonia value for that sampling point.
Table 17.15: Derivation of mean unionised ammonia value based on water quality data collected in 2009 and applying the conditions likely to produce the highest unionised ammonia concentrations e.g. the lowest overall salinity recorded during four separate sampling occasions, the highest overall pH and the highest average temperature plus an increase of 12 oC.
Month Temperature
(oC)
Salinity
(psu)
pH Total ammonia Unionised Ammonia
NH3 –N mg l-1
January 17.27 23.3 8.11 Highest value* 0.008
May 23.48 23.3 8.11 Highest value 0.010
June 29.48 23.3 8.11 Highest value 0.012
September 28.85 23.3 8.11 Highest value 0.015
Mean 0.011
Taken from BEEMS, 2010a (Ref 17.4).
17.7.72 Based on the ‘worst-case’ data in terms of maximum unionised ammonia concentration, from the 2009 dataset, the highest average unionised ammonia value calculated was 0.011 mg.l-1 NH3 –N. This value is just over a half of the Habitats Directive criterion limit value of 0.021 mg l-1 expressed as an annual average.
17 Marine Water & Sediment Quality
38 | HINKLEY POINT C PRE-APPLICATION CONSULTATION – STAGE 2
ENVIRONMENTAL APPRAISAL – VOLUME 2
17.7.73 The estimated distribution of unionised ammonia concentration was plotted for the vicinity of an operational HPC (Figure 17.3). This utilised an Environment Agency ammonia calculator and assumed conditions of mean salinity and pH based on empirical data for September. A maximum thermal input predicted using GETM for twin EPRs for Hinkley Point C was applied to a mean background temperature of 16.85oC. Applying this approach, the effect of the temperature increase resulted in unionised ammonia concentrations up to a maximum of 0.009 mg.l-1 NH3-N in the wider area across the mudflats, and within the mouth of the Parrett estuary. Based on these data, there is a low likelihood that unionised ammonia concentrations that exceed Habitats Directive criterion limit value of 0.021 mg.l-1 expressed as an annual average will result from the thermal input predicted for HPC.
Effect Of Thermal Discharge Upon Water Quality Status (with reference to WFD and habitats directive requirements)
17.7.74 The waters around the River Parrett are defined as a candidate Heavily Modified Water Body (cHMWB) under the WFD and characterised as having moderate ecological potential. Waters between West of Hinkley Point and Porlock Bay are characterised as moderate ecological status (BEEMS, 2010a (Ref 17.4)).
17.7.75 Maximum temperature increases for the River Parrett and Bridgwater Bay WFD water bodies have been modelled (effect of Hinkley Point C station alone) and do not show exceedances beyond the most stringent permitted uplift for waters of high status, which is set at 20oC. Modelled temperature data for each of these WFD water bodies would also place both the Parrett and Bridgwater Bay within the ‘good status’ class (based on predicted 98 percentile values).
17.7.76 With reference to the Habitats Directive requirements for SPA’s and SAC’s. BEEMS, 2010a (Ref 17.4) presents a comparison of modelled scenarios (effects assessed are of Hinkley Point C alone) with relevant standards. Both the proposed intake/outfall configuration) and that employing an intermediate offshore discharge came closest to meeting the temperature threshold value. For these configurations, both models predicted maximum excess temperatures of between 4 and 8.2 oC.
17.7.77 The highest temperatures predicted for the intertidal areas are to the east and west of the discharge point. These predictions exceed the criteria value of 2 oC. Despite failure to meet strict criteria, it can be argued that these temperature increases are localised and biological impacts would be insignificant indicating a low significance. Using the Delft3D model, for all configurations tested all of the points were <2 oC for mean excess temperature at the seabed.
17.7.78 Seabed temperatures were selected as benthic species are particularly important to the habitats assessment for this area. Using the GETM model, the mean excess temperature at the seabed at all points for the proposed intake/outfall configuration was <2 oC, although both models found maximum seabed temperatures exceeded 2 oC at a number of points. The potential implications of this predicted increase in water temperature over areas of intertidal mudflat and their ecological function is covered in the chapter on marine ecology.
17.7.79 The more stringent of the Habitats criteria guidance values (not to exceed >21.5�C as a 98 percentile at the edge of the mixing zone) is not predicted to be met for any configuration by either model. However, it should be noted that the natural background temperatures for this area expressed as a 98 percentile, range between 19 and 20.4 oC. This threshold is particularly directed to the protection of migratory species, and it is uncertain how much influence small levels of thermal increase have on different migratory species (see BEEMS, 2010a and thermal impact discussions within Chapter 19). Comparison of modelled results against these criteria is highly dependent upon mixing zone interpretation. Habitats in close proximity to the discharge
17 Marine Water & Sediment Quality
39HINKLEY POINT C PRE-APPLICATION CONSULTATION – STAGE 2 |
ENVIRONMENTAL APPRAISAL – VOLUME 2
that exceed the maximum value may be judged to be within the mixing zone when guidance is fully developed and all configurations may thus be found to comply.
17.7.80 Regarding cross-sectional analysis, the Severn Estuary (owing to its size and the relatively small magnitude of thermal input) met guidance criteria easily. For the Parrett Estuary the guidance criteria were not always met. Such failures are predicted to be <0.25 oC above 2 oC. In most cases the cross sectional area impacted by a >2 oC temperature increase was close to the threshold of 25 %. The significance of this temperature increase can therefore be considered to be low.
Dissolved Oxygen Concentrations
17.7.81 As referenced above, thermal discharges have the potential to impact upon the dissolved oxygen concentration of receiving waters. In the context of water quality conditions offshore of Hinkley Point, there will be some reduction of dissolved oxygen in the cooling water discharge; the effect of this (on the water quality status of the Bristol Channel/Severn Estuary) is likely to be moderated to a large degree by the fact that background concentrations of oxygenation are generally high. This is supported by the 2009 marine water quality baseline studies that found substantive concentrations of dissolved oxygen within an extremely well mixed system. This suggests, following mixing, that the discharge would be unlikely to have a significant effect upon levels of dissolved oxygen within the water column.
Ammonia Concentrations
17.7.82 As referenced above, thermal discharges have the potential to impact upon ammonia ionisation. The GETM modelling based upon the 2009 data has shown a low likelihood of Habitats Directive criterion limits for unionised ammonia (0.021 mg/l) being exceeded and this effect is therefore not considered significant. This component of the assessment does not take into account additional discharges of unionised ammonia from the EPRs. Discharges of Ammonia from the EPRs have been investigated and have been found to be insignificant (HI assessment results – see Ref. 17.2).
iv) Cooling Water - Chemical Discharges
17.7.83 Effluent discharges under both the initial commissioning and operational scenarios (expected effluent contaminants and expected maximum loadings of metals) have been estimated. These values are based on information contained within the PCER documentation and assume that the operation of the demineralisation and desalination units will be similar to that proposed for Flamanville 3. However, the actual operational discharges at Hinkley Point may show variation on the values quoted due to differences in the quality of the abstracted seawater. As such the discharge loading values need to be treated with some caution until validation of these data through testing can be undertaken. Table 17.16 and Table 17.17 provide discharge estimates for the commissioning phase.
17.7.84 In addition to the waste water from circuit conditioning and testing, effluent will also arise from desalination and production of demineralised water (see Table 17.17).
17.7.85 The expected contaminant concentrations (non-radioactive) from the process water effluent deriving from two EPR units i.e. water which has passed through the main station circuits, are presented in Table 17.18. The expected composition of metals in the discharge effluent is presented in Table 17.19.
17 Marine Water & Sediment Quality
40 | HINKLEY POINT C PRE-APPLICATION CONSULTATION – STAGE 2
ENVIRONMENTAL APPRAISAL – VOLUME 2
Table 17.16 Expected 24hr And Annual Maximum Discharges For Two EPR Units During The Commissioning Phase (excluding demineralised water production).
Substance Circuit testing and conditioning (kg) – 24 hr loadings
Circuit testing and conditioning (kg) – Annual loadings
Iron 80 800
Suspended solids
30 160
Phosphates 340 1000
Lithium 4 4
Hydrazine 0.8 1
Boric acid 2500 2500
Boron* 218 437
Morpholine 30 600
Notes: Information derived from tables in EDF, 2009 (Ref. 17.3). *Concentration of boron derived from boric acid concentration.
Table 17.17 Expected Discharges From Desalinisation And Demineralisation Plants During The Commissioning Phase For 2 EPR Units.
Substance Desalinisation And Demineralisation Plant Discharges (kg) – Annual Loadings
Iron 628
Suspended solids 1200
Sodium 12066
Sulphates 9182
Notes: Information derived from tables in EDF 2009 (Ref. 17.3).
17 Marine Water & Sediment Quality
41HINKLEY POINT C PRE-APPLICATION CONSULTATION – STAGE 2 |
ENVIRONMENTAL APPRAISAL – VOLUME 2
Table 17.18 Expected Effluent Contaminants Associated With The Process Water Discharges From Two EPR Units (process water is also called radioactive discharge on account of the water use in the main plant circuits).
Substance 24 hr flow (kg)
Annual Expected Loadings (kg)
Maximum Expected Loadings (kg)
Boric Acid 5630 4000 14000
Boron 984 699 2448
Lithium hydroxide <2 8.8
Hydrazine 4 14 28
Morpholine 95 690 1680
Ethanolamine 25 500 920
Acetates1 0.08 1.68 3.1
Formiates1 0.1 2.07 3.8
Glycolates1 0.01 0.207 0.38
Oxalates1 0.007 0.07 0.13
Total Nitrogen as N (excluding hydrazine, morpholine and ethanolamine)2
320 5060 10120
Un-ionised ammonia2 10.6 167 334
Phosphates 200 310 800
Detergents 270 1260 3200
Total Metals 12 32 55
Suspended solids 420 1310 2800
Notes: 1 Morpholine forms ethanonlamine by thermal decomposition. This is further decomposed into acetates, formiates, glycolates and oxalates. 2 Total nitrogen is present in the secondary circuit water only in the form of ammonium ions. Some conversion to both nitrite and nitrate may occur prior to discharge to the environment. For the assessment of ammonia, reference has been made to the PCER documentation (Chapter 12 pg 37). The unionised ammonia is based on a worst-case scenario with a 3.3% fraction of the discharge being unionised ammonia. This assumes a temperature of 20 °C, pH of 8 and salinity of 30ppt. ‘Annual expected loadings’ are those anticipated during normal operation. All modelling assessment has been based on the ‘maximum expected loadings’, which are the maximum possible use and represent the worst-case scenario.
17 Marine Water & Sediment Quality
42 | HINKLEY POINT C PRE-APPLICATION CONSULTATION – STAGE 2
ENVIRONMENTAL APPRAISAL – VOLUME 2
Table 17.19 Expected Maximum Loadings Of Metals From Two EPR Units. These Expected Effluent Contaminants Are Associated With Process Water Only (also termed radioactive discharge).
Metal1 Typical Proportion Of Total Metals In Discharge (%)
Maximum Expected Annual Loading (kg) From Two EPR Units2,3
Aluminium 8.95 4.93
Copper 0.7 0.39
Chromium 14.1 7.76
Iron 59.3 32.62
Manganese 5.6 3.08
Nickel 0.75 0.41
Lead 0.5 0.28
Zinc 10.10 5.56
Notes: 1) For the purpose of H1 assessment the metals discharged are assumed to be in a dissolved state. 2) Based on information in the EDF, 2009 (Ref. 17.3). 3) Calculated based on a maximum annual discharge of total metals of 55 kg from two operating EPR units.
17.7.86 For the assessment of discharges, it has been assumed that all metals within the effluent are present 100 % in the dissolved state and therefore biologically available. This provides a worst-case scenario in terms of the modelling assessment as the EQS values for dissolved metals are generally at a low concentration.
17.7.87 Modelling of all process chemicals that are proposed to be discharged to the marine environment (via the cooling water discharge) has been undertaken according to an Environment Agency H1 type assessment methodology. The modelling process includes two tiers. The first tier screens out discharges deemed to be of no environmental significance. Chemical parameters found to be at significant concentrations are then subject to more detailed analysis for a range of scenarios.
17.7.88 The H1 methodology provides methods for calculating dispersion rates for discharges into tidal and coastal waters and recommends that a site specific value is derived. For the H1 assessment of proposed HPC discharges, a dilution factor was estimated based on the models used to examine thermal plume dispersion. A depth averaged dilution factor was derived from the Delft3D model for distances of 100m and 500m from the proposed offshore discharge location.
17.7.89 The assessment has shown that based on the available discharge information during the commissioning and operational phases, the resultant depth average environmental concentrations at 100 m and 500 m from the discharge point are below concentrations of environmental significance with the exception of hydrazine.
Hydrazine Introduction
17.7.90 Hydrazine is a weak volatile base used in the proposed plant circuits mainly as a reducing agent. The PCER (Ref. 17.3) states that when the secondary circuit is operational, it is the use of
17 Marine Water & Sediment Quality
43HINKLEY POINT C PRE-APPLICATION CONSULTATION – STAGE 2 |
ENVIRONMENTAL APPRAISAL – VOLUME 2
hydrazine that maintains a non-oxidising environment, reduces the oxygen dissolved in the feedwater and limits oxide production in the feedwater plant. In these circumstances, hydrazine is decomposed in two ways:
by reaction with the oxygen in the water to form water and nitrogen; and by thermal decomposition to form nitrogen, hydrogen and ammonia.
17.7.91 During plant outages hydrazine is also used to condition the steam generators (Ref 17.3) whilst also being used as an oxygen scavenger in the primary circuit, although at low concentrations.
17.7.92 The estimated impact significance of hydrazine is influenced by the PNEC values used within the H1 assessment. The normal approach is to derive a ratio of PNEC to PEC. Given the absence of detectable background concentrations in this instance, the PEC value has been based solely based on the calculated process contribution. The expected range of discharge concentrations for hydrazine, not taking in to account any offshore dilution effects, range between 0.0003 μg/l for an annual commissioning phase discharge up to 0.7 μg/l for a worst-case 24 hour discharge loading. These values may be compared to the PNEC values adopted in the assessment which are 0.0004 μg/l for chronic discharges (annual) and 0.004 μg/l for acute discharges (24 hour).
17.7.93 The degradation rate of hydrazine is dependent on a wide variety of factors. The main factors that favour abiotic hydrazine degradation are the presence of certain metal ions (i.e. copper), organic material in general, organic oxidizers in particular, increased hardness and high pH and temperature (Slonim & Gisclard, 1976 (Ref. 17.17)).
17.7.94 Given that elevated concentrations in the cooling water discharge have been identified via the H1 assessment, some degree of detriment in terms of water quality can be presumed. In order to scale the extent of the zone of detriment involved, there is a need to develop a better understanding of degradation rates in the local receiving water prior to numerical modelling, with this in turn informing a discussion of tolerable mixing zone extents with the Environment Agency. Such degradation studies are in progress.
17.7.95 All other process chemicals intended to be discharged to the marine environment have been assessed in the same manner using the Environment Agency’s H1 assessment methodology. All other discharge parameters have been found to be below thresholds of significance and no effects on water quality are therefore anticipated in relation to these process chemicals.
Cooling Water - Potential Chlorination
17.7.96 Chlorine is one of the most common biocides used to prevent biofilm development and establishment of macrofouling organisms, e.g. mussels, in industrial cooling water systems. In estuarine/marine systems, chlorine reacts with the bromine in seawater to form hypobromous acid and hypobromite.
17.7.97 Due to the extremely high tidal range and consequent turbidity regime, it is likely that HPC will not need to apply low level chlorination as a matter of routine (see Chapter 19). However, as with these two power stations, low flow conditions may occasion this need as a more successful recruitment and growth of existing or new potentially fouling species. Current operational procedures applied at Hinkley Point B recognise this to be a risk. The most significant risk is associated with the presence of Sabellaria; a species well suited to the extreme tidal regime, and, from operational experience elsewhere, capable of taking advantage of low-flow opportunities.
17.7.98 Replicating the operational procedures established at HPA and HPB, it is proposed that HPC would maintain the means to apply low level chlorination in the case of actual need. Under these established procedures, chlorination would only be carried out when the risk of fouling is realised through operational surveillance.
17 Marine Water & Sediment Quality
44 | HINKLEY POINT C PRE-APPLICATION CONSULTATION – STAGE 2
ENVIRONMENTAL APPRAISAL – VOLUME 2
17.7.99 The expected discharges from the chlorination process include the following, with the relevant regulatory controls being summarised in Table 17.20:
Residual chlorine-produced oxidants in the form of free chlorine, chlorinated compounds and in particular brominated compounds, collectively termed Total Residual Oxidants (TRO). The range and proportions of chlorinated compounds would be variable, being dependant amongst other factors on the background organic content of the incoming seawater, its pH and salinity; and
Chlorination by-products (CBPs), predominantly trihalomethanes, themselves mainly present as bromoform.
17.7.100 Should chlorination be required, dosing would be established to achieve a 0.2 mg/l TRO at the condensers.
17.7.101 Some of the CBPs are persistent but the concentrations involved are low, being at the �g/l level. The principal issues for water quality in terms of chlorine addition relate to exceeding environmental quality standards (EQS) and potential toxicity from:
the residual TRO levels beyond the point of discharge. The EQS (expressed as a maximum allowable concentration) of total TRO is currently set as 10 μg/l at the edge of an agreed mixing zone;
the effect of TRO on entrained organisms and the contribution of this impact to the status of the water body as a whole; and
confirmation that the CBP levels involved are sufficiently low for management using the TRO EQS alone to confer a sufficient level of protection on the receiving water.
Table 17.20: Legalisation Associated With Potential Chlorination Impacts
POTENTIAL ACTION BY POWER PLANT : Thermal Discharge
45HINKLEY POINT C PRE-APPLICATION CONSULTATION – STAGE 2 |
ENVIRONMENTAL APPRAISAL – VOLUME 2
POTENTIAL ACTION BY POWER PLANT : Thermal Discharge
Fish behaviour
Fish mortality
Sub-metrics
under the fish
classification
scheme in WFD
Failure of EQR in the
overall sub-metrics
Changes in fish behaviour
relating to migration patterns,
spawning are identified in the
fish classification scheme.
Change in fish species
composition must relate to a
pressure
WFD
assessment
from 2009. Will
continue to
2030
Benthic
invertebrates
Limited data on the effect of temperature on
benthic invertebrates
More information needed
Change in
phytoplanktonco
mmunity
Sub-metrics
under the marine
plant
classification
scheme
Exceedance threshold
based on 30%
deviation of natural
population
(community
indicators)
Significant deviation in
community composition is
part of the normative
definitions and will be
identified in the
phytoplankton classification
tools
WFD
assessment
from 2009. Will
continue to
2030
Impact on SAC
biological
element
Listed under the
Habitats Directive
Measurable change in
a protected species or
conservation area
Modification of pressure as to
eliminate the impact on the
high conservation species or
area
Habitats
Directive
17.7.102 As a result of dilution of the cooling water and additional demand on the chlorine-produced oxidants, the concentration of total residual oxidants may be expected to drop considerably over a short distance from the discharge point. BEEMS, 2010a (Ref 17.4) notes that cooling water plume studies at Heysham and Sizewell power stations in the UK found that TRO levels were at 0.2 mg/l at the point of discharge and fell below 0.01 mg/l just over 1 and 2 km from the discharge point at each site, respectively. Modelled TRO concentrations for the proposed HPC discharge are presented below.
17.7.103 In order to assess the spatial extent of a likely TRO plume from the proposed HPC station, empirical studies utilising raw Hinkley seawater were used to generate coefficients for chemical decay that were then applied within a full hydrodynamic model (GETM). The results of these studies are summarised in BEEMS, 2010a (Ref. 17.4).
17.7.104 The GETM model was selected because the model includes full vertical and lateral mixing, simulates real winds and uses real riverine flows. Three different TRO levels were modelled, with the concentrations chosen to bracket the likely operation of the plant. These were 0.05 mg/l (scenario TRO1), 0.1 mg/l (scenario TR02) and 0.2 mg/l (scenario TRO3). In combination effects with HPB were not modelled in this study.
17.7.105 The model was run for a two month period, using real data from April and May 2008. These months were selected as they represent the start of the growing season and thus both the period of greatest operational risk and likely need.
17.7.106 Figure 17.4 presents modelled results for surface TRO concentrations and Figure 17.5 presents modelled results for seabed TRO concentrations.
17 Marine Water & Sediment Quality
46 | HINKLEY POINT C PRE-APPLICATION CONSULTATION – STAGE 2
ENVIRONMENTAL APPRAISAL – VOLUME 2
17.7.107 Comparative analysis of surface and bottom modelled concentrations shows strong differences due to the thermal buoyancy of the plume, with highest TRO concentrations at the surface. As expected, the plume is slightly biased to the west associated with the greater strength of the ebb tide (westward) than the flood (eastward). The maximum surface or bottom values of TRO concentrations (presented in the figures above), are those predicted during the two-month period; it is a summation of the maximum value at any given position at the 100 m resolution of the model. The mean is derived over the whole 2 month period, but is likely to be indicative of a mean over a tidal period.
17.7.108 These modelling results indicate that the spatial area within which the EQS would be exceeded, is on average small at the surface and negligible at the seabed. BEEMS, 2010a (Ref. 17.4) notes that the area of EQS exceedance does not extend to the ecologically sensitive areas of intertidal habitat. These TRO discharge profiles are considered likely to be acceptable in terms of environmental sensitivities as it is not anticipated that these TRO concentrations would affect water quality to the extent that a significant impact would occur.
Cooling Water - CBPs
17.7.109 Upon addition of chlorine to seawater, other water quality factors such as pH and the presence of compounds such as ammonia or the amount and form of organic matter in the water, will influence the formation of chloramines/bromamines and other chlorination by-products (CBPs). Studies in cooling water systems of coastal nuclear power stations showed that chlorination leads to the formation of CBPs such as halogenated by-products, mainly trihalomethanes (major compounds formed), haloacetonitriles, (HANs) and halophenols (HPhs) (which might not be formed at high concentrations, but are of interest because of their high toxicity) and haloacetic acids (HAAs). The main compounds detected within each of these groups were bromoform, dihaloacetonitrile, 2,4,6-tribromophenol and dibromoacetic acid (see Allonier et al., 1999 (Ref. 17.18)). Other studies in coastal power stations (reviewed in BEEMS, 2010a (Ref. 17.4)) have confirmed the dominance of bromoform in CBPs, and dibromochloromethane in smaller quantities.
17.7.110 The formation of CBPs in seawater is of interest primarily because of the potential diversity of chlorinated compounds involved (Ref 17.4). Although a range of CBPs have been measured in coastal discharges, there is still uncertainty on the types of different CBPs that can be formed with chlorination of seawater. For those CBPs that have been measured, the discharge concentrations are below the calculated thresholds of effect and would decrease further within 1 km of the discharge. Although some concern may relate to the formation of carcinogenic CBPs, these are less dominant in cooling water than in sewage and other industrial sectors’ wastewater owing to the generally lower content of organic matter and, in the former case, other contaminants.
17.7.111 Given the above and the large volume (and hence dilution capability) of the Bristol Channel, it is considered that this effect on water quality is unlikely to be significant.
Cooling Water - Desalination and Demineralisation
17.7.112 The expected discharge loadings from operation of desalination and demineralisation plant are largely based on extrapolation of information from the Flamanville 3 site in France. However, the actual operational discharges at HPC may show variation on the values quoted (see Table 17.21) due to differences in the chemistry and suspended solids loading of the abstracted seawater. As such, the discharge loading values need to be treated with some caution until validation of this data can be undertaken. The values presented are based on the production of water for two EPR units. These maximum discharge values assume the desalination units run continuously and that the demineralisation unit runs for several hours each day with a regeneration cycle occurring every 30 days.
17 Marine Water & Sediment Quality
47HINKLEY POINT C PRE-APPLICATION CONSULTATION – STAGE 2 |
ENVIRONMENTAL APPRAISAL – VOLUME 2
Table 17.21 Expected Discharges Associated With Desalination And Demineralisation Of Water During Operational Period For Two EPR Units.
Chemical Source Maximum Daily 24 hour flow (kg)
Maximum Annual flow (kg)
Suspended Solids Gross discharge to sea based on ambient concentrations i.e. includes suspended solids in abstracted water)
11230 2373007
Iron From desalination and demineralisation stations
250 46006
Chloride Gross discharge to sea based on ambient concentrations (i.e. includes chlorides in abstracted water)
111810 22712370
Sodium Gross discharge to sea based on ambient concentrations (i.e. includes sodium in abstracted water)
61010 12325213
Sulphate Gross discharge to sea based on ambient concentrations (i.e. includes sulphate in abstracted water)
17680 3297410
Alkyl phosphoric acid
Anti-fouling agent used in reverse osmosis process
4 910
Values based on the production of 346,800 cubic metres of demineralised water / year. Actual values may vary based on the quality of abstracted sea water.
17.7.113 The effluents from desalination and demineralisation (Table 17.18) have likewise been subject to H1 assessment (Ref. 17.1). The chemical discharge levels from the desalination and demineralisation processes are found to be below thresholds of significance and from a water quality perspective are therefore considered to have a negligible effect.
f) Water Quality Impacts Changes That May Result From Accidents And Incidents
17.7.114 As highlighted previously, the potential risk of accidents and incidents occurring and the avoidance and minimisation of their potential effects on water quality would be managed through the adoption of best practice procedures. For example, fuels will be stored within bunded areas, refuelling will be undertaken in designated areas, plant will be well maintained and regularly serviced. In addition, an incident management plan will be put in place to respond to spillage incidents swiftly and effectively. Pollution prevention/management equipment will be made available in order to minimise the severity of a potential spillage.
17.7.115 Other than potential effects associated with spillages, the potential also exists for water quality effects to occur as a result of emergency discharges to marine waters. As these are potential risks that can be identified and the potential for occurrence and therefore environmental harm
17 Marine Water & Sediment Quality
48 | HINKLEY POINT C PRE-APPLICATION CONSULTATION – STAGE 2
ENVIRONMENTAL APPRAISAL – VOLUME 2
effectively designed ‘out’ or managed they are briefly considered here, although again it is not possible to be certain of any scale or duration of potential effect.
17.7.116 Emergency discharges associated with fire fighting runoff are likely to contain a mix of chemicals which are detrimental to water quality. This impact could potentially occur as a result of an accident during either the construction phase or the operational phase. The surface water drainage system will be designed so that waters are discharged to the cooling water. The advantage of discharging firewater for example, within the cooling water discharge is that large dilution will be applied to the potentially harmful chemicals prior to discharge to the environment. The site surface water drainage system will incorporate oil interceptors, which will collect hydrocarbon/fuel inputs to drainage water prior to discharge both routinely and during emergency.
17.7.117 Process water from the secondary circuit (i.e. not cooling water) is discharged initially to the Discharge Holding Pond. This acts as a holding lagoon for process water where the water is able to be held and tested, before it is pumped at controlled rates into the cooling water discharge stream for final discharge to the marine environment. The concentration of process chemicals in the Discharge Holding Pond could potentially be very high, far in excess of environmental quality standards for example. Under normal circumstances, controlled pumping into the cooling water discharge water provides a very large degree of dilution, resulting in the normal operation discharge concentrations. Under an emergency discharge scenario, it is proposed that the Discharge Holding Pond will discharge directly to the foreshore. Because of the temporary nature of any discharge, it is considered unlikely that from a water quality perspective that such a discharge would be of significance. However, there are potential marine ecology issues associated with the discharge. As a result, the potential is being considered for emergency storage capacity and for the installation of back-up pumps to ensure that process water can be discharged to the cooling water stream even during an emergency.
17.8 Conclusions
17.8.1 The main marine water quality issues identified are the influence of the thermal plume and the potential impacts of biocide use and certain other process chemicals present in the cooling water.
17.8.2 These issues have been considered in relation to the current status of the receiving waters concerned. Numerical hydrodynamic modelling has been used to predict the level and extent of change that may result from power station operation under both likely operational and a range of meteorological conditions.
17.8.3 Although certain thermal criteria are not met, the potential degree to which this might be significant appears to be very limited in extent. Despite failure to meet these strict criteria, it can be argued that these temperature increases are localised and biological impacts would be insignificant indicating a low significance. Both existing and current studies will inform discussion on discharge levels and mixing zone limits, as appropriate.
17.8.4 Taking these issues into consideration, and pending further evaluation in support of both mixing zone development and studies to inform the Appropriate Assessment, there would appear to be a low risk of non-compliance with existing regulatory water quality thresholds. Continuing studies intended to support the Appropriate Assessment are described under Marine Ecology in Chapter 19 and associated Appendix.
17.8.5 The primary means of mitigating potential thermal impacts has been through the appropriate selection of cooling water intake and outfall positions. A series of configurations were tested using numerical modelling at an early stage and both cross-shore and intermediate offshore
17 Marine Water & Sediment Quality
49HINKLEY POINT C PRE-APPLICATION CONSULTATION – STAGE 2 |
ENVIRONMENTAL APPRAISAL – VOLUME 2
outfall locations rejected in favour of that currently proposed. These models are now being refined and further studies engaged in order to resolve a variety of uncertainties, again as described in the marine ecology chapter (Chapter 19) of this appraisal.
17.8.6 Sediment quality and the likelihood of construction related activities remobilising these materials have also been assessed and the consequences found to be both limited in spatial extent, and low and even negligible in terms of their impact.
17 Marine Water & Sediment Quality
50 | HINKLEY POINT C PRE-APPLICATION CONSULTATION – STAGE 2
ENVIRONMENTAL APPRAISAL – VOLUME 2
References
17.1 Environment Agency, 2010. H1 Environmental Risk Assessment. Annex D. April 2010.2 AMEC (2010).
17.2 AMEC, 2010. Non-Radiochemical Surface Water Quality Modelling Report. EDF Reference 15011/TR/00117. PREL D version.