17.1.2 Situation of Bolivia, Brazil, Argentina and Peru This section is based primarily on interviews and observations conducted by the JICA Study Team in October – November 2000. Statistical data, obtained in these countries and through the Internet and other means, are also presented to support the findings. Results regarding Peru are based largely on interviews conducted in Arica during the Phase II period (the study team was not able to enter the country at this time due to an unstable political situation). (1) Bolivia Access and Transport The road between Tambo Quemado and Patacamaya, which was constructed with Japan’s assistance (an OECF loan), was found to be as good as the road between Arica and Chungara, the Chilean border point, at least good enough for the present volume of traffic. However, it will become necessary to improve the road for heavy trucks in the future, as indicated by the projection of the demand for transport in Chapter 12. The ports in the North Zone are of great importance to Bolivia. Among them, the Port of Arica is definitely the most important, as many Bolivian people expressed, “Arica is the natural port of Bolivia.” In fact, Arica accounts for about half of Bolivia’s total imports (Table 17.1.5) and presumably a significant part of exports as well. Peru has completed road construction from the Bolivian border to the Port of Ilo, which has led to the following reality: “the distance is longer but the cost is lower.” Although Arica is still competitive vis-à-vis Ilo, the Bolivian government has recently conducted a study to compare the competitive levels of Chilean and Peruvian ports. It is therefore crucial that the port take immediate action to improve facilities and services. Table 17.1.5 Imports of Bolivia by Port of Entry, 1990-1999 (cif at port, US$1,000) 5 Ibid. Port 1990 1991 1992 1993 1994 1995 1996 1997 1998 1999 (p) Total 702,697 993,748 1,130,497 1,176,945 1,196,346 1,433,589 1,656,615 1,909,358 2,449,831 1,854,469 Brazil Amazonas 256 421 275 390 1,596 2,701 877 3,083 94,374 2,016 Corumba 61,822 134,679 128,473 124,037 166,971 142,782 130,528 177,635 251,668 226,616 Chile Antofagasta 6,665 49,212 49,430 39,231 19,071 50,358 33,466 17,723 12,053 10,850 Arica 452,053 479,226 558,165 534,361 570,651 657,059 671,583 739,842 1,044,856 863,899 Iquique 11,079 21,585 41,859 71,607 88,889 118,786 157,730 174,584 48,159 Peru Mollendo 1,468 42 1,960 3,305 342 1,027 19 176 - - Desaguadero 7,317 27,446 40,499 61,353 77,688 96,509 116,613 112,962 107,002 93,719 Yunguyo 32 139 27 80 12 74 356 56 169 328 Moho - - 1 54 67 - - - - - Argentina Pocitos 34,039 59,554 40,361 71,887 68,639 90,740 102,942 195,436 195,569 206,245 Oran 4,405 15,033 9,023 8,550 9,185 10,673 7,326 8,961 14,805 8,217 La Quiaca 16,431 47,118 59,092 28,810 33,270 32,278 30,166 36,890 23,493 26,565 Air 117,403 167,071 192,100 246,819 162,703 247,657 429,885 457,783 531,015 283,191 Postal mail 805 1,111 12,162 731 500 361 504 1,082 243 143 Not specified - 1,618 17,343 15,480 14,045 12,481 13,564 - - 84,520 Source: Instituto Nacional de Estadistica (INE), Bolivia, Anuario Estadistico 1999 . (p): Preliminary figures. 17 - 7
Transcript
17.1.2 Situation of Bolivia, Brazil, Argentina and Peru
This section is based primarily on interviews and observations conducted by the JICAStudy Team in October – November 2000. Statistical data, obtained in these countriesand through the Internet and other means, are also presented to support the findings.Results regarding Peru are based largely on interviews conducted in Arica during thePhase II period (the study team was not able to enter the country at this time due to anunstable political situation).
(1) Bolivia
Access and Transport
The road between Tambo Quemado and Patacamaya, which was constructed withJapan’s assistance (an OECF loan), was found to be as good as the road between Aricaand Chungara, the Chilean border point, at least good enough for the present volume oftraffic. However, it will become necessary to improve the road for heavy trucks in thefuture, as indicated by the projection of the demand for transport in Chapter 12.
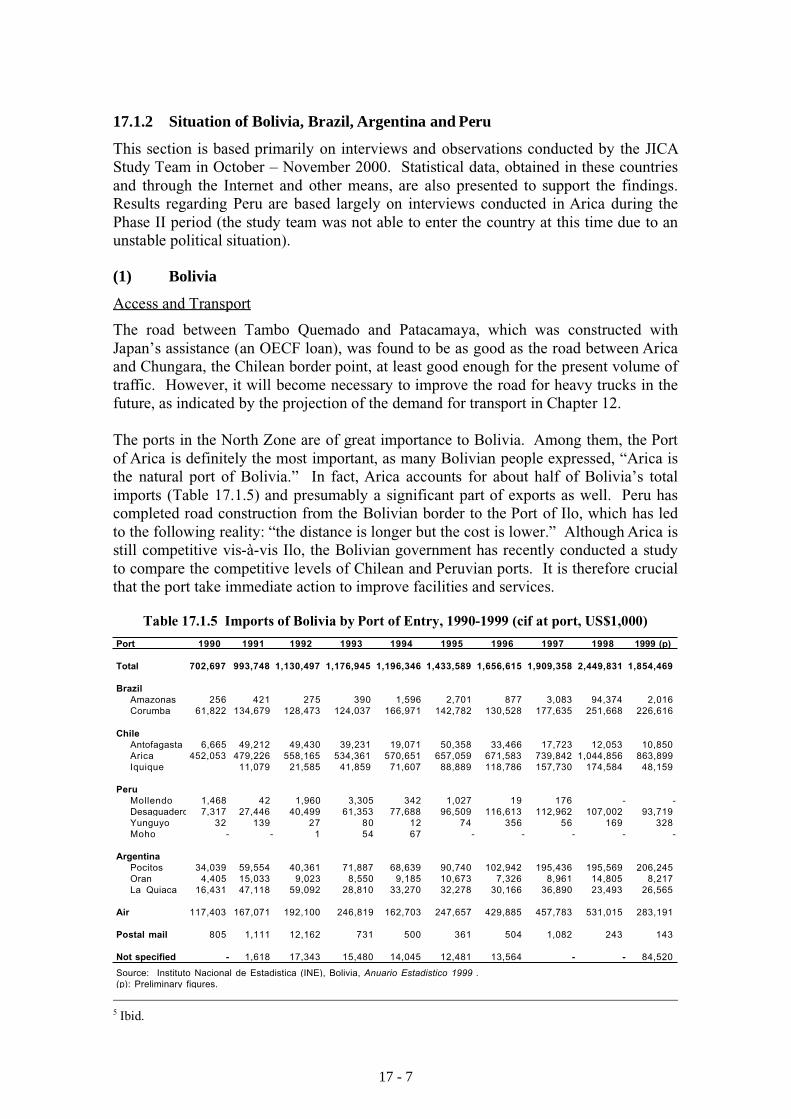
The ports in the North Zone are of great importance to Bolivia. Among them, the Portof Arica is definitely the most important, as many Bolivian people expressed, “Arica isthe natural port of Bolivia.” In fact, Arica accounts for about half of Bolivia’s totalimports (Table 17.1.5) and presumably a significant part of exports as well. Peru hascompleted road construction from the Bolivian border to the Port of Ilo, which has ledto the following reality: “the distance is longer but the cost is lower.” Although Arica isstill competitive vis-à-vis Ilo, the Bolivian government has recently conducted a studyto compare the competitive levels of Chilean and Peruvian ports. It is therefore crucialthat the port take immediate action to improve facilities and services.
Table 17.1.5 Imports of Bolivia by Port of Entry, 1990-1999 (cif at port, US$1,000)
Source: Instituto Nacional de Estadistica (INE), Bolivia, Anuario Estadistico 1999 .(p): Preliminary figures.
17 - 7
The improvement of the Port of Arica, through concession or any other means, is themost urgent task so Arica may grasp the opportunities being brought about byexpanding and deepening regional economic integration. It is also a prerequisite forArica’s further industrial development. Based on the Treaty of Peace, Friendship andCommerce signed between Chile and Bolivia in 1904, the Bolivian governmentcontends that more than one operator must manage the port.6 This condition partiallydelays the bidding process for concession and, therefore, some institutionalarrangements are needed to transcend the present situation. One possibility may be toform an international consortium of investors. The issues related to the improvement ofthe Port of Arica are further discussed in Appendix A: “Why Is It So Difficult to Grant aConcession in the Port of Arica? – Analysis of Present Situation and Proposal forDevelopment Strategy.”
Transportation costs to Arica must be significantly reduced in order that the Chileanport receives more cargo from the eastern part of Bolivia, (e.g., US$120/ton of soybeangrains utilizing the route from Santa Cruz through Arica to Buenaventura, Colombia vs.US$105/ton utilizing the route from Santa Cruz through Rosario, Argentina, toBuenaventura). According to Santa Cruz experts, cost competitiveness will beenhanced by: a) lowering handling charges of the Port of Arica by increasing itsefficiency; b) connecting the railways between Aiquile and Santa Cruz; c) allowingChilean transporters to operate in Bolivia (currently not possible due to the 1904 treaty);and d) reforming the Bolivian Port Administration Services (ASPB), which chargesUS$150/container, significantly higher than the normal price of US$40/container.
The construction of a railway from Aiquile to Santa Cruz, however, does not appear tobe economically feasible. Its construction costs are estimated to be US$500-600million, but it would be more difficult and costly to maintain the railway due to thephysical conditions of the area, which demands that many river basins are crossed.Even the existing railway from Cochabamba to Aiquile is not operating because of thehigh costs for rehabilitation and maintenance. The present situation and problems ofinfrastructure development in Bolivia are further discussed in Section 17.3.
Production and Export
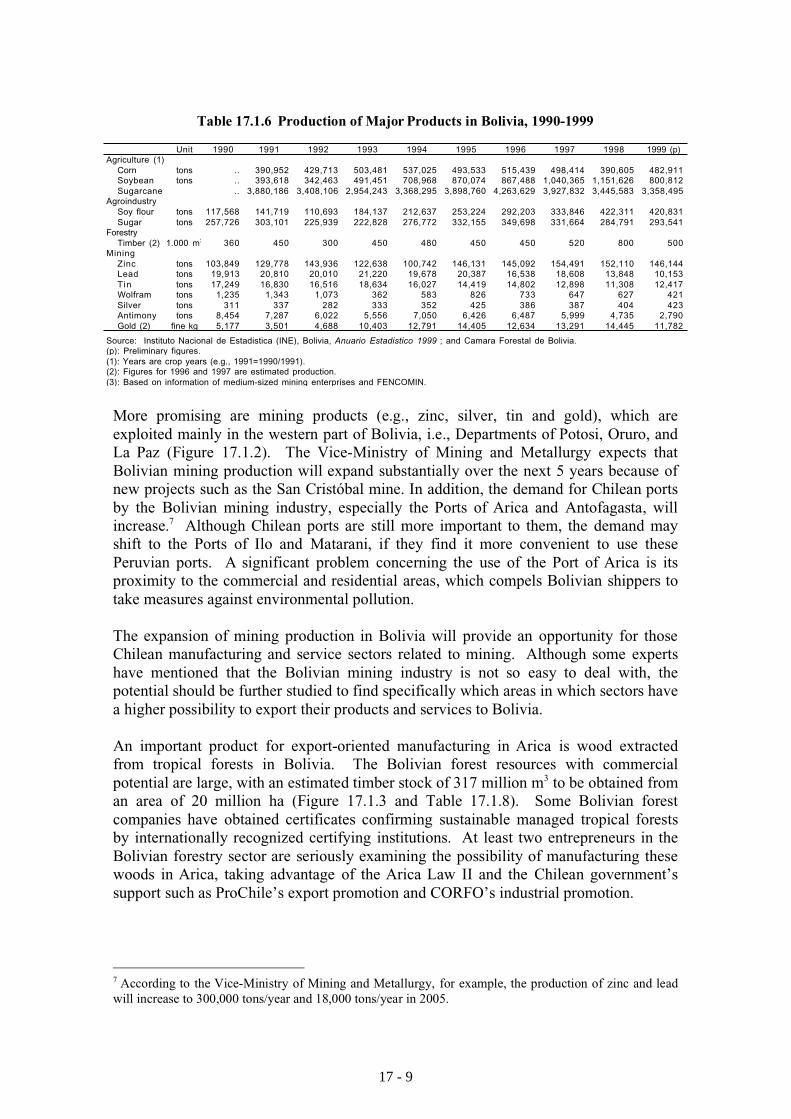
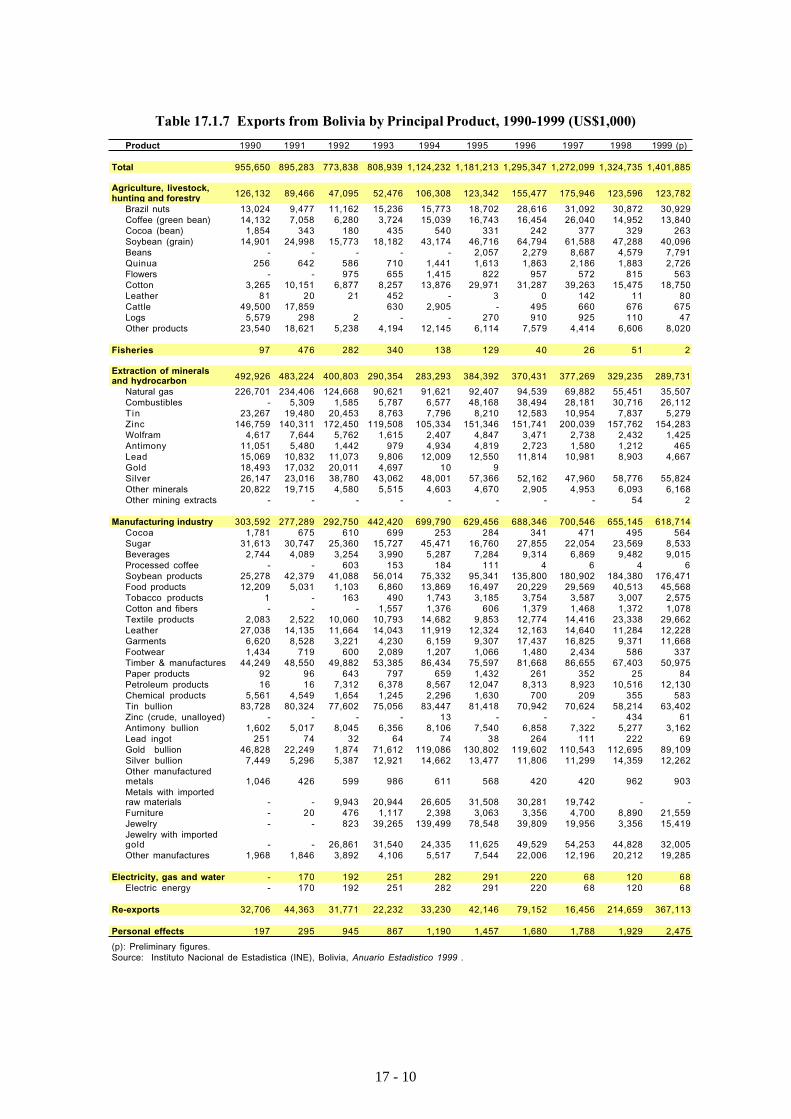
Major products produced and exported in Bolivia are soybean, mining, and forestryproducts (Tables 17.1.6 and 17.1.7). Soybean (grains) and other bulky agriculturalproducts do not seem to bear costs for trans-Andean transport and it is necessary tointroduce higher value added products to increase exports from Bolivia through Chileanports. It should be noted that Bolivian soybean could bear the trans-Andean transportcost because Colombia imposes no tariffs on this product according to the Andean Pact.
6 Strictly speaking, the 1904 Treaty does not impose this condition. However, even when the issue underdiscussion is not explicitly stated in the Treaty, according to Chilean experts, a final decision is madethrough the interpretation of the Treaty by both sides. The condition of multi-operators was set forth byLaw No. 19,542 to prevent a monopolistic situation in which shippers cannot freely choose an operator atthe port.
17 - 8
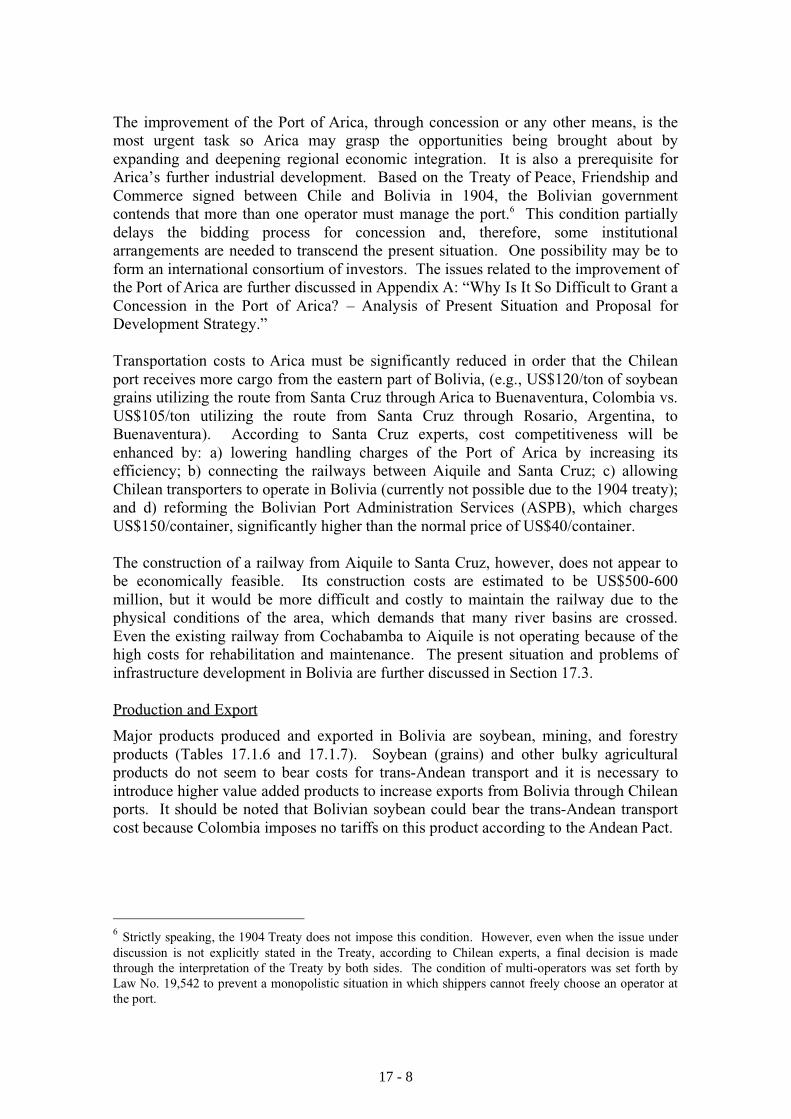
Table 17.1.6 Production of Major Products in Bolivia, 1990-1999
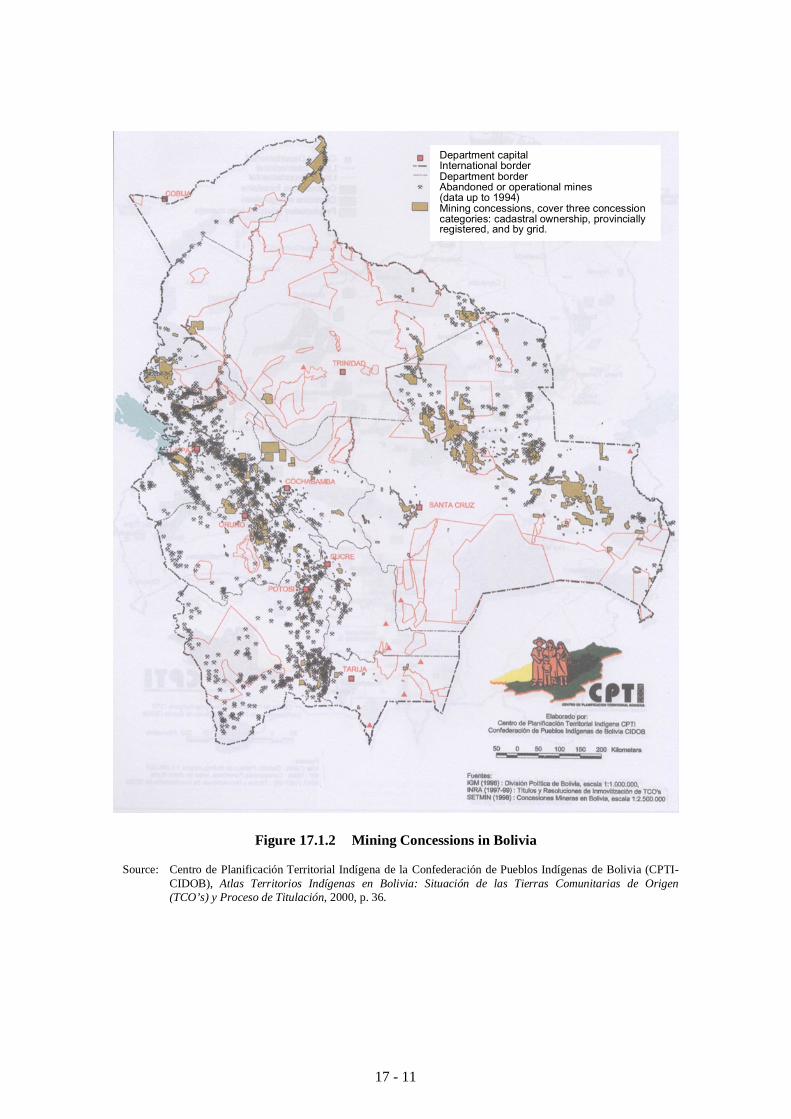
More promising are mining products (e.g., zinc, silver, tin and gold), which areexploited mainly in the western part of Bolivia, i.e., Departments of Potosi, Oruro, andLa Paz (Figure 17.1.2). The Vice-Ministry of Mining and Metallurgy expects thatBolivian mining production will expand substantially over the next 5 years because ofnew projects such as the San Cristóbal mine. In addition, the demand for Chilean portsby the Bolivian mining industry, especially the Ports of Arica and Antofagasta, willincrease.7 Although Chilean ports are still more important to them, the demand mayshift to the Ports of Ilo and Matarani, if they find it more convenient to use thesePeruvian ports. A significant problem concerning the use of the Port of Arica is itsproximity to the commercial and residential areas, which compels Bolivian shippers totake measures against environmental pollution.
The expansion of mining production in Bolivia will provide an opportunity for thoseChilean manufacturing and service sectors related to mining. Although some expertshave mentioned that the Bolivian mining industry is not so easy to deal with, thepotential should be further studied to find specifically which areas in which sectors havea higher possibility to export their products and services to Bolivia.
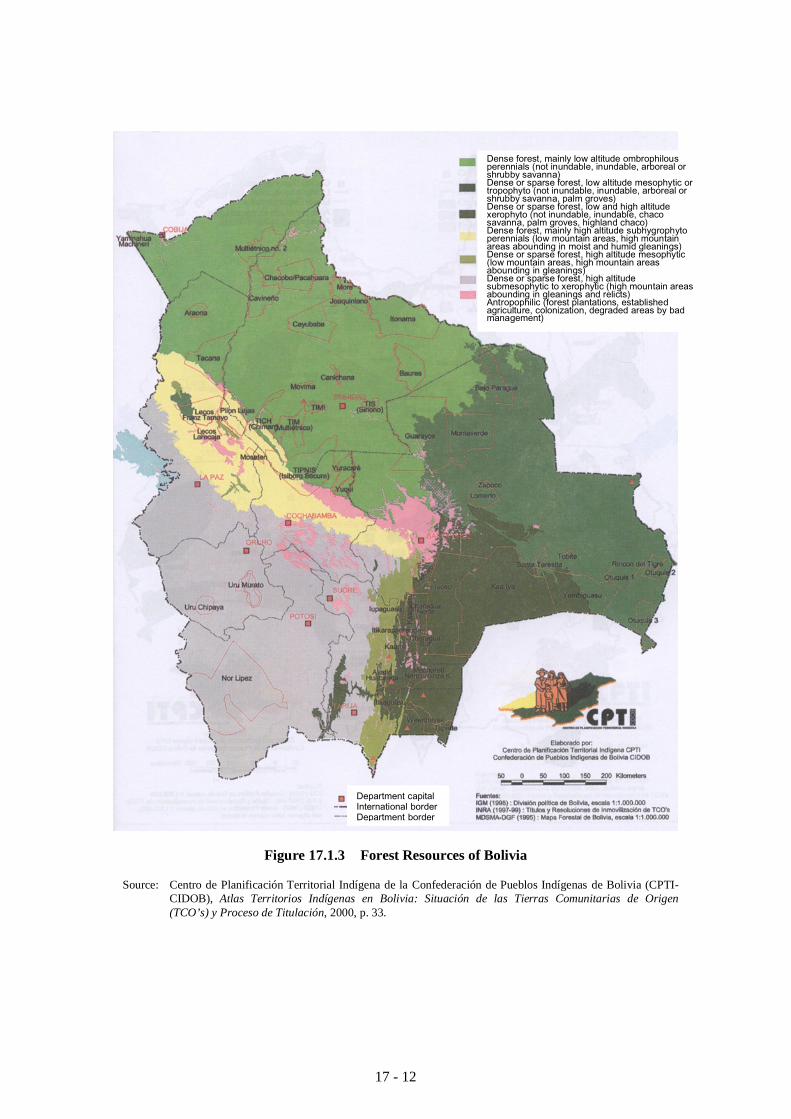
An important product for export-oriented manufacturing in Arica is wood extractedfrom tropical forests in Bolivia. The Bolivian forest resources with commercialpotential are large, with an estimated timber stock of 317 million m3 to be obtained froman area of 20 million ha (Figure 17.1.3 and Table 17.1.8). Some Bolivian forestcompanies have obtained certificates confirming sustainable managed tropical forestsby internationally recognized certifying institutions. At least two entrepreneurs in theBolivian forestry sector are seriously examining the possibility of manufacturing thesewoods in Arica, taking advantage of the Arica Law II and the Chilean government’ssupport such as ProChile’s export promotion and CORFO’s industrial promotion.
7 According to the Vice-Ministry of Mining and Metallurgy, for example, the production of zinc and leadwill increase to 300,000 tons/year and 18,000 tons/year in 2005.
Source: Instituto Nacional de Estadistica (INE), Bolivia, Anuario Estadistico 1999 ; and Camara Forestal de Bolivia.(p): Preliminary figures.(1): Years are crop years (e.g., 1991=1990/1991).(2): Figures for 1996 and 1997 are estimated production.(3): Based on information of medium-sized mining enterprises and FENCOMIN.
17 - 9
Table 17.1.7 Exports from Bolivia by Principal Product, 1990-1999 (US$1,000)
(p): Preliminary figures.Source: Instituto Nacional de Estadistica (INE), Bolivia, Anuario Estadistico 1999 .
Agriculture, livestock,hunting and forestry
Extraction of mineralsand hydrocarbon
17 - 10
Figure 17.1.2 Mining Concessions in Bolivia
Source: Centro de Planificación Territorial Indígena de la Confederación de Pueblos Indígenas de Bolivia (CPTI-CIDOB), Atlas Territorios Indígenas en Bolivia: Situación de las Tierras Comunitarias de Origen(TCO’s) y Proceso de Titulación, 2000, p. 36.
Department capitalInternational borderDepartment borderAbandoned or operational mines(data up to 1994)Mining concessions, cover three concessioncategories: cadastral ownership, provinciallyregistered, and by grid.
17 - 11
Figure 17.1.3 Forest Resources of Bolivia
Source: Centro de Planificación Territorial Indígena de la Confederación de Pueblos Indígenas de Bolivia (CPTI-CIDOB), Atlas Territorios Indígenas en Bolivia: Situación de las Tierras Comunitarias de Origen(TCO’s) y Proceso de Titulación, 2000, p. 33.
Dense forest, mainly low altitude ombrophilousperennials (not inundable, inundable, arboreal orshrubby savanna)Dense or sparse forest, low altitude mesophytic ortropophyto (not inundable, inundable, arboreal orshrubby savanna, palm groves)Dense or sparse forest, low and high altitudexerophyto (not inundable, inundable, chacosavanna, palm groves, highland chaco)Dense forest, mainly high altitude subhygrophytoperennials (low mountain areas, high mountainareas abounding in moist and humid gleanings)Dense or sparse forest, high altitude mesophytic(low mountain areas, high mountain areasabounding in gleanings)Dense or sparse forest, high altitudesubmesophytic to xerophytic (high mountain areasabounding in gleanings and relicts)Antropophilic (forest plantations, establishedagriculture, colonization, degraded areas by badmanagement)
Department capitalInternational borderDepartment border
17 - 12
Table 17.1.8 Sustained Timber (Logs) Production Potential in Bolivia
(1) Major commercial species(2) Mean Annual IncrementSource: Forestry Chamber of Bolivia, Strategic Plan for the Development of the Bolivian Forestry Sector: Executive
Summary, CFB-01/99 – Rev. 0, November 2000, p. 7.
Products based on certified Bolivian wood, such as furniture and construction materials,may be able to compete in the East Asian market with non-certified products importedfrom Southeast Asian countries such as Indonesia and Myanmar. Co-finance for theBolivian Forest Certification Fund, managed by the Forest Chamber of Bolivia andassisted by the Swedish International Development Agency (SIDA), can be one of theshort-term action plans for the North Zone with the purpose of ensuring the certifiedwood supply from Bolivia.
The business plan of a Santa Cruz meat packer interviewed by the study teamexemplifies a competitive manufacturing industry to be promoted in Arica. The idea isto transport raw materials from Bolivia (and also possibly from Brazil), process them inArica, and sell the processed products in Arica, other Chilean cities and to externalmarkets. Bolivian meat can bear transport costs to Santiago when processed, owingpartly to the benefits of the Arica Law II. At present, however, Bolivian meat, unlesscooked, is not allowed to enter the Chilean market due to Chile’s quarantine controlover the foot-and-mouth disease (Bolivia is a country with some incidence of thedisease).
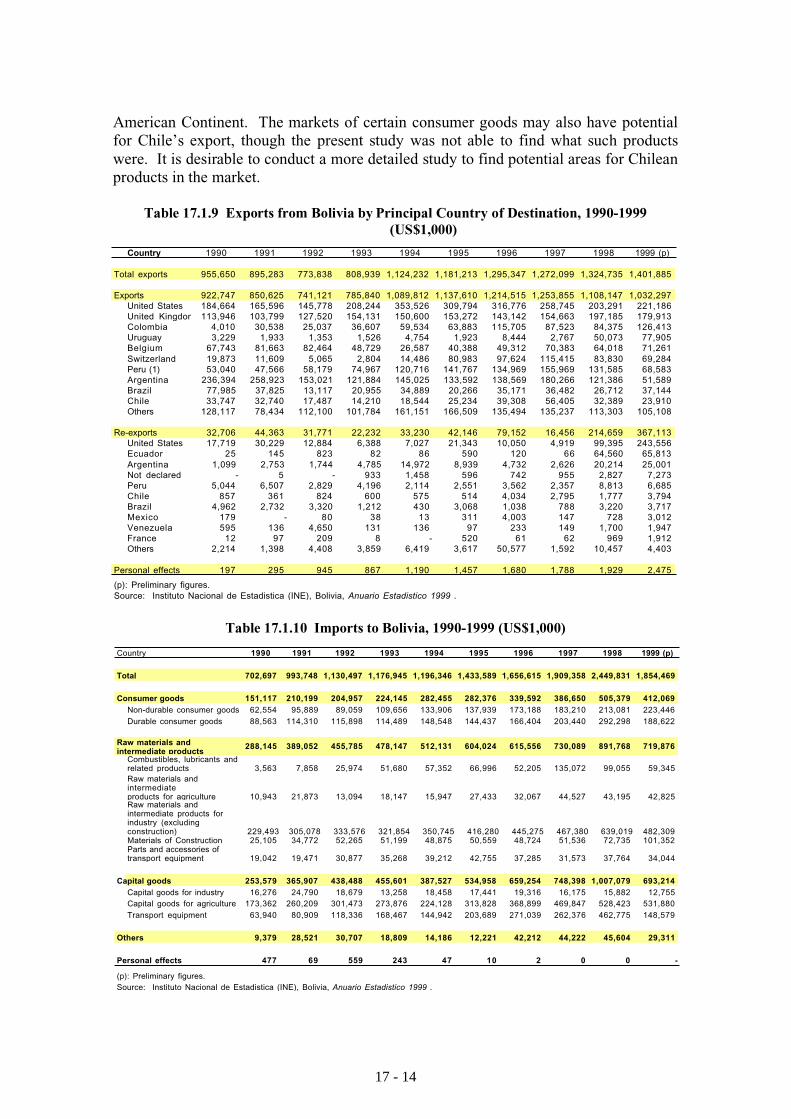
The principal destinations for Bolivian exports are the United States, the UnitedKingdom and neighboring countries such as Colombia, Uruguay, Peru and Argentina(Table 17.1.9). Exports to Argentina, traditionally the most important market to Bolivia,have substantially decreased in recent years due to the economic recession in Argentina.The recession has adversely affected Bolivia’s export business across the board, asnoted by the majority of Bolivians interviewed during the study.
Import (Markets for Chilean Products)
Bolivian imports include various kinds of goods, but the most important are capitalgoods and intermediate products for agriculture, followed by non-durable and durableconsumer goods (Table 17.1.10). The large share of goods for agriculture indicates thesector’s dependence on imported inputs and machinery, as well as its importance inBolivia’s economy. Goods for agriculture, therefore, seem to be one of the potentialareas where Chile’s exports may enter the Bolivian market. Judging from statisticaldata (Table 17.1.11) and observations made in Santa Cruz, however, they are largelysupplied by the United States and Brazil, the two major agricultural producers on the
17 - 13
American Continent. The markets of certain consumer goods may also have potentialfor Chile’s export, though the present study was not able to find what such productswere. It is desirable to conduct a more detailed study to find potential areas for Chileanproducts in the market.
Table 17.1.9 Exports from Bolivia by Principal Country of Destination, 1990-1999(US$1,000)
Table 17.1.10 Imports to Bolivia, 1990-1999 (US$1,000)
(p): Preliminary figures.Source: Instituto Nacional de Estadistica (INE), Bolivia, Anuario Estadistico 1999 .
Raw materials andintermediate products
17 - 14
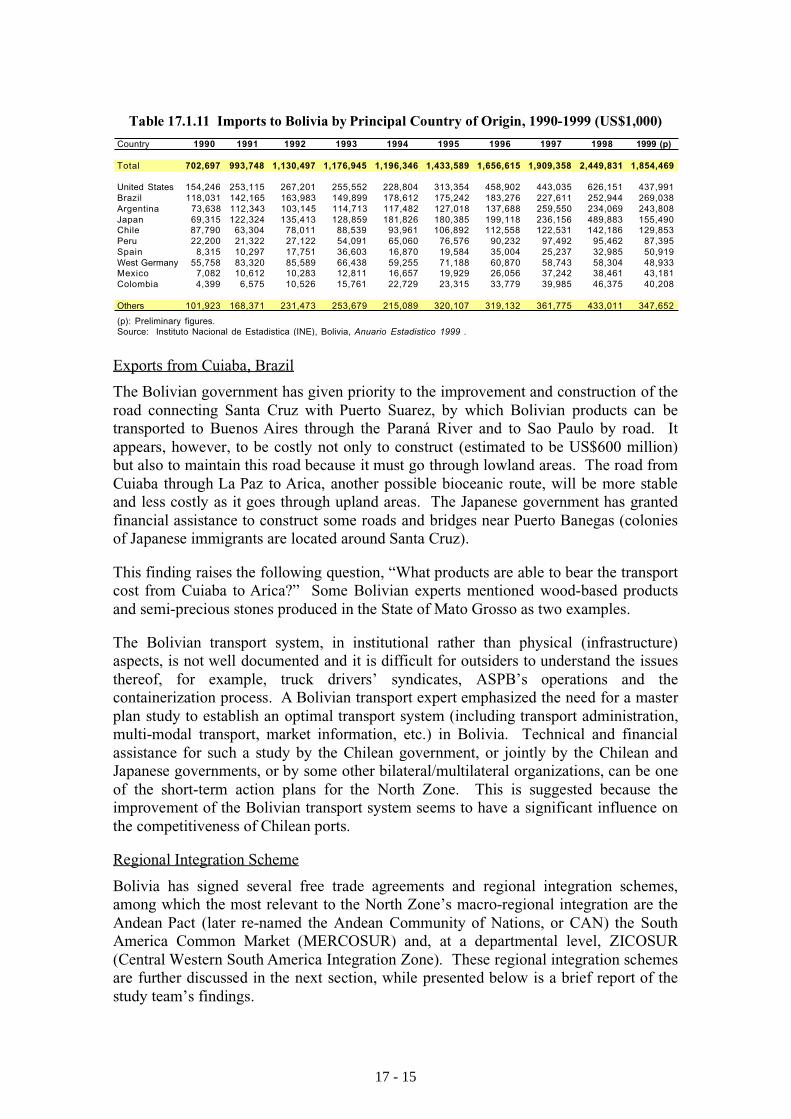
Table 17.1.11 Imports to Bolivia by Principal Country of Origin, 1990-1999 (US$1,000)
Exports from Cuiaba, Brazil
The Bolivian government has given priority to the improvement and construction of theroad connecting Santa Cruz with Puerto Suarez, by which Bolivian products can betransported to Buenos Aires through the Paraná River and to Sao Paulo by road. Itappears, however, to be costly not only to construct (estimated to be US$600 million)but also to maintain this road because it must go through lowland areas. The road fromCuiaba through La Paz to Arica, another possible bioceanic route, will be more stableand less costly as it goes through upland areas. The Japanese government has grantedfinancial assistance to construct some roads and bridges near Puerto Banegas (coloniesof Japanese immigrants are located around Santa Cruz).
This finding raises the following question, “What products are able to bear the transportcost from Cuiaba to Arica?” Some Bolivian experts mentioned wood-based productsand semi-precious stones produced in the State of Mato Grosso as two examples.
The Bolivian transport system, in institutional rather than physical (infrastructure)aspects, is not well documented and it is difficult for outsiders to understand the issuesthereof, for example, truck drivers’ syndicates, ASPB’s operations and thecontainerization process. A Bolivian transport expert emphasized the need for a masterplan study to establish an optimal transport system (including transport administration,multi-modal transport, market information, etc.) in Bolivia. Technical and financialassistance for such a study by the Chilean government, or jointly by the Chilean andJapanese governments, or by some other bilateral/multilateral organizations, can be oneof the short-term action plans for the North Zone. This is suggested because theimprovement of the Bolivian transport system seems to have a significant influence onthe competitiveness of Chilean ports.
Regional Integration Scheme
Bolivia has signed several free trade agreements and regional integration schemes,among which the most relevant to the North Zone’s macro-regional integration are theAndean Pact (later re-named the Andean Community of Nations, or CAN) the SouthAmerica Common Market (MERCOSUR) and, at a departmental level, ZICOSUR(Central Western South America Integration Zone). These regional integration schemesare further discussed in the next section, while presented below is a brief report of thestudy team’s findings.
(p): Preliminary figures.Source: Instituto Nacional de Estadistica (INE), Bolivia, Anuario Estadistico 1999 .
17 - 15
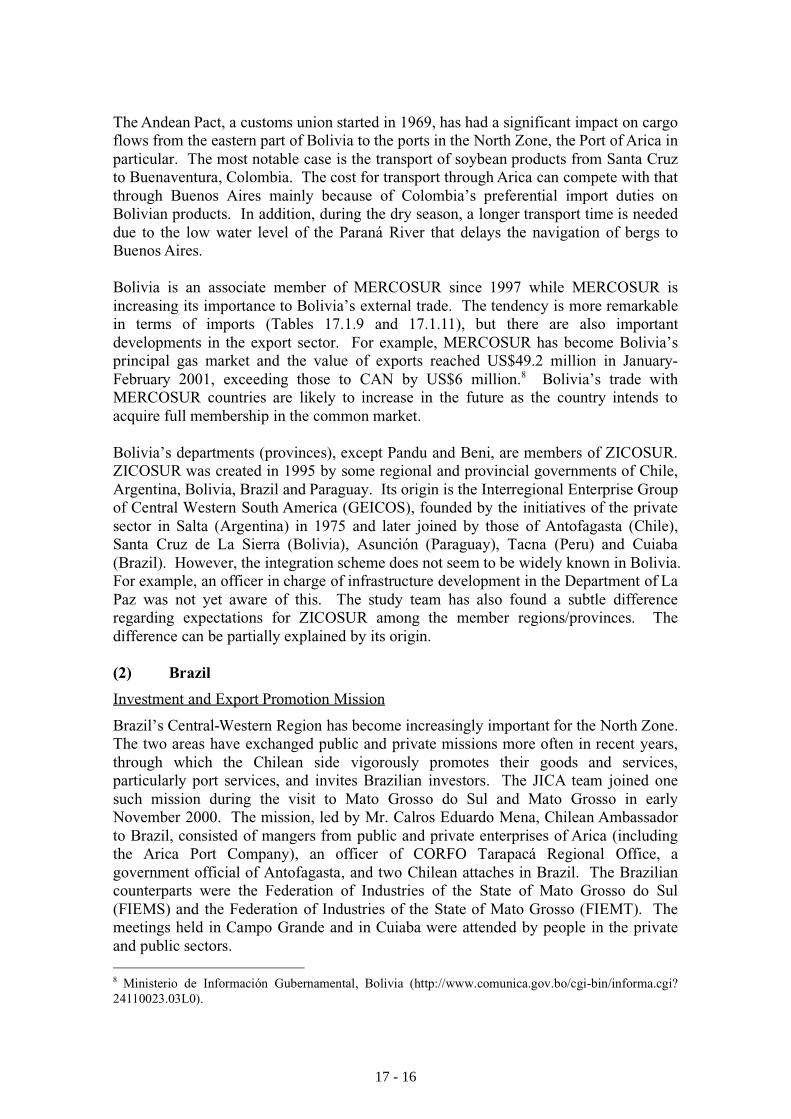
The Andean Pact, a customs union started in 1969, has had a significant impact on cargoflows from the eastern part of Bolivia to the ports in the North Zone, the Port of Arica inparticular. The most notable case is the transport of soybean products from Santa Cruzto Buenaventura, Colombia. The cost for transport through Arica can compete with thatthrough Buenos Aires mainly because of Colombia’s preferential import duties onBolivian products. In addition, during the dry season, a longer transport time is neededdue to the low water level of the Paraná River that delays the navigation of bergs toBuenos Aires.
Bolivia is an associate member of MERCOSUR since 1997 while MERCOSUR isincreasing its importance to Bolivia’s external trade. The tendency is more remarkablein terms of imports (Tables 17.1.9 and 17.1.11), but there are also importantdevelopments in the export sector. For example, MERCOSUR has become Bolivia’sprincipal gas market and the value of exports reached US$49.2 million in January-February 2001, exceeding those to CAN by US$6 million.8 Bolivia’s trade withMERCOSUR countries are likely to increase in the future as the country intends toacquire full membership in the common market.
Bolivia’s departments (provinces), except Pandu and Beni, are members of ZICOSUR.ZICOSUR was created in 1995 by some regional and provincial governments of Chile,Argentina, Bolivia, Brazil and Paraguay. Its origin is the Interregional Enterprise Groupof Central Western South America (GEICOS), founded by the initiatives of the privatesector in Salta (Argentina) in 1975 and later joined by those of Antofagasta (Chile),Santa Cruz de La Sierra (Bolivia), Asunción (Paraguay), Tacna (Peru) and Cuiaba(Brazil). However, the integration scheme does not seem to be widely known in Bolivia.For example, an officer in charge of infrastructure development in the Department of LaPaz was not yet aware of this. The study team has also found a subtle differenceregarding expectations for ZICOSUR among the member regions/provinces. Thedifference can be partially explained by its origin.
(2) Brazil
Investment and Export Promotion Mission
Brazil’s Central-Western Region has become increasingly important for the North Zone.The two areas have exchanged public and private missions more often in recent years,through which the Chilean side vigorously promotes their goods and services,particularly port services, and invites Brazilian investors. The JICA team joined onesuch mission during the visit to Mato Grosso do Sul and Mato Grosso in earlyNovember 2000. The mission, led by Mr. Calros Eduardo Mena, Chilean Ambassadorto Brazil, consisted of mangers from public and private enterprises of Arica (includingthe Arica Port Company), an officer of CORFO Tarapacá Regional Office, agovernment official of Antofagasta, and two Chilean attaches in Brazil. The Braziliancounterparts were the Federation of Industries of the State of Mato Grosso do Sul(FIEMS) and the Federation of Industries of the State of Mato Grosso (FIEMT). Themeetings held in Campo Grande and in Cuiaba were attended by people in the privateand public sectors. 8 Ministerio de Información Gubernamental, Bolivia (http://www.comunica.gov.bo/cgi-bin/informa.cgi?24110023.03L0).
17 - 16
Apart from the mission’s activity, the JICA team visited an industrial fair, industrialparks, the Brazilian National Agricultural Research Enterprise (ENBRAPA), theBrazilian Institute of Geography and Statistics (IBGE), the State Secretariat of Planningand of Science and Technology in Campo Grande, and IBGE in Cuiaba. Despite thelimited period, these visits provided the JICA team with a broad picture of the macro-regional market extended to Santos, one of the most important gateways to the AtlanticOcean and the other end of bioceanic corridors for most ports of the North Zone.
Export Potential through Chile
Port service, both in the short and long run, is an area in the Brazilian market thatpossesses great potential for the North Zone. With this in mind, the principal questionconcerning this market is: “What are the products that can bear transport costs fromCuiaba (or Campo Grande) to Arica (or Iquique or Antofagasta)?” With the exceptionof woods and some mining products (e.g., precious stones), however, the two statescurrently do not produce and export many such products (Tables 17.1.12 and 17.1.13).
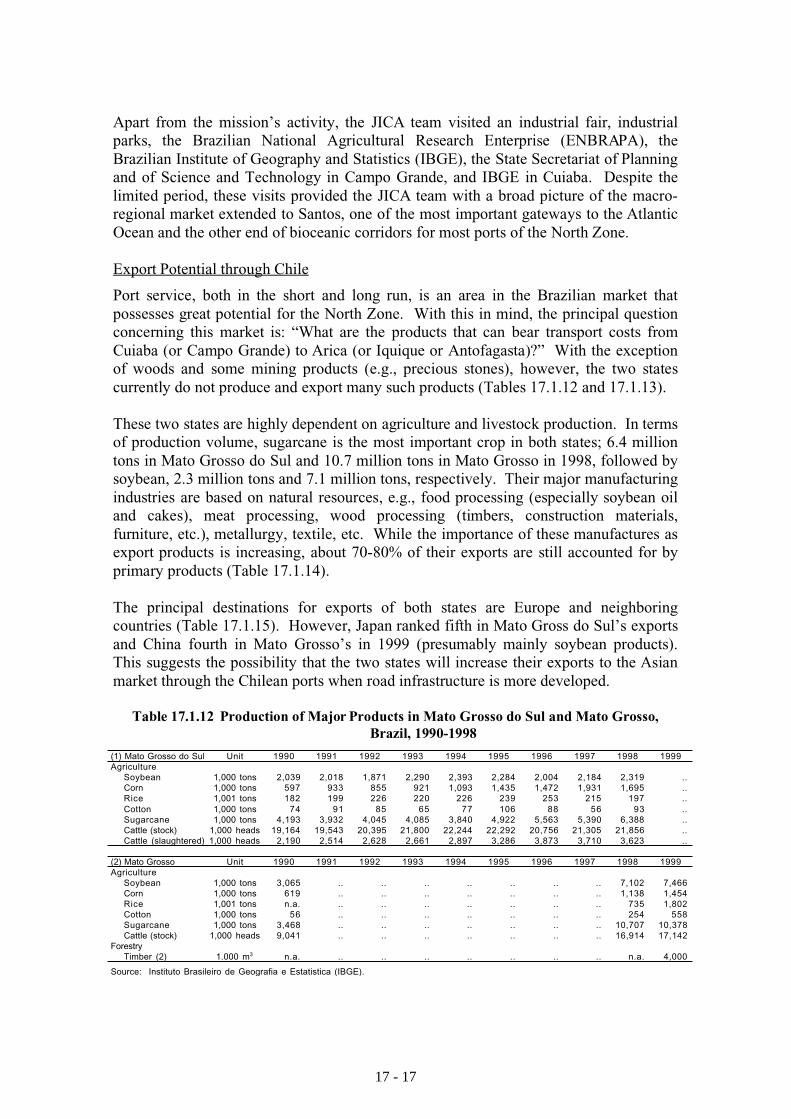
These two states are highly dependent on agriculture and livestock production. In termsof production volume, sugarcane is the most important crop in both states; 6.4 milliontons in Mato Grosso do Sul and 10.7 million tons in Mato Grosso in 1998, followed bysoybean, 2.3 million tons and 7.1 million tons, respectively. Their major manufacturingindustries are based on natural resources, e.g., food processing (especially soybean oiland cakes), meat processing, wood processing (timbers, construction materials,furniture, etc.), metallurgy, textile, etc. While the importance of these manufactures asexport products is increasing, about 70-80% of their exports are still accounted for byprimary products (Table 17.1.14).
The principal destinations for exports of both states are Europe and neighboringcountries (Table 17.1.15). However, Japan ranked fifth in Mato Gross do Sul’s exportsand China fourth in Mato Grosso’s in 1999 (presumably mainly soybean products).This suggests the possibility that the two states will increase their exports to the Asianmarket through the Chilean ports when road infrastructure is more developed.
Table 17.1.12 Production of Major Products in Mato Grosso do Sul and Mato Grosso,Brazil, 1990-1998
(1) Mato Grosso do Sul Unit 1990 1991 1992 1993 1994 1995 1996 1997 1998 1999Agriculture
Source: Ministerio do Desenvolvimento, Industria e Comercio Exterior (MDIC) / Secretaria de Comercio Exterior (SECEX) / Departamento de Operacoes de Comercio Exterior (DECEX) / Gerencia de Estatisticas e Sistemas (GEREST).
Source: Ministerio do Desenvolvimento, Industria e Comercio Exterior (MDIC) / Secretaria de Comercio Exterior (SECEX) /Departamento de Operacoes de Comercio Exterior (DECEX) / Gerencia de Estatisticas e Sistemas (GEREST).
17 - 18
Table 17.1.15 Exports from Mato Grosso do Sul and Mato Grosso, Brazilby Principal Destination, 1998-1999
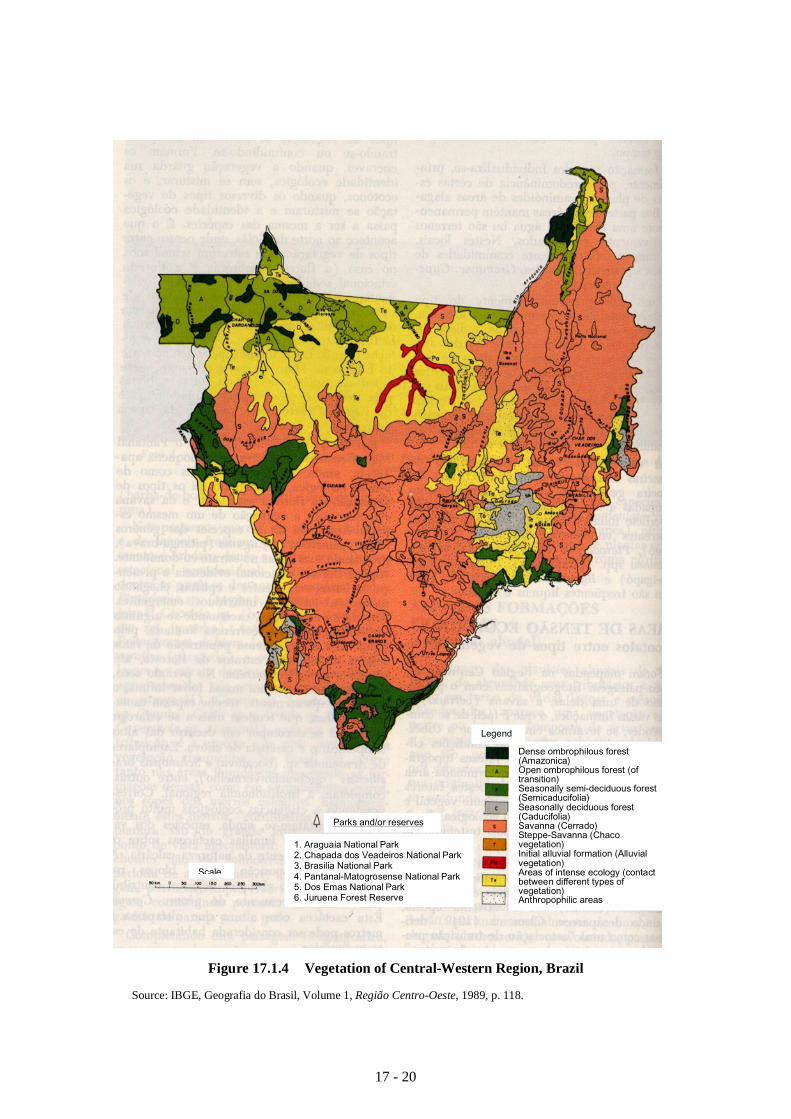
Another potential area is wood extracted from tropical forests of Mato Grosso. TheBrazilian wood can be exported in the forms of timbers and other manufacturedproducts through the Chilean ports, Arica in particular, and manufactured for export inArica. The Brazilian trade statistics indicate that the state exports timbers of tropicalspecies such as mahogany and cedro.9 There exist dense tropical forests of at least afew million hectares in the area 100-200 km northwest of Cuiaba, though the remainingwood resources are not known (Figure 17.1.4). The study team encountered a Chileanentrepreneur who was seeking to import timbers from Mato Grosso and manufactureconstruction materials for export in Arica. According to the entrepreneur, the state has alarge potential to produce wood of relatively high value.
Import (Markets for Chilean Products)
The Brazilian market is large, with a population of 162 million and the average percapita income of US$4,865 in 1998 (Table 17.1.1 above). For these reasons, the NorthZone of Chile finds it attractive. Although the incomes of Mato Grosso do Sul andMato Grosso are not as high as the national average, the imports of the two states aremainly industrial products and there may be an opportunity for the North Zone to exportmanufactured products to the market (Table 17.1.16). However, the Brazilian capacityof industrial production, particularly in the Sao Paulo area, is so great that there does notseem to exist a high possibility for the North Zone to export industrial products to thetwo states. This observation is more relevant to Campo Grande, which is located 1,000km from Sao Paulo and has relatively dense road networks that lead to major cities andthus has closer economic relationships with industrial and commercial centers of thecountry.
9 Ministerio do Desenvolvimento, Industría e Comercio Exterior (MDIC)/Secretaria de Comercio Exterior(SECEX) (http://www.mdic.gov.br/publica/SECEX/pag/balancaEstados.html).
(1) Mato Grosso do Sul 1998 1999(fob US$ 1,000) (%) (fob US$ 1,000) (%)
Total exports 175,388 100.0 218,323 100.0Total exports to principal countries 159,826 91.1 210,735 96.5
Source: Ministerio do Desenvolvimento, Industria e Comercio Exterior (MDIC) /Secretaria de Comercio Exterior (SECEX) /Departamento de Operacoes de Comercio Exterior (DECEX) / Gerencia de Estatisticas e Sistemas (GEREST).
17 - 19
Figure 17.1.4 Vegetation of Central-Western Region, Brazil
Source: IBGE, Geografia do Brasil, Volume 1, Região Centro-Oeste, 1989, p. 118.
Legend
1. Araguaia National Park2. Chapada dos Veadeiros National Park3. Brasilia National Park4. Pantanal-Matogrosense National Park5. Dos Emas National Park6. Juruena Forest Reserve
Parks and/or reserves
Scale
Dense ombrophilous forest(Amazonica)Open ombrophilous forest (oftransition)Seasonally semi-deciduous forest(Semicaducifolia)Seasonally deciduous forest(Caducifolia)Savanna (Cerrado)Steppe-Savanna (Chacovegetation)Initial alluvial formation (Alluvialvegetation)Areas of intense ecology (contactbetween different types ofvegetation)Anthropophilic areas
17 - 20
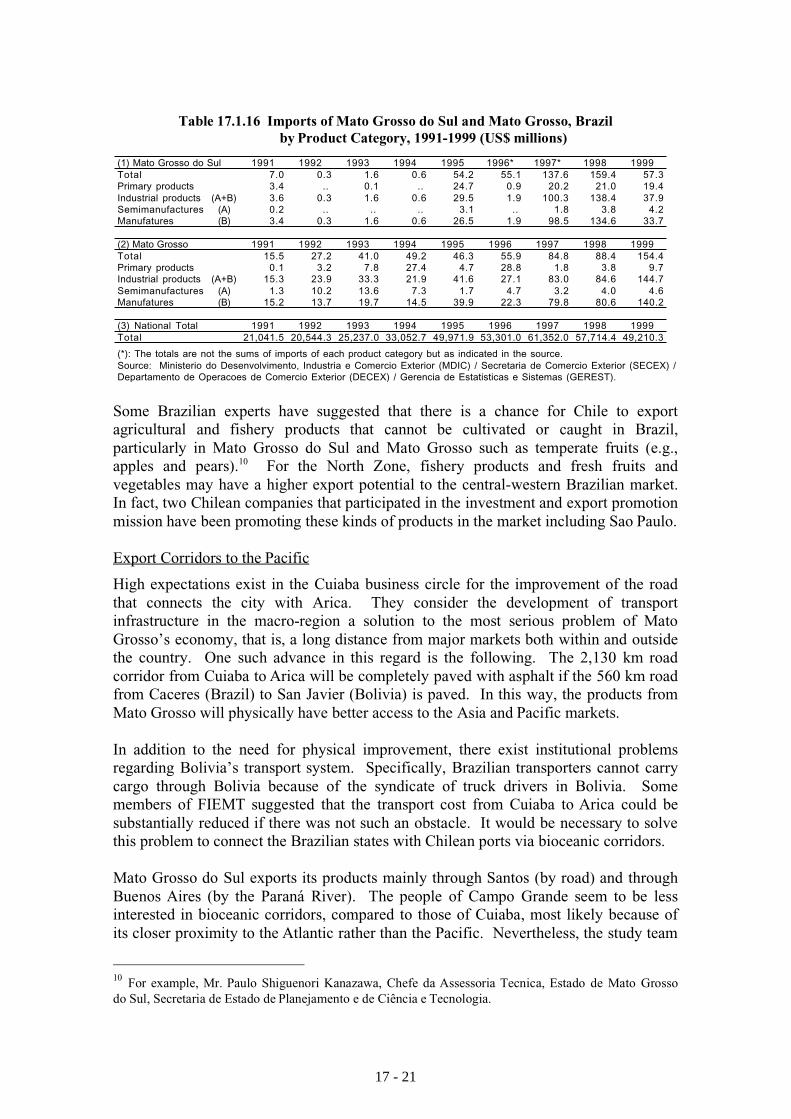
Table 17.1.16 Imports of Mato Grosso do Sul and Mato Grosso, Brazilby Product Category, 1991-1999 (US$ millions)
Some Brazilian experts have suggested that there is a chance for Chile to exportagricultural and fishery products that cannot be cultivated or caught in Brazil,particularly in Mato Grosso do Sul and Mato Grosso such as temperate fruits (e.g.,apples and pears).10 For the North Zone, fishery products and fresh fruits andvegetables may have a higher export potential to the central-western Brazilian market.In fact, two Chilean companies that participated in the investment and export promotionmission have been promoting these kinds of products in the market including Sao Paulo.
Export Corridors to the Pacific
High expectations exist in the Cuiaba business circle for the improvement of the roadthat connects the city with Arica. They consider the development of transportinfrastructure in the macro-region a solution to the most serious problem of MatoGrosso’s economy, that is, a long distance from major markets both within and outsidethe country. One such advance in this regard is the following. The 2,130 km roadcorridor from Cuiaba to Arica will be completely paved with asphalt if the 560 km roadfrom Caceres (Brazil) to San Javier (Bolivia) is paved. In this way, the products fromMato Grosso will physically have better access to the Asia and Pacific markets.
In addition to the need for physical improvement, there exist institutional problemsregarding Bolivia’s transport system. Specifically, Brazilian transporters cannot carrycargo through Bolivia because of the syndicate of truck drivers in Bolivia. Somemembers of FIEMT suggested that the transport cost from Cuiaba to Arica could besubstantially reduced if there was not such an obstacle. It would be necessary to solvethis problem to connect the Brazilian states with Chilean ports via bioceanic corridors.
Mato Grosso do Sul exports its products mainly through Santos (by road) and throughBuenos Aires (by the Paraná River). The people of Campo Grande seem to be lessinterested in bioceanic corridors, compared to those of Cuiaba, most likely because ofits closer proximity to the Atlantic rather than the Pacific. Nevertheless, the study team
10 For example, Mr. Paulo Shiguenori Kanazawa, Chefe da Assessoria Tecnica, Estado de Mato Grossodo Sul, Secretaria de Estado de Planejamento e de Ciência e Tecnologia.
(*): The totals are not the sums of imports of each product category but as indicated in the source.Source: Ministerio do Desenvolvimento, Industria e Comercio Exterior (MDIC) / Secretaria de Comercio Exterior (SECEX) /Departamento de Operacoes de Comercio Exterior (DECEX) / Gerencia de Estatisticas e Sistemas (GEREST).
17 - 21
has found that they recently received delegations from Antofagasta and Ilo, supposedlyfor port sales. Specialists are examining the routes to the Pacific not only throughBolivia (Campo Grande - Corumba - Santa Cruz - Chilean or Peruvian ports) but alsothrough Paraguay (Campo Grande - Puerto Montineo - Filadelfia - Antofagasta orIquique).
Although there appear to be some differences in the degree of interest between the twostates, those whom the study team met in Campo Grande and Cuiaba unanimouslyrecognized the importance of the “physical” integration of the macro-region, i.e., theimprovement of infrastructure and transport systems of the related countries. By suchdevelopment, they expect that the two inland states can increase the possibility to export,to receive investment and thus to diversify their economies. The same can be said aboutthe North Zone of Chile.
In recent years, the Ministries of Transport of Chile, Bolivia, Brazil, etc. are discussingissues related to the macro-regional transport systems more regularly in an effort toimprove conditions through international cooperation. A publicized example is theMontevideo Plan of Action (Action Plan for Regional Infrastructure Integration in SouthAmerica), agreed upon by the ministers of transport, telecommunications and energy ofSouth American countries in December 2000.11 This action plan aims precisely atincreased physical integration to obtain higher competitiveness and sustainability ofSouth America as a whole and is significant to the macro-region of the North Zone. Theprivate sectors of Chile and Brazil are also expected to have increased businessmeetings in coming years. At first glance, Chile and Brazil appear to conduct policiesin quite an individual manner, but it has become apparent that the public and privatesectors of both countries are more actively exchanging their ideas and plans.
(3) Argentina
Production and Export
The six provinces of Northwestern Argentina (Jujuy, Salta, Catamarca, Tucuman,Santiago del Estero, and La Rioja) are highly dependent on agriculture and mining andamong the poorest provinces in Argentina (Tables 17.1.1 and 17.1.2 above). The majorproducts of these provinces are tobacco, citrus fruits, cotton, sugarcane, vegetables,limestone, and application rocks (Table 17.1.17). La Rioja is largely occupied by aridland and its main products are wine grapes and olives.
Although mining production is important and expected to increase in these provinces inthe next 5 to 10 years, their major export products are largely agriculture-based (Table17.1.4 above). For example, Salta’s major export products are fuel and energy (naturalgas), vegetables, tobacco (unprocessed), minerals, cereals, fresh fruits (mainly citrus),leather, and cotton, whereas those of Jujuy are tobacco (unprocessed), vegetables, sugar,fresh fruits, and beverages in 1998.12 While tobacco and sugar, the main traditional
11 Technical Coordinating Committee (TCC), Inter-American Development Bank (IDB), AndeanDevelopment Corporation (CAF), and Financial Fund for the Development of the River Plate Basin(FONPLATA), “Action Plan for Regional Infrastructure Integration in South America,” Montevideo,Uruguay, 4-5 December 2000. For further information on this action plan, see Section 17.2.2.12 Information provided by the provincial government of Salta, based on INDEC data.
17 - 22
export products of the two provinces, are becoming less competitive due to diminishinggovernment support, fruits and vegetables seem to have a brighter outlook. Catamarca,Tucuman and Santiago del Estero are also highly dependent on primary products forexport (Table 17.1.18). Regarding La Rioja, manufactures of agricultural originaccount for more than half of total exports, wine being its major export product.
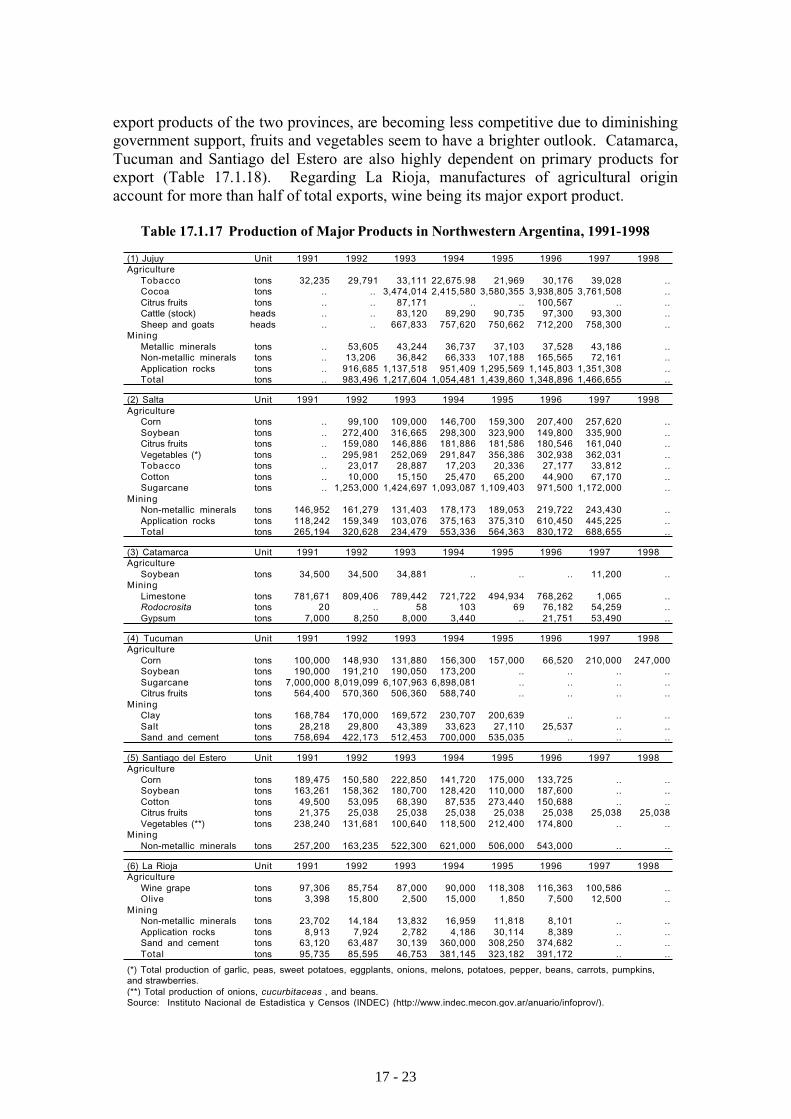
Table 17.1.17 Production of Major Products in Northwestern Argentina, 1991-1998
(*) Total production of garlic, peas, sweet potatoes, eggplants, onions, melons, potatoes, pepper, beans, carrots, pumpkins,and strawberries.(**) Total production of onions, cucurbitaceas , and beans.Source: Instituto Nacional de Estadistica y Censos (INDEC) (http://www.indec.mecon.gov.ar/anuario/infoprov/).
17 - 23
Table 17.1.18 Exports from Northwestern Argentina by Product Category, 1991-1999(fob US$ millions)
Recession and Expectations for Chilean Ports
The prolonged recession since 1998, high tax rates and the unfavorable exchange ratehave been undermining export and investment in Argentina. The president of a tradingcompany in Salta explained the situation: “We do not have a (competitive) price for anyproduct.” They have also stopped importing, mainly consumer goods, through ZOFRIsince mid-2000 due to the recession, as well as to some nontransparent customsoperations in Buenos Aires (i.e., import prices through the Argentine port have becomelower than those through ZOFRI). That is, the Argentine economic situation hasadversely affected the market potential for Chilean goods and services.
Under these circumstances, the two provinces are anxiously anticipating that thecompletion of the roads to the Chilean ports, i.e., Antofagasta, Iquique, and futureMejillones in particular, will reduce the transport costs thereto and thus bring about a
(*) Preliminary figures.Note: Some totals are not be the sum of figures indicated in each product category.Source: Instituto Nacional de Estadistica y Censos (INDEC) (http://www.indec.mecon.gov.ar/anuario/infonacio/); and INDEC dataprovided by the Provincial Government of Salta.
17 - 24
considerable increase in their exports to the Asian market. The prevailing transportcosts for commodities (e.g., soybean grains) by railroad are unfavorable to the Chileanports as indicated below.
While Jujuy is hurrying to pave the road from its provincial capital to Jama Path(between the Province of Jujuy and the Region of Antofagasta), Salta places greateremphasis on the construction of the road through Sico Path (between the Province ofSalta and the Region of Antofagasta) and the rehabilitation of the railroad toAntofagasta as its export corridors. The Chilean Ministry of Public Works hasprioritized both paths, together with 11 other paths on the border with Argentina, toaccelerate commercial integration between the two countries.13
In addition to trade expansion, these roads will facilitate the promotion of tourismcurrently underway on both sides of the border. As the Provinces of Salta and Jujuyexpect for their own tourism, the Region of Antofagasta, which includes the AtacamaDesert, will be more attractive to international tourists with easier transport across theAndes. Better coordination and cooperation among these regions/provinces will benefitboth sides. The provincial government of Salta expects that the regular flight servicesbetween Salta and Antofagasta/Iquique, started in December 2000, will also increasethe flow of business peoples between their province and the two Chilean regions in thefuture. According to their estimate, however, they are likely to transport mainly touristsin the initial stage.
Regional Integration and Free Trade Zones
There is a subtle difference between Salta and Jujuy concerning ZICOSUR activities.Salta hosted the second meeting in October 1998 and is eager to move towards regionalintegration through cooperation among the member regions/provinces/states ofZICOSUR, while Jujuy has somewhat separated itself from the integration scheme. Thedifference is due partially to the origin of ZICOSUR. As mentioned in the section onBolivia, the scheme was created by the public sector but originated from GEICOS,which was formed in Salta in 1975 by private enterprises seeking new markets.14
Nevertheless, both provinces consider themselves located at the crossroads of SouthAmerica and plan to establish free trade zones respectively (Salta’s free trade zone hasbeen legally instituted by private initiatives but yet to be physically established inGeneral Martin Miguel de Guemes, located 25 km northeast of Salta). The provincialgovernment of Jujuy is considering the establishment of a “primary customs zone” thatwill provide various services related to import-export activities at one place (e.g.,customs, quarantine, immigration, transport, banking and so on). This kind of one-stopservice center appears to be more relevant, and realistic, in these inland provinces. Inparticular, the situation in which two free trade zones exist only 60 km apart from each
13 La Tercera, August 14, 2000.14 FIEMT, “Experiencia Empresarial de Mato Grosso no Processo de Integracao do Centro Oeste Sul-Americano,” http://www.sice.oas.org/Ftaa/belo/forum/workshops/papers/wks1/fiemtp.asp.
17 - 25
other will not be favorable to either zone.
Both provinces are seeking to receive more foreign direct investment by providinginvestors with some incentives (e.g., exemption of income taxes and import duties),especially for manufacturing activities. There are four industrial parks around SanSalvador de Jujuy, one in the suburbs of Salta, and another to be established in GeneralGuemes. The occupancy rates of the existing parks are less than 30% and most of thefactories in the Industrial Park of Salta have been shut down. The inactivity of theseindustrial parks can be partially explained by the recession of the national economy. Itcan also be presumed that the factories (e.g., textile, food processing, cement, etc.) thatwent out of business were not competitive internationally because the closures occurredprimarily in the mid-1990s, when Argentina shifted more towards an open economy.
Markets for Chilean Goods and Services
Potential areas in the Argentine market for the North Zone’s goods and services are notobvious, except for port services provided by the Ports of Antofagaasta and Iquique.The consumer goods market of Salta and Jujuy, at least of the two provincial capitals,are filled with imported products and those manufactured in southern industrial cities,e.g., Buenos Aires, Cordoba, and Santa Fe. Low-priced consumer goods sold insupermarkets, particularly electric home appliances, are largely made in China and otherAsian countries. Consumer goods are also imported from other Latin Americancountries such as Brazil and Mexico.
A potential area for Chilean exports to these provinces seems to be mining-relatedmanufacturing and services, though further research is necessary to find whethercompanies in the North Zone are competitive vis-à-vis companies based in other zonesof Chile and companies of other countries. The Antofagasta Regional Offices ofProChile and CORFO have jointly conducted a study to find potential customers forChilean mining-related companies.15 The export potential of Chile’s mining-relatedmanufacturing and services to Argentina are further discussed in Section 17.4.2.
A provincial government official of Salta contended that human resource developmentwould become the most important factor for regional integration upon the improvementof transport infrastructure: “Integration will mean nothing to us if there are no export-oriented human resources.” Such people are most needed in the fields of managementand business administration. This may imply future opportunities for Chileanuniversities that are competitive in these fields, though Argentine national universitiesmay currently be more attractive to students due to lower tuitions.
In conclusion, the Argentine market does not appear to be highly promising for the nextfew years because of the prolonged recession and the low confidence of business people,those not only of Argentina but also of Chile and other neighboring countries, regardingthe market. From a long-term perspective, however, there is potential for goods andservices to be exported from the North Zone in some fields, e.g., mining-relatedmanufacturing and services, tourism, higher education and business training, etc., inaddition to port services.
15 Nivaldo Rojas et al., “Estudio de Mercado: Minería Argentina,” February 2000.
17 - 26
(4) Peru
The Peruvian market is even more important than other markets in the macro-region forthe North Zone, though the JICA team was not able to visit Peru due to the country’spolitical turmoil. This is not merely because of the advantages in distance and physicalaccessibility to the market, but also interviews with business people in Arica haverevealed that it is less “difficult” to do business with Peruvians than with Bolivians,while the historical backgrounds of Chile’s bilateral (national) relations are similar forthe two neighboring countries (e.g., wars in the 19th century).16 There are somerestrictions and control over the importation of certain types of products, but for themost part, Chilean products can still enter the market. For example, the Peruviangovernment imposes import duties on chicken, whereas only processed chicken can beexported to Bolivia. Another factor that may facilitate the North Zone’s business withPeru is that some people of the zone, Arica in particular, have roots in Southern Peru.
The variety of industries in Southern Peru, i.e., mining and tourism in Arequipa,agriculture in Moquegua, commerce in Tacna, offers a potential for the future economicdevelopment of the North Zone, especially as a gateway to the Pacific. Although recentdata is not available, Table 17.1.19 shows major products of Southern Peru.17 Theimportance of these hinterlands will become clearer when one looks at the developmentof Singapore, which could not have become the main gateway of Southeast Asiawithout the industrial and economic development of its neighboring countries such asMalaysia, Indonesia and Thailand. It is thus desirable to study further, and regularly,the situation and outlook of these departments.
Table 17.1.19 Production of Major Products in Departments of Southern Peru, 1994
The short-term outlook of the macro-regional market for the North Zone may not seemto be bright, but an important conclusion drawn from the field visits and data analysis isthat the macro-region is dynamically moving towards wider and deeper economicintegration. It is therefore important to grasp opportunities to be realized as a result ofincreased integration by preparing for future needs with a long-term perspective,specifically in areas such as infrastructure development and information and knowledgeexchange.
16 Based on interviews with some Arica-based businesses that are exporting to Peru, including poultry,confectionery and mining-related engineering services and manufacturing.17 The study team tried to obtain such data through the Internet but did not succeed in getting access to theelectric library of the National Institute of Statistics and Information (http://www.inei.gob.pe/).
Unit Arequipa Moquegua Puno Tacna National TotalAgriculture