Page 1
Get Homework/Assignment Done Homeworkping.comHomework Help https://www.homeworkping.com/
Research Paper helphttps://www.homeworkping.com/
Online Tutoringhttps://www.homeworkping.com/
click here for freelancing tutoring sitesEXECUTIVE SUMMARY
Markets have always played a central role in the economic development and ensuring orderly
conduct of markets had been a constant endeavor various theories have provided an essential back drop to analyze
and understand market behavior. In the case of financial markets, the prominent ones are. Efficient market
hypothesis agency theory and information theory. Whenever the assumptions of these theories are not met fully
there begins a case for regulation. The key concerns of financial market regulators are market integrity systemic
safety and customer protection. These three concerns are inter wined and inter related.
As it is evident from the growth pattern of the international markets that develop countries have
maintained their position, while the emerging markets are also coming forward with full strength. A few
prominent emerging trends are the investors are becoming more market savvy information and communication
technology is revolutionizing the way transactions are carried out world is becoming a financial village
emergence of trans-national business demands better coordination among regulators etc. In the future Indian
markets are expected to become more vibrant and attain a leading position in the global financial system. With
1
Page 2
increasing role of information and communication technology information asymmetry is expected to reduce at an
increasing rate organized exchanges are likely to become one-stop financial shopping malls.
The committee has noted recent introduction of new products based on its interim recommendations and it
has further recommended widening the range of new products. It is expected that these new products, namely
mini contracts on equity index, options contract with longer life/tenure creation of volatility index and futures and
options contracts on it, options on futures, creation of bond indexes and futures and options contracts on them,
exchange traded currency [foreign exchange] futures and options contracts, exchange –traded products involving
different strategies, exchange traded credit derivatives over the count or product and exchange traded third party
products will be able to meet the needs of various classes of investors. Each class of these products needs to be
carefully designed and risk management specified by the exchanged with due approval by SEBI.
Finally the committee feels that while the small individual investors could best protect their investments by
hedging their positions in options market, they should carefully consider taking positions on futures markets
because mark-to-market losses resulting in margin calls could wipe out small individual investors.
2
Page 3
INTRODUCTION:
DERIVATIVES:
A Derivative is a financial instrument that derives its value from an underlying asset. Derivative is an
financial contract whose price/value is dependent upon price of one or more basic underlying asset, these
contracts are legally binding agreements made on trading screens of stock exchanges to buy or sell an asset in the
future. These assets can be anything ranging from share, index, bond, rupee dollar exchange rate, sugar crude,
soya bean, cotton, coffee etc.
Derivative on its own does not have any value. It is considered important because of its underlying asset.
Derivatives can of different types like forwards, futures, option, swaps, collars, caps, floor etc. The most popular
derivative instruments are futures and options.
Example:
A very simple example of derivative is curd, which is derivative of milk. The price of curd depends upon
the price of milk, which in turn depends upon the demand, and supply of milk. Let’s see it in this way, the price of
the Reliance Triple Option Convertible debentures (Reliance TOCD) varies upon the price of the Reliance Shares,
similarly the price of TELCO Warrants depends upon the price of the TELCO shares.
The American Depository Receipts (ADR) and Global Depository Receipts (GDR) Of ICICI, Satyam and
Infosys Traded on stock exchanges in NASDAQ of USA, draw their values from the prices of shares traded in
India. Similarly in mutual funds the prices of mutual fund units depends upon the prices of portfolio of securities
under that scheme.
History of Derivatives
The Derivatives market has existed from centuries as need for both users and producers of natural
resources to hedge against price fluctuations in underlying commodities. Although trading in agriculture and other
commodities has been the driving force behind the development of Derivatives market in India, the demand for
products based on financial instruments – such as bond, currencies, stocks and stock indices had outstripped the
commodities markets.
India has been trading in derivatives market in Silver, spices, gold, coffee, cotton and in oil markets for
decade’s gray market. Trading in derivatives market was legal before Morarji Desai’s Government had banned
forward contracts. Derivatives on stocks were traded in the form of Teji and mandi in unorganized markets.
Recently futures contracts various commodities were allowed to be on various exchanges. For Example Cotton
3
Page 4
and Oil futures were traded in Mumbai, Soya bean futures in Bhopal, Pepper futures in Kochi, Coffee futures in
Bangalore etc.
In June 2000, National stock exchange and Bombay stock exchange started trading in futures in Sensex
and Nifty. Options trading on Sensex and Nifty commenced in June 2001. Very soon thereafter trading began on
futures and options on 31 prominent stocks in the month of July and November respectively, currently there are
41 stocks trading in NSE derivatives and the list keeps growing.
Derivatives products initially emerged has hedging devices against fluctuations in commodity prices and
commodity linked derivatives remained the sole form of such products for almost three hundred years. The
financial derivatives came into spotlight in post 1970 period, due to the in stability in the financial markets.
Financial derivatives are instruments that their value from financial assets. These assets can be stocks,
bonds, currency etc. These Derivatives can be Forward rate agreements, Futures, Options, and Swaps. As stated
earlier the most traded instruments are futures and options. However these products became very popular and by
1990s, they accounted for about two-thirds of total transactions in derivatives products. In recent years, the market
for financial derivatives has grown tremendously.
Both in terms of variety of instruments available, their complexity and also turnover. In class of equity
derivatives, futures and options on stock indices have gained more popularity than on individual stocks, especially
among the institutional investors, who are major users of index-linked derivatives. Even small investors find these
useful due to high correlation of popular indices with various portfolios and ease of use.
The following factors have been driving the growth of financial derivatives:
Increased volatility in asset prices in financial markets.
Increased integration of national financial markets with the international markets.
Marked improvement in communication facilities and sharp decline in their costs.
Innovations in the derivatives markets, which optimally combine the risks and returns over a large
number of financial assets, leading to higher returns, reduced risks as well as transactions costs as
compared to individual financial assets.
PLAYERS IN THE MARKET
The following are the players in the Derivatives markets:
Speculators:
4
Page 5
People who buy or sell in the market to make profits. For example, if you will the stock price of
Reliance is expected to go up to Rs. 400 in one month; one can buy a one-month future of Reliance at Rs. 350 and
make profits.
Hedgers:
People who buy or sell to minimize their losses. For example, an importer has to pay US $ to buy goods
and rupee is expected to fall to Rs.50/$ from Rs.48/$, then the importer can minimize his losses by buying a
currency future at Rs.49/$.
Arbitrageurs:
People who buy or sell to make money on price differentials in different markets. For example, a futures
price is simply the current price plus the interest cost. If there is any change in the interest, it presents an arbitrage
opportunity. We will examine this in detail when we look at futures in a separate chapter. Basically, every
investor assumes one or more of the above and derivatives are a very good option for him.
TYPES OF DERIVATIVES
The most commonly used derivatives contracts are forwards, futures and options, which we shall discuss
in detail later. Here we take a brief look at various derivatives contracts that have come to be used.
Forwards:
A forward contract is a customized contract between two entities, where settlement takes place on
specific date in the future at today’s pre-agreed price.
Futures: A futures contract is an agreement between two parties to buy or sell an asset at a certain time
in the future at a certain price. Futures contracts are special types of forward contracts in the sense that
the former are standardized exchange-traded contracts.
Options:
Options are of two types
Call option
Put option
Call option:
Call option gives the buyer the right but not the obligation to buy a given quantity of the underlying
asset, at a given price on or before a given future date.
5
Page 6
Put option:
Put option gives the buyer the right, but not the obligation to sell a given quantity of the underlying asset
at a given price on or before a given date.
Warrants:
Options generally have lives of unto one year, the majority of options traded on options exchanges
having a maximum maturity of nine months. Longer-dated options are called warrants and are generally traded
over the years.
Baskets:
Basket options are on portfolios of underlying assets. The underlying asset is usually a moving average or
a basket of assets. Equity index options are a form of basket options
Swaps:
Swaps are private agreements between two parties to exchange cash flows in the future according to a
prearranged formula. They can be regarded as portfolios of forward contracts. The two commonly used swaps are:
Interest rate swaps:
These entail swapping only the interest related cash flows between the parties in the same currency.
Currency swaps:
These entail swapping both principal and interest between the parties, with the cash flows in one direction
being in a different currency than those in the opposite direction.
6
Page 7
NEED OF THE STUDY
The turnover of the stock exchange has been tremendously increasing from last 10 years. The
number of trades and the number of investors, who are participating, have increased. The investors are
willing to reduce their risk, so they are seeking for the risk management tools.
Prior to SEBI abolishing the BADLA system, the investors had this system as a source of
reducing the risk, as it has many problems like no strong margining system, unclear expiration date and
generating counter party risk. In view of this problem SEBI abolished the BADLA system.
After the abolition of the BADLA system, the investors are seeking for a hedging system, which
could reduce their portfolio risk. SEBI thought the introduction of the derivatives trading, as a first step it
has set up a 24 member committee under the chairmanship of Dr. L.C. Gupta to develop the appropriate
framework for derivatives trading in India, SEBI accepted the recommendation of the committee on may
11, 1998 and approved the phase introduction of the derivatives trading beginning with stock index
futures.
There are many investors who are willing to trade in the derivatives segment, because of its
advantages like limited loss unlimited profit by paying the small premiums.
SCOPE OF THE STUDY:
The study is limited to “Risk Return Analysis of Futures & Options” with special reference to
futures and option in the Indian context and the Inter-Connected Stock Exchange has been taken as a
representative sample for the study. The study can’t be said as totally perfect. Any alteration may come.
The study has only made a humble attempt at evaluation derivatives market only in India context. The
study is not based on the international perspective of derivatives markets, which exists in NASDAQ,
CBOT etc.
OBJECTIVE OF THE STUDY
To study the benefits of Futures and Options in Indian Market.
To study the functioning of futures & options in financial market.
7
Page 8
To make decisions of the shareholders in overcoming by investing in futures and
options
To study & compare the returns on inviting in future options.
To study the different ways of buying and selling of options.
To study the role of derivatives in India financial market.
LIMITATIONS OF THE STUDY:
The following are the limitation of this study.
The study of this project is limited to only 45 days.
The major limitation of this project is time fact.
The scrip is selected for analysis through secondary data so the analysis cannot be taken as
universal.
8
Page 9
DESCRIPTION OF THE METHODOLOGY:
The following are the steps involved in the study.
1. Selection of the scrip:-
The scrip selection is done on a random and the scrip selected is AIR DECCAN, BHARATI
AIRTEL, and WIPRO. Risk & return Involved in the Futures contracts & option Contract.
2. Data Collection:-
The data of the AIR DECCAN, BHARATI AIRTEL, and WIPRO has been collected from the
web site of National Stock Exchange i.e. “www.nseindia.com”. The data consist of the March
contract and the period of data collection is from 1st February 2012 – 31st March 2012.
9
Page 10
3. Analysis:-
The analysis consist of the tabulation of the data assessing the Risk & Return of Futures
Contracts & Option Contracts, representing the data with graphs and making the interpretation using
data.
INDUSTRY PROFILE
HISTORY OF STOCK EXCHANGE:
The only stock exchange operating in the 19th century were those of Bombay set up in
1875 and Ahmadabad set up in 1894. These were organized as voluntary non profit-making
association of brokers to regulate and protect their interests. Before the controls on securities
trading became central subject under the constitution in 1950, it was a state subject and the
Bombay securities contracts (control) Act of 1925 used to regulate trading in securities. Under
this act, the Bombay stock was recognized in 1927 and Ahmadabad in 1937.
During the war boom, a number of stock exchanges were organized in Bombay,
Ahmadabad and other centers, but they were not recognized. Soon after it became a central
subject, central legislation was proposed and a committee headed by A.D Gorwala went into the
bill for securities regulation. On the basis of the committee’s recommendations and public
discussion, the securities contracts (regulation) Act became law in 1956.
DEFINATION OF STOCK EXCHANGE:
10
Page 11
“Stock exchange means anybody or individuals whether incorporated or not, constituted
for the purpose of assisting, regulating or controlling the business of buying, selling or dealing in
securities.”
It is an association of member brokers for the purpose of self-regulation and protecting the
interests of its members.
It can operate only. If that Government under securities recognizes it contracts (regulation) Act
1956.The recognition is granted under section 3 of the act by the central government, ministry of
Finance.
NEED FOR STOCK EXCHANGE:
As the business and industry expanded and economy became more complex in nature, a
need for permanent finance arose. Entrepreneurs require money for long-term needs, where as
investors demand liquidity. The solution to this problem gave way for the origin of ‘Stock
Exchange’, which is a ready market for investment and liquidity.
FUNCTIONS OF STOCK EXCHANGE:
Maintains Active Trading:
Shares are traded on the stock exchanges, enabling the investors to buy and sell securities.
The prices may vary from transaction to transaction. A continues trading increases the liquidity or
marketability of the shares traded on the stock exchanges.
Fixations of prices:
Prices are determined by the transactions that flow from investors demand and the supplies
preferences. Usually the traded prices are named known to the public. This helps the investors to
make better decisions.
Ensures safe and fair dealings:
The rules, regulations and bye laws of the stock exchanges provide a measure of safety to the
investors to get a fair deal.
Aids in financing the industry:
A continuous market for shares provided a favorable climate for raising capital. The negotiability
and transferability of the securities help the companies to raise long-term funds. As it is easy to
trade the securities, investors are willing to subscribe the Initial public offerings (IPO). This
stimulates the capital formation.
Dissemination of Information:
11
Page 12
Stock Exchange provides information through their various publications. They publish the share
prices traded on their basis along with the volume traded. Directory of corporate information is
useful for the investor’s assessment regarding the corporate. Handouts and pamphlets provide
information regarding the functioning of the stock exchanges.
Performance inducers:
The prices of stocks reflect the performance of the traded companies. This makes the corporate
more concerned with its public image and tries to maintain good performance.
Self-regulating organizations:
The stock exchanges monitor the integrity of the members, brokers, listed companies and clients.
Continuous internal audit safeguards the investors against unfair trade practices. It settles the
disputes between member broker, investors and brokers.
The national stock Exchange (NSE) of India became operational in the capital market segment on
3rd November 1994 in Mumbai. The genesis of NSE lies in the recommendations of the pertains
committee 1991. A part from the NSE, it had recommended for the establishment of national
stock market system also. The committee pointed out some major defects in the Indian stock
market. The Defects specified are
1. Lack of infrastructure facilities and outdated trading system.
2. Lack of transparency in the operations that effect investor’s confidence.
3. Out dated settlement systems that are inadequate to cater to the growing volume, leading to
delays.
4. Lack of single market due to inability of various stock exchanges to function cohesively with
legal structure and regularity framework.
These factors led to the establishment of the NSE.
OBJECTIVES:
1. To establish a nationwide trading facility for equities, debt instruments and hybrids.
2. To ensure equal access investors all over the country through appropriate communication
network.
3. To provide a fair, efficient and transparent securities market to investors using an electronic
communication network.
4. To enable shorter settlement cycle and book entry settlement system.
5. To meet current international standards of securities market.
PROMOTERS:
12
Page 13
Industrial Development Bank of India (IDBI)
Industrial Credit and Investment Corporation of India (ICICI)
Industrial Financing Corporation of India (IFCI)
Life Insurance Corporation of India (LIC)
State Bank of India (SBI)
General Insurance Corporation (GIC)
Bank of Baroda
Canara Bank
Corporation Bank
Indian Bank
Oriental Bank of Commererce
Union Bank of India
Punjab National Bank
Infrastructure Leasing and Financial Services
Stock Holding Corporation of India
SBI capital market
MEMBERSHIP:
The membership is based on the factors as capital adequacy, corporate structure, Track
record, Education, Experience etc.Admission is a two-storage process with applicants required to
go through a written examination followed by an interview. A committee consisting of
experienced professionals from the industry, to access the applicant’s capability to operate as an
exchange member. The exchange admits members separately to whole sale debt market (WDM)
segment and the capital market segment. Only corporate members are admitted to the debt market
segment where as individuals and firms are also eligible to the capital market segment.
Eligibility criteria for trading membership on the segment of WCM are as follows:
1. The person eligible to become trading members are bodies corporate, companies, institutions
including subsidiaries of banks engaged in financial services and such other persons or entities
are may be permitted from time to time by RBI\SEBI.
2. The Whole-Time Directors should possess at least two years experience in any activity related
to banking or financial services.
3. The applicant must be engaged solely in the business of the securities and must not be engaged
in any fund-based activities.
4. The applicant must possess a minimum of Rs.2crores.
13
Page 14
Eligibility criteria for the capital market segment are:
1. Individual, registered firms, corporate bodies, companies and such other persons may be
permitted under the SCR Act, 1957.
2. The applicant may be engaged in the business of securities and must not be engaged in any
fund-based activities.
3. The minimum net worth requirements prescribed are as follows:
Individuals and registered firms-Rs.75Lakhs.
Corporate bodies-Rs100Lakhs
In case of partnership firm each partner should contribute at least 5% of the net
worth of the firm.
4. A corporate trading member should consist only of individuals (maximum of 4)
Who should directly hold at least 40% of the paid-up capital in case of listed companies and at
least 51% in case of these companies.
5.The minimum prescribed qualification of graduation and two years experience of handling
securities as broker , Sub-broker, authorized assistant etc.,must be fulfilled by
Minimum two directors in case the applicant are a corporate
Minimum two partners in case of partnership firms
In case of individual or sole proprietary concerns. The two experienced directors in a corporate
applicant or trading member should hold minimum 5% of the capital of the company.
MARK-TO-MARKET MARGIN AND INTRADAY LIMIT
Under the current clearing and settlement system, if an Indian investor buys and
subsequently sells the same number of shares of stock during a settlement period, or sells and
subsequently buys, it is not necessary to take. Or deliver the shares. The difference between the
selling and buying prices can be paid or received .In other words, the squaring –off of the trading
position during the same settlement period results in non-delivery of the shares that the investor
traded.
Thus, possible at a relatively low cost.FII’s and domestic institutional increasing Number of no
delivery transactions as the stock market becomes excessively speculative. Accordingly, SEBI
has introduced a daily mark-to-market margin and intraday trading limit. The daily market-to-
14
Page 15
market margin is a margin on a broker’s daily position. The intraday trading limit is the limit to a
broker’s intraday trading volume. Every broker is subject to these requirements.
Each stock exchange may take any other measures to ensure the safety of the market.BSE and
NSE impose on members a more stringent daily margin, including one based on concentration of
business .A daily mark-to-market margin is 100 percent of the notional loss of the stockbroker for
every stock, calculated as the difference between buying or selling price and the closing price of
that stock at the end of that day. However, there is a threshold limit of 25 percent of the base
minimum capital plus additional capital kept with the stock exchange or Rs 1 million, whichever
is lower. Until the notional loss exceeds the threshold limit, the margin is not payable.
This margin is payable by a stockbroker to the stock exchange in cash or as a bank guarantee
from a scheduled commercial bank, on a net basis. It will be released ion the pay-in day for the
settlement period .The margin money is held by the exchange for 6-12 days.
This cost the broker about 0.4-1.2 percent of the notional loss, assuming that the
broker’s funding cost is about 24-36 percent. Thus Speculative trading without the delivery of
shares is no longer cost-free. Each broker’s trading volume during a day is not allowed to exceed
the intraday trading limit. This limit is 33.3 times the base minimum capital deposited with the
exchange on a gross basis.
i.e., purchase plus sale. In the event of brokers wishing to exceed this limit, they have to deposit
additional capital with the exchange and this cannot be withdrawn for six months.
NEATSYSTEM:
Neat IS A STATE-OF-THE- ART CLIENT SERVER BASED APPLICATION. At the
server end, all trading information is stored in an in-memory database to achieve minimum
response time and maximum system availability for users. Each trading member trades on the
NSE with other members through a PC located in the trading member’s office, anywhere in India.
The trading members on the Wholesale Debt Market segment are linked to the central computer
at the NSE through dedicated 64Kbps leased lines and VSAT terminals. These leased lines are
multiplexed using dedicated 2 Mbps, optical-fiber links. The WDM participants connect to the
trading system through dial-uplinks.
NSE is one the largest interactive VSAT based stocked exchange in the world. Today
it supports more than 3000 VSATs and is expected to grow to more than 4000 VSATs in the next
year. The NSE – network in the world. Currently more than 9000 users are trading on the real
time-online NSE application. There are over 15 large computer systems.
15
Page 16
INDICES
An Index is used to give information about the price movements of products in the
financial, commodities or any other markets. Financial indexes are constructed to measure price
movements of stocks, bonds-bills and other forms of investments. Stock market indexes are
meant to capture the overall behavior of equity markets. A stock market index is created by
selecting a group of stock that are representative of the whole market or a specified sector or
segment of market. An Index is calculated with reference to a base period and base index value.
Stock market indexes are useful for a Varity of reasons. Some of them are
They provide a historical comparison of returns on money invested in the stock
market against other forms of investments such as gold or debt.
They can be used as a standard against which to compare the performance of an
equity fund.
It is a lead indicator of the performance of the overall economy or a sector of the
economy
Stock indexes reflect highly up to date information
Modern financial applications such as Index Funds, Index Futures, Index Options
play an important role in financial investments and risk management
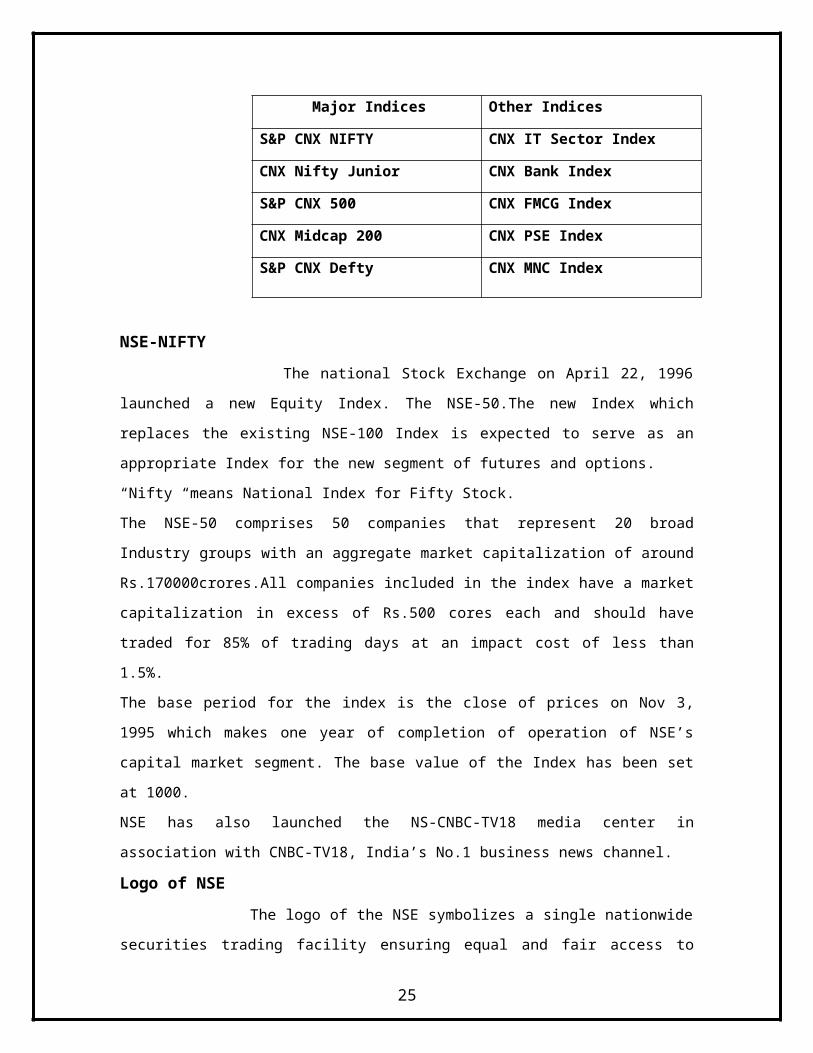
Major Indices Other Indices
S&P CNX NIFTY CNX IT Sector Index
CNX Nifty Junior CNX Bank Index
S&P CNX 500 CNX FMCG Index
CNX Midcap 200 CNX PSE Index
S&P CNX Defty CNX MNC Index
NSE-NIFTY
The national Stock Exchange on April 22, 1996 launched a new Equity Index. The
NSE-50.The new Index which replaces the existing NSE-100 Index is expected to serve as an
appropriate Index for the new segment of futures and options.
“Nifty “means National Index for Fifty Stock.
16
Page 17
The NSE-50 comprises 50 companies that represent 20 broad Industry groups with an aggregate
market capitalization of around Rs.170000crores.All companies included in the index have a
market capitalization in excess of Rs.500 cores each and should have traded for 85% of trading
days at an impact cost of less than 1.5%.
The base period for the index is the close of prices on Nov 3, 1995 which makes one year of
completion of operation of NSE’s capital market segment. The base value of the Index has been
set at 1000.
NSE has also launched the NS-CNBC-TV18 media center in association with CNBC-TV18,
India’s No.1 business news channel.
Logo of NSE
The logo of the NSE symbolizes a single nationwide securities trading facility ensuring
equal and fair access to investors, trading members and issuers all over the country. The initials
of the Exchange viz., N, S and E have been etched on the logo and are distinctly visible. The logo
symbolizes use of state of the art information technology and satellite connectivity to bring about
the change within the securities industry. The logo symbolizes vibrancy and unleashing of
creative energy to constantly bring about change through innovation.
Mission OF NSE
NSE’s mission is setting the agenda for change in the securities markets in the India. The
NSE was set-up with the main objective of:
Establishing a nation-wide trading facility for equities, debt instruments and hybrids,
Ensuring equal access to investors all over the country through an appropriate
communication network.
Providing a fair , efficient and transparent securities market to investors using
electronic trading systems,
Enabling shorter settlement cycles and book entry settlements systems, and
Meeting the current international standards of securities markets.
The standards set by NSE in terms of market practices and technologies have become industry
benchmarks and are being emulated by other market participants.NSE is more than a mere market
facilitators. It’s that force which is guiding the industry towards new horizons and greater
opportunities.
17
Page 18
Corporate Structure:
NSE is one of the first de-mutualised stock exchanges in the country, where the ownership
and management of the Exchange is completely divorced from the right to trade on it. Though the
impetus for its establishment came from policy makers in the country, it has been set up a public
limited company, owned by the leading institutional investors in the country. From day one, NSE
has adopted the form of a demutualised exchange the ownership, management and trading is in
the hands of three different sets of people.NSE is owned by a set of leading financial institutions,
banks, insurance companies and other financial intermediaries and is managed by professionals,
who do not directly or indirectly trade on the Exchange. This has completely eliminated any
conflict of interest and helped NSE in aggressively pursuing policies and practices within a public
interest framework. The NSE model however, does not preclude, but in fact accommodates
involvement, support and contribution of trading members in a variety of ways. Its Board
companies of senior executives from promoter institutions, eminent professionals in the fields of
law, economics, accountancy ,finance, taxation, etc, public representatives, nominees of SEBI
While the Board deals with broad policy issues, decisions relating to market operations are
delegated by the Board to various committees constituted by it. Such committee includes
representatives from trading members, professionals, the public and management. The day-to-day
management of the Exchange is delegated to the Managing Director who is supported by a team
of professional.
Committees:
The Exchange has constituted various committees to advise it on areas such as good
market practices, settlement procedures, risk containment systems etc.Industry professionals
manage these committees, trading members, Exchange staff as also representatives from the
market regulator.
Executive Committee
Committee On Trade Related Issues(COTI)
SECURITITIES AND EXCHANGE BOARD OF INDIA
SEBI’S ROLE IN A STOCK EXCHANGE
18
Page 19
The SEBI was established on April 12, 1998 through an administrative order, but it
became a statutory and really powerful organization only since 1992.The SEBI is under the
overall control of the Ministry of Finance, and has its head office at Mumbai.
The philosophy underlying the certain of the SEBI is that multiple regulatory bodies for securities
industry mean that the regulatory system gets dividend, causing confusion among market
participants as to who is really in command. In a multiple regulatory structure, there is also an
overlap of functions of different regulatory bodies .Through the SEBI, the regulation model
which is sought to be put in place in India is one in which every aspect of securities market
regulation is entrusted to a single highly visible and independent organization, which is backed by
a statute, and which is accountable to the parliament and in which investors can have trust.
POWER, SCOPE, AND FUNCTIONS OF SEBI:
The scope of operations of the SEBI is very wide; it can frame or issue rules,
regulations, directives, guidelines, norms in respect of both primary and secondary markets, and
certain financial institutions.
The SEBI is empowered to register any agency or intermediary who may be associated
with the securities market and none of them shall by, sell or deal in securities except under and in
accordance with the conditions of certificate of registration issued by the SEBI.
The SEBI can suspend or cancel a certificate of registration issued by it to anyone after
giving him a reasonable opportunity of being heard.
However, in exercise of its powers and in performing its functions, such directions on
questions of policy bind the SEBI as the GOI may give in writing from time to time. Although it
has the opportunity to express its views before any direction is given, the decision of the GOI is
final in every case.
19
Page 20
COMPANY PROFILE:
ZEN SECURITIES LTD:
Zen Securities Limited (ZSL) is one of the leading financial services company -
providing Financial and Investment related Services and Products. The Company commenced as
a proprietary concern of M/s K. Ravindra Babu in 1986 was converted to a Limited company in
February 1995 as Zen Securities Ltd. Zen has the distinction of being the First Corporate Member
from Hyderabad and also the first A.P. based broking firm to start trading on the National Stock
Exchange (NSE). ZEN is a registered Member on the Capital Market Segment and Futures &
Options segment of both NSE and BSE.
ZEN is also a Depository Participant (DP) with National Securities Depository Ltd.
(NSDL) and also with Central Depositories Services Ltd. (CDSL). ZEN is also a SEBI Registered
Portfolio Manager offering Portfolio Management Services to clients.
In 29-08-2008 Zen Securities lanches brand name as ZEN MONEY LTD.
Zen Comtrade Pvt. Limited:
A 100% subsidiary of ZSL and is a member of National Commodities & Derivatives
Exchange Limited (NCDEX) and Multi Commodity Exchange (MCX). ZEN operates from
Hyderabad as it head office and has branches and associates in Andhra Pradesh, Tamil Nadu,
Maharashtra, Karnataka, West Bengal and Orissa. The Company operates from over 140
locations with over 500 trading terminals.
Services Offered by Zen Securities Limited:
20
Page 21
Investment advisory services
Trading in cash market of NSE and BSE
Trading in Futures and Options on NSE and BSE
Internet Trading in Stocks, futures and Options both NSE and BSE
Mutual Funds advisory service
Depository Services in Both NSDL and CDSL
Trading in Commodities on MCX and NCDEX
Portfolio Management Services
NRI Investor Services
PAN Application Service
Mutual Fund KYC Registration Service
Fixed Income Securities / Fixed Deposits / RBI Bonds / Tax Saving Bonds
FOUNDER:
Shri Ravindra Babu Kantheti founded Zen Securities Ltd as a stock broking company and led its
evolution into a highly respectable financial services company known for its ethics and values.
He passionately believed that one can be successful in business without compromising on ethics.
Thru Zen he demonstrated this philosophy and inspired every one of us by setting an example.
His ethical, transparent and trustworthy approach to business has inspired all of us to build a very
vibrant, successful and strong organization.
We at Zen totally rededicate ourselves to continue to build the organization on sound foundations
of trust, values and relationship with clients, servicing their investment needs as set out by our
founder Sri K.Ravindra Babu.
The board of directors of Zen Securities Ltd has appointed Mr Pratap Kantheti and Mr Satish
Kantheti as Managing Director and Joint Managing Director, respectively, of the company. The
board at its meeting on 16-04-2008 expressed sorrow at the sudden demise of Mr K. Ravindra
Babu, Founder Managing Director of Zen Securities Ltd. Both Mr Pratap and Mr Satish have
been working with Zen Securities as Directors for over a decade.
21
Page 22
BOARD OF DIRECTORS:
Directors of Zen Securities Ltd. have considerable experience and expertise ranging over many
industries such as financial services, pharmaceuticals, manufacturing, banking and Information
Technology among others. They are some of the most highly respected people in their
professional circles.
Mr. Pratap Kantheti, Managing DirectorMr. Pratap Kantheti is the Managing Director of the company. He is a Chartered Financial
Analyst (CFA) and also has a Masters in Business Administration (MBA) in Finance. He has a
deep understanding of and exposure to the financial services sector.
Mr. Satish Kantheti, Jt. Managing DirectorMr. Satish Kantheti looks after the Portfolio Management Services and Equity Research divisions
of the Company. He is a Chartered Financial Analyst (CFA) and also has a Masters in Business
Administration (MBA) in Finance. He oversees the Equity Research division and the Portfolio
Management divisions.
Mr. K. Gandhi, Director
Mr. K. Gandhi is one of the founder directors of the company. He holds a Masters degree in
Electrical and Communication Engineering from IIT Bombay. He has extensive experience in IT
and General Management.
Mr. Satyanarayana Ch. Ravi (RS), Whole Time Director
Mr. Satyanarayana Ch. Ravi has more than two decades of experience in the fields of
Management, Administration, Manufacturing, and Marketing. He holds a Bachelors degree in
Chemical Engineering.
Mr. Sambasiva Rao Patibandla, Executive DirectorMr. Sambasiva Rao has worked with several multinational pharmaceuticals companies before
incorporating and running a successful pharmacy business venture in U.S. He relocated to India
entered the Stock broking industry in 1994. He is the Executive Director of company. He has a
Masters degree in Pharmacy.
Mr. Narayanan Narayanan, Director
22
Page 23
Mr. Narayanan is a very experienced Investment Analyst and Tax Consultant possessing a deep
understanding about investments and stock market dynamics.
Mr. Ajay Kumar Mikkilineni, DirectorMr. Ajay Kumar Mikkilineni has over a decade of experience in senior positions of the
Pharmaceutical industry and also has twelve years of experience in the banking sector. He holds a
Masters degree in Agriculture.
Mr. K.Venkat Reddy, DirectorMr. K.Venkat Reddy is a chemical engineer. He worked in reputed industrial houses in Paper &
Power sectors for 16 years and in financial markets for 10 years. He has extensive experience in
the areas of project management and strategic management..
Mr. K. Narasimha Rao, Director
Mr. K. Narasimha Rao is a Post Graduate in Literature. He is the Chief Agent of A.P. LIC Mutual
Fund since June 2002. He is an LIC agent since 1980 and has extensive knowledge about the
securities and insurance markets.
Mr. Namashivaya Renukuntla, Director and Head of ComplianceMr. Namashivaya Renukuntla has vast experience in the field of stock broking and has a deep
understanding of the regulatory framework of the Capital Markets. He heads the Commodity
Broking business of the Company. He holds a bachelors degree in Civil Engineering and a
Masters in Business Administration (MBA.)
SERVICES:
Stock Broking
Zen Securities Limited provides the following equity related trading services to the investors:
o Capital Market Segment of NSE and BSE
o Futures & Options segment of NSE and BSE
ZEN operates from Hyderabad as it head office and has branches and associates in Andhra
Pradesh, Tamil Nadu, Maharashtra, Karnataka, West Bengal and Orissa. The Company operates
from over 140 locations with over 500 trading terminals.
23
Page 24
Internet Trading:
Internet trading is easy, convenient and reliable with ZenTr@de
Advantages of ZenTr@de - Internet Trading Platform
Flexible and advanced trading platform
Simple, reliable and easy to use
Futures & Options segment of NSE and BSE
Integrated payment gateways – facilitates online transfer of funds from your banks (ICICI
/Axis/Corp / Yes bank etc.) for instant limits (on funds transferred)
Integrated with Zen DP account – seamless settlement
Take full control of trading and trade with privacy from any place of your choice.
Choice of Trading from Internet or Branch
Choice of Browser based or EXE based trading
Market watch
Streaming market quotes
Multiple market watch
Integrated market watch for viewing NSE / BSE / NSE FAO on one screen
Access to trade in NSE / BSE and NSE FAO Segments
INTRADAY and DELIVERY differentiation
Different limits for INTRADAY and DELIVERY
Auto square off of all INTRADAY orders 15 minutes before close of trading
Convert INTRADAY trades to DELIVERY trades on availability of credit/margin source
Access to statements
Stock Statements - View Stocks in your DP account and also Zen Benf account
Statements – View Cash available in your Zen Broking account
Mutual Funds – View Transaction/Holding statements with Latest NAV’s
24
Page 25
Net worth Statement - Net worth statement of assets with Zen, (Stocks+Cash+Mutual
funds).
Mutual Funds:
ZEN’S MUTUAL FUND SERVICES - HIGHLIGHTS
One stop shop for a range of Mutual fund products from top Mutual funds such as HDFC,
ICICI Prudential, Birla sun life, Franklin Templeton, Reliance , HSBC, Sundaram BNP
Paribas, Fidelity and many more
Cost-effective, prompt and trustworthy service
Facility to view your account information online 24 X 7, Updates every day.
o You can view your latest Holding statement
o You can view your latest transaction statement
o You can view value of all your mutual funds in one consolidated statement
Easy and convenient application process
Good Advice keeping your financial goals in mind
Offline presence in various locations convenient to you for better service
¤ CONCEPT
¤ ORGANISATION OF A MUTUAL FUND
¤ ADVANTAGES OF MUTUAL FUNDS
CONCEPT: A Mutual Fund is a trust that pools the savings of a number of investors who share a
common financial goal. The money thus collected is then invested in capital market instruments
such as shares, debentures and other securities. The income earned through these investments and
the capital appreciation realized is shared by its unit holders in proportion to the number of units
owned by them. Thus a Mutual Fund is the most suitable investment for the common man as it
offers an opportunity to invest in a diversified, professionally managed basket of securities at a
relatively low cost. The flow chart below describes broadly the working of a mutual fund:
25
Page 26
Organization of a Mutual Fund
There are many entities involved and the diagram below illustrates the organizational
set: up of a mutual fund.
ADVANTAGES OF INVESTING IN MUTUAL FUNDS
Professional Money Management & Research
Mutual funds are managed by professional fund managers who regularly monitor market
trends and economic trends for taking investment decisions. They also have dedicated research
professionals working with them who make an in depth study of the investment option to take an
informed decision.
Risk Diversification Diversification reduces risk contained in a portfolio by spreading it. It is about not putting
all your eggs in one basket. As mutual funds have huge corpuses to invest in, one can be part of a
large and well-diversified portfolio with very little investment.
Convenience
26
Page 27
With features like dematerialized account statements, easy subscription and redemption
processes, availability of NAVs and performance details through journals, newspapers and
updates and lot more; Mutual funds are sure a convenient way of investing.
Liquidity
One of the greatest advantages of Mutual funds investment is liquidity. Open-ended
funds provide option to redeem on demand, which is extremely beneficial especially during rising
or falling Markets.
Reduction in Costs
Mutual funds have a pool of money that they have to invest. So they are often involved
in buying and selling of large amounts of securities that will cost much lower than when you
invest on your own.
Tax Advantages
Investment in mutual funds also enjoys several tax advantages. Dividends from Mutual
Funds are tax-free in the hands of the investor (This however depends upon changes in Finance
Act). Also Capital Gain accrued from Mutual Fund investment for a period of over one year is
treated as long term capital appreciation and is tax free.
Other Advantages
Indian Mutual fund industry also presents several other benefits to the investor like:
transparency - as funds have to make full disclosure of investments on a periodic basis, flexibility
in terms of needs based choices, very well regulated by SEBI with very strict compliance
requirements to investor friendly norms.
DEPOSITORY SERVICES:
DEPOSITORY:
Zen is a depository participant offering flexible, cost effective and transparent
depository services to its clients .Zen is a depository participant with the National Securities
Depository Limited and Central Depository Services (India) Limited for trading and settlement of
dematerialized shares. Zen performs clearing services for all securities transactions through its
accounts. Zen offers depository services to create a seamless transaction platform – execute trades
through Zen Securities and settle these transactions through the Zen Depository Services. Zen
Depository Services is a part of our value added services for our clients that creates multiple
interfaces with the client and provides for a solution that takes care of all your needs
27
Page 28
Basic Services Provided by Zen DP
Account Opening
Account Transfers - Market and Off-Market
Dematerialization
Re-materialization
Pledge
FEATURES:
Zen is a depository participant with National Securities Depository Limited (NSDL) and Central
Depository Service Limited (CDSL) offering flexible, cost effective and transparent depository
services to its clients. Owning a demat a/c with Zen is the ideal option as it entails:
Access to DP account like Holdings (With Holding valuation), Transactions & ISIN
details in our site.
Provision of Portfolio value on account statement.
Limited power of attorney (LPOA) facility for clients having broking / trading A/c. with
Zen, eliminating the need for giving instructions every time a sale is executed l through
Zen.
Very low annual charge and transaction charges.
Mailing of a regular transaction statement, free of cost to all account holders showing an
opening balance, debit/credit and closing balance for securities held.
Facility to log on to the NSDL web site ( IDEAS ) and view your account/ transactions
directly from NSDL (Note : This service is available on subscription to Ideas)
Accounts freeze/defreeze facility, security wise and quantity wise.
DOCUMENTATIONS:
Documentation for Account OpeningIn order to open a Demat account, you will need to provide/produce the following documents
1. INDIVIDUALS
Duly filled (in block letters) Demat Account Opening Form & Depository Client
Agreement.
A photograph of each holder / signatory to be pasted on the form and signed across.
28
Page 29
A photocopy of the PAN card for each holder is compulsory.
Proof of identity (any one of the below mentioned)
o Passport, Voter ID Card, Driving license,
o PAN card with Photograph,
o MAPIN card,
o Proof of Identity cum Address form (Attested by a scheduled commercial Bank
Manage
o Identity card/document with applicant’s photo, issued by:
Central/State Government and its Departments,
Statutory/ Regulatory Authorities,
Public Sector Undertakings,
Scheduled Commercial Banks,
Public Financial Institutions,
Colleges affiliated to Universities,
Professional Bodies such as ICAI, ICWAI, and ICSI, Bar Council etc. to
their Members
Credit cards/Debit cards issued by Banks.
Proof of Address (any one of the below mentioned)
o Ration card, Passport, Voter ID Card, Driving license, Bank passbook,
o Verified copies of Electricity bills (Not more than two months old)/ Residence
Telephone bills (not more than two months old).
o License agreement / Agreement for sale, Self-declaration by High Court &
Supreme Court judges, giving the new address in respect of their own accounts.
o Proof of Identity cum Address form (Attested by a scheduled commercial Bank
Manager)
o Identity card/document with address, issued by
Central/State Government and its Departments.
Statutory/Regulatory Authorities.
Public Sector Under takings.
Scheduled Commercial Banks.
Public Financial Institutions.
29
Page 30
Colleges affiliated to universities and
Professional Bodies such as ICAI, ICWAI, Bar Council etc., to their
Members.
Nomination form (If required)
Note:
If the Current Address is same as in Passport / Voter's ID card / Driving license / MAPIN Card
then Proof of Address not required.
2. CORPORATE ACCOUNTS
Duly filled (in block letters) Demat Account Opening Form & Depository Client
Agreement.
A copy of
Certificate of Incorporation,
Certificate of Commencement of Business
Memorandum and Articles of Association.
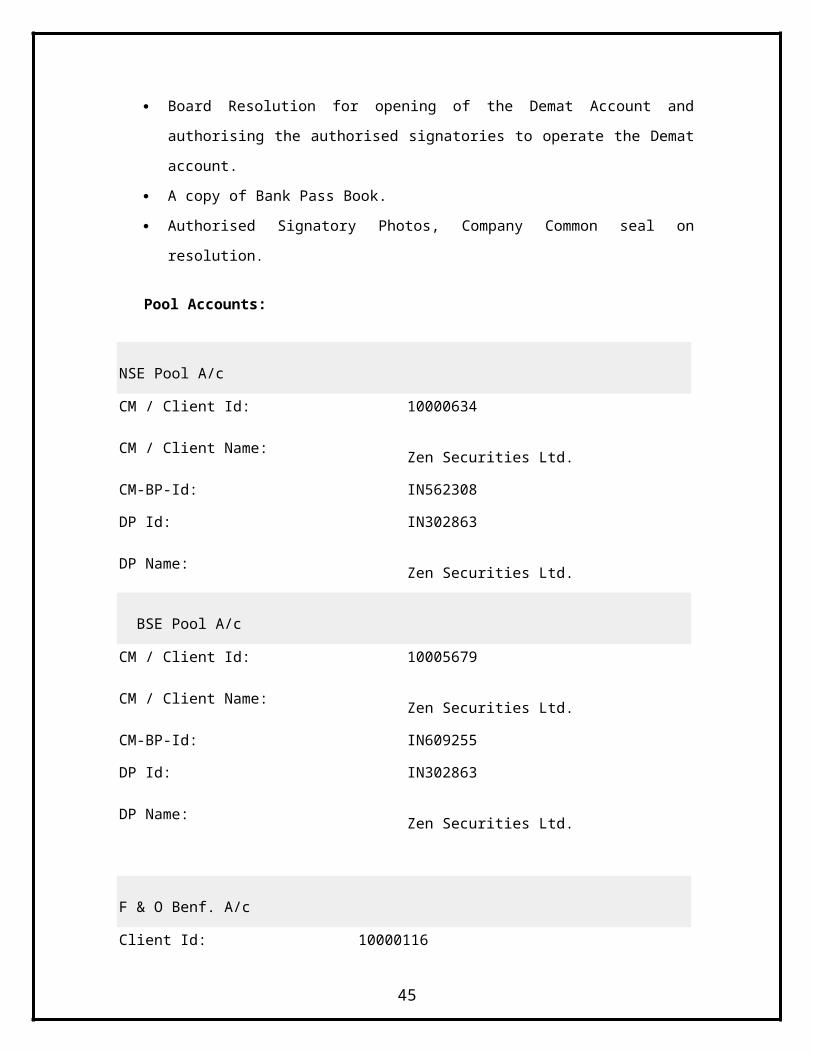
Board Resolution for opening of the Demat Account and authorising the authorised
signatories to operate the Demat account.
A copy of Bank Pass Book.
Authorised Signatory Photos, Company Common seal on resolution.
Pool Accounts:
NSE Pool A/c
CM / Client Id: 10000634
CM / Client Name: Zen Securities Ltd.
CM-BP-Id: IN562308
DP Id: IN302863
DP Name: Zen Securities Ltd.
BSE Pool A/c
30
Page 31
CM / Client Id: 10005679
CM / Client Name: Zen Securities Ltd.
CM-BP-Id: IN609255
DP Id: IN302863
DP Name: Zen Securities Ltd.
F & O Benf. A/c
Client Id: 10000116
Client Name: Zen Securities Ltd.
DP Id: IN302863
DP Name: Zen Securities Ltd.
LITERATURE SURVEY
DERIVATIVES:-
The emergence of the market for derivatives products, most notably forwards, futures and options,
can be tracked back to the willingness of risk-averse economic agents to guard themselves against uncertainties
arising out of fluctuations in asset prices. By their very nature, the financial markets are marked by a very high
degree of volatility. Through the use of derivative products, it is possible to partially or fully transfer price risks
by locking-in asset prices. As instruments of risk management, these generally do not influence the fluctuations
in the underlying asset prices. However, by locking-in asset prices, derivative product minimizes the impact of
fluctuations in asset prices on the profitability and cash flow situation of risk-averse investors.
Derivatives are risk management instruments, which derive their value from an underlying asset. The
underlying asset can be bullion, index, share, bonds, currency, interest, etc.. Banks, Securities firms, companies
and investors to hedge risks, to gain access to cheaper money and to make profit, use derivatives. Derivatives are
likely to grow even at a faster rate in future.
31
Page 32
INTRODUCTION TO FUTURES CONTRACTS:
In the Derivatives market Futures contract is most actively traded contract. It has gained its
momentum in recent years, after forwards contract were banned in some parts of the world. It is one of
the most popular types of contracts for the traders in the world.
FUTURES CONTRACT:
Futures contract was designed to solve limitations that existed in forward contracts. Futures
contract is an agreement between two parties to buy or sell an asset at a certain time in future at a certain
price. To make it simple Futures are exchange-traded contracts to buy or sell an asset in future at a price
agreed upon today. The asset can be share, index, interest rate, bond, rupee-dollar exchange rate, sugar,
crude oil, soybean, cotton, coffee etc.
To facilitate liquidity in the futures contract, the exchange specifies certain standard features of
the contract. It is a standardized contract with standard underlying instrument.
The following are the Standard terms in any Futures contract:
Quantity of the underlying asset
Quality of the underlying asset (not required in case of financial futures)
Expiration date
The unit of price quotation (not the price)
Minimum fluctuation in price (tick size)
Settlement style
Example:
when you are dealing in March 2002 Satyam futures contract, you know that the market lot,
i.e. the minimum quantity you can buy or sell, is 1,200 shares of Satyam, the contract would expiry on
March 28, 2002, the price is quoted per share, the tick size is 5 paisa per share or (1200*0.05) = Rs 60 per
contract/ market lot, the contract would be settled in cash and the closing price in the cash market on
expiry date would be the settlement price.
TERMINOLOGY USED IN FUTURES MARKET:
32
Page 33
The terminologies used in futures market are as follows:
SPOT PRICE:
The price at which an asset trades in the spot market.
FUTURE PRICE:
The price at which the futures contract trades in the futures market.
CONTRACT CYCLE:
The period over which a contract trades.
BASIS :
It is the difference between future price and the spot price. Popularly termed as spread among the trading
community.
INITIAL MARGIN:
The amount deposited in the margin account, when the future contract is first entered.
MARKING TO MARKET:
In the futures market, at the end of each trading day, the margin account is adjusted to reflect
the investors gain or loss depending upon the futures closing price. This is called as marking to market.
MAINTENANCE MARGIN:
It is the minimum margin the investor has to keep in his account, so that it never shows negative
balance.
PRICING FUTURES THEORYTICALY:
The theoretical price of a futures contract is spot price of the underlying plus the cost of carry.
Please note that futures are not about predicting future prices of the underlying assets.
In general, Futures Price = Spot Price + Cost of Carry
The Cost of Carry is the sum of all costs incurred if a similar position is taken in cash market and
carried to expiry of the futures contract less any revenue that may arise out of holding the asset. The cost
typically includes interest cost in case of financial futures (insurance and storage costs are also considered
33
Page 34
in case of commodity futures). Revenue may be in the form of dividend. Though one can calculate the
theoretical price, the actual price may vary depending upon the demand and supply of the underlying
asset.
Example:
Suppose Reliance shares are quoting at Rs 300 in the cash market. The interest rate is about
12% per annum. The cost of carry for one month would be about Rs 3. As such a Reliance future contract
with one-month maturity should quote at nearly Rs303. Similarly Nifty level in the cash market is about
1100. One month Nifty future should quote at about 1111. However it has been observed on several
occasions that futures quote at a discount or premium to their theoretical price, meaning below or above
the theoretical price. This is due to demand-supply pressures. Every time a Stock Future trades over and
above its cost of carry i.e. above Rs. the arbitragers would step in and reduce the extra premium
commanded by the future due to demand. E.g.: would buy in the cash market and sell the equal amount in
the future, Hence creating a risk free arbitrage, vice-versa for the discount.
When the future contract approaches expiry date, the cost of carry reduces as the time to expiry
reduces; thus futures and cash prices start converging. On expiry date, futures price should equal cash
market price.
Settlement in Futures markets:
34
Page 35
Presently both stock and index futures are settled in cash. The closing price in the cash segment is
considered as the settlement price. The difference between the trade price and the settlement price is
ultimately your profit/loss.
In case of delivery based settlement Stock-based derivatives are expected to be settled in delivery.
On expiry of the futures contract, the buyer/seller of the future would receive a long/short position at the
closing price in the cash segment on the next trading day. This position in the cash segment would merge
with any other position the buyer/seller has. In case the buyer/seller wants he can square up this position
by selling/buying the shares. Or else he would be required to deliver/receive the underlying shares on the
settlement day (e.g. T+2) in the cash segment.
The aforesaid methodology is not final yet. Sebi guidelines in this regard are awaited. You can call
exchanges and me to know the exact methodology once the regulator. Index based Derivatives would
continue to be settled in cash
USAGE of Futures contracts:
You can do directional trading using futures. In case you are bullish on the underlying stock or
index, you can simply buy futures on stock/index. Similarly if you are bearish on the underlying, you can
sell futures on stock/index.
There are eight basic modes of trading on the index futures market:
Hedging
H1 Long stock, short Nifty futures
H2 Short stock, long Nifty futures
H3 Have portfolio, short Nifty futures
H4 Have funds, long Nifty futures
Speculation
S1 Bullish index, long Nifty futures
S2 Bearish index, short Nifty futures
Arbitrage
A1 Have funds, lend them to market
A2 Have securities, lend to the market
35
Page 36
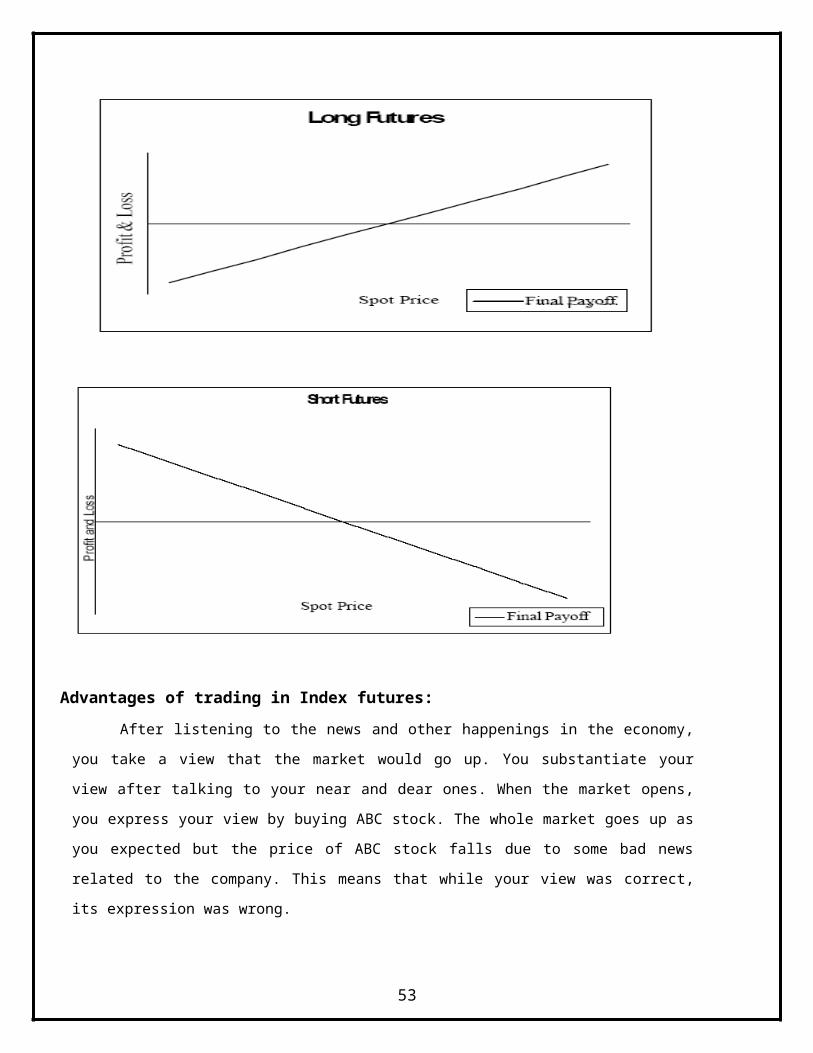
Advantages of trading in Index futures:
After listening to the news and other happenings in the economy, you take a view that the market
would go up. You substantiate your view after talking to your near and dear ones. When the market
opens, you express your view by buying ABC stock. The whole market goes up as you expected but the
price of ABC stock falls due to some bad news related to the company. This means that while your view
was correct, its expression was wrong.
Using Nifty/Sensex futures you can express your view on the market as a whole. In this case you
take only market risk without exposing yourself to any company specific risk. Though trading on Nifty or
Sensex might not give you a very high return as trading in stock can, yet at the same time your risk is also
limited as index movements are smooth, less volatile with unwanted swings.
36
Page 37
When trading futures in cash the biggest advantage of futures is that you can short sell without
having stock and you can carry your position for a long time, which is not possible in the cash segment
because of rolling settlement. Conversely you can buy futures and carry the position for a long time
without taking delivery, unlike in the cash segment where you have to take delivery because of rolling
settlement.
Further futures positions are leveraged positions, meaning you can take an Rs 100 position by paying Rs
25 margin and daily mark-to-market loss, if any. This can enhance the return on capital deployed. For
example, you expect an Rs 100 stock to go up by Rs 10. One way is to buy the stock in the cash segment
by paying Rs 100. You make Rs 10 on investment of Rs 100, giving about 10% returns. Alternatively you
take futures position in the stock by paying about Rs 30 toward initial and mark-to-market margin. You
make Rs 10 on investment of Rs 30, i.e. about 33% returns. Please note that taking leveraged position is
very risky, you can even lose your full capital in case the price moves against your position. You can
square up your future at any time once you have initiated the position, you need not wait until its expiry
you can book profits or cut losses.
One can use volume and open interest rates to predict the movement of the market this is done
like this, the total outstanding position in the market is called open interest. In case volumes are rising and
the open interest is also increasing, it suggests that more and more market participants are keeping their
positions outstanding. This implies that the market participants are expecting a big move in the price of
the underlying. However to find in which direction this move would be, one needs to take help of charts.
In case the volumes are sluggish and the open interest is almost constant, it suggests that a lot of
day trading is taking place. This implies sideways price movement in the underlying.
When Corporate Dividends are announced:
In the event of such corporate announcements, the exchanges adjust the position such that
economical value of your position on cum-benefit and on ex-benefit day is the same. While calculating
the theoretical price of a futures contract, the interest rate should be taken as net of dividend yield. So on
announcement of the dividend, the futures price should be discounted by the dividend amount. However
as per the policy of Sebi and stock exchanges, if the dividend is more than 10% of the market price of the
stock on the day of dividend announcement, the futures price is adjusted. The exchanges roll over the
positions from last-cum-dividend day to the ex-dividend day by reducing the settlement price by
dividend. In such a case, the announcement of such exceptional dividends does affect the price of futures.
37
Page 38
Suppose Reliance is trading at Rs 300 and a two-month Reliance future which has 45 days to
maturity is trading at Rs 304. Reliance declares 50% dividend, i.e. Rs 5. The dividend amount is less than
10% of the market price of Reliance, so the exchange would not adjust the position. As such the market
adjusts this dividend in the market price and the futures price goes down by Rs 5 to Rs 299.
In case of Bonus the lot size of the stock that gives bonus gets adjusted according to the ratio of
the bonus. The position is transferred from cum-bonus to ex-bonus day by adjusting the settlement price
to neutralize the effect of bonus.
For example:
The current lot size of Cipla is 200. Suppose Cipla announces a bonus of 1:1. You are long on 200
shares of Cipla and the settlement price of Cipla on cum-bonus day is Rs 1,000. On ex-bonus day your
position becomes long on 400 shares at Rs 500. Thereafter the lot size of Cipla would be 400.
Hedging of stock positions using futures:
Suppose you are holding a stock that has futures on it and for two to three weeks the stock does
not look good to you. You do not want to lose the stock but at the same time you want to hedge against
the expected adverse price movement of the stock for two to three weeks. One option is to sell the stock
and buy it back after two to three weeks. This involves a heavy transaction cost and issue of capital gain
taxes. Alternatively you can sell futures on the stock to hedge your position in the stock. In case the stock
price falls, you make profit out of your short position in the futures. Using stock futures you would
virtually sell your stock and buy it back without losing it. This transaction is much more economical as it
does not involve cost of transferring the stock to and from depository account. You might say that if the
stock had moved up, you would have made profit without hedging. However it is also true that in case of
a fall, you might have lost the value too without hedging. Please remember that a hedge is not a device to
maximize profits, it is a device to minimize losses. As they say, a hedge does not result in better outcome
but in predictable outcome.
You can hedge your cash market position in stocks that do not have stock futures by using index
futures. Before we go any further, we need to understand the term called beta. Beta of a stock is nothing
but the movement of the stock relative to the index. So suppose a stock X moves up by 2% when the
Nifty moves up by 1% and it goes down by 2% when the Nifty falls by 1%, the beta of this stock is 2.
Beta is crucial in deciding how much position should be taken in index futures to hedge the cash market
position. Suppose you have a long position in ABB worth Rs 2 lakh. The beta of ABB is 1.1. To hedge
38
Page 39
this position in the cash market you need to take an opposite position in Nifty futures worth 1.1 x 2, i.e.
worth Rs 2.2 lakh. Suppose Nifty futures are trading at 1100 and the market lot for Nifty futures is 200.
Then each market lot of Nifty is worth Rs 2.2 lakh. Therefore to hedge your position in ABB you need to
sell one contract of Nifty futures.
Hedging with index futures are not perfect, Hedging is like marriage and one should not expect it
to be perfect. The beta taken in the calculation of the position of Nifty futures is historical and there is no
guarantee that it will be the same in future. So, any deviation of beta makes the hedge imperfect. Suppose
you want to hedge your position in ABB for 15 days and during those 15 days ABB becomes very
volatile and the beta goes up as high as 1.5. In this case your hedging position of one contract is not
sufficient and you will be under hedged. It is very difficult (in fact impossible) to get perfect hedge but
one can improve the perfection by adjusting the position in Nifty futures from time to time.
Demystifying Stock Futures
Here we try to solve some myths about futures
When some liquid money is available to you and you are trying to buy future stocks for risk free interest.
Using stock futures you can deploy this money to earn risk-free interest. Suppose Satyam is quoting at Rs
300 in the cash segment and one-month future is quoting at 305, you can earn risk-free interest by
following the steps mentioned below:
Buy Satyam in cash market at Rs 300 and simultaneously sell Satyam future at Rs 305.
Pay Rs 300 to take delivery of Satyam stock in cash market.
On expiry of Satyam future contract, the short position would be transferred to your account
in the cash segment and a delivery order would be issued against you.
Deliver the Satyam stock.
Whatever happens to the price of Satyam, you earn Rs 305 - 300 = 5 on Rs 300 for one
month.
Need to have mark-to-mark margins in your account, incase Satyam moves up.
If required the future position can be rolled over to the next month position with a difference of Rs 4-5.
This roll-over process can continue till you want to get your money back.
The above example was about how earn risk free interest when liquid cash is available with you, when
the futures stock is going down in futures market but going up in the cash segment then we can do the
following:
39
Page 40
Suppose one-month SBI future is quoting at 200 while SBI is quoting at Rs 205 in the cash segment.
Follow the steps mentioned below to make risk-free money.
Sell SBI in the cash market at Rs 205 and simultaneously buy SBI future at 200.
Receive Rs 205 and make delivery of SBI stock in the cash market.
On expiry of the SBI future contract, the long position would be transferred to your account in the
cash segment and a receive order would be issued to you.
Get your SBI stock back.
Whatever happens to the price of SBI, you earn Rs 205 – 200 = 5 on your stock.
rrow against the future stock and that is the advantage of futures. Instead of going to the banker
and complying with a whole lot of formalities, you can in fact just call me to help you raise
money against your shares using futures.
Suppose ACC is quoting at Rs 150 in the cash segment and one-month ACC futures are quoting at 152.
Follow the steps mentioned below to raise money against your ACC shares.
Sell ACC in the cash market at Rs 150 and simultaneously buy ACC futures at 152.
Receive Rs 150 and make delivery of ACC stock in the cash market.
On expiry of the ACC futures contract, the long position would be transferred to your account in
the cash segment and a receive order would be issued to you.
Get your ACC stock back.
Whatever happens to the price of ACC, you lose Rs 152 – 150 = 2 to raise money against your
shares as cost.
You might have seen that spot price and future price varies in the intra day trading, in that
case you can do arbitrage to raise money in that situations. When the futures are quoting at a premium to
their theoretical price, one can buy cash and short futures. When the prices come in line, that is when the
difference between the futures and cash prices comes down, reverse the positions. Conversely when the
futures are quoting at a discount to the theoretical price, one can sell cash and buy futures. When the
prices come in line, that is the difference between the futures and cash prices goes up, reverse the
positions. This way it is possible to take advantage of fluctuations in the basis. Please note that there is the
risk of execution of order. Also you need to decide the arbitration band depending on the transaction cost
you bear.
INTRODUCTION TO OPTIONS MARKET:
40
Page 41
In this section, we look at the next Derivative product to be traded at NSE, namely Options.
Options are fundamentally different from Forward and Futures contracts. An option gives the holder the
right do something; the holder does not have to exercise this price.
OPTIONS MARKET:
Options are contracts that give the buyers the right (but not the obligation) to buy or sell a
specified quantity of certain underlying asset at a specified price on or before a specified date. On the
other hand, the seller is under obligation to perform the contract (buy or sell the underlying). The
underlying asset can be share, index, interest rate, bond, rupee-dollar exchange rate, sugar, crude oil,
soybean, cotton, coffee etc.
For example:
A railway ticket is an option in daily life. Using the ticket, a passenger has an option to travel. In
case he decides not to travel, he can cancel the ticket and get a refund. But he has to pay a cancellation
fee, which is analogous to the premium paid in an option contract. The railways on the other hand have an
obligation to carry the passenger if he decides to travel and refund his money if he decides not to travel.
In case the passenger decides to travel the railways get the ticket fare. In case he does not then they get
the cancellation fee. The passenger on the other hand, by booking ticket he has hedged his position in
case he has to travel as anticipated. In case the travel does not materialize, he can get out of the position
by canceling the ticket at a cost, which is the cancellation fee.
Example 2:
Suppose you have a right to buy 1,000 shares of Hindustan Lever at Rs 250 per share on or
before March 28, 2002. In other words you are a buyer of a call option on Hindustan Lever. The option
gives you the right to buy 1,000 shares. You have the right to buy Hindustan Lever shares at Rs250 per
share. The seller of this call option who has given you the right to buy from him is under obligation to sell
1,000 shares of Hindustan Lever at Rs250 per share on or before March 28, 2002 whenever asked.
Option Terminology:
There are some basic terminologies used in options, they are as follows:
Index option: These options have the index as the underlying. Some options are European options
while others are American options. Indexed option contracts settled in cash.
Stock option:
41
Page 42
Stock options are options on individual stocks. Options currently traded on more than 500
stocks in the United States. The contract gives the holder the right to buy or sell shares.
Option holder: Buyer if the option who has the right.
Option writer: Seller of the option who has the obligation.
Premium: The consideration paid by the buyer for the right.
Call option: Option that gives the holder the right to buy.
Put option: The option that gives the holder the right to sell.
American option: These are options that are exercised at any point till the expiration date.
European option: These are option that can be exercised only on the expiration date.
In the money: It is an option that would lead to profits if it were exercised immediately.
Out of money: It is an option that would lead to loss if exercised immediately.
At the money: It is an option that would even the holder’s option if exercised immediately.
How money is made in the option market?
The money made in the option market is known as option pay off. There can be two
types of option pay off.
Call option
Put option
Call option:
A call option gives the holder the right to buy shares. The option holder will make money if
the spot price is higher than the strike price. The pay off assumes that the option holder will buy at the
strike price and sell immediately at the spot price. But if the spot price is lower than the strike price the
holder can simply ignore the option. Here the profits for the option holder are unlimited while the losses
are limited.
Example1:
Suppose you have a right to buy 1,000 shares of Hindustan Lever at Rs250 per share on or before
March 28, 2002. In other words you are a buyer of a call option on Hindustan Lever. The option gives
you the right to buy 1,000 shares. You have the right to buy Hindustan Lever shares at Rs250 per share.
The seller of this call option who has given you the right to buy from him is under obligation to sell 1,000
shares of Hindustan Lever at Rs250 per share on or before March 28, 2002 whenever asked.
42
Page 43
Example2:
Assume you have the right to buy 200 Nifty units at 1100. In other words, you are a buyer of a call
option on Nifty. The option gives you the right to buy 200 Nifty units. You have the right to buy 200 units
of Nifty at 1100. The seller of this call option who has given you the right to buy from him is under
obligation to sell 200 units of Nifty.
Put Option:
The put option gives the right to sell. The option holder will make money if the spot price is
lower than the strike price. The pay off assumes that the option holder will buy at spot price and sell at
strike price. But if the spot price is higher than the strike price, the option holder will simply ignore the
option, it will be beneficial to sell it in the market. But if the spot price falls dramatically then he can
make wind fall profits. Thus the profits of the option holder are unlimited and his losses are capped to the
extent of the premium.
Example1:
Suppose you have the right to sell 1,600 shares of Bharat Heavy Electrical at Rs 140 per share on
or before March 28, 2002. In other words you are a buyer of a put option on Bharat Heavy Electrical. The
option gives you the right to sell 1,600 shares. You have the right to sell Bharat Heavy Electrical shares at
Rs140 per share. The seller of this put option who has given you the right to sell to him is under
obligation to buy 1,600 shares of Bharat Heavy Electricals at Rs140 per share on or before March 28,
2002 whenever asked.
Example2:
Suppose you have the right to sell 200 Nifty units at 1200. In other words you are a buyer of a put
option on Nifty. The option gives you the right to sell 200 Nifty units. You have the right to sell 200 units
of Nifty at 1200. The seller of this call option who has given you the right to sell to him is under
obligation to buy 200 units of nifty.
Option contracts have an expiry date specified by exchanges. The buyer enjoysthe right and
the seller is under obligation to fulfill the right till the option contract expires. March 28, 2002 is the
expiry date in the aforesaid example. Normally as per the contract specifications of options given by the
National Stock Exchange and Bombay Stock Exchange, last Thursday of the contract month is the expiry
day. In case the last Thursday of a month is a holiday, the previous business day is considered as the
expiry day. However you must check with the dealer about the expiry date before placing the order for
43
Page 44
buying or selling options. There are one-, two- and three-month contracts available presently. It is
expected that once these contracts become liquid, the exchanges would introduce contracts of longer-term
expiry/maturity.
Who decides the strike price?
The exchanges decide the strike price at which call and put options are traded. Generally to
simplify matters, the exchanges specify the strike price interval for different levels of underling prices,
meaning the difference between one strike price and the next strike price over and below it.
For example
The strike price interval for Bharat Heavy Electricals is Rs10. This means that there would be
strike prices available with an interval of Rs10. Typically you can see options on Bharat Heavy
Electricals with strike prices of Rs150, Rs160, Rs170, Rs180, and Rs190 etc.
Strike price intervals specified by the exchanges:
Strike price intervals specified by the exchanges are as follows:
Price level of Underlying Strike Price Interval (in Rs)
Less than or equal to 50 2.5
Above 50 to 250 5.0
Above 250 to 500 10.0
Above 500 to 1000 20.0
Above 1000 to 2500 30.0
Above 2500 50.0
Options Market Process:
Call and put options are traded on-line on the trading screens of the National Stock Exchange and
Bombay Stock Exchange like any other securities. The price of options is decided between the buyers and
sellers on the trading screens of the exchanges in a transparent manner. You can see the best five orders
by price and quantity. You can place market, limit and stop loss order etc. You can modify or delete your
pending orders. The whole process is similar to that of trading in shares.
44
Page 45
You are not compelled to wait till expiry of the option once you have bought or sold an option. Instead
you can buy an option and square up the position by selling the identical option (same expiry and same
strike) at any time before the
contract expires. You can sell an option and square up the position by buying an identical option. You can
buy first and sell later or you can initiate your position by selling and then buying—there is no restriction
on direction. The difference between the selling and buying prices is your profit/loss. The process is
similar to that of trading in shares.
Factors affecting the price of option:
There are five fundamental factors that affect the price of an option. These are:
1. Price of the underlying stock or index
2. Strike price/exercise price of the option
3. Time to expiration of the option
4. Risk-free rate of interest
5. Volatility of the price of underlying stock or index
Adjust the price for dividend expected during the term of the option to arrive at fine prices.
Consider this suppose a stock is trading at Rs70. There is 40% probability that the stock price would
move to Rs80. Similarly the probabilities of the price being Rs90, Rs100, Rs110 and Rs120 are 25%,
15%, 10% and 5% respectively. What would be your expected return if you were the buyer of a call
option with a strike price of Rs100? If the stock price were to finish at Rs80, Rs90 and Rs100, the call
option would expire worthless. If the stock price were to finish at Rs110 or Rs120, you would gain Rs10
and Rs20 respectively. Your expected return from the call would be:
(40%*0)+ (25%*0) + (15%*0) + (10%*10) + (5%*20) = 11.
This means that you would like to pay anything less than Rs11 for this option to make a profit and the
seller would always like to get anything more than Rs11 for giving you this option.
Settlement:
Presently stock options are settled in cash. This means that when the buyer of the option exercises
an option, he receives the difference between the spot price and the strike price in cash. The seller of the
option pays this difference. It is expected that stock options would be settled by delivery of the underlying
stock. This means that on exercise of a call option, a long position of the underlying stock effectively at
the strike price would be transferred in the cash segment in the account of the buyer of the call option
who has the right to buy. An opposite short position at effectively the strike price would be transferred in
45
Page 46
the cash segment in the account of the seller of the call option who has obligation to sell. Similarly on
exercise of a put option, a short position in the underlying stock effectively at the strike price would be
transferred in the cash segment in the account of the buyer of the put option who has the right to sell. An
opposite long position at effectively the strike price would be transferred in the cash segment in the
account of the seller of the put option who has the obligation to buy. However guidelines in this regard
are awaited from SEBI. Please check the exact method of delivery-based settlement once the regulator
and exchanges announce it.
Varying time value for at-, in- and out-of-the-money options?
The following graph shows how the premium of 30-day maturity, Rs260 strike price call option
on Reliance varies with the movement of the spot price of Reliance. Study the price movement of the
option carefully. You would find that the time value is the highest when the spot price is equal to the
strike price; the option is at the money. As the spot price rises above the strike price, the option becomes
in the money and its intrinsic value increases but its time value decreases. In the same way as the spot
price falls below the strike price, the option becomes out of the money and its intrinsic value becomes
zero while its time value decreases.
Premium Varying with the Price of the Option:
The buyers of longer maturity options enjoy the right to longer duration and the sellers are subject
to risk of price movement of the underlying during a longer term, since the price of both call and put
options increases as the time to expiry increases. The following graph shows the prices of 15- and 30-day
maturity, Rs260 strike price call options on Reliance when the spot price of Reliance is Rs260.
46
Page 47
Difference between Options and Futures:
In case of futures, both the buyer and the seller are under obligation to fulfill the contract. They
have unlimited potential to gain if the price of the underlying moves in their favour. On the contrary, they
are subject to unlimited risk of losing if the price of the underlying moves against their views. In case of
options, however, the buyer of the option has the right and not the obligation. Thus he enjoys an
asymmetric risk profile. He has unlimited potential to profit if the price of the underlying moves in his
favour. But a limited potential to lose, to the extent of the premium paid, in case the price of the
underlying moves against the view taken. Similarly the seller of the option is under obligation.
He has limited potential to profit, to the extent of the premium received, in case
the price of the underlying moves in his favour. But an unlimited risk of losing in case the price of the
underlying moves against the view taken.
PRICE BEHEVIOUR OF AN OPTION OR GREEK OPTION:
We need to understand and appreciate various option Greeks like delta, gamma, theta, Vega
and rho to completely comprehend the behavior of option prices.
DELTA of an Option and its Significances:
For a given price of underlying, risk-free interest rate, strike price, time to maturity and volatility,
the delta of an option is a theoretical number. If any of the above factors changes, the value of delta also
changes. The delta of an option tells you by how much the premium of the option would increase or
decrease for a unit change in the price of the underlying. For example, for an option with delta of 0.5, the
premium of the option would change by 50 paisa for an Rs1 change in the price of the underlying. Delta
is about 0.5 for near/at the- money options. As the option becomes in the money, the value of delta
47
Page 48
increases. Conversely as the option becomes out of the money, the value of delta decreases. In other
words, delta measures the sensitivity of options with respect to change in the price of the underlying.
Deep out-of-the-money options are less sensitive in comparison to at-the-money and deep in-the-money
options.
Delta is positive for a bullish position (long call and short put) as the value of the position
increases with rise in the price of the underlying. Delta is negative for a bearish position (short call and
long put) as the value of the position decreases with rise in the price of the underlying.
Delta varies from 0 to 1 for call options and from –1 to 0 for put options. Some people refer to
delta as 0 to 100 numbers.
The Delta is an important piece of information for a option Buyer because it can tell him much of
an option & buyer he can expect for short-term moves by the underlying stock. This can help the Buyer of
an option which call / Put option should be bought. The factors that can change the Delta of an option are
Stock price, Volatility and Number of days.
THETA of an option and its Significance:
The theta of an option is an extremely significant theoretical number for an option trader. Like the
other Greek terms you can calculate theta using option calculator.
Theta tells you how much value the option would lose after one day, with all the other parameters
remaining the same.
Suppose the theta of Infosys 30-day call option with a strike price of Rs3, 900 is 4.5 when Infosys
is quoting at Rs3,900, volatility is 50% and the risk-free interest rate is 8%. This means that if the price of
Infosys and the other parameters like volatility remain the same and one day passes, the value of this
option would reduce by Rs4.5.
48
Page 49
Theta is always negative for the buyer of an option, as the value of the option goes down each day if his
view is not realized. Conversely theta is always positive for the seller of an option, as the value of the
position of the seller increases as the value of the option goes down with time. Consider options as
depreciating assets because of time decay and appreciating due to
Favorable price movements. If the rate of appreciation is more than that of depreciation hold the option,
else sell it off. Further, time decay of option premium is very steep near expiry of the option. The
following graph would make it clearer.
VEGA of an Option and its Significance:
Vega is also a theoretical number that can be calculated using an option calculator for a given set
of values of underlying price, time to expiry, strike price, volatility and interest rate etc. Vega indicates
how much the option premium would change for a unit change in annual volatility of the underlying.
Suppose the Vega of an option is 0.6 and its premium is Rs15 when volatility of the underlying is
35%. As the volatility increases to 36%, the premium of the option would change upward to Rs15.6. Vega
is positive for a long position (long call and long put) and negative for a short position (short call and
short put).
Simply put, for the buyer it is advantageous if the volatility increases after he has bought the
option. On the other hand, for the seller any increase in volatility is dangerous as the probability of his
option getting in the money increases with any rise in volatility.
Sometimes you might have observed that though seven to ten days have passed after you bought
an option, the underlying price is almost in the same range while the premium of the option has increased.
This clearly indicates that volatility of the underlying might have increased.
49
Page 50
GAMMA of an option and its Significances:
Gamma is a sophisticated concept. You need patience to understand it, as it is important too. Like
delta, the gamma of an option is a theoretical number. Feeding the price of underlying, risk-free interest
rate, strike price, time to maturity and volatility, the gamma of an option tells you how much the delta of
an option would increase or decrease for a unit change in the price of the underlying. For example,
assume the gamma of an option is 0.04 and its delta is 0.5. For a unit change in the price of the
underlying, the delta of the option would change to 0.5 + 0.04 = 0.54. The new delta of the option at
changed underlying price is 0.54; so the rate of change in the premium has increased.
If I were to explain in very simple terms:
If delta is velocity, then gamma is acceleration. Delta tells you how much the premium would
change; gamma changes delta and tells you how much the next premium change would be for a unit price
change in the price of the underlying.
Gamma is positive for long positions (long call and long put) and negative for short positions
(short call and short put). Gamma does not matter much for options with long maturity. However for
options with short maturity, gamma is high and the value of the options changes very fast with swings in
the underlying prices.
STRATEGY IN THE OPTION MARKET:
When Bullish
When you are very bullish, buy a call option. When you are very bullish on the market as a
whole, buy a call option on indices (Nifty/Sensex). When you are very bullish on a particular stock, buy a
call option on that stock.
The more bullish you are, the more out of the money (higher strike price) should be the option you buy.
No other position gives you as much leveraged advantage in a rising market with limited downside.
50
Page 51
Upside potential:
The price of the option increases as the price of the underlying rises. You can book profit by
selling the same option at higher price whenever you think that the underlying price has come to the level
you expected. At expiration the break-even underlying price is the strike price plus premium paid for
buying the option.
Downside risk:
Your loss is limited to the premium you have paid. The maximum you can lose is the
premium, if the underlying price is below the strike price at expiry of the option.
Time decay characteristic:
Options are wasting assets in the hands of a buyer. As time passes, the value of the position
erodes. If volatility increases, erosion slows down; if volatility decreases, erosion hastens.
When NO Rise
When you firmly believe that the underlying is not going to rise, sell a call option. When you
firmly believe that index (Nifty/Sensex) is not going to rise, sell a call option on index. When you firmly
believe that a particular stock is not going to rise, sell call option on that stock. Sell out-of-the-money
(higher strike price) options if you are only somewhat convinced; sell at-the-money options if you are
very confident that the underlying would remain at the current level or fall.
51
Page 52
Upside potential:
Your profit is limited to the premium received. At expiration the break-even is strike price plus
premium. Maximum profit is realized if the underlying price is below the strike price.
Downside risk:
The price of the option increases as the underlying rises. You can cut your losses by buying the
same option if you think that your view is going wrong. Losses keep on increasing as the underlying rises
and are virtually unlimited. Such a position must be monitored closely.
Time decay characteristic:
Options are growing assets in the hands of a seller. As time passes, the value of position increases
as the option loses its time value. You get maximum profit if the option is at the money.
When Bearish
When you are very bearish, buy a put option. When you are very bearish on the market as a
whole, buy put option on indices (Nifty/Sensex). When you are very bearish on a particular stock, buy put
option on that stock. The more bearish you are, the more out of the money (lower strike price) should be
the option you buy. No other position gives you as much leveraged advantage in a falling market with
limited down side.
52
Page 53
Upside potential:
The price of the option increases as the price of the underlying falls. You can square up your
position by selling the same option at a higher price whenever you think that the underlying price has
come to the level you expected. At expiration the break-even underlying price is the strike price minus
premium paid for buying the option.
Downside risk:
Your loss is limited to the premium you have paid. The maximum you can lose is the premium, if
the underlying price is above the strike price at expiry of the option.
Time decay characteristic:
Options are wasting assets in the hands of a buyer. As time passes, the value of the position
erodes. If the volatility increases, erosion slows; if the volatility decreases, erosion hastens.
When NO Fall
When you firmly believe that the underlying is not going to fall, sell a put option. When you
firmly believe that index (Nifty/Sensex) is not going to fall, sell a put option on the index. When you
firmly believe that a particular stock is not going to fall, sell put option on that stock. Sell out-of-the-
money (lower strike price) options if you are only somewhat convinced; sell at-the-money options if you
are very confident that the underlying would remain at the current level or rise.
53
Page 54
Upside potential:
Your profit is limited to the premium received. At expiration the break-even is strike price
minus premium. Maximum profit is realized if the underlying price is above the strike price.
Downside risk:
The price of the option increases as the underlying falls. You can cut your losses by buying the
same option if you think that your view is going to be wrong. Losses keep on increasing as the
underlying falls and are virtually unlimited. Such a position must be monitored closely.
Time decay characteristic: options are growing assets in the hands of a seller. As time passes, the value
of the position increases as the option loses its time value. Maximum profit is realized if the option is at
the money.
Moderately Bullish
When you think the underlying index or stock will go up somewhat or is at least more likely to
rise than fall, Bull Spread is the best strategy.
Strategy implementation:
A call option is bought with a lower strike price and another call option is sold with a higher
strike price, producing a net initial debit. Or a put option is bought with a lower strike price and another
put sold with a higher strike price, producing a net initial credit.
54
Page 55
Upside potential: profit is limited.
Calls: Difference between strikes minus initial debit.
Puts: Net initial credit. Maximum profit if underlying price at expiry is above the
higher strike.
Downside risk: loss is limited.
Calls: net initial debit.
Puts: Difference between strikes minus initial credit.
Maximum loss if the underlying price at expiry is below the lower strike.
Time decay characteristic: time value erosion is not too significant because of balanced position.
Moderately Bearish
When you think the underlying index or stock will go down somewhat or is at least more
likely to fall than rise, Bear Spread is the best strategy.
Strategy implementation:
A call option is sold with a lower strike price and another call option is bought with a higher
strike price, producing a net initial credit or a put option is sold with a lower strike price and another put
bought with a higher strike, producing net initial debit.
55
Page 56
Upside potential: Profit is limited.
Calls: Net initial credit.
Puts: Difference between strikes minus initial debit.
Maximum profit if the market is below the lower strike at expiry.
Downside risk: profit is limited.
Calls: Difference between strikes minus initial credit.
Puts: Net initial debit
Maximum loss if the market is above the higher strike at expiry.
Time decay characteristic: Time value erosion is not too significant because of balanced position.
Air Deccan Future Contract
Calculation of ReturnsDATES Open Price close price Returns1-Feb-12 55.05 55.05 0.002-Feb-12 0.00 55.05 -55.053-Feb-12 54.30 54.30 0.004-Feb-12 54.30 51.95 2.355-Feb-12 48.40 50.90 -2.506-Feb-12 51.10 52.25 -1.158-Feb-12 53.85 50.85 3.009-Feb-12 52.60 52.60 0.0010-Feb-12 52.45 50.85 1.60
56
Page 57
11-Feb-12 52.85 51.70 1.1515-Feb-12 52.15 51.25 0.9016-Feb-12 52.60 52.60 0.0017-Feb-12 52.55 52.40 0.1518-Feb-12 52.35 51.45 0.9019-Feb-12 51.00 50.90 0.1022-Feb-12 51.20 50.30 0.9023-Feb-12 50.00 49.35 0.6524-Feb-12 49.65 50.55 -0.9025-Feb-12 51.10 49.45 1.6526-Feb-12 49.55 49.65 -0.102-Mar-12 50.10 52.35 -2.253-Mar-12 52.65 53.30 -0.654-Mar-12 53.30 53.70 -0.405-Mar-12 54.25 54.10 0.158-Mar-12 54.65 54.65 0.009-Mar-12 54.60 53.60 1.0010-Mar-12 53.90 53.40 0.5011-Mar-12 53.25 53.20 0.0512-Mar-12 53.20 51.90 1.3015-Mar-12 51.65 50.85 0.8016-Mar-12 50.00 52.15 -2.1517-Mar-12 52.50 50.20 2.3018-Mar-12 50.50 50.20 0.3019-Mar-12 50.35 50.20 0.1522-Mar-12 49.40 49.10 0.3023-Mar-12 50.40 48.40 2.0025-Mar-12 48.30 48.00 0.30
Total -42.65Average -1.15
RETURN = open price – closing price
Calculation of RiskReturns (X) Expected Return(x) X-exp(x)= d D2
0.00 -1.15 1.15 1.3225-55.05 -1.15 -53.90 2905.210.00 -1.15 1.15 1.32252.35 -1.15 3.50 12.25-2.50 -1.15 -1.35 1.8225-1.15 -1.15 0.00 03.00 -1.15 4.15 17.22250.00 -1.15 1.15 1.32251.60 -1.15 2.75 7.56251.15 -1.15 2.30 5.290.90 -1.15 2.05 4.20250.00 -1.15 1.15 1.32250.15 -1.15 1.30 1.690.90 -1.15 2.05 4.20250.10 -1.15 1.25 1.5625
57
Page 58
0.90 -1.15 2.05 4.20250.65 -1.15 1.80 3.24-0.90 -1.15 0.25 0.06251.65 -1.15 2.80 7.84-0.10 -1.15 1.05 1.1025-2.25 -1.15 -1.10 1.21-0.65 -1.15 0.50 0.25-0.40 -1.15 0.75 0.56250.15 -1.15 1.30 1.690.00 -1.15 1.15 1.32251.00 -1.15 2.15 4.62250.50 -1.15 1.65 2.72250.05 -1.15 1.20 1.441.30 -1.15 2.45 6.00250.80 -1.15 1.95 3.8025-2.15 -1.15 -1.00 12.30 -1.15 3.45 11.90250.30 -1.15 1.45 2.10250.15 -1.15 1.30 1.690.30 -1.15 1.45 2.10252.00 -1.15 3.15 9.92250.30 -1.15 1.45 2.1025
total 3037.2
S.D. (σ) = √∑d2/N
S.D. (σ) = 9.060159
58
Page 59
INTERPRETATION:
The above table shows Futures Contract return & risk associated with the price movement of AIR DECCAN for a month of February & March 2012. It has an average return of -1.15 that is -115.00 and risk is 9.060159.
Put OptionCalculation of Returns
Date Strike Price Close Price Returns1-Feb-12 500 26.45 473.552-Feb-12 500 23.90 476.103-Feb-12 500 25.00 475.004-Feb-12 500 21.75 478.255-Feb-12 500 25.45 474.556-Feb-12 500 26.95 473.058-Feb-12 500 27.50 472.509-Feb-12 500 27.20 472.80
10-Feb-12 500 25.70 474.3011-Feb-12 500 26.55 473.4515-Feb-12 500 26.35 473.6516-Feb-12 500 27.40 472.6017-Feb-12 500 27.35 472.6518-Feb-12 500 26.30 473.7019-Feb-12 500 25.80 474.2022-Feb-12 500 25.15 474.8523-Feb-12 500 24.15 475.8524-Feb-12 500 25.20 474.8025-Feb-12 500 24.30 475.7026-Feb-12 500 24.60 475.402-Mar-12 500 27.20 472.803-Mar-12 500 28.30 471.704-Mar-12 500 28.75 471.255-Mar-12 500 28.90 471.108-Mar-12 500 29.55 470.459-Mar-12 500 28.55 471.45
10-Mar-12 500 28.35 471.65
59
Page 60
11-Mar-12 500 28.00 472.0012-Mar-12 500 26.80 473.2015-Mar-12 500 25.65 474.3516-Mar-12 500 26.95 473.0517-Mar-12 500 25.15 474.8518-Mar-12 500 25.00 475.0019-Mar-12 500 25.00 475.0022-Mar-12 500 24.00 476.0023-Mar-12 500 23.35 476.6525-Mar-12 500 27.75 472.25
Total 17529.70Average 473.78
RETURN = strike price – closing priceCalculation of Risk
Returns (X) Expected returns(x) X-exp(x) = D D2473.55 473.78 -0.23 0.0529476.10 473.78 2.32 5.3824475.00 473.78 1.22 1.4884478.25 473.78 4.47 19.9809474.55 473.78 0.77 0.5929473.05 473.78 -0.73 0.5329472.50 473.78 -1.28 1.6384472.80 473.78 -0.98 0.9604474.30 473.78 0.52 0.2704473.45 473.78 -0.33 0.1089473.65 473.78 -0.13 0.0169472.60 473.78 -1.18 1.3924472.65 473.78 -1.13 1.2769473.70 473.78 -0.08 0.0064474.20 473.78 0.42 0.1764474.85 473.78 1.07 1.1449475.85 473.78 2.07 4.2849474.80 473.78 1.02 1.0404475.70 473.78 1.92 3.6864475.40 473.78 1.62 2.6244472.80 473.78 -0.98 0.9604471.70 473.78 -2.08 4.3264471.25 473.78 -2.53 6.4009471.10 473.78 -2.68 7.1824470.45 473.78 -3.33 11.0889471.45 473.78 -2.33 5.4289471.65 473.78 -2.13 4.5369472.00 473.78 -1.78 3.1684473.20 473.78 -0.58 0.3364474.35 473.78 0.57 0.3249473.05 473.78 -0.73 0.5329474.85 473.78 1.07 1.1449475.00 473.78 1.22 1.4884475.00 473.78 1.22 1.4884
60
Page 61
476.00 473.78 2.22 4.9284476.65 473.78 2.87 8.2369472.25 473.78 -1.53 2.3409
Total 110.5738
S.D. (σ) = √∑d2/NS.D. (σ) = 1.728722
INTERPRETATION:
The above table shows put option contract return & risk associated with the price movement of AIR DECCAN for a month of February & March 2012. It has an average return of 473.78that is 47378.00 and risk is 1.728722.
61
Page 62
Wipro FuturesCalculations of the Returns
Date Open Price Close Price Returns1-Feb-12 637.7 672.3 -34.62-Feb-12 689.5 655.1 34.43-Feb-12 661.7 671.75 -10.054-Feb-12 668.55 653.5 15.055-Feb-12 642.1 646 -3.96-Feb-12 645 649 -48-Feb-12 645.95 637.4 8.559-Feb-12 640 654.85 -14.8510-Feb-12 709.2 646.4 62.811-Feb-12 653.85 657.7 -3.8515-Feb-12 664.9 661.45 3.4516-Feb-12 660.55 670.65 -10.117-Feb-12 674.95 671.3 3.6518-Feb-12 668.15 669.8 -1.6519-Feb-12 662.55 666.4 -3.8522-Feb-12 672 670.45 1.5523-Feb-12 669.9 678 -8.124-Feb-12 678.7 673.8 4.925-Feb-12 674.5 671.7 2.826-Feb-12 672.9 678.3 -5.42-Mar-12 679.8 700.6 -20.83-Mar-12 703.2 698.15 5.054-Mar-12 696.85 694.35 2.55-Mar-12 698 686.35 11.658-Mar-12 691.7 696.8 -5.19-Mar-12 700 701.15 -1.1510-Mar-12 701 697.25 3.7511-Mar-12 701.6 712 -10.412-Mar-12 713.1 711.4 1.715-Mar-12 711.15 727.65 -16.516-Mar-12 730 730.1 -0.117-Mar-12 732.15 739.9 -7.7518-Mar-12 721.15 732.15 -1119-Mar-12 738.8 729.9 8.922-Mar-12 723 730.4 -7.423-Mar-12 732 722.8 9.225-Mar-12 722.5 718.9 3.6
Total 2.95Average 0.07973
RETURN = opening price – closing price
Calculation of RiskReturns(X) Expected Return (x) X-exp(x)=D D2
-34.6 0.07973 -34.67973 1202.68
62
Page 63
34.4 0.07973 34.32027 1177.88-10.05 0.07973 -10.12973 102.6115.05 0.07973 14.97027 224.11-3.9 0.07973 -3.97973 15.84-4 0.07973 -4.07973 16.64
8.55 0.07973 8.47027 71.75-14.85 0.07973 -14.92973 222.9062.8 0.07973 62.72027 3933.83-3.85 0.07973 -3.92973 15.443.45 0.07973 3.37027 11.36-10.1 0.07973 -10.17973 103.633.65 0.07973 3.57027 12.75-1.65 0.07973 -1.72973 2.99-3.85 0.07973 -3.92973 15.441.55 0.07973 1.47027 2.16-8.1 0.07973 -8.17973 66.914.9 0.07973 4.82027 23.242.8 0.07973 2.72027 7.40-5.4 0.07973 -5.47973 30.03-20.8 0.07973 -20.87973 435.965.05 0.07973 4.97027 24.702.5 0.07973 2.42027 5.86
11.65 0.07973 11.57027 133.87-5.1 0.07973 -5.17973 26.83-1.15 0.07973 -1.22973 1.513.75 0.07973 3.67027 13.47-10.4 0.07973 -10.47973 109.821.7 0.07973 1.62027 2.63
-16.5 0.07973 -16.57973 274.89-0.1 0.07973 -0.17973 0.03-7.75 0.07973 -7.82973 61.30-11 0.07973 -11.07973 122.768.9 0.07973 8.82027 77.80-7.4 0.07973 -7.47973 55.959.2 0.07973 9.12027 83.183.6 0.07973 3.52027 12.39
Total 8702.54
S.D. (σ) = √∑d2/N
S.D. (σ) = 15.34
63
Page 64
INTERPRETATION:
The above table shows Futures Contract return & risk associated with the price movement of WIPRO for a month of February & March 2012. It has an average return of 0.07973 that is 7.973 and risk is 15.34.
Put OptionsCalculation of Returns
Date Strike Price Close Price Returns1-Feb-12 500 231.50 268.502-Feb-12 500 216.40 283.603-Feb-12 500 234.65 265.354-Feb-12 500 218.25 281.755-Feb-12 500 207.15 292.856-Feb-12 500 210.95 289.058-Feb-12 500 199.05 300.959-Feb-12 500 217.00 283.00
10-Feb-12 500 210.30 289.70
64
Page 65
11-Feb-12 500 218.20 281.8015-Feb-12 500 222.15 277.8516-Feb-12 500 232.15 267.8517-Feb-12 500 233.50 266.5018-Feb-12 500 229.90 270.1019-Feb-12 500 227.80 272.2022-Feb-12 500 230.00 270.0023-Feb-12 500 237.85 262.1524-Feb-12 500 233.65 266.3525-Feb-12 500 230.80 269.2026-Feb-12 500 238.90 261.102-Mar-12 500 242.50 257.503-Mar-12 500 259.65 240.354-Mar-12 500 254.85 245.155-Mar-12 500 256.95 243.058-Mar-12 500 258.60 241.409-Mar-12 500 262.95 237.05
10-Mar-12 500 257.20 242.8011-Mar-12 500 270.25 229.7512-Mar-12 500 270.85 229.1515-Mar-12 500 289.25 210.7516-Mar-12 500 288.25 211.7517-Mar-12 500 299.60 200.4018-Mar-12 500 289.40 210.6019-Mar-12 500 286.90 213.1022-Mar-12 500 288.20 211.8023-Mar-12 500 280.40 219.6025-Mar-12 500 236.75 263.25
Total 9427.30Average 254.79
RETURN = strike price – closing priceCalculation of Risk
Returns(X) Expected Return (x) X-Exp(x)=D D2268.5 254.79 13.71 187.96283.6 254.79 28.81 830.02265.35 254.79 10.56 111.51281.75 254.79 26.96 726.84292.85 254.79 38.06 1448.56289.05 254.79 34.26 1173.75300.95 254.79 46.16 2130.75
283 254.79 28.21 795.80289.7 254.79 34.91 1218.71281.8 254.79 27.01 729.54277.85 254.79 23.06 531.76267.85 254.79 13.06 170.56266.5 254.79 11.71 137.12270.1 254.79 15.31 234.40272.2 254.79 17.41 303.11
65
Page 66
270 254.79 15.21 231.34262.15 254.79 7.36 54.17266.35 254.79 11.56 133.63269.2 254.79 14.41 207.65261.1 254.79 6.31 39.82257.5 254.79 2.71 7.34240.35 254.79 -14.44 208.51245.15 254.79 -9.64 92.93243.05 254.79 -11.74 137.83241.4 254.79 -13.39 179.29237.05 254.79 -17.74 314.71242.8 254.79 -11.99 143.76229.75 254.79 -25.04 627.00229.15 254.79 -25.64 657.41210.75 254.79 -44.04 1939.52211.75 254.79 -43.04 1852.44200.4 254.79 -54.39 2958.27210.6 254.79 -44.19 1952.76213.1 254.79 -41.69 1738.06211.8 254.79 -42.99 1848.14219.6 254.79 -35.19 1238.34263.25 254.79 8.46 71.57
total 27364.89
S.D. (σ) = √∑d2/N
S.D. (σ) = 27.195
66
Page 67
INTERPRETATION:
The above table shows put option contract return & risk associated with the price movement of AIR DECCAN for a month of February & March 2012. It has an average return of 254.79 that is 25479.00 and risk is 27.195.
Bharathi Airtel FuturesContractCalculations of Returns
Date Open price Close price Returns1-Feb-12 307.00 312.45 -5.452-Feb-12 314.80 307.6 7.203-Feb-12 309.60 309.6 0.004-Feb-12 307.95 302.75 5.205-Feb-12 295.00 300.3 -5.306-Feb-12 301.95 301.15 0.808-Feb-12 299.00 309.15 -10.159-Feb-12 307.85 314.1 -6.25
10-Feb-12 313.50 314.7 -1.2011-Feb-12 310.85 313.5 -2.6515-Feb-12 314.00 286.4 27.6016-Feb-12 287.70 273.35 14.3517-Feb-12 274.10 279.35 -5.2518-Feb-12 280.85 281.75 -0.9019-Feb-12 278.30 279.2 -0.9022-Feb-12 281.50 277.4 4.1023-Feb-12 276.10 280.45 -4.3524-Feb-12 280.00 275.85 4.1525-Feb-12 276.00 277.2 -1.2026-Feb-12 278.10 279.55 -1.452-Mar-12 282.40 290.3 -7.903-Mar-12 292.00 291.75 0.254-Mar-12 292.00 293.65 -1.655-Mar-12 294.70 298.15 -3.458-Mar-12 301.00 291.95 9.059-Mar-12 292.20 290.5 1.70
10-Mar-12 291.00 288.55 2.45
67
Page 68
11-Mar-12 231.45 294.55 -63.1012-Mar-12 295.40 298.1 -2.7015-Mar-12 299.35 298.85 0.5016-Mar-12 298.15 295.35 2.8017-Mar-12 296.80 298.9 -2.1018-Mar-12 299.50 300.85 -1.3519-Mar-12 301.10 313.05 -11.9522-Mar-12 306.10 316.05 -9.9523-Mar-12 315.00 307.45 7.5525-Mar-12 304.70 314.4 -9.70
Total -71.20Average -1.92
RETURN = open price – closing price
Calculation of RiskReturns(X) Expected Return(x) X-Exp(x)=D D2
-5.45 -1.92 -3.53 12.46097.20 -1.92 9.12 83.17440.00 -1.92 1.92 3.68645.20 -1.92 7.12 50.6944-5.30 -1.92 -3.38 11.42440.80 -1.92 2.72 7.3984
-10.15 -1.92 -8.23 67.7329-6.25 -1.92 -4.33 18.7489-1.20 -1.92 0.72 0.5184-2.65 -1.92 -0.73 0.532927.60 -1.92 29.52 871.430414.35 -1.92 16.27 264.7129-5.25 -1.92 -3.33 11.0889-0.90 -1.92 1.02 1.0404-0.90 -1.92 1.02 1.04044.10 -1.92 6.02 36.2404-4.35 -1.92 -2.43 5.90494.15 -1.92 6.07 36.8449-1.20 -1.92 0.72 0.5184-1.45 -1.92 0.47 0.2209-7.90 -1.92 -5.98 35.76040.25 -1.92 2.17 4.7089-1.65 -1.92 0.27 0.0729-3.45 -1.92 -1.53 2.34099.05 -1.92 10.97 120.34091.70 -1.92 3.62 13.10442.45 -1.92 4.37 19.0969
-63.10 -1.92 -61.18 3742.992-2.70 -1.92 -0.78 0.60840.50 -1.92 2.42 5.85642.80 -1.92 4.72 22.2784-2.10 -1.92 -0.18 0.0324-1.35 -1.92 0.57 0.3249
68
Page 69
-11.95 -1.92 -10.03 100.6009-9.95 -1.92 -8.03 64.48097.55 -1.92 9.47 89.6809-9.70 -1.92 -7.78 60.5284
Total 5768.224
S.D. (σ) = √∑d2/N
S.D. (σ) = 27.195
INTERPRETATION:
The above table shows Futures Contract return & risk associated with the price movement of BHARATHI AIRTEL for a month of February & March 2012. It has an average return of -1.92 that is -192.00 and risk is 27.195.
69
Page 70
Put OptionsCalculation of the Return
Date Strike Price close Price Returns1-Feb-12 500 112.55 387.452-Feb-12 500 108.95 391.053-Feb-12 500 110.30 389.704-Feb-12 500 105.35 394.655-Feb-12 500 101.30 398.706-Feb-12 500 101.60 398.408-Feb-12 500 109.55 390.459-Feb-12 500 114.35 385.6510-Feb-12 500 116.45 383.5511-Feb-12 500 115.60 384.4015-Feb-12 500 87.00 413.0016-Feb-12 500 92.70 407.3017-Feb-12 500 100.15 399.8518-Feb-12 500 102.80 397.2019-Feb-12 500 99.70 400.3022-Feb-12 500 97.70 402.3023-Feb-12 500 100.75 399.2524-Feb-12 500 96.55 403.4525-Feb-12 500 96.85 403.1526-Feb-12 500 99.95 400.052-Mar-12 500 110.70 389.303-Mar-12 500 112.45 387.554-Mar-12 500 114.05 385.955-Mar-12 500 118.90 381.108-Mar-12 500 114.00 386.009-Mar-12 500 111.70 388.3010-Mar-12 500 108.40 391.6011-Mar-12 500 114.30 385.7012-Mar-12 500 119.45 380.5515-Mar-12 500 119.75 380.2516-Mar-12 500 115.05 384.9517-Mar-12 500 118.25 381.7518-Mar-12 500 120.63 379.3719-Mar-12 500 132.05 367.9522-Mar-12 500 136.45 363.5523-Mar-12 500 127.70 372.3025-Mar-12 500 78.60 421.40
Total 14457.42Average 390.74
RETURN = strike price – closing priceCalculation of Risk
70
Page 71
S.D. (σ) = √∑d2/NS.D. (σ) = 11.67
Returns(X) Expected Return(x) X-Exp(x)=D D2387.45 390.74 -3.29 10.82391.05 390.74 0.31 0.10389.70 390.74 -1.04 1.08394.65 390.74 3.91 15.29398.70 390.74 7.96 63.36398.40 390.74 7.66 58.68390.45 390.74 -0.29 0.08385.65 390.74 -5.09 25.91383.55 390.74 -7.19 51.70384.40 390.74 -6.34 40.20413.00 390.74 22.26 495.51407.30 390.74 16.56 274.23399.85 390.74 9.11 82.99397.20 390.74 6.46 41.73400.30 390.74 9.56 91.39402.30 390.74 11.56 133.63399.25 390.74 8.51 72.42403.45 390.74 12.71 161.54403.15 390.74 12.41 154.01400.05 390.74 9.31 86.68389.30 390.74 -1.44 2.07387.55 390.74 -3.19 10.18385.95 390.74 -4.79 22.94381.10 390.74 -9.64 92.93386.00 390.74 -4.74 22.47388.30 390.74 -2.44 5.95391.60 390.74 0.86 0.74385.70 390.74 -5.04 25.40380.55 390.74 -10.19 103.84380.25 390.74 -10.49 110.04384.95 390.74 -5.79 33.52381.75 390.74 -8.99 80.82379.37 390.74 -11.37 129.28367.95 390.74 -22.79 519.38363.55 390.74 -27.19 739.30372.30 390.74 -18.44 340.03421.40 390.74 30.66 940.04
Total 5040.28
71
Page 72
INTERPRETATION:
The above table shows Call option contract return & risk associated with the price movement of BHARATHI AIRTEL for a month of February & March 2012. It has an average return of 390.74that is 39074.00 and risk is 11.67.
Comparison of Futures Contract
Companies Return RiskAir Deccan -1.15 9.06Wipro 0.079 15.34Bharathi Airtel -1.92 27.19
72
Page 73
Interpretation:
By the above graph we can understand that in Future contract Risk is more than the return for three companies. So we suggest to those three companies to discontinue the future contract to avoid risk.
Comparison of Put Option contract
Companies Return RiskAir Deccan 473.78 1.72Wipro 254.79 27.19Bharathi Airtel 390.74 11.67
73
Page 74
Interpretation:
By the Above graph we can understand that the risk is so less in the Put option for the three companies i.e. Air Deccan, Bharathi Airtel, and Wipro so we recommend to those companies to continue with their contract.
FINDINGS
Risk and Returns are Wipro, Air Deccan, and Bharathi Airtel in futures, but where as in options risk is limited to premium and the profits are Wipro, Air Deccan, and Bharathi Airtel.
In this research it is found that Wipro futures are generated positive returns of 0.079.
Where as in Wipro call option it is found that the returns are positive 254.79.
In this research it is found that Air Deccan futures are generated negative returns of –1.15.
Where as in Air Deccan call option it is found that the returns are positive 473.78.
In this research it is found that Bharathi Airtel futures are generated negative returns of – 1.92.
74
Page 75
Where as in Bharathi Airtel call option it is found that the returns are positive 390.74.
In bullish market the call options writers will get more profit so the investors are suggested to go for a call options holder the options holders get more profit.
In bearish market the call options holders will get more profit so the investors are suggested to go for a call options writer and in put options the option writer get more losses so investors suggested opting as a put option holder.
In cash market the investors has to pay the total money but in derivatives the investors has to pay premium or margin which are some percentage of total money.
Futures and options are mostly used for hedging purpose.
In this research we found that the options are better to invest than futures. In options contract the risk is minimum to the premium.
SUGGESTIONS
The derivative market is newly started in India and it is not know about the futures and
options for many people so SEBI should take actions to create the awareness to the
people about the derivative markets.
The contract size should minimize because the small investors cannot afford this much
of huge premiums.
In order to increase the derivatives market in India the SEBI should revise some of their
regulations like contract size, participations of FII in the derivative market.
In bullish market investors are suggested to go for purchase of futures or purchase of call
options.
75
Page 76
In bearish market investors are suggested to go for sale of futures or purchase of put
options
The investors are suggested to invest on options because the risk is limited and returns
are unlimited rather than futures. In futures the risk and returns are unlimited.
CONCLUSIONS
A derivative is an instrument available in financial market which reduces the risk to a
maximum extent. The risk associated with individual security will be very high to minimize this
risk portfolio construction has been evolved. Mostly portfolios reduce the risk but not to a great
extent. Then in the evolution process these instruments known as derivatives emerged. Derivates
are of four types out of these futures and options become famous these days the investors are
showing much interest in this instrument these futures and options can be traded to minimize the
risk .Using these instrument the present project work has been analyzed to verify whether
actually these futures and options reduce the risk or not. In practical futures and options are
working to the expectations of investors satisfactorily.
76
Page 77
BIBILOGRAPHY
BOOKS AUTHOR NAME
Indian financial system M.Y.KhanFinancial management Prasanna ChandraPublications of national stock exchangeDerivatives Core Module Workbook NCFM material Financial Markets and Services Gordan and Natrajan
WEB SITES:
www.nseindia.com/futures & options/historical datawww.bseindia.comwww.indian capital market.comwww.investopedia.comwww.monrycontrol.comwww.capitaline.comwww.glossary.reuters.comwww.derivativesindia.comwww.sebi.gov.inwww.moneycontrol.comwww.hseindia.orgwww.zenmoney.comwww.indianinfoline.comwww.5paisa.com
SEARCH ENGINES
Google search.com Wikipedia.com Ask.com msn.com
77