Am J Nucl Med Mol Imaging 2015;5(2):183-194 www.ajnmmi.us /ISSN:2160-8407/ajnmmi0003506 Original Article Added value of cost-utility analysis in simple diagnostic studies of accuracy: 18 F-fluoromethylcholine PET/CT in prostate cancer staging Oke Gerke 1,2 , Mads H Poulsen 3 , Poul Flemming Høilund-Carlsen 1,4 1 Department of Nuclear Medicine, Odense University Hospital, Denmark; 2 Centre of Health Economics Research, Department of Business and Economics, Faculty of Business and Social Sciences, University of Southern Den- mark, Denmark; 3 Department of Urology, Odense University Hospital, Denmark; 4 Institute of Clinical Research, Faculty of Health Sciences, University of Southern Denmark, Denmark Received October 31, 2014; Accepted November 18, 2014; Epub January 15, 2015; Published February 1, 2015 Abstract: Diagnostic studies of accuracy targeting sensitivity and specificity are commonly done in a paired design in which all modalities are applied in each patient, whereas cost-effectiveness and cost-utility analyses are usually assessed either directly alongside to or indirectly by means of stochastic modeling based on larger randomized con- trolled trials (RCTs). However the conduct of RCTs is hampered in an environment such as ours, in which technology is rapidly evolving. As such, there is a relatively limited number of RCTs. Therefore, we investigated as to which extent paired diagnostic studies of accuracy can be also used to shed light on economic implications when considering a new diagnostic test. We propose a simple decision tree model-based cost-utility analysis of a diagnostic test when compared to the current standard procedure and exemplify this approach with published data from lymph node staging of prostate cancer. Average procedure costs were taken from the Danish Diagnosis Related Groups Tariff in 2013 and life expectancy was estimated for an ideal 60 year old patient based on prostate cancer stage and prosta- tectomy or radiation and chemotherapy. Quality-adjusted life-years (QALYs) were deduced from the literature, and an incremental cost-effectiveness ratio (ICER) was used to compare lymph node dissection with respective histopatho- logical examination (reference standard) and 18 F-fluoromethylcholine positron emission tomography/computed to- mography (FCH-PET/CT). Lower bounds of sensitivity and specificity of FCH-PET/CT were established at which the replacement of the reference standard by FCH-PET/CT comes with a trade-off between worse effectiveness and lower costs. Compared to the reference standard in a diagnostic accuracy study, any imperfections in accuracy of a diagnostic test imply that replacing the reference standard generates a loss in effectiveness and utility. We conclude that diagnostic studies of accuracy can be put to a more extensive use, over and above a mere indication of sensitiv- ity and specificity of an imaging test, and that health economic considerations should be undertaken when planning a prospective diagnostic accuracy study. These endeavors will prove especially fruitful when comparing several imaging techniques with one another, or the same imaging technique using different tracers, with an independent reference standard for the evaluation of results. Keywords: Diagnostic study, accuracy study, sensitivity, specificity, cost-effectiveness, molecular imaging, positron-emission tomography/computed tomography, 18 F-fluoromethylcholine, prostate cancer, staging Introduction In diagnostic research, imaging techniques are required to detect and localize disease and, thereby, to discriminate between diseased and disease-free (or metastasized and metastasis- free) patients by means of sensitivity and speci- ficity. Diagnostic research in recent decades has been affected by the introduction and increased clinical use of rapidly evolving imag- ing techniques like single-photon emission computed tomography (SPECT), magnetic reso- nance imaging (MRI), positron emission tomog- raphy (PET), PET/computed tomography (PET/ CT), and, most recently, PET/MRI. Sufficient sensitivity and specificity of a test is, though, not considered appropriate as surrogate end- point for clinical benefit which preferably has to be demonstrated by means of randomized con- trolled trials (RCT) in which mortality, morbidity,
Transcript
Am J Nucl Med Mol Imaging 2015;5(2):183-194www.ajnmmi.us /ISSN:2160-8407/ajnmmi0003506
Original Article Added value of cost-utility analysis in simple diagnostic studies of accuracy: 18F-fluoromethylcholine PET/CT in prostate cancer staging
Oke Gerke1,2, Mads H Poulsen3, Poul Flemming Høilund-Carlsen1,4
1Department of Nuclear Medicine, Odense University Hospital, Denmark; 2Centre of Health Economics Research, Department of Business and Economics, Faculty of Business and Social Sciences, University of Southern Den-mark, Denmark; 3Department of Urology, Odense University Hospital, Denmark; 4Institute of Clinical Research, Faculty of Health Sciences, University of Southern Denmark, Denmark
Received October 31, 2014; Accepted November 18, 2014; Epub January 15, 2015; Published February 1, 2015
Abstract: Diagnostic studies of accuracy targeting sensitivity and specificity are commonly done in a paired design in which all modalities are applied in each patient, whereas cost-effectiveness and cost-utility analyses are usually assessed either directly alongside to or indirectly by means of stochastic modeling based on larger randomized con-trolled trials (RCTs). However the conduct of RCTs is hampered in an environment such as ours, in which technology is rapidly evolving. As such, there is a relatively limited number of RCTs. Therefore, we investigated as to which extent paired diagnostic studies of accuracy can be also used to shed light on economic implications when considering a new diagnostic test. We propose a simple decision tree model-based cost-utility analysis of a diagnostic test when compared to the current standard procedure and exemplify this approach with published data from lymph node staging of prostate cancer. Average procedure costs were taken from the Danish Diagnosis Related Groups Tariff in 2013 and life expectancy was estimated for an ideal 60 year old patient based on prostate cancer stage and prosta-tectomy or radiation and chemotherapy. Quality-adjusted life-years (QALYs) were deduced from the literature, and an incremental cost-effectiveness ratio (ICER) was used to compare lymph node dissection with respective histopatho-logical examination (reference standard) and 18F-fluoromethylcholine positron emission tomography/computed to-mography (FCH-PET/CT). Lower bounds of sensitivity and specificity of FCH-PET/CT were established at which the replacement of the reference standard by FCH-PET/CT comes with a trade-off between worse effectiveness and lower costs. Compared to the reference standard in a diagnostic accuracy study, any imperfections in accuracy of a diagnostic test imply that replacing the reference standard generates a loss in effectiveness and utility. We conclude that diagnostic studies of accuracy can be put to a more extensive use, over and above a mere indication of sensitiv-ity and specificity of an imaging test, and that health economic considerations should be undertaken when planning a prospective diagnostic accuracy study. These endeavors will prove especially fruitful when comparing several imaging techniques with one another, or the same imaging technique using different tracers, with an independent reference standard for the evaluation of results.
In diagnostic research, imaging techniques are required to detect and localize disease and, thereby, to discriminate between diseased and disease-free (or metastasized and metastasis-free) patients by means of sensitivity and speci-ficity. Diagnostic research in recent decades has been affected by the introduction and increased clinical use of rapidly evolving imag-
ing techniques like single-photon emission computed tomography (SPECT), magnetic reso-nance imaging (MRI), positron emission tomog-raphy (PET), PET/computed tomography (PET/CT), and, most recently, PET/MRI. Sufficient sensitivity and specificity of a test is, though, not considered appropriate as surrogate end-point for clinical benefit which preferably has to be demonstrated by means of randomized con-trolled trials (RCT) in which mortality, morbidity,
Cost-utility analysis in simple diagnostic studies of accuracy
184 Am J Nucl Med Mol Imaging 2015;5(2):183-194
symptoms, and quality of life are measured [1, 2]. Ideally, analyses examining societal costs and benefits of a given diagnostic imaging tech-nology complete the picture [3].
Cost-effectiveness analysis (CEA) compares alternative interventions using costs and a common effectiveness measure (e.g., correct staging or life-years gained). The results of such comparisons may be stated in terms of costs per unit of effectiveness (e.g. dollars spent per life-year gained) or effectiveness per unit of cost (life-years gained per dollar spent). In this context, the relative cost-effectiveness of alter-native tests can be assessed as long as the alternatives under consideration are not of an exceptionally different scale. In cost-utility anal-ysis (CUA), the incremental cost of an interven-tion is compared to the incremental health improvement attributable to the intervention, where health improvement is for instance mea-sured in quality-adjusted life-years (QALYs) gained [4-6].
Studies demonstrating clinical benefit by improvement of long-term patient outcome as well as studies on cost-effectiveness or cost-utility do require RCTs in order to compare imaging techniques head-to-head. However, studies of this type are rare [7-9] and most of the studies in diagnostic research today are still diagnostic accuracy studies. An alternative approach to RCTs is the application of econom-ic modeling techniques.
Economic modeling is a relatively cheap and effective way of synthesizing existing data and evidence available on the costs and outcomes of alternative interventions [10-13]. In interven-tion trials, for instance, intervention thresholds were introduced as the absolute threshold of disease risk at which intervention becomes acceptable in terms of both efficacy and cost-effectiveness [14, 15].
We propose to utilize simple diagnostic studies of accuracy to assess the incremental cost-effectiveness ratio (ICER) for the comparison of a (new) diagnostic imaging technique and a ref-erence standard diagnostic procedure. Com- pared to the reference standard, any imperfec-tions in accuracy of a new diagnostic imaging technique will indeed imply that replacing the reference standard generates a loss in effec-tiveness. However, lower boundaries of sensi-
tivity and specificity of a new imaging test can be assessed at which the replacement of a standard procedure by the new test comes with a trade-off between worse effectiveness and lower costs. We demonstrate our approach by using data from a recent investigation at our institution in which the value of 18F-fluorome- thylcholine (FCH) PET/CT for lymph node stag-ing in prostate cancer was assessed using pel-vic lymph node dissection (LND) with subse-quent histological examination as the reference standard [16].
Methods
Background on clinical study
The methodology of the clinical study was pub-lished earlier [16]. In brief, between January 2008 and December 2010 FCH-PET/CT was performed in 210 intermediate or high risk patients prior to regional LND and subsequent histological examination (reference standard). The surgical technique comprised an open ret-roperitoneal bilateral pelvic LND that was undertaken through a midline incision, either as part of the radical prostatectomy or as an individual operation. The LND was performed along the medial side of the external iliac ves-sels from the femoral canal up to the bifurca-tion of the internal and external iliac vessels, including the obturator fossa. The LND included most of the lymph nodes of the external iliac, obturator, and hypogastric nodes. The speci-mens were prospectively mapped according to their anatomical location and processed according to standard protocols for the subse-quent histological examination. The result of the histological examination of the lymph nodes was compared with the result of FCH-PET/CT, as obtained by blinded review. Sensitivity and specificity of FCH-PET/CT for the detection of lymph node metastases were estimated to be 0.73 (Wilson score-based 95% confidence interval (95% CI): 0.58-0.84) and 0.88 (95% CI: 0.82-0.92), respectively.
Cost data collection
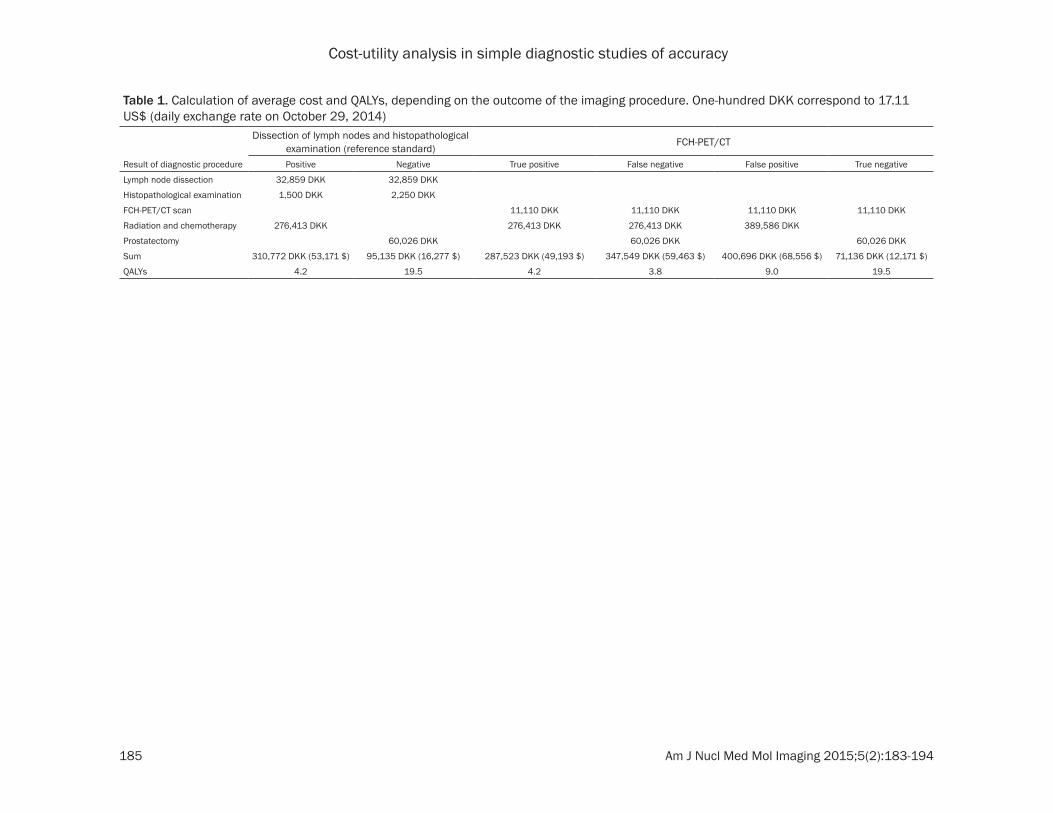
Cost data were collected post hoc in addition to the clinical trial. These comprised costs for lymph node dissection, histological examina-tion of lymph nodes, prostatectomy, radiation and chemotherapy as per the Danish Diagnosis Related Groups Tariff in 2013. Details can be found in Table 1.
Cost-utility analysis in simple diagnostic studies of accuracy
185 Am J Nucl Med Mol Imaging 2015;5(2):183-194
Table 1. Calculation of average cost and QALYs, depending on the outcome of the imaging procedure. One-hundred DKK correspond to 17.11 US$ (daily exchange rate on October 29, 2014)
Dissection of lymph nodes and histopathological examination (reference standard) FCH-PET/CT
Result of diagnostic procedure Positive Negative True positive False negative False positive True negative
Cost-utility analysis in simple diagnostic studies of accuracy
186 Am J Nucl Med Mol Imaging 2015;5(2):183-194
Life-expectancy and QALYs
The expected number of life years remaining was estimated for a 60 year old patient and depended on the stage of disease as indicated by the diagnostic imaging procedure. The fol-lowing numbers were not explicitly available and were deduced from the literature to the best of our knowledge [17-20]:
● True positive (metastatic prostate cancer, radiation and chemotherapy): 8 years.
● False negative (metastatic prostate cancer, prostatectomy): 8 years.
● False positive (localized prostate cancer, radiation and chemotherapy): 14 years.
● True negative (localized prostate cancer, prostatectomy): 20.4 years.
QALYs, i.e., (score per year) x (expected number of life years), for these four outcomes of the diagnostic staging procedure were also not explicitly available and instead deduced from the literature to the best of our knowledge [21-
castration, one year of moderate other disease, one year of heavy other disease.)
● True negative: 0.9 × 2 + 1 × 17 + 0.5 × 1.4 = 19.5 QALYs. (Two years of discomfort due to treatment, but knowledge of being cured, sev-enteen life years in good health, 1.4 years of other disease).
ICER
We observed a prevalence for progressed dis-ease (malignant metastases in the lymph nodes) in 41 (19.5%) of the 210 patients in our clinical study [16]. We modeled the alternative pathways by means of a decision tree (Figure 1) and evaluated the expected cost and expected utility for both FCH-PET/CT and the reference standard accordingly (Table 2), given the esti-mated sensitivity and specificity of FCH-PET/CT of 0.73 and 0.88, respectively. The ICER is then the ratio between the difference in expected cost and the difference in expected utility (FCH-PET/CT minus reference standard).
Apart from abovementioned primary analysis in which the point estimates for sensitivity and
Figure 1. Decision tree model for the detection of lymph node metastases. The estimated prevalence of 0.195 as well as estimates of sensitivity and specificity of FCH-PET/CT stem from the clinical study [16].
24]. Scores were estimated using values between one (good health) and zero (death):
● True positive: 0.7 × 5 + 0.4 + 0.2 + 0.1 = 4.2 QALYs. (Five years of mild disease includ-ing consequences of castra-tion, one year of moderate disease, one year of heavy disease, one year near death.)
● False negative: 0.8 × 2 + 0.5 × 3 + 0.4 + 0.2 + 0.1 = 3.8 QALYs. (Two years of dis-ease including consequences of treatment and disease, three years of mild disease including further treatment and consequences of castra-tion, one year of moderate disease, one year of heavy disease, one year near death.)
● False positive: 0.7 × 12 + 0.4 + 0.2 = 9.0 QALYs. (Twelve years of mild disease includ-ing belief of metastatic dis-ease and consequences of
Cost-utility analysis in simple diagnostic studies of accuracy
187 Am J Nucl Med Mol Imaging 2015;5(2):183-194
specificity of FCH-PET/CT from our clinical study were used, we assessed lower boundaries of sensitivity and specificity of FCH-PET/CT at which the replacement of the reference stan-dard comes with a trade-off between worse effectiveness and lower costs. This was done by varying the levels of sensitivity and specific-ity of FCH-PET/CT in the ICER calculations. These boundaries were then compared to the 95% CI of sensitivity and specificity from our clinical study.
All analyses were performed using SAS 9.1.3 (SAS Institute Inc., Cary, NC, USA) and Stata/MP 13.1 (StataCorp, College Station, TX, USA).
Results
The ICER was -10,760 DKK (-1,841 $) per QALY as the difference in expected cost and the dif-ference in expected utility (FCH-PET/CT minus reference standard) was 11,138 DKK (1,906 $) and -1.0351 QALY, respectively (see also Figure 1 and Table 2). This means that FCH-PET/CT was, given the estimated values of sensitivity and specificity of 0.73 and 0.88, respectively, both more costly and less effective in terms of QALYs than the reference standard. Figure 2 shows the cost-effectiveness plane, in which the abovementioned ICER value of -10,760 DKK (-1,841 $) per QALY corresponds to the point P1 in quadrant II. Points in the four quad-rants have the following interpretation:
● I: FCH-PET/CT is more effective (in terms of QALYs), but also more costly than LND staging.
able ICER for which a hypothetical value of 30,000 $ per QALY was assumed here. Line K divides the plane into cost-effective (lower right) and non-cost-effective outcomes (upper left).
When varying the levels of sensitivity and speci-ficity of FCH-PET/CT, it was found that the spec-ificity of FCH-PET/CT must be at least 0.92 in order to change the sign of the ICER to be posi-tive, meaning here that losses in terms of QALYs were accompanied by monetary savings when moving from the reference standard to FCH-PET/CT. For specificities of 0.92, 0.93, 0.94, and 0.95, the sensitivities needed to exceed 0.78, 0.55, 0.33, and 0.10, respectively, in order to get a positive number as ICER (see filled circles and squares in Figure 3). For instance, the pair (sensitivity, specificity) = (0.78, 0.92) was associated with a difference in expected cost and a difference in expected util-ity of -57 DKK (-9.75 $) and -0.693 QALY, respectively, resulting in an ICER of 82 DKK (14.03 $) per QALY. This value is indicated by point P2 in Figure 2 and still reflects a non-cost-effective result at an ICER benchmark value of 30,000 $ per QALY.
The abovementioned lower boundaries of sen-sitivity and specificity of FCH-PET/CT imply a trade-off between worse effectiveness and lower costs when replacing the reference stan-dard with FCH-PET/CT. Comparing these bound-aries to the 95% CIs of sensitivity and specifici-ty of PET/CT from our clinical study showed that only some values from the upper range of these
Table 2. Calculation of expected cost and expected utility for FCH-PET/CT and the reference standard, according to the decision tree model in Figure 1. One-hundred DKK correspond to 17.11 US$ (daily exchange rate on October 29, 2014)Pathway Probability Cost (DKK) Expected cost (DKK) Utility Expected utilityA 0.195 310,772 60,675 4.2 0.82B 0 371,548 0 3.8 0C 0.805 95,135 76,561 19.5 15.69D 0 423,945 0 9 0Total 1 137,236 16.51E 0.143 287,523 40,979 4.2 0.60F 0.053 347,549 18,321 3.8 0.20G 0.708 71,136 50,378 19.5 13.81H 0.097 400,696 38,696 9 0.87Total 1 148,374 15.48
● II: FCH-PET/CT is less effective and more cost-ly than LND staging, i.e. LND staging dominates FCH-PET/CT.
● III: FCH-PET/CT is less effective, but also less costly than LND staging.
● IV: FCH-PET/CT is more effective and less costly than LND staging, i.e. FCH-PET/CT dominates LND staging.
The blue line K indicates the maximum accept-
Cost-utility analysis in simple diagnostic studies of accuracy
188 Am J Nucl Med Mol Imaging 2015;5(2):183-194
95% CIs (i.e. a specificity of 0.92 and a sensitiv-ity between 0.78 and 0.84; see filled squares in Figure 3) were accompanied by worse effec-tiveness at lower costs when replacing the ref-erence standard with FCH-PET/CT. Figure 4 shows a contour plot which illustrates an increasing ICER with increasing sensitivity and specificity of FCH-PET/CT. The orange area indi-cates combinations of sensitivity and specifici-ty at which the ICER is negative, hence indicat-ing both lower costs and superior effectiveness of the reference standard over FCH-PET/CT. This area accords to the area of unfilled circles and squares in Figure 3. The remaining, i.e. non-orange, area in Figure 4 shows combina-tions of sensitivity and specificity at which the ICER was positive, thereby indicating lower costs of FCH-PET/CT, but favorable utility for the reference standard. Due to the prevalence of progressed disease (19.5%) and its impact on cost calculations (Figure 1, Table 2), even pairs with relatively low sensitivity, but high specificity, were associated with a positive ICER. Only the dark blue area indicates combi-
nations of sensitivity and specificity at which the replacement of LND staging by FCH-PET/CT would be cost-effective, given an ICER bench-mark value of 30,000 $ per QALY (see, for instance, point P3 in Figure 2).
Discussion
The assessment of the cost-effectiveness or the cost-utility of diagnostic imaging techniques like PET/CT does, in principle, require larger scale clinical trials. Such trials are difficult to conduct in an environment in which technology is rapidly evolving and costly. RCTs that also evaluate cost-effectiveness or cost-utility rep-resent a study design scarcely found in clinical trials that evaluate non-invasive imaging modalities [27, 28]. Moreover, not many cost-effectiveness analyses for PET/CT were under-taken in cancer imaging prior to 2010 [29, 30]. Recent systematic reviews on the cost-effec-tiveness of PET and PET/CT in cancer and non-cancer indications and of 18F-Fluorodeoxyglu- cose PET in tumors other than lung cancer
Figure 2. Cost-effectiveness plane (adapted from [25] (p.212) and [26] (p.12)). The blue line K divides the plane into cost-effective (lower right: I A, III B, IV) and non-cost-effective areas (upper left: I B, II, III A). Here, line K is based on a hypothetical benchmark value of 30,000 $ per QALY.
Cost-utility analysis in simple diagnostic studies of accuracy
189 Am J Nucl Med Mol Imaging 2015;5(2):183-194
Figure 3. Indication of pairs (sensitivity, specificity) for which the expected cost and the expected utility of FCH-PET/CT were greater than and less than those of the reference standard, respectively, thereby implying a negative ICER (unfilled circles and squares) and for which both the expected cost and the expected utility of FCH-PET/CT were less than those of the reference standard, yielding a positive ICER (filled circles and squares). The estimated values of sensitivity and specificity of FCH-PET/CT from our clinical study and the respective 95% confidence intervals are shown (squares). The prevalence of malignant lymph node metastases was 0.195 [16].
Cost-utility analysis in simple diagnostic studies of accuracy
190 Am J Nucl Med Mol Imaging 2015;5(2):183-194
comprised only 47 and 16 studies, respectively [28, 31]. Modeling techniques remain the way to proceed in generating and synthesizing the economic evidence efficiently in order to inform decision makers regarding PET [32].
Our approach is a simple, applied example of a cohort model-based cost-utility analysis of a diagnostic test for lymph node staging of pros-tate cancer in which we take the perspective of the hospital. The model is essentially a deci-sion tree, with crude life expectancy estimates for each endpoint. It does not replace the assessment of cost-effectiveness or cost-utility in clinical trials by means of more sophisticated stochastic modeling or, whenever possible, in addition to RCTs. However, facing scarce evalu-ative resources, we propose an extended use of simple diagnostic studies of accuracy. An evaluation of lower boundaries of sensitivity and specificity at which the replacement of the reference standard comes with a trade-off between worse effectiveness and lower costs is easily performed and gives valuable insight
into the potential economic burden caused by new diagnostic procedures. Obviously, these lower economic thresholds of sensitivity and specificity must also be assessed from a clini-cal point of view, not just an economical one, as, for instance, only relatively large values of sensitivity and specificity of FCH-PET/CT will support the replacement of lymph node dissec-tion by FCH-PET/CT scanning in the future. In our example, the former clinical study results indicated that from a clinical point of view FCH-PET/CT was not sufficiently accurate to replace the reference procedure. This post hoc cost-effectiveness assessment pointed to values at the upper range of the 95% CI of accuracy mea-sures (i.e. a specificity of 0.92 and a sensitivity between 0.78 and 0.84) at which worse effec-tiveness at least comes along with lower costs when replacing the reference standard with FCH-PET/CT.
The histological examination of the lymph nodes in our clinical study [16] was done according to standard protocols. Later, fellow
Figure 4. ICER of FCH-PET/CT in prostate cancer patients depending on varying levels of sensitivity and specificity. One-hundred DKK correspond to 17.11 US$ (daily exchange rate on October 29, 2014). The prevalence of malignant lymph node metastases was 0.195 [16].
Cost-utility analysis in simple diagnostic studies of accuracy
191 Am J Nucl Med Mol Imaging 2015;5(2):183-194
colleagues of ours reinvestigated the lymph nodes from all 169 patients of whom the lymph nodes were judged to be negative in the stan-dard examination by means of an extended pathological examination, which is a costly and time-consuming procedure [33]. The extended pathological examination included a 100-μm deep haematoxylin and eosin (HE) section fol-lowed by a slide stained with cytokeratin AE1/AE3 and then by four HE sections at 0.5-mm intervals. The standard pathological examina-tion detected 41 patients with malignant lymph node involvement, whereas the extended path-ological examination revealed 5 additional patients with lymph node metastases. This means that the sensitivity of the reference pro-cedure in our example could be assessed as low as 89.1%, whereas it is still reasonable to assume a specificity of the reference proce-dure of 100%. Then, the lower boundaries of sensitivity and specificity at which the ICER becomes positive decrease slightly to the pairs (sensitivity, specificity) = (0.90, 0.91), (0.67, 0.92), (0.44, 0.93), and (0.22, 0.94), thereby comprising additional pairs from the estimated 95% CI of sensitivity and specificity of FCH-PET/CT as compared to assuming the reference standard to be perfect. Besides, sensitivity and specificity of FCH-PET/CT need also to be reas-sessed on these grounds (here, a reclassifica-tion of these 5 patients would actually lead to a slightly decreased sensitivity of 0.67 (95% CI: 0.53-0.79), whereas specificity remains unch- anged). The consequence of assuming an imperfect reference procedure is a larger num-ber of sensitivity/specificity pairs for which switching to a new imaging test could be of interest from an economical point of view and emphasizes the outstretched reach of the valid-ity of the reference standard on both the accu-racy and the cost-effectiveness assessment of competing tests.
PET/CT is a technology that is rapidly evolving and continually improving, most likely resulting in improved sensitivity and specificity of any given tracer. As a consequence, any prediction of the economic burden of PET/CT will either hold (when sensitivity and specificity are not subjected to significant change despite techno-logical advancement) or will be overestimated, i.e., a conservative estimation, when re-visited later (when sensitivity and specificity actually are subjected to significant improvements due
to technological advancement). According to this, any economic assessment today can be considered a lower boundary of the actual eco-nomic burden tomorrow when technology has improved since the economic assessment.
Limitations of our study comprise its retrospec-tive nature, working with a base-case scenario of a typical 60 year old patient only, and the extent to which costs and QALYs were assessed post hoc, failing to comprise ranges for both costs and QALYs and merely using point esti-mates instead, thereby failing to provide sup-plementary sensitivity analyses. Using fixed values does, indeed, influence the calculated numbers, but not necessarily the principles applied. Further limitations of our study are the relatively short time horizon, the disregard of some form of discounting of costs and benefits in order to consider their present value, and the hospital perspective that we take rather than a more societal point of view. We did not consider side effects of LND, radiation and chemothera-py, or prostatectomy which entails an over-sim-plification of the clinical setting. All in all, the ICER and, thereby, the concrete lower boundar-ies of sensitivity and specificity derived depend heavily on our assumptions made. However, we would like to stress the added value of our approach in principle and do not claim robust-ness of the derived lower boundaries of sensi-tivity and specificity against model variations.
Future research on the added value of cost-utility analysis in diagnostic studies of accuracy in other clinical settings will improve our approach by bearing the following issues in mind:
● Tariff-based cost estimation is far from actual costs; costs should be, whenever possible, estimated using claims data or accounted costs on a per-patient basis in order to enable the assessment of cost distributions across patients and patient groups. However, tariff-based cost data may be the only available source in countries like Denmark.
● Instead of using fixed values of point estimates for costs, life years, or utility index, ranges should be applied. Costs differ greatly between different age groups/cancer stage groups, those who received different diagno-sis/treatment options, or those with and with-out operative complications. Also life-years
Cost-utility analysis in simple diagnostic studies of accuracy
192 Am J Nucl Med Mol Imaging 2015;5(2):183-194
vary greatly. At least, 95% CI for the mean value of costs/life years should be applied to the cost-utility sensitivity analysis.
● Quality of life scores in a healthy population typically average around 0.85 on a scale of 0 to 1. Even an advanced stage group of patients rarely score, on average, less than 0.3. If suit-able literature on the long-term quality of life of patients’ post-diagnostic tests is not available, looking beyond the cancer form under consid-eration to other cancers may prove beneficial in order to get an idea of average quality of life scores. Expert elicitation can then be used to adjust these scores depending on how the can-cer form under consideration is felt to differ.
● The derivation of a utility index by measuring patients’ preferences is, generally speaking, a challenging endeavour and methods used are various (e.g. Visual Analogue Scale, time trade-off, or standard gamble). Cost-effectiveness analysis using clinical endpoints such as sur-vival or time-to-progression as effectiveness measures is probably easier to convey to clini-cians and policy makers as it makes use of more direct measures of patient-benefit, being independent of patient preferences and the measurement thereof.
● Probabilistic sensitivity analysis sheds light on the implications of the uncertainty of the model by investigating the consequences of choosing alternative, plausible values for quali-ty of life scores, survival, cost of treatment, starting age of the population in the model, and the results of the diagnostic imaging test.
● A cost-effectiveness threshold by means of a benchmark ICER value is needed to get context of what QALY benefit would have to be seen to make a diagnostic imaging test cost-effective. The ICER is of little value without it and the risk is that international thresholds are then consid-ered that might not be representative for the country to which the respective study results are supposed to apply.
In 2013, Consolidated Health Economic Eva- luation Reporting Standards (CHEERS) were published in order to consolidate and update former health economic evaluation guidelines into one current, useful reporting guidance doc-ument, including a 24-item checklist [34].
Conclusions
Simple diagnostic studies of accuracy can be put to a more extensive use, over and above a mere indication of sensitivity and specificity of an imaging test. An evaluation of lower bound-aries of sensitivity and specificity can be per-formed and gives valuable insight into the eco-nomic burden of new diagnostic procedures or tracers. Compared to the reference standard in a diagnostic accuracy study, any imperfections in accuracy of a diagnostic test imply that replacing the reference standard generates a loss in effectiveness and utility. In our example, substituting the conventional staging proce-dure with FCH-PET/CT would produce a loss, and not a minor one, due to the clinically ineffi-cient sensitivity and specificity of FCH-PET/CT. Giving our study’s limitations, we cannot claim cost-effectiveness of FCH-PET/CT in staging prostate cancer, but we have hopefully stimu-lated further perspectives to the planning and evaluation of simple diagnostic studies of accuracy.
We focused on the comparison of a non-inva-sive imaging technique and the current, inva-sive reference procedure in that respective indication. Analogously, cost-utility and cost-effectiveness analyses using ICERs can and should be done especially in paired diagnostic studies of accuracy when comparing several imaging techniques with one another, or the same imaging technique using different trac-ers, with an independent reference standard for the evaluation of results. This will enable to rank order several different imaging techniques from an economical point of view, supplement-ed by a graphical display by means of a cost-effectiveness plane, which completes the pic-ture on top of the imaging techniques’ clinical assessments. Health economic considerations should be undertaken when planning any pro-spective diagnostic accuracy study in order to investigate if adding cost-utility or cost-effec-tiveness analysis to sensitivity and specificity determination of diagnostic tests improves the ability to identify the better performing alterna-tive between competing diagnostic modalities when each are referenced to a gold standard.
Cost-utility and cost-effectiveness analyses involve various challenges. However, modalities (or tracers) that also seem to be economically
Cost-utility analysis in simple diagnostic studies of accuracy
193 Am J Nucl Med Mol Imaging 2015;5(2):183-194
defensible will be easier to argue for when it comes to regular use in daily clinical practice (such as in Denmark) or reimbursement (such as in the US or Germany).
Acknowledgements
The authors would like to thank Anette Albæk for retrieving the Danish Diagnosis Related Groups Tariff data for 2013 and several anony-mous reviewers for their constructive com-ments which helped us improve earlier versions of this manuscript significantly.
Address correspondence to: Dr. Oke Gerke, Depart- ment of Nuclear Medicine, Odense University Hos- pital, Denmark. E-mail: [email protected]
References
[1] Schünemann HJ, Oxman AD, Brozek J, Glaszi-ou P, Jaeschke R, Vist GE, Williams JW Jr, Kunz R, Craig J, Montori VM, Bossuyt P, Guyatt GH; GRADE Working Group. Grading quality of evi-dence and strength of recommendations for diagnostic tests and strategies BMJ 2008; 336: 1106-1110.
[2] Tunis SR, Benner J, McClellan M. Comparative effectiveness research: Policy context, meth-ods development and research infrastructure. Stat Med 2010; 29: 1963-1976.
[3] Fryback DG, Thornbury JR. The efficacy of diag-nostic imaging. Med Decis Making 1991; 11: 88-94.
[4] Buck AK, Herrmann K, Stargardt T, Dechow T, Krause BJ, Schreyögg J. Economic evaluation of PET and PET/CT in oncology: evidence and methodologic approaches. J Nucl Med Technol 2010; 38: 6-17.
[5] Drummond MF, Sculpher MJ, Torrance GW, O’Brien BJ, Stoddart GL. Methods for the eco-nomic evaluation of health care programmes. 3rd edition. Oxford: Oxford University Press; 2005.
[6] Riegelman RK. Studying a study and testing a test: reading evidence-based health research. 6th edition. Philadelphia: Lippincott Williams and Wilkins; 2012.
[7] Ferrante di Ruffano L, Davenport C, Eisinga A, Hyde C, Deeks JJ. A capture-recapture analysis demonstrated that randomized controlled tri-als evaluating the impact of diagnostic tests on patient outcomes are rare. J Clin Epidemiol 2012; 65: 282-287.
[8] Scheibler F, Zumbe P, Janssen I, Viebahn M, Schroer-Gunther M, Grosselfinger R, Hausner E, Sauerland S, Lange S. Randomized Con-trolled Trials on PET: a systematic review of top-
ics, design, and quality. J Nucl Med 2012; 53: 1016-1025.
[9] Siepe B, Høilund-Carlsen PF, Gerke O, Weber WA, Motschall E, Vach W. The move from ac-curacy studies to randomized trials in PET: Cur-rent status and future directions. J Nucl Med 2014; 55: 1228-1234.
[10] Schaafsma JD, van der Graaf Y, Rinkel GJ, Buskens E. Decision analysis to complete diag-nostic research by closing the gap between test characteristics and cost-effectiveness. J Clin Epidemiol 2009; 62: 1248-1252.
[11] Trikalinos TA, Siebert U, Lau J. Decision-analyt-ic modeling to evaluate benefits and harms of medical tests: uses and limitations. Med Decis Making 2009; 29: E22-29.
[12] Sutton AJ, Cooper NJ, Goodacre S, Stevenson M. Integration of meta-analysis and economic decision modeling for evaluating diagnostic tests. Med Decis Making 2008; 28: 650-667.
[13] Briggs A, Sculpher M. An Introduction to Mar-kov Modelling for Economic Evaluation. Phar-macoeconomics 1998; 13: 397-409.
[14] Borgström F, Johnell O, Kanis JA, Jönsson B, Rehnberg C. At what hip fracture risk is it cost-effective to treat? International intervention thresholds for the treatment of osteoporosis. Osteoporos Int 2006; 17: 1459-1471.
[15] Johannesson M. At what coronary risk level is it cost-effective to initiate cholesterol lowering drug treatment in primary prevention? Eur Heart J 2001; 22: 919-925.
[16] Poulsen MH, Bouchelouche K, Høilund-Carlsen PF, Petersen H, Gerke O, Steffansen S, Marcus-sen N, Svolgaard N, Vach W, Geertsen U, Wal-ter S. [18F]fluoromethylcholine (FCH) positron emission tomography/computed tomography (PET/CT) for lymph node staging of prostate cancer: a prospective study of 210 patients. BJU Int 2012; 110: 1666-1671.
[17] Bill-Axelson A, Holmberg L, Ruutu M, Garmo H, Stark JR, Busch C, Nordling S, Häggman M, An-dersson SO, Bratell S, Spångberg A, Palmgren J, Steineck G, Adami HO, Johansson JE; SPCG-4 Investigators. Radical prostatectomy versus watchful waiting in early prostate cancer. N Engl J Med 2011; 364: 1708-1717.
[18] Aus G, Nordenskjöld K, Robinson D, Rosell J, Varenhorst E. Prognostic factors and survival in node-positive (N1) prostate cancer-a pro-spective study based on data from a Swedish population-based cohort. Eur Urol 2003; 43: 627-631.
[19] Chodak GW, Thisted RA, Gerber GS, Johansson JE, Adolfsson J, Jones GW, Chisholm GD, Mos-kovitz B, Livne PM, Warner J. Results of con-servative management of clinically localized prostate cancer. N Engl J Med 1994; 330: 242-248.
Cost-utility analysis in simple diagnostic studies of accuracy
194 Am J Nucl Med Mol Imaging 2015;5(2):183-194
[20] Damber JE, Aus G. Prostate cancer. Lancet 2008; 371: 1710-1721.
[21] Eton DT, Lepore SJ. Prostate cancer and health-related quality of life: a review of the lit-erature. Psychooncology 2002; 11: 307-326.
[22] Steineck G, Helgesen F, Adolfsson J, Dickman PW, Johansson JE, Norlén BJ, Holmberg L; Scandinavian Prostatic Cancer Group Study Number 4. Quality of life after radical prosta-tectomy or watchful waiting. N Engl J Med 2002; 347: 790-796.
[23] Rosenfeld B, Roth AJ, Gandhi S, Penson D. Dif-ferences in health-related quality of life of prostate cancer patients based on stage of cancer. Psychooncology 2004; 13: 800-807.
[24] Johansson E, Bill-Axelson A, Holmberg L, Onelöv E, Johansson JE, Steineck G; Scandina-vian Prostate Cancer Group Study No 4. Time, symptom burden, androgen deprivation, and self-assessed quality of life after radical pros-tatectomy or watchful waiting: the Randomized Scandinavian Prostate Cancer Group Study Number 4 (SPCG-4) clinical trial. Eur Urol 2009; 55: 422-430.
[25] Black WC. The CE plane: a graphic representa-tion of cost-effectiveness. Med Decis Making 1990; 10: 212-214.
[26] Gray AM, Clarke PM, Wolstenholme JL, Word-sworth S. Applied methods of cost-effective-ness analysis in health care. Oxford: Oxford University Press; 2011.
[27] Buck AK, Herrmann K, Schreyögg J. PET/CT for staging lung cancer: costly or cost-saving? Eur J Nucl Med Mol Imaging 2011; 38: 799-801.
[28] Gerke O, Hermansson R, Hess S, Schifter S, Vach W, Høilund-Carlsen PF. Cost-effective-ness of PET and PET/Computed Tomography: a systematic review. PET Clin 2015; 10: 105-124.
[29] De Wever W, Coolen J, Verschakelen JA. Inte-grated PET/CT and cancer imaging. JBR-BTR 2009; 92: 13-19.
[30] Langer A. A systematic review of PET and PET/CT in oncology: A way to personalize cancer treatment in a cost-effective manner? BMC Health Serv Res 2010; 10: 283.
[31] Annunziata S, Caldarella C, Treglia G. Cost-ef-fectiveness of Fluorine-18-Fluorodeoxyglucose positron emission tomography in tumours oth-er than lung cancer: A systematic review. World J Radiol 2014; 6: 48-55.
[32] Dahabreh IJ, Gatsonis C. A flexible, multifacet-ed approach is needed in health technology assessment of PET. J Nucl Med 2014; 55: 1225-1227.
[33] Engvad B, Poulsen MH, Staun PW, Walter S, Marcussen N. Histological step sectioning of pelvic lymph nodes increases the number of identified lymph node metastases. Virchows Arch 2014; 464: 45-52.
[34] Husereau D, Drummond M, Petrou S, Carswell C, Moher D, Greenberg D, Augustovski F, Briggs AH, Mauskopf J, Loder E; CHEERS Task Force. Consolidated Health Economic Evaluation Re-porting Standards (CHEERS) statement. Value Health 2013; 16: e1-5.


![18F]FMCH PET/CT biomarkers and similarity analysis to rene ...](https://static.documents.pub/doc/80x56/623d3660b7458d4b3c40f8e5/18ffmch-petct-biomarkers-and-similarity-analysis-to-rene-.jpg)


