Correlating Tube Failures with Operating Severity Detailed report on the results of an extensive survey of reformer catalyst tube failure experience in side- and bottom-fired reformer furnaces. R. M. Osman and P. A. Ruziska, Exxon Chemical Co., Florham Park, N. J. The AICLE Symposia on Ammonia Plants and Related Facilities have included a number of papers on failure statistics for reformer catalyst tubes (1, 2, 3, 4). The data was primarily based on experiences of plants having similar top-fired furnace designs. Little quantita- tive comparison of failure data with operating severity was included. This is a report on results of a survey of reformer catalyst tube failure experience in side- and bottom-fired reformer furnaces. To obtain this failure ex- perience, a questionnaire was mailed to operators of such furnaces in November, 1974. To permit correlation of tube failure frequency with operating severity, furnace operating data was requested along with tube failure in- formation. In response, 30 completed questionnaires were re- ceived. Responses represented ammonia, hydrogen, and methanol plants, Selas, Foster-Wheeler, Chemico, and Exxon furnace designs, and both staggered and straight tube row arrangements. All furnaces use HK-40 for their tube material, although one had recently installed a few Manurite 36X tubes (Manoir-Pompey proprietary alloy). A small number of internally machined HK-40 tubes were also reported. The furnaces reporting contain a total of more than 5,500 catalyst tubes, and at the time of ques- tionnaire completion, had amassed more than 40 thousand tube-years of operating experience. The primary conclusions reached from an analysis of the questionnaire data are as follows: 1. Most reported reformer catalyst tube failures and preventive replacements were due to creep rupture (primarily from long-term aging but with significant num- bers attributed to localized overheating or plugging/ coking). 2. Other major causes of failures and preventive re- placements were outlet pigtail/coupling problems-, severe bowing, carburization (indicated by inspection), and tube weld cracks. Furnaces with staggered tube rows ac- counted for most of the bowing and outlet pigtail/coupling problems. 3. The Weibull probability distribution gives generally excellent fits to individual plant creep rupture data, and thus can be used to predict tube failure frequency vs. time. 4. Median creep rupture failure times predicted from Weibull analysis can be correlated atainst operating se- verity, with severity defined in terms of a Larson-Miller analysis using tube metal temperature (TMT) and tube stress level. 5. Tube life predictions based on Larson-Miller analysis tended to be optimistic. 6. Severity calculations based on computer predicted TMT's gave better correlations (less scatter) than those based on measured TMT's. 7. No significant difference in severity vs. median fai- lure time correlation among the various furnace designs was noted. Creep rupture predominant failure mode Of the 30 plants responding, 24 reported experiencing one or more catalyst tube failures. A total of 818 tube fail- ures, or incipient failures requiring preventive replace- ment, were reported (excluding failures due to outlet header problems—reported by two plants). The break- down of the reported failures and preventive replacements among the various reported causes is given in Table 1. The table shows that 71% of all failures or preventive replacements reported were .due to a creep rupture mechanism. Even excluding failures due to local over- heating, plugging or coking, more than 2/3 of the fail- ures were reported as being from creep rupture. It can therefore be concluded that creep rupture (from now on referring only to creep ruptures due to aging) was the predominant mode of reformer catalyst tube failure. This statement must be tempered somewhat by the fact that some reported creep rupture failures could have been due to an unrecorded local overheating situation. Also, 343 of the 555 reported creep rupture failures occurred at 3.of the 21 plants which experienced such failures. The outlet pigtail/coupling failure (or preventive re- placement) category represented almost 15% of the total reported. This category included pigtail weld cracks, out- let coupling cracks, and "weldolet" bulging and ruptures. Note that none of these can actually be considered as tube failures. Most (> 80%) of the outlet pigtail/coupling problems were in a furnace having staggered tube rows, and where the thermal cycling of long vs. short pigtails was given primary blame for the failures. Bowing problems were blamed directly for more than 8% of the reported failures/replacements, and were also cited as secondary problems contributing to creep rupture failures at three plants. Two-thirds of the plants reporting bowing problems had staggered tube rows. More signifi- cantly, these staggered tube row plants accounted for 97% 42
Transcript
Correlating Tube Failures with Operating SeverityDetailed report on the results of an extensive survey of reformercatalyst tube failure experience in side- and bottom-fired reformerfurnaces.
R. M. Osman and P. A. Ruziska,Exxon Chemical Co.,Florham Park, N. J.
The AICLE Symposia on Ammonia Plants and RelatedFacilities have included a number of papers on failurestatistics for reformer catalyst tubes (1, 2, 3, 4).
The data was primarily based on experiences of plantshaving similar top-fired furnace designs. Little quantita-tive comparison of failure data with operating severitywas included. This is a report on results of a survey ofreformer catalyst tube failure experience in side- andbottom-fired reformer furnaces. To obtain this failure ex-perience, a questionnaire was mailed to operators of suchfurnaces in November, 1974. To permit correlation oftube failure frequency with operating severity, furnaceoperating data was requested along with tube failure in-formation.
In response, 30 completed questionnaires were re-ceived. Responses represented ammonia, hydrogen, andmethanol plants, Selas, Foster-Wheeler, Chemico, andExxon furnace designs, and both staggered and straighttube row arrangements. All furnaces use HK-40 for theirtube material, although one had recently installed a fewManurite 36X tubes (Manoir-Pompey proprietary alloy).A small number of internally machined HK-40 tubes werealso reported. The furnaces reporting contain a total ofmore than 5,500 catalyst tubes, and at the time of ques-tionnaire completion, had amassed more than 40 thousandtube-years of operating experience.
The primary conclusions reached from an analysis ofthe questionnaire data are as follows:
1. Most reported reformer catalyst tube failures andpreventive replacements were due to creep rupture(primarily from long-term aging but with significant num-bers attributed to localized overheating or plugging/coking).
2. Other major causes of failures and preventive re-placements were outlet pigtail/coupling problems-, severebowing, carburization (indicated by inspection), and tubeweld cracks. Furnaces with staggered tube rows ac-counted for most of the bowing and outlet pigtail/couplingproblems.
3. The Weibull probability distribution gives generallyexcellent fits to individual plant creep rupture data, andthus can be used to predict tube failure frequency vs.time.
4. Median creep rupture failure times predicted fromWeibull analysis can be correlated atainst operating se-verity, with severity defined in terms of a Larson-Milleranalysis using tube metal temperature (TMT) and tube
stress level.5. Tube life predictions based on Larson-Miller
analysis tended to be optimistic.6. Severity calculations based on computer predicted
TMT's gave better correlations (less scatter) than thosebased on measured TMT's.
7. No significant difference in severity vs. median fai-lure time correlation among the various furnace designswas noted.
Creep rupture predominant failure mode
Of the 30 plants responding, 24 reported experiencingone or more catalyst tube failures. A total of 818 tube fail-ures, or incipient failures requiring preventive replace-ment, were reported (excluding failures due to outletheader problems—reported by two plants). The break-down of the reported failures and preventive replacementsamong the various reported causes is given in Table 1.
The table shows that 71% of all failures or preventivereplacements reported were .due to a creep rupturemechanism. Even excluding failures due to local over-heating, plugging or coking, more than 2/3 of the fail-ures were reported as being from creep rupture.
It can therefore be concluded that creep rupture (fromnow on referring only to creep ruptures due to aging) wasthe predominant mode of reformer catalyst tube failure.This statement must be tempered somewhat by the factthat some reported creep rupture failures could have beendue to an unrecorded local overheating situation. Also,343 of the 555 reported creep rupture failures occurred at3.of the 21 plants which experienced such failures.
The outlet pigtail/coupling failure (or preventive re-placement) category represented almost 15% of the totalreported. This category included pigtail weld cracks, out-let coupling cracks, and "weldolet" bulging and ruptures.Note that none of these can actually be considered as tubefailures. Most (> 80%) of the outlet pigtail/couplingproblems were in a furnace having staggered tube rows,and where the thermal cycling of long vs. short pigtailswas given primary blame for the failures.
Bowing problems were blamed directly for more than8% of the reported failures/replacements, and were alsocited as secondary problems contributing to creep rupturefailures at three plants. Two-thirds of the plants reportingbowing problems had staggered tube rows. More signifi-cantly, these staggered tube row plants accounted for 97%
42
Table 1. Summary tabulation of reported primary failures
Reported primary failure or No. of Percent of No. of plantspreventive replacement cause failures total reporting
of the tubes removed due to bowing as the primary re-ported mechanism.
Carburization, as indicated by magnetic inspection, wascited as the reason for preventive tube replacement at fourplants. No actual failures were reported, however.
Tube weld cracks accounted for about 2% of the re-ported failures. Of these, about half were reported asbeing at the top flange weld. For the rest, no location wasgiven, so it is not known whether top flange welds orfirebox welds were at fault.
In the "other" category, two problem types were re-corded. One tube failed due to thermal shock from steamcarryover, and another was preventively removed due toheavy pitting (cause not recorded).
Type of data requested in questionnaire
Completed questionaires contained a summary of thefurnace tube replacement failure history. Specific data re-quested for failed for replaced tubes were: time of failureor replacement; whether replaced before failure or actu-ally failed; type of failure or reason for replacement; andany changes in specification for replacement tube.
Also requested in the failure history section of thequestionnaire was a summary of the present ages of alltubes currently in the furnace. Usually (but unfortunatelynot always) the questionnaire data was sufficient to estab-lish a complete picture of what had happened to the vari-ous furnace tubes.
Since a primary interest was creep rupture failures,special attention was given to data describing failures orreplacements due to that mechanism. One problem washow to handle data on tubes that were replaced due to in-cipient creep rupture (usually indicated by severe bulging)before they had actually failed. To consider them as fail-ures at the time of replacement would bias the analysistoward earlier failure times, whereas to ignore these tubescompletely would give a very optimistic picture of tubelife. As a reasonable compromise, it was assumed that alltubes preventively replaced due to incipient creep rupturewould actually have failed within 12 months of the re-
ported replacement time, had they been left in service.Inasmuch as a probablistic analysis of creep failure data
requires cumulative fractions of tubes failed as a functionof time, special attention had to be paid to properly defin-ing the total population of tubes that the failures shouldbe referenced to. The situation is complicated by the factthat, in most cases, failed tubes are replaced by newtubes, which usually remain in the furnace for signifi-cantly long periods, and which sometimes fail themselves.Also, tubes often fail (or are replaced) for reasons otherthan creep rupture of incipient creep rupture.
To handle these difficulties, the following approacheswere used:
1. For plants having new tubes installed as replace-ments, several tube populations were considered, eachhaving different total service times. When computingcumulative failure fraction for time t, the numerator is thecumulative number of failures at time t for all tube popu-lations having service times equal to or greater than t, andthe denominator is the total number of tubes in all suchpopulations.
2. Tubes which, at time t, fail and/or are removed forreasons other than creep rupture, were considered to.bepart of the total tube population up until time t, but wereeliminated from the population afterwards. Note thattubes whose failures and/or removals were attributed tocreep rupture were considered to be part of their originalpopulation for the full life of that population.
For some responding plants, the data indicates veryhigh failure rates during the early life of the plants, withconsiderably lower failure rates later on. Since the startupand early post-startup phases of plant operation often re-sult in severe upsets in furnace operation, it was assumedthat the failure vs. time data on the initial populations oftubes from such plants were not representative. In thesecases, only the failure data on subsequent tube popula-tions were used in the general correlation work.
Use Of Weibull probability distribution
In correlating reformer tube failure rates against operat-
43
ing severity, it was decided to use the median time tocreep rupture failure as the correlation basis. This was de-fined as the time required to fail 50% of the tubes in agiven population operating at a given severity.
This basis has the advantage of being independent ofany maldistribution of firing, process gas flow, coking,metal defects, etc., among the various tubes in a givenfurnace. Theoretically at least, two furnaces operating atthe same severity but with different degrees of tube-to-tube maldistribution, would have the same median failuretime. Data from two such hypothetical furnaces wouldshow more early failures, but a lower cumulative failurevs. time slope, for the furnace with more maldistributionthan for the more evenly balanced furnace. However, thetwo cumulative failure vs. time curves would cross eachother at the 50% failure point.
Of the 30 plants responding to the reformer tube failurequestionnaire, 12 reported having either no creep rupturefailures, or only one. Therefore, the data for these plantscould not be used in formulating a correlation betweenmedian failure time and operating severity, because atleast two data points are needed to make a projection tothe 50% failure time.
Of the remaining 18 plants responding, all of which re-ported two or more creep rupture failures or replace-ments, 16 provided failure data that were sufficiently de-scriptive to yield complete pictures of their failure his-tories. These 16 failure data sets formed the basis for anattempt to correlate median failure time against operatingseverity.
The Weibull probability distribution has been widelyused to describe fa i lure rate data (5). The Weibullcumula t ive dis t r ibut ion funct ion can be expressedmathematically as:
(1)
where: P(t) is the cumulative failure probabilityt is time6 is the Weibull scale parameterc is the Weibull shape parameter.
Fortunately, the expression given in equation 1 can berearranged into the following more convenient form:
log In =clogt- c logo (2)
The form of equation 2 means that when log [in { I/(1 — P(t)) } ] is plotted against log t, a straight line willresult if a Weibull probability distribution is followed.Such a straight line can be extrapolated to predict a me-dian failure time by setting P(t) equal to 0.5 and solvingas follows:
log[ln<2>]
or:
log;50 = logo +0.1592
(3)
(4)
where r50 is the median time to failure in months.Table 2 summarizes the results of Weibull probability
distribution least squares fits for the 16 failure data sets
having two or more discrete tube failure times. Includedin the table are values for the product-moment correlationcoefficient, which is a statistical measure of how well astraight line fits the data. Also included, but only forplants with three or more failure points, are values of the95% confidence intervals (/) on the log f30 projections.Based on the Weibull model, this means that it can besaid, with 95% certainty, that:
f (5)
The Weibull failure time model was also used to de-termine if certain early failures could be discounted inprojecting median failure times. Figure 1 gives a typicalWeibull cumulative failure fraction vs. time plot (forplant No. 2).
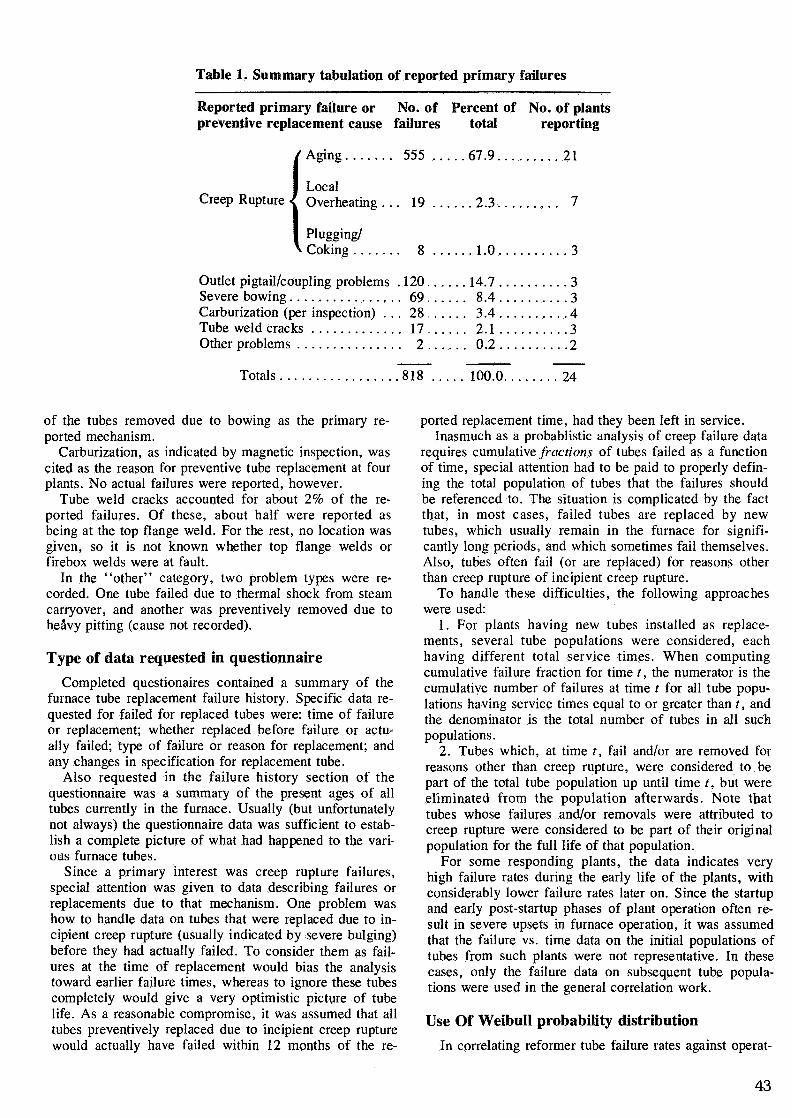
By comparison,. Figure 2 shows a Weibull plot forplant No. 4, which had two early failures at 4 and 19months tube life, with the rest of the failures at 78 +months life. Note the skewed distribution indicating thatthe early failures do not correlate with the rest of the fail-ures, and should not be used for projecting median fail-ure time. Figure 3 shows a revised Weibull plot for plantNo. 4, with the first two failure points omitted. Note thatthe data now correlates well using a Weibull distribution.
Predicting tube metal temperatures
The reformer tube failure questionnaire requests data onplant operating conditions such as feed rate and composi-tion, steam rate, catalyst tube inlet and outlet temperatureand pressure, and catalyst tube outlet gas analysis. Physi-cal data such as tube and catalyst dimensions were alsorequested.
With a proprietary Exxon computer model for reformerfurnaces, the operating and physical data supplied foreach plant were used to generate tube metal temperature(TMT) and pressure stress profiles for the catalyst tubes.No attempt was made to add a maldistribution safetymargin because a correlation of failure times predictedfrom average furnace conditions against Weibull medianfailure time projections was planned.
Significant inaccuracies in the predicted TMT profilesmay be present, due to the uncertainties in the baseoperating data. The outlet conditions of the reformer fur-nace must be defined in order to perform the TMT andstress calculations. These conditions were determined foreach case by fixing the feed composition, outlet tempera-ture and outlet pressure, and then varying the temperatureapproach to reforming equilibrium until the calculatedratio of outlet methane to total carbon matched that re-ported in the outlet analysis. Unfortunately, the approachto reforming equilibrium was often significantly negative,indicating better than equilibrium catalyst performance.This would suggest errors in the outlet temperature, outletanlysis, or both. Fortunately, these factors tend to becompensating to some extent, which would reduce theexpected errors in the predicted TMT profiles.
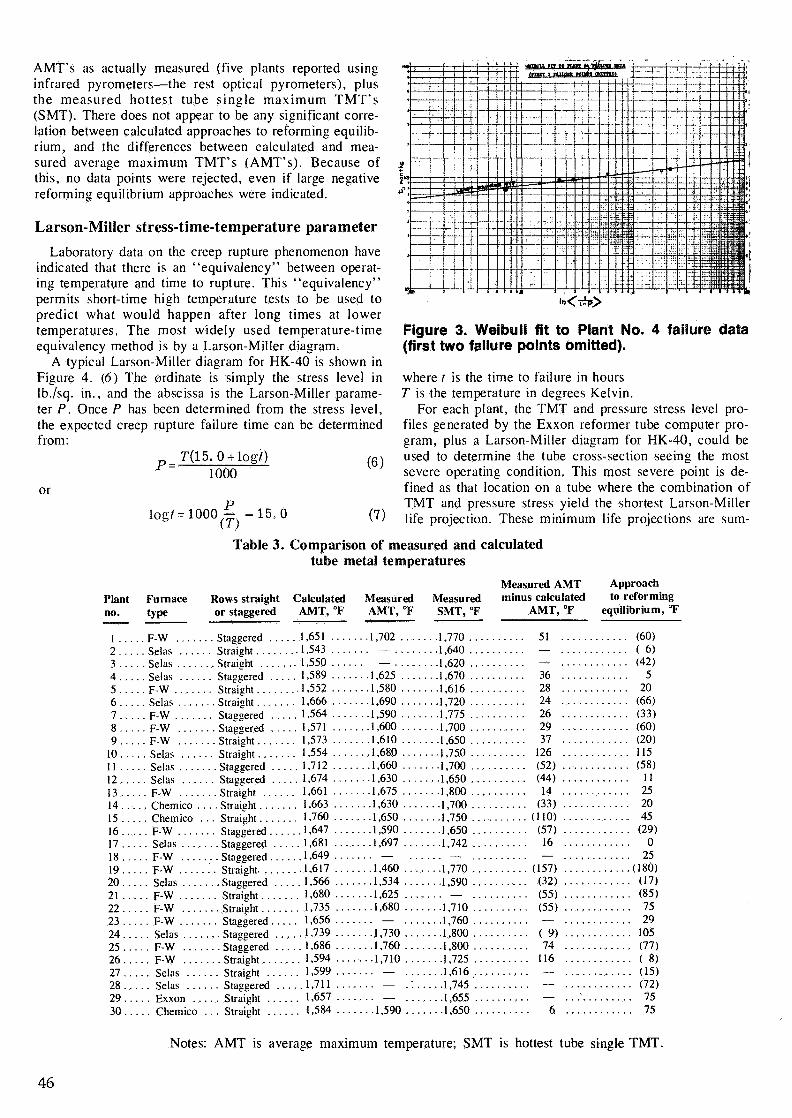
Table 3 summarizes the calculated outside maximumTMT's and the corresponding calculated approaches to re-forming equilibrium. Since these TMT's represent aver-age furnace conditions (no maldistribution factor), theywill be abbreviated as "AMT" (average maximum temp-erature). Also tabulated for comparison are the reported
44
Figure 1. Weibull fit to Plant No. 2 failure data.
Figure 2. Weibull fit to Plant No. 4 failure data (ailpoints included).
Plantno.
Table 2. Summary of results of Weibull analysisof plant creep rupture tube failure data
Product momentFurnace Rows straight Weibuil Constants correlationtype Or staggered C 0 Months coefficient, r
AMT's as actually measured (five plants reported usinginfrared pyrometers—the rest optical pyrometers), plusthe measured hottest tube single max imum TMT's(SMT). There does not appear to be any significant corre-lation between calculated approaches to reforming equilib-rium, and the differences between calculated and mea-sured average maximum TMT's (AMT's). Because ofthis, no data points were rejected, even if large negativereforming equilibrium approaches were indicated.
Larson-Miller stress-time-temperature parameter
Laboratory data on the creep rupture phenomenon haveindicated that there is an "equivalency" between operat-ing temperature and time to rupture. This "equivalency"permits short-time high temperature tests to be used topredict what would happen after long times at lowertemperatures. The most widely used temperature-timeequivalency method is by a Larson-Miller diagram.
A typical Larson-Miller diagram for HK-40 is shown inFigure 4. (6) The ordinale is simply the stress level inlb./sq. in., and the abscissa is the Larson-Miller parame-ter P. Once P has been determined from the stress level,the expected creep rupture failure time can be determinedfrom:
T(15. 0 + logf)p=- 1000(6)
or
log* =1000^-15 ,0
lo<-iep>
Figure 3. Weibull fit to Plant No. 4 failure data(first two failure points omitted).
where t is the time to failure in hoursT is the temperature in degrees Kelvin.
For each plant, the TMT and pressure stress level pro-files generated by the Exxon reformer tube computer pro-gram, plus a Larson-Miller diagram for HK-40, could beused to determine the tube cross-section seeing the mostsevere operating condition. This most severe point is de-fined as that location on a tube where the combination ofTMT and pressure stress yield the shortest Larson-Millerlife projection. These minimum life projections are sum-
Table 3. Comparison of measured and calculatedtube metal temperatures
Notes: AMT is average maximum temperature; SMT is hottest tube single TMT.
46
marized in Table 4 on a log (hours to failure) basis. As-suming the same pressure stress profiles, Larson-Millertube life expectancies were also calculated using mea-sured AMT's and SMT's as bases. Table 4 also sum-marizes these life projections.
Two failure times are correlated
To find the dependence of tube life upon operatingseverity, a correlation of median failure times determinedfrom Weibull projections of actual failure data was madeagainst Larson-Miller life projections. The Weibull log(median failure hours) was used as the dependent vari-able, henceforth abbreviated as W. The Larson-Miller pro-jected log (median failure hours) values were used as in-dependent variables. Specifically the log (median failurehours) determined via the Exxon reformer simulationcomputer program was independent variable Ml, the cor-responding term based on measured AMT was M2, andthe term based on measured SMT was M3. In otherwords, a correlation in the form of equation 8 wassought:
W=f(Ml, A/2, A/3) (8)
There were additional complicating factors in theanalysis, however. The questionnaire requested an esti-mate of the fraction of time the responding plant actuallyoperated at the reported most severe condition. The re-sponses indicated that this fraction ranged from 20 to95% depending on the plant. It did not seem reasonableto compare, on an equal basis, a plant operating 95% ofthe time at peak severity, with another operating only
Table 4. Larson-Miller failure time projections
Plantno.
Larson-Miller log (hours to failure)based on Based on Based on
Furnace Rows straight calculated measured measuredtype ' or staggered AMT (Ml) AMT (M2) SMT (M3)
20% of the time of peak severity. More reasonably, alonger life relative to severity would be expected for theplant operating only a small fraction of the time at the re-ported most severe condition.
All plants responding to the questionnaire indicatedfractional time at peak severity falling into one of the fol-lowing three groups: I, 20-30%; II, 50-68%; and III, 80-95%.
Since no plants are expected to run at their peak (mostsevere) condition 100% of the time, group III (80-95%)was taken as the base point for the correlation. Plants inGroup I, having only a small fraction of time at theirmost severe conditions, were assumed to have lives Ktimes longer than predicted by the correlation, where Kwould be determined By the best least squares fit to thedata. Thus, a correlation in the form of
was called for. E would be 0.0 for group III plants (80-95% at peak severity) and 1.0 for group I plants (20-30%at peak severity). Group II plants, being intermediate be-tween groups I and III, would be assigned an £ value of0.5. By this procedure, the fractional severe operationfactor, E, became a fourth independent variable in thecorrelation.
An additional complicating factor was the fact that notall Weibull median life projections could be made withequal confidence. Plants that had only two failures didnot even permit a confidence limit to be estimated (confi-dence limit calculation formula becomes indeterminate fortwo points), so median failure times for those plants wereconsidered to carry less weight.
For the plants were confidence limits could be deter-mined (i.e., three or more failures), it was arbitrarily as-sumed that a median life projection whose 95% confi-dence limit exceeded a factor of two (i.e., / > 0.301)would count for less than life projections with narrowerconfidence limits. Thus, the Weibull data was split intotwo groups: one group getting full weight in the correla-tion, with a new parameter, "HT", equal to 1, andanother group and lower weight data having "equal to 2.
Figure 4. Typical Larson-Miller plot for HK-40alloy (6). The middle line represents average val-ues.
47
Table 5 gives a final summary of the data base used intrying out various correlations of Weibull median failuretime against Larson-Miller predictions. To keep the re-sulting models simple, only linear correlations were con-sidered. Thus, all correlations explored fit the generalform:
W = Z (O ) + 2 (l )[M1 + E logÄ] + Z(2 )[M2 + E logÄ]
+ Z(3)[M3 + £logtf] (10)
Models considered did not utilize all the terms in equation10 simultaneously, but set one or more of the Z correla-tion constants to zero. For each model considered, thenon-zero Z terms were determined by a least squares mul-tiple regression of the data. Data considered as carryingless weight (WT=2) was handled by dividing the correla-tion deviations (actual W - predicted W) by a poor confi-dence weight factor before the squaring and summing stepin the least squares determination of best correlation con-stants. Poor confidence weight factors of 1 (i.e., countingdeviations at full value), V2 (i.e., counting squared devia-tions at half value), and 2 (i.e., counting deviations athalf value) were all tried in the various correlations.
Most of the correlation work was aimed toward es-timating W from simple multiplicative functions of Ml,M2 and M3. Thus Z(0), the constant term, was set equalto zero. In various trials, W was correlated against Mlalone (Z(2) = 0; Z(3) = 0), M2 alone (Z(l) = 0;Z(3) = 0), M 3 alone (Z(l) = 0; Z(2) = 0), Ml and M 2(Z(3) = 0), Ml and M3 (Z(2) = 0), M2 and M3(Z(l) = 0), and finally M l,M2, andM3 (onlyZ(O) = 0).
Finding the best fit to the data
Comparing the standard deviations (s) determined forthe various models, we found that if a single Larson-Miller life projection must be used, the values based onthe Exxon reformer computer program results (Ml) gavethe best match to projections based on actual failure data.The Ml correlation also yielded lower errors than the cor-relation based on both measured AMT (M2) and mea-sured SMT (M3).
Keeping the Ml dependency (i.e., Z(l) ^ 0), and add-ing terms for M2 and/or M3 dependency gave, as ex-pected, lower standard deviations (s). However, both the
M1/M2 model and the M1/M2/M3 models yielded nega-tive values for Z(2), which is not physically realistic (itwould imply higher severity gives longer life). TheM1/M3 model, although giving lower standard deviationsthan the Ml model, was such a slight improvement(s = 0.341 - 0.380 vs. s = 0.347 - 0.388), that addingthe M3 dependency cannot be considered as having hadany significant effect. Thus it was concluded that the bestmodel for all the points considered was:
(11)
where, depending on poor confidence weight factor as-sumed, Z(l) was in the range of 0.847 — 0.849, with cor-responding K's ranging from 5. 12-5.00.
Since the choice of weight factor did not significantlyaffect the values of Z(l) and K , it was decided to use themiddle values associated with a "S/2~factor. This gave afinal model (henceforth referred to as Model I) as fol-lows:
W=0.848[Ml + £log(5.08)] (12)For Model I, s, the standard deviation, was 0.361.Note that this model indicates that actual tube life is
shorter than predicted from a Larson-Miller analysis(0.848 < 1). This could be due to actual TMT's beinghigher than calculated (note the many points in Table 3indicating large negative approaches to reforming equilib-rium), or due to the effects of cycling, thermal stresses,and operating upsets. The model also indicates that, onthe average, a plant operating only 20-30% of the time atpeak severity, will have a median tube life of about 5times as long as one operating 80-95% of the time atpeak severity.
No significant differences among furnace designs
To see if there were any significant differences amongthe various furnace designs with respect to tube life, thesame seven correlation models (W vs. Ml, M2, M3,M1/M2, M1/M3, M2/M3, M1/M2/M3) were checkedagainst data from plants in each of the following furnacedesign categories (not mutually exclusive): Selas,Foster-Wheeler, straight tube rows, and staggered tuberows.
When the Z values for the various design groups were
Table 5. Summary of data used in developing correlationsFurnace Rows straight
compared, it was found that the differences were gener-ally small compared to the standard deviations of the pre-dictions from the various models. Thus, no statisticallysignificant differences can be detected among the variousfurnace design types with respect to the correlation oftube life against operating severity. This means that themodel given by equation 12 is a general one, and can beused for any of the furnace design types included in thissurvey.
No constant term was included in any of the previouslydiscussed correlation work (i.e., Z(0) = 0). As a com-parison, a correlation based on weighted average valuesof W alone, without regard to operating severity, was alsomade. This correlation sets Z(l), Z(2), and Z(3) equal tozero, thus eliminating any dependency on severity, andjust determines Z (0). This approach was tried for all datapoints together, and separately for the various furnace de-sign data point subgroups.
Comparing the results to those based on assumingZ(0) = 0, it was distrubing to note that, with few excep-tions, the life predictions based simply on the weightedmean values of W were better (as indicated by lowerstandard deviations) than those based on operating sever-ity. However, since only plants which had had two ormore creep rupture failures permitted a Weibull medianfailure time estimation, and since the operating times forvarious plants were all on the same order of magnitude, itshould not be too surprising that there is little variation inthe logarithms of the projected median failure times.
Values of Z(0) were determined for each of the variousfurnace design types, as were the corresponding standarddeviations. These were compared to overall values for theentire population, and it was again concluded that a singlecommon model was adequate. This model, henceforth re-ferred to as Model II, is as follows:
W=5.01 (13)
For Model II, s was 0.266 (vs. 0.361 for Model I).Since models based only on an average value and only
on Ml were good, one based on both should be better.On this theory, correlation constants to fit the form:
W=Z(Q) + Z(l)[Ml + ElosK] (14)
were developed. As expected, the weighted standard de-viations were lower than those for either Model I orModel II. Again using the v2 poor confidence weight fac-tor values as a reasonable middle ground, the followingmodel, henceforth referred to as Model III, was de-veloped:
W= 3.485 + 0. 255[M1 + Elog(ll. 73)] (15)
For Model III, 5 was 0.229.
Successful prediction of no-failure data
As previously noted, all plants included in the correla-tion work could be expected to yield log (median failuretime) values that were not very much different from eachother, because only plants reporting two or more failureswere in the sample. A good test of the models resultingfrom such a sample would be to see what life they wouldpredict for plants which have not had any failures, and tocompare those predictions to the actual times the plantshave operated without failures.
A difficulty arises here, in that the correlation modelsdeveloped predict median failure times, but what are re-ally needed for comparison to no-failure data are predic-tions of first failure times. For each of the 16 plants in-cluded in the median failure time correlation work, thedifference (A) between log {first failure time) and log(projected median failure time) was determined. (A is, infact, the log of the ratio of first to median failure times.)
Note that in two cases, very early failures which hadbeen discounted in the Weibull analysis work due to poorcorrelation with other failure points, were also discountedhere, and not considered as first failures. The justificationfor this is the assumption that these very early failureswere the result of a tube structural defect, or some unre-ported local overheating phenomenon, rather than creeprupture from metal aging.
The first failure vs. median failure time A's wereplaced in ascending order, and used to generate a cumula-tive frequency diagram intended to approximate the prob-abilities of A's exceeding various values. This cumulativefrequency diagram is shown in Figure 5. With this figure,and a median failure time prediction from one of the cor-relation models, a probability (Pi) of experiencing thefirst creep rupture failure (due to aging) before a giventime can be determined. Note that according to Figure 5,on the average, the median failure time will be aboutdouble the first failure time (A50 = 0.295; log 2 = 0.301),and in 80% of the cases, the median failure time will beat least one and a half times the first failure time(A80 = 0.175; log 1.5 = 0.176).
Eight of the plants responding to the questionnaire re-ported no creep rupture failures. For each of these plantsthe Ml, M2, M3, and E values were determined from thereported operating data. These values, well as L, the log(actual operating hours), are summarized in Table 6.From these operating severity values, values of W', thepredicted log (median failure hours) were computedusing each of Models I, II, and III. From W and L, val-ues of A were computed as follows:
A = W-L (16)Given the calculated A for each case, a corresponding
predicted probability (Pi) of having had the first failureon or before the reported failure-free operating time can
Figure 5. Cumulative frequency distribution offirst failure data.
49
be estimated from Figure 5. Table 6 summarizes the cal-culated values of A and PI for each of Models I, II, andIII, with cases having P^ > 50% indicated by a box. Notethat Model I, using only a.multiplier on Ml and no con-stant term, would predict probable first failure only forone case. Models II and III, each containing a constantterm, would predict probable first failure for five andthree cases respectively. Thus, we can conclude thatModel I best simulates the actual physical situation.
The Model I prediction for Plant 15 was puzzling sinceit not only predicted that the first failure time had beenexceeded, but that the time to 50% failures had been ex-ceeded as well. The questionnaire data for Plant 15 wasreviewed, and an inconsistency was noted. Although nofailures or replacements were reported, the ages of thetubes currently in the furnace indicated that 52 (of 234) ofthem were not from the original batch, and that 12 ofthese newer tubes had been installed as early as sixmonths after startup.
Thus, it seems apparent that although Plant 15 may nothave had any actual failures, it must certainly have hadsome preventive replacements. Therefore, it is not too sur-prising that Model I would not predict it to be in thefailure-free category. Note that no similar data inconsis-tencies were found for any of the other plants reportingno creep rupture failures.
Good job of predicting no-failure data
So far, all the models tested against no-failure datahave not depended at all on measured TMT's. Since thebest model tested (Model I) requires the use of Exxon'sproprietary reformer computer simulation program to de-termine Ml, it is of limited usefulness to plants not hav-ing access to that program. A model that would be moregenerally useful would be one that depended only on M2and/or M3, which can be derived from the AMT andSMT.
If Ml cannot be considered, the correlations against M2and M3 together were found to be significantly better thanthose'against either M2 orM3 alone. However, dependingon the poor confidence weight factor assumed, signifi-cantly different predictions of median tube life for the no-failure plants were reached. These predictions were com-pared and it was determined that the constants corres-ponding to a weight factor of 2 gave the best predictionof the no-failure data. The model using this weight factor,henceforth referred to as Model IV, is as follows:
(17)The standard deviation for Model IV predictions of ac-
tual failure data was 0.480.Note that the low time at peak severity life increase
factor, K, is 5.10, which compares very well to the 5.08value determined for Model I. Also note that Model IV,like Model I, predicts median failure times that areshorter than those predicted by Larson-Miller theory (i.e.,0.325 + 0.560 < 1.0).
Table 6 indicates how well Model IV predicts no-failure data. With the exception of the questionable Plant15 data, Model IV predicts less than 50% probability offirst creep rupture failure for all of the plants that actuallydid not experience any such failures. Thus Model IV canbe considered as a useful tool for predicting reformer fur-nace catalyst tube life. The correlation standard deviationsare significantly higher than those for Model I however(0.480 vs. 0.361), so Model I is still preferred where itsuse is possible.
Assuming that a given plant actually operates at its de-sign severity a high percentage (^ 80%) of the time,Model I reduces to the simple form:
W=0.848M1 (18)
Remembering that W and Ml are both logarithms of time,
Table 6. Test of various correlation modelsagainst plants with no creep rupture failures
the 0.848 factor represents quite a significant reduction inlife. Some quantitative examples of the effect of thisfactor follow:
1. If a set of furnace tubes are designed for 100,000hr. life (Ml =5.00) based on a Larson-Miller analysis,and no TMT or stress safety margin is used, the actualmedian tube life would only be 17,400 hr. (W = 4.24).
2. If an actual median tube life of 100,000 hr. is de-sired, a TMT safety factor of 4.48% (based on degreesRankine) must be used. For outside TMT's in the typicalrange of 1500-1700°F, this corresponds to safety factorsof 88-97°F.
It is interesting to note that W. J. Salot came to a verysimilar conclusion. (4) He noted that, on the average, thefailure behavior of the tubes in the top-fired reformersparticipating in the "Reformer Information Network" wasthe same as that for a creep-rupture test specimen over-heated by 120°F above the design calculated mean diame-ter temperature of the tubes.
For the side- and bottom-fired reformers participatingin the current survey, and average 35°F difference be-tween mean diameter temperature and outside temperaturewas calculated. If this 35°F is added to the required safetymargins predicted by Model I (based on outside TMT), amean diameter temperature safety margin in the range of123-132°F is indicated. This compares very well to the120°F margin reported by Salot.
Principal conclusions
Summing up the conclusions of the work to correlatereformer catalyst tube creep rupture failure data againstoperating severity and furnace type:
1. The Weibull probability distribution is a useful toolfor extrapolating cumulative failure vs. time data.
2. The most successful correlation of median creeprupture time against operating severity (based on outsideTMT's calculated using the Exxon reformer computermodel) can be expressed as in equation 12:
W= 0. 848[M1 + £log(5. 08)]
where W is the log (median failure hours) from Weibullanalysis, Ml is the log (failure hours) from Larson-Milleranalysis based on computer calculated outside TMT, andE is the short time at peak severity correction factor.
3. If only measured TMT data are available, the creeprupture time vs. severity correlation yielding the best re-sults is in equation 17:W= 0. 325[A/2 + £log(5.10)] + 0. 560[M3 + £log(5.10)]
where M2 is the log (failure hours) from Larson-Milleranalysis based on measured average maximum TMT(AMT), and M3 is the log (failure hours) from Larson-Miller analysis based on single maximum measured TMT(SMT).
4. Both correlation models indicate that actual tube lifeis normally significantly less than that predicted from asimple Larson-Miller analysis (assuming continuous oper-ation at the severity level assumed in that analysis).
5. No statistically significant differences among thevarious furnace design types (Selas vs. Foster-Wheeler1
and straight tube rows vs. staggered tube rows) werefound in the correlation of median creep rupture failuretime against operating severity.
Acknowledgments
The authors wish to thank the 30 ammonia, hydrogenand methanol plants which submitted data to this survey.We will be sending out individual correlation results, in-cluding pertinent Weibull cumulative failure vs. time pro-jections, to each of these responding plants.
Literature cited
1. Zeis, L. A., and Heinz, E. "Catalyst Tubes in Prim-ary Reformer Furnaces," 66th National AIChEMeeting, August 25-27, 1969.
2. Salot, W. J., "Anticipating Reformer Tube Life inNormal Exposure Service," 70th National AIChEMeeting, September 1, 1971.
3. Salot, W. J., "Primary Reformer Catalyst Tube Per-formance Updated," 73rd National AIChE Meet-ing, August 27-30, 1972.
4. Salot, W. J., "The Trouble With HK-40 High-Pressure Reformer Tube Operation," 78th NationalAIChE Meeting, August 18-21, 1974.
5. Kao, J. H. K. , "A Summary Of Some NewTechniques On Failure Analysis," Proceedings 6thNational Symposium On Reliability Quality ControlIn Electronics, 1960.
6. Estruch, B., and Lyth, C., "High-Temperature Al-loys For Use In Reformer Furnaces," a chapter in"Materials Technology In Steam Reforming Process-es," C. Edeleanu (Ed.), Pergamon Press (1966).
P.A. Ruziska R.M. Osman
51
DISCUSSBON
BILL SALOT, Allied Chemical Co.: I was pleased tosee several correlations between your data and the previ-ously published data on top fired reformers. One mightsay that your model probably applies to top fired-reformers also. The correlations that I had in mind were:
1. The relation between tube performance and creeprupture test specimen performance was similar for bothgroups of reformers.
2. The predominant mechanism of failure in bothgroups of reformers is the same, namely longitudinalcreep rupture.
3. In both groups, many reformers have premature fail-ures that cannot be plotted on a single straight line onany set or coordinates.
4. The value of the weibull factor W (the log of the50% failure time) was in the vicinity of five in most ofyour cases. In the case of the top fired reformers, it wasonly slightly more than five. Would you care to commenton the significance of the shape parameter C, which waslisted in one of your tables. It's my understanding thatwhen this shape parameter is small, the reformer is doingwell and when it is very high, the failures are excessive.If the number exceeds 2.3 for instance, the failures in thatreformer are failing more frequently than normal probabil-ity would predict.
In the case of the top fired reformers, the average for alarge number was 3.2OSMAN: Bill, with regard to your question about theWeibull shape parameter, C, I'd first like to say that, de-pending on the value of the shape parameter, you can de-scribe the various portions of the classic bathtub failurecurve. If C is less than one, you have the early, "burn-in" period where the failure rate is declining. If C isequal to one, you have the constant rate, random failureperiod, and if C is greater than one,' you have the wear-out period, where failure rate increases. In almost allcases, without throwing out any early data points, wecame up with values of C which were significantlygreater than one, indicating that the failures were occur-ring during the wear-out period. In some of the plants,we did have to throw out a few early failures which didnot fit the correlation, and which we felt were due tosome burn-in problems with tube defects or perhaps unre-ported upsets.
Considering the significance of a high value of theshape parameter, I would not say that this represents apoor furnace operation. In fact, directionally, I would saythat the higher the value of C, the better the furnace op-eration. This is because the C shape parameter effectivelydescribes the steepness of the failure versus time curve.This means that a plant with perfect firing distribution,identical metallurgy and dimensions for each tube, andperfect flow distribution, would theoretically have everytube in the furnace fail at the same moment. This wouldgive an infinite value of the C parameter. Thus, thehigher the value of C, the closer the furnace approximatesthis ideal situation. Low values of C indicate a relativelysloppy furnace operation, with a relatively large numberof early failures due to, for example, poor firing distribu-tion.
Note that the factor which characterizes the averagetube life, is really the scale parameter, 0, which relates tothe 50% failure time.JOHN LANCASTER, Kellogg International, London:I'd like to comment that, quite independently of Bill Salotand the Exxon people, we carried out a survey of topfired reformer furnaces in Europe and came up with re-sults which really correlate extremely well with theseother two surveys, except that the 50% mean failure timecame out somewhat higher; in the range 106 hours, ratherthan 10s hours.
But I would like to comment on one particular pointand that is the nature of the failures that we are observ-ing. You can, of course, get rupture failures in reformertubes for a number of reasons. One possibility is that thetube has been operated at its steady design temperatureand it's come to the end of its natural life. Other pos-sibilities are that the tube has been locally overheated dueto flame impingement, due to catalyst blocking, or due toone of a great number of things.
We are particularly interested in this aspect of the prob-lem because, clearly, if we are dealing entirely with agingfailures, then as soon as there are two or three failures inthe furnace, pretty soon there is going to be an avalancheof failures and you really ought to change all your tubes.If, on the other hand, the failures are of an accidentalcharacter due to flame impingement, etc., then it may bepossible to continue operating provided, of course, youreplace the defective tube on the next shutdown.
Now there are two or three possible diagnostic methodsof determining which type of failure you've got. One ofthem is by taking microsections of the failure. We foundby experiment that long term failures are characterised bythe presence of creep cavitation in the microsection,whereas short term failures don't have such creep cavitiesin them.
Another characteristic is that in long term failures theweld tends to be the weaker part, whereas with short termfailures the weld is stronger, so that any swelling thattakes place is below and above a weld, and the weld ap-pears to form a constriction in the tube. But the third in-dication is that, if the slope of the Weibull curve is oneor near to one, this is an indication that the distribution offailures is of a random type. This type of distribution isone where you get the same number of failures occurringin a given time, this year, next year and ten years hence.Now we found, and I think everybody else has foundhere, that, in fact, the slope of the Weibull curve is notone, but is slightly greater than one. However, it's a verylong way from the 3.2 slope which would indicate thetype of distribution you expect from a pure aging type offailure. And I would interpret the results that we got asindicating that the failures we are seeing are essentiallyrandom failures due to local overheating with a certainamount of aging built into it.OSMAN: John, let me comment on a few of your points.One, you noted that for the European top-fired reformers,the average life is more on the order of 10s hours, ratherthan 105 hours reported in this paper. You have to re-member that we were using a biased sample here which
52
te'nded to give shorter failure times. If you recall, the typ-ical 10s hours life figure applies only to those 16 plantshaving two or more creep rupture failures. I'm sure that ifyou actually operated the rest of the plants responding toour survey, those which currently have no or only onecreep rupture failure, out to the point where they had sig-nificant numbers of creep rupture failures, you would findthat the average time to 50% failures would have beenmuch longer.
Now considering your point about the local overheatingphenomenon, we did attempt to split out local overheatingand upsets from the correlation work where the failureswere reported as such. Also we found for most of theplants, that the Weibull shape parameter C was in factgreater than 3.2, in some cases 8 or 10, or even 19, indi-cating that the aging phenomenon was very much thedominant reason for failure.Q. Do you believe there is any correlation between thefrequency of thermally cycling the furnace and tube life?OSMAN: I think it's fairly certain that there is such acorrelation, and in fact Battelle has a computer programthat enables you to include the effects of thermal stressesand also cycling in your analysis of the operating sever-ity. Now unfortunately, timing and problems with ourparticular version of Battelle's program did not permit usto explore this, but we can almost definitely say that cy-cling would have an adverse effect on life. Shortly afterstartup there are very high thermal stresses across the tubewall, sometimes as high as 10 times the pressure stresses.However, these thermal stresses tend to relieve them-selves quite quickly, so that if you only had a singlecycle for example, their effect would be close to negligi-ble. However, if you have enough cycles, and each timethis thermal stress effect is repeated, we would expect tosee a shortening of the life of the tube.PHIL RUZISKA, Exxon Chemical: I would like toelaborate a little further regarding the practical signifi-cance of this correlation method. I think that the quantita-
tive correlation, which includes the effect of severity, canbe used for several meaningful purposes by plant person-nel. For instance, we can look at the effects of increasingfurnace duty, such as operating at higher throughput orhigher coil outlet temperature, to determine what effectsthis would have on tube life and time to first failure.
Secondly we can look at increasing the tube wallthicknesses to determine what effect this might have onextending tube life. Finally, for plants which have notexperienced their first failure, we can look at when initialfailures are expected, and so can plan an appropriate pro-gram for turnaround tube inspections.Q. In this survey you say you have 30 response, that is amixture of ammonia, methanol, and hydrogen reformers.How many of the 30 are actually high pressure reformers,and how many are not, which I assume to be in the lowerpressure range of operation for methanol and hydrogen?Also, did you make any attempt to distinguish betweenthe data in the ammonia area and the methanol/hydrogenarea?OSMAN: Off the top of my head, I can't tell you whatthe split was. I believe the majority were high pressureammonia reformers. We did not in fact make any attemptto split out the high pressure reformers from low pressurereformers. We felt that the severity characterization factorwould account for the difference between the types, in theparameter itself.Q. But you said, in effect, that the severity factor wasnot a factor in correlating the data. In other words, thefact that it was low pressure/high temperature, or highpressure/low temperature had no factor in the way thedata was put together for life predictions.OSMAN: That's correct. We made no attempt to split outthe high pressure reformers from the low pressure reform-ers in the data workup. This could have been done butwe didn't do it. The point is that the severity term whichincludes temperature and pressure in effect correlates boththe high pressure and low pressure furnace experience.