GE.16-18355(E) Subsidiary Body for Implementation Forty-fifth session Marrakech, 7–14 November 2016 Item 3(d) of the provisional agenda Reporting from and review of Parties included in Annex I to the Convention Report on national greenhouse gas inventory data from Parties included in Annex I to the Convention for the period 1990–2014 National greenhouse gas inventory data for the period 1990–2014 Report by the secretariat* Summary Forty-two Parties included in Annex I to the Convention (Annex I Parties) submitted their greenhouse gas (GHG) inventory common reporting format (CRF) tables and national inventory reports (NIRs) in 2016. By the deadline of 15 April 2016, CRF tables from 38 Parties and NIRs from 33 Parties had been received. Over the period 1990–2014, total aggregate GHG emissions without emissions and removals from land use, land-use change and forestry (LULUCF) for all Annex I Parties decreased by 11.3 per cent, while total GHG emissions and removals with LULUCF decreased by 15.8 per cent. For Annex I Parties with economies in transition, GHG emissions without and with LULUCF decreased by 37.2 per cent and 47.0 per cent, respectively. For Annex I Parties that do not have economies in transition, GHG emissions without and with LULUCF increased by 1.4 per cent and 0.7 per cent, respectively. The information in this document is based on information in the national GHG inventory submissions of Annex I Parties received as at 16 September 2016. At the time of the publication of this document, the annual review process for GHG inventories from Annex I Parties was still ongoing; therefore, the data included in this document may not reflect the latest information provided by Parties. The latest GHG inventory data are available on the UNFCCC website. * This document was submitted after the due date in order to take into account the latest submissions from Parties. United Nations FCCC/SBI/2016/19 Distr.: General 2 November 2016 Original: English
Transcript
GE.16-18355(E)
Subsidiary Body for Implementation Forty-fifth session
Marrakech, 7–14 November 2016
Item 3(d) of the provisional agenda
Reporting from and review of Parties included in Annex I to the Convention
Report on national greenhouse gas inventory data from Parties included in Annex I
to the Convention for the period 1990–2014
National greenhouse gas inventory data for the period 1990–2014
Report by the secretariat*
Summary
Forty-two Parties included in Annex I to the Convention (Annex I Parties) submitted
their greenhouse gas (GHG) inventory common reporting format (CRF) tables and national
inventory reports (NIRs) in 2016. By the deadline of 15 April 2016, CRF tables from 38
Parties and NIRs from 33 Parties had been received. Over the period 1990–2014, total
aggregate GHG emissions without emissions and removals from land use, land-use change
and forestry (LULUCF) for all Annex I Parties decreased by 11.3 per cent, while total GHG
emissions and removals with LULUCF decreased by 15.8 per cent. For Annex I Parties
with economies in transition, GHG emissions without and with LULUCF decreased by
37.2 per cent and 47.0 per cent, respectively. For Annex I Parties that do not have
economies in transition, GHG emissions without and with LULUCF increased by 1.4 per
cent and 0.7 per cent, respectively. The information in this document is based on
information in the national GHG inventory submissions of Annex I Parties received as at
16 September 2016. At the time of the publication of this document, the annual review
process for GHG inventories from Annex I Parties was still ongoing; therefore, the data
included in this document may not reflect the latest information provided by Parties. The
latest GHG inventory data are available on the UNFCCC website.
* This document was submitted after the due date in order to take into account the latest
submissions from Parties.
United Nations FCCC/SBI/2016/19
Distr.: General
2 November 2016
Original: English
FCCC/SBI/2016/19
2
Contents
Paragraphs Page
I. Introduction ............................................................................................................. 1–5 3
A. Mandate .......................................................................................................... 1 3
B. Scope of the note ............................................................................................ 2–4 3
C. Possible action by the Subsidiary Body for Implementation .......................... 5 3
II. Status of reporting ................................................................................................... 6–11 3
A. Timeliness and completeness of submissions ................................................. 6–8 3
B. Recalculations ................................................................................................. 9–11 5
III. Overview of emission trends and sources in Annex I Parties ................................. 12–28 6
A. Total aggregate greenhouse gas emissions ..................................................... 12–16 6
B. Greenhouse gas emissions by gas ................................................................... 17–19 10
C. Greenhouse gas emissions by sector ............................................................... 20–25 11
D. Emission data for individual Annex I Parties ................................................. 26–28 13
FCCC/SBI/2016/19
3
I. Introduction
A. Mandate
1. The Conference of the Parties (COP), by decision 24/CP.19, requested Parties
included in Annex I to the Convention (Annex I Parties) to submit national inventory data
on greenhouse gas (GHG) emissions by sources and removals by sinks by 15 April each
year. By decision 13/CP.20, paragraphs 8 and 10, the COP requested the secretariat to
compile and summarize information on GHG inventory data submitted by Annex I Parties,
inter alia, for consideration by the COP and the subsidiary bodies.
B. Scope of the note
2. This document shows the status of reporting of GHG inventories by Annex I Parties
in 2016 (chapter II) and provides a summary of the latest available data on GHG emissions
and removals for the period 1990–2014 (chapter III). Data are provided for carbon dioxide
(CO2), methane (CH4) and nitrous oxide (N2O), as well as for hydrofluorocarbons (HFCs),
perfluorocarbons (PFCs), sulphur hexafluoride (SF6), unspecified mix of HFCs and PFCs
(MIX) and nitrogen trifluoride (NF3) taken together, and, where Parties have elected to
report them, indirect CO2 emissions from the atmospheric oxidation of CH4, carbon
monoxide and non-methane volatile organic compounds. Data are provided on total1
aggregate2 GHG emissions, both without and with net GHG emissions and removals from
land use, land-use change and forestry (LULUCF).
3. The information provided in this document is based on information in the national
GHG inventories received from 42 Annex I Parties (see table 1) as at 16 September 2016.
4. At the time of the publication of this document, the annual review process for GHG
inventories from Annex I Parties was still ongoing; therefore, the data presented here may
not reflect the latest information provided by Parties. The latest GHG inventory data are
available on the UNFCCC website.3
C. Possible action by the Subsidiary Body for Implementation
5. The Subsidiary Body for Implementation may wish to take note of the information
contained in this document and seek further guidance from the COP, as appropriate.
II. Status of reporting
A. Timeliness and completeness of submissions
6. According to the “Guidelines for the preparation of national communications by
Parties included in Annex I to the Convention, Part I: UNFCCC reporting guidelines on
1 The term “total” implies that emissions from the sectors of the common reporting format are summed;
the inclusion of emissions from land use, land-use change and forestry in the sum is indicated
separately; unless stated otherwise, totals do not include indirect CO2 emissions.
2 The term “aggregate” implies that GHG emissions and removals are calculated as a weighted sum of
CO2, CH4, N2O, HFCs, PFCs, SF6, MIX and NF3 using the global warming potential values agreed
under the Convention.
3 <http://unfccc.int/9492.php>.
FCCC/SBI/2016/19
4
annual greenhouse gas inventories” (hereinafter referred to as the UNFCCC Annex I
inventory reporting guidelines),4 Annex I Parties are required to submit annually a national
inventory report (NIR) and common reporting format (CRF) tables containing data from the
base year up to two years prior to the year of submission. In 2016, 42 Annex I Parties
provided GHG data for all years from 19905 to 2014.
7. By 15 April 2016, CRF tables had been received from 37 Parties and NIRs had been
received from 33 Parties. Within six weeks after 15 April 2016, a total of 40 Parties6 had
submitted their CRF tables and 39 Parties had submitted their NIRs. The dates of the initial
submissions of the CRF tables are shown in table 1.
Table 1
Greenhouse gas inventory submissions from Annex I Parties in 2016
Party CRF tables submission datea Party
CRF tables submission datea
Australia 27 May 2016 Liechtenstein 15 April 2016
Austria 14 April 2016 Lithuania 15 April 2016
Belarus 10 June 2016 Luxembourg 15 April 2016
Belgium 15 April 2016 Malta 14 April 2016
Bulgaria 15 April 2016 Monaco
Canada 14 April 2016 Netherlands 15 April 2016
Croatia 15 April 2016 New Zealand 20 May 2016
Cyprus 13 April 2016 Norway 15 April 2016
Czechia 15 April 2016 Poland 15 April 2016
Denmark 15 April 2016 Portugal 15 April 2016
Estonia 15 April 2016 Romania 15 April 2016
European Union 15 April 2016 Russian Federation 15 April 2016
Finland 15 April 2016 Slovakia 15 April 2016
France 15 April 2016 Slovenia 15 April 2016
Germany 15 April 2016 Spain 15 April 2016
Greece 15 April 2016 Sweden 15 April 2016
Hungary 15 April 2016 Switzerland 15 April 2016
Iceland 15 April 2016 Turkey 15 April 2016
Ireland 15 June 2016 Ukraine 24 May 2016
Italy 15 April 2016 United Kingdom 15 April 2016
Japan 14 April 2016 United States 15 April 2016
Latvia 15 April 2016
Abbreviation: CRF = common reporting format. a Dates after 15 April 2016 are shown in italics. The dates of submission of the national inventory
reports may be different. Blank cells indicate that no submission had been received as at 16
September 2016.
4 Decision 24/CP.19, annex I.
5 Unless otherwise specified, for certain Parties base year data are used instead of 1990 data. The
Parties that may use a base year other than 1990, as stipulated in decisions 9/CP.2 and 11/CP.4,
provided data for their respective base years. Such Parties and their base years are Bulgaria (1988),
Hungary (average of 1985–1987), Poland (1988), Romania (1989) and Slovenia (1986).
6 When making their submissions, some Parties referred to technical problems that they encountered
with the reporting software. In decision 20/CP.21, the COP noted that the CRF Reporter was not yet
fully functioning.
FCCC/SBI/2016/19
5
8. After the initial submissions, 36 Parties submitted revised versions of their CRF
tables and 31 Parties resubmitted their NIRs.
B. Recalculations
9. According to the UNFCCC Annex I inventory reporting guidelines, Parties should,
where necessary, conduct recalculations in order to improve the quality of their emission
estimates and ensure the consistency of the time series.
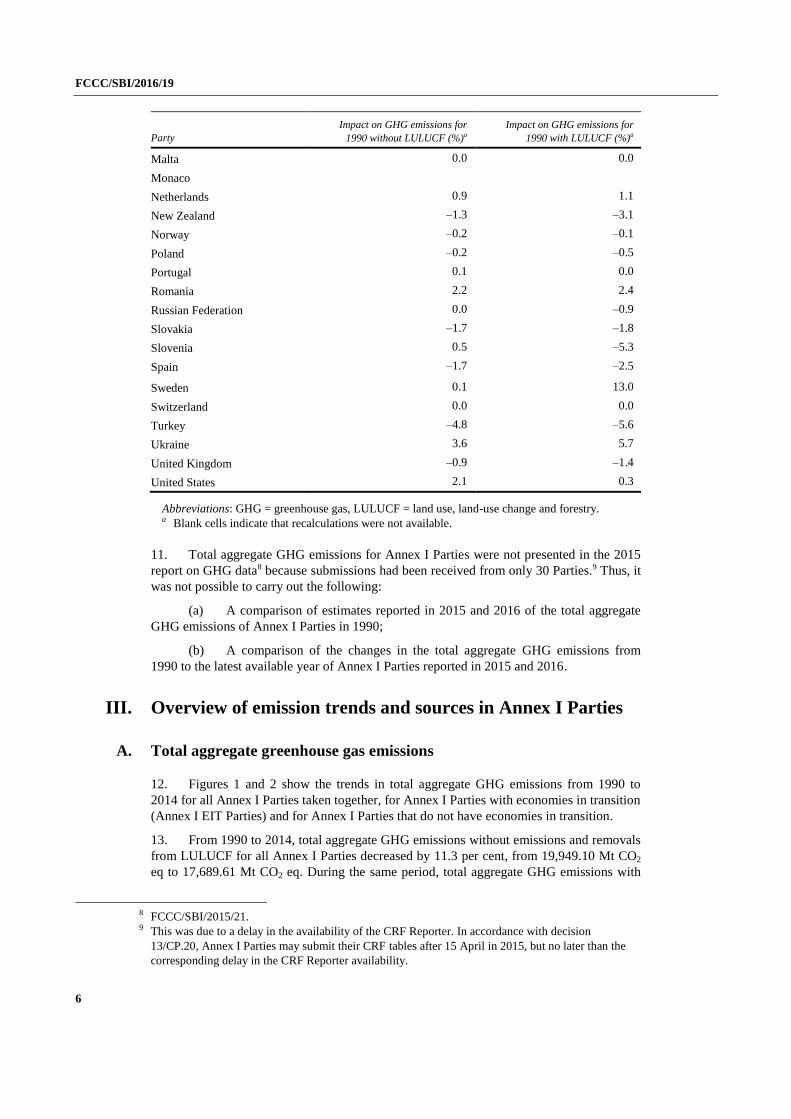
10. In 2016, 39 Annex I Parties7 reported recalculations that had an impact on their
estimated GHG emissions for 1990 (see table 2). The recalculations resulted from changes
in activity data, emission factors and methodologies. For total aggregate GHG emissions
without LULUCF, the change was less than 1 per cent for 29 Parties and more than 3 per
cent for 4 Parties. For total aggregate GHG emissions with LULUCF, the change was less
than 1 per cent for 24 Parties and more than 3 per cent for 7 Parties.
Table 2
Inventory recalculations by Annex I Parties in 2016
Party
Impact on GHG emissions for
1990 without LULUCF (%)a
Impact on GHG emissions for
1990 with LULUCF (%)a
Australia –2.3 2.9
Austria 0.2 0.5
Belarus
Belgium –0.7 –0.8
Bulgaria –5.1 –6.6
Canada 0.0 0.1
Croatia
Cyprus 2.4 2.7
Czechia 1.0 1.0
Denmark –0.5 –1.2
Estonia –0.2 –1.7
European Union –0.4 –0.3
Finland 0.0 –0.4
France –0.6 0.7
Germany –0.1 0.0
Greece –0.2 –0.1
Hungary –0.1 0.9
Iceland –5.6 –1.4
Ireland –1.0 1.8
Italy 0.2 0.0
Japan 0.0 0.0
Latvia 0.3 3.2
Liechtenstein –0.2 –0.2
Lithuania –1.3 –0.7
Luxembourg –0.1 –2.2
7 In Switzerland’s GHG inventory, recalculations showed identical values to previous estimates.
Recalculations for Belarus, Croatia and Monaco (without and with LULUCF) were not available.
FCCC/SBI/2016/19
6
Party
Impact on GHG emissions for
1990 without LULUCF (%)a
Impact on GHG emissions for
1990 with LULUCF (%)a
Malta 0.0 0.0
Monaco
Netherlands 0.9 1.1
New Zealand –1.3 –3.1
Norway –0.2 –0.1
Poland –0.2 –0.5
Portugal 0.1 0.0
Romania 2.2 2.4
Russian Federation 0.0 –0.9
Slovakia –1.7 –1.8
Slovenia 0.5 –5.3
Spain –1.7 –2.5
Sweden 0.1 13.0
Switzerland 0.0 0.0
Turkey –4.8 –5.6
Ukraine 3.6 5.7
United Kingdom –0.9 –1.4
United States 2.1 0.3
Abbreviations: GHG = greenhouse gas, LULUCF = land use, land-use change and forestry. a Blank cells indicate that recalculations were not available.
11. Total aggregate GHG emissions for Annex I Parties were not presented in the 2015
report on GHG data8 because submissions had been received from only 30 Parties.9 Thus, it
was not possible to carry out the following:
(a) A comparison of estimates reported in 2015 and 2016 of the total aggregate
GHG emissions of Annex I Parties in 1990;
(b) A comparison of the changes in the total aggregate GHG emissions from
1990 to the latest available year of Annex I Parties reported in 2015 and 2016.
III. Overview of emission trends and sources in Annex I Parties
A. Total aggregate greenhouse gas emissions
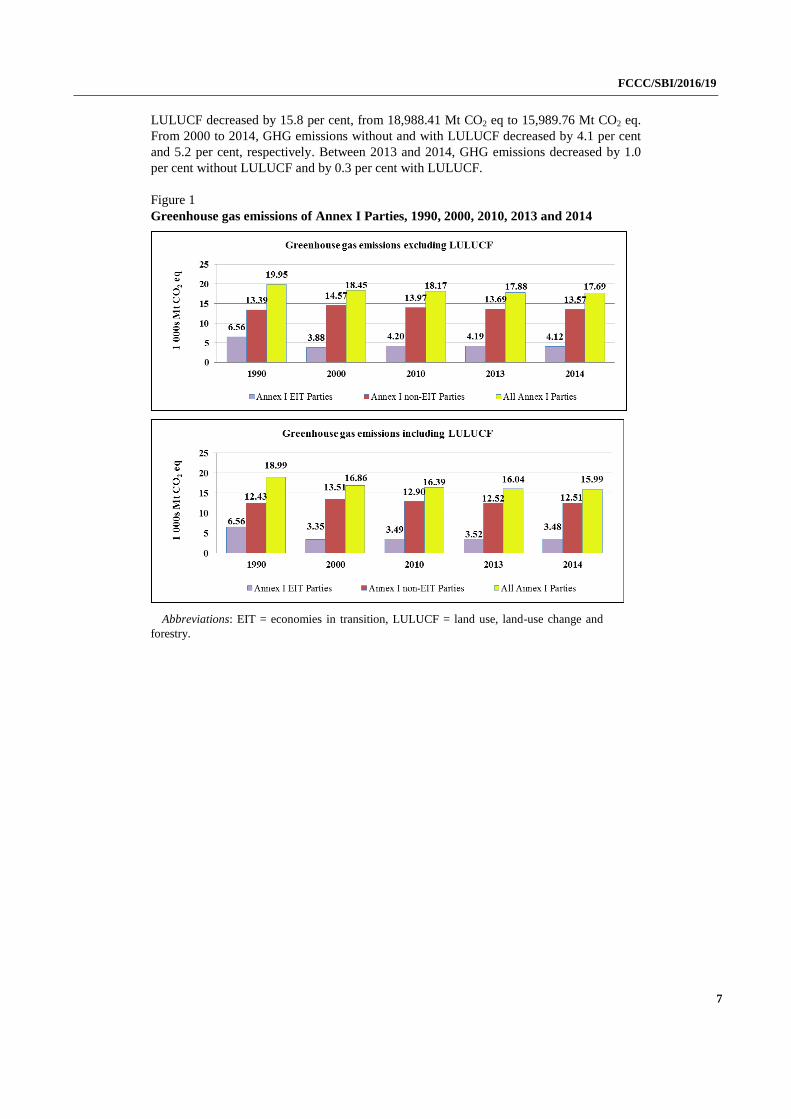
12. Figures 1 and 2 show the trends in total aggregate GHG emissions from 1990 to
2014 for all Annex I Parties taken together, for Annex I Parties with economies in transition
(Annex I EIT Parties) and for Annex I Parties that do not have economies in transition.
13. From 1990 to 2014, total aggregate GHG emissions without emissions and removals
from LULUCF for all Annex I Parties decreased by 11.3 per cent, from 19,949.10 Mt CO2
eq to 17,689.61 Mt CO2 eq. During the same period, total aggregate GHG emissions with
8 FCCC/SBI/2015/21.
9 This was due to a delay in the availability of the CRF Reporter. In accordance with decision
13/CP.20, Annex I Parties may submit their CRF tables after 15 April in 2015, but no later than the
corresponding delay in the CRF Reporter availability.
FCCC/SBI/2016/19
7
LULUCF decreased by 15.8 per cent, from 18,988.41 Mt CO2 eq to 15,989.76 Mt CO2 eq.
From 2000 to 2014, GHG emissions without and with LULUCF decreased by 4.1 per cent
and 5.2 per cent, respectively. Between 2013 and 2014, GHG emissions decreased by 1.0
per cent without LULUCF and by 0.3 per cent with LULUCF.
Figure 1
Greenhouse gas emissions of Annex I Parties, 1990, 2000, 2010, 2013 and 2014
Abbreviations: EIT = economies in transition, LULUCF = land use, land-use change and
forestry.
FCCC/SBI/2016/19
8
Figure 2
Changes in greenhouse gas emissions of Annex I Parties, 1990–2014
Abbreviations: EIT = economies in transition, LULUCF = land use, land-use change and
forestry.
14. For Annex I EIT Parties, GHG emissions from 1990 to 2014 decreased by 37.2 per
cent without LULUCF and by 47.0 per cent with LULUCF. From 2000 to 2014, GHG
emissions without and with LULUCF increased by 6.2 per cent and 3.9 per cent,
respectively. Between 2013 and 2014, GHG emissions decreased by 1.7 per cent without
LULUCF and by 1.2 per cent with LULUCF.
15. For Annex I Parties that do not have economies in transition, from 1990 to 2014
GHG emissions increased by 1.4 per cent without LULUCF and by 0.7 per cent with
LULUCF. From 2000 to 2014, GHG emissions without and with LULUCF decreased by
6.9 per cent and 7.4 per cent, respectively. Between 2013 and 2014, GHG emissions
showed a decrease of 0.8 per cent without LULUCF and of 0.1 per cent with LULUCF.
16. The changes in total aggregate GHG emissions over the period 1990–2014 varied
considerably among Parties (see figure 3). The largest decrease in emissions without
LULUCF was in Romania (by 63.4 per cent), while the largest decrease in emissions with
LULUCF was in Lithuania (by 74.7 per cent). On the other hand, the greatest increase in
emissions without and with LULUCF was in Turkey (by 125.0 per cent and 129.6 per cent,
respectively).
FCCC/SBI/2016/19
9
Figure 3
Changes in total aggregate emissions of individual Annex I Parties, 1990–2014
FCCC/SBI/2016/19
10
Abbreviations: GHG = greenhouse gas, LULUCF = land use, land-use change and
forestry.
B. Greenhouse gas emissions by gas
17. Throughout the period 1990–2014, CO2 accounted for the largest share of total
emissions, contributing 76.6 per cent in 1990 and 77.7 per cent in 2014. CH4 was the
second-highest contributor to total GHG emissions (16.1 per cent in 1990 and 14.9 per cent
in 2014), followed by N2O (5.9 per cent in 1990 and 5.1 per cent in 2014). The emissions of
HFCs, PFCs, SF6, MIX and NF3 taken together contributed less than 2.5 per cent of the
total GHG emissions in both years.
18. Figure 4 shows the contribution of each GHG to the total emissions without
LULUCF for 1990 and 2014 and the changes in the total emissions of each GHG over the
period 1990–2014. Emissions of CO2, CH4 and N2O decreased, while emissions of HFCs,
PFCs, SF6, MIX and NF3 taken together increased by 40.3 per cent.
FCCC/SBI/2016/19
11
Figure 4
Greenhouse gas emissions excluding land use, land-use change and forestry of Annex I
Parties by gas, 1990 and 2014
Abbreviation: LULUCF = land use, land-use change and forestry.
19. Between 2013 and 2014, emissions of CO2 and CH4 decreased by 1.4 per cent and
0.3 per cent, respectively. During the same period, emissions of N2O increased by 0.1 per
cent and emissions of HFCs, PFCs, SF6, MIX and NF3 taken together increased by 2.9 per
cent.
C. Greenhouse gas emissions by sector
20. From 1990 to 2014, emissions from the energy, industrial processes and product use,
agriculture and waste sectors decreased (see figure 5). The agriculture sector experienced
the largest relative decrease in emissions (by 17.9 per cent), followed by the industrial
processes and product use, waste and energy sectors. Over the same period, net GHG
removals from LULUCF increased by 76.9 per cent, from –960.69 Mt CO2 eq to –1,699.85
Mt CO2 eq.
21. Between 2013 and 2014, emissions from the energy sector decreased by 1.4 per
cent. Emissions from the industrial processes and product use, agriculture and waste sectors
increased by 0.6 per cent, 0.3 per cent and 0.3 per cent, respectively. Net GHG removals
from LULUCF decreased by 7.3 per cent.
FCCC/SBI/2016/19
12
Figure 5
Greenhouse gas emissions and removals of Annex I Parties by sector, 1990 and 2014a
Abbreviation: LULUCF = land use, land-use change and forestry. a The sector other is not included in this figure because its contribution to the total GHG
emissions is very small. The emissions from this sector decreased by 27.2 per cent between 1990
and 2014.
22. Within the energy sector, from 1990 to 2014, GHG emissions decreased in all
subsectors except transport and CO2 transport and storage, where emissions increased by
10.7 per cent and 80.0 per cent, respectively (see figure 6). The largest relative emission
reduction occurred in manufacturing industries and construction (where emissions
decreased by 20.9 per cent).
Figure 6
Greenhouse gas emissions of Annex I Parties in the energy sector, 1990 and 2014
23. Between 2013 and 2014, emissions from all energy subsectors, except CO2 transport
and storage (namely energy industries, manufacturing industries and construction,
transport, fugitive emissions and other sectors) decreased.
FCCC/SBI/2016/19
13
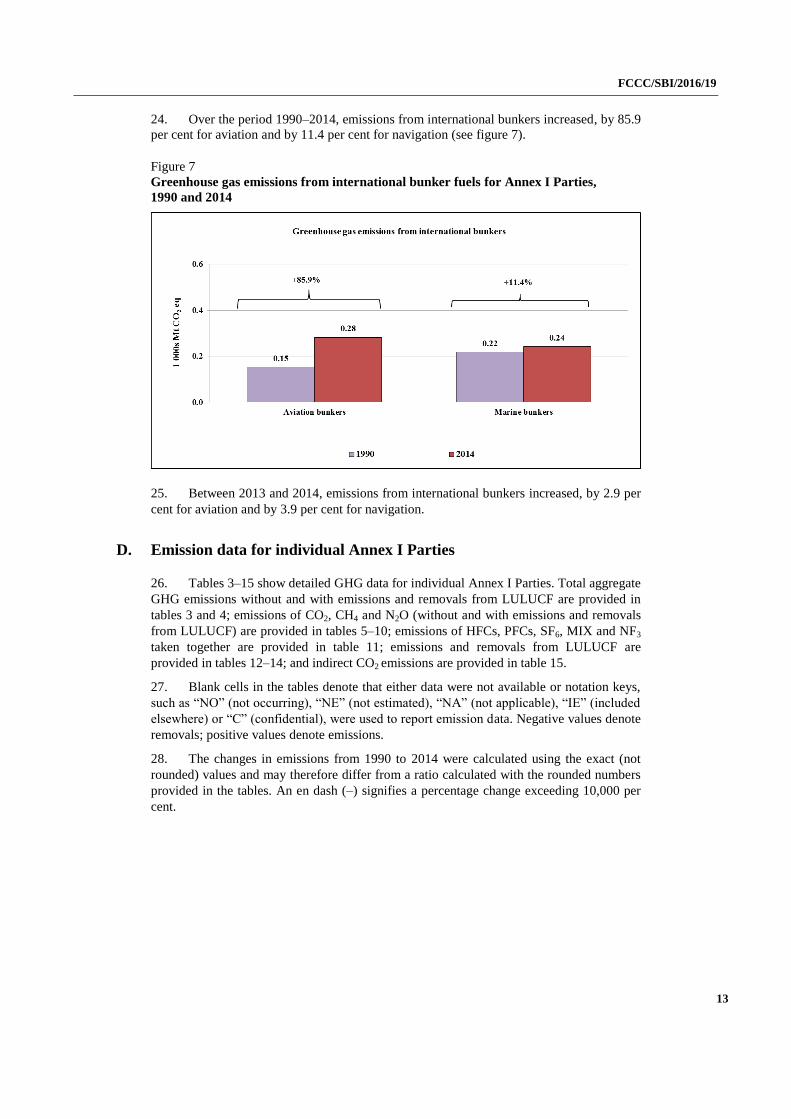
24. Over the period 1990–2014, emissions from international bunkers increased, by 85.9
per cent for aviation and by 11.4 per cent for navigation (see figure 7).
Figure 7
Greenhouse gas emissions from international bunker fuels for Annex I Parties,
1990 and 2014
25. Between 2013 and 2014, emissions from international bunkers increased, by 2.9 per
cent for aviation and by 3.9 per cent for navigation.
D. Emission data for individual Annex I Parties
26. Tables 3–15 show detailed GHG data for individual Annex I Parties. Total aggregate
GHG emissions without and with emissions and removals from LULUCF are provided in
tables 3 and 4; emissions of CO2, CH4 and N2O (without and with emissions and removals
from LULUCF) are provided in tables 5–10; emissions of HFCs, PFCs, SF6, MIX and NF3
taken together are provided in table 11; emissions and removals from LULUCF are
provided in tables 12–14; and indirect CO2 emissions are provided in table 15.
27. Blank cells in the tables denote that either data were not available or notation keys,
such as “NO” (not occurring), “NE” (not estimated), “NA” (not applicable), “IE” (included
elsewhere) or “C” (confidential), were used to report emission data. Negative values denote
removals; positive values denote emissions.
28. The changes in emissions from 1990 to 2014 were calculated using the exact (not
rounded) values and may therefore differ from a ratio calculated with the rounded numbers
provided in the tables. An en dash (–) signifies a percentage change exceeding 10,000 per
cent.
FCCC/SBI/2016/19
14
Table 3
Total aggregate anthropogenic emissions of CO2, CH4, N2O, HFCs, PFCs, SF6, MIX
and NF3 without emissions/removals from land use, land-use change and forestry,
United States 6 397 144 7 258 973 6 985 457 6 799 979 6 870 446 7.4
Number of Parties showing a decrease in emissions by more than 1 per cent: 29 Number of Parties showing a change in emissions within 1 per cent: 0 Number of Parties showing an increase in emissions by more than 1 per cent: 13
a A Party with an economy in transition. b Data for the base year defined by decisions 9/CP.2 and 11/CP.4 (Bulgaria (1988), Hungary (average of 1985–1987), Poland
(1988), Romania (1989) and Slovenia (1986)) are used for this Party instead of 1990 data.
FCCC/SBI/2016/19
15
c Emission estimates of the European Union are as reported for its 28 member States and are reported separately from those of
each individual member State. d Decision 26/CP.7 invited Parties to recognize the special circumstances of Turkey, which place it in a situation different from
that of other Parties included in Annex I to the Convention.
Table 4
Total aggregate anthropogenic emissions of CO2, CH4, N2O, HFCs, PFCs, SF6, MIX
and NF3 with emissions/removals from land use, land-use change and forestry, 1990,
United States 5 659 192 6 575 954 6 219 033 6 040 395 6 107 976 7.9
Number of Parties showing a decrease in emissions by more than 1 per cent: 31
FCCC/SBI/2016/19
16
kt CO2 eq Change from 1990
Party 1990 2000 2010 2013 2014 to 2014 (%)
Number of Parties showing a change in emissions within 1 per cent: 0
Number of Parties showing an increase in emissions by more than 1 per cent: 11
a A Party with an economy in transition. b Data for the base year defined by decisions 9/CP.2 and 11/CP.4 (Bulgaria (1988), Hungary (average of 1985–1987), Poland
(1988), Romania (1989) and Slovenia (1986)) are used for this Party instead of 1990 data. c Emission estimates of the European Union are as reported for its 28 member States as a group and are reported separately from
those of each individual member State. d Decision 26/CP.7 invited Parties to recognize the special circumstances of Turkey, which place it in a situation different from
that of other Parties included in Annex I to the Convention.
Table 5
Total anthropogenic CO2 emissions without emissions/removals from land use,
land-use change and forestry, 1990, 2000, 2010, 2013 and 2014
United States 5 115 095 5 992 438 5 688 756 5 502 551 5 556 007 8.6
Number of Parties showing a decrease in emissions by more than 1 per cent: 28 Number of Parties showing a change in emissions within 1 per cent: 0 Number of Parties showing an increase in emissions by more than 1 per cent: 14
a A Party with an economy in transition. b Data for the base year defined by decisions 9/CP.2 and 11/CP.4 (Bulgaria (1988), Hungary (average of 1985–1987), Poland
(1988), Romania (1989) and Slovenia (1986)) are used for this Party instead of 1990 data. c Emission estimates of the European Union are as reported for its 28 member States as a group and are reported separately from
those of each individual member State. d Decision 26/CP.7 invited Parties to recognize the special circumstances of Turkey, which place it in a situation different from
that of other Parties included in Annex I to the Convention.
Table 6
Total anthropogenic CO2 emissions with emissions/removals from land use, land-use
change and forestry, 1990, 2000, 2010, 2013 and 2014
United States 4 370 240 5 293 061 4 914 071 4 727 892 4 778 456 9.3
Number of Parties showing a decrease in emissions by more than 1 per cent: 32 Number of Parties showing a change in emissions within 1 per cent: 0
Number of Parties showing an increase in emissions by more than 1 per cent: 10
a A Party with an economy in transition. b Data for the base year defined by decisions 9/CP.2 and 11/CP.4 (Bulgaria (1988), Hungary (average of 1985–1987), Poland
(1988), Romania (1989) and Slovenia (1986)) are used for this Party instead of 1990 data. c Emission estimates of the European Union are as reported for its 28 member States as a group and are reported separately from
those of each individual member State. d Decision 26/CP.7 invited Parties to recognize the special circumstances of Turkey, which place it in a situation different from
that of other Parties included in Annex I to the Convention.
Table 7
Total anthropogenic CH4 emissions without emissions/removals from land use, land-
use change and forestry, 1990, 2000, 2010, 2013 and 2014
United States 773 855 717 474 722 411 721 475 730 829 –5.6
Number of Parties showing a decrease in emissions by more than 1 per cent: 32 Number of Parties showing a change in emissions within 1 per cent: 0
Number of Parties showing an increase in emissions by more than 1 per cent: 10
a A Party with an economy in transition. b Data for the base year defined by decisions 9/CP.2 and 11/CP.4 (Bulgaria (1988), Hungary (average of 1985–1987), Poland
(1988), Romania (1989) and Slovenia (1986)) are used for this Party instead of 1990 data. c Emission estimates of the European Union are as reported for its 28 member States as a group and are reported separately from
those of each individual member State. d Decision 26/CP.7 invited Parties to recognize the special circumstances of Turkey, which place it in a situation different from
that of other Parties included in Annex I to the Convention.
Table 8
Total anthropogenic CH4 emissions with emissions/removals from land use, land-use
change and forestry, 1990, 2000, 2010, 2013 and 2014
United States 777 142 725 802 725 690 728 825 738 179 –5.0
Number of Parties showing a decrease in emissions by more than 1 per cent: 33 Number of Parties showing a change in emissions within 1 per cent: 0
Number of Parties showing an increase in emissions by more than 1 per cent: 9
a A Party with an economy in transition. b Data for the base year defined by decisions 9/CP.2 and 11/CP.4 (Bulgaria (1988), Hungary (average of 1985–1987), Poland
(1988), Romania (1989) and Slovenia (1986)) are used for this Party instead of 1990 data. c Emission estimates of the European Union are as reported for its 28 member States as a group and are reported separately from
those of each individual member State. d Decision 26/CP.7 invited Parties to recognize the special circumstances of Turkey, which place it in a situation different from
that of other Parties included in Annex I to the Convention.
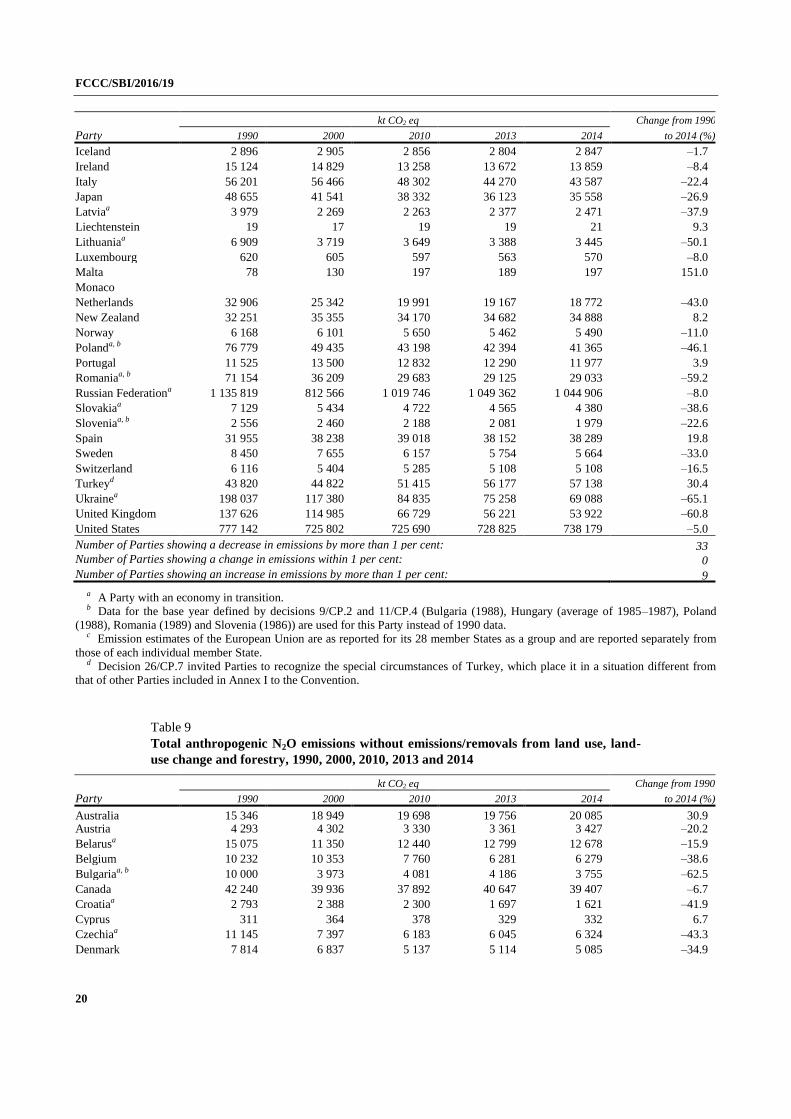
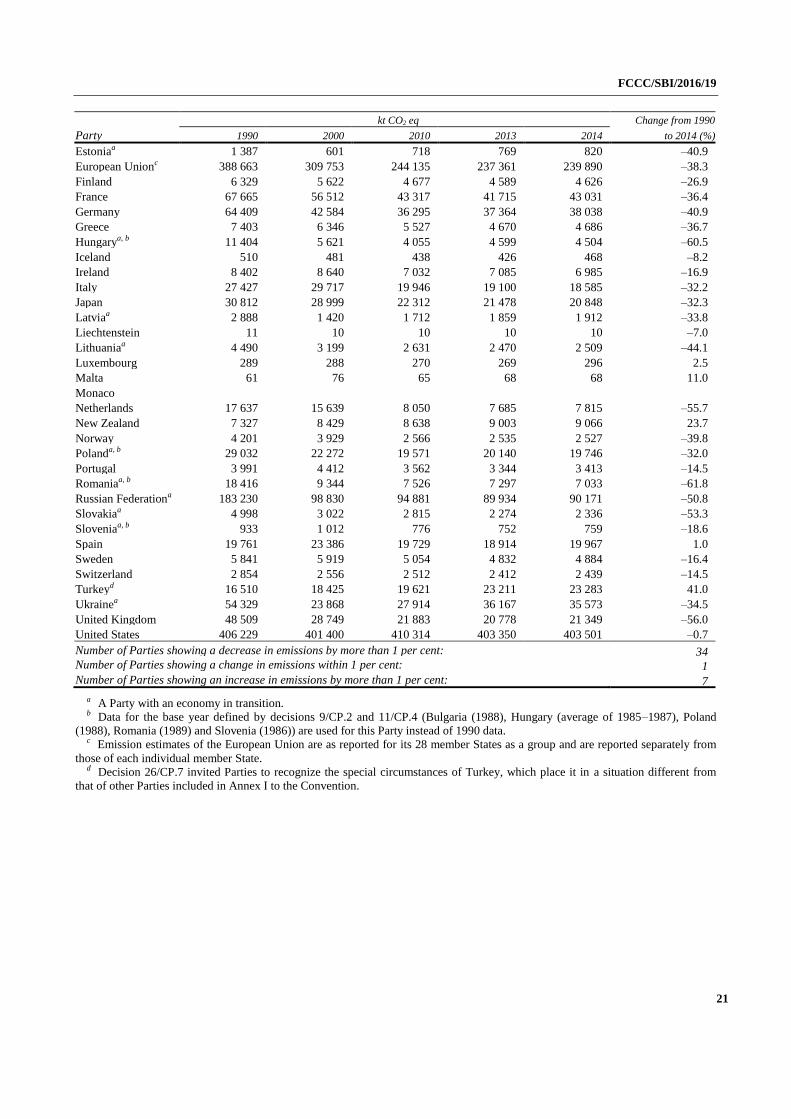
Table 9
Total anthropogenic N2O emissions without emissions/removals from land use, land-
use change and forestry, 1990, 2000, 2010, 2013 and 2014
United States 406 229 401 400 410 314 403 350 403 501 –0.7
Number of Parties showing a decrease in emissions by more than 1 per cent: 34 Number of Parties showing a change in emissions within 1 per cent: 1
Number of Parties showing an increase in emissions by more than 1 per cent: 7
a A Party with an economy in transition. b Data for the base year defined by decisions 9/CP.2 and 11/CP.4 (Bulgaria (1988), Hungary (average of 1985–1987), Poland
(1988), Romania (1989) and Slovenia (1986)) are used for this Party instead of 1990 data. c Emission estimates of the European Union are as reported for its 28 member States as a group and are reported separately from
those of each individual member State. d Decision 26/CP.7 invited Parties to recognize the special circumstances of Turkey, which place it in a situation different from
that of other Parties included in Annex I to the Convention.
FCCC/SBI/2016/19
22
Table 10
Total anthropogenic N2O emissions with emissions/removals from land use, land-use
change and forestry, 1990, 2000, 2010, 2013 and 2014
United States 409 844 409 431 415 295 411 075 411 231 0.3
Number of Parties showing a decrease in emissions by more than 1 per cent: 32 Number of Parties showing a change in emissions within 1 per cent: 1 Number of Parties showing an increase in emissions by more than 1 per cent: 9
a A Party with an economy in transition. b Data for the base year defined by decisions 9/CP.2 and 11/CP.4 (Bulgaria (1988), Hungary (average of 1985–1987), Poland
(1988), Romania (1989) and Slovenia (1986)) are used for this Party instead of 1990 data.
FCCC/SBI/2016/19
23
c Emission estimates of the European Union are as reported for its 28 member States as a group and are reported separately from
those of each individual member State. d Decision 26/CP.7 invited Parties to recognize the special circumstances of Turkey, which place it in a situation different from
that of other Parties included in Annex I to the Convention.
Table 11
Total aggregate anthropogenic emissions of HFCs, PFCs, SF6, MIX and NF3, 1990,
United States 101 966 147 661 163 976 172 604 180 109 76.6
Number of Parties showing a decrease in emissions by more than 1 per cent: 8 Number of Parties showing a change in emissions within 1 per cent: 1
FCCC/SBI/2016/19
24
kt CO2 eq Change from 1990
Party 1990 2000 2010 2013 2014 to 2014 (%)
Number of Parties showing an increase in emissions by more than 1 per cent: 24
a A Party with an economy in transition. b Data for the base year defined by decisions 9/CP.2 and 11/CP.4 (Bulgaria (1988), Hungary (average of 1985–1987), Poland
(1988), Romania (1989) and Slovenia (1986)) are used for this Party instead of 1990 data. c Emission estimates of the European Union are as reported for its 28 member States as a group and are reported separately from
those of each individual member State. d Decision 26/CP.7 invited Parties to recognize the special circumstances of Turkey, which place it in a situation different from
that of other Parties included in Annex I to the Convention.
Table 12
Net anthropogenic CO2 emissions/removals from land use, land-use change and
United States –744 855 –699 377 –774 685 –774 659 –777 550 4.4
Number of Parties showing a decrease in emissions by more than 1 per cent: 17 Number of Parties showing a change in emissions within 1 per cent: 0
Number of Parties showing an increase in emissions by more than 1 per cent: 25
a A Party with an economy in transition. b Data for the base year defined by decisions 9/CP.2 and 11/CP.4 (Bulgaria (1988), Hungary (average of 1985–1987), Poland
(1988), Romania (1989) and Slovenia (1986)) are used for this Party instead of 1990 data. c Emission estimates of the European Union are as reported for its 28 member States as a group and are reported separately from
those of each individual member State. d Decision 26/CP.7 invited Parties to recognize the special circumstances of Turkey, which place it in a situation different from
that of other Parties included in Annex I to the Convention.
Table 13
Anthropogenic CH4 emissions from land use, land-use change and forestry, 1990,
2000, 2010, 2013 and 2014
kt CO2 eq Change from 1990
Party 1990 2000 2010 2013 2014 to 2014 (%)
Australia 12 013 11 101 9 840 9 167 9 612 –20.0 Austria 0.47 0.10 0.11 0.21 0.13 –72.0
Number of Parties showing a decrease in emissions by more than 1 per cent: 19 Number of Parties showing a change in emissions within 1 per cent: 0
Number of Parties showing an increase in emissions by more than 1 per cent: 18
a A Party with an economy in transition. b Data for the base year defined by decisions 9/CP.2 and 11/CP.4 (Bulgaria (1988), Hungary (average of 1985–1987), Poland
(1988), Romania (1989) and Slovenia (1986)) are used for this Party instead of 1990 data. c Emission estimates of the European Union are as reported for its 28 member States as a group and are reported separately from
those of each individual member State. d Decision 26/CP.7 invited Parties to recognize the special circumstances of Turkey, which place it in a situation different from
that of other Parties included in Annex I to the Convention.
Table 14
Anthropogenic N2O emissions from land use, land-use change and forestry, 1990,
2000, 2010, 2013 and 2014
kt CO2 eq Change from 1990
Party 1990 2000 2010 2013 2014 to 2014 (%)
Australia 6 285 5 295 6 674 4 318 4 189 –33.3 Austria 15 14 18 19 19 23.8
Number of Parties showing a decrease in emissions by more than 1 per cent: 15 Number of Parties showing a change in emissions within 1 per cent: 1
Number of Parties showing an increase in emissions by more than 1 per cent: 25
a A Party with an economy in transition. b Data for the base year defined by decisions 9/CP.2 and 11/CP.4 (Bulgaria (1988), Hungary (average of 1985–1987), Poland
(1988), Romania (1989) and Slovenia (1986)) are used for this Party instead of 1990 data. c Emission estimates of the European Union are as reported for its 28 member States as a group and are reported separately from
those of each individual member State. d Decision 26/CP.7 invited Parties to recognize the special circumstances of Turkey, which place it in a situation different from
that of other Parties included in Annex I to the Convention.
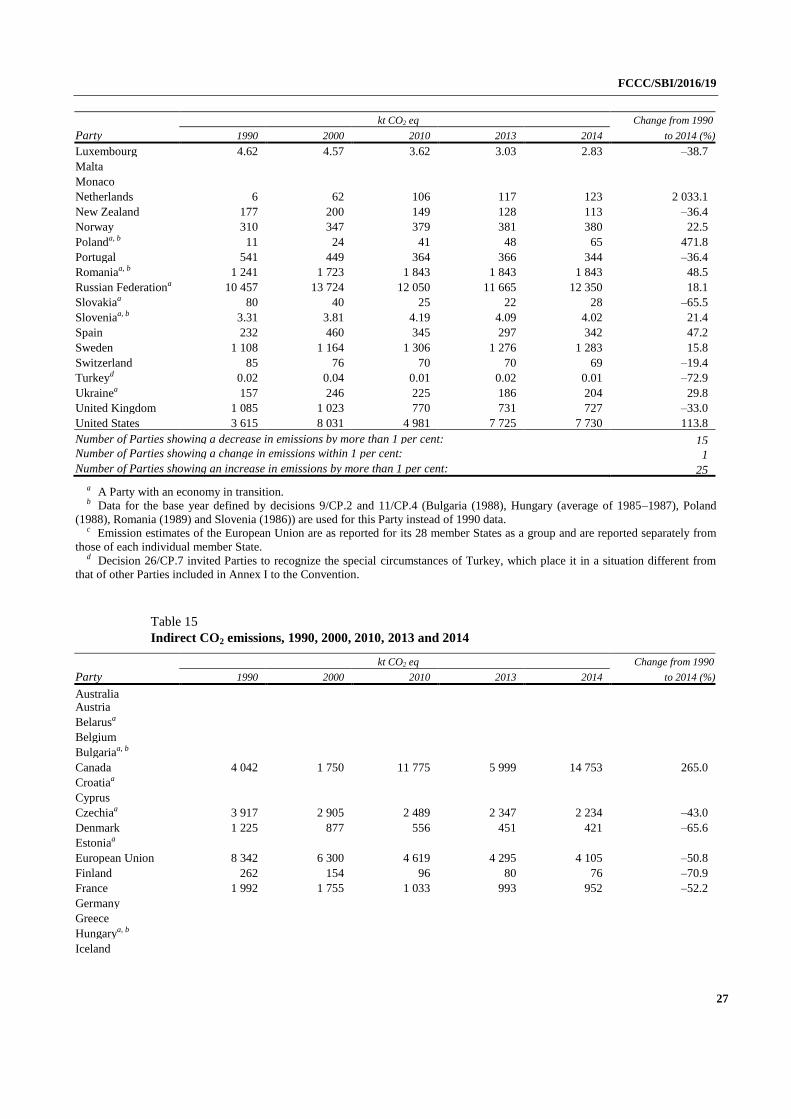
Table 15
Indirect CO2 emissions, 1990, 2000, 2010, 2013 and 2014
kt CO2 eq Change from 1990
Party 1990 2000 2010 2013 2014 to 2014 (%)
Australia Austria
Belarusa
Belgium
Bulgariaa, b
Canada 4 042 1 750 11 775 5 999 14 753 265.0
Croatiaa
Cyprus
Czechiaa 3 917 2 905 2 489 2 347 2 234 –43.0
Denmark 1 225 877 556 451 421 –65.6
Estoniaa
European Union 8 342 6 300 4 619 4 295 4 105 –50.8
Finland 262 154 96 80 76 –70.9
France 1 992 1 755 1 033 993 952 –52.2
Germany
Greece
Hungarya, b
Iceland
FCCC/SBI/2016/19
28
kt CO2 eq Change from 1990
Party 1990 2000 2010 2013 2014 to 2014 (%)
Ireland 81 74 64 65 65 –20.1
Italy
Japan
Latviaa 43 26 16 15 20 –53.5
Liechtenstein
Lithuaniaa
Luxembourg
Malta
Monaco
Netherlands 666 335 237 214 211 –68.3
New Zealand
Norway
Polanda, b
Portugal 157 176 132 133 128 –18.8
Romaniaa, b
Russian Federationa
Slovakiaa
Sloveniaa, b
Spain
Sweden
Switzerland 418 190 125 121 121 –71.1
Turkeyd
Ukrainea
United Kingdom
United States
Number of Parties showing a decrease in emissions by more than 1 per cent: 10 Number of Parties showing a change in emissions within 1 per cent: 0 Number of Parties showing an increase in emissions by more than 1 per cent: 1
a A Party with an economy in transition. b Data for the base year defined by decisions 9/CP.2 and 11/CP.4 (Bulgaria (1988), Hungary (average of 1985–1987), Poland
(1988), Romania (1989) and Slovenia (1986)) are used for this Party instead of 1990 data. c Emission estimates of the European Union are as reported for its 28 member States as a group and are reported separately from
those of each individual member State. d Decision 26/CP.7 invited Parties to recognize the special circumstances of Turkey, which place it in a situation different from
that of other Parties included in Annex I to the Convention.