Page 1
University of WollongongResearch Online
University of Wollongong Thesis Collection University of Wollongong Thesis Collections
1991
Heat affected zone structure and properties of awelded copper bearing HSLA steelXiaping LinUniversity of Wollongong
Research Online is the open access institutional repository for theUniversity of Wollongong. For further information contact the UOWLibrary: [email protected]
Recommended CitationLin, Xiaping, Heat affected zone structure and properties of a welded copper bearing HSLA steel, Doctor of Philosophy thesis,Department of Materials Engineering, University of Wollongong, 1991. http://ro.uow.edu.au/theses/1501
Page 3
HEAT AFFECTED ZONE STRUCTURE AND PROPERTIES OF A WELDED COPPER
BEARING HSLA STEEL
A thesis submitted in fulfilment of the requirements for the award of the degree of
DOCTOR OF PHILOSOPHY
from
THE UNIVERSITY OF WOLLONGONG
by
XIAPING LIN, B. Sc, M. Sc.
DEPARTMENT OF MATERIALS ENGINEERING
1991
Page 4
DECLARATION
The work submitted in this thesis has been carried out by the candidate
whilst enrolled as a full-time postgraduate student at the Department of
Materials Engineering of the University of Wollongong. The results
obtained from this study and the conclusions drawn are those of the
candidate, except where otherwise stated.
The work contained in this thesis has not been submitted for a degree to any
other university or similar institution.
XIAPING LIN
Page 5
i
ACKNOWLEDGEMENTS
The research work reported in this thesis was carried out at the Department of Materials
Engineering, the University of Wollongong under the supervision of Associate Professor
D.P. Dunne.
I wish to express my sincere gratitude to Associate Professor D.P. Dunne, for his skillful
supervision, patience and encouragement, as well as for arranging scholarship support
during m y candidature. M y special gratitude is also due to him for his personal
understanding and generosity throughout the course of this work.
I would like to thank the chairmen of the Department during this study, Associate
Professor N.F. Kennon and Professor W J . Plumbridge for the provision of laboratory
facilities. I would especially like to thank Associate Professor N.F. Kennon for setting
up the scholarship for m e at the beginning of this research during study leave by
Associate Professor D.P. Dunne.
I wish to thank Bisalloy Steel Pty. Ltd. for the financial support of the initial part of this
research work. I would like to thank Dr. A.L. Wingrove of Bisalloy Steel Pty. Ltd. for
offering generous help in tensile and Charpy testing experiments, and the staff members
in the mechanical testing laboratory of this company for testing these samples. Gratitude
is also extended to B H P Steel and Plate Products Division for the financial support of
part of this research work and donation of welded samples and steel plate used in this
investigation. I would like to thank C S I R O Division of Manufacturing Technology for
the supply of welded specimens.
I am grateful to the members of the Department who have assisted me during the
experimental work. M y special appreciation goes to Mr. G. Hamilton for his effort in
Page 6
ii
setting up and modifying the weld simulator equipment, and assistance with the weld
simulation experiments, as well as for his encouragement and suggestions throughout the
present work.
Finally, my warm appreciation and respect is due to my husband, Hua Guo, for his
understanding, continuous encouragement and patience throughout the period of this
research work. M y grateful acknowledgement also goes to m y parents, sisters and
brother who have given m e support and encouragement through the course of this work
The research work was sponsored by the Australian Welding Research Association
( A W R A ) and by the Australian Government Industry Research and Development Board
via a research grant for a project on High Productivity Welding'.
Page 7
iii
ABSTRACT
A weld joint produced by a fusion welding process consists of the weld metal and a heat
affected zone (HAZ). The macro- and microstructures and mechanical properties of these
regions determine the weldability of a material. Although the composition of the weld
metal can be varied by the choice of filler metal and the extent of dilution, the H A Z has a
composition which is essentially the same as the base plate and is an identifiable region
because of the structural changes induced by the weld thermal cycle. The H A Z is
important because of its potential to develop structures which adversely affect the
properties of the joint.
In the present work, the structures and properties of the HAZs produced by various
welding processes have been investigated for a commercial structural plate steel. The
structure and property gradients across the H A Z have been examined to determine the
critical region of the H A Z which governs the properties of the whole H A Z . The effects
on the H A Z of weld process type (bead-on -plate submerged arc [BOP SA], bead-on-
plate flux cored arc [BOP F C A ] , and four wire submerged arc [4 wire SA]); and the
welding parameters of heat input, welding speed, multi-passes and postweld heat
treatment have been analysed in order to assess the weldability of the steel. The
mechanical properties of toughness, tensile properties and hardness are of major concern
in the present investigation.
The steel investigated was a low carbon, copper-bearing, precipitation hardening steel
(HSLA 80) which has been recently developed by B H P Steel, SPPD, Port Kembla,
Australia. It is based on a modified A S T M A710 steel chemical composition and is
produced by a thermomechanical control rolling process (TMCP). The high yield strength
of this steel (80ksi or 550Mpa for plate < 2 5 m m ) is achieved by copper precipitation
hardening through an aging heat treatment at 550°C for 1/2 hour after rolling. The reason
Page 8
iv
for the development of this steel was to produce an 80ksi grade steel which can be
welded more easily and can be more economically produced than quenched and tempered
H Y 80 type steels and thus can be qualified as a replacement in various structural
applications. The weldability of this new steel is thus of critical importance in proving its
advantages over H Y 80.
This thesis reports a detailed investigation of the structure and properties of the weld
H A Z , which is widely regarded as a critical region in terms of the weldability of a steel.
As a result of the microstructural gradient which develops across the HAZ, it is difficult
to carry out Charpy impact toughness testing on a particular microstructural region of the
H A Z . In order to facilitate mechanical testing, especially impact testing, thermal
simulation experiments have been conducted to reproduce in "bulk form" structures
similar to those of different sub-regions of the actual H A Z . A comparison has been made
of the results obtained from actual and simulated H A Z s .
The effect of multi-pass welding and postweld heat treatment on the HAZ structure has
been simulated to assess the response of the H A Z to a series of thermal cycles. A partial
y-»a continuous cooling transformation diagram for the grain coarsened H A Z region
under weld thermal cycle conditions was also obtained by analysing the cooling curves
associated with thermal cycles simulating those experienced in the H A Z during welding
under different conditions.
The microstructure of the grain coarsened HAZ region for both actual and simulated
welds generally consisted of ferrite in the form of grain boundary allotriomorphs,
Widmanstatten sideplates and laths, together with martensite-austenite ( M A ) islands. The
dominant constituents were lath ferrite and M A islands. L o w carbon lath martensite was
also found in the H A Z of some low heat input welds, particularly B O P F C A welds.
Page 9
V
A general problem in welding precipitation hardening steels is that the H A Z thermal cycle
can destroy the precipitation hardening and reduce the hardness locally to below the level
of the base plate. Such a softened H A Z was observed in the present steel for the B O P
SA, B O P F C A and the 4 wire S A welds; as well as for the simulated HAZs. The loss of
precipitation hardening was found to be due to solution of copper on re-austenitising and
the resulting supersaturation of ferrite on cooling. For intercritical heating, a significant
part of the softening was due to rapid overaging of copper precipitate particles in the
untransformed ferrite.
It was found that the HSLA 80 steel showed a good overall toughness in the HAZ for the
welding conditions investigated. The toughness of this type of steel in the hot rolled and
aged condition is due to its low carbon content (0.055%) and a fine grained structure. In
addition, the low carbon equivalent (0.41), relative to the strength, ensured that H A Z
toughness generally exceeded the minimum requirements for H Y 80 and was similar to
that of the base plate. Of the various H A Z sub-zones, the grain coarsened region
( G C H A Z ) near the fusion line exhibited the lowest toughness and highest hardness
values and, therefore, this region is likely to govern the overall H A Z toughness.The heat
input did not appear to have a major effect on H A Z toughness, despite the observation
that H A Z structural refinement and an increase of H A Z hardness occurred with
decreasing heat input.
It was established by simulated multiple weld thermal cycles that multi-pass welding
generally refines the H A Z structure and improves the toughness of the H A Z . However,
it was found that a second weld thermal cycle to a subcritical peak temperature, consistent
with a high heat input, could markedly increase the hardness of an original grain
coarsened H A Z region produced by a low heat input, because of precipitation of copper
from supersaturated ferrite. This combination of thermal cycles appears to have the
potential to reduce the toughness in this local region.
Page 10
vi
Strengths similar to that of the base plate were obtained from transverse tensile tests on
weld joints produced at heat inputs of 2.5 and 5kJ/mm by 4 wire submerged arc welding,
despite the softening which occurred in the H A Z . However, for a high heat input of
lOkJ/mm, significant degradation of weld strength occurred because of the wide softened
H A Z . Varying the welding speed of 4 wire S A W showed little effect on H A Z structure,
toughness, hardness and tensile properties.
Postweld heat treatment of the GCHAZ region at 550°C for 1 hour significantly reduced
its toughness. This embrittlement was attributed to precipitation hardening by copper
which resulted in a considerable increase in hardness. However, postweld heat treatment
at 450oC and 650"C were found to improve the toughness and reduce the hardness of the
GCHAZ.
Investigation of the y-»a transformation temperature of the grain coarsened HAZ region
under simulated welding conditions showed that during the cooling part of a weld thermal
cycle, austenite begins to transform at temperature between 600-650° C for the equivalent
heat input range of 1.9-4.9kJ/mm. A lower transformation temperature was associated
with a lower heat input.
Comparison with a reference steel indicated that the copper and nickel additions to the
H S L A 80 suppressed the H A Z transformation temperature. The major associated
microstructural change was the predominance of a nondiffusional second constituent
(martensite-austenite islands) rather than a diffusional one (pearlite and/or bainite).
The research investigation makes two main contributions to knowledge in the field of the
physical metallurgy of ferrous alloy welding. The first is the provision of detailed data on
the structure and properties of the H A Z of a modified A710 type precipitation hardening
steel for welding by flux cored arc and submerged arc processes under various
Page 11
vii
conditions. This characterisation of the structure and properties has allowed definition of
welding conditions leading to satisfactory strength and toughness in the H A Z .
The second contribution is a general finding concerning limitations of the Rosenthal
analysis of heat transfer during welding which is based on the assumption of a moving
point heat source. The implication of this analysis, and a widely accepted view, is that a
constant heat input dictates a constant H A Z cooling rate and hence structure. However,
structure and properties have been observed to vary in a small but significant way with
position around the fusion line of a single weld bead at a given heat input and between
welding processes at the same nominal heat input In both cases, variations in weld bead
shape affect the local heat transfer conditions and hence the cooling rate.
Page 12
viii
TABLE OF CONTENTS
Page
ACKNOWLEDGEMENTS i
ABSTRACT iii
TABLE OF CONTENTS viii
Chapter 1 INTRODUCTION 1
Chapter 2 THE HEAT-AFFECTED ZONE 12
2.1 INTRODUCTION 13
2.2 THE THERMAL CYCLE OF BASE METAL 15
2.3 HAZ MICROSTRUCTURE 20
2.3.1 Grain Coarsened Region 20
2.3.1.1 Precipitation retardation of austenite grain growth 21
2.3.1.2 Prediction of prior austenite grain size of H A Z 25
2.3.2 Grain Refined Region 25
2.3.3 Partially Transformed Region 26
2.3.4 Tempered Region 26
2.3.5 Region of Unchanged Base Material 26
2.3.6 H A Z Microstructure of Multi-pass Welds 27
2.4 M I C R O S T R U C T U R E S I M U L A T I O N 29
2.4.1 Uses of Weld Thermal Simulators 30
2.4.2 Weld Simulator 31
2.4.3 Comparison of Weld and Thermally Simulated H A Z
Microstructure 31
Page 13
ix
2.5 CONTINUOUS COOLING TRANSFORMATION DIAGRAM 34
2.5.1 Methods for Determining CCT Diagrams 37
2.5.2 CCT Characteristics and Hydrogen Cracking 43
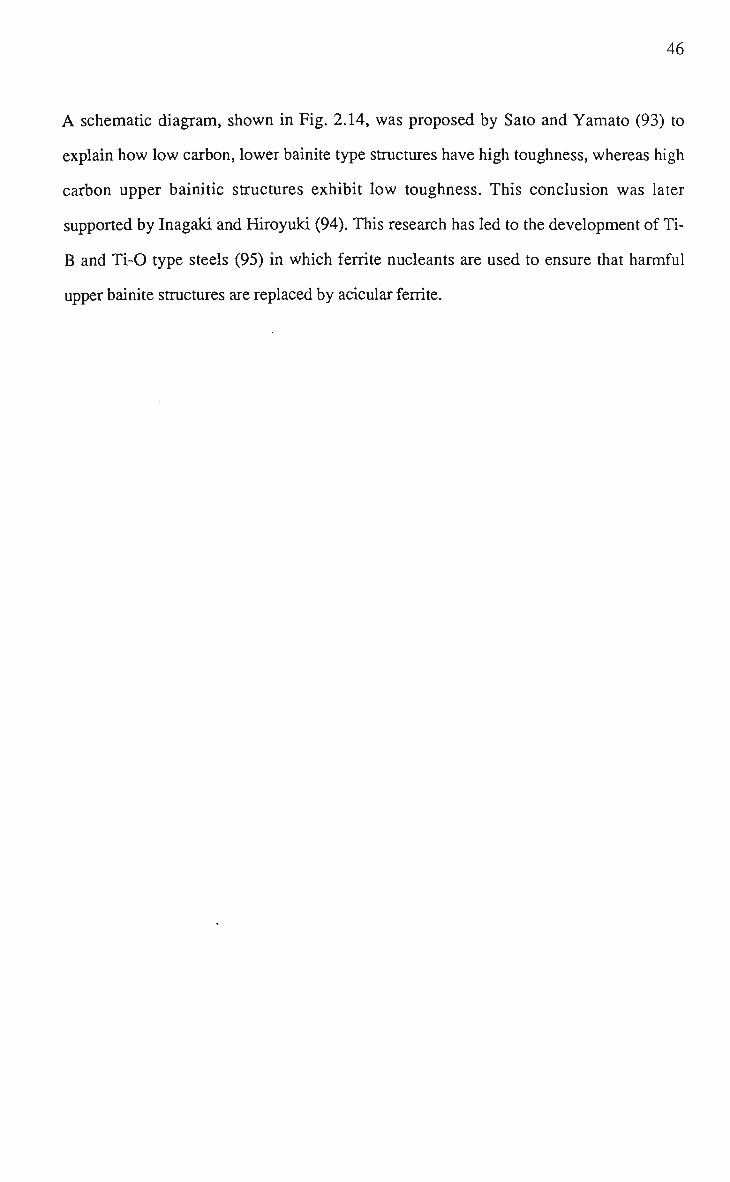
2.5.3 H A Z Toughness Prediction from the CCT Diagram 45
Chapter 3 PROPERTIES OF THE HEAT AFFECTED ZONE 48
3.1 INTRODUCTION 49
3.2 C O L D C R A C K I N G 50
3.2.1 The Effect of Microstructure 50
3.2.2 Prediction of Cold Cracking by Carbon Equivalent 53
3.3 H A Z H A R D N E S S 56
3.3.1 Hardness Measurement 58
3.3.2 Prediction of Maximum Hardness 61
3.4 T O U G H N E S S OF H A Z 63
3.4.1 Testing Methods 63
3.4.2 Influence of Metallurgical Factors 66
3.4.2.1 Coarse grain in the H A Z 66
3.4.2.2 Martensite-austenite constituent 67
3.4.2.3 Influence of microalloy elements 69
3.4.3 Influence of Welding Parameters and High
Productivity Welding 71
Chapter 4 COPPER-BEARING STEELS AND THEIR
WELDABILITY 77
4.1 INTRODUCTION 78
4.2 DEVELOPMENT OF COPPER-BEARING HSLA STEELS 80
Page 14
X
4.3 WELDABELITY OF COPPER-BEARING STEELS 84
4.3.1 Hot Cracking 85
4.3.2 Cold Cracking 87
4.3.3 HAZ Toughness 89
4.3.4 Stress Relief Embrittlement 91
4.4 A710 STEELS AND THEIR WELDABILITY 92
4.4.1 Age Hardening Heat Treatment 94
4.4.2 Certification of HSLA 80 Steel in Naval Construction 95
4.4.3 A710-modified Steels Produced by Thermomechanical
Control Rolled Process 96
4.4.4 Weldability of A710 Steels 98
Chapter 5 EXPERIMENTAL METHODS 102
5.1 INTRODUCTION 103
5.2 MATERIALS 105
5.3 WELDING PROCEDURES AND ELECTRODES 112
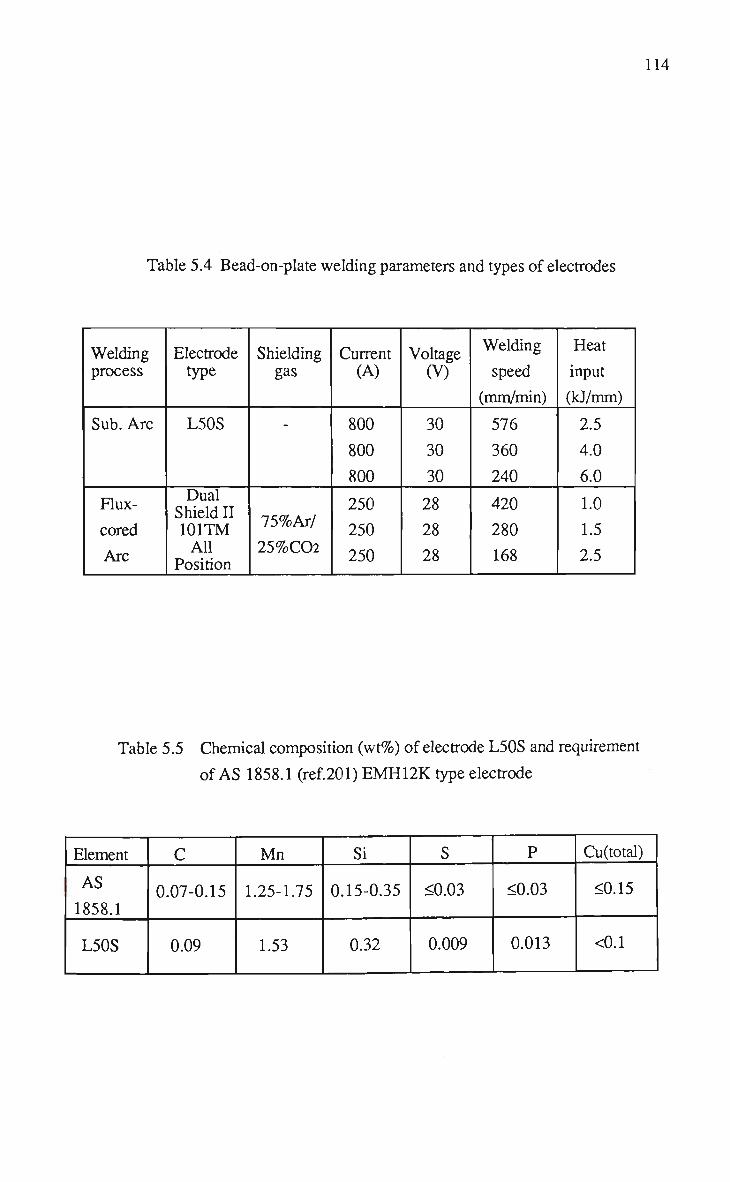
5.3.1 Bead-on-plate SA and FCA Welds 112
5.3.2 Four Wire SA Welds 116
5.4 REHEATED BOP SA WELD HAZS 116
5.5 HAZ WELD SIMULATION 120
5.5.1 Weld Simulator 120
5.5.2 Control of Thermal Cycle Parameters 122
5.5.2.1 Cooling rate 122
5.5.2.2 Peak temperature 122
5.5.3 Simulation Conditions 124
5.5.3.1 HAZ of single and multi-pass welding 125
Page 15
XI
5.5.3.2 The effect of heat input 128
5.5.3.3 Postweld heat treatment 128
5.6 DETERMINATION OF y->a TRANSFORMATION
TEMPERATURE 12g
5.7 MECHANICAL PROPERTIES TESTING 129
5.7.1 Impact Toughness 129
5.7.1.1 Simulated HAZs 129
5.7.1.2 Four wire SA welds ; 131
5.7.2 Hardness ..131
5.7.2.1 Bead on plate welds 132
5.7.2.2 Four wire submerged arc welds 132
5.7.2.3 Simulated HAZ 134
5.7.3 Tensile Properties of 4 Wire Submerged Arc Welds 134
5.8 METALLOGRAPHY AND FRACTOGRAPHY 135
5.8.1 Optical Metallography and Fractography 135
5.8.2 HAZ Width Measurement 136
5.8.3 Quantitative Analysis of Martensite-Austenite Islands 136
5.8.4 Measurement of Prior Austenite Grain Size 138
5.8.5 Electron Micrography and Fractography 140
Chapter 6 EXPERIMENTAL RESULTS 141
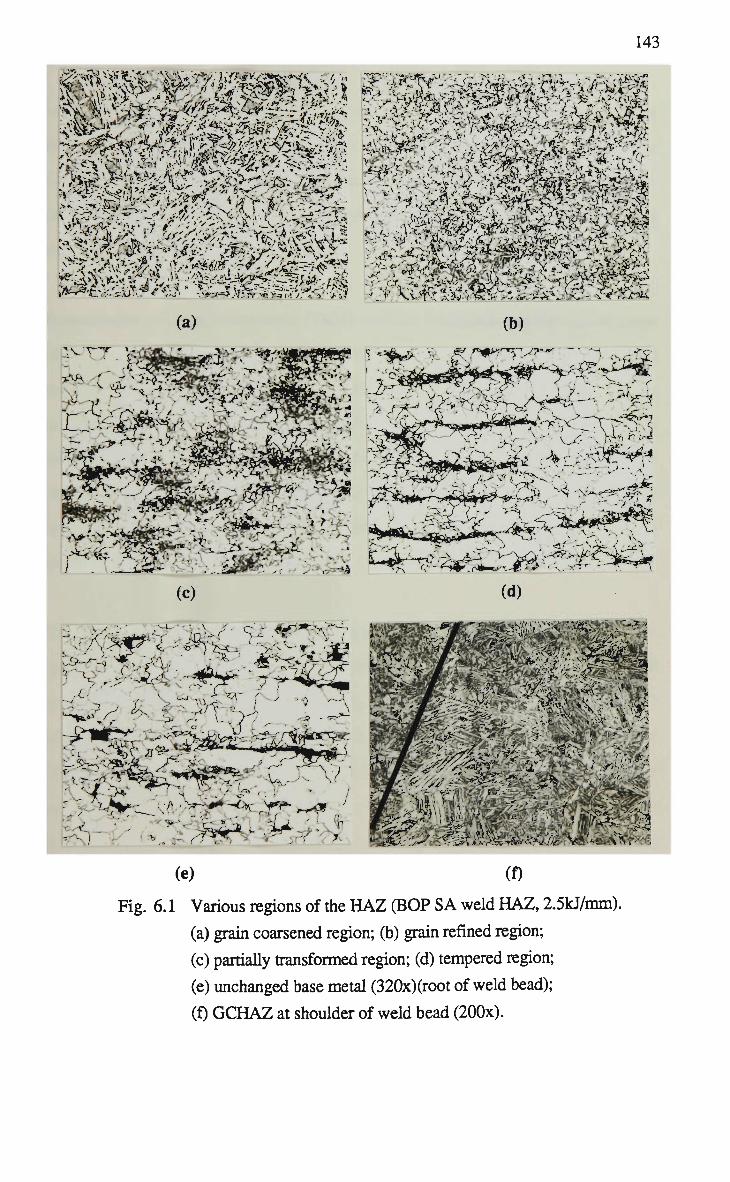
6.1 INTRODUCTION 142
6.2 BEAD-ON-PLATE SUBMERGED ARC WELDS 142
6.2.1 Microstructure of Various Regions 142
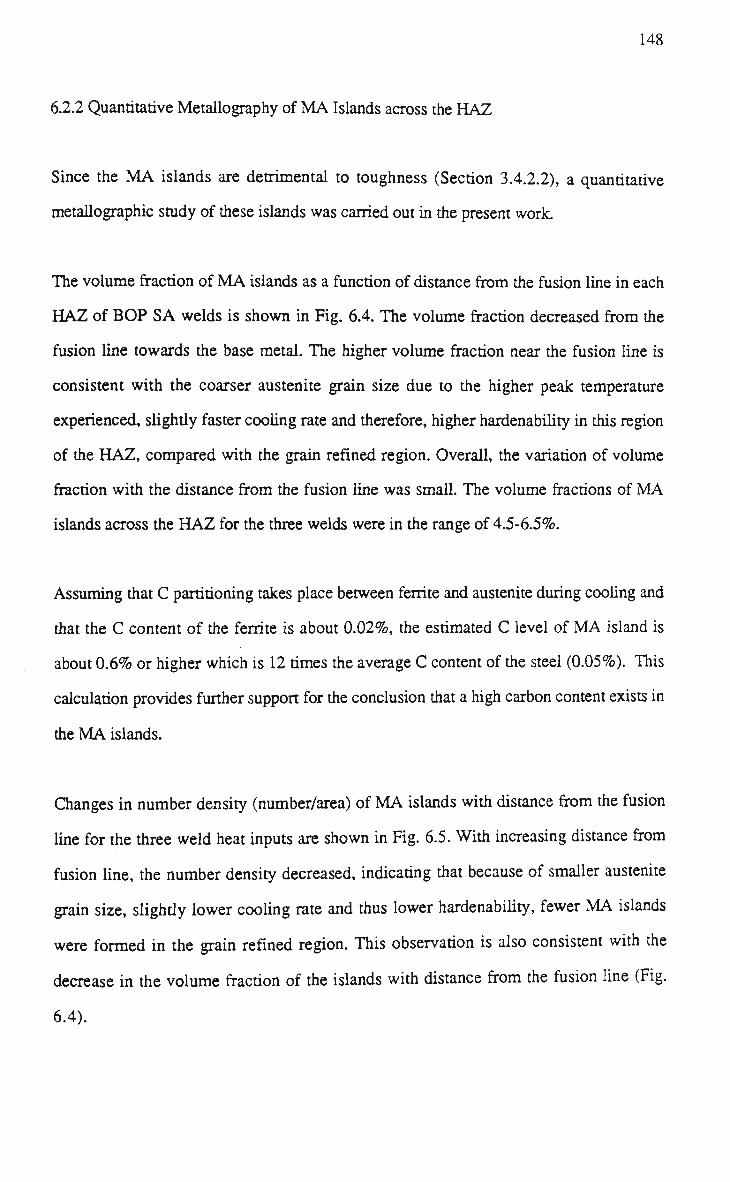
6.2.2 Quantitative Metallography of M A Islands across the HAZ 148
6.2.3 Hardness Traverses 151
6.2.4 The Effect of Heat Input 154
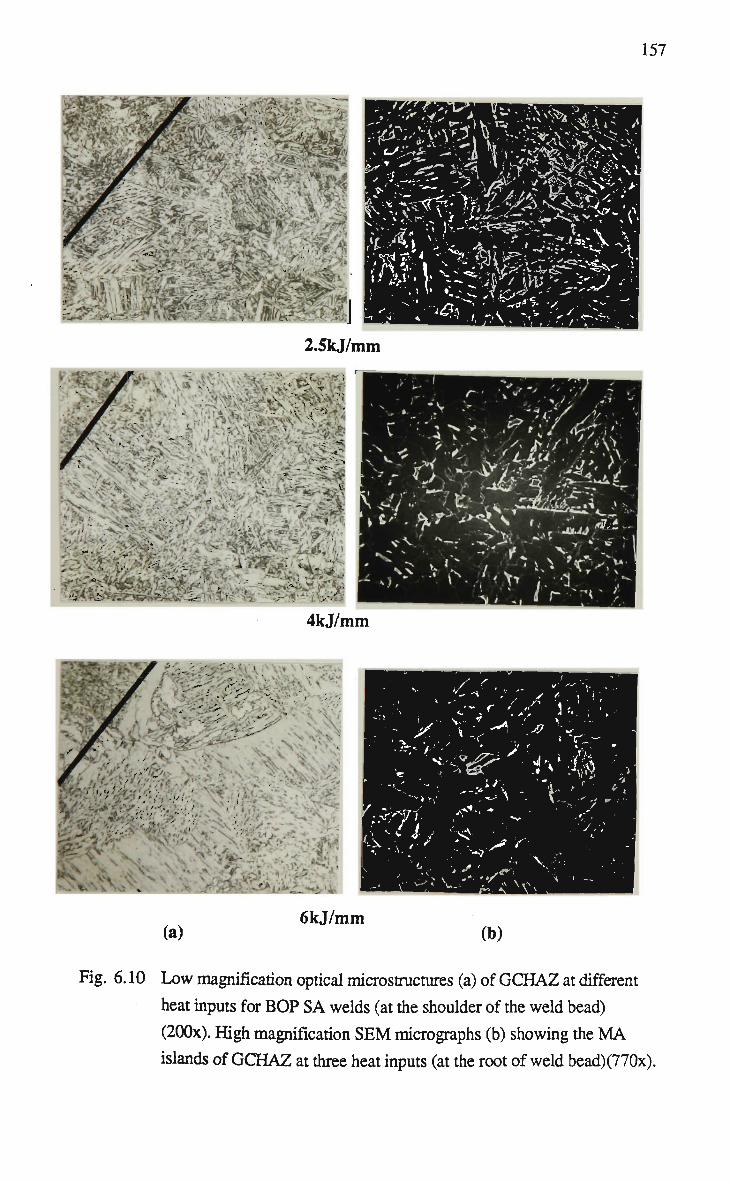
6.2.4.1 Macro- and micro- structures of HAZ 154
Page 16
xii
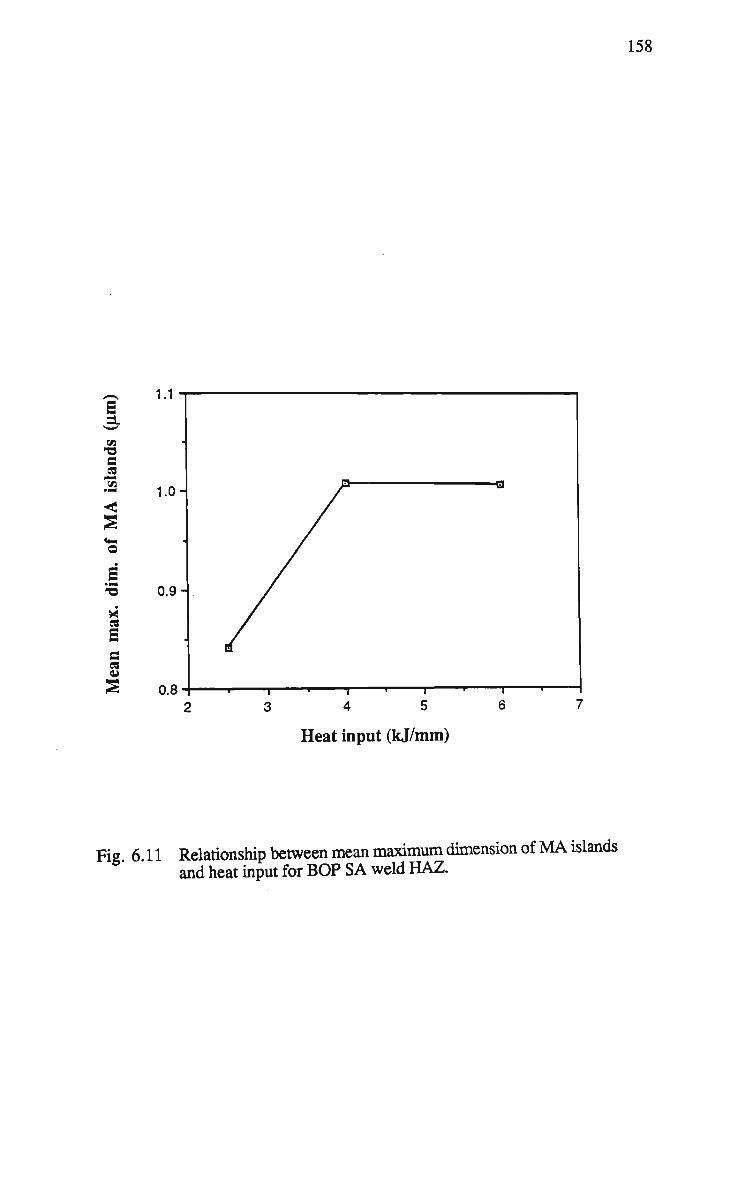
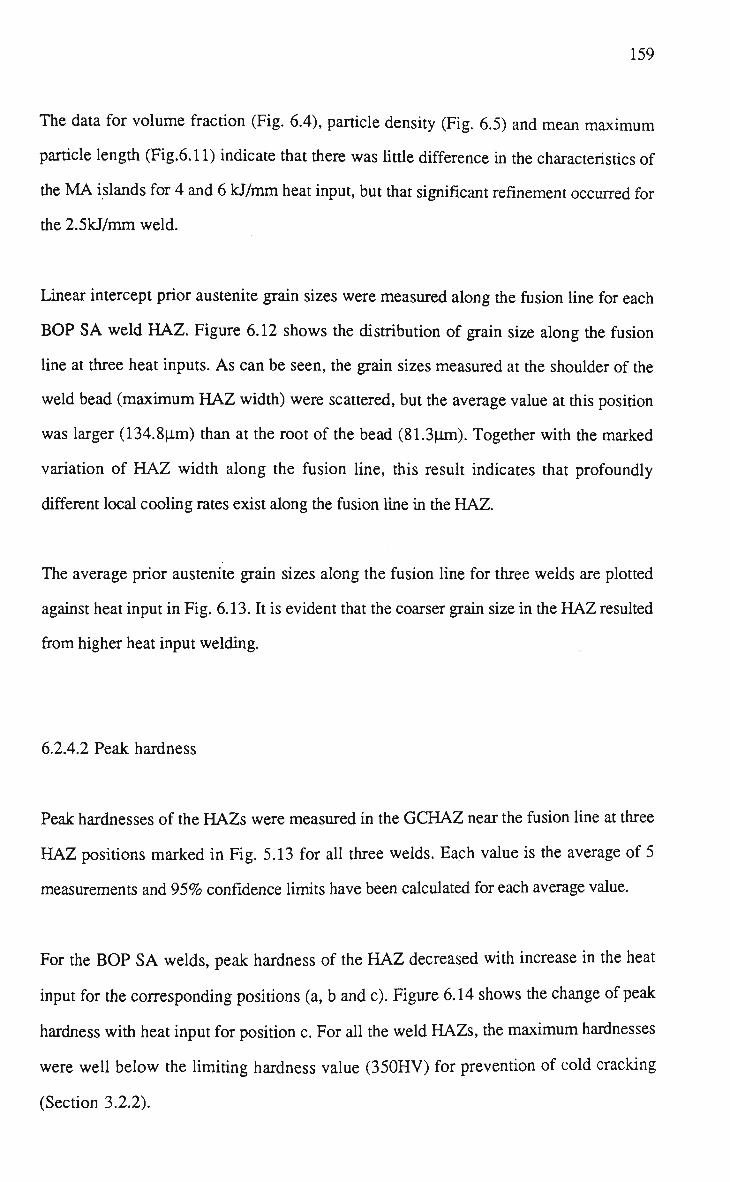
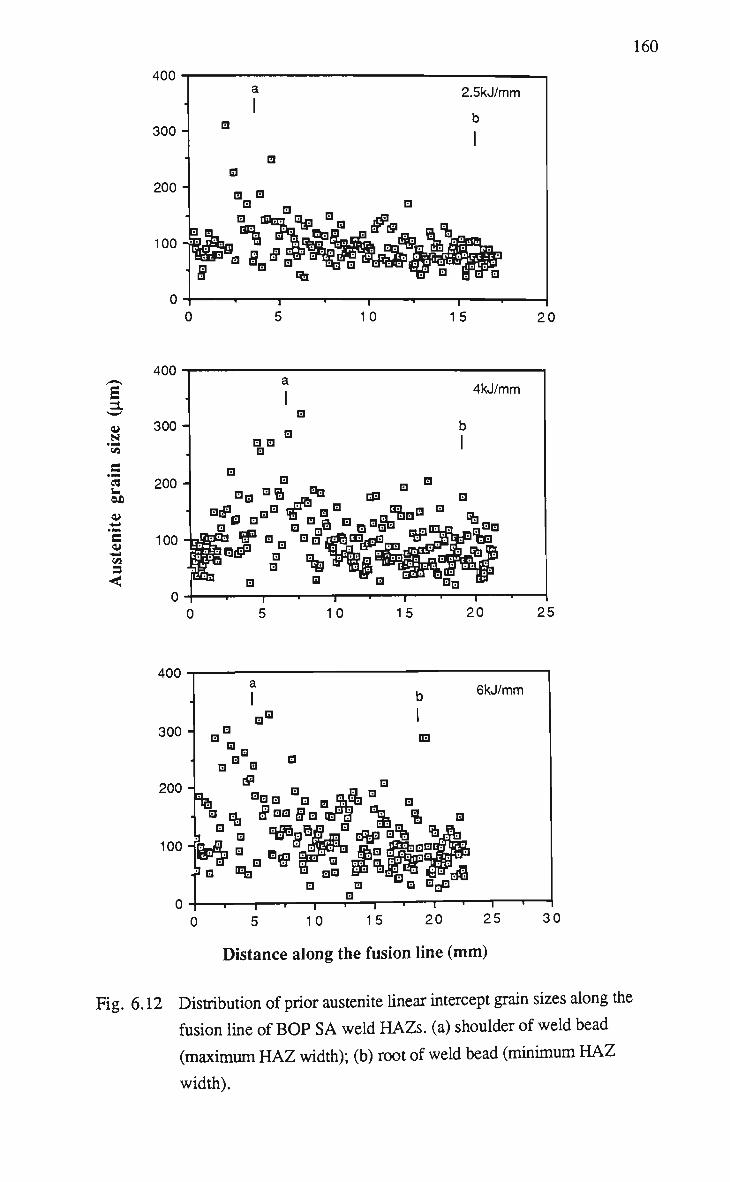
6.2.4.2 Peak hardness 159
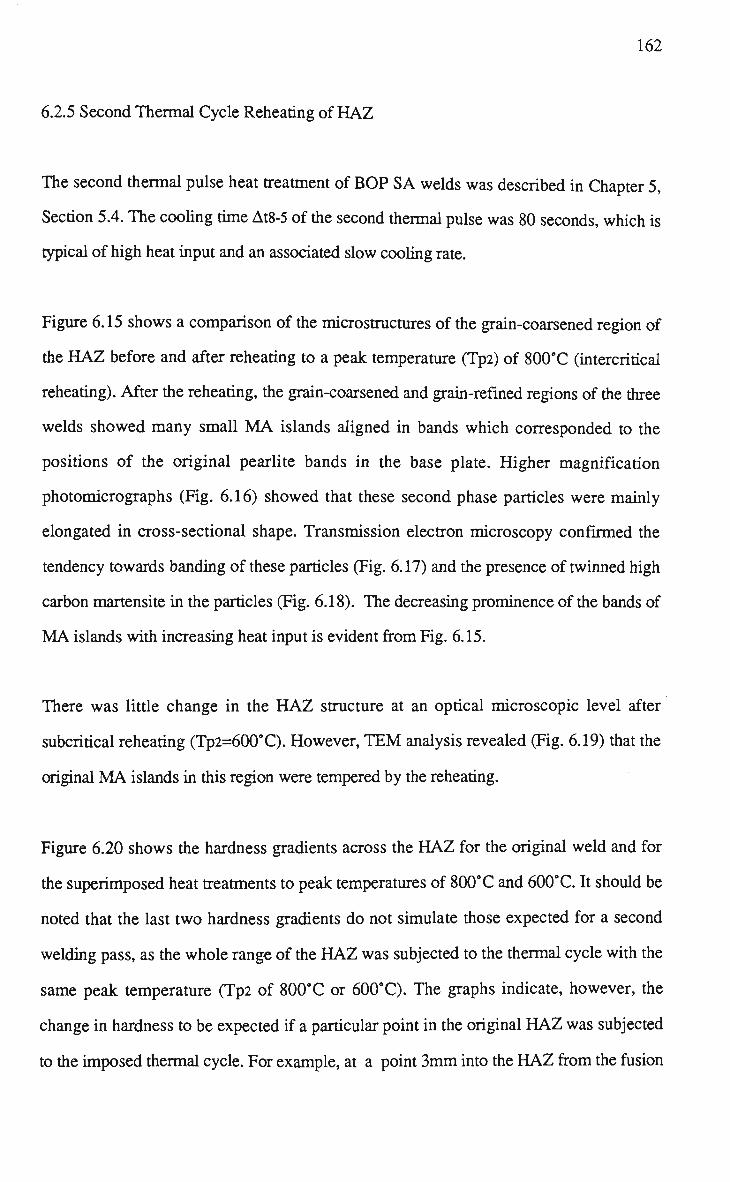
6.2.5 Second Thermal Cycle Reheating of HAZ 162
6.3 BEAD-ON-PLATE FLUX-CORED ARC WELDS 167
6.4 FOUR WIRE SUBMERGED ARC WELDS 173
6.4.1 The Effect of Heat Input 173
6.4.2 Effect of Welding Speed on the Structure and Properties of
4 Wire SA Welds 188
6.5 SIMULATED H E A T AFFECTED ZONE 190
6.5.1 Single Pass H A Z 194
6.5.2 Reheated Grain Coarsened H A Z Region 202
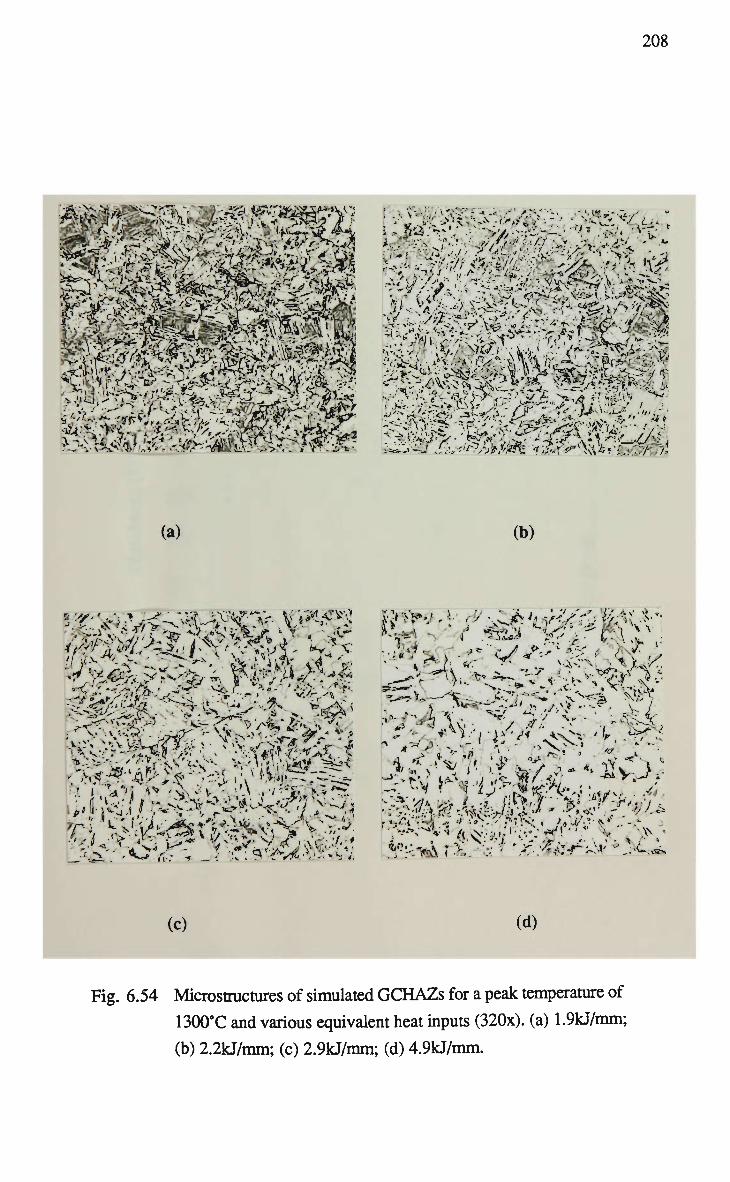
6.5.3 The Effect of Heat Input 207
6.5.4 The Effect of Postweld Heat Treatment 210
6.6 CONTINUOUS COOLING TRANSFORMATION
DIAGRAMS 213
Chapter 7 DISCUSSION 218
7.1 INTRODUCTION 219
7.2 STRUCTURE AND PROPERTIES OF THE HAZ OF SINGLE
PASS ACTUAL AND SIMULATED WELDS 220
7.3 HARDNESS AND HAZ WIDTH VARIATION ALONG THE
FUSION LINE OF BOP SA WELDS 226
7.4 FACTORS AFFECTING THE HAZ STRUCTURE AND
PROPERTIES 231
7.4.1 Effect of Multi-pass Welding 231
7.4.1.1 Intercritical reheating of BOP SA welds 231
7.4.1.2 Subcritical reheating of BOP SA welds 232
7.4.1.3 Intercritically and subcritically reheated simulated G C H A Z 233
7.4.1.4 Summary 234
Page 17
xiii
7.4.2 Effect of Heat Input 235
7.4.2.1 Weld profile and H A Z width 235
7.4.2.2 H A Z peak hardness 236
7.4.2.3 H A Z impact toughness 236
7.4.2.4 Transverse tensile properties of 4 wire SA welds 238
7.4.3 The Effect of Welding Speed on the H A Z of 4 wire SA welds....239
7.4.4 Effect of Postweld Heat Treatment 241
7.5 TRANSFORMATION IN THE G C H A Z A N D RESULTANT
S T R U C T U R E A N D PROPERTIES 247
7.5.1 Partial CCT Diagram of CR HSLA 80 Steel 247
7.5.2 Properties of the Simulated G C H A Z 248
7.5.3 Effect of Copper and Nickel Contents on H A Z Microstructure
and Hardness 249
Chapter 8 CONCLUSIONS 251
REFERENCES 256
PUBLICATIONS 276
Page 18
1
CHAPTER 1
INTRODUCTION
Page 19
2
Materials for naval and offshore constructions must meet a variety of requirements
principally associated with loadings, environment and life-cycle maintenance. The
fracture safety of these structures is addressed mainly through the use of tough structural
alloys. The current steels available for construction of naval vessels are mainly
H T S , H Y 80 and H Y 100. The high tensile steel (HTS) is a carbon-manganese steel with
52 ksi minimum yield strength. The H Y 80 and H Y 100 are high yield steels with
minimum yield strength of 80 and 100 ksi respectively.
Development of HY 80 steel began after World War II as a high-strength steel to replace
the H T S steel (1). The H Y 80 steel was actually developed from a 1894-vintage Krupp
armour steel (2) that relied on nickel and chromium for strength and toughness. The
toughness and strength achieved in the HY-series steels is obtained with the use of
relatively high amounts of alloying elements combined with a quench and temper (Q&T)
heat treatment.
The HY-series steels have martensitic structure, which usually shows high hardenability
and low crack resistance. Welding of these steels thus requires the use of stringent
welding process controls and specially designed filler materials to retain adequate
properties in the as-welded condition. Additionally, preheat prior to welding and interpass
temperature control is needed when using these steels to avoid and minimize cracking in
weldments. These controls and requirements are still in place today. Unfortunately, they
increase the cost of welded structure considerably.
To reduce cost, an easily weldable steel with similar strength and toughness properties
was needed to replace the H Y 8 0 steel.
High strength low alloy (HSLA) C-Mn steels with carbon levels below 0.15 per cent and
fine grained ferritic microstructures were considered by the U S . Navy as the best
candidate steels to replace H Y 8 0 steel (1). The use of microalloying and
Page 20
3
thermomechanical processing results in fine grain size, reduced C level and therefore,
enhanced strength and toughness. H S L A steels can be produced with similar strength and
toughness to Q & T steels and inherendy good weldability can be achieved due to their low
carbon contents. The U.S. Navy reported (1) that estimates of the reduction in cost of
welded ship structures are in the range of $0.4 to $0.9 per pound, which projects to a
total savings of $0.5 to $2 billion over the next two decades.
Of the commercially available HSLA steels, ASTM A710 Grade A steel, which was
originally used by the offshore industry, immediately meets the property goals without
requiring any alloy development or modification. The successful certification program of
80 ksi H S L A steel, based on the A710 steel system occurred in early 1984 to replace the
H Y 80 steel in surface ship hull structural application (1). In the last few years,
application of H S L A 80 steel has been increased as a substitute for H Y 8 0 in cruiser deck,
bulkhead and hull applications (3).
The chemical composition of A710 steel Grade A is listed in Table 1.1. High yield
strength of this steel is attributed to C u precipitation hardening in a ferrite matrix while
still retaining good toughness. Because of the low carbon content and ferritic structure,
this steel is extremely weldable without the use of preheat and many stringent process
controls required for HY80. In addition, the presence of about 1 % Cu contributes to good
formability (4) and excellent corrosion resistance (5). Furthermore, A710 steel has a
reported high resistance to fatigue crack growth (6).
The ASTM A710 Grade A steel can be produced in three classes (shown in Table 1.1). In
each case, precipitation hardening is used to achieve the required strength level. With the
minimum required yield strength beyond 80 ksi (550 M P a ) , only classes 1 and 3 are
relevant in developing the H S L A 80 steel. Although yield strengths of both class 1 and
class 3 are above 80 ksi, it is reported (1) that the Charpy toughness of class 1 plate with
16 and 1 9 m m thickness is well below that of the class 3 and does not meet the required
Page 21
4
Table 1.1 Chemical composition range and processing conditions for A710
Grade A steel (ASTM Designation: A710)(ref.7)
C
<0.07
Cu
1.0-1.3
Mn
0.4-0.7
Cr
0.6-0.9
Si
<0.4
M o
0.15-0.25
P
<0.025
Nb
>0.02
S
<0.025
Ni
0.7-1.0
CEnw
0.4-0.57
Grade and Class Conditions
Grade A , Class 1
Grade A, Class 2
Grade A, Class 3
as-rolled and precipitation heat treated
normalized and precipitation heat treated
quenched and precipitation heat treated
Page 22
5
high and low-temperature toughness goal (48J at -84eC and 81J at -18°C) for 80 ksi steel
for surface ship construction. Therefore, the HSLA 80 steel developed in recent years is
produced mainly through the quenching and aging (Q&A) route, corresponding to the
ASTM A710, class 3 steel.
Research work has demonstrated (3,8) that at least equivalent performance with the HY
80 steel system can be achieved for the Q&A HSLA 80 steel. The low carbon content
(<0.07%) increases the weldability and toughness properties, as shown by many
researchers (8,9). Currently, the quench and aged HSLA 80 steel is finding increasing
applications in the ship building industry (3).
The HSLA 80 steel can also be produced by controlled-rolling (CR) process with a
modified A710 chemical composition. The CR process takes advantage of the
recrystallization kinetics of the steel resulting from both deformation during rolling and
microalloying. By using vanadium or niobium carbonitrides to suppress austenite grain
growth while retarding austenite recrystallization during finishing, a fine ferrite gain size
can be achieved through thermomechanically controlled processing (TMCP). Enhanced
strength and toughness can be obtained as a result of fine grain size. It is claimed (1) that
the controlled-rolled steels usually have better low temperature toughness and weldability
strength than those produced by the quenched and aged processing route. However,
unless specially designed plate mill facilities are used, it is difficult to produce the
controlled-rolled plate with thickness over 13mm whilst retaining the high yield strength.
The thickness limitation is based on plate mill capacity to introduce sufficient strain at low
rolling temperatures.
More recently, following the establishment of strict TMCP practices for thick plate (10,
11), a Cu age-hardened 80 ksi yield strength grade steel has been developed (12) by BHP
Steel, Australia, based on a modified A710 composition and utilizing TMCP technology.
Page 23
6
Although A S T M A710 includes an as-rolled and aged version (class 1), the alloy design
is more suitable for the quench and aging process route (class 3), due to the high quench
hardenability provided by the Ni, Cr and M o additions. As a result, class 1 (control
rolled) A710 steels exhibit mechanical properties inferior to class 3 ( Q & A ) A710 steel as
mentioned previously.
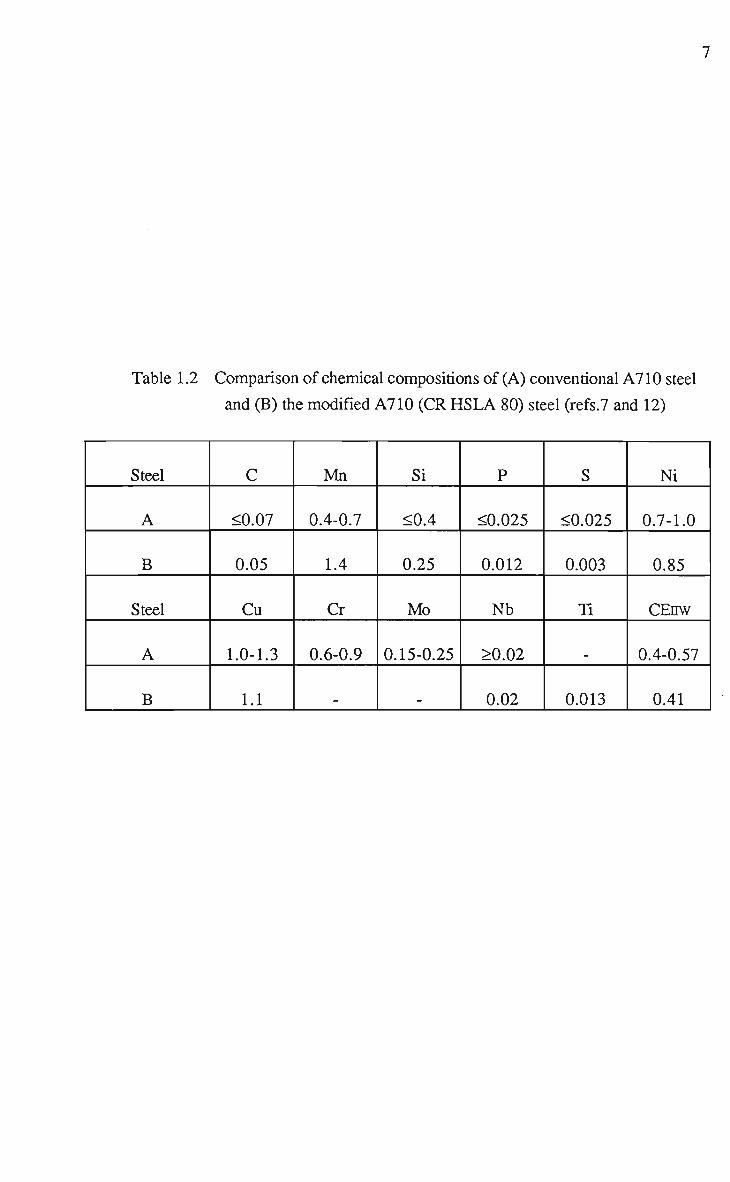
To facilitate the TMCP and aging process route, a modified leaner alloy design was
developed by B H P and used for modification of A710 steel. Chemical compositions of
both conventional and modified A710 are listed in Table. 1.2. The latter steel can be
produced more cheaply because fewer expensive alloying elements are used.
Yield strengths in excess of 80 ksi (550 MPa) can be achieved for the thinner plate
(<25mm) and 73 ksi (500 M P a ) for thicker plate (>25mm). The thinner plate can
therefore be classified as H S L A 80 steel or more appropriately as C R H S L A 80 to
differentiate it from Q & A H S L A 80 steel.
CR HSLA 80 plates of various thicknesses exhibit excellent Charpy toughness (12).
Figure 1.1 shows the Partial Charpy toughness transition curves for 2 0 m m plate. The
circular symbol shows the high-and low-Charpy energy requirement for certification of
H S L A 80 steel for surface ship construction (1). It shows that a Charpy energy
comfortably in excess of the requirement can be achieved for the 2 0 m m plate.
As a newly developed steel, little work has been reported on the weldability of the CR
H S L A 80 steel. Although researchers have demonstrated (13,14,15,16) that excellent
weldability can be achieved for the Q & A A710 steel, investigation of weldability is still
necessary for the C R H S L A 80 steel, due to the difference in chemical composition and
the thermomechanical processing for the two types of steels. Furthermore, weld joint
mechanical properties and microstructures under different welding conditions are also
needed to understand the effect of welding conditions on the quality of the weld joint.
Page 24
7
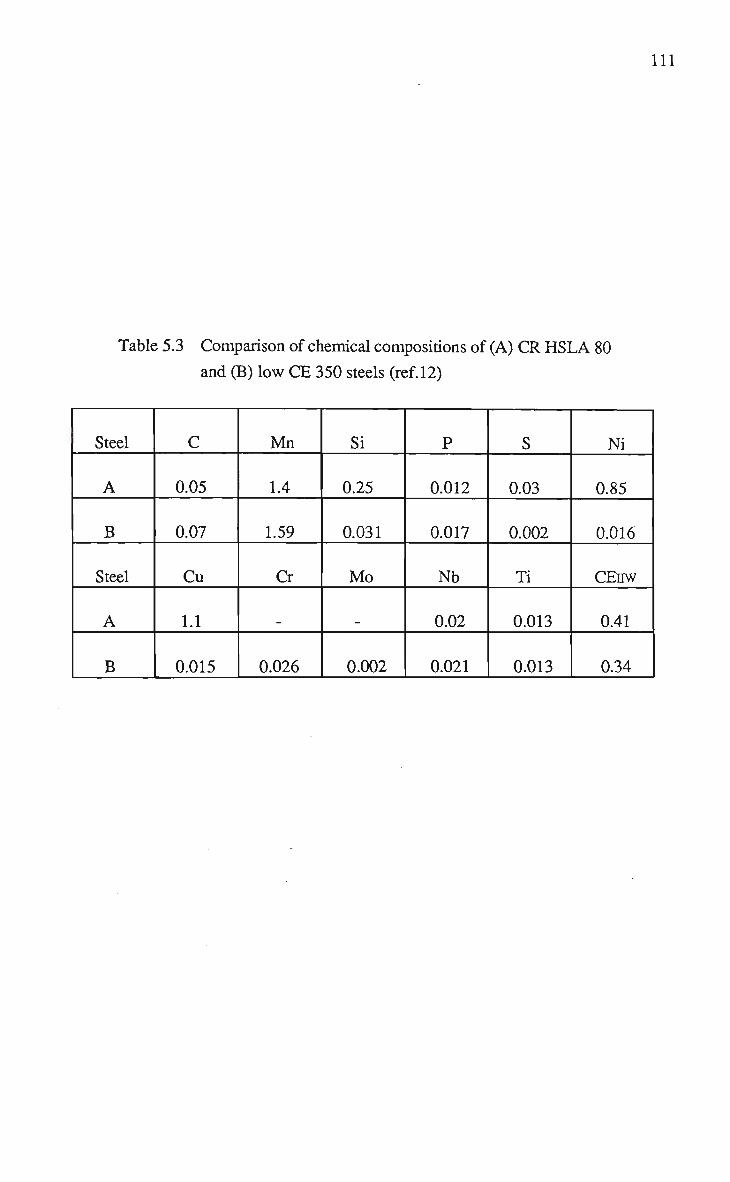
Table 1.2 Comparison of chemical compositions of (A) conventional A710 steel
and (B) the modified A710 (CR HSLA 80) steel (refs.7 and 12)
Steel
A
B
Steel
A
B
C
<0.07
0.05
Cu
1.0-1.3
1.1
Mn
0.4-0.7
1.4
Cr
0.6-0.9
.
Si
<0.4
0.25
M o
0.15-0.25
P
<0.025
0.012
Nb
>0.02
0.02
S
<0.025
0.003
Ti
0.013
Ni
0.7-1.0
0.85
CEnw
0.4-0.57
0.41
Page 25
8
300
OJD la 4> fi
SS
a S >> &. u CQ
200-
100-
-100
Sur.T-L
Sur.L-T
Cen.T-L
Cen.L-T
-40
Temperature (°C)
Fig. 1.1 Charpy V-notch impact toughness versus test temperature for
20mm CR HSLA 80 steel plate (Data from BHP SPPD). The
circular symbols show the high- and low-energy requirements
for certification of HSLA 80 steel for surface ship
construction (ref.l).
Page 26
9
The weldability of steel is a complex property since it covers both the sensitivity to weld
cracking and the toughness required by service conditions and test temperatures.
Easterling (17) defined "good weldability" as a function of several factors, which include:
(1) type of welding process;
(2) environment;
(3) alloy composition; and
(4) joint design and size.
Being decisive to the steel's weldability, unsuitability of any of these factors may cause
cracking problems. In simple terms, weldability is often defined as susceptibility of steel
to various types of cracking problems associated with welds. For a fixed environment
and joint configuration, the weldability of a particular steel (fixed alloy composition) is
only dependent on the type of welding process.
A weld joint consists of weld metal and heat affected zone (HAZ). For the fusion welding
process, the weld bead is the fusion zone where dilution of the deposited metal (wire) by
melted base plate occurs. The H A Z is usually referred to the volume of base metal, which
is structurally affected by the weld thermal cycle. The present investigation mainly
concerns the H A Z of the weld joint.
The important weldability problems associated with the HAZ in arc welding of structural
steels are hydrogen cracking (or cold cracking) and H A Z toughness. Hydrogen cracking
occurs when all the following factors are present:
(1) a sufficient hydrogen concentration;
(2) a susceptible microstructure;
(3) an applied tensile stress.
Page 27
10
For a given level of weld hydrogen and joint restraint, the risk of cracking depends on the
microstructure and hardness of the heat-affected zone, as well as its susceptibility.
Formation of unfavorable brittle constituents such as Widmanstatten ferrite sideplate,
coarse bainite packets and martensite-austenite islands were reported to result in the
embrittlement of H A Z of steel (18,19,20) and to increase the susceptibility of cracking.
It is well known that high hardness in the HAZ is related to the high hardenability and
therefore, increasing harness increases the susceptibility to cracking in the weld H A Z .
Since 1940, 350 H V has been the limiting hardness value in various welding
specifications (21,22,23) to obtain good weldability. Since H A Z hardness is proportional
to the carbon equivalent (CE) of the steel, C E must be limited to keep the H A Z hardness
below the critical level. Although C E formulae for assessing the risk of hydrogen
cracking in the H A Z has been modified over time (24), it is recommended that C E should
be kept as low as possible to achieve good weldability.
Fracture toughness is the mechanical property directly reflecting crack resistance and
H A Z toughness is the most important mechanical property when weldability is
concerned. Because of the critical nature of naval and offshore structures, highlighted by
tragic accidents, a thorough evaluation of the toughness behaviour of weldments is
required.
HAZ microstructure characterization, hardness measurement and toughness assessment
have been carried out in the present work, with the objective of gaining a better
understanding of the welding characteristics and the optimum welding conditions for the
newly developed C R H S L A 80 steel. The welding process and conditions were varied.
Moreover, in order to assess the toughness of the H A Z in detail, it is important to locate
region(s) of the H A Z which show a low toughness level. Weld thermal cycle simulation
was used to simulated weld H A Z structures and to elucidate property differences
Page 28
11
associated with the microstructural gradient across the H A Z .
Page 29
12
CHAPTER 2
THE HEAT AFFECTED ZONE
Page 30
13
2.1 I N T R O D U C T I O N
The HAZ is the volume of base material which has been heated to various peak
temperatures and cooled again rapidly during fusion welding. Figure 2.1 shows a
schematic diagram of the HAZ structure as a function of the temperature reached.
Depending on the peak temperature, the HAZ can be divided into a number of sub-
regions (Fig. 2.1). Each sub-region has its own distinct microstructure, and therefore,
possesses its own mechanical properties. The structure of the HAZ is determined by the
welding conditions, prior thermal and mechanical history and more importantly, the
chemical composition of the material.
With the use of welded steel constructions in a large variety of applications, it became
apparent that some steels used in the past showed extreme susceptibility to various types
of cracking in the HAZ, especially cold cracking. This has been attributed to the
formation of a very susceptible HAZ microstructure (25). Thus, it is important to study
the microstructure of the HAZ in order to investigate the weldability of steels.
In this chapter, the thermal cycle experienced by the HAZ is discussed in Section 2.2.
The solutions of the heat flow equations given by Rosenthal are discussed in this section,
providing the correlation between welding heat input and cooling rate of the HAZ, since
the cooling rate is one of the main factors determining the HAZ microstructure. The
relationship between heat input and HAZ cooling rate also provides the theoretical basis
for predicting HAZ microstructure resulting from a particular welding procedure.
The microstructure of the HAZ is discussed in Section 2.3 in terms of discussing the
types of structure likely to occur in various sub-regions and the effect of multi-run
welding on HAZ microstructure. Since coarse austenite grains significantly enhance the
formation of undesirable microstructural constituents, the emphasis of this section is on
the control and prediction of austenite grain size in the HAZ.
Page 31
solidified weld
solid-liquid transition zone
grain growth zone
rocrystalhzed zone
tempered zone
E
a \ 1600
1400-
1200-
1000-
partially transformed 800-zone
600
unaffected base material
400
200
W l % C
heal affected zone
Fig. 2.1 A schematic diagram of the various sub-regions of the H A Z
approximately corresponding to the alloy Co (0.15wt%C)
indicated on the Fe-Fe3C phase diagram (ref. 17).
Page 32
15
Finally, the literature review on H A Z microstructure simulation techniques and H A Z
continuous cooling phase transformation diagrams is presented in Sections 2.4 and 2.5,
respectively.
2.2 THE THERMAL CYCLE OF BASE METAL
Arc welding is a process in which a very intense, moving heat source is applied to the
workpiece. The weld thermal cycle is applied for very short time and produces high
temperatures. It causes very steep temperature gradients, which affect the solidification
process in the weld metal and phase transformations in the heat-affected zone (HAZ) of
the parent plate.
The weld thermal cycle experienced by a point in the HAZ has been measured (26,27), as
well as being theoretically predicted (28). The prediction of the thermal cycle in the HAZ
is based on the relationship between the cooling rate of the HAZ and the welding heat
input and is derived below following the treatment by Easterling (17).
Rosenthal (29) assumed that the source energy input or heat input (HI)(measured in
kJ/mm or MJ/m) moving at a constant speed S, is given by
HI=T1^ (2.1)
where V is welding voltage, I is welding current and n. is the arc efficiency (n = 0.9-0.99
for submerged arc welding).
When assuming the thermal conductivity (^)(Jm-1S'1K-1) and the specific heat (p) x
density product (c)(pc - the volume thermal capacity, Jm^K-1) are constants, the
Page 33
16
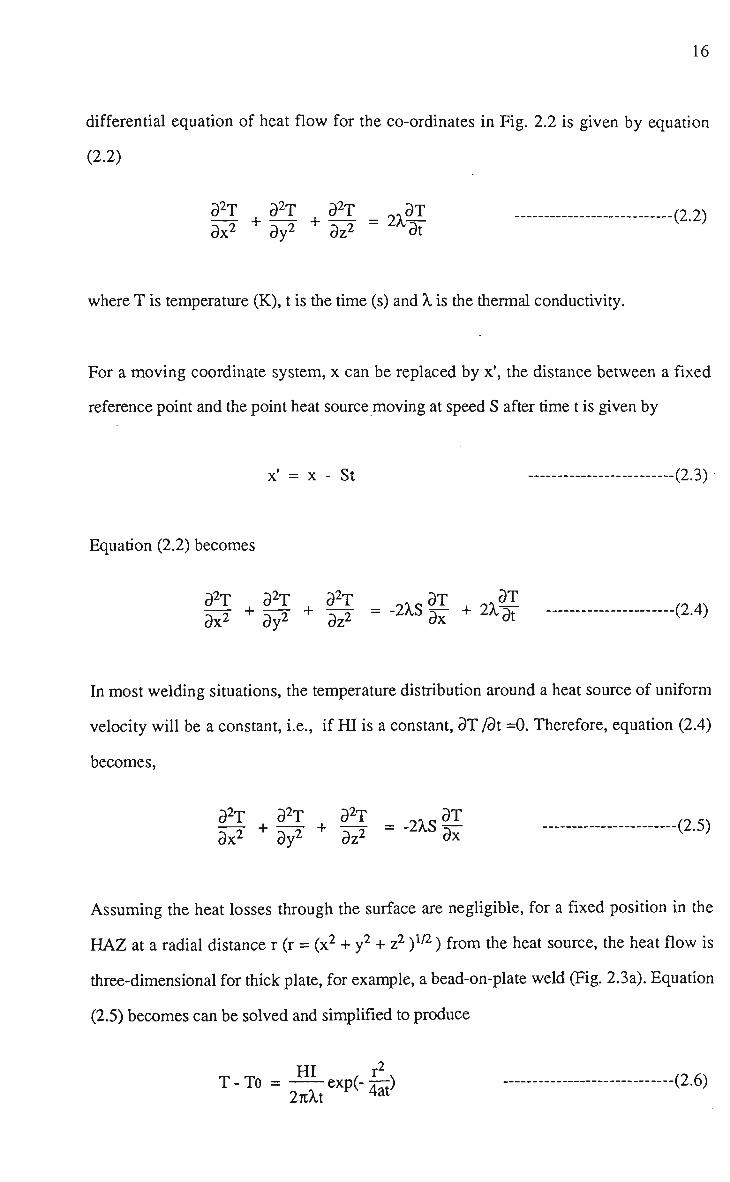
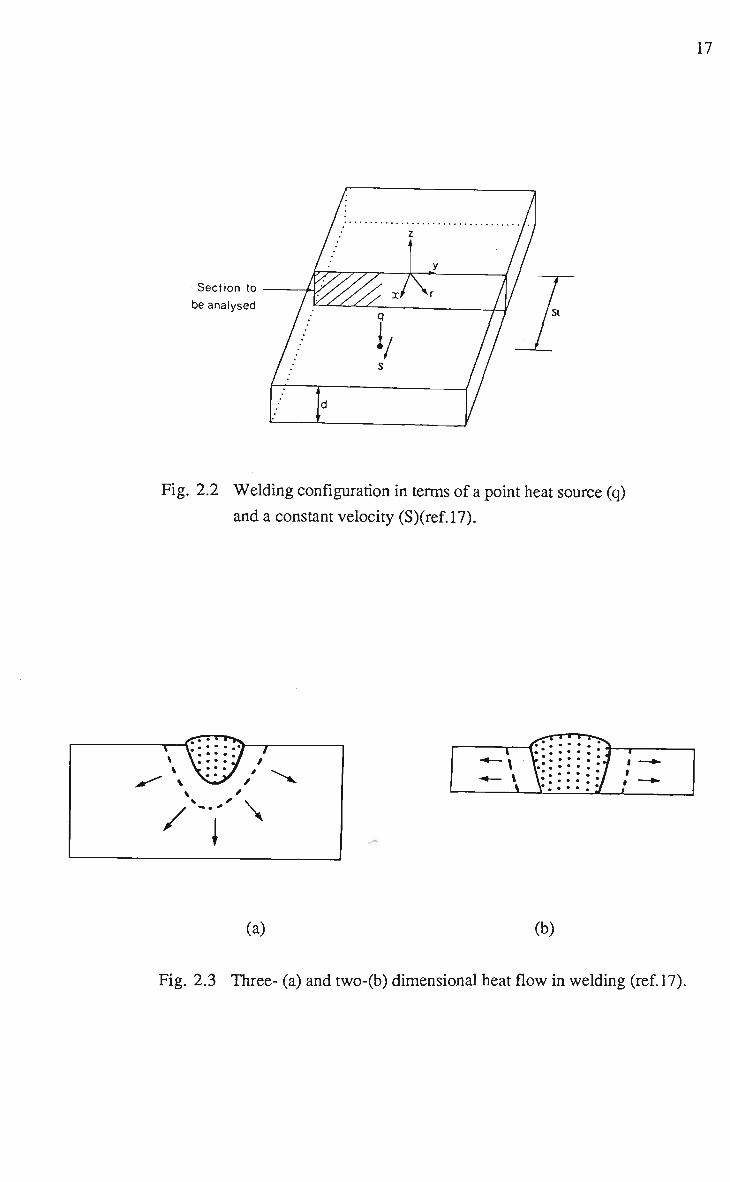
differential equation of heat flow for the co-ordinates in Fig. 2.2 is given by equation
(2.2)
a ^ a^r a^r ar (2.2) ax2 + ay
2 + az2 " 2A,at
where T is temperature (K), t is the time (s) and X, is the thermal conductivity.
For a moving coordinate system, x can be replaced by x', the distance between a fixed
reference point and the point heat source moving at speed S after time t is given by
x- = x . st (2.3)
Equation (2.2) becomes
a2T a2T a2T . 3T + n^L n„
In most welding situations, the temperature distribution around a heat source of uniform
velocity will be a constant, i.e., if HI is a constant, dT /3t =0. Therefore, equation (2.4)
becomes,
a^T ^ r a?T _ aT ax2 + ay
2 + az2 - "2*s ax (2,5)
Assuming the heat losses through the surface are negligible, for a fixed position in the
H A Z at a radial distance r (r = (x2 + y2 + z2 )1/2) from the heat source, the heat flow is
three-dimensional for thick plate, for example, a bead-on-plate weld (Fig. 2.3a). Equation
(2.5) becomes can be solved and simplified to produce
T - T 0 = ^ e X p ( - £ ) (2.6)
Page 34
17
Section to be analysed
Fig. 2.2 Welding configuration in terms of a point heat source (q)
and a constant velocity (S)(ref.l7).
(a) (b)
Fig. 2.3 Three- (a) and two-(b) dimensional heat flow in welding (ref. 17).
Page 35
18
and for thin plates (two-dimensional heat flow, Fig. 2.3b),
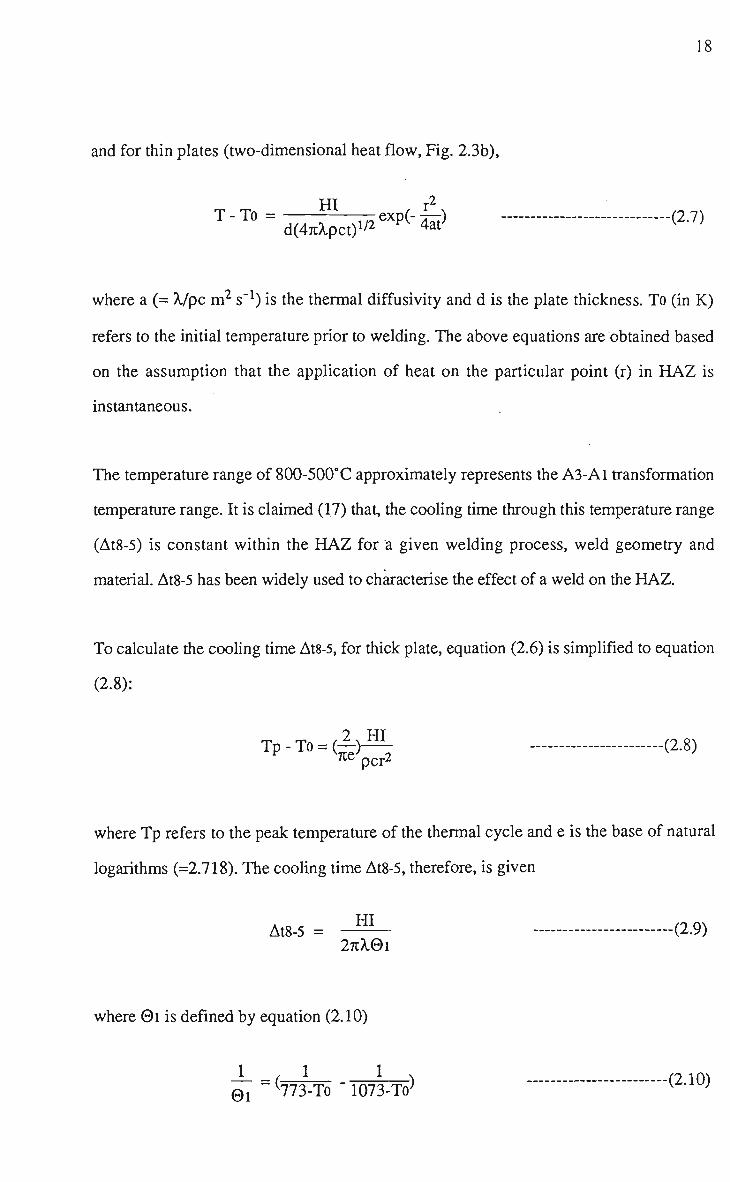
T"To = d^g^ e x p ( " & ~—(2'7)
where a (= V p c m 2 s"1) is the thermal diffusivity and d is the plate thickness. To (in K)
refers to the initial temperature prior to welding. The above equations are obtained based
on the assumption that the application of heat on the particular point (r) in HAZ is
instantaneous.
The temperature range of 800-500° C approximately represents the A3-A1 transformation
temperature range. It is claimed (17) that, the cooling time through this temperature range
(At8-5) is constant within the HAZ for a given welding process, weld geometry and
material. At8-5 has been widely used to characterise the effect of a weld on the HAZ.
To calculate the cooling time At8-5, for thick plate, equation (2.6) is simplified to equation
(2.8):
Tp - To = (-|)^~ -(2.8) >lc per2
where Tp refers to the peak temperature of the thermal cycle and e is the base of natural
logarithms (=2.718). The cooling time At8-5, therefore, is given
At8-5 = - ^ L - (2.9) 27U.X01
where 01 is defined by equation (2.10)
^ = (77Vro ' 1073-W (2-10)
Page 36
19
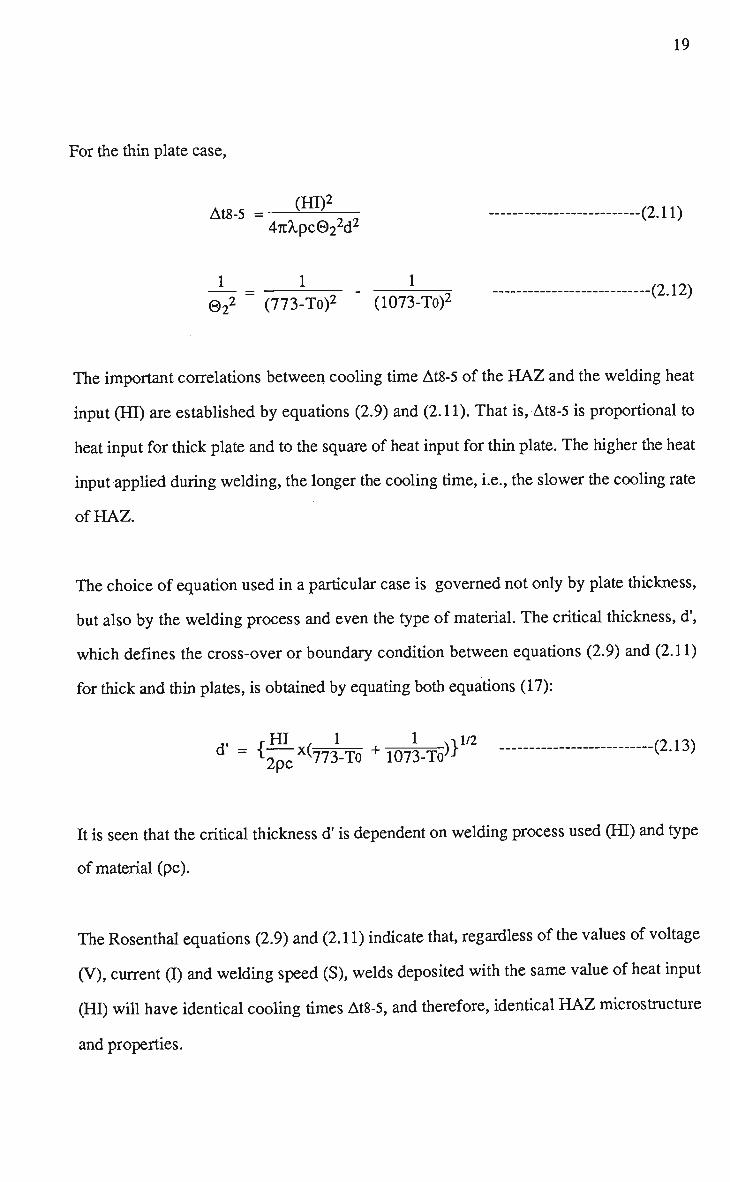
For the thin plate case,
At8-5 = , ,(H!l29 J 2 (2-n) 47iA,pc©2 dz
-(2.12) 0 2
2 (773-To)2 (1073-To)2
The important correlations between cooling time At8-5 of the HAZ and the welding heat
input (HI) are established by equations (2.9) and (2.11). That is, At8-5 is proportional to
heat input for thick plate and to the square of heat input for thin plate. The higher the heat
input applied during welding, the longer the cooling time, i.e., the slower the cooling rate
of HAZ.
The choice of equation used in a particular case is governed not only by plate thickness,
but also by the welding process and even the type of material. The critical thickness, d',
which defines the cross-over or boundary condition between equations (2.9) and (2.11)
for thick and thin plates, is obtained by equating both equations (17):
d' = ^x(773^ + T07Prb")}1/2 (2'13)
It is seen that the critical thickness d' is dependent on welding process used (HI) and type
of material (pc).
The Rosenthal equations (2.9) and (2.11) indicate that, regardless of the values of voltage
(V), current (I) and welding speed (S), welds deposited with the same value of heat input
(HI) will have identical cooling times At8-5, and therefore, identical HAZ microstructure
and properties.
Page 37
20
However, Wingrove (30) demonstrated that the H A Z microstructure and hardness are not
solely dependent on the final value of heat input, but also depend on the individual values
of voltage (V), current (I) and welding speed (S). Since H A Z microstructure is
determined by H A Z cooling rate, this implies that the cooling rate of the H A Z can be
different at constant heat input, depending on the values of V, I and S which produce the
heat input (HI). H e claimed that the Rosenthal analysis, based on 'a moving point heat
source', is an oversimplification of a complex phenomenon, since the 'pinching off and
travel of molten metal droplets from the tip of electrode are affected by arc temperature,
droplet size distribution and rate of transfer of droplets. A similar result was reported by
the CSIRO Division of Manufacturing Technology in Adalaide (192) based on cooling
rate measurements in 4 wire submerged arc (SA) weld HAZs. It was found that the
cooling rate was higher for a higher welding speed at constant heat input.
However, the Rosenthal approach appears to be adequate as a first approximation and if
only one of the parameters: voltage, current and welding speed is varied to increase the
heat input, it is commonly observed that the higher heat input does result in a slower
cooling rate of the H A Z (31).
2.3 HAZ MICROSTRUCTURE
2.3.1 Grain Coarsened Region
The grain coarsened region (GCR or GCHAZ) of the HAZ is the area immediately
adjacent to the fusion line (Fig. 2.1). In this region, the base material experiences a
thermal cycle with peak temperature beyond the austenite grain coarsening temperature, in
the range of 1100-1500°C for most steels. Although the final transformation product of
this region is determined by many factors, it is generally a ferritic structure for lower
Page 38
21
carbon equivalent (CE) steels and lower temperature transformation products, such as
Widmanstatten ferrite sideplates, bainite and martensite for higher C E steels. A typical
microstructure of a G C H A Z is shown in Fig.2.4a.
The GCHAZ is regarded as the most dangerous region of the HAZ, because cold cracks
are most c o m m o n in this area. The cold cracking results from the embrittlement by
structures, such as Widmanstatten ferrite sideplates, upper bainite, martensite-austenite
( M A ) islands and twinned martensite. Increase in the austenite grain size effectively
enhances the formation of these unfavorable microstructural constituents.
2.3.1.1 Precipitate retardation of austenite grain growth
Since fine austenite grain size in the GCHAZ is important to ensure the desired properties
in the H A Z , significant attention has been focused on the refinement of grain size. The
most practical way to achieve this goal is to utilize the pinning effect of particles, like
carbides and nitrides, during austenite grain growth. To produce these particles, small
amounts of strong carbide and nitride forming elements, notably niobium (Nb), titanium
(Ti) and vanadium (V) can be added to steels. These microalloying additions play an
important role in achieving adequate levels of strength and toughness in the steel as well
as in the weld H A Z . However, in practice, the amount of microalloying elements does
not always related to finer grain size. The final effect of microalloying elements on
retardation of austenite grain growth is quiet complicated and depends on particle
solubility, stability and formation temperature, as well as on the composition of the steel.
McCutcheon et al. (32) carried out an investigation on the effect of microalloy additions
on the H A Z notch toughness for a C - M n - M o line pipe steel. They found that a small Ti
addition (0.005 to 0.010 %) significantly restricted austenite grain coarsening in a
Page 39
22
l^r^r *&J:*J&
s 0.M7**-
mm^w^w^^^ m
(c) (d)
Fig. 2.4 Microstructures of various sub-regions of H A Z of a 4 wire Sub.
Arc welded 4 5 m m Australian Standard (AS 1204) 350 grade steel
(lOkJ/mm, 1000mm/min.)(ref.33).(a) grain coarsened region;
(b) grain refined region; (c) partially transformed region;
(d) unchanged base metal. (160x)
Page 40
23
simulated H A Z structure, and, therefore, resulted in a improved H A Z toughness. N b
addition to the Ti steels resulted in further grain refinement in the HAZ.
The beneficial effect of Ti (34,35) on controlling austenite grain size in the weld HAZ and
base steel has led to the development of Ti-modified steels. In manufacturing these steels,
Nb and/or V are usually added to Ti in order to provide the required degree of grain
refinement Thus, Ti-bearing steels may contain a mixture of various carbonitrides, such
as TiN, TiC, VN, A1N, and NbC. During a high heat input weld cycle, only the TiN is
likely to survive the peak temperature of the GCHAZ without complete solution, but the
coarsening of these precipitates is inevitable (17).
Ti-bearing steels usually have nitrogen concentrations above the stoichiometric level for
TiN, to prevent formation of TiC, and are suitably heat treated to yield a high volume
fraction of grain boundary pinning TiN precipitates. However, Edwards et al. (36)
reported that for steels containing a high level of Al, Ti rather than N concentration greater
than the stoichiometric level for TiN give better grain size control near the weld fusion
boundaries. The reason suggested was that small TiN particles dissolve at the high
temperature reached near the weld fusion line. The excess Ti in solution then appears to
minimize austenite grain growth by a mechanism of solute drag.
A suitable size of TiN precipitates is critical in suppressing austenite grain coarsening in
the weld HAZ. It is unlikely that large precipitates can play any useful role in refining the
grain size. A study by Chen et al. (37) of concast Nb-V, Nb-V-Ti, and Nb-Ti steels
indicated that addition of Ti to Nb containing HSLA steels resulted in undesirable
precipitation in these steels, i.e. precipitation of large particles with various
morphologies. These large particles were found to be stable up to 1150°C and some up to
the melting point of the steels.
Page 41
24
A detailed review on fundamental aspects of precipitation in microalloyed steel has been
given by Honey combe (38). H e concluded that nitrides coarsen more slowly than
carbides, so partial substitution of carbon by nitrogen in carbides is beneficial.
Concerning the austenite grain growth through a weld thermal cycle, Ikawa et al. (39)
reported that the m a x i m u m increase in grain size occurs in the initial stages of grain
growth. In fact, it was found that 8 0 % of grain growth occurred during the heating part
of thermal cycle for tungsten inert gas (TIG) and submerged arc (SA) welded
microalloyed high strength steels. Easterling (17) explained that it is due to the higher
driving force available at the initial stage of grain growth.
The rapid grain growth may also related to oc->y transformation by diffusionless
mechanism during heating, i.e., by a martensitic mechanism, as found by Sekino and
Mori (40) and Albutt and Garber (41). The authors of both references proved that OC->Y
transformation by a diffusionless mechanism could happen during heating rates of 200-
300°C/s in the temperature range of 800-1100°C. This transformation produces some
homogeneous plastic deformation in the austenite formed (42), which leads to a rapid
recrystallization of austenite at high temperature. If the martensitic transformation
mechanism operates and austenite recrystallization occurs with an enhanced driving force
then, precipitates may not be effective in inhibiting austenite grain growth and reducing
the grain size. It was suggested by Rasanen and Tenkula (43) that the only way to
eliminate coarse grains would then be by reducing the heating rate in the temperature
range 800-1100"C to such an extent that the phase change of a->y occurs by the normal
diffusional mechanism.
Page 42
25
2.3.1.2 Prediction of prior austenite grain size of H A Z
Since fine grain size is an important factor in avoiding HAZ cold cracking, it would
clearly be useful if the prior austenite grain size in the H A Z produced by any specific heat
input could be predicted. In this way, any potentially dangerous situations could be
identified before fabrication proceeded, A number of papers (17,44) have been published
on developing these models. The calculations of austenite grain growth in the H A Z were
based on elementary kinetic models for grain growth and particle dissolution, integrated
over the weld cycle. Generally, a reasonable correlation can be achieved between
theoretical prediction of grain growth in a weld thermal cycle and that obtained
experimentally using weld simulated specimens.
Although good agreement is expected between predicted grain size and that of weld
simulated samples, in applying the equation to weld HAZs, Albeny et al. (28) found that
the equation predicted a larger grain size than what is actually observed. This result
suggests that an alternative growth-inhibiting mechanism is operating in the actual weld
H A Z . H e concluded that the steep thermal gradients in the actual H A Z produce 'thermal
pinning' which inhibits austenite grain growth. To take this effect into account, he
introduced a thermal pinning factor N in the equation to predict the grain size in the weld
HAZ.
2.3.2 Grain Refined Region
The temperature range of this region (GRHAZ) is about 900-1100*C. Compared to the
grain coarsened region, the lower peak temperature does not allow the austenite grains to
coarsen, and the grain size remains very small. Furthermore, the weld thermal cycle may
not allow enough time for carbides to be dissolved completely. During cooling, the fine
grained austenite and remaining carbides tend to produce a fine grained ferrite plus second
phase structure due to the large austenite grain boundary area and carbides acting
Page 43
26
as nucleation sites (Fig. 2.4b). The second constituents can be pearlite, bainite or
martensite-austenite islands depending on the cooling rate and composition of the steel.
2.3.3 Partially Transformed Region
In the partially transformed region, the temperature range of 750-900°C resulted in partial
austenisation. The pearlite regions of the base plate are austenitized due to their lower
transformation temperature. The austenite regions formed are enriched in carbon and
manganese contents which are higher than the average values of the base material. For
this reason, the transformation product of this austenite during cooling can be pearlite,
upper bainite, autotempered martensite or high-carbon martensite (Fig. 2.4c), depending
on cooling rate.
2.3.4 Tempered Region
This region is also called the spheroidized carbide region. It corresponds approximately to
the temperature range of 650-750°C. In this temperature range, a soft annealed structure
is formed during welding. Little a->y transformation occurs during the rapid heating
cycle, so that the most obvious change concerns degradation of the lamellar pearlite to
spheroidal particles of Fe3C.
2.3.5 Region of Unchanged Base Material
As this region corresponds to temperature below 650°C, no changes of microstructure
can be observed optically in the base material (Fig. 2.4d). However, the welding stresses
together with greater solubility of carbon and nitrogen can lead to dynamic strain aging.
Page 44
27
The substructures, such as fine precipitates and dislocations, are changed as a result of
the aging. This phenomenon can be intensified more by multi-run than by single-run
welding (45).
2.3.6 HAZ Microstructure of Multi-pass Welds
In practical welding processes, particularly for welding of the thick plates, multi-pass
welding is often required to fill up the joint gaps. Since the heat input is limited to avoid
the coarse HAZ structure resulting from high heat input, the volume of deposited filler
metal for each pass, which is proportional to the heat input, is also restricted. For the
multi-pass weld HAZ, a large proportion of the previous pass HAZ is reheated to a
certain extent. Therefore, study of the reheated HAZ microstructure is important in
investigating the whole HAZ weld joint. Figure 2.5 shows a schematic diagram of single
and multi-run welds.
Except for a small part of the HAZ being subjected to the highest peak temperature during
the second weld run, most of the reheated region experiences a relatively low temperature
in the second thermal cycle and is therefore subjected a relatively mild heat treatment. A
major effect of reheating the HAZ is refining the structure (46). Depending on the
distance between the beads, some original single pass weld HAZs may be subject to third
or fourth reheating cycles. The final structure of the reheated HAZ is the result of the
cumulative effect of each thermal cycle. It depends on a sequence of peak temperatures
and cooling rates, and the precipitation behaviour during each weld cycle, as well as on
the composition and initial microstructure of the material.
Since refinement of the HAZ structure leads to improvement of the mechanical properties
of the HAZ, multi-layer welding is regarded as beneficial. However, as discussed in
Page 45
t
(a)
weld metal coarse-grained H A Z structure, grain size, & G um fine-grained HAZ structure, grain size, •< 0 pm intercrifical region
Fig. 2.5 Schematic representation of structure distribution in H A Z of
(a) single pass and (b) multi-pass weld deposits on flat plate
(ref.47).
Page 46
29
Chapter 3, Section 3.4.3, multi-pass welding with low heat input reduces the efficiency
of the welding process. High heat input single pass welding is finding increasing
application in the fabrication industry to increase welding productivity. Compared to
multi-pass welding, single pass welding represents the most severe case with respect to
the grain growth in the HAZ.
Alberry and Jones (47) first developed a computer model for calculating the
microstructure in multi-pass weldments. They showed that with a knowledge of the
phase-transformation behaviour (CCT diagram) and grain-growth kinetics, prediction of
the multi-run weld HAZ structure is possible by utilizing Rosenthal's heat flow equation.
In this work, reasonable agreement was obtained between computer-model predictions
and measured weld HAZ structural distributions in multi-pass 0.5Cr-Mo-V weldments.
With this model, it is possible to predict optimum weld parameters for a wide range of
welding applications.
In 1985, based on the established relationship between dimensions of single manual metal
arc weld bead HAZs and welding process parameters, Clark (48,49,50) was able to
develop a model which allows the welding process parameters to be optimized with
respect to dilution and refinement in the HAZ and weld metal.
2.4 MICROSTRUCTURE SIMULATION
The HAZ consists of a range of metal structures, as discussed in Section 2.3. Each type
of structure is likely to posses different mechanical properties. The non-uniform
microstructure of real weld HAZs causes difficulty in conducting mechanical property test
on the HAZ. In order to obtain information about the microstructural and property
gradient across HAZ, the weld simulation technique was developed by Nippes and
Savage (51) to produce a synthetic HAZ microstructure in a small scale specimens.
Page 47
30
2.4.1 Uses of Weld Thermal Simulators
The fracture toughness of the HAZ affects the overall weldability of a steel and is a key
factor in determining the integrity of welded steel structures. Despite its importance,
difficulties exist in carrying out toughness testing, such as Charpy V-notch
impact and crack opening displacement ( C O D ) testing, on real weld H A Z s . These
difficulties are:
(i) the problem of locating the notch tip in a volume cOTtaining a particular microstructure,
due to the structure gradient in the H A Z ;
(ii) specimens with standard dimensions for both tests are difficult to obtain from an
actual weld, especially for the C O D test
A recent study by Ahmed and Yellup (52) proved that a large scatter exists among the
values of Charpy impact energy and C O D of weld HAZs. The sectioning and polishing of
tested samples revealed that inaccuracy of notch tip location was the main reason for the
scattering of results.
Although the influence of notch position on the critical COD value may be eliminated to a
certain extent if the notch root of the C O D specimen is prepared perpendicular to the
surface (53), extensive toughness assessment of the H A Z has been carried out on the
weld simulated H A Z microstructures (54,55,56).
Thermal simulators have also been used to study mechanical properties of the HAZ such
as hardness (57,58), tensile strength (59,60,61), notch tensile strength (62) and stress
rupture strength (63). Hot cracking problems associated with welding has also been
investigated (64), where that the simulator was limited to hot ductility measurement
Page 48
31
equipment which could load the specimen rapidly to failure at any chosen point in the
thermal cycle.
In addition, the weld simulation technique provides a very useful method for the
continuous cooling transformation study of the H A Z (Section 2.5) and producing
specimens for microstructural study of any required part of the H A Z . The effect of
preheat and postweld heat treatments ( P W H T ) , multi-run welds, etc., can also be easily
incorporated in the programmed thermal cycle.
2.4.2 Weld Simulator
To achieve a very rapid heat rate similar to that experienced by the HAZ during welding,
the specimen is usually heated by its own electrical resistance, or by a high frequency
(HF) induction furnace. In resistance heating, specimens are clamped to a pair of water-
cooled metal grips. The control of thermal cycle is via a thermocouple either spot welded
to the surface or embedded inside the sample. The parameters of heating cycle, such as
heating rate and peak temperature, are controlled by varying the current and voltage. The
cooling rate during the cooling cycle is controlled by voltage and current inputs. In the
case of air cooling, the cooling rate is controlled by adjusting the cooling water flow rate
and the separation of the metal grips (65). To introduce fast cooling rates, helium cooling
(66) and water spray cooling have also been used.
2.4.3 Comparison of Weld and Thermally Simulated HAZ Microstructures
There are two types of weld simulation.
Page 49
32
(1) The weld simulation thermal cycle is programmed at different cooling rates,
corresponding to different heat inputs according to Rosenthal's equation (Section
2.2)(67,68);
(2) the simulated thermal cycle is based on one measured from an actual weld H A Z
(27,69).
In the first situation, thermal cycles with various peak temperatures and cooling times
At8-5 are used to simulate the microstructure corresponding to various positions in the
H A Z and various heat inputs. The simulated microstructure does not directly correspond
to the weld H A Z , although the approximate heat input can be calculated from the cooling
time At8-5 by employing the Rosenthal equations (2.9) or (2.11). However, since At8-5 is
related to heat input, the effect of heat input can be simulated by changing the H A Z
cooling rate (or At8-5). Similarly, various peak temperatures can be applied to simulate the
microstructure developed in different positions in the actual H A Z .
In the second circumstance, the thermal cycle applied on simulated sample is kept as close
as possible with that measured from the actual H A Z . In most cases, the results obtained
from simulated samples and the actual H A Z were directly combined without any
correction, as it was assumed that the microstructures were similar for both cases.
However, this is clearly incorrect as it has been established (70) that even when the
thermal cycles experienced by the actual H A Z and simulated sample are the same,
difference in microstructure between both types of samples occurs.
Numerous attempts have been made to compare simulated and real welds. In general,
there appears to be a fairly satisfactory correlation with respect to both microstructure and
mechanical property measurements (71). These comparisons have been based mainly on
qualitative examination of the microstructural constituents microstructures martensite or
bainite. Little attention has been given to obtaining quantitative information on the
proportions of the constituents and a comparison of the austenite grain sizes.
Page 50
33
Dolby and Widgery (70) first reported that a discrepancy in austenite grain size was found
for similar thermal cycles. Since austenite grain size is an important factor controlling the
final transformation structure, a detailed investigation to determine the reasons for the
discrepancy was carried out. The following possible reasons were examined:
(1) difference in rate of heating to peak temperature between the weld HAZ and the
simulator;
(2) difference in rate of cooling from peak temperature between the weld HAZ and the
simulator;
(3) systematic errors in measurement of peak temperatures;
(4) solution of precipitates, e.g. aluminium nitride, caused by their high local resistance to
the heating currents in the simulated specimen, thus allowing easier grain growth; and
(5) the narrow width of the weld HAZ restricting grain growth.
It was found that compared to the real weld HAZ, the larger austenite grain size of the
thermally simulated specimen is caused by two major factors. They are the existence of a
temperature gradient in the weld HAZ (reason 5) and errors in temperature measurement
(reason 3). Any factor which controls the width of the HAZ, i.e., the temperature
gradient, is very important in terms of the austenite grain size developed in the HAZ.
These factors are heat input (31), welding speed (72) and plate thickness. Low heat input
and high welding speed would be beneficial in keeping the austenite grain size to a
minimum level, since a narrow HAZ results. The errors in temperature measurement
during simulation were found to be a result of finite bead size of the thermocouples used,
resulting in lower peak temperatures being recorded than the actual specimen temperature.
The average error was about 29-31°C. The results suggested that care must be taken in
interpreting the simulation results.
Page 51
34
Due to the lower recorded temperature and larger austenite grain size in the simulated
specimen, it was recommended that the recorded peak temperature of the simulated
thermal cycle should be kept lower than that experienced in the actual H A Z . Good
agreement was found between the microstructures of simulated specimens and the H A Z
after cycling the simulated specimens to a lower peak temperature.
A difference in austenite grain size between the simulated specimen and the weld HAZ
was also reported later by Berkhout (73). H e found that the discrepancy in austenite grain
size increased with decreasing of heat input and suggested that a correction to austenite
grain size is necessary when comparing the austenite grain size in both HAZs, especially
for welding with low heat input. This is consistent with Dolby and Widgery's conclusion
that austenite grain growth is restricted by the temperature gradient in the actual H A Z . A
smaller austenite grain size is expected for lower heat input welding because of the
narrower H A Z .
More recently, a similar phenomenon was observed by Alberry et al. (28) when
comparing the predicted austenite grain size with that measured from the actual H A Z .
Supporting Dolby and Widgery's work, the authors concluded that the thermal gradient in
weld H A Z causes the reduction of austenite grain size in the actual H A Z .
2.5 CONTINUOUS COOLING TRANSFORMATION DIAGRAMS
Systematic and detailed investigation of the y->a phase transformation reaction is
necessary to elucidate the development of microstructure in the weld H A Z . The
continuous cooling transformation (CCT) diagram relates the composition, cooling rate,
and austenite grain size of the material to its y->oc transformation temperature and the
resultant microstructure.
Page 52
35
Conventional C C T diagrams usually involve re-austenitization in the low temperature
region of the austenite phase field (850-900°C), followed by continuous cooling by
quenching, air cooling, or furnace annealing. A much higher austenite temperature,
usually 1200-1400°C, is experienced by the G C H A Z during welding, and thus the
conventional C C T diagrams cannot be applied directly to the H A Z for most welding
situations. In addition, the thermal cycle of welding differs from that used to establish the
conventional C C T diagram. Namely, the G C H A Z is very rapidly heated to a temperature
just short of the solidus temperature, and then the cooling begins immediately.
For this reason, weld CCT diagrams have been developed (74) to predict HAZ
microstructure and hardness.
The earliest publications describing CCT diagrams applicable to the weld HAZ were
reported in the 1950s (75,76), following the first conventional C C T diagram produced by
Christenson et al. (77) in 1945. In addition to many microstructural applications of C C T
data which have allowed a fuller understanding of the y->a transformation in the H A Z
(78), the transformation product hardness values obtained have often proved to be a
valuable source of data for predicting the actual H A Z hardness and as such have been
incorporated into some of the schemes for avoiding H A Z hydrogen cracking (79)(Section
3.2) and predicting H A Z toughness (54).
A wider range of peak temperatures is experienced by the base metal adjacent to a weld,
resulting in a wide range of microstructures in the H A Z (as discussed in Section 2.3).
Thus, in principle, a large number of C C T diagrams is required to describe
transformation behaviour in every region of the H A Z . Usually, the grain coarsened
region ( G C H A Z ) represents the area in the H A Z most likely to have cracks as a result of
an undesirable microstructure, such as twinned martensite and a local brittle zone. Thus
the main effort in the study of weld C C T diagrams is concentrated on this region. A
typical C C T diagram of the grain coarsened region (Tp=1400°C) is shown in Fig.2.6.
Page 53
800-
700-
600-
() e
4) ^ 3 CO k.
o n F a H
600
400
300
200-
100-
0-
_Aa_
Austenite
M<
Martensite
—I 1 1— 1 2 4 10
I , , I , 40 100 200 400 1000 4000
Time s
Fig. 2.6 Example of a weld H A Z C C T diagram for a medium strength C-Mn
steel, (Tp=1300°C)(ref.74).
Page 54
37
2.5.1 Methods for r^etermining C C T Diagrams
The principle of CCT diagram measurement is to heat samples quickly to certain peak
temperatures, then cool them at various cooling rates. The y-»a transformation
temperatures are recorded during cooling. The weld simulator is usually used to produce
appropriate thermal cycles similar to actual welding.
Various methods have been used to obtain HAZ CCT diagrams, but the main methods are
dilatometry (54,80) and thermal analysis (81).
Dilatometry involves a dilatometer which is located on the center of the specimen which
continuously monitors the diametral expansion and contraction throughout a thermal
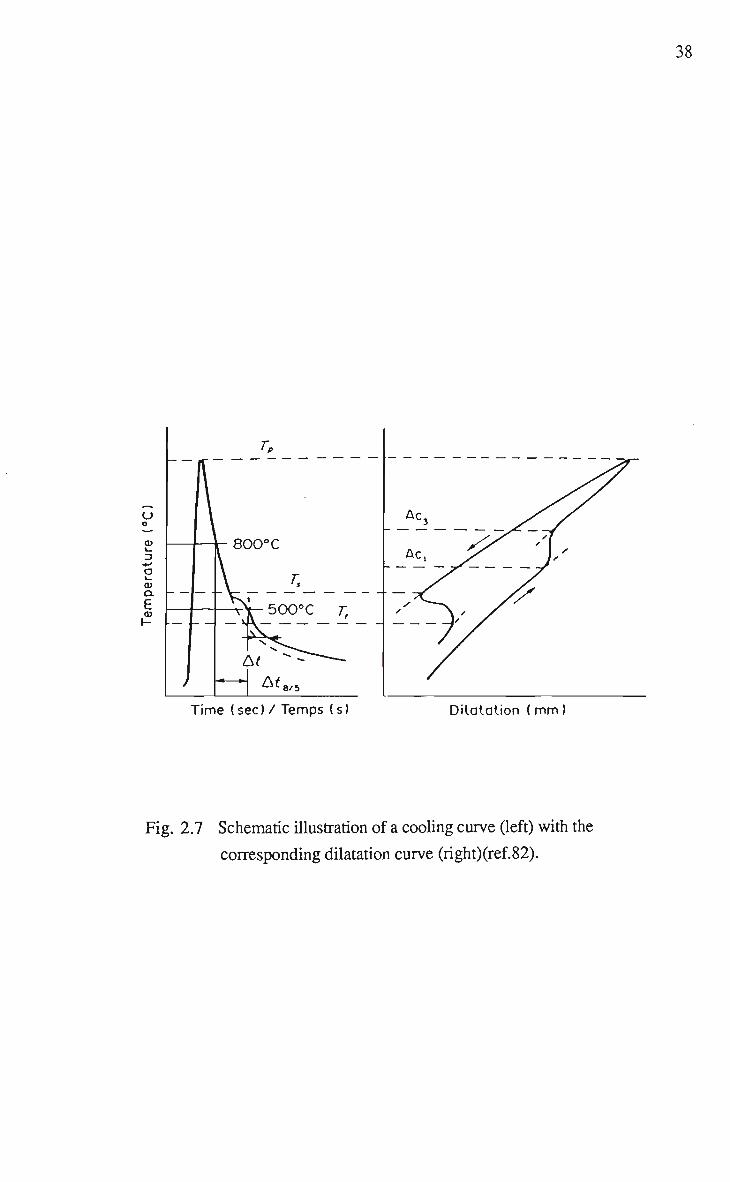
cycle. After plotting the curve of dilation recorded against temperature during cooling,
transformation temperature is detected by the sudden change of dilatation of the specimen,
as shown in Fig. 2.7.
The thermal analysis method has been reviewed extensively by Akselsen and Simonsen
(82). They explained that during phase transformation of f.c.c. to b.c.c, the free energy is
reduced. The enthalpy difference is liberated as heat, AHtrans, resulting in a slower
cooling rate through the transformation range which is used to monitor the onset of
transformation. Akselsen et al. divided this method into three groups according to the
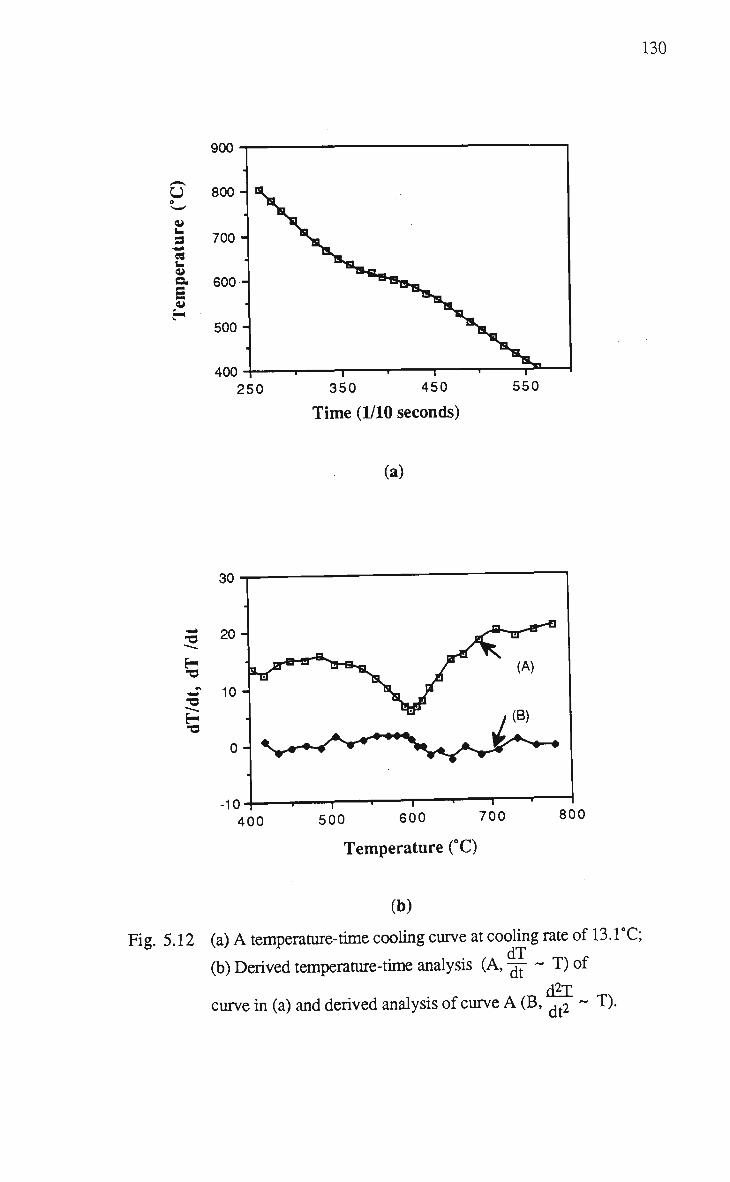
processing of the signal: temperature-time (T -1), derived temperature-time (dT/dt - T or
d2T/dt2 - T), and differential and derived logarithmic derivation methods.
The temperature at which delayed cooling occurs due to the heat liberation of austenite
transformation is considered as the start of transformation (Ts). The end of
transformation (Tf) temperature is the temperature at which the temperature-time curve
approaches its normal curvature, but with a displacement At along the time axis, as shown
Page 55
38
Time (sec)/Temps (s) Dilatation (mm)
Fig. 2.7 Schematic illustration of a cooling curve (left) with the
corresponding dilatation curve (right)(ref.82).
Page 56
39
in Fig. 2.7. A s can be seen, it is difficult to determine the precise location of both the start
and end of transformation by using the temperature-time curve.
The derived temperature-time (65) analysis uses the curve of successive equal intervals
A T of temperature plotted against the temperature (dT/dt - T). In this case, the start
transformation temperature is shown at the temperature of marked deviation from linearity
(Fig. 2.8). This method was considered to be more accurate than the temperature-time
method since a more exact temperature for start of transformation can be defined by this
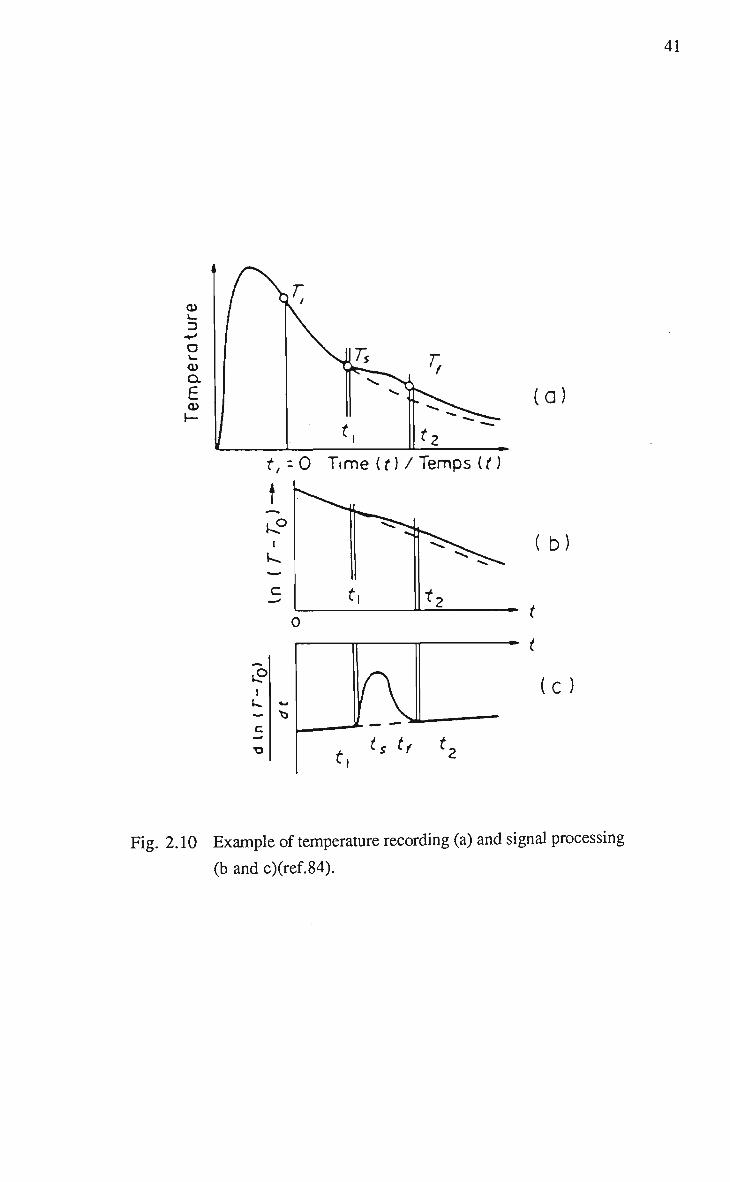
method. T o improve precision, the temperature-time cycle can also be analysed by
plotting d2T/dt2 (Fig. 2.9), In (T-To) and dln(T-To)/dt versus time (Fig. 2.10) or
temperature (T).
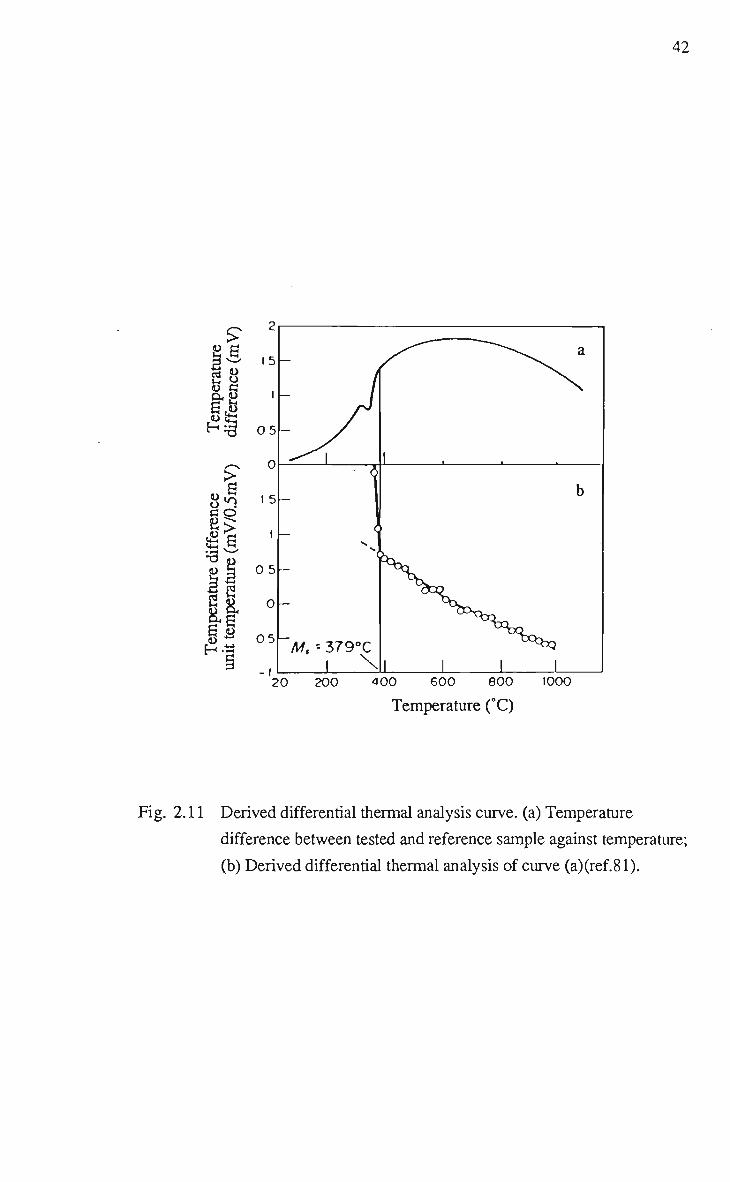
Differential thermal analysis (81) involves a reference sample. It relies on the curve of
temperature difference between tested and reference samples plotted against temperature
(Fig. 2.11a). It is considered to be one of the most sensitive methods for recording the
start of transformation. At the start of transformation, the temperature difference between
tested and reference sample increases significantly. Applying the derived analysis (dT/dt)
on the differential curve can further improve the precision. After derived analysis, the
curve is called the derived differential thermal analysis (Fig. 2.1 lb). The disadvantage of
this method is that a reference sample is required.
Compared to the dilatometric technique, Phillips (81) reported that thermal analysis gave
the most precise transformation temperature for fast cooling. At slow cooling, the
dilatometric technique appeared to be the most precise method. Akselsen and Simonsen
(82) later indicated that both methods give approximately the same temperatures for
cooling time At8-5 in the range from 5-30 seconds. For slower cooling, corresponding to
At8-5 longer than 30 seconds, the dilatometric analysis should be applied.
Page 57
40
1250
Ms •- 350°C
L 2 4 6 8
dT/dt (°C/0.5sec)
_3
.1
0 10 20 30 40
Time (sec)
50
Fig. 2.8 Derived temperature-time analysis of temperature-time curves (ref.81).
Start/ Finish
Time/ Temps
Time/Temps
Fig. 2.9 Thermal analysis of temperature-time cycle. Schematic illustration
of the primary curve and the first and second derivatives. The start
and finish of the transformation are marked (ref.83).
Page 58
41
i
d> l_
O
CD OL
6 cu 1—
/ b?" / Sv'
t
£ U T< ""^•"^TIL
1
•v» ^ ^ ^ ^
*Z
(a)
t,-0 T.me (f)/ Temps Kt)
\
(b)
^>
1
— c
•o
*-. \>
*.
(L — —
ts tf
(c)
<2
Fig. 2.10 Example of temperature recording (a) and signal processing
(b and c)(ref.84).
Page 59
42
>
s o u C O ^ r >
^£
II 20 200 400 600 800 1000
Temperature (°C)
Fig. 2.11 Derived differential thermal analysis curve, (a) Temperature
difference between tested and reference sample against temperature;
(b) Derived differential thermal analysis of curve (a)(ref.81).
Page 60
43
2.5.2 C C T Characteristics and Hydrogen Cracking
In the past, CCT studies have been used to examine how HAZ transformation
characteristics influence hydrogen cracking. In addition, data obtained from C C T
diagrams are often used to help predict safe welding procedures. In most cases, a
maximum H A Z hardness of 350HV is considered as the critical value with respect to cold
cracking.
An early investigation by Cottrell (75) on the relationship between the HAZ CCT
characteristics and H A Z hydrogen cracking indicated that the severity of H A Z hard zone
cracking was linearly related to the 5 0 % y-»a transformation temperature, and was also
loosely related to the martensite finish (Mf) temperature, as shown in Fig. 2.12.
Watkinson and Baker (85) used the data of transformation behaviour to predict welding
conditions which, for a given composition, would result in an unhardened H A Z
(<350HV). In early 1970, further improving the methods for predicting welding
procedures to avoid H A Z cold cracking, Bailey (86,87) established linear relationships
between carbon equivalent (CE) and the reciprocal of square root of critical cooling rate
which gave a peak H A Z hardness of 350HV (Fig. 2.13). Based on this relationship, the
maximum cooling rate for safe welding can be predicted for a given material.
More recently, it has become increasing apparent that safe welding procedure prediction
based on 350 H V critical hardness for all steels is not reliable, because the critical
hardness varies with carbon content (21,88). For low carbon steels, it was found (89)
that the extent of H A Z embritdement was more dependent on total fraction of martensite
than the m a x i m u m hardness. Pavaskar and Kirkaldy (90) developed a method for
assessing cold cracking susceptibility in low alloy steels, based on prediction of both %
martensite and the hardness of the H A Z .
Page 61
44
450
0 20 40 60 0 20 40 60
SEVERITY OF HARD ZONE CRACKING.-/, leg length.
a for completion of transformation; b for 5 0 % transformation
Fig. 2.12 Relationship between transformation temperature during
continuous cooling and extent of cracking in tests weld
(ref.75).
vo
0-4
CARBON EQUIVALENT
0-5 0-6 0-7 Mn-Si Cr-Mo-V Ni»Cu
15
Fig. 2.13 Relationship between critical cooling rate giving 350HV (R350) and
carbon equivalent (CE) for C-Mn steels containing 0.9-1.7 % M n
and 0-0.6%Si (ref.87).
Page 62
45
2.5.3 H A Z Toughness Prediction from the C C T Diagram
The weld thermal simulation technique has been used to assess HAZ toughness in the
past. A number of these studies included the use of C C T data to help in the understanding
of H A Z microstructure and toughness. These studies have provided useful information
concerning a single weld H A Z .
For a quenched and tempered steel, Nippes et al. (76) used the thermal simulation
technique to investigate the H A Z toughness and to obtain a H A Z C C T diagram. A fast
cooling transformation product which is a mixture of low carbon martensite and bainite
was found to have a higher toughness than a completely bainitic microstructure formed at
a slower cooling rate. Therefore, it was concluded that best H A Z toughness was achieved
when welding at low heat inputs without preheating, because of the presence of a high
proportion of tough low carbon martensite.
However, contrary results were found for different steels for the effect of low carbon
martensite on H A Z toughness. Inagaki and Sekiguchi (74) reported that an increase of
toughness with increasing volume fraction of low carbon martensite is only true when the
volume fraction of martensite is below 5 0 % . For some steels (such as a as rolled and
annealed steel), toughness declined significantly with increase of volume fraction of low
carbon martensite in the vicinity of the critical cooling rate at 5 0 % martensite. They were
unable to explain the reason for this phenomenon. It was later suggested by Harrison and
Farrar (91) that this may be the result of different degrees of autotempering of martensite
during the final stage of cooling. Similarly, it was reported by Shorshorov et al. (92) that
an increase in the proportion of martensite to -100%, caused by rapid cooling, resulted in
a sharp reduction in ductility. In addition, it was concluded that for the low carbon C-Mn-
Nb steel investigated, the H A Z would be resistant to brittle fracture and cold cracking if
the cooling times At8-5 were maintained between 5-300 seconds.
Page 63
46
A schematic diagram, shown in Fig. 2.14, was proposed by Sato and Yamato (93) to
explain how low carbon, lower bainite type structures have high toughness, whereas high
carbon upper bainitic structures exhibit low toughness. This conclusion was later
supported by Inagaki and Hiroyuki (94). This research has led to the development of Ti-
B and Ti-O type steels (95) in which ferrite nucleants are used to ensure that harmful
upper bainite structures are replaced by acicular ferrite.
Page 64
t
W E L D H E A T INPUT
2.14 Schematic diagram showing relationship between H A Z
microstructures and toughness: M martensite, B L low bainite,
B U upper bainite, F+P ferrite and pearlite, vTre transition
temperature of absorbed energy (ref.93).
Page 65
48
CHAPTER 3
PROPERTIES OF THE HEAT
AFFECTED ZONE
Page 66
49
3.1 I N T R O D U C T I O N
As pointed out in Chapter 1, the weldability of a steel is defined as the susceptibility of a
steel to cracking problems associated with welds. Cracking behaviour, thus, is the key to
investigate the weldability.
Of several types of cracking, cold cracking (or hydrogen induced cracking) is the most
serious, least understood, and most widely encountered cracking problem associated with
the H A Z . The occurrence of cold cracking is the result of three factors: a sufficient
hydrogen concentration, an applied tensile stress and a susceptible microstructure. For a
given level of hydrogen and a weld joint restriction which determines the stress of a weld,
the risk of cold crack is dependent on the microstructure of H A Z .
HAZ hardness and. fracture toughness are two important mechanical properties of weld
joints. H A Z hardness reflects the type of microstructure and gives a direct indication of
the strength, toughness and hardenability of the H A Z . Fracture toughness is an important
property since it represents the crack resistance of a tested material, and H A Z toughness
testing has been widely used to assure the quality of the H A Z as well as the whole weld
joint
In this Chapter, a brief review of HAZ cold cracking is given in Section 3.2, which
covers the effect of microstructure (Section 3.2.1) and prediction of cold cracking by
carbon equivalent value (Section 3.2.2). In Sections 3.3 and 3.4, the H A Z hardness and
toughness are reviewed, respectively.
Page 67
50
3.2 C O L D C R A C K I N G
Cold cracking (or hydrogen induced cracking) is the most serious of all weld cracking
problems. A n example of cold cracking is shown in Fig. 3.1. Cold cracking can occur in
the weld metal as well as in the H A Z , but, except for very highly restrained welds or
weld-metal strength exceeding 550 Mpa, this problem is encountered mainly in the H A Z
due to the susceptible microstructure (96), as discussed later in detail.
3.2.1 Effect of Microstructure
Figure 3.2 shows that the solubility of hydrogen in ferrite is much less than in austenite.
During the y->a transformation, a decrease in hydrogen solubility occurs which results in
an increase in diffusivity. Hydrogen become more mobile to accommodate the change of
solubility in a and y during transformation. The austenite is gradually enriched in
hydrogen with the transformation. The lower temperature product is transformed in this
region from more hydrogen-enriched austenite. Twinned martensite is considered very
susceptible to cold cracking since it is formed at the lowest transformation, originating
from the most hydrogen-enriched austenite.
Generally, martensite transformation is likely to be associated with a relatively high
hydrogen enrichment at defects such as lath-packet boundaries or twinned plate
boundaries. Overall, the lower temperature transformation products, such as martensite,
bainite or Widmanstatten ferrite side plates, have higher susceptibility to cold cracking.
Any factors that decrease the transformation temperature, like increasing austenite grain
size and increasing carbon equivalent, will increase the susceptibility of the material to the
cold cracking. The grain coarsened region of the H A Z is the region in which the greatest
risk of hydrogen cracking generally exists for both C-Mn and low alloy steels (79), as a
result of coarse grain structure.
Page 68
51
Fig. 3.1 Examples of hydrogen
(ref.97).
cold cracking in the H A Z of weld
Page 69
52
ooo o ooo o
Temperature, C
go o S o o Q oO ID
o X ll
LL
en O O
I n E u c
o
o o
8 12 104/T,(Tin°K)
Fig. 3.2 The solubility of hydrogen in iron (ref.98).
Page 70
53
In general, the harder the microstructure, the greater is the risk of cracking (79,99). This
is consistent with the trend that lower transformation temperature products have higher
susceptibility to cold cracking because of their higher hardness.
The HAZ microstructure produced in any steel is dependent upon the composition,
hardenability of the steel and the cooling rate experienced in the thermal cycle. The
parameters related to H A Z microstructure derived from the above factors may be listed as
follows: carbon equivalent (CE), time between 800-500°C (At8-5) (proportional to heat
input) and H A Z hardness.
3.2.2 Prediction of Cold Cracking by Carbon Equivalent
The CE value of a steel is assessed in terms of how the alloying elements present affect
the transformation characteristics, i.e. the C C T diagram of the steel. Its value provides an
indication of the type of microstructure to be expected in the H A Z as a function of cooling
rate from the peak temperature. More specifically, it gives an indication of transformation
temperature, the possibility of martensite formation in the steel and the hardness and
hardenability of the steel. The established C E formulae are based on hardness and
cracking testing data (21).
For many years, CE formulae have been widely and successfully used for assessing the
risk of cold cracking in the H A Z of steels. The most widely used carbon equivalent
formula was developed by the International Institute of Welding (IIW) (23) and was
incorporated into a British Standard in 1974 (22):
~, ~, Mn , Ni + Cu , Cr + Mo + V n n
Page 71
54
Conflicting factors must be considered for developing a good quality steel with proper
chemical composition, i.e. carbon equivalent. Since high hardness and the presence of
hard structure like martensite are known to increase the risk of cold cracking in HAZ, the
CE level should be kept as lower as possible. However, at the same time, it should be
recognized that the strength of a steel must be maintained at high level to meet the
increasing demand for high strength steel. Increase in strength is likely to be achieved by
increasing alloying element levels which result in an increase in CE.
Despite the contrary factors, the steelmaker has been able to lower the hardenability, and
lower the CE level in pursuit of improved weldability. This situation has been achieved
by improvements in rolling technology (12) and use of microalloy additions to obtain fine
grained steel with an optimum combination of strength and toughness (Section 2.3.1.1).
The purpose of applying the CE equation is to control the chemistry of the steel to help
attain good weldability. Since the hardened microstructure of a weld HAZ is susceptible
to cold cracking, good weldability is ensured by placing a maximum allowable value on
HAZ hardness. HAZ hardness is controlled by keeping the CE below a critical level. A
value of 350HV is generally considered to be the critical value of HAZ hardness. Limiting
values of CE have been proposed to ensure that HAZ hardness is kept below 350HV. A
CE value of 0.4 (100) is considered to correspond to a HAZ hardness of 350HV and is
claimed to be the maximum allowable value for avoiding cold cracking.
The above recommendation may only be considered as a generalization. It is obviously
not true that a CE value of 0.4 is invariably associated with a hardness of 350HV because
HAZ hardness is also largely determined by the cooling rate At8-5. This criticism has been
made out by Brisson et al. (101). In addition, it has been advised (21) that a distinction
between hardenability and cracking is important since the risk of cracking is related not
only to avoiding hardened microstructures (hardenability), but also to the inherent
susceptibility of any given hardened microstructure to cracking under the developed
Page 72
55
contraction stress. Any effect of composition on hardenability may not be the same as on
susceptibility, and the final effect on the risk of cracking will be the balance of the
individual influences on these factors.
Nevertheless, as Winterton (102) pointed out, carbon equivalents can generally be used
for rough comparison of steels limited to the range used in developing the carbon
equivalent in question. To cover wide ranges of steel compositions, CE equations were
developed based on the theory that the susceptibility of HAZ to cold cracking can be
detected by one of the many weldability cracking tests available and that the results of the
cracking test are associated to the carbon equivalent by the link to the HAZ
microstructure.
In recent years, questions have arisen concerning the accuracy of IIW formula. It has
been shown (103) that simple extrapolation of the HW formula derived for high CE steel
to low CE steel is not appropriate. In particular, the effect of the elements Mn and Mo are
likely to be overestimated in these reduced C-steels with regard to their influence on
hardening (17). Furthermore, the cooling rate (or At8-5 ) should be considered for its
effect on HAZ hardness.
By investigating the relative effects of 0.07-0.17C, 1.0-2.0Mn, 0-0.8Ni, 0-0.5Mo and 0-
0.14C in C-Mn steels on the risk of HAZ hydrogen cracking and on HAZ hardenability,
Hart and Harrison (21) developed equations relating composition to critical hardness and
critical cooling time At8-5 for cracking. Critical hardness was found dependent of
composition, being higher with increasing C, Mn, Mo, and decreasing V contents. They
also established the equations for cooling time to achieve different levels of HAZ
hardness in the range 250-450HV as a function of composition. The decrease in critical
hardness with decrease of CE value means that control of HAZ hardness to the
conventional 350HV maximum may not prevent cracking in some low CE (<0.4) steels.
Page 73
55A
In his work on Australian produced low C E steels, Squires (24) also reported that the
critical hardness appears to decrease with decreasing CE.
Recently, Yurioka and Suzuki (233) gave a detailed review of prediction of susceptibility
to cold cracking as a function of H A Z hardness and carbon equivalent. They concluded
that a critical hardness is not an adequate index to assess the susceptibility to cold
cracking, since recent experience in the welding of modern steels has indicated that there
is a trend towards cracking at a lower H A Z hardness level as the carbon content or C E
decreases. However, they also concluded that whatever the trend in critical hardness with
the C E may be, reduction of the C E of a steel definitely leads to an improvement in the
resistance to cold cracking. Various C E formula were discussed. For low carbon, low
alloy H S L A steels, the C E and cracking parameter (Pcm) formulae shown below are
considered to assess the weldability more satisfactorily than the C E formula proposed by
the U W (equation (3.1)).
C E H S L A = C + M n Ni Cr 16 50 + 23 + 7
Mo Nb + 1"
V + 9
-(3.2)
Pcm u + 30 Cu Ni Mn
+ 20 + 20 + 60 Cr
+ 20 Mo
+ IS V
+ TO + 5B —(3.3)
Table 3.1 lists values of CEs calculated by the formulae CEiiw, CEHSLA and Pcm for CR
HSLA 80 steel and the similar strength steel, HY 80.
Table 3.1 Comparison of Pcm and CEs for CR HSLA 80 and HY 80 steels
Equation
CEiiw
CEHSLA
Pcm
CR HSLA 80
0.41
0.12
0.20
HY 80
0.59-0.97
0.22-0.26
0.30-0.41
Page 74
56
3.3 H A Z Hardness
HAZ hardness still gives a useful indication of the composition of a steel, microstructural
constituents and the presence of martensite. H A Z hardness serves as a basis for
characterizing the H A Z strength, toughness and hardenability (104) of a steel.
Despite the difference in critical HAZ hardness for steels with different CE, it has been
shown by numerous researchers (105,106) that H A Z hardness is superior to carbon
equivalent in predicting of cold cracking tendency, especially at low carbon levels. This is
due to the fact that the H A Z hardness is a parameter that takes into consideration of both
composition and cooling rate. Furthermore, it has been shown (99,107,108) that H A Z
hardness correlates reasonably well with implant cracking test results.
An example of a hardness traverse across the HAZ is shown in Fig. 3.3. From the base
metal towards the fusion line, hardness increases to a m a x i m u m at the fusion line,
indicating a harder microstructure and the presence of martensite as a result of a large
austenite grain size in the grain coarsened region ( G C H A Z ) near the fusion line. Lower
heat input, or faster cooling rate of the H A Z , results in a harder H A Z . A relationship
between peak H A Z hardness and cooling time At8-5 is shown in Fig. 3.4.
For most steels, the whole range of the HAZ is harder than the base plate. However,
numerous instances of H A Z softening have been revealed in different steels (96,109).
Softening in the outer regions of the H A Z has been related to the overtempering effect on
carbides and precipitates. In age hardened steeL softening observed for heating above the
Page 75
to >
X VI VI
0> C
-a u a
a
240-
230-
220-
210-
200 -
190 -
180 -
170-
160-
150 -
HAZ I base metal
0 4 8 12
Distance from fusion line (mm)
16
Fig. 3.3 Hardness traverse in the H A Z of a 45mm A S 3678 (formerly AS
1204), 350 Grade structural steel welded by 4 wire Sub. Arc
welding at heat input of lOkJ/mm and welding speed of
lOOOmm/min (ref. 33).
10 40 100 200 400 1000 4000 Cooling time from 800 to 500°C sec
Fig. 3.4 Mean Vickers hardness measurements in the H A Z of a medium
strength 20mm C-Mn steel based on several different welding
processes (ref.74).
Page 76
58
Al temperature involves the loss of precipitation hardening in the H A Z and the
formation of high carbon austenite and ferrite in the intercritical HAZ region (31). A
softened HAZ has occasionally been revealed adjacent to the fusion line in Cr-Mo steels
(102). This result is thought to be a reflection of carbon migration during heat treatment
(annealing or normalizing) or postweld heat treatment (PWHT).
3.3.1 Hardness Measurement
HAZ hardness measurement is usually fairly easy to carry out. However, owing to the
narrow width and various weld bead shapes, special caution must be taken to choose the
test location and hardness load in order to achieve consistent results.
Hardness testing methods for welds were reviewed extensively in a paper published by
Commission LX (Behaviour of metals subjected to welding) of the International Institute
of Welding (IIW) (110). Compared to Brinell and Rockwell testing methods, the Vickers
test was considered to be preferable, since it covers the whole range of hardnesses, from
the lowest to the highest.
The width of the HAZ could be very narrow (ranging from a millimeter to a few
millimeters) depending on the welding process and the heat input. Hardness testing in the
HAZ should be performed using loads which are necessarily low to reduce the size of the
indentation. Concerning the errors of hardness measurement as a function of load for
hardnesses ranging from 250 to 450HV, Brooks and Hart (111) found that the errors
increase with decreasing of loads and hardness measurements are more accurate for lower
hardness material. It was concluded (106) that a loads of 5 and 10 kg are more
appropriate for assessing the hardness in the HAZ in the light of the HAZ dimensions
generally resulting from current welding processes.
Page 77
59
For the various standard specification (112,113,114), H A Z hardness measurement is
usually recommended either along a line parallel to the surface of the plate (tangential
method) or along the contour of the fusion line (contour method)(Fig. 3.5). The
Australian Standard (AS 2205.6.1)(115) adopts the tangential method with the hardness
survey parallel to the specimen surface, at 2mm below the surface. For a sharp-
penetration weld profile, as in Fig. 3.6, it has been found (106,116) that zones marked A
and B show higher hardness values than at the point of maximum penetration. Therefore,
the location of hardness testing according to the Australian Standard is not necessarily at
the position of maximum hardness.
Because determining maximum hardness value in the HAZ is not specified for a large
number of specifications, it is difficult to assess the accuracy of the reported maximum
hardness. It seems arbitrary using only one maximum value as the maximum HAZ
hardness without confirmation by surrounding hardness points. For this reason, some
specifications (114,116) have adopted the arithmetic mean method, specifying the mean
of the 3 hardest values lying within a range of 25 Vickers as the peak value.
Cochrane and Amin (117) investigated the factors contributing to the scatter of HAZ
hardness data on bead on plate (BOP) weld HAZs. A survey of the accuracy and
reproducibility of the BOP hardness testing technique and assessment of the effects of
microstructural variables were conducted. It was established that the scatter arising from
the hardness testing technique and the variation in operator performance were small
compared with the overall scatter of 50HV found in a typical production weld. A large
variation in HAZ hardness along the length of a weld run was observed, typically within
a range of 24HV, supporting earlier results by Brooks and Hart (111). The base plate
characteristics, such as heat treatment, ferrite grain size and segregation (or pearlite
banding) had minor effects on HAZ hardness. The most significant effect on hardness
was found to be the austenite grain size of the HAZ which was largely influenced by the
amount of Al present as A1N.
Page 78
60
HAZ xxxxXxxx>5««rtfxx)c/xxxxx
BM (a)
•^-""x
HAZ
BM (b)
Fig. 3.5 Tangential (a) and Contour (b) H A Z hardness testing methods
(ref. 110). W M : weld metal; B M : base metal; HAZ: heat affected
zone.
A .'/
Transverse section
Fig. 3.6 Cross-section of a weld (ref. 110).
Page 79
61
3.3.2 Prediction of M a x i m u m Hardness
Direct determination of HAZ hardness requires destructive testing. Moreover, the accurate
peak hardness is difficult to achieve due to the reason stated in Section 3.3.1. It would
therefore be very helpful to be able to assess the risk of cold cracking prior to actual
fabrication by the predicted H A Z hardness, based on the carbon equivalent value.
One approach of empirically establishing the maximum hardness formula has been the use
of measured hardness values, cooling time At8-5 and calculated cooling transformation
temperature. Based on this approach, Yurioka et al. (118) developed equations to predict
the hardness and martensite content of H A Z s for most transformable steels with particular
emphasis on those with tensile strength around 500 MPa.
Suzuki (119) established a formula (BL70) for estimating HAZ peak hardness based on a
backward logistic curve relationship between maximum hardness and cooling time At8-5
(Hmax = Hoo + K/(l+ exp(a(Y-Y5))), Y=logAt8-5, shown in Fig. 3.7). Stepwise multiple
regression analyses were performed for the material constants, K, a and Y5, with 11
alloying elements as independent variables, to establish the B L 7 0 formula. H e claimed
that this formula is more reliable than other formulae proposed previous by Yurioka et al.
(120), Lorenz andDuren (121) andTerasaki (122).
Duren (123) later examined the validity of the BL70 formula by using hardness data from
110 different steel grades (119). The B L 7 0 formula was compared with the formula
(HVc) proposed by Lorenz and Duren (121) and an older formula (SM) previously
proposed by Suzuki (124). The result showed that the H V c formula produces the closest
coincidence between measured and calculated hardness values. It was suggested that the
inaccuracy of the B L 7 0 formula is due to variations in measuring accuracy and the
inclusions in steels with highly dissimilar chemical compositions (e.g. structural steels,
pipeline steels).
Page 80
62
HM
1 1
*:|cvj
1
AN\
B
Y5
XL
4
1 8 -
• ^
Y = |ogAt9/5
Fig. 3.7 A backward logistic curve between Hmax and log At8-5 (ref. 119).
Page 81
63
3.4 Toughness of H A Z
Fracture toughness is one of the most important mechanical properties of the HAZ since it
represents the crack resistance of H A Z in industrial applications for a given welding
procedure. It remains the key to the structural integrity of major steel constructions.
Toughness is the capacity of a material to absorb energy by deforming plastically before
fracture. It is determined by the combined strength and ductility of a material and usually
is measured by the amount of work absorbed during the propagation of a crack through a
structural member or a standard specimen. The consideration of toughness during design
of a part will permit selection of materials with low probability of failure by fracture.
3.4.1 Testing Methods
When making HAZ toughness measurements, two experimental approaches are
commonly used. They are the Charpy V notch impact test (125) and the crack opening
displacement (COD) test (126).
As mentioned in Section 2.4, Charpy impact and COD tests on the actual HAZ are
difficult to conduct due to the difficulty of correct placement of the notch tip in a
suspected low toughness region. Thus, much toughness testing of the H A Z is carried out
on the simulated H A Z microstructure (Section 2.4).
Charpy impact energy is thought to rank material toughness in the right order which is
particularly useful in quality control testing. Compared to the C O D test, the impact test
can be easily carried out since the test bar (lOxlOmm-standard size) is cheap to produce,
and the testing procedure and testing machine are relatively simple. These advantages are
Page 82
64
the main reasons for the Charpy impact test being widely used to evaluate the toughness
of the H A Z .
However, this test has its limitation. The most important limitation is that a good impact
value is not always a guarantee against failure by brittle fracture. The impact test bar of
1 0 m m thickness is selected independent of the thickness of the tested material. Therefore,
the result achieved does not reflect the size effect of the material. More importantly, the
strain rate of the impact test (ca. l O M O 6 s"1) is much too high compared to the strain rate
of the construction generated by normal work loading conditions. The difference in strain
rate results in a different toughness value between the test sample and the material in a
structure. Furthermore, the notch of a standard impact bar ( 2 m m depth, angle 45" and a
0.25mm radius at the bottom of the notch) may not be sited in a position where actual
defects, such as crack, slag inclusions and undercutting exist, thus giving an
optimistically high toughness value. O n the other hand, the notch root could co-incide
with these defects, giving a falsely low toughness value.
Charpy impact tests on simulated specimens have been reported (127) to give consistently
higher transition temperatures than tests on actual weld H A Z s . This difference can be
attributed to inaccuracy in simulating the microstructure, such as coarser grains in the
simulated sample due to absence of the thermal gradients that exist in the weld H A Z
(Section 2.4.3). Another possible reason is that unlike the actual weld H A Z , the
simulated Charpy specimen has a uniform microstructure across the ligament below the
notch which is likely to give lower toughness values. Because of these disadvantages of
the Charpy impact test, C O D testing has found increasing application in assessing H A Z
toughness.
The dimensions of the COD specimen are according to the proposals of the Standard
(128). The thickness of the specimen varies, but it is often equal to the original plate
thickness and this is one of the advantages over the impact test. In addition, it has been
Page 83
65
reported (129) that the results of the C O D test are m u c h more sensitive to the
microstructure at the notch tip than the impact test.
One of the disadvantages of COD testing is that the specimen must be pre-cracked at the
notch tip. The process to produce a fatigue crack at the root of a machined notch is
generally time consuming and expensive. It also involves more complicated and
expensive instrument and requires a long time to complete the test. In addition, the COD
test result usually gives an extremely wide scatter, which is difficult to interpret.
For this reason, the Charpy impact test is still widely used in the welding industry, as it
provides a useful quality control test for ranking the toughness of materials.
In a review titled "Incentives for fracture testing", Denys (130) stated that a
straightforward application of above-mentioned testing options in assessing the integrity
of welded joints is difficult, due to:
a. the exact level of toughness required to avoid brittle fracture is not precisely known;
b. the COD specimen geometry does not always model the actual constraint;
c. the relationship between structural performance and COD for thick material sections is
not documented with experimental data;
d. there is concern about the current practice of extending the results of COD
measurement to structural performance;
e. the differing stress-strain characteristics of the weld and base metal are not sufficiently
accounted for.
As a consequence, he urged that new ideas and engineering judgement are urgently
needed to arrive at realistic toughness requirements. Immediate actions are needed to re
establish the credibility of fracture mechanics experts. He suggested that the tension
Page 84
66
fatigue test could be of great values as a supplementary test to routine tests because the
extrapolation to structural performance is quite easy.
3.4.2 Influence of Metallurgical Factors
Microstructure and HAZ toughness relationship's have been briefly discussed in Section
2.5.3 with respect to HAZ toughness prediction from the CCT diagram. A more detailed
review on HAZ toughness in terms of metallurgical aspects is reported herein.
The microstructural constituents which generally cause a toughness deterioration in the
HAZ are as follows:
(1) coarse grains;
(2) upper bainite structure;
(3) martensite-austenite (MA) constituent;
(4) a high proportion of martensite, especially twinned martensite, with a relatively high
hardness;
(5) age hardening occurring in a slow cooling stage or postweld heat treatment (stress
relief heat treatment).
The occurrence and degree of embrittlement due to the above structures are determined by
the steel type and welding procedure. In the following sections, the effect of coarse grains
and MA constituents in the HAZ are reviewed in detail.
3.4.2.1 Coarse grain in the HAZ
Maximum embrittlement of the HAZ normally occurs in the grain coarsened region. The
embrittlement in this region is associated with a coarse microstructure, such as grain
Page 85
67
boundary ferrite and ferrite side plates which are linked to a coarse prior austenite grain
size resulting from a relatively high peak temperature. These constituents have low
cleavage resistance despite the low H A Z hardness (131,132).
To reduce the prior austenite grain growth, precipitates such as TiN can be used as a
means of pinning the grain boundaries. The beneficial effect of TiN on restricting the
austenite grain growth and refinement of microstructure has been demonstrated by many
researchers (27,133,134), despite some lack of understanding of the precise mechanism.
The retardation of austenite growth by precipitate particles is reviewed in Chapter 2,
Section 2.3.1.1.
Reducing the heat input of a welding process will result in a finer grain size as a result of
the fast heating and cooling during the weld thermal cycle, as well as the thermal pinning
effect of a steep gradient of grain size across the H A Z .
3.4.2.2 Martensite-austenite constituent
As well as the grain coarsened region of the HAZ, embrittlement can also occur in other
sub-regions of single and multi-run weld H A Z s . B y using the weld simulation technique,
Tomita et al. (55) examined local brittle zones (LBZ) in single and multiple weld H A Z s
for a series of offshore structural steels. It was found that the L B Z consisted of the
partially transformed region and the intercritically reheated grain coarsened region of the
H A Z . Similar results were observed by Uchino et al. (135).
The low toughness in these regions was attributed to the formation of high carbon
martensite-austenite ( M A ) islands. In both regions, the M A islands were formed from
partially austenized regions as a result of reheating to the intercritical range. These islands
were found to be concentrated in original pearlite colonies (67,135,136) and were formed
Page 86
68
from the austenite enriched in carbon and alloying elements. A s a result, high carbon,
twinned martensite islands were formed from the austenite during cooling. As well as the
partially transformed and intercritically reheated grain coarsened regions, M A islands
have also been found in the grain coarsened H A Z (53). In this case, the M A islands
transform from retained austenite after preferential ferrite formation and they are located in
regions between the ferrite laths and are interlocked by these laths.
The deterioration of toughness due to the presence of MA islands has been observed by
many researchers (137,138). Increasing the volume fraction of M A islands was found to
cause a significant deterioration of toughness (53,67). Toughness of the L B Z has also
been strongly linked with the microhardness of the M A islands with higher hardness
associated with lower toughness (68).
In spite of the numerous observations mentioned above, the mechanism of the
deterioration of the toughness by the presence of the M A constituent has not been
clarified. However, it has been found that preferential fracturing occurs at the M A
constituent which lowers the toughness (139) and that brittle cracks run along the
boundaries of the M A islands and ferrite matrix (140). Since the interfacial energy
between M A islands/matrix ferrite decreases with the segregation of carbon (141),
Nakanishi et al. (53) suggested that the M A constituent fractures preferentially at low
stress and/or strain levels, establishing a Griffith crack (142), which then propagates
along the M A constituent/matrix ferrite interfaces.
It was also suggested and demonstrated that cracking initiates from voids in the interface
of martensite and ferrite (143, 144). The voids are developed by interfacial decohesion at
the ferrite/martensite interfaces.
A rather different mechanism was proposed by Akselsen et al. (67) and Ramberg et al.
(68). Instead of in martensite, they suggested that the initiation of cleavage fracture,
Page 87
69
occurs in the ferrite as a result of an extensive build-up of dislocations at the
ferrite/martensite interface. Stress concentration develops at the interface due to the
significant difference in yield strength between the two phases (231), and is enhanced by
the difference in flow strength between ferrite and martensite (232,145). In addition,
strain partitioning between the MA islands and the ferrite may occur when only the ferrite
can accumulate strain. Consequently, the embrittlement in the intercritical HAZ containing
MA islands is considered to arise from the extensive build-up of dislocations at the
boundaries of MA island and ferrite, and the brittle fracture initiates in the ferrite.
One possible solution to the embrittlement of the LBZ mentioned above is to facilitate the
decomposition of the MA constituent by subsequent welding runs or by postweld heat
treatment (PWHT)(stress relief heat treatment). However, PWHT, can cause temper
brittleness or precipitation brittleness with some steels (69,146). This kind of
embrittlement can occur in copper-bearing steels as discussed in Chapter 4, Sections
4.3.4 and 4.4.4.
3.4.2.3 Influence of microalloying elements
Microalloying elements can affect the HAZ toughness through changing the HAZ
microstructure. The effect of Ti on retardation of austenite grain growth in the HAZ by
forming TiN is reviewed in Section 2.3.1.1. The fine grain size and structure are likely to
improve the toughness of the HAZ. A detailed study by Homma et al. (95) showed that
Ti-containing oxides (Ti203) formed during a submerged arc welding process
considerably enhanced the nucleation of acicular ferrite. Due to its high toughness (147),
the acicular ferrite structure improved the HAZ toughness. Ti203 is found to be more
stable than TiN even at very high peak temperatures near the weld fusion boundary and
provides active nucleation sites for fine intragranular ferrite formation. The authors
showed that the newly developed Ti203 steel exhibited less deterioration in notch
Page 88
70
toughness in the grain coarsened region of the H A Z as compared with a conventional TiN
steel.
The effect of Nb on HAZ toughness is found to be quite contradictory. Hulka and
Heisterkamp (148) showed that N b contents remarkably refine the austenite grain in the
H A Z . It was reported that N b contents up to 0.18% have a small influence on the y->cc
transformation, shifting it to a shorter time and preventing martensite formation, even at
very high cooling rate. Therefore, Hulka and Heisterkamp (148) concluded that the
toughness of the H A Z is enhanced rather than impaired. However, the effect of N b has
also been reported to depress the transformation temperature. Cane and Dolby (149)
using C O D testing demonstrated a detrimental effect of N b on submerged arc weld H A Z s
at heat inputs of 5 and 7kJ/mm. The lower H A Z toughness of the N b steels resulted from
the effect of N b on the y->a transformation temperature at slow cooling rates. By
depressing the transformation temperature, the more brittle upper bainite structure
developed, lowering the resistance to cleavage.
It is reported that in the presence of TiN, the reprecipitating elements do not always mix
homogeneously with the TiN, but instead may sometimes form shells around the original
TiN particles (150). The coarsened particles offer little resistance to grain growth in the
higher temperature ranges, thus resulting in a coarse grain structure.
Wang et al. (25) indicated that the combination of Ti and Nb produced much poorer
toughness properties than Ti alone. This was due to the much higher content of sideplate
ferrite in (Ti,Nb) steel than in Ti steel as a result of N b forming caps on the surface of
TiN particles and reducing its potency for nucleating acicular ferrite.
Like Nb, V was also found to cause the as-weld HAZ notch toughness to decrease as the
heat input increased (151,152). In the study of Hannerz and Holmquist (152) on
Page 89
71
0.15%C, 1.3%Mn steels, notch toughness improved initially as the V content increase.
At higher levels, however, toughness was reduced (Fig.3.8).
In the presence of TiN, Ca has a beneficial effect on HAZ toughness through the
formation of calcium oxysulfide particles to complement the effect of TiN on pinning due
to their higher stability in the high temperature range of the weld thermal cycle (134). Ti-
Ca bearing steels exhibited a higher toughness than Ti-bearing steels at every simulated
peak temperature up to 1450°C in simulated H A Z specimens for a series of high strength
offshore steel plates (134).
Boron (B) can be successfully utilized to improve the toughness of a welded joint in Ti-
containing steels. The absorbed energy was reported (134) to increase with an increase in
boron content, but decreased when the content exceeded 0.0015% (Fig. 3.9). Since small
TiN particles dissolve near the fusion line and free nitrogen is released, the improvement
in toughness due to B was considered to result from reduction of free nitrogen by fixing it
as B N at an early stage of cooling cycle of welding.
3.4.3 Influence of Welding Parameters and High Productivity Welding
The welding parameters such as heat input, welding speed, current and voltage affect the
H A Z microstructure and properties. Although the individual effect of current, voltage and
welding speed is relatively unknown, increase in heat input usually results in a coarse
H A Z structure as a result of slow cooling, consistent with Rosenthal's equation (Section
2.2). The coarse austenite grains enhance the formation of undesirable microstructures,
such as coarse grain size, coarse grain boundary ferrite, upper bainite and martensite-
austenite ( M A ) constituents (Section 3.4.2). B y reducing the heat input, a faster cooling
rate brings about refinement of microstructure, eliminates or reduces the formation of
these unfavorable structures and improves the toughness (153,154). However, the heat
Page 90
co ii
<oo DCcs
><
< s
300 -
250
200
150
100
50
0
-50
Cooling Time From 800
to 500° C, sec. 33 100 300
0.005-0.006% Nitrogen
O •
0.010-0.013% Nitrogen
• •
300 sec. Cooling Time
*-^ Bonomo and Rothwell"
JL 0.10 0.20 0.30
VANADIUM, %
0.40
Fig. 3.8 Influence of vanadium on the simulated H A Z transition temperature
(ref. 152).
Max. heating temoerature ; I350*C Cooling time from 800°C fo 500°C • 60 see
u e
o I 150-
>. w
c
•a
w Si
100-
t 50-
-
' / -/
s«-
i
\
\ \
Ceq :0.29—0.3l(%>
Ti : 001 (%)
N : ~ 20 (ppmJ
_ 1 1
10 15 20 Boron content (pom)
Fig. 3.9 Effect of boron on the toughness in simulated H A Z test (ref. 134).
Page 91
73
input must be kept beyond a critical value to avoid the formation of martensite, especially
twinned martensite, which also causes the degradation of H A Z toughness (155).
Therefore, in general, there is an optimum cooling rate (heat input) which produces the
highest toughness in the H A Z .
In recent years, increasing attention has been focused on increased welding productivity
to achieve overall cost savings in the construction of large engineering structures
(52,156). Improving welding productivity can be achieved through increasing the deposit
rate (kg of filled wire/time) by
(1) increasing the heat input;
(2) increasing the welding speed;
(3) using multiple wires.
Although it is generally believed that increasing the heat input may cause the loss of HAZ
toughness, high heat input welding can be used in fabrication, provided the construction
materials can still satisfy the mechanical property requirements, particularly the H A Z
toughness. Moreover, developing a favorable microstructure and reducing the grain size
by utilizing a microalloying elements have allowed that high heat input welding
procedures to be used safely for some steels without considerable deterioration of weld
mechanical properties.
Cuddly et al. (157) examined the addition of Ti on the HAZ toughness of high heat input
welds for ship steels. Plates were subjected to simulated weld thermal cycles
corresponding to 7.2 and 40kJ/mm heat input for submerged arc and electroslag welding,
respectively. There was an optimum Ti content for both kinds of welds to achieve the best
H A Z toughness. The improvement in toughness caused by small Ti additions (~0.01%)
was due to reduction in hardenability by forming TiN which refines austenite grain size,
promotes intragranular nucleation of ferrite and alters ferrite morphology from
Page 92
74
Widmanstatten to equiaxed, thus improving the morphology and distribution of the
pearlite grains. Higher Ti and N additions degraded toughness by embrittling the matrix.
In the study by Itoh et al. (158), weld simulation of large heat input welding was carried
out on a newly developed Ti-B-lowN HY-50 steel. The cooling time At8-5 was 160s.
This steel showed good HAZ toughness under large heat input welding because complex
precipitates of TiN-MnS-Fe23(CB)6 acted as nuclei for intragranular ferrite formation
producing a drastic change in the microstructure and improving toughness in the coarse
grained HAZ.
A comparison of HAZ toughness of three high heat input welded Nb-Ti based HSLA
steels welded was conducted by Ahmed and Yellup (52). The heat input ranged from 5.3-
13.4 kJ/mm. The increase in heat input produced a decrease in toughness for the two
normalized microalloyed steels. A third high-strength, low-alloy steel which was
controlled rolled and contained Ti showed high HAZ toughness over the whole range of
heat inputs. The good HAZ toughness of this steel was attributed to the effect of Ti on the
retardation of austenite grain growth and the lower carbon equivalent of this steel.
Concerning the effect of the welding speed on the HAZ properties, Eichhorn and Pyrasch
(136) examined the suitability of high speed electrogas welding with higher-alloy metal
powder compositions on normalised and water-quenched and tempered fine grained
structural steels. The Charpy impact energy of all regions of the weld joints met the
requirement value of 27J at -51°C.
'Undercutting' and 'humping' were reported as problems occurring in high speed
welding. Undercutting' is the depression at the edge of a weld and 'humping' is the
formation of a raised section (hump) in the centre of the seam. Both phenomena were
claimed to be more pronounced in high speed welding (159,160,161). However, with
Page 93
75
close control of welding parameters and knowledge of weld bead formation mechanisms,
good quality joints can be achieved (162,163).
The application of multiple wire submerged arc welding to increase productivity in
welding was first reported three decades ago (164,165). During welding, several
electrodes were positioned in series, parallel with the welding direction and were fed
simultaneously to the joint, to produce a multiple pass weld in a single traverse of the
joint (Fig. 3.10).
Ahmed and French (156) have used a double and 4 wire submerged arc welding
arrangement to increase joint completion rates. The effect of welding speed on weld
properties was also examined on the basis of constant heat input. It was shown that high
speed multiple wire submerged arc welding significantly increases deposition rate and
productivity of welding procedure. It was concluded that an optimum welding speed
existed for a particular material to achieve the best weld quality. They suggested that
thorough procedure development is required before use of such multiple wire techniques
in a particular application since non-optimal procedures can cause surface and internal
defects, as well as toughness degradation.
Page 94
76
Fig. 3.10 4 wire Sub. Arc Welding equipment in CSIRO Division of
Manufacturing Technology, Adelaide Laboratory.
\
Page 95
77
CHAPTER 4
COPPER-BEARING STEELS AND
THEIR WELDABILITY
Page 96
78
4.1 I N T R O D U C T I O N
Compared with other copper alloys, iron-base alloys containing copper are of quite
recent in origin. On the basis of the total tonnage of copper produced, the amount of
copper used in ferrous products is still small. Since copper is cheap to produce and
usually only relatively small amount are required to confer desirable properties,
increasing amounts of copper are being used in ferrite alloys as an alloying element.
In the early stages, addition of copper in steel was mainly to increase the corrosion
resistance. As long ago as 1928, driven by the need to develop slower-rusting steels than
mild steel which was then widely used, the British Iron and Steel Institute set up a
corrosion committee, to carry out completely unbiased corrosion tests on steel, cast irons
and wrought irons (166). They discovered that copper-bearing steel, in the same
application as mild steel, showed much slower-rusting properties. But it was not until
some thirty years ago, that users of steel were benefiting from the evidence provided by
this research.
More recent investigations have shown that Cu, in addition to providing improved
corrosion resistance, can make a significant contribution to the mechanical properties of
steel. The use of Cu as an alloying element has the following advantages; increasing the
strength by Cu precipitation hardening (1,12); retaining good formability (4) and
toughness; high corrosion resistance (5); high fatigue cracking resistance (6) and
resistance to hydrogen induced cracking (167, 168).
When Cu is combined with other microalloying elements such as B or Mo, a tough
acicular or bainitic structure can be produced (169). Copper also increases resistance to
softening on tempering (170). Its effect, which is due both to solid-solution
strengthening and to the effect of precipitated particles, is more complex than that of
other common alloying elements.
Page 97
79
Lower carbon content and carbon equivalent level are possible for C u bearing steels
since strengthening can be achieved by C u precipitation hardening, rather than by
increasing the hardenability through a high carbon content and a high carbon equivalent
level. The lower carbon equivalent thus results in good weldability (171)(Section 3.2.2)
and H A Z toughness.
Despite the abovementioned advantages of Cu in steel, it has been traditionally believed
that addition of C u to steel may cause problems in conventional steels. These problems
include (5):
(1) difficulty of descaling, contributing to bad surface quality of the products, especially
for steels with high sulphur content; this problem is usually attributed to a build-up of
copper by preferential oxidation of iron, leaving a copper and sulphur-rich surface layer
with a lower melting point;
(2) hot shortness caused by relatively low melting point of the e-Cu phase (~1090 °C);
the hot shortness is characterized by small cracks on the surface or edges during hot-
rolling or continuous casting;
(3) deterioration of some specific mechanical properties, for example, embrittlement
during stress relief.
These problems have prevented the widespread acceptance and use of copper as a major
alloying element.
However, the severity of these problems is dependent on the amount of Cu and other
alloying elements in the steel. With a careful control of C u content and use of m o d e m
steel process technology, these problems are not insurmountable and the otherwise
beneficial effects of copper may be more fully utilized.
Page 98
80
By the addition of Ni, which increases the solubility of copper in austenite, during the
production of Cu-containing steel products (172); and by control of the process
parameters, including heating rate, soaking time and temperature, and furnace
atmosphere (173), the hot shortness can be overcome.
The avoidance of hot shortness and improved steelmaking practice have led to the
introduction in recent years of several commercial copper bearing steels, especially high
strength low alloying (HSLA) steels, designed to exploit the strengthening effect of
copper.
In this Chapter, a literature survey on the development of Cu-bearing HSLA steels is
presented in Section 4.2. The weldability of Cu-bearing steels is reviewed in Section
4.3, which covers the effect of Cu on the susceptibility of weld to hot cracking (Section
4.3.1) and cold cracking (Section 4.3.2); the effect of Cu on H A Z toughness (Section
4.3.3) and the embrittlement after postweld heat treatment ( P W H T ) due to the Cu
precipitation hardening (Section 4.3.4). The recent development of steels based on the
composition A S T M A710 steel and the weldability of these steels are discussed in
Section 4.4.
4.2 Development of Copper-Bearing HSLA Steels
Cu-bearing HSLA steels, with the addition of nickel (Ni) or chromium (Cr), have
assumed considerable importance in recent years. Their corrosion resistance is
considerably better than of unalloyed copper-bearing steels and they have the added
advantage of possessing a higher strength.
The corrosion resistance of Cu-bearing HSLA steels (Cor-Ten Type) is compared in Fig.
4.1 with that of mild steel and normal copper-bearing steel. The better corrosion
Page 99
81
Fig. 4.1 Comparative corrosion curves for three grades of steel in an
industrial atmosphere (ref. 166).
Page 100
82
resistance of these steels is dependent on a protective rust film on the surface, enhanced
by an additional sealing effect on the pores of the rust by Cr and Ni (166).
Some mechanical properties of the steels in Fig. 4.1 are given in Table 4.1 which
indicates that the copper-bearing H S L A 80 steel showed an improvement in yield
strength of 50 per cent due to the precipitation hardening of Cu. This enables a
considerable reduction in section thickness of the structural members, reducing the
overall cost of a structure. With the addition of Ni and Cr to avoid the hot shortness, Cu-
bearing H S L A steels have been routinely produced commercially without hot-shortness
problems being significant.
Krishnadev and LeMay (174) reported that alloys with 2wt% Cu can be heat treated to
yield strength levels beyond 860MPa (-125 ksi) while retaining reasonable ductility. The
high strength is attributed to the martensitic matrix structure from a quenching heat
treatment before aging. Based on this result, extra-low-carbon H S L A steels with yield
strengths in the range 830-1030MPa have been developed by combining precipitation
strengthening due to copper and niobium (Nb) and transformation substructure
strengthening due to manganese (Mn) and molybdenum (Mo)(175).
In 1981, a new pipeline steel was developed utilizing the precipitation hardening of Cu
by Nippon Kokan Steel of Japan (176). Being a low C and high C u steel with Ni and
N b added, this steel has a yield strength of 456-49IMPa and Charpy absorbed energy of
more than 100J at -60°C after normalizing and tempering. The toughness of seam welds
and the field weldability are also good.
A research project was undertaken in Laval University (Canada) to develop copper
containing steels for structural applications in energy and resource, transportation and
conversion systems (177). The experimental steels are based on higher copper and lower
Page 101
Table 4.1 Mechanical properties of steels in Fig. 4.1 (ref. 166)
Mild Structure
Steel
Copper-bearing
Steel
Cor-Ten Type
Approximate Chemical
Composition
C
0.3
0.3
0.1
Mn
0.5
0.5
0.3
Cu
-
0.3
0.3
Si
-
-
0.5
Cr
-
-
1.0
Mechanical Properties j
E (GPa)
20.7
20.7
20.7
YS (MPa)
231
231
338.8
TS (MPa)
462
462
539
El.min
(%)
20
20
20
Page 102
84
carbon levels than normal weathering steels and contain niobium and titanium. It was
concluded that there is considerable scope for the development of a new class of higher
copper content weathering steels for low temperature applications. By control of
processing variables, including thermomechanical processing and aging heat treatment, a
wide ranging combination of properties (536-1016 M P a yield strength and -15 to -130°C
transition temperature) can be achieved in these alloys.
A new family of Cu-containing HSLA steels, namely Cu-B steels for pressure vessel
applications and Cu-Si-Ti-Nb-B steels for hydrogen resistance application have been
developed (178). The high yield strength, low transition temperatures, good formability
characteristics, intrinsic weldability, corrosion and fatigue resistance were achieved on
the basis of the use of copper as a major strengthening element, its synergistic influence
with boron on y-»a transformation and the ability of Ti to impart hydrogen cracking
resistance.
Another family of steels based on the ASTM specification A710 (7) is finding increasing
applications, and will be reviewed separately in Section 4.4.
4.3 Weldability of Copper-Bearing Steels
In the early days, there seems to be agreement among various researchers that copper is
permissible in steel in amounts up to 0.8 to 1.0% without introducing difficulties in
welding (179). There was a little more uncertainty about the welding of steels containing
more than 1.0% copper, in spite of numerous reports indicating good weldability of
steels containing up to 2 % copper (180).
Page 103
85
4.3.1 Hot Cracking
Hot cracking of welds has long been regarded as a major problem in copper-bearing
steels. Such a cracking phenomenon is induced by the low melting point of copper, and
hot shortness can occur in the weld metal as well as in the H A Z . This once-prevalent
belief has led many people to believe that copper steels connot be welded satisfactorily.
Quite conflicting results have been obtained for studies of hot cracking phenomenon in
welds of Cu steels. Ni was reported (181) to reduce the hot cracking in weld with the
steels containing l%Ni-2% Cu showing the best result.
Miyoshi et al. (182) studied hot cracking of linepipe steels using the Varestraint Test. No
hot cracks were observed for up to l%Cu in a 0.11%C, l.l%Mn steel, but in a
0.16%C, 1.45%Mn steel, hot cracks were observed for Cu contents greater than-0.5%
with 4 % or more bending strain.
Ostrovskaya (171) developed equations for determining the comparative and total effects
of certain elements on resistance to hot cracking of weld metal deposits for mild and low
alloying construction steels. Copper is among the group of alloying elements which was
considered to have a bad effect on the resistance to hot cracking.
For a steel with a base composition of 0.18%C, 0.9%Mn, 0.7%Cr, 0.2%Mo, 0.07%Zr,
Matsuda (183) studied the effects of other elements on hot cracking. The worst element
was Cu among those examined (Fig. 4.2). Intense hot cracks were observed with a
copper content more than 0.3%. The hot cracking was caused by a liquid film,
containing segregated Cu along the solidification fronts and cell boundaries.
Watanabe and Matsuzaka (184) showed that, even in small quantities, Cu increased the
tendency to hot cracking for a 0.25%C, 0.35%Si and 0.9%Mn steel.
Page 104
86
E E
o < CE O r-O X
u. o X r-
o z
14
12
10
8
6
4
2
0
1
Cu !
-J" - 1 "
"1
"J J / J
1
IZr
lSi /
! Ti
i i i i i Jr\ Ni /
Al .•^
1 1 1 1 1 1 1 0
0
* *
>/^ BASE STEEL COMPOSITION \
0.18 % C , 0.9 % Mn , 0.7 % Cr ,
r THICKNESS : / TOTAL CRACK
Cr /
•v 1 \* 1 1 1 II
0.2 % Mo , 0.7 V. Zr
13 mm LENGTH • I Ci
jf (^^" CRATER
HOT CRACKS (Cil
1 1 1 1 1 1 1
3 4 5 6 7 8 10 14 18 22 26
ADDED ELEMENT . WT. %
Fig. 4.2 The effect of added elements on the hot cracking of a steel as
measured by the Varestraint test (ref. 182).
Page 105
87
More recently, investigations of hot cracking susceptibility using Varestraint testing of
control rolled and aged Cu-bearing A710 modified steel (12) and quenched and tempered
(class 3) A 7 1 0 steel (1) indicated that these low carbon, Cu-Ni-Mn steels are less
susceptible to hot cracking than commonly used steels (also see Section 4.4.4).
It was suggested (5) that steel plates containing copper must be descaled before welding
because Cu in the scale layer sometimes causes severe hot cracking.
In general, although Cu enhances the tendency towards hot cracking, with the addition
of Ni, hot cracking can be avoided in Cu-containing steels and eliminated by descaling
the steel plate and careful control of C u content below the critical value determined for
that composition.
4.3.2 Cold Cracking
A small effect of Cu on the tendency towards cold cracking would be expected since
copper has a minor effect on the hardenability of a steel (5). The relatively low
propensity toward hardening of the H A Z indicates that copper-bearing steels may be
welded without special precautions, such as preheating or the use of specially designed
electrodes to give low hydrogen.
In Chapter 3, Section 3.2.2, the carbon equivalent (CE) equations aimed to predict the
risk of cold cracking are discussed. Compared to other alloying elements, the low
coefficient for C u in carbon equivalent equations (equation (3.1)) reflects the low
hardenability effect of Cu in steel (23).
Miyoshi et al. (182) summarised the published data dealing with the effect of Cu on cold
cracking (Table 4.2). In most cases, copper had a smaller effect than nickel. Although
Page 106
88
CO
V
V o v: 3 W)
c
o
u c o
o u
o
CN
M CO
P
> u & '... c N < X o
a F
c o
• ^
E L.
£ c
so c
•a c J2 l> J=
F o
u
O £ (0 C/3
ra u
E
U a .e <u -CJ * • *
E o
•a
c o a*
> a o
60
c '3
> o o t-
00
) >-. E o
v. u.
S a -2 c.
2 Hi oil »i p c
S C «-> ? w n -a ™ c IS c o o fc p
- E!-E - u. s. c
c o
I* E c o n
o U
U
o U
a a o
o o o Z Z 3
u CJ (J (J
c£ r*«-. m o
*° J. c o
U U
£*
3- o m —
o o
u a 7 i 3
U U
K5 ,- *"l ^ <"i o o o £ c o 3
u u
c^ r. ™ £,§ <N
9 c
o o 3
U O
c? «—1
o ~ o a <C 1
T o o o 3
u u
o
e; -s •*. O "">
SS A o CI 3 V/ — O 3 — u
o o
UJ
•go S -a
•a
«
c o
c
c 19
3 E 3 ra
oc t-
o li
r BO
3
E u O
u.
Page 107
89
some coefficients were obtained by maximum hardnesses which are not directly related
to cold cracking, the effect of Cu on HAZ hardenability can be easily obtained from this
table. The difference in coefficients for HAZs produced by different heat inputs by
Masumoto et al. (185) in Table 4.2 indicates that the lower cooling rate for high heat
inputs allows Cu to precipitate more easily, thus increasing the hardness and the risk of
cold cracking.
4.3.3 HAZ Toughness
The low hardenability contribution of Cu means that little detrimental effect of Cu on
HAZ toughness would be expected. In fact, Cu as an added element, can improve the
toughness at the fusion line and HAZ. The improvement of HAZ toughness by the
addition of Cu is due to the refinement of the microstructure caused by a change from
upper to lower bainite (186).
The effect of various elements on toughness near the fusion line was studied by Tanaka
et al. (187) for manual arc welding (4.5kJ/mm heat input) and electro-gas welding
(20kJ/mm heat input). As shown in Fig.4.3, Cu improved the toughness in the case of
the 4.5 kJ/mm heat input, and had no effect in the case of the 20 kJ/mm heat input.
Based on the Charpy V-notch transition temperature (TT) data from thermal simulated
HAZs in low alloy steels containing Cu in a range of 0-1.6%, Masumoto et al. (185)
reported that the following formulae applied to submerged arc welds of the 25 mm thick
plate, with heat inputs of 4 and lOkJ/mm, respectively.
Page 108
LU tt
r-
< rr LU
a. LU r-2 o
< cr
LU
z < X o
0 0.5 1.0 1.5 2.0
ALLOYING ELEMENT . %
Fig. 4.3 The effect of alloying elements on the shift of the Charpy impact
transition temperature at the fusion line after two different welding
procedures (ref. 185).
Page 109
91
T T (4 kJ/mm) = Const. - 48x(%Cu) + 14x(%Cu)2 (4.1)
TT (lOkJ/mm) = Const. - 5x(%Cu) - 20x(%Cu)2 (4.2)
The combination of Ni with Cu has been reported (187) to improve HAZ toughness in
Cu-bearing steels.
The Cu-bearing HSLA steels recently developed around the world, which obtain high
strength from C u precipitation hardening, have also shown good H A Z toughness and
weldability. A newly developed 1,2%Cu-bearing fitting pipe steel, containing Ni and
Nb, exhibited a Charpy impact energy and critical C O D value comparable to those of the
baseplate (176).
Tomita et al. (188) demonstrated that HAZ toughness is insensitive to Cu content,
consistent with little change in microstructure of the H A Z as the copper content increased
from 0 to 1.4%.
High HAZ toughness values were also reported for ASTM A710 steels which are
reviewed separately in Section 4.4.4.
4.3.4 Stress Relief Embrittlement
Stress relief embrittlement occurs in the HAZ during stress relief heat treatment (or
postweld heat treatment (PWHT)) of welds, in the temperature range of 450° to 650°C.
It can occur in precipitation hardened steels and is usually attributed to the precipitation
of fine particles within the ferrite and the formation of a precipitate denuded zone along
the grain boundary (189). Creep strains developed during P W H T or high temperature
exposure are concentrated in the weakened grain boundary region and this, coupled with
Page 110
92
grain boundary sliding, produces intergranular cracks. Elements contributing to such
embrittlement have been reported to be chromium, copper, sulphur, phosphorus,
arsenic, antimony and tin (189).
Figure 4.4 shows the effect of Cu and Mo on the cracking sensitivity for low alloy
steels, according to Ito and Nakanishi (190). The increase in cracking susceptibility with
increase in alloying elements was attributed to secondary hardening caused by
precipitates.
Stress relief cracking in A710 steels has been observed by some researchers (189,191)
and is discussed further in Section 4.4.4.
4.4 A710 Steels and Their Weldability
A710 steels are low-carbon, Cu-Ni-Cr-Mo-Cb, copper precipitation hardened steels
which have been identified by a number of designations over the years. According to the
ASTM Standard Specification for A710 steel (7), there are two different grades. Grade A
provides minimum yield strength levels ranging from 55 to 85 ksi (380 to 585 MPa) and
Grade B has the minimum strength range of 75-85 ksi (515 to 585 MPa). Most
development has occurred for Grade A steels. The composition and three classes of
A710 Grade A steel are given in Table 1.1. All three classes involve an aging heat
treatment to achieve high strength by Cu precipitation hardening.
The A710 steels were known as IN-787 steels during their early development in the late
1960s and first commercial production in 1970. IN-787 steel was a modification by the
International Nickel Company of an earlier alloy system called "Nicuage" (174). The IN-
787 family of steels was subsequently developed to ASTM specifications for structural
(A710) and pressure vessel (A736) applications. A military specification, MIL-S-24645
Page 111
93
0 % Cr
0 0.5 1.0 1.5 2.0
Cu OR Mo ALLOY CONTENT. %
Fig. 4.4 The effect of Cu and M o on stress relief cracking of low alloy
steels (ref. 189).
Page 112
94
(SH), also known initially as *HSLA 80', was developed by U.S. Navy (192) from the
A710 steels (Section 4.4.2). Increasing tonnages of A710 steels are being used in
various applications, such as ship building (3), machinery and offshore platforms (8).
In these steels, the heat treatments of quenching and normalizing (classes 3 and 2 of
A710 steel, respectively) are conventionally applied before the aging treatment to
improve mechanical properties. To further improve properties, especially the weldability,
thermomechanical processing can also be utilized for HSLA steels with a modified A710
composition (11, 178)(Section 4.4.3).
4.4.1 Age Hardening Heat Treatment
As a precipitation hardening steel, proper aging treatment is important to achieve
adequate properties. Jesseman and Murphy (8) showed that aging at 540-705°C raises
yield strengths in all three classes of steels by up to 175 MPa. Strength and toughness
levels are mainly influenced by the age hardening temperature with changes being
gradual and easily controlled. Time at temperature and cooling rate after age hardening
have only relatively minor effects.
Hicho et al. (193) reported their study of the effect of thermal processing variations on
the mechanical properties and microstructure of A710 Grade A, Class 3 (Q&A) steel.
The main conclusion was that the size and amount of fine copper-rich precipitates are
sensitive to the aging treatment and these, in turn, determine the mechanical behaviour of
the alloy. Manufactured plate is normally in an overaged condition. Hicho et al. (194)
later demonstrated that variations in properties caused by heat treatment can be attributed
to the variation in the Cu precipitate distribution.
Page 113
95
Abe et al. (195) revealed that accelerated cooling and direct quenching after controlled
rolling enhanced the formation of a microstructure of low carbon bainite which produced
improvements in strength and toughness of A 7 1 0 and A710-modified steels. The
improvement of mechanical properties was partly attributed to the retardation of
recrystallization during hot working due to a Cu addition over 1 % and the suppression of
e-Cu precipitation due to rapid cooling.
4.4.2 Certification of HSLA 80 Steel in Naval Construction
The attractive properties of A710 steels have led to the development of these steels in
naval structures.
As pointed out in the introduction of this thesis (Chapter 1), most of the conventional
high strength steels used in Navy construction, particularly H Y 80 and H Y 100, develop
their strength levels from a quench-and-temper ( Q & T ) heat treatment. The result is a
martensitic steel structure which requires the use of stringent welding process controls
and specially designed filler materials to retain adequate properties in the as-welded
condition. Unfortunately, these requirements, as well as the Q & T heat treatment of the
base plate, increase costs considerably (196).
Beginning in 1980, the U.S. Navy carried out a certification program for HSLA steels
for use in ship construction (1). The prime goal was to 'reduce shipbuilding cost through
improvement of welding processes, materials, technologies, procedures, and techniques,
whilst simultaneously improving overall quality' (1).
Three classes of HSLA steels were chosen for certifying as 80 ksi HSLA steel for use in
destroyers and other surface ships. They were (a) copper precipitation strengthened, (b)
control rolled, and (c) Mn-Mo-Cb quenched and tempered steels. Extensive mechanical
Page 114
96
property and weldability testing was conducted on these steels. Tests of sample steels
from each class showed that only the Cu-strengthened steel based on the A S T M A710
Grade A, class 3 ( Q & A ) steel could immediately meet the property goals without
requiring any alloy development or modifications.
The successful certification of the Q&A HSLA 80 steel based on the A710 Grade A,
class 3 steel has led to wide acceptance of this steel around the world. Significant
tonnages have been produced as a replacement for H Y 80 in cruiser deck (3,169),
bulkhead and hull applications (3), fittings, machinery, and offshore platforms (8).
4.4.3 A710-Modified Steels Produced by Thermomechanical Control Rolled
Processing
Thermomechanical control rolled processing (TMCP) has been utilized to produce
offshore structural steel based on the A710 chemistry (12,188). To produce A710 steel
by the T M C P process route, modification of chemical composition is necessary because
the alloy design of this steel is more suited to Q & A processing (class 3), rather than to
the as-rolled and aged condition (class 1), due to the high quench hardenability provided
by Ni, Cr and M o additions (Table 1.1). Consequently, A710 class 1 steel plate with a
conventional composition exhibited a much lower toughness than that of class 3 steel
(1,8). A T M C P A710 type steel with a modified composition has been reported to show
improved toughness of the base plate and H A Z relative to the conventional A710 class 1
steel (12,188).
As offshore structures of larg size are often installed in cold regions and in deep seas,
steels of high tensile strength and low-temperature toughness are required to cope with
these conditions.
Page 115
97
To meet the increasingly stringent property demands for offshore applications, steel
plates with a maximum thickness of 80mm, yield strength >450 MPa, tensile strength
>570 M P a and high notch toughness of the weld joint have been developed in Japan by
Tomita et al. (188). This new Cu-bearing steel with a modified A710-type chemical
composition has been produced by T M C P . In this work, M n less than 1.5% was found
to increase the strength substantially and at the same time to increase H A Z toughness.
However, M n was found to decrease the H A Z toughness when present in an amount
larger than 1.5%. Thus, M n was added up to a limit of 1.5%. The main modifications of
composition of this A710 modified steel were reduction of carbon and increase in
manganese content. The effect of M n in increasing the strength of A710 steel was also
realized by Wilson (9).
Recently, BHP Steel Slab and Plate Products Division (SPPD) at Port Kembla,
Australia, developed an even higher strength grade (550Mpa (80 ksi) Y.S) for offshore
and naval use by using a T M C P (or control rolling (CR) process) (12). A modified
leaner alloy design has been employed to facilitate T M C P for plates up to 5 0 m m thick.
Test plates with a thickness less than 2 5 m m showed a yield stress in excess of 550MPa
(80ksi), and can be classified as H S L A 80 steel or (CR H S L A 80). Plates in the
thickness range 25-50mm had lower yield strengths, but were in excess of 500MPa
(73ksi).
The chemical composition of this steel is shown in Table 1.2, together with that of
conventional A710 steel. Compared to conventional A710 steel (Table 1.2), the main
differences in chemical composition are:
(1) the elimination of Cr and Mo additions;
(2) an increase in M n content;
(3) a reduction of C and Nb contents; and
(4) introduction of a small amount Ti.
Page 116
98
Cr and M o are eliminated because high hardenability is not required when T M C P is
utilized. The increase in M n was designed to offset the strength reduction arising from
the elimination of Cr and M o and the reduction of C, as well as to increase the H A Z
toughness as mentioned previously (188). The reduced carbon equivalent level due to the
reduction of C, Cr, M o and Nb, together with the small addition of Ti, provide enhanced
weldability of this steel. Furthermore, the reduced alloying element content means that
this steel can be produced more cheaply than conventional A710 steels.
This steel has demonstrated excellent notch toughness. High HAZ toughness was also
established by Charpy V-notch and C O D tests on the actual H A Z of submerged arc
welds at 5kJ/mm for 5 0 m m plate and 3.2kJ/mm for 1 2 m m plate. The improved
mechanical properties were largely attributed to the grain size refinement brought about
by T M C P and by the Ti addition (see Sections 2.3.1.1,3.4.2.3).
4.4.4 Weldability of A710 Steels
The enhanced weldability and no requirement for preheat despite the high strength and
toughness levels have been the major motivations for the use of A710 steel. The good
weldability of this steel is attributed to its lower carbon content and carbon equivalent
level (CEiiw of 0.4-0.57) compared to similar strength grades (e.g. H Y 80 steel (CEiiw
of 0.59-0.96)).
An early report on the weldability of A710 steel was by Jessman and Schmid (197). In
this work, weldability was tested by determining transverse tensile and Charp V-notch
(CVN) impact transition properties on both the weld deposit and H A Z for submerged arc
welds. The microstructures of the deposit and H A Z were examined. It was concluded
that A710 Grade A alloy steel plates can be readily submerged arc welded without
Page 117
99
preheat. H A Z toughness in the coarse-grained region ( G C H A Z ) was less than that in the
base metal, but high C V N impact toughness was still maintained at -50°F (-46°C) or
lower test temperatures.
To test the weldability of the new Q&A HSLA 80 steel based on the A710 class 3 steel,
extensive laboratory testing has been conducted by Ingalls Shipbuilding, Pascagoula,
Miss. (3) to characterize weld properties. This work further proved that Q & A H S L A 80
is an outstanding ship steel that possesses high yield strength and toughness; can be
joined with all of the standard welding processes used to fabricate high yield strength
steels; and can be welded and fabricated with results of excellent quality.
Deb et al. (198) studied the microstructural characterization of two (preheated and non-
preheated) shielded metal arc weldments across the weld H A Z for Q & A H S L A 80 steel.
Their paper reported that preheated and non-preheated samples exhibited the same
microstructure in similar locations with respect to the fusion line. It is also concluded that
this steel can be welded without preheating as hydrogen-assisted cracking is not expected
to be a problem in the H A Z .
Isothermal and continuous cooling transformation behaviour of HAZ for the Q&A
H S L A 80 steel was measured by Vandermeer and Void (199) and Lundin et al. (66),
respectively.
It has been found that A710 Grade A, class 3 steel can be successfully laser beam
welded (14,15). Through mechanical testing and microstructural studies of welds,
Lukens (16) demonstrated that thick sections of this steel can also be successfully
welded by the autogenous buried gas tungsten arc process.
Smith et al. (13) carried out a close examination of the relationship between
microstructure and mechanical properties for weld metal and H A Z of submerged arc
Page 118
100
welded Q & A H S L A 80 steel. In the as-welded condition, a decrease in notch toughness
of the grain coarsened HAZ was found with increase in heat input, due to (a) an
increasing proportion of the GCHAZ taking part in the fracture; and (b) a change in
microstructure of the GCHAZ from low-carbon martensite/bainite to coarse upper
bainite.
A710 steels show much less susceptibility to hot cracking compared to HY80 steel (3)
despite a higher Cu content. The CR A710 modified steel showed less susceptibility to
hot cracking than a low strength structural steel (AS 1204-250) and 345 MPa YS grade
TMCP low carbon microalloy steel (12).
Wilson (9) suggested that care must be taken when stress relieving (or postweld heat
treatment) of the welds because a local hardened HAZ region can be created which could
result in deterioration of toughness.
Supporting Wilson's suggestion, embrittlement of HAZ after postweld heat treatment
(PWHT) was reported by Smith et al. (12) for Q&A HSLA 80 steel. PWHT at a
temperature of 1050°F (566.1°C), 1150°F (621.1°C) and 1250°F (677.1°C) for 1 hour
was performed on the HAZ by Lundin et al. (179). It was demonstrated that the GCHAZ
of this steel was susceptible to stress relief cracking (SRC) at these three temperatures.
Intragranular precipitation of Cu-rich precipitates leading to grain matrix strengthening
and concomitant strain accumulation in the prior austenite grain boundaries during
PWHT are likely to be the reasons for this cracking phenomenon. Cracking was not
observed, however, in the grain-refined or partially-transformed regions of the HAZ. It
was later pointed out that PWHT at 454°C for 1 hour also induced embrittlement in the
GCHAZ (66).
Comparison of the susceptibility to SRC of HY 80 and HSLA 100 steels was carried out
by Balaguer et al. (191). HSLA 100 is a copper-containing steel a modified A710 steel
Page 119
101
(1.58%Cu) designed to meet the mechanical property specifications for H Y 100. The
stress-relief cracking susceptibility of the H S L A 100 steel was found to be greater than
that of the higher-carbon, quench and tempered, high yield strength H Y 8 0 steel.
Most of the weldability studies listed above were concerned with Q&A HSLA 80 steel
based on A710 Grade A, class 3 steel. Very little work has been reported on the
weldability of the T M C P or C R H S L A 80 steel, except for the limited information
reported in references 12 and 188. The need for a close examination of the weldability
over a wide range of welding conditions for this type of steel was the driving force for
the present investigation.
Page 120
102
CHAPTER 5
EXPERIMENTAL METHODS
Page 121
103
5.1 I N T R O D U C T I O N
The aim of the present research was to investigate the weldability, through a study of the
structure and properties of the H A Z , of BHP's newly developed C R H S L A 80 steel. As
pointed out in previous sections, the microstructure, toughness and hardness of the H A Z
are its most important characteristics. The experimental work was thus directed mainly
towards analysis of the microstructure, measurement and analysis of the toughness and
hardness of actual and simulated HAZs. The types of welds used and the experimental
work carried out on different types of H A Z s are illustrated in Fig. 5.1.
Since the 'weld' continuous cooling transformation (CCT) diagram provides detailed
information on the y-»cc phase transformation temperature range, a partial H A Z C C T
diagram of the C R H S L A 80 steel was obtained by a weld thermal cycle simulation
technique.
Investigating the properties of each sub-region of the HAZ is difficult because of the
small volumes involved (Section 2.4.1), and thus the weld simulation technique was
employed to provide a larger volume of uniform microstructure similar to that of a
selected region of the actual H A Z . Charpy impact toughness and Vickers hardness
measurements were made on the simulated specimens.
As discussed in Section 3.4.3, the productivity of the welding process can be improved
by increasing the heat input and welding speed, but increases in productivity are only
useful if the quality and integrity of the weld zone structure are not adversely affected by
the welding process.
A joint (GIRD) research project on 'Development of high productivity welding processes
and procedures for joining structural steels of Australian manufacture' is being currently
conducted at the University of Wollongong. The main partners of this project are CSIRO
Page 122
BOP SA welds (36mm)
Reheating of
HAZ to 600°C, 800°(
Metallography
TYPES OF WELDS
Simulated
HAZ
X single pass Tpl=1300°C + P W H T (lhr) at 450. 550,650°C
three passes Tpl = 13CXTC Tp2 = 800°C Tp3= 600°C
Hardness measurements
Tensile Tests of welds
Charpy Impact
Tests
Fig. 5.1 Diagram showing the experimental procedures carried out for each
type of weld H A Z .
Page 123
105
Division of Manufacturing Technology (Adelaide Laboratory), B H P Steel SPPD and
Bisalloy Steel Pty Ltd. Several locally produced steels are being investigated and the C R
H S L A 80 steel produced by B H P Steel is one of the steels under investigation. Research
work related to the steel is presented as part of this thesis.
This Chapter provides a detailed description of the materials used in the present research
(Section 5.2); the welding procedures and electrodes (Section 5.3); and heat treatment by
a second heating cycle for the bead-on-plate submerged arc (SA) weld H A Z s (Section
5.4). The H A Z weld thermal simulation experiments are outlined in Section 5.5.
Determination of the y-»a transformation temperatures for construction of the C C T
diagram is described in Section 5.6. The methods of mechanical properties testing are
presented in Section 5.7 and the metallographic analysis of actual and simulated H A Z
structure are given in Section 5.8.
5.2 MATERIALS
The steel used in the present study was CR HSLA 80 steel developed by BHP Steel,
SPPD, Port Kembla, Australia. The chemical composition of this steel is given in Table
5.1. The carbon equivalent is 0.41 according to the formula proposed by the International
Institute of Welding (IIW)(23). This steel was produced by a thermomechanical
controlled processing (TMCP) route, involving three stages (12) which are illustrated in
Fig. 5.2. The three stages are:
(1) recrystallisation controlled rolling in the y recrystallisation temperature range to
achieve fine y grains;
Page 124
106
Table 5.1 Chemical composition of CR HSLA 80 steel
c
0.05
Cu
1.1
Mn
1.4
Cr
Si
0.25
Mo
.
P
0.012
Nb
0.02
S
0.003
Ti
0.013
Ni
0.85
CEnw
0.41
Page 125
107
LU LT I—
tr LU
a LU
1200"C
Control of 8 grain size at slab reheat by Ti (N. C)
Fine reX'd 8 grain size
TIME
Fig. 5.2 T M C P schematic representation for CR HSLA 80 steel (B) and LCE
350 steel (A) (ref. 12).
Page 126
108
(2) non-recrystallisation rolling (finishing phase) at the lowest possible temperature in the
austenitic range, with the aim of minimizing the recovery of potential ferrite nucleation
sites during the time interval before transformation begins; and
(3) controlled cooling to 500-550° C after rolling to enhance the plate cooling rate, thereby
restricting the extent of 'auto' aging by Cu precipitation during the cooling of the plate.
The last stage is designed to maximise the Cu age-hardening increment on subsequent
aging (195). Finally, the steel was age hardened at 550°C for 1/2 hour in order to induce
Cu-based precipitation hardening.
This steel has a banded ferrite and pearlite structure as shown in Fig. 5.3. The ferrite
grains are fine and slightly elongated in the rolling direction and the pearlite band spacing
of thicker plate was higher than thinner plate. The volume fraction of pearlite, average
ferrite grain size and pearlite banding spacing of 2 0 m m plate in transverse sections were
reported as 2.3%, 7.2pm and 51.9pm, respectively (200).
Typical mechanical properties of plates with thicknesses from 12 to 50mm are
summarized in Table 5.2 which shows that plates up to 2 5 m m thickness satisfy the
requirement of 550 M P a (80 ksi) yield strength (YS) and can be classified as H S L A 80
steel, according to the military specification (192)(Section 4.4.2). Plate thicknesses
studied in the present work were 20, 36 and 5 0 m m , and even though the steel is referred
to C R H S L A 80 steel, it should be borne in mind that 'HSLA 80' does not apply strictly
to the 36 and 5 0 m m grades; which have a yield stress lower than the specified 550 M P a
minimum yield stress.
A low carbon equivalent (LCE) 350 MPa YS grade steel was chosen as a reference steel
to investigate the effect of Cu and Ni contents on the H A Z C C T diagram. This steel has a
composition similar to the C R H S L A 80 steel except for a lower content of Cu and Ni
contents as shown in Table 5.3. The IIW carbon equivalent of this steel is 0.34 (23). A
Page 127
109
AS
Fig. 5.3 Microstructure of base metal of the 20mm CR HSLA 80 steel (320x).
Page 128
1
Table 5.2 Mechanical properties of CR HSLA 80 steel
(ref. 12 and unpublished data from BHP SPPD)
plate
thick
(mm)
12
20
25
36
50
orien
tation
L-T
T-L
L-T
T-L
L-T
T-L
L-T
T-L
L-T
T-L
Tensile properties
LYS TS El(%) ROA
(MPa) (MPa) 5.65A1/2 (%)
613 660 22
592 656 24
597 658 23 - •
583 656 23
587 654 23
540 623 25
555 623 24
538 624 27 73
Charpy-V impact properties
Lo En(-40°C) 50%FATT
cation (J) (°C)
l/2t 166 <-130
l/2t 133 <-130
l/4t 266 -125
l/2t 230 -125
l/4t 191 -105
l/2t 195 -95
l/4t 251 -110
l/2t 232 -105
l/4t 231 -95
l/2t 218 -80
l/4t 232 -90
l/2t - -75
l/4t 205 -80
l/2t 179 -60
l/4t 294 -95
l/2t 255 -90
l/4t 201 -85
l/2t 164 -75
Page 129
Table 5.3 Comparison of chemical compositions of (A) CR HSLA 80
and (B) low CE 350 steels (ref. 12)
Steel
A
B
Steel
A
B
C
0.05
0.07
Cu
1.1
0.015
Mn
1.4
1.59
Cr
0.026
Si
0.25
0.031
Mo
0.002
P
0.012
0.017
Nb
0.02
0.021
S
0.03
0.002
Ti
0.013
0.013
Ni
0.85
0.016
CEnw
0.41
0.34
Page 130
112
similar T M C P process to that for the C R H S L A 80 steel was utilized to produce the L C E
350 M P a grade steel, except that controlled cooling and aging heat treatment were not
employed after rolling (Fig. 5.2). The microstructure of this steel also consisted of
banded ferrite and pearlite (Fig. 5.4); however, ferrite grains were more equiaxed and
larger than in 2 0 m m C R H S L A 80 steel (Fig. 5.3).
5.3 WELDING PROCEDURES AND ELECTRODES
5.3.1 Bead-on-Plate SA and FCA Welds
Steel plate of 36mm thickness was single pass bead-on-plate (BOP) welded on the
surface of the plate parallel to the rolling direction at B H P SPPD, Port Kembla by
submerged arc (SA) and gas shielded flux-cored arc (FCA) welding processes. The
welding parameters, types of electrodes used and shielding gas are listed in Table 5.4.
Arc efficiencies (n.) of 1 are used in the calculation of heat input for both types of welding
processes.
The chemical composition of the electrode, Lincoln weld L50S, used for SA welds is
given in Table 5.5 and meets the requirements of Australian Standard A S 1858.1 for the
E M H 1 2 K type electrode (also shown in the table)(201). The typical undiluted weld metal
chemical composition of the Dual Shield 101TM flux-cored electrode is listed in Table
5.6.
Page 131
113
: j& *>v*^. *v$;, :•;. * T ^ * Try
k^
Fig. 5.4 Microstructure of base metal of the 2 0 m m L C E 350 steel (320x).
Page 132
1
Table 5.4 Bead-on-plate welding parameters and types of electrodes
Welding process
Sub. Arc
Flux-
cored
Arc
Electrode type
L50S
Dual Shield II 101TM All
Position
Shielding gas
75%Ar/
25%C02
Current (A)
800
800
800
250
250
250
Voltage (V)
30
30
30
28
28
28
Welding
speed
(mm/min)
576
360
240
420
280
168
Heat
input
(kJ/mm)
2.5
4.0
6.0
1.0
1.5
2.5
Table 5.5 Chemical composition (wt%) of electrode L50S and requirement
of A S 1858.1 (ref.201) E M H 1 2 K type electrode
Element
AS
1858.1
L50S
C
0.07-0.15
0.09
Mn
1.25-1.75
1.53
Si
0.15-0.35
0.32
S
<0.03
0.009
P
<0.03
0.013
Cu(total)
<0.15
<0.1
Page 133
115
Table 5.6 Typical undiluted weld metal chemical composition of electrode
Dual Shield 101TM
c
0.058
Mn
1.13
Si
0.37
P
0.006
S
0.011
Ni
1.78
Page 134
116
5.3.2 Four Wire Submerged Arc Welds
Plates of 20 and 50mm were welded by CSIRO DMT using specially developed 4 wire
SA welding equipment. Figure 5.5 shows the schematic diagram of the 4 wire S A
welding arrangement. A photograph of this welding equipment is shown in Fig. 3.10.
Steels were welded along the rolling direction at three different heat inputs and three
welding speeds to analyse the effects of both parameters on quality of weld and response
to high productivity welding procedures.
The joint preparations, types of electrodes and welding parameters used are summarised
in Table 5.7. T w o different types of electrodes were chosen for the 20 and 5 0 m m plates
due to the difference in yield strength level of the two plates. The chemical compositions
of both electrodes are listed in Table 5.8.
5.4 REHEATED BOP SA WELD HAZS
Samples of dimensions 5x2x22mm were cut from the cross-sections of the BOP SA
welds for each of the three heat inputs (Fig. 5.6). These samples were rapidly heated in a
muffle furnace to a pre-determined temperature, then immediately air cooled. A
thermocouple was embedded in each specimen to record the heating and cooling rates.
A second weld pass produces a thermal pulse at a particular point in the original HAZ and
the peak temperature experienced will vary with distance from the heat source. In the
present 'simulation', every point in the H A Z experienced the same thermal pulse, i.e., the
same second peak temperature, Tp2. In this experiment, the intercritical and subcritical
reheating of the H A Z was simulated with the peak temperatures selected at 800°C (A(cl)
< T < A(c3)) and 600° C (< A(cl)), respectively.
Page 135
117
Travel direction of electrodes
- •
molton slag
solid flux
root of V edge
preparation
weld root solidified
metal
\ arc 'cavity'
liquid metal
14° 0° 23°
30mm H-—H
75mm 40mm
Positions of Electrodes
Fig. 5.5 Schematic diagram of 4 wire Sumberged Arc welding.
Page 136
Table 5.7 Welding parameters, joint preparations and types of electrode of
4 wire Submerged Arc welds
Plate thickness (mm)
20
50
Heat input (kJ/mm)
2.5
5
10
2.5
5
10
Welding speed
(mm/min) 1000 1500 2000 1000 1500 2000 600 1000 1300 1000 1500 2000 1000 1500 2000 600 j 1000 1300
Edge
preparation M
single V M M M
single V S S s
nil S S M
double V M M M
double V M M S
double V S S
Electrode
LA100
TTBOR33
M: multi-pass; S: single-pass.
Table 5.8 Chemical composition of electrodes L A 100 (A) and TTBOR 33 (B)
Element
A
B
Element
A
B
C
0.057
0.09
Mo
0.39
0.44
Mn
1.74
1.46
Al
0.011
0.04
Si
0.46
0.02
Cu
0.05
0.01
S
0.004
0.007
Ti
0.04
0.15
P
0.015
0.012
B 49 ppm
0.013
Ni
1.9
0.02
N 85 ppm
0.006
Cr
0.09
0.04
O 160 ppm
Page 137
119
x 2 2 m m
Fig. 5.6 Selection of samples from actual H A Z of B O P SA welds
for the second thermal cycle treatment.
Page 138
120
The heating rate of 15*C/s is likely to be much lower than under actual welding
conditions, but was the highest possible for furnace heating of the samples used. The
cooling time between 800 to 500*C (At8-5) was 80 seconds (cooling rate of 3.8'C/s),
which corresponds to high heat input welding with a low cooling rate. Although each
sample had a different heat input for the first welding pass, the effective 'heat input1 of
the simulated second pass was the same for each sample heated to the same peak
temperature because of the constant cooling rate.
5.5 HEAT AFFECTED ZONE WELD SIMULATION
5.5.1 Weld Simulator
HAZ thermal simulation in the present work was carried out on a recently developed weld
simulator at the Department of Materials Engineering, at the University of Wollongong
(Fig. 5.7). The simulator is based on resistance heating, relying on a computer to control
the hearing and cooling cycle.
A bar shaped test piece, llxl lmm in cross-section and with length ranging from 100 to
125mm was sampled from the mid-thickness of the 2 0 m m plate. The test piece was
clamped by grips at both ends and a thermocouple was spot welded onto the surface at the
mid-length, to transfer the temperature signal from the specimen to the computer. The
thermocouple wires consisted of Pt / Pt 1 3 % Rh.
Sample cooling following a heating cycle was effected by conduction of heat through the
water cooled cast iron grips.
Page 139
121
Ek ~*c( -M iii
^ i n H
•?*" P^^
SKI^-V
.J
I 1
-- 1 7 ;J wW^^iad
^^3 ^^k
4 ^ . ^ B
Fig. 5.7 Weld thermal simulator.
Page 140
122
5.5.2 Control of Thermal Cycle Parameters
In order to simulate the HAZ microstructure of a particular HAZ region for Charpy impact
testing and to obtain the H A Z continuous cooling y—>o: transformation temperature,
specimens were air cooled during the cooling cycle so that thermal changes during
cooling were detected and analysed in terms of the y-»a transformation temperature. A n
example of a simulated weld thermal profile is shown in Fig. 5.8.
Cooling rate and peak temperature were the two thermal cycle variables of most concern
in this investigation. Cooling rate relates to the heat input of the welding procedure and
peak temperature relates to the position in the H A Z in respect to the fusion line. To obtain
the required peak temperatures and cooling rates, trial and error methods were used on
dummy samples.
5.5.2.1 Cooling rate
Because specimens were air cooled, the cooling rate of the specimen was controlled by
the separation of the grips at constant flow rate of cooling water. Figure 5.9 shows the
relationship between the cooling rate (between 800-500°C) and the separation of the grips
at constant flow rate of cooling water. The preset peak temperature was 1140°C for the
data given in Fig. 5.9. As can be seen, the wider the grips are apart, the lower the cooling
rate.
5.5.2.2 Peak temperature
The actual peak temperature reached by the specimen was usually higher than the preset
one due to overshoot. Therefore, the preset peak temperature was set below the desired
Page 141
1.3 8 Br.
-
?i
C
8
: V
i \ -: \
I
L
i
1 ,
: 1. . MSB 1 1 ! 1 I I
\
\
V ' "".. V
V. "*"l-I..,
"M* "'"*-<.. u_t'"n"l™
1 (. j J 1 1
""1 —• f—*
—t h-
....
-
»»~™....
Sif? c s 2 9.1
Fig. 5.8 A n example of the thermal profile experienced by a sample heated
in the weld thermal simulator (actual Tp=1300°C, preset Tp=1265°C,
At8-5=60s).
VI
U o
0)
«
u CI
a o o U
Grip distance (mm)
Fig. 5.9 Relationship between cooling rate (between 800-500°C) and
separation of grips (preset Tp=l 140°C).
Page 142
124
peak temperature level. A s for cooling rate, the overshoot of the peak temperature is
dependent on the separation of the grips. It also depends on the preset heating rate and the
selected peak temperature. A s Fig. 5.10 shows, the actual peak temperature varies with
separation of the grips for a preset temperature of 1140°C. The wider the separation, the
lower the temperature overshoot
Since the separation of the grips was selected to suit the required cooling rate, as
mentioned in the last section, and the preset heating rate was kept at a constant value for
different simulation conditions, the desired actual peak temperature was obtained by
setting the preset peak temperature at a suitable value. This suitable preset peak
temperature was determined on a d u m m y sample before the actual simulation run.
5.5.3 Simulation Conditions
The relationship between cooling rate (800-500"C) and heat input is needed to calculate
the equivalent heat input from the cooling rate for the simulated H A Z .
As pointed out in Chapter 2, Section 2.2, the time between 800-500"C (At8-5) during
cooling of the H A Z is related to the heat input of the welding process by Rosenthal's
equations ((2.9) and (2.11)). At8-5 is proportional to the heat input for thick plate and is
proportional to the square of the heat input for thin plate.
To decide which equation to use to estimate equivalent heat input from cooling time data
(At8-5), the critical thickness which defines the boundary condition between the two
equations was calculated from equation (2.13)(17). Equation (2.13), which shows that d'
is dependent on heat input, is as follows,
Page 143
125
HI „, 1 L _ M 1 / 2
'2pc d' ~ ^ x(773-T0 'l073-T0^ (2-13^
H A Z temperature measurements have been carried out using embedded thermocouples by
CSIRO D M T (202,203). The temperature profile of a point in the H A Z at the weld root
was recorded for 4 wire B O P S A welds on both 20 and 50 m m plates. The data for the 20
m m plate was used to estimate the heat inputs corresponding to the highest and lowest
cooling rates possible in the simulator without forced cooling (32 and 5'C/s.). If the B O P
4 wire S A welds on 20 m m plate are considered to correspond to the thin plate condition,
equation 2.11 should apply and a linear relation between cooling time At8-5 and the
square of heat input (or between cooling rate and reciprocal of the square of the heat
input) is to be expected. Figure 5.11 shows that a linear relationship does exist between
cooling rate and the reciprocal of the square of heat input for measured cooling rate data
for the B O P 4 wire S A welds at three heat inputs (2.5, 5 and lOkJ/mm) and a welding
speed of lOOOmm/min (202). The square of the correlation coefficient was equal to 1,
suggesting that the thin plate equation (2.11) was appropriate for the welded 2 0 m m plate.
The equivalent weld heat inputs corresponding to the cooling rate for each simulated H A Z
sample were thus calculated on the basis of the empirical equation established by the data
plotted in Fig. 5.11. Equivalent heat inputs of 5 and 1.9 kJ/mm were estimated for the
observed minimum (5°C/s) and maximum (30°C/s) cooling rates. As a consistency
check, the calculated heat inputs were substituted in equation 2.11 to calculate the
changeover d' values. The values were respectively 43.2 and 24.5mm, both in excess of
the dimension of the plate from which the cooling rate data were obtained. Therefore,
application of the thin plate equation is valid in this case.
5.5.3.1 HAZ of sin gle and multi-pass welding
The peak temperatures were chosen to simulate the local HAZ peak temperature of single
and multi-pass welds as closely as possible.
Page 144
U 1240
4J U
3 « U
a.
1220 -
1200 -
1 180 -
« ilea's
1140 H — • r i — i 1 — T — i r —
20 30 40 50
Grip distance (mm)
60 70
Fig. 5.10 Relationship between actual peak temperature and separation of
grips (preset Tp=l 140*C)
y = 0.53333 + 107.29x R A 2 = 1.000
1/Square of HI
Fig. 5.11 Relationship between cooling rate and reciprocal of square of
heat input
Page 145
127
For simulating the distinct microstructural regions from the H A Z boundary to the fusion
boundary of a single weld run or the last welding pass of multi-pass welding, a series of
single thermal cycles was used, where the peak temperature was varied from 600 to
1300°C (refer to Section 2.3). The peak temperatures were chosen at 600°C, 700°C,
800°C, 900°C, 1020°C, 1300°C. The cooling time from 800°C to 500°C (At8-5) was
22.6 seconds which converts to an average cooling rate of 13.3°C/s, corresponding to a
equivalent heat input of 2.9kJ/mm (from Fig. 5.11).
Generally, during multi-pass welding, the grain coarsened region (GCHAZ) near the
fusion boundary is reheated by the subsequent pass up to temperatures which depend on
the distance from the fusion line of the subsequent pass (Section 2.3.5). The reheated
peak temperature is lower than the previous one and can result in tempering, partial re-
austenitising or full re-austenisation plus grain refinement.
To simulate the microstructural evolution of the original GCHAZ in multiple pass
welding, a second thermal cycle was applied, where the peak temperature of the first
cycle (Tpi) was 1300°C, and peak temperatures of the second cycle (Tp2) were 600°C,
800"C and 900°C, corresponding to tempered (subcritically reheated), partially
transformed (intercritically reheated) and grain refined (fully re-austenitised) regions of
the H A Z .
The reheated region near the primary fusion boundary is reheated further by the
successive welding passes, but the thermal pulse is relatively weak and attenuates with
increasing pass number. To simulate this case, an additional thermal cycle (the third) was
applied. The peak temperature of the third cycle was 600°C and only the tempering effect
was studied, because the distance between the primary G C H A Z and the third pass fusion
boundary is generally large and a high reheating temperature cannot be expected in an
Page 146
128
actual welding process. The peak temperatures of the first and second cycles in this case
were 1300 and 800° C, respectively.
5.5.3.2 The effect of heat input
To investigate the effect of heat input on microstructure and toughness of the GCHAZ,
three additional cooling rates were chosen to modify the microstructure of the G C H A Z
produced at a peak temperature of 1300"C. In addition to the cooling rate of 13.3°C/s
indicated in experiments discussed in the last section, the three average cooling rates
between 800-500°C were 5.0, 23.8 and 30.2°C/s which correspond to 4.9, 2.2 and 1.9
kJ/mm, respectively.
5.5.3.3 Postweld heat treatment
The effect of postweld heat treatment (PWHT) or stress relief heat treatment on properties
of the G C H A Z was examined out in the present work. After being subjected to a peak
temperature of 1300°C at a cooling rate (800-500°C) of 12°C/s (equivalent heat input of
3.1kJ/mm), specimens were postweld heat treated in a muffle furnace at 450°C, 550"C
and 650°C for 1 hour.
5.6 DETERMINATION OF y-»a TRANSFORMATION TEMPERATURE
Cooling curves (temperature versus time) for each cooling condition of simulated
G C H A Z specimens were analysed to determine the start, 5 0 % and completion y-»a
transformation temperatures to obtain data on the C C T diagram for the G C H A Z .
Page 147
129
As mentioned in Chapter 2 (Section 2.5.1), the y-^a transformation temperature can be
obtained by dilatometry and by thermal analysis of cooling curves. In the present study,
thermal analysis was used. The derived temperature-time method based on the curve of
dT/dt versus temperature (T) was used to determine the transformation temperatures. This
method was adopted because of its relative simplicity and accuracy. A n attempt was also
made to improve the accuracy of definition of the transformation temperature by plotting
curves of d2T/dt2 against temperature (T). However, these d2T/dt2 curves failed to show
a more clearly defined transformation temperature than dT/dt curves (Fig. 5.12). Thus,
the curve of dT/dt against temperature was used to determine the transformation
temperature.
For the same cooling rate, three identical Charpy samples were prepared for impact
toughness testing. The transformation temperatures (start, 5 0 % and completion
transformation) were measured from each of the three cooling curves obtained and the
average result was used in the final C C T diagram.
5.7 MECHANICAL PROPERTIES TESTING
5.7.1 Impact Toughness
5.7.1.1 Simulated HAZs
Charpy-V notch (CVN) impact energy testing was carried out on samples with simulated
H A Z structures. After thermal simulation, specimens of 5 5 m m length were selected at
mid-length of the heated area and surface machined to a cross-section of 10x10mm to
remove the oxide scale on the surface, as well as to obtain the standard Charpy
dimensions (10xl0x55mm)(125). The notch was cut to produce samples with a T-L
Page 148
130
900
250 350
Time (1/10 seconds)
400
(a)
500 600 700 800
Temperature (°C)
(b)
Fig. 5.12 (a) A temperature-time cooling curve at cooling rate of 13.1°C;
(b) Derived temperature-time analysis (A, -^ ~ T) of
d 2 ! curve in (a) and derived analysis of curve A (B, 2 ~ T).
Page 149
131
orientation. Three parallel samples were tested for each condition to obtain an average
value. Since the 2 0 m m plate meets the military requirement of H S L A 80 steel (192), the
testing temperature was selected at -5TC to comply with the requirements of the military
standard for this grade of steel. The testing of Charpy specimens was carried out at the
Bisalloy Steel Pty Ltd laboratory.
5.7.1.2 Four wire SA welds
CVN tests were also carried out on actual HAZs of 4 wire SA welded 20 and 50mm
plates by CSIRO D M T . Charpy test bars were also notched with a T-L orientation. Due to
the difference in yield strength of the base plate, H A Z s of 20 and 5 0 m m thickness plates
were tested at -50*C and -20°C, respectively, to comply with the requirements for each
plate thickness.
5.7.2 Hardness
Vickers diamond pyramid hardness testing was employed to assess the hardness of actual
and simulated H A Z s . Before testing, specimens were metallographically polished and
lightly etched as required by the Australian Standard A S 2205.6.1 (115). Combined
polishing and etching procedures were necessary for actual welds to reveal the position of
the H A Z so as to ensure the correct position for hardness testing. In all cases, the interval
between the two closest indentations was greater than 2.5 times the diagonal of the largest
indentation as required by the Australian Standard A S 1817 (205).
Five measurements were carried out for testing the peak hardness of the actual HAZs and
the hardness of simulated H A Z specimens. The final results are shown as average values,
with 9 5 % confidence limits (206) for each average.
Page 150
132
5.7.2.1 Bead-on-plate welds
Hardness traverses across the HAZs were measured along two lines 1mm apart and
perpendicular to the fusion line for B O P S A and F C A weld HAZs, and as well as for the
second thermal cycle reheated B O P S A welds. The hardness testing position was chosen
at the widest H A Z , where the highest hardness is expected, as reported by other
researchers (106,116)(Fig. 3.6 of Section 3.3.1). Hardness traverses were determined by
means of a Vickers hardness tester with 5kg load. The interval between the two closest
impressions was 1mm.
For the unheated BOP SA welds, hardness traverses across the HAZs were also
measured at three different positions (a, b and c), corresponding to maximum,
intermediate and minimum H A Z width as seen in Fig. 5.13. The hardness traverses in
this case were determined by means of a Leitz micro-hardness tester. The hardness
traverses were tested along two parallel lines at 0.3mm interval with the indentations
offset by 0.15mm.
The peak hardness of the HAZ was measured near the fusion line by using a smaller load
(200g) in order to locate the indenter as close as possible to the fusion line. This
measurement was carried out on a Leitz micro-hardness tester. The peak hardness was
measured at intervals of 200pm along the contour of the fusion line at a similar position to
the hardness traverse. The distance between the fusion line and the indentations was
50pm.
5.7.2.2 Four wire submerged arc welds
Hardness traverse surveys of 4 wire SA weld HAZs for both 20 and 50mm thick plates
Page 151
2.5kJ/mm
4kJ/mm
6kJ/mm
Fig. 5.13 Macrographs of cross-section of B O P S A welds. (2.5% nital)
a, b and c on each macrograph indicate the hardness traverse
sampling positions.
Page 152
134
were carried out along a line 2 m m from the surface of the plate, from the weld metal
across the H A Z (of the sealing run in the case of multiple runs) to the base metal. The
hardness traverse was measured by indentations at 635pm intervals by using a 5 kg load.
This method was adopted as it is recommended by the Australian Standard (AS
2205.6.1)(115).
Peak hardnesses were measured on HAZs of 20mm plate using a 5kg load, in a similar
way to that used for bead-on-plate welds. Peak hardness testing was also performed at
positions of m a x i m u m H A Z width and along the contour of the fusion line. Five
measurements were made at intervals of 635pm and 150pm away from the fusion line.
5.7.2.3 Simulated HAZ
After Charpy impact testing, the surfaces of Charpy samples of the simulated HAZ
structures were metallographically polished and lightly etched in 2.5% nital. Vickers
hardness testing with a 5kg load was then carried out, followed by metallographic
analysis at similar location to that of hardness testing.
5.7.3 Tensile Properties of 4 Wire Submerged Arc Welds
Since hardness traverses across the HAZs indicated that the hardness was lower in the
H A Z than in the weld metal and base plate, transverse tensile tests were carried out to
investigate whether the softening of the H A Z caused any reduction of strength of the weld
joint
Cylindrical tensile pieces of 10mm diameter were taken from the mid-thickness of each 4
wire S A welded 2 0 m m plate sample. The test piece was oriented in the transverse
Page 153
135
direction and sectioned with the weld metal centred about the mid-length position. The
gauge length was 5 0 m m which was 5 times the diameter, as recommended by the
Australian Standard A S 1391 (207). Three parallel tensile tests were carried out for each
welding condition using the facilities of Bisalloy Steel Pty Ltd.
5.8 METALLOGRAPHY AND FRACTOGRAPHY
5.8.1 Optical Metallography and Fractography
Both macro- and micro-scopic metallographic techniques were used to examine the actual
and simulated H A Z specimens.
Transverse cross-section of welds were cut from the plate and metallographically
polished. H A Z s were macroscopically revealed by deep etching in 2.5% nital solution.
After macrographic examination of the weld profile and the H A Z , photomacrographs
were taken for all the welds using vertical illumination. Welds were then repolished and
lightly etched in 2.5% nital for microscopic examination using a Leitz and/or Nikon
microscope.
After Charpy impact testing and hardness testing, the notch side surfaces of the simulated
H A Z Charpy specimens were microscopically examined at the region near the notch
where hardness measurements were taken.
The fracture surfaces of Charpy impact specimens of the simulated and actual 4 wire SA
weld H A Z s were macroscopically examined by stereomicroscopy and S E M to elucidate
the fracture characteristics and the fracture mechanism associated with different
Page 154
136
microstructures. Similar observations were carried out on the fracture surfaces of tensile
test pieces of 4 wire S A welded 2 0 m m plate.
5.8.2 HAZ Width Measurement
The width of the HAZ perpendicular to the fusion line was measured along the fusion line
for B O P S A and F C A welds. The measurement was carried out by measuring the
apparent width in macrophotographs of etched cross-sections of the welds. The H A Z
width was recorded as the distance between the fusion line and the termination of the
partially transformed region of H A Z , corresponding to the apparent boundary of the H A Z
on the macrophotograph. This measurement was carried out on a graphics tablet attached
to an Apple computer.
5.8.3 Quantitative Analysis of Martensite-Austenite Islands
A quantitative metallographic study of martensite-austenite (MA) islands was performed
on B O P S A weld H A Z s (36mm) and 4 wire S A weld H A Z s of 2 0 m m plate. To reveal the
islands clearly, a color etching method was used (208). This method was based on the
modification of a etching method originally used for revealing sulphides in carbon and
alloy steels (209). Samples were pre-etched in 2.5% nital and then stain etched in a
solution of aqueous 2 0 % sodium thiosulfate, 2.3% citric acid and 2.3% cadmium
chloride. The ferrite grains were colored blue, and the islands were colored brown. The
black and white image of a color etched specimen is shown in Fig. 5.14. Quantitative
image analysis was carried out on an M D - 2 0 Image Analyser equipped with a video
camera connected to a Nikon optical microscope.
Page 155
137
7, /•
- '1
r - -.-<! 7 - .
i > m S » ;' > /*..
Fig. 5.14 Color etched G C H A Z showing M A islands for 20mm
C R H S L A 80 steel plate welded at lOkJ/mm heat input
and 600mm/min speed (640x).
Page 156
138
For B O P S A weld H A Z s , the quantitative analysis was carried on contiguous fields
extending from the fusion line towards the base metal over a distance of 500pm at the
root of the weld where the width of the H A Z is a minimum. This traverse included the
grain coarsened and part of the grain refined regions of the HAZs. In excess of 1000
particles were sampled in determination of each data point for volume fraction or areal
density.
For 4 wire SA weld HAZs, quantitative metallographic analysis was conducted at a
position of maximum H A Z width near the fusion line. Five fields were measured along
the fusion line. Each field covered an area of 4469pm2. The results quoted in Chapter 6
are the average values for the five fields.
5.8.4 Measurement of Prior Austenite Grain Size
By using delineation of the prior austenite grain boundaries by ferrite allotriomorphs, the
linear intercept austenite grain size of the H A Z adjacent to the fusion line was determined
along the fusion line for each of the B O P S A H A Z s and 4 wire S A weld H A Z s of 2 0 m m
plate. The measurement was carried out on Reichert and M G K Olympus optical
microscopes for B O P and 4 wire S A weld HAZs, respectively, with the aid of a scaled
eye piece.
The prior austenite boundaries of the HAZ in the area adjacent to the fusion line of BOP
F C A weld H A Z s were revealed by etching in 2.5% nital (Fig. 5.15). The prior austenite
grain sizes of this area along the fusion line for the three B O P F C A weld H A Z s were
measured by outlining grain boundaries on a graphics tablet attached to a Apple computer.
Page 157
139
ffWRSS
Fig. 5.15 Optical microstructure showing the prior austenite grain boundaries
of the H A Z near the fusion line of B O P F C A weld H A Z
(1.5kJ/mm)(320x).
Page 158
140
T w o layers of prior austenite grains adjacent to the fusion line were measured. The
measured area covered half of the total length of the fusion line, from the surface to the
root of the weld bead. The final austenite grain size of each H A Z is the calculated average
grain size of all the measured grains for each weld.
5.8.5 Electron Micrography and Fractography
To reveal the fine detail of microstructure and Cu precipitates in the HAZ, transmission
electron microscopy (TEM) was employed. Thin foil samples selected from the actual
H A Z were prepared by jet polishing in a Struers Tenupol using a 5 % perchloric acid-95%
acetic acid solution. Foils were examined in a Jeol 2000FX electron microscope, after
which the discs were etched in 2.5% nital and examined by optical microscopy to
determine the precise location in the H A Z of the region sampled by T E M .
Scanning electron microscopy (SEM) was used to study the fine fractographic features of
tensile and Charpy fracture surfaces. The specimens were ultrasonically cleaned in
acetone and examined in an Hitachi S450 scanning electron microscope.
Page 159
141
CHAPTER 6
EXPERIMENTAL RESULTS
Page 160
142
6.1 I N T R O D U C T I O N
This Chapter presents the results of experimental work described in Chapter 5. The
experimental results are discussed in five sections. The first four sections (6.2-6.5) cover
the results obtained from four types of HAZs. Section 6.2 describes the results of the
bead-on-plate (BOP) submerged arc (SA) welds; Section 6.3, the B O P flux-cored arc
(FCA) welds; and Section 6.4 the 4 wire S A welds. Section 6.5 presents the experimental
data for simulated single and reheated HAZs.
The effect of postweld heat treatment (PWHT) on the properties of the simulated grain
coarsened H A Z region is described in Section 6.6, separately from the results of
simulated H A Z s (Section 6.5). Finally, the partial continuous cooling transformation
(CCT) diagrams of the grain coarsened H A Z regions for the C R H S L A 80 and L C E 350
steels are presented in Section 6.7. A comparison of both diagrams is made to enable
assessment of the effect of copper and nickel contents on y-»a transformation in the
HAZ.
6.2 BEAD-ON-PLATE SUBMERGED ARC WELDS
6.2.1 Microstructure of Various Regions
The HAZ is usually divided into five sub-zones or regions according to the peak
temperature experienced in different positions of the H A Z during welding. The
characteristics of each region are reviewed in Chapter 2, Section 2.3.
Figure 6.1 shows the typical microstructures of various HAZ regions for the CR HSLA
80 steel at 2.5kJ/mm heat input. Figure 6. If gives the microstructure of the G C H A Z at a
Page 161
(a) (b)
-VTT. ta
£3* T^
t'
(c)
5 *>f^'- $. /\T** ' 7rc~"
(d)
S2 f%^W
(e) (f)
Fig. 6.1 Various regions of the H A Z (BOP S A weld H A Z , 2.5kJ/mm).
(a) grain coarsened region; (b) grain refined region;
(c) partially transformed region; (d) tempered region;
(e) unchanged base metal (320x)(root of weld bead);
(f) G C H A Z at shoulder of weld bead (200x).
Page 162
144
lower magnification for the same sample. It can be seen that the H A Z microstructure of
the C R H S L A 80 steel is basically ferritic in nature. In the grain coarsened region
(GCHAZ)(Fig. 6.1a), the structure consists of four distinct microstructural features:
packets of coarse parallel ferrite laths, quasi-polygonal ferrite, acicular ferrite and second
phase islands.
Transmission electron microscopic (TEM) analysis confirmed that the second phase
islands are martensite-austenite ( M A ) constituents and consist of martensite, retained
austenite and cementite (31). Transformation twins (Fig. 6.2a) were observed in some
martensitic regions, indicating their formation from a relatively high carbon austenite
(>0.4%C)(210). Similar twinned M A islands have been reported by many researchers
(67,135,136,211). Small precipitate particles of cementite indicated in Fig. 6.2b are likely
to be the result of autotempering of high carbon martensite after its formation during the
weld cooling cycle.
The mixture of various types of ferrite with second phases is sometimes referred as
'granular structure' in the case of quasi-polygonal ferrite and acicular ferrite, and
'granular bainite' in the case of bainitic ferrite (212). The coarse laths shaped ferrite with
M A islands in the present case m a y therefore be classified as 'granular bainite'
(213,214,215), and is different from the mixture of ferrite laths and interlath cementite
associated with upper bainite. Other workers would classify it as Bi type bainite (78) or
B3 (150). A variety of granular structures, consisting of different ferrite matrices with
second and third constituents, are often observed in T M C P steels (212).
The grain refined region of the HAZ (Fig. 6.1b) contained fine equiaxed ferrite grains (or
polygonal ferrite) and M A islands. Compared to the G C H A Z , the finer structure is the
result of the formation of fine recrystallized y grains at a lower peak temperatures ranging
from about 900°C to llOO'C (Section 2.3).
Page 163
145
(a) (b)
/ O[011]M
air ^ [ O H ] T
[100]Fe3C
(C) (d)
Fig. 6.2 Transmission electron micrographs of M A islands in the grain
coarsened region (BOP S A weld H A Z , 6kJ/mm).
(a) high magnification bright field showing transformation twins;
(b) dark field corresponding to g=(l 10)Fe3Cin s a m e region as (a);
(c) selected area diffraction (SAD) pattern of twinned M in (a);
(d) indexing of (c).
Page 164
146
In the partially transformed region (Fig. 6.1c), the structure consisted of fine polygonal
ferrite bands and bands of islands of higher carbon constituents which include
untransformed but degenerated pearlite aggregates and M A islands. The banded structure
obviously arose from the banding in the base material. The small M A islands resulted
from the partially austenitised regions and were concentrated in layers corresponding to
the original pearlite bands in the base plate. The pearlite region of the base plate was
enriched in carbon and alloying elements and was the first region to revert to austenite on
heating (lower A(c3) temperature). In the absence of homogenization during the thermal
cycle, this region also has the lowest A(r3) temperature on cooling. Undercooling of
ferrite is therefore promoted, favouring transformation to martensite.
The tempered region (Fig. 6.Id) has a similar structure to the base plate, except for
degeneration of the lamellar pearlite in the base plate to spheroidal particles of Fe3C
formed as a result of experiencing a weld thermal cycle with a peak temperature in the
range of 650-750°C (Section 2.3.4).
The 'unchanged' region (Fig. 6. Ie) adjacent to the tempered region has the same structure
as the base plate which consists of polygonal ferrite and pearlite bands. Although no
change in microstructure was apparent at an optical level, weld thermal cycling to a peak
temperature below 65Q°C influences Cu precipitates on a submicroscopic scale, altering
hardness and toughness properties in this region, as discussed in following sections.
TEM revealed that e-Cu precipitates were present in the HAZ (Fig. 6.3). Precipitates in
the aged base plate are shown for comparison in Fig. 6.3a. The Kurdjumov-Sachs (K-S)
orientation relationship was confirmed to exist between e-Cu particles and the ferrite
matrix (Fig. 6.3e), indicating that C u precipitation had occurred in ferrite. Since complete
austenization occurred in the grain coarsened and refined regions, the presence of fine e-
Cu precipitates in both regions (Figs 6.3b and 6.3c) indicates that some Cu re-
precipitation took place during cooling.
Page 165
u
.a, c w
Q a Ml
e
p u c
u * • ' X a u .S'g SC 4J •c c
1°? Of
2 c o t* T3 u C <U
2 S o u c & /—V J3 N » ^
o" 03
•M tm*
•mm}
^~* . A
^
s H i
N" <
^X a <u 4mm
VI 'S3 a
2 13 £ <
oco u a. SO 4l^
C3 J^>
c _o o 2 <te a.<*;
4> oo f3 -O
-a <u &0 S3 U J /-—\ C3
_C OO <U • ^
f3
' a . • »-« o a , 3
u 1 cu m VO
db fe
• •** T3
£3 o '3b % T3 <U f3
I oo C r3
a. /-v "O
_c X
*5 CS
s 1) 4_*
'E ,w «* - •
T3 c C3 CO
"o C3
a, u, 1) CU a. o a <u £ <u n
Page 166
148
6.2.2 Quantitative Metallography of M A Islands across the H A Z
Since the MA islands are detrimental to toughness (Section 3.4.2.2), a quantitative
metallographic study of these islands was carried out in the present work.
The volume fraction of MA islands as a function of distance from the fusion line in each
H A Z of B O P S A welds is shown in Fig. 6.4. The volume fraction decreased from the
fusion line towards the base metal. The higher volume fraction near the fusion line is
consistent with the coarser austenite grain size due to the higher peak temperature
experienced, slightly faster cooling rate and therefore, higher hardenability in this region
of the H A Z , compared with the grain refined region. Overall, the variation of volume
fraction with the distance from the fusion line was small. The volume fractions of M A
islands across the H A Z for the three welds were in the range of 4.5-6.5%.
Assuming that C partitioning takes place between ferrite and austenite during cooling and
that the C content of the ferrite is about 0.02%, the estimated C level of M A island is
about 0.6% or higher which is 12 times the average C content of the steel (0.05%). This
calculation provides further support for the conclusion that a high carbon content exists in
the M A islands.
Changes in number density (number/area) of MA islands with distance from the fusion
line for the three weld heat inputs are shown in Fig. 6.5. With increasing distance from
fusion line, the number density decreased, indicating that because of smaller austenite
grain size, slightly lower cooling rate and thus lower hardenability, fewer M A islands
were formed in the grain refined region. This observation is also consistent with the
decrease in the volume fraction of the islands with distance from the fusion line (Fig.
6.4).
Page 167
7-
' l
100 200
149
300 400 500
500
0 100 200 300 400 500
Distance from fusion line (pm)
4 Volume percentage of M A islands as a function of distance from
the fusion line of B O P SA weld HAZs.
Page 168
180000
VI
e 160000-— "c«
^ 140000-1
o >> 120000 "3 e <u "° 100000 u .Q
3 80000
z 60000
a •
2.5 kJ/mm 4.0kJ/mm 6.0kJ/mm
"T
100 200 300
Distance from fusion line (pm)
\ 500
Fig.6.5 Number density (um-2) as a function of distance from
the fusion line of B O P SA weld HAZs.
Page 169
151
Although m a x i m u m lengths up to 15pm were measured for particles in the grain
coarsened region, the majority of the M A islands had maximum dimensions less than a
few microns.
6.2.3 Hardness Traverses
Hardness traverses across the HAZs for the three welds were measured at three different
positions (Fig. 5.13). Figure 6.6 summarises the results and shows a matrix of hardness-
distance graphs corresponding to the three sampling positions and the three heat inputs.
The local width of the H A Z and the subzones are also marked on each graph. In this case,
the width was determined microstructurally in terms of the boundary between modified
and unmodified structure, i.e. the termination of the tempered region.
Figure 6.6 shows that the peak hardness of the HAZ occurred in the grain coarsened
region near the fusion line. Unlike many other steels for which the whole range of the
H A Z is harder than the base metal (Section 3.3), hardness gradients in the Cu-bearing C R
H S L A 80 steel show a minimum value which is well below the hardness of the base
plate. The minimum hardness occurred in the partially transformed region. The low
hardness zone also extended beyond the apparent microstructural boundary of the H A Z
(termination of the tempered region) to unchanged base material regions, indicating that
the hardness of the H A Z is altered submicroscopically by overaging of the copper-rich
precipitates.
The widths of HAZ soft zones where the hardness is lower than that of base plate were
measured at the three locations of H A Z for different heat inputs. As can be seen in Fig.
6.7, from a->b-»c, the width of the low hardness region increased, similar to the width of
H A Z . Higher heat input resulted in a wider H A Z soft zone.
Page 170
152
250 250
4 6 d(mm)
H A Z
2 4 S d(mm)
8 10
position a position b position c
Fig. 6.6 Hardness traverses at positions a, b and c for the three B O P S A weld
HAZs. First row: 2.5kJ/mm; second row: 4kJ/mm and third row:
6kJ/mm.
1-grain coarsened region; 2-grain refined region;
3-partially transformed region; 4-tempered region.
Page 171
153
• position a
• position b
o position c
Heat input (kJ/mm)
Fig. 6.7 Width of H A Z softened zone as a function of heat input at three positions (a, b and c) for B O P SA welds.
Page 172
154
6.2.4 The Effect of Heat Input
6.2.4.1 Macro- and micro- structures of HAZ
Figure 6.8 shows the macroetched weld cross-sections for three different heat inputs. As
can be seen the three welds showed similar weld profiles. The higher heat input was
associated with a larger volume of weld deposit, a longer fusion line length and a wider
HAZ.
The widths of the HAZs perpendicular to the fusion line are recorded in Fig. 6.9 as a
function of distance along the fusion line of the three welds. Significant variation in H A Z
width can be seen along the fusion line (Fig. 6.9). The ratio of the maximum and
minimum widths of the H A Z is about 2.5:1 for a given heat input, with the minimum
width occurring at the root of the weld bead and the maximum width occurring at the
shoulder of the bead (Fig. 6.8). Figure 6.9 also indicates that a higher heat input is
associated with a wider average H A Z which is consistent with the macrographs shown in
Fig. 6.8.
The microstructure of the HAZ changed with heat input. Of the various regions of the
H A Z , the G C H A Z showed the most marked change with heat input. The G C H A Z is
usually regarded as the most dangerous region of the H A Z , because embrittlement can
occur in this region as a result of the formation of unfavorable brittle constituents
(Chapter 2, Section 2.3.1). Therefore, the present study of the effect of welding
parameters on H A Z microstructure and properties has been concentrated on the G C H A Z
region.
Page 173
155
2.5kJ/mm 6kJ/mm
60
i , I
50 40 30 20 10 0 l0 20 30 40 50 60 70 80
I l . l tuPE INI J A P * f l | I I i
Fig. 6.8 Macrographs of weld cross-sections for B O P S A welds.
a 6.0kJ/mm • 4.0kJ/mm n 2.5kJ/mm
Distance along fusion line (mm)
Fig. 6.9 H A Z width along the fusion line of B O P S A welds.
Page 174
156
Figure 6.10 shows the optical and S E M microstructure of the G C H A Z for the B O P S A
weld H A Z s at different heat inputs. It can be seen that a lower heat input resulted in a
finer structure due to faster cooling rate of the H A Z during welding. At the highest heat
input (6kJ/mm), grain boundary ferrite with aligned M A islands is observed.
From Fig. 6.4, it can be seen that similar volume fractions of MA islands were present in
regions near the fusion line (~6%) for the three different heat inputs. This result indicates
that heat input in this case had little effect on the volume fraction of M A islands in the
HAZ.
In contrast, the number density of MA islands increased with decrease in heat input from
4 to 2.5kJ/mm (Fig. 6.5). The mean maximum dimension of the M A islands averaged
over the grain coarsened and grain refined regions are shown in Fig. 6.11 as a function of
heat input. The size of the islands increased from 2.5 to 4 kJ/mm heat input
As there was little change with heat input of the volume fraction of MA in the grain
coarsened region, the higher value of number density for the lowest heat input (Fig. 6.5)
clearly shows that the major change in microstructure with decreasing heat input is the
increasing level of structural refinement, consistent with the microstructures shown in
Fig. 6.10. This conclusion is also consistent with the evidence of smaller mean maximum
dimension of M A particles for the lowest heat input (Fig. 6.11). For low heat input, the
higher cooling rate and lower "residence time" at high temperatures, where rapid grain
growth can occur, collectively result in a smaller austenite grain size. The hardenability is
increased by faster cooling, but is reduced by decreasing austenite grain size, so that no
major increase in the volume fraction of M A island was obtained for the lowest heat input
(2.5kJ/mm). However, both fast cooling and fine austenite grain size enhance the
nucleation of diffusional products, resulting in transformation structures which are finer
than those present in the grain coarsened region of the higher heat input welds.
Page 175
•^z^-&i^6 <*&' WJMrmmm
< % V > •••••"<r
- ' , ^ • »
>.-^.
1 <Wtl
7^vVV,* -'•7:"^,,Y:'0 :s?.-V
s P ^ ^ ^ ^ * - (\|
tT
2.5kJ/mm
,' -^ "'- *v ™
bS^%|( 7
^ - \ ' ' ' *l7V* '
(a) 6kJ/mm
(b)
Fig. 6.10 Low magnification optical rnicrostructures (a) of G C H A Z at different
heat inputs for B O P SA welds (at the shoulder of the weld bead)
(200x). High magnification S E M micrographs (b) showing the M A
islands of G C H A Z at three heat inputs (at the root of weld bead)(770x).
Page 176
158
4 5
Heat input (kJ/mm)
Fig 6.11 Relationship between mean maximum dimension of M A islands and heat input for BOP S A weld HAZ.
Page 177
159
The data for volume fraction (Fig. 6.4), particle density (Fig. 6.5) and mean maximum
particle length (Fig.6.11) indicate that there was little difference in the characteristics of
the M A islands for 4 and 6 kJ/mm heat input, but that significant refinement occurred for
the 2.5kJ/mm weld.
Linear intercept prior austenite grain sizes were measured along the fusion line for each
B O P S A weld H A Z . Figure 6.12 shows the distribution of grain size along the fusion
line at three heat inputs. As can be seen, the grain sizes measured at the shoulder of the
weld bead (maximum H A Z width) were scattered, but the average value at this position
was larger (134.8pm) than at the root of the bead (81.3pm). Together with the marked
variation of H A Z width along the fusion line, this result indicates that profoundly
different local cooling rates exist along the fusion line in the H A Z .
The average prior austenite grain sizes along the fusion line for three welds are plotted
against heat input in Fig. 6.13. It is evident that the coarser grain size in the H A Z resulted
from higher heat input welding.
6.2.4.2 Peak hardness
Peak hardnesses of the HAZs were measured in the GCHAZ near the fusion line at three
H A Z positions marked in Fig. 5.13 for all three welds. Each value is the average of 5
measurements and 9 5 % confidence limits have been calculated for each average value.
For the BOP SA welds, peak hardness of the HAZ decreased with increase in the heat
input for the corresponding positions (a, b and c). Figure 6.14 shows the change of peak
hardness with heat input for position c. For all the weld HAZ s , the maximum hardnesses
were well below the limiting hardness value (350HV) for prevention of cold cracking
(Section 3.2.2).
Page 178
400
300 -
200 -
100
2.5kJ/mm
b
5 10 i
15 20
400
s 9i
"3
u CD
"a VI
3 <
300 -
200-
100
a
a •31
4kJ/mm
BH 0 1 3 EP
m
EI a
oj3
•
T 5
—r~ 10 15 20 25
400
300-
200-
100 -r
6kJ/mm
. * .
% n|H ' B B
H EL ET Q a § B IETD
-pa i% Q B #
ID
B jP«»5H
B D U B B Q B
B 1 1 1 1 1 • r — " 1 ' 5 10 15 20 25 30
Distance along the fusion line (mm)
Fig. 6.12 Distribution of prior austenite linear intercept grain sizes along the
fusion line of BOP SA weld HAZs. (a) shoulder of weld bead
(maximum HAZ width); (b) root of weld bead (minimum HAZ
width).
Page 179
120 s <u s
s S 110 u 5X) &>
'S V. 3 «3
100
3 4 5
Heat input (kJ/mm)
Fig. 6.13 Average austenite grain size along the fusion line as a function of heat
input for BOP SA weld HAZs.
260
*-~\ CD O o
v. VI <u G "3 u « •a
^ « 0)
250 -
240-
230 -
220-
r j,
210 3
T 5
Heat input (kJ/mm)
Fig. 6.14 Peak hardness of H A Z as a function of heat input at position
c for the BOP SA welds. Bars represent 95% confidence
limits of the means.
Page 180
162
6.2.5 Second Thermal Cycle Reheating of H A Z
The second thermal pulse heat treatment of BOP SA welds was described in Chapter 5,
Section 5.4. The cooling time At8-5 of the second thermal pulse was 80 seconds, which is
typical of high heat input and an associated slow cooling rate.
Figure 6.15 shows a comparison of the microstructures of the grain-coarsened region of
the H A Z before and after reheating to a peak temperature (Tp2) of 800°C (intercritical
reheating). After the reheating, the grain-coarsened and grain-refined regions of the three
welds showed many small M A islands aligned in bands which corresponded to the
positions of the original pearlite bands in the base plate. Higher magnification
photomicrographs (Fig. 6.16) showed that these second phase particles were mainly
elongated in cross-sectional shape. Transmission electron microscopy confirmed the
tendency towards banding of these particles (Fig. 6.17) and the presence of twinned high
carbon martensite in the particles (Fig. 6.18). The decreasing prominence of the bands of
M A islands with increasing heat input is evident from Fig. 6.15.
There was little change in the HAZ structure at an optical microscopic level after
subcritical reheating (Tp2=600°C). However, T E M analysis revealed (Fig. 6.19) that the
original M A islands in this region were tempered by the reheating.
Figure 6.20 shows the hardness gradients across the HAZ for the original weld and for
the superimposed heat treatments to peak temperatures of 800°C and 600°C. It should be
noted that the last two hardness gradients do not simulate those expected for a second
welding pass, as the whole range of the H A Z was subjected to the thermal cycle with the
same peak temperature (Tp2 of 800"C or 600°C). The graphs indicate, however, the
change in hardness to be expected if a particular point in the original H A Z was subjected
to the imposed thermal cycle. For example, at a point 3 m m into the H A Z from the fusion
Page 181
163
k_4-- 7:»v •- cTi
-V7 >- <' ?•• •• :- - 7 l "*^r< ^
i .^ - f&yj -if 7- ••
7 ? &;w£
mu w£a*y~ - 'ikX.'V^i .,A»'-&-n*-'Vi 1
s a
3 VO
2
<
cu O m
NrJ
O u •5b S
<L> •8 § s
Ebo o »? «».S 3 <u
CO <L>
vd bb
C3
Page 182
164
^v«*i V'*/V£ *T/^«a
&v- M-,. r-7'frv -•'r.-.:.' *rv-"
20um ' 1
Fig. 6.16 High magnification micrograph showing the shape and distribution of
M A islands in intercritically reheated G C H A Z (BOP S A weld H A Z
at 4kJ/mm).
Fig. 6.17 T E M micrograph showing the tendency towards banding of M A islands in the G C H A Z after intercritical reheating (BOP SA weld at 4kJ/mm).
Page 183
165
Fig. 6.18 Twinned martensite in intercritically reheated G C H A Z (BOP S A weld
at 4kJ/mm).
m> W* • ^ '^Wfw 9i
j j 1 200nm
Fig. 6.19 T E M micrograph showing the tempered M A islands in subcritically
reheated H A Z (BOP SA weld at 4kJ/mm).
Page 184
166
160
2.5kJ/mm
"T 2
"T 6
single pass - intercritical — subcritical
10
240 4.0kJ/mm
160 T" 2 4
T 6 8
- a — single pass ...«... intercritical — o — subcritical
10
240 6.0kJ/mm
••••-•"••"•
— a — single pass •••••••• intercritical — o — subcritical
0 2 4 6 8
DISTANCE FROM FUSION UNE (mm)
10
Fig. 6.20 Hardness traverses of H A Z for single pass B O P S A welds before and after reheating to peak temperatures of 600°C (subcntical) and 800 C (intercritical). 1-grain coarsened region; 2-grain refined region; 3-partially transformed region; 4-tempered region.
Page 185
167
line for the 2.5 kJ/mm weld, both the Tp2of 800°C and 600°C treatments raised the
hardness by at least 10 points.
The effect of the second thermal cycle on the base plate hardnesses is also indicated
by Fig. 6.20. For Tp2of 600°C, the hardness level was raised about 10 points above the
original average hardness. This result indicates that the 550°C aging treatment for 1/2
hour following control rolling does not produce maximum hardening and that the
superimposed thermal spike to a 600° C peak temperature gives an additional hardening
increment. In contrast, intercritical treatment to 800° C resulted in softening in the base
plate to levels similar to the minimum produced in the H A Z by the single pass weld.
For the 4.0 and 6.0 kJ/mm samples, there was no significant change in the hardness
gradient in the G C H A Z region after reheating to 600°C. However, for the 2.5 kJ/mm heat
input, the second thermal cycle with peak temperature of 600°C resulted in an increase in
hardness of the grain-coarsened region of this sample (Fig. 6.20a). Reheating to 800°C
did not have any significant effect on G C H A Z hardness.
6.3 BEAD-ON-PLATE FLUX-CORED ARC WELDS
Figure 6.21 shows the macroetched weld cross-sections for the BOP FCA welds for
three heat inputs. As can be seen the welds showed similar weld profiles at different heat
inputs. However, the weld profiles of B O P F C A welds were greatly different compared
to B O P S A welds (Fig. 6.8). A higher heat input was associated with a larger volume of
weld deposit, a longer fusion line length and a wider H A Z , similar to the B O P S A welds.
The widths of the HAZs perpendicular to the fusion line are also recorded in Fig. 6.22 as
a function of distance along the fusion line. For the F C A welds, the variations of H A Z
width along the fusion line are quite different to the SA welds, reflecting the difference in
Page 186
168
110 120 130 140 |50 160 170 180 190 2 0 0 2I° 22° 230 240 2 I I I MADE IN I JAPAN
JMimwiMJJM ^
Fig. 6.21 Macrographs of weld cross-sections of B O P F C A welds.
S
s, S3 < X
A i.0(kJ/mm) • 1.5(kJ/mm) n 2.5(kJ/mm)
Distance along the fusion line ( m m )
Fig. 6.22 HAZ width along the fusion line for BOP FCA welds.
Page 187
169
weld profiles observed in Fig. 6.21. The ratios of maximum to minimum H A Z width are
different at different heat inputs and are 2.1:1, 1.3:1 and 1.4:1 for 1.0, 1.5 and
2.5kJ/mm, respectively. The measurement of H A Z width (Fig. 6.22) indicates that higher
heat input resulted in a wider H A Z , consistent with the macrographs in Fig. 6.21 and
with the results obtained for B O P S A welds.
Figure 6.23 shows the optical microstructure of the GCHAZ for BOP FCA weld HAZs at
three different heat inputs. The structures of the G C H A Z for the B O P F C A weld H A Z s
are similar to those for B O P S A welds (Fig. 6.10). It is evident that a lower heat input
resulted in a finer structure. Compared to the B O P S A welds, the B O P F C A welds
showed some dark etching structural constituents in the G C H A Z (marked in Fig. 6.23)
which contained a very fine lath structure. Lower heat input resulted in a higher
percentage of this dark etching structure. Transmission electron microscopy (TEM)
revealed that the structure consisted of finely distributed sheaf-like ferrite (Fig. 6.24),
consistent with low carbon lath martensite (212). In general, the structure of the G C H A Z ,
for low heat input and the associated fast cooling rate, consists of a mixture of granular
bainite and lath martensite (212).
The average prior austenite grain sizes in the GCHAZ along the fusion line for BOP FCA
welds are plotted against heat input in Fig. 6.25. Much lower prior austenite grain sizes
were obtained from F C A welds over those of S A welds due to the faster cooling rates
associated with the lower heat inputs. Consistent with the results for the B O P S A welds,
high heat input resulted in a coarser grain size in the H A Z .
Peak hardnesses of the HAZs were measured in the GCHAZ near the fusion line at
maximum H A Z width for the welds. As for the B O P S A welds, the peak hardness of the
H A Z decreased with increase in the heat input (Fig. 6.26). The B O P F C A welds showed
a much more significant change in peak hardness with heat input than the B O P S A welds.
Page 188
lkj/mm
1.5kJ/mm
2.5kJ/mm
Fig. 6.23 Microstructures of G C H A Z region for different heat inputs
in B O P F C A welds (256x). The arrow indicates the dark
etching structure.
Page 189
171
Fig. 6.24 T E M micrographs showing low carbon martensite in HAZs of
BOP FCA welds.
Page 190
Heat input (kJ/mm)
Fig. 6.25 Average austenite grain size along the fusion line as a function of
heat input for BOP FCA weld HAZs.
340
CD ©
o Vi Vi 4)
S •3
u ea CQ <U
320-
300
280-
260-
240 0 1 2 3
Heat input (kJ/mm)
Fig. 6.26 Peak hardness of HAZ as a function of heat input for the
BOP FCA welds. (Bars show the 95% confidence limits)
Page 191
173
6.4 F O U R W I R E S U B M E R G E D A R C W E L D S
6.4.1 The Effect of Heat Input
Figure 6.27 shows the macroetched weld cross-sections for 4 wire SA welds. The weld
profiles of the 4 wire SA welds were similar to those of the B O P SA welds. Higher heat
input was also associated with a larger volume of weld deposit, a longer fusion line
length and a wider H A Z .
Optical microstructures of the GCHAZ at different heat inputs in Figure 6.28 indicate that
at the same welding speed, a lower heat input resulted in a finer structure in the HAZ.
This observation is consistent with the results obtained from B O P SA and FCA welds.
Quantitative measurement of MA islands was also carried out on 4 wire SA welds.
Similar results were obtained to those for B O P SA welds, in that variation in welding
conditions (heat input and welding speed) appeared to have little effect on the volume
fraction of M A islands in the G C H A Z (Fig. 6.29a). The volume fractions of M A islands
in the G C H A Z for all the welding conditions (three heat inputs and three welding speeds)
were within the range of 3-6%. However, as heat input decreased, the average maximum
dimension of the M A islands decreased (Fig. 6.29b), consistent with the measurements
for B O P SA welds (Fig. 6.11). These results confirm that a finer H A Z structure is
obtained at lower heat input.
The average linear intercept prior austenite grain sizes along the fusion line for the 4 wire
SA welds (averaged over the three speeds) are plotted against heat input in Fig. 6.30. It is
evident that a coarser grain size in the G C H A Z results from higher heat input welding.
The two types of SA welding procedures (BOP and 4 wire SA welds) showed similar
prior austenite grain sizes in the H A Z , whereas the F C A welds showed much smaller
austenite grain sizes (Fig. 6.31).
Page 192
2.5kJ/mm
1
7 • • '•• '
j ^ ^ ^ J
>y' HI 2000mm/min| •i5(X)mm/min 1
\%wt MmW ^H
m^mtl tm^. -mW
j •
1lOOOmm/min
ll!l|llilllll|llll
I Q Q 110 120 130 140 150 160
5kJ/mm
lOkJ/mm
Fig. 6.27 Macrographs of weld cross-sections of 4 wire SA welds in
20mm plate.
Page 193
i
-
»5r J*"'
(a)
(b)
Fig 6.28 Comparison of G C H A Z microstructures for different heat inputs in 4
wire SA welds at lOOOmm/min welding speed on 20mm plate (256x).
(a) 2.5kJ/mm; (b) lOkJ/mm.
Page 194
176
^ 7
Vi •3
3
<
3
CU
£
© >
6 -
4-
3-
•
a
• D
2.5kJ/mm 5.0kJ/mm 10.0kJ/mm
B B
1000 2000
Welding speed (mm/min)
3000
s Vi •3
3 In
<
1.5-
'
1.0-
0.5-
a
a
•
B
1
a
• •
•
B
b
H 2.5kJ/mm
• 5.0kJ/mm
B 10.OkJ/mm
1000 2000 3000
Welding speed (mm/min)
Fig. 6.29 Volume fraction (a) and maximum dimension (b) of M A islands in
HAZ near the fusion line at the shoulder of weld bead of 4 wire S A
welded 20mm CR HSLA 80 steel plate.
Page 195
177
160 E z± CU N *5 140 -
u CD CU
'2 cu 3 u ©
4 6 8
Heat input (kJ/mm)
12
Fig. 6.30 Average austenite grain size along the fusion line as a function of heat
input (averaged over the three welding speeds) for 4 wire SA weld
HAZs.
200
150
100-
50-
• 4 wire SAW(20mm)
a BOP,SAW(36mm)
+ BOP,FCAW(36mm)
4 6 8
Heat input (kJ/mm)
12
Fig. 6.31 Average austenite grain size along the fusion line as a function of heat
input for the three types welds (BOP SA, B O P F C A and 4 wire SA).
Page 196
178
Peak hardness of the H A Z of 4 wire S A welding decreased with increase in the heat input
(Fig. 6.32). The result at each heat input is the average value over three welding speeds.
Table 6.1 and Fig. 6.33 summarize the peak hardnesses for the three types of welding
processes. Compared to the two types of S A welding processes, the B O P F C A welds
showed a more significant change in peak hardness with heat input than the S A welds.
The 4 wire S A welds exhibited lower peak hardnesses than the B O P S A welds, probably
as a result of lower cooling rates in the multiple wire welds of thinner plate (20mm versus
36mm).
Although lower heat input results in a harder HAZ, relative to the hardness of base plate,
the hardening of the H A Z is rather mild for the 4 wire SA welds. The 2.5kJ/mm H A Z in
the 4 wire S A weld showed a peak hardness slightly higher than the hardness of the base
plate (Table 6.1), but the peak hardness for the 5 and lOkJ/mm heat input welds were
lower than that of the base plate. For all the weld HAZs, the maximum hardnesses were
well below the limiting hardness value (350HV) for prevention of cold cracking (Section
3.2.2).
Charpy impact tests were conducted on 4 wire S A weld HAZs of 20 and 50mm plates by
CSIRO D M T at -51°C and -20°C, respectively (216,217). Individual C V N values for all
weld H A Z s are listed in Table 6.2, together with the calculated average values for each
H A Z . The average C V N values are also plotted in Fig. 6.34 and 6.35 for 20 and 5 0 m m
plates, respectively. It should be noted that in this case, the C V N values obtained for the
H A Z s were obtained using a notch running across the structural gradient of the H A Z , as
difficulty exists in locating the notch tip within a narrow region of the weld H A Z (Section
3.4.1). The C V N results are average values across the H A Z . Both Figs. 6.34 and 6.35
show that toughness of the H A Z did not vary markedly with heat input in the range of 2.5
to lOkJ/mm.
Page 197
>
X S3
Vi Vi
cu 3 •3 U CQ
cu fl-
<i«»u -
230-
220-
210-
200-
!
N vj l^-^
(
«
0 2 4 6 8
Heat input (kJ/mm)
10 12
Fig. 6.32 Peak hardness of H A Z (averaged over three welding speeds) as a
function of heat input for the 4 wire SA welds. Bars represent 95%
confidence limits of the means.
Page 198
Table 6.1 HAZ peak hardnesses of three types of welds
Types of
welds BOP, FCA
36mm
BOP, SA 36mm
4wireSA 20mm
base plate 3 6 m m 2 0 m m
Heat input
(kJ/mm) 1.0 1.5 2.5 2.5 4.0 6.0 2.5 5.0 10.0
H V m a x
309.4 298.2 264.1 248.2 240.7 229.2 226.2 218.6 213.2
218.0 221.7
9 5 % confidence
limit 289.6-329.2 291.7-302.7 246.6-281.6 242.5-253.9 231.9-249.5 219.6-238.8 220.6-231.8 213.5-223.8 205.6-220.8
205.6-230.4 218.6-224.8
Page 199
181
220
200
a BOPFCAW • BOP SAW p 4 wire SAW
Heat input (kJ/mm)
Fig. 6.33 Peak hardness of H A Z as a function of heat input for the three types
of welds (BOP SA, B O P FCA and 4 wire SA).
Page 200
Table 6.2 Charpy-V notch impact energy of 4 wire SA welds (ref.216,217)
plate thickness (mm)
20mm
(-51°C)
50mm
(-20°C)
Heat input (kJ/mm)
2.5
5
10
2.5
5
10
welding speed (mm/min)
1000
1500
2000
1000
1500
2000
600
1000
1300
1000
1500
2000
1000
1500
2000
600
1000
1300
CVN values (J)
146, 89
180
210, 216, 214
178, 155
90, 126, 130, 87
172, 118, 147, 164
47, 95, 102, 72
170, 170, 148
118, 114,60
251, 255, 227, 208
240, 261, 228, 206
226, 223, 234, 220
210, 189, 207, 194
174, 183
207, 246
194, 204, 210, 196
166, 198, 164, 176
186, 240, 200, 186
Mean CVN values
(J)
118
180
210
167
108
150
79
163
97
235
234
226
200
179
227
201
176
203
Page 201
300
200-
100 -
1000 2000
Welding speed (mm/min)
- — a — 2.5kJ/mm —••••— 5kJ/mm --•a-- iokJ/mm
3000
6.34 C V N values at -5TC for 4 wire SA weld HAZs as a function of welding speed at three heat inputs for 20mm CR HSLA 80 plate (ref.216, 217).
200-
100-
0 - 1 •• . 1
1000 2000
Welding speed (mm/min)
H — 2.5kJ/mm — • • — 5kJ/mm - - B - - iokJ/mm
3000
6.35 C V N values at -20'C for 4 wire SA weld HAZs as a function of welding speed for three heat inputs for 50mm CR H S L A 80 plate (ref.217).
Page 202
184
Tensile properties were measured for the 4 wire S A welds of 2 0 m m plate. Of all the
welding conditions, four contained defects. These defects were either lack of fusion or
slag entrapped in the weld metal. Tensile test specimens of these welds failed at the
defects, showing relatively low strength values. These results are not considered here.
Table 6.3 shows the tensile results for the remaining welds.
For heat inputs of 2.5 and 5kJ/mm, the welds showed a similar yield strength to the base
plate, but a slightly lower tensile strength. However, the welds at lOkJ/mm exhibited
lower yield strength values than the base plate. The values were also below the minimum
requirement (80ksi or 550MPa) for the H S L A 80 steel. Figure 6.36 shows that the width
of the H A Z , which has a hardness lower than that of the base plate, increased with heat
input. The wider softened H A Z associated with higher heat input is the likely reason for
the lower strength.
Examination of the failure location of each weld indicated that all samples failed at the
H A Z where softening occurred. Each sample exhibited a cup and cone fracture
appearance, consisting of a central cup region and a shear lip outer region, as shown in
Fig. 6.37. Both regions showed transgranular fracture by microvoid coalescence
(dimpled appearance)(Fig. 6.38a and 6.38b), but few inclusions were found inside the
dimples. The rough central area also indicated that the fracture was very ductile, which
correlates with the large values of reduction of area in Table 6.3. The dimple size varied
significantly in the central region (Fig. 6.38a), but the outer shear lip region showed
dimples of similar size.
Page 203
185
Table 6.3 Tensile properties of 4 wire SA welded HSLA 80 plate (20mm)
H.I (kJ/mm)
10
5
2.5
base
W.S (mm/min)
1000
1300
1500
2000
2000
UYS (MPa)
534, 524
510, 517
609,589,607
608
608, 574
602,598,604
UT (MPa)
576, 598, 601
590, 597, 601
638, 635, 635
639, 640, 644
657, 660, 654
672, 668, 675
El. (%)
20, 20, 21
20, 21, 21
18, 18
17, 17
19,20
28, 24, 30
ROA (%)
76, 76, 76
74, 72, 70
78, 76, 76
76, 72, 70
73,70
71,71,70
H.I: heat input, W.S: welding speed, UYS: upper yield strength,
U.T: ultimate tensile strength, EL: elongation, ROA: reduction of area.
Page 204
240 -r
230-
!£ 220 -
S 210-aa S 200-G "g 190-53 180 -
170-
160 weld metal HAZ base metal T -r
2 -r 4 6 6 - 4 - 2 0
Distance from fusion line (mm)
i • i • i •
8 10 12 14
186
«o >
X to to 0>
•o •_
=
240-i
230-
220-
210-
200*
190 -
180-
170 -weld metal
160 HAZ I
conn
base metal T T
6 - 4 - 2 0 2 4 6
Distance from fusion line (mm)
T
4 I ' I • l • I
8 10 12 14
240
230-
& 220->
KS 210-
S 200-
•§ 190-u ea X 180-170-160-
weld metal • i • i
6 -4 -2
| HAZ I • I ' — T " * -
base metal i • I • i •
0 2 4 6 8 1 0 1 2 1 4
Distance from fusion line (mm)
Fig. 6.36 Hardness traverses across the HAZs of 4 wire SA welds in
20mm plate, (a) 2.5kJ/mm, 1500mm/min; (b) 5kJ/mm,
1500mm/min; (c) lOkJ/mm, 1300mm/min.
Page 205
187
Fig. 6.37 Cup and cone fracture appearance of weld transverse tensile specimen
( H S W 20, U Y S = 534 MPa).
(a) (b)
Fig. 6.38 S E M fractographs showing the dimpled appearance at the
(a) central region (440x) and (b) side shear lip (330x) in the
tensile fracture surface (HSW20, UYS=534MPa).
Page 206
188
6.4.2 Effect of Welding Speed on the Structure and Properties of 4 Wire S A Welds
The effect of welding speed on HAZ microstructure and mechanical properties was
studied by comparing the results of welds produced at different welding speeds at
constant heat input for 4 wire S A welding.
As shown in Fig. 6.27, there was no significant change in weld profile with welding
speed. However, a slight reduction in H A Z width with increasing speed is evident in Fig.
6.27. The weld cross-section for the lowest welding speed at each heat input showed an
internal boundary within the weld bead (Fig. 6.39), indicating that instead of a single
weld bead, some solidification occurred on passage of the previous electrodes before
passage of and remelting by the following electrodes.
Linear intercept HAZ prior austenite grain sizes along the fusion line of 4 wire SA welds
of 2 0 m m plate are plotted as a function of welding speed in Fig. 6.40. Except for low
values at the lowest welding speeds for 2.5 and 5kJ/mm heat inputs, the general trend
with increasing welding speed is towards smaller austenite grain size.
The unexpectedly small austenite grain size at the slowest welding speed for 2.5 or
5kJ/mm heat inputs may be related to the additional fusion lines within the weld bead as
shown in Fig. 6.39. The internal fusion lines are associated with the complexity of the 4
wire welding procedure and will be explained in the next Chapter.
Both optical microstructural observations and quantitative metallography of the MA
islands (Fig. 6.29) showed that no significant H A Z microstructural change occurred with
change of welding speed at constant heat input, despite the reported slight cooling rate
increase with increasing welding speed (203).
Page 207
189
Fig. 6.39 Optical micrograph showing the additional fusion lines in the
weld bead of last pass of 4 wire S A weld at 2.5kJ/mm heat input
and lOOOmm/min speed (2.5% nital etched, 16x).
200
e
e "« u
s 3 « _o
- Q — 2.5kJ/mm
-•— 5kJ/mm
- B — 10kJ/mm
Fig.
0 1000 2000 3000
Welding speed (mm/min)
6.40 Average prior austenite linear intercept grain size of the H A Z along the
fusion line as a function of welding speed for 4 wire S A welded
2 0 m m plate.
Page 208
190
Table 6.4 lists peak hardnesses of 4 wire S A weld H A Z s of 2 0 m m plate for different heat
inputs and welding speeds. These are averages based on 5 measurements and the 9 5 %
confidence limits for these means are also shown in Table 6.4. It can be seen that peak
hardness of the H A Z is not very sensitive to changing welding speed at constant heat
input.
As Figs. 6.34 and 6.35 show, HAZ toughness is similar to peak hardness in that it is not
sensitive to change in welding speed for both 20 and 5 0 m m thick plates.
There is insufficient data in Table 6.3 to indicate how the welding speed affects the tensile
properties of the weld. However, no significant difference in transverse tensile properties
existed for the two different welding speeds at 10 and 5kJ/mm, which suggests that only
a minor change in tensile properties is to be expected with changing welding speed.
6.5 SIMULATED HEAT AFFECTED ZONE
The Charpy impact energy and hardness results obtained from simulated HAZ samples
are presented in the following sections. They are firstly summarized in Table 6.5-6.8
which covers the results: for simulated single weld H A Z s heated to different peak
temperatures (Table 6.5); for second and third cycle reheated G C H A Z (Table 6.6); for
simulated G C H A Z at different heat inputs (Table 6.7); and for the P W H T treated
G C H A Z s (Table 6.8). These Tables provide the detailed data source for all the figures
related to the simulated H A Z . Fibrosity and lateral expansion of some simulated H A Z
Charpy samples are also listed in these Tables.
Page 209
191
Table 6.4 H A Z peak hardness of 4 wire S A welded 20mm CR HSLA 80 steel
Heat input (kJ/mm)
2.5
5
10
Welding speed (mm/min)
1000
1500
2000
1000
1500
2000
600
1000
1300
HVmax (5kg load)
228.6
229.9
220.2
221.8
218.5
215.6
215.7
212.6
211.3
95% confidence limit
222.7-234.5
223.4-236.4
215.9-224.5
214.2-229.4
213.3-223.7
213.0-218.2
207.3-224.2
206.4-218.8
203.2-219.4
Table 6.5 Charpy impact properties and hardness of simulated single weld H A Z at
equivalent heat input of 2.9kJ/mm (13.3°C/s)
Tpl
CQ 600
700
800
900
1020
1300
C V N (J)
(-51'Q
113, 185, 116
210, 210, 194
227, 217, 236
235, 223, 225
178, 162, 123
62, 124, 51
Mean
CVN
138
205
227
228
154
79
Fibrosity
(%)
98, 98, 100
-
100, 100, 100
-
100, 100, 90
30, 60, 30
Lat. Exp.
(mm)
1.32, 1.84
-
2.14, 1.9, 2.0
-
1.66, 1.7, 1.26
0.69, 1.32, 0.58
HV5
207
197
192
198.6
215.2
222.4
Page 210
Table 6.6 Charpy impact properties and hardnesses of simulated multi-pass H A Z
at equivalent heat input of 2.9kJ/mm (13.3°C/s)
Tpl =
1300'C
Tp2
Tp3
(Tp2 =
800°C)
Temp.
CC)
600
800
900
600
CVN (J)
(-51°C)
169, 90, 156
90, 140, 200
175, 153, 160
174, 146, 184
Mean
CVN
138
143
163
168
Fibrosity
(%)
-
45, 55,70
-
60,55
Lat. Exp.
(mm) -
0.99, 1.51, 2.02
-
1.87, 1.6
HV5 (av.)
212.6
220.2
208.4
218.4
Table 6.7 Charpy impact energies and hardnesses of simulated G C H A Z
(Tpl=1300°C) at various cooling rates (equivalent heat inputs)
Cooling rate CC/s)
Heat input (kJ/mm)
30.2
1.9
23.8
2.2
13.3
2.9
5.0
4.9
C V N (J)
(-51°C)
150, 59, 160
125, 70, 151
62, 124, 51
70, 52, 141
Mean
CVN
123
115
79
88
Fibrosity
(%)
-
60, 45, 55
30, 60, 30
-
Lat. Exp.
(mm)
-
1.3, 0.71, 1.51
0.69, 1.32,0.58
"
H V5
236.3
230.9
222.4
203.2
Page 211
193
Table 6.8 Charpy impact energies and hardnesses of simulated GC HAZ after
PWHT at various temperatures for 1 hour (equivalent heat input of
3.1kJ/mm)
PWHT Temp.
CC) 450
550
650
CVN (J)
(-51°C)
147, 144, 70
49, 19,19
160, 172, 160
Mean
CVN
120
29
164
HV5
216.8
242.7
209.6
Page 212
194
6.5.1 Single Pass H A Z
The microstructures of the various HAZ regions were simulated by applying single
thermal cycles with different peak temperatures (600-1300°C) to base material as
described in Chapter 5, Section 5.4.3.1. Figure 6.41 shows the simulated H A Z
microstructures for various peak temperatures. The cooling rate between 800-500°C was
13.3°C/s which corresponds to a heat input of 2.9kJ/mm. Comparison of the simulated
H A Z microstructure (Fig. 6.41) with that of the actual weld H A Z for a similar heat input
(Fig. 6.1) suggests that the microstructures of the actual H A Z have been successfully
simulated.
The hardness of the single thermal cycle simulated HAZ as a function of peak temperature
is shown in Fig. 6.42. The value near zero peak temperature in Fig. 6.41 is the hardness
value of the base metal. The bars in the figure represent the 9 5 % confidence limits for the
mean values. The hardness trend in Fig. 6.42 is similar to the hardness traverses across
the actual H A Z s as shown in Fig.6.6. As for Fig.6.6, Fig. 6.42 indicates that the peak
hardness of the H A Z occurred in the grain coarsened region near the fusion line
(Tp=1300°C). The minimum hardness, which is well below that of the base plate,
occurred in the partially transformed region (Tp=800°C). The low hardness zone also
extended beyond the apparent microstructural boundary of the H A Z (termination of
partially transformed region) to the tempered region (Tp=700oC) and into the unchanged
base material (Tp=600°C) due to the overaging of the copper-rich precipitates.
Charpy impact energies at -51°C for simulated HAZ structures of 20mm CR HSLA 80
steel are shown in Fig. 6.43 as a function of peak temperature. The values near zero peak
temperature represent the C V N energy of the C R H S L A 80 base plate. C V N values for
various peak temperatures exceeded the Military Standard concerned with the qualification
of submerged arc weld consumables for HY80/100 steels (47J at -51°C)(218). As peak
temperature increased, C V N energy increased to maximum values in the range of 800'C -
Page 213
195
(c)
(e)
Fig. 6.41 Optical microstructures of the simulated H A Z as a
function of peak temperature (Tpl) (2.9kJ/mm)(320x).
(a) Tpi=1300°C; (b) Tpi=900°C; (c) Tpi=800°C;
(d) Tpi=700°C; (e) Tpi=600°C.
Page 214
196
240
T—•—i—'—i—'—i—«—i—•—r 0 200 400 600 800 1000 1200 1400 1600
Peak temperature (Tpl)(°C)
Fig. 6.42 Hardness as a function of peak temperature (Tpl) for single cycle
simulated H A Z of 20mm C R HSLA 80 steel. The value near 0°C
represents the hardness of the base plate. (Bars represent 9 5 %
confidence limits)
u
e
«
a S a. *-ea JS
U
300
200"
100-
Q CVN1 • CVN2
• CVN3
- i — | — i — r 0 200 400 600 800 1000 1200 1400 1600
Peak temperature (Tpl)(°C)
Fig. 6.43 CVNvaluesforsimulatedHAZat-5rCasafunctionofpeak
temperature (Tpl). The values near 0°C show the impact values
of the base plate.
Page 215
197
900°C (partially transformed and grain refined regions), and decreased with further
increase in peak temperature. The grain coarsened H A Z region near the fusion line
showed the lowest C V N value. Overall, compared to the base plate, little deterioration of
toughness occurred for the H A Z sub-region structures, although the G C H A Z region
showed slightly lower values than the base plate.
Samples with higher CVN values showed higher amounts of fibrosity and lateral
expansion (Table 6.5). Except for a peak temperature of 1300°C, Charpy samples cycled
to peak temperatures from 600°C to 1020°C showed almost totally fibrous fracture
surfaces, consistent with the high impact toughness values (>113J at -5TC).
Figure 6.44 shows the typical fracture surfaces for lower (Fig. 6.44a) and higher peak
temperatures (Fig. 6.44b). Figure 6.45 is a schematic diagram which illustrates various
fracture zones for a typical fracture surface (219). It consists of shear lips at both sides of
the fracture surface; a tearing shear Up at the final fracture region; a ductile initiation zone
(Diz) adjacent to the notch which acts as a stress concentrator and a central area of brittle
and/or ductile fracture.
Shear lips at either side of the fracture surface are typically ductile as indicated by the
dimpled fracture appearance (Fig. 6.46). The tearing shear lip at the final fracture region
showed a similar fracture morphology except that the dimples were elongated and pointed
in the direction opposite to that of crack propagation (Fig. 6.47).
The Diz showed rough steps or bands under stereo-microscopy (Fig. 6.44) and in the
S E M image (Fig. 6.48). Elongated dimples were also found in this area (Fig. 6.49).
At lower peak temperatures (600°C and 800°C), the central part of the fracture surface
showed internal open lips parallel to the rolling direction as seen in Fig. 6.44a. S E M
examination of the matching sides of the lips indicated that some area exhibited a totally
Page 216
198
(a) (b)
(c)
Fig. 6.44 Fracture surface appearances of Charpy impact specimens (-50°C) of
simulated H A Z (2.9kJ/mm) for (a) Tpi=600°C, 115J; (b) Tpi=1020°C,
162J; (c) Tpi=1300°C, 62J.
Page 217
Notch
Ductile initiation zone (Diz)
Shear lips formed at both sides of the fracture surface
Tearing shear lip formed at the final fracture region
Central area of fracture
Fig. 6.45 Schematic diagram showing the various zones of the fracture surface of a Charpy impact specimen (ref.219).
&
i i i
Page 218
Fig. 6.46 S E M micrograph showing the dimpled appearance of the shear lips at
the side of the Charpy impact fracture surface (440x)(Tpi=1020DC,
162J at -50°C).
Fig. 6.47 Elongated dimples in tearing shear lip pointing towards the opposite
direction to that of fracture in the final fracture region (440x)
(Tpi=1020°C, 162J at -50°C).
Page 219
Fig. 6.48 S E M micrograph at low magnification showing the rough steps and
bands the in ductile initiation zone near the notch of the impact
specimen (66x). (Tpi=1020°C, 162J at -50°C)
m&b
Fig. 6.49 Elongated dimples in ductile initiation zone (440x)(Tpi=10208C,
162J at-50°C).
Page 220
202
dimpled appearance, corresponding to shear lips, other areas showed cleavage fracture
mode, indicating that these areas can be regarded as 'splits' (220). For a high peak
temperature where there were no internal splits or shear lips (Fig. 6.44b), and the central
part was predominantly transgranular cleavage type of fracture (Fig. 6.50).
The size of the ductile area (Diz and shear lips) varied with the peak temperature as did the
Charpy impact energy. Specimens with higher C V N values showed larger ductile areas.
A marked increase in thickness of the Diz accompanied the increase of C V N value with
decrease in peak temperature from 1300°C to 800°C.
6.5.2 Reheated Grain Coarsened HAZ Region
Overlapping of HAZs occurs in actual multi-pass welds. The microstructure and
properties of this reheated H A Z region is usually different to the single pass H A Z . The
properties of the reheated region are very important in terms of overall quality of the weld
joint. Since the grain coarsened region exhibits the lowest toughness of the various H A Z
regions, the effect of reheating of the G C H A Z has been investigated in the present work.
Changes in optical microstructure of the GCHAZ due to reheating to three different
temperatures is shown in Fig. 6.51. The three reheating temperatures (Tp2=600°C,
800°C and 900°C) were selected to correspond to the tempered, the partially transformed
and the grain refined regions, respectively.
No obvious microstructural changes occurred after reheating to 600°C, as expected, since
only tempering occurs at this temperature. However, compared to the structure before
reheating, the original M A islands (white etching) were darkened after reheating due to
the tempering of M A islands.
Page 221
203
irtk
Fig. 6.50 Transgranular cleavage type of fracture in central region of
fracture surface (440x)(Tpi=1020°C, 162J at -50°C).
Page 222
204
Fig. 6.51 Optical microstructures of simulated grain coarsened H A Z
region (2.9kJ/mm, Tpi=1300'C)(320x). (a) before reheating;
(b) TP2=600°C; (c) Tp2=800°C; (d) Tp2=9008C.
Page 223
205
Intercritical reheating to 800° C modified the granular bainitic structure of the original
single weld G C H A Z , by refining the structure and forming bands of M A islands. The
final structure was fine equiaxed ferrite grain with M A islands in discontinuous bands.
Further reheating to 600'C (Tp3) in a third cycle resulted in tempering of these M A
islands.
The microstructure of the GCHAZ after reheating to 900° C (temperature of grain
refinement) was similar to that reheated to 800"C, except that the M A islands were more
randomly distributed, and banding was less obvious.
The effect of the second thermal cycle on the hardness of the original GCHAZ
(Tpi=1300°C) is shown in Fig. 6.52 and Table 6.6. The hardness value before reheating
is plotted near zero temperature for comparison. It is obvious that the subsequent
reheating to all three peak temperatures reduced the hardness relative to that of the single
weld G C H A Z . The intercritically reheated G C H A Z (Tp2=800°C) showed the smallest
hardness reduction.
A third thermal cycle with peak temperature (Tp3) of 600°C (Table 6.6) showed little
effect on the hardness of the intercritically reheated G C H A Z (Tp2 of 800°C).
Figure 6.53 and Table 6.6 shows Charpy impact energies (CVN) at -51°C for double
thermal cycled original G C H A Z specimens. The impact values near zero temperature
represent the results before the second thermal treatment, which corresponds to a single
cycle to Tpi=1300°C.
Little difference was found amongst the CVN values for the three second peak
temperatures of 600°C, 800°C and 900"C. The impact values were lower than those
resulting from a single cycle to the same peak temperature (Fig. 6.43), but the toughness
was slightly improved relative to the simulated G C H A Z before reheating (Fig. 6.53).
Page 224
240
230-> X % 220 <u e •o
u «
210-
200 0
Second peak temperature (°C)
Fig. 6.52 Hardness (HV5) of reheated GCHAZ as a function of second peak
temperature (Tp2). The value plotted near 0°C is for the unheated
GCHAZ (Tpi=1300°C). (Bars represent 95% confidence limits
of the means)
ex
s o>
a
a u 03 X!
u
iUU -
200 -
100-
0 -•
•
El
— ' 1 r
• •
•
1 ' 1
Tpl=1300°C
•
•
fi •
•
• l •
a CVN1 • CVN2 • CVN3
200 400 600 BOO 1000
Second peak temperature (°C)
Fig. 6.53 C V N values at -5 VC for the reheated G C H A Z as a function of
second peak temperature (Tp2). The values plotted near 0"C are
for the GCHAZ (Tpi=1300eC) with no reheating.
Page 225
207
C V N values for samples subjected to three heating cycles are given in Table 6.6. The
peak temperatures in this case were 1300°C (Tpi), 800°C (Tp2) and 600*C (Tp3).
Following the third thermal cycle with peak temperature of 600°C, the specimens did not
show any significant change in Charpy value compared to the double cycled specimens
(Table 6.6).
Examination of the fracture surfaces of doubly and triply cycled samples showed little
difference in morphology compared to samples subjected to a single cycle to 1300"C,
except that the size of the Diz and shear lips increased, consistent with the improved C V N
values.
6.5.3 The Effect of Heat Input
From the previous discussion, it is clear that the unreheated GCHAZ shows the lowest
impact toughness among single and multi-run weld HAZs. It is therefore regarded as
having the potential to govern the toughness of welded joints. O n this basis, the effect of
welding variables, and particularly heat input, on the properties of this region will be
significant in terms of weldability of this material.
Figure 6.54 shows the optical microstructure of the simulated GCHAZ (Tpi=1300°C) at
different heat inputs. The most significant microstructural change in G C H A Z with
increasing heat input is the coarsening of the structure. This result is consistent with the
actual B O P SA, F C A and 4 wire S A weld H A Z s , as discussed previously. Increasing
amounts of dark etching structure, identified as lath martensite in B O P F C A weld H A Z s
were found at lower heat inputs, as a result of faster cooling.
The effect of heat input on hardness of the simulated GCHAZ structure is shown in Fig.
6.55. Bars represent 9 5 % confidence limits on the mean values of 5 measurements.
Page 226
208
(a) (b)
§|$mt f§i fe $;^.v*^$&; S3
(c) (d)
Fig. 6.54 Microstructures of simulated G C H A Z s for a peak temperature of
1300'C and various equivalent heat inputs (320x). (a) 1.9kJ/mm;
(b) 2.2kJ/mm; (c) 2.9kJ/mm; (d) 4.9kJ/mm.
Page 227
209
1 2 3 4 Heat input (kJ/mm)
55 Hardness of simulated G C H A Z as a function of equivalent heat input.
The value plotted near OkJ/mm is for the base plate. (Bars represent
9 5 % confidence limits of the means)
Page 228
210
Similar to the results from actual weld HAZs, Fig. 6.55 indicates that lower H A Z
hardness resulted from higher heat input welding. The hardness of the simulated G C H A Z
at the lowest equivalent heat input (1.9kJ/mm) was only about 13 points higher than the
hardness of the base plate, and the G C H A Z at the highest heat input (4.9kJ/mm) was
about 20 points softer than the base plate.
Charpy impact energies for the simulated GCHAZ for different equivalent heat inputs is
summarized in Table 6.7. These C V N values are plotted as a function of heat input in
Fig. 6.56, together with the C V N values of the base plate for comparison. Similar to the
results obtained on actual 4 wire S A weld HAZs, Fig. 6.56 indicates that the impact
toughness of the G C H A Z is apparently insensitive to changing heat input, but a large
scatter exists in the C V N values.
6.5.4 The Effect of Postweld Heat Treatment
Postweld heat treatment (PWHT), or stress relief heat treatment, of both the base metal
and simulated G C H A Z (Tpl=1300°C) for 3.1kJ/mm equivalent heat input was carried
out at three temperatures (450, 550 and 650°C) for 1 hour. The effects of P W H T
temperature on the hardness of the simulated G C H A Z and the base plate are shown in
Table 6.8, Fig. 6.57 and Fig. 6.58.
For the simulated GCHAZ, the hardnesses before PWHT at slightly lower equivalent heat
input (2.9kJ/mm) are shown near the zero point of the temperature in Fig. 6.57. It can be
seen in Fig. 6.57 and Table 6.8 that the G C H A Z showed the maximum hardness after
P W H T at 550° C. The hardness value in this case was higher than that before P W H T and
higher than that of the base metal (-222HV5). P W H T at 450 and 650°C resulted in a
reduced hardness in the G C H A Z .
Page 229
211
6X3 U 4>
e a «
a S a «
U
^uu -i
180-
160 -
140 -
120-
100 -
BO ;
60 -
40 -
20 -
•
•
a
0
•
•
3
1 2
•
•
3 Heat input (kJ/mm)
4
•
• •
. 5
CVN1 CVN2 CVN3
Fig. 6.56 C V N values at -51°C of simulated G C H A Z as a function of equivalent
heat input. The values near 0"C are for the base plate.
> X
a •o u «
X
zou -
250-
240 -
230'
220-
210*
200 -
190 "
180 -
T •
• 1 —
T
I
• 1 •"
¥ J,
1
T a i
1
200 400 600
PWHT temperature CO
800
Fig. 6.57 Hardness of simulated G C H A Z at 3. lkJ/mm equivalent heat input as
a function of PWHT temperature for 1 hour. The value near 0*C is for
the GCHAZ (Tpi=1300°C) before PWHT. (Bars represent 95%
confidence limits of the means)
Page 230
>
S o> C •a
ca
230
220 ~
0 200 400 600 800
Postweld heat treatment temperature (°C)
Fig. 6.58 Hardness of the base plate as a function of P W H T temperature
for 1 hour. The value plotted near 0°C is for the base plate prior
to PWHT. (Bars represent 95% confidence limits of the means)
Page 231
213
P W H T reduced the hardness of the base material (Fig. 6.58), with the higher the P W H T
temperature, the lower the hardness of the base metal.
Figure 6.59 and Table 6.8 show the CVN values at -51°C as a function of PWHT
temperature for simulated G C H A Z samples (Tpi=1300°C). The Charpy energy of the
G C H A Z before P W H T is shown near the zero point of the temperature axis for
comparison.
It can be seen that impact toughness showed the opposite trend to that of hardness with
P W H T temperature. The lowest C V N value occurred after P W H T at 550°C. The C V N
value in this case is much lower than that before P W H T and lower than that of the base
plate. The toughness of the G C H A Z was improved after P W H T at 450°C and 650°C,
especially at the higher temperature.
The fracture surfaces of Charpy samples for the simulated GCHAZ after PWHT were
examined by stereo-microscopy. As for the samples with single thermal cycle HAZs
(Section 6.5.1), the fracture surface of the simulated G C H A Z specimens after P W H T
also consisted of four typical zones as shown in Fig. 6.45. Samples with lower C V N
values showed a narrower Diz and a smaller area of shear lips at both sides and tearing
shear lips at the final fracture region. Almost no Diz and shear lips were observed in
samples after P W H T at 550°C for 1 hour. The central area of each sample after P W H T
exhibited a similar fracture mode, consisting of transgranular cleavage type fracture.
6.6 CONTINUOUS COOLING TRANSFORMATION DIAGRAMS
For the 20mm CR HSLA 80 steel plate, a partial continuous cooling transformation
(CCT) diagram of the G C H A Z was obtained by measuring the start, 5 0 % and finish
transformation temperatures on cooling curves at different cooling rates (Fig. 6.60). The
Page 232
U ii
s ii
250
w 200 -
08
a S :*>
a 03
U
150-
100-
50-'
Temperature (°C)
• CVN1 • CVN2 a CVN3
800
6.59 CVN values at -50°C of simulated GCHAZ at 3. lkJ/mm equivalent
heat input as a function of PWHT temperature for 1 hour. The
values near 0°C are for the GCHAZ (Tpi=1300°C) before PWHT.
800
^ 700
ii
u 3 03 U ii
a E 4)
H
600 -
500 -
400 -
300
Tp=1300°C
2.9 4.9kJ/mm
2.2
1.9 /O- >
•V
203HV
222
236 231
i i i 111 ii| i i i 111 ii|
.1 1 10
Time (seconds)
• 1 1 • I I i |
-H- Ts -•- T50%
~a~ Tf
100 I I I I III
1000
6.60 Partial CCT diagram of GCHAZ for 20mm CR HSLA 80 steel.
Peak temperature Tp=1300°C.
Page 233
215
peak re-austenitising temperature was 1300°C and the equivalent heat input ranged
between 1.9 to 4.9kJ/mm corresponding to cooling rates (800-500°C) of 30.2-5.0°C/s.
Microstructure, hardness and toughness for various heat inputs are reported in Section
6.5.3.
To study the influence of Cu and Ni alloying elements on HAZ transformation behaviour,
a similar partial C C T diagram was prepared for a reference steel: a low carbon equivalent
(LCE) 350 M P a grade steel (Fig. 6.61), which has a similar chemical composition except
for much lower Cu and Ni contents (Table 5.3). The same peak temperature (1300°C)
was used as for the C R H S L A 80 steel. The heat input range in this case was 1.8-
4.8kJ/mm, corresponding to cooling rates of 32.6-5.1°C/s. Compared to Fig. 6.60, the
L C E 350 M P a grade steel showed a lower v->a transformation temperatures for heating
and cooling conditions simulating those of the G C H A Z .
The hardness of the simulated GCHAZ of the LCE 350 MPa steel for different equivalent
heat inputs is shown in Fig. 6.62. Compared to Fig. 6.55, the L C E 350 M P a steel
showed a lower G C H A Z hardness than that of the C R H S L A 80 steel for a similar heat
input.
Optical microstructures of the GCHAZ at different heat inputs for LCE 350 steel (Fig.
6.63) are similar to those of the C R H S L A 80 steel (Fig. 6.54). However, much of the
high carbon island constituent is diffusional transformation product (pearlite or bainite) as
shown by the dark etching particles, whereas for the C R H S L A 80 steel, most of the
islands were white etching (Fig. 6.54), indicating the non-diffusional M A product. The
formation of M A islands in the C R H S L A 80 steel is associated with the lower y->a
transformation temperature and the higher carbon equivalent (CE). The M A islands
contribute to the higher hardness obtained in the G C H A Z of this steel.
Page 234
fj
800
700
ii
a 600 03
u ii
g 500 H
400 -
300 .1
Tp=1300°C 2.8
4.8kj/mm
I90HV / 204
207
224
i i i 11 i i | i i i i i iiig i i i i i i n
-a- Ts
••••• T50Z
-o- Tf
1 10
Time (seconds)
100 1000
Fig. 6.61 Partial C C T diagram of G C H A Z for 20mm L C E 350 steel.
Peak temperature Tp=1300°C.
>
W
s C3
X
240
1 2 3
Heat input (kJ/mm)
Fig. 6.62 Hardness of the simulated G C H A Z of LCE 350 steel as a function of
equivalent heat input The value near OkJ/mm is for the base plate.
(Bars represent 9 5 % confidence limits of the means)
Page 235
217
(c)
Fig. 6.63 Microstructures of simulated G C H A Z at different heat inputs
for L C E 350 steel (320x). (a) 1.8kJ/mm; (b) 2.2kJ/mm;
(c) 2.8kJ/mm; (d) 4.8kJ/mm.
Page 236
CHAPTER 7
DISCUSSION
Page 237
219
7.1 I N T R O D U C T I O N
In understanding and optimizing the weldability of a steel in terms of HAZ properties, it
is very important to analyse the inter-relationships between H A Z structure, properties and
welding conditions. In this Chapter, the experimental results presented in Chapter 6 are
discussed in four sections. In each section, an attempt is made to characterise the
relationship between structure and properties of the H A Z . A summary is given at the end
of each section.
Because a structure gradient exists across the HAZ, the properties at different positions of
the H A Z vary. The structures and properties of the various H A Z regions are discussed in
Section 7.2, with the aim of establishing the region or regions which exert the greatest
influence on the overall H A Z properties. The hardness and H A Z width variation along the
fusion line and with heat input for B O P S A welds is discussed in Section 7.3.
In Section 7.4, the effect of various factors associated with the welding process on the
H A Z structure and properties are considered. These factors include multi-pass welding
(Section 7.4.1), heat input (Section 7.4.2), welding speed (Section 7.4.3) and postweld
heat treatment (Section 7.4.4).
Finally, the y->a phase transformation behaviour of the grain coarsened HAZ region is
discussed in Section 7.5. The partial H A Z C C T diagram for the C R H S L A 80 is
presented in Section 7.5.1 and is compared with the diagram for low carbon equivalent
(LCE) 350 steel (Section 7.5.3) to assess the effect of copper and nickel on
transformation of austenite in the H A Z . The properties of the G C H A Z are summarised in
Section 7.5.2.
Page 238
220
7.2 STRUCTURE A N D PROPERTIES OF THE H A Z OF SINGLE PASS ACTUAL
AND SIMULATED WELD
Hardness traverses across the actual and simulated HAZ indicated that peak hardness
occurred in the grain coarsened region (GCHAZ), and the partially transformed region
showed the minimum hardness which was well below that of the base material (Figs. 6.6
and 6.42). Most of the H A Z was softer than the base material. To explain the softening of
the HAZ, it is necessary to discuss the Cu precipitation hardening behaviour in the HAZ,
since the softer H A Z is attributed to the different state of Cu precipitation in the HAZ and
base plate.
Since the solubility of Cu in austenite is higher than in ferrite (Fig. 7.1), relatively fast
cooling from high temperature retains much of the Cu in supersaturated solid solution in
ferrite. Subsequent aging to produce a fine dispersion of Cu clusters in the ferrite matrix
produces a considerable increase in hardness and strength. It has been reported that
coherent metastable b.c.c precipitates (Cu clusters or G.P. zones) contribute strongly to
the precipitation hardening (175,221). These Cu clusters are not resolved in the electron
microscope because they are either too small to be seen by TEM (222,223) or the contrast
between Cu clusters and the ferrite matrix is low due to the similarity of the scattering
factors of iron and copper and negligible strains are produced by the precipitate (224).
Particles visible by TEM are overaged Cu clusters which are f.c.c e-Cu particles.
In the GCHAZ and grain refined (GR) HAZ regions, complete austenitisation occurs. As
a result, Cu precipitates in the ferrite of the base metal re-dissolve during cc^y
transformation because of the higher solubility of Cu in austenite. Whether or not re-
precipitation of Cu occurs in the H A Z during cooling after welding is dependent upon the
cooling rate of the HAZ. The observation of e-Cu precipitates in the G C H A Z and
G R H A Z (Fig. 6.3b and 6.3c) in the present research suggests that reprecipitation of Cu
Page 239
C O P P E R , WEIGHT PERCENT.
Fig. 7.1 Partial Fe-Cu phase diagram illustrating the solubility of Cu in Fe
(ref.225).
Page 240
222
occurred in the H A Z during cooling for the welding conditions investigated. Cu particles
were uniformly distributed in the ferrite matrix rather than preferentially on dislocations
(Fig. 6.3). This observation is consistent with reports by several investigators (174,175).
Hornbogen (226) concluded that the probability of dislocation and matrix nucleation of
the f.c.c phase at temperatures below 700°C is almost equal due to a low strain energy
term for nucleation. This factor leads to the uniform distribution of particles. The
Kurdjumov-Sachs (K-S) orientation relationship between e-Cu particles and the ferrite
matrix (Fig. 6.3e and 6.3f) also indicated that Cu-rich coherent b.c.c. metastable
precipitates (clusters) occur initially, and then transform in situ into f.c.c. e-Cu particles
(226).
Although Cu reprecipitation occurred in the HAZ during cooling, the resulting
rehardening was very minor compared to the precipitation hardening generated by aging
heat treatment of the base plate (at 550°C for 1/2 hour). This difference arises because of
different cooling rates in T M C P and after welding, and the absence of an aging heat
treatment in the case of the welded samples. The higher hardness in the G C H A Z than the
G R H A Z is attributed to the coarse prior austenite grain size which increases the
hardenability, resulting in a coarse ferrite lath structure (comparing Fig. 6.1a to 6.1b)
with a higher volume fraction of M A islands than other regions of the H A Z (Fig. 6.4).
The partially transformed region had the lowest hardness in the HAZ. The hardness value
in this region was well below that of the base material. A similar result was reported for
gas tungsten arc (16) and submerged arc welded (9) Q & A A710 steel. Compared to the
base metal, the significant loss of hardness is attributable to the overaging of C u clusters
in untransformed ferrite, and re-solution of Cu precipitates in austenitised regions (as in
the G C H A Z and G R H A Z ) . Heating by the weld thermal cycle to a peak temperature
between A(rl) - A(r3) ensured rapid overaging of Cu clusters in the untransformed ferrite
grains, as shown by the coarse e-Cu particles in Fig. 6.3d. Re-austenitised regions
transformed on cooling to ferrite and M A islands which are supersaturated with Cu.
Page 241
223
Although austenite transformation does not occur in the tempered and apparently
unchanged base metal regions, the reduced hardness compared with the base material is
due to overaging of Cu clusters. The softening is demonstrated in Fig.6.6 for the B O P
S A welds and in Fig. 6.42 for Tpl of 600 and 700'C in simulated weld H A Z samples.
Furthermore, there is a contribution to softening by degradation of lamellar pearlite to
spheroidal particles of carbide in the tempered H A Z region.
CVN values for various HAZ regions exhibited the opposite trend to hardness, i.e. a
higher hardness was associated with a lower impact toughness value (Figs. 6.42 and
6.43). This result confirms a commonly accepted conclusion drawn by many
investigators that harder structures generally show a lower toughness (99,131).
The GCHAZ showed the lowest CVN value and the highest hardness of the various sub-
regions. The relatively low toughness in this region results from a structure with the
highest volume fraction of M A islands (Fig. 6.4) which contribute to the higher hardness
of this region. The deterioration in toughness associated with the M A islands has been
reported previously (55,67), as discussed in Chapter 3, Section 3.4.2.2. The fact that an
increasing volume fraction of M A islands causes significant reduction of toughness is
also widely accepted (53,67). In addition, the relatively low toughness of the G C H A Z is
also associated with the presence of the high carbon, twinned martensite of the M A
islands (Fig. 6.2). Twinned martensite has been reported to be one of the micTostructural
constituents which is most detrimental to toughness (155).
However, compared to the base plate, little or no deterioration in toughness occurred in
the simulated H A Z structures (Fig. 6.43) for the present steel. The high H A Z toughness
of this steel is consistent with work reported on other steels based on the A S T M A710
steel composition (see Chapter 4, Section 4.4.4). The toughness is associated with the
Page 242
224
much lower carbon content and carbon equivalent of the A710 steels than conventional
steels of same grade (e.g. H Y 80). As a result, a tough ferritic structure is formed in the
H A Z . In the present steel, the high H A Z toughness may also attributed to the grain
refining influence of TiN which restricts grain growth in the G C H A Z .
Significant degradation of toughness in the partially transformed region and the
intercritically reheated G C H A Z has been demonstrated by several authors (55,67) in
offshore structural and low carbon microalloyed steels. The deterioration of toughness in
both regions was reported to be related to the formation of M A islands.
In contrast, simulated HAZ structures for the present steel showed the highest toughness
in the partially transformed region and improved toughness in the intercritically reheated
G C H A Z (Fig. 6.43 and 6.53), despite the presence of M A islands. Charpy impact
energies in both regions were higher than in the base plate. This result is associated with
the low hardness in both regions as the result of loss of the Cu precipitation hardening.
The better toughness in both regions may also associated with the low carbon content of
the steel and the generally low volume fraction of M A islands in the H A Z .
The hardness and structure of the MA islands are influenced strongly by the carbon
content. The carbon content in the present steel (0.055%C) is low compared to the steels
mentioned above which showed low C V N values in both the partially transformed and
intercritically reheated G C H A Z regions (>0.08%C). Therefore, the volume fraction
and/or the carbon content of the M A islands must be lower in the present steel. Thus the
hardness is expected to be lower, and provided that the M A islands are not
morphologically unfavourable, a higher toughness should be exhibited. Coarse interfacial
plates of brittle constituents are unfavourable morphologies with respect to toughness.
Quantitative metallography indicated that the M A islands in the G C H A Z of B O P S A
welds had an average maximum dimension of about 1 p m (Fig. 6.11), although particles
Page 243
225
up to 15pm were measured. The fine M A islands are consistent with the relatively high
measured toughness in the partially transformed region.
The CVN impact properties of the partially transformed HAZ region has been reported to
be closely related to the volume fraction of M A islands (67), with high volume fractions
resulting in lower toughness in this region. It has been found from investigations of
several types of steels that the toughness in this region starts to deteriorate when the
volume fraction of M A islands exceeds a critical value of about 6 % (67). In the present
case, both bead-on-plate S A welds (Fig. 6.4) and 4 wire S A welds H A Z s (Fig. 6.29a)
showed that the volume fraction of M A islands in the G C H A Z is about 6 % or lower and
is relatively insensitive to changes in heat input and welding process. Since the volume
fraction of M A islands decreased from the G C H A Z to the partially transformed region,
the volume fraction in the partially transformed region for the various welding conditions
examined was much lower than the critical value of 6%.
In summary, high HAZ toughness was obtained for all major regions of the HAZ of
simulated weld structures in the C R H S L A 80 steel, consistent with relatively high C V N
values in the H A Z of actual welds. The overall high H A Z toughness of this steel is
associated with the low carbon content and carbon equivalent and the grain refining effect
of Ti, all of which result in a low volume fraction of M A island in the H A Z . In addition,
the high toughness of the H A Z relative to the base plate is associated with the softening
caused by the loss of Cu precipitation hardening.
The critical region governing the toughness of the HAZ is considered to be the GCHAZ.
The relatively low toughness in this region is the result of its higher hardenability which
results in a microstructure of coarse ferrite sideplates and a relatively high volume fraction
of M A islands. The partially transformed and grain refined regions exhibited highest
toughness and lowest hardness values because of the grain refinement and maximum loss
of hardness in these regions.
Page 244
226
7.3 HARDNESS AND HAZ WIDTH VARIATION ALONG THE FUSION LINE OF
BOP SA WELDS
The variation of HAZ width along the fusion line is significant as shown in Fig. 6.9 for
the three different positions (a, b and c). Variation in width was also marked with
changing heat input with the average H A Z width increasing with increasing heat input.
Since high heat input is associated with slow cooling rate (equations (2.9) and (2.11)), it
is inferred that a wide H A Z corresponds to a slow H A Z cooling rate.
For welds at different heat inputs, the relationship between cooling rate («=l/At8-5) and
width of H A Z can be deduced from Rosenthal's equations.
For thick and thin plate, equations (7.1) and (7.2) apply to a certain fixed position from
the heat source as defined by a radial distance r (17),
Tp-To=(|)-SL (7.1) 7ie pcr2
T p - T o= t e ) 2.N.1/2 H I (7.2) dpc2r
where Tp refers to the peak temperature (in K) of the thermal cycle and e is the base of
natural logarithms (=2.718); HI (J/m) is heat input; pc is the specific heat per unit volume
in Jm^K-1 and d is the thickness of the plate.
The HAZ width is roughly equal to the difference in r (Ar) between Tisoo'C and T700°c.
From equations (7.1) and (7.2), the following relationship exists between the width of
the H A Z (X) and the heat input (HI) for thick and thin plates, respectively.
Page 245
227
X oc HI1/* ( 7 3 )
X - HI (7.4)
The above equations, (7.3) and (7.4), suggest that at a constant heat input, the HAZ
width is constant. This is obviously not true since significant variation of H A Z width is
observed around the periphery of B O P S A and F C A welds (Fig. 6.9 and 6.22). This
observation indicates that the Rosenthal approach, based on 'a moving point heat source',
is an oversimplification of the complex phenomenon of arc welding in which the heat
source is extended and variable in shape. Therefore, the above equations can only strictly
be applied at similar H A Z position for different heat inputs.
The following equations have been developed to relate At8-5 and heat input (Chapter 2),
For thick plate,
At8-5 = - ^ L . (2.9) 2JCA.0I
where X is the thermal conductivity, and 01 is defined by equation (2.10)
01 _(773-To ' 1073-W (2'10)
For the thin plate case,
At8.5 = ^ S £ - (2.H) 47tXpc022dz
- L = 1 . 1 (2.12) 0 2
2 (773-T0)2 (1073-To)2
Page 246
228
The relationship between H A Z width and cooling time (At8-5), for both the thick and thin
plate cases, is
X oc (AtS-5)1/2 (7.5)
Therefore, it is concluded that for welds of different heat inputs, the HAZ width at a
given position is proportional to the square root of cooling time At8-5, and is therefore
inversely proportional to the square root of cooling rate, with a wider H A Z corresponding
to a slower cooling rate.
The wider HAZ, the coarser structure in the GCHAZ and the lower HAZ peak hardness
(Figs. 6.9, 6.10 and 6.14) at higher heat input for the B O P S A welds are consistent with
Rosenthal's equations (2.9) and (2.11) for At8-5 and the derived equations (7.3), (7.4)
and (7.5), for corresponding positions in welds of different heat inputs.
However, the significant variation of HAZ width from position a to c for the BOP SA
welds (a ratio of 2.5:1) indicates that the local cooling rate in the H A Z varies at different
positions along the fusion line.
Since the HAZ maximum hardness correlates approximately with cooling rate (17),
which is inversely proportional to the square of H A Z width (X2) (equation (7.5)), the
maximum hardnesses at different positions along the fusion line and for the three heat
inputs can therefore be replotted as a function of the inverse square of H A Z width (Fig.
7.2). The dashed curves in Fig. 7.2 show the variation of hardness with heat input for
corresponding positions in the H A Z , and therefore give similar information to Fig. 6.14.
As can be seen in Fig. 7.2, the change in cooling rate («= 1/X2) with heat input at a certain
position is relatively small compared to that with changing positions (a-»b-»c) at a certain
heat input. Similar results are obtained from the change in prior austenite grain size (Fig.
7.3). For position a, for example, the grain size changed from 80 to 100 p m as the heat
Page 247
229
on o ©
cu c •n
u 03
03
a CU
260
250
240-
230-
220-
210 0.0 0.3
1/square of X
Fig. 7.2 Mean peak hardness as a function of inverse of square of HAZ width
(X). Heat inputs and sampling positions are indicated.
1.80
,—N
E n *— <u N .— CO C 03 u B£ CU •<-<
s cu ^•"*
Cfl 3 «<
160
140
120
100
80
60
H position a
• position c
Heat input (kJ/mm)
Fig. 7.3 Mean austenite grain size at positions a and c in the grain coarsened
region of the H A Z , as a function of heat input
Page 248
230
input increased from 2.5 to 6kJ/mm. It is inferred that since the prior austenite grain size
is similar, the increase in cooling rate associated with decreasing heat input dominates in
determining the hardness trend for corresponding positions in the G C H A Z . The higher
cooling rate at lower heat input does not substantially change hardenability, since the
volume fraction of M A islands is largely independent of heat input (Fig. 6.4), but it
stimulates a higher nucleation rate, refinement of the ferrite laths and corresponding
refinement of the interlath regions of M A constituent (Fig. 6.10).
The full curves in Fig. 7.2 give the variation in hardness with cooling rate at the three
sampling positions within the one sample (i.e. at constant heat input). It should be
emphasized again that the square of H A Z width (X2) variation is much greater within a
sample than for varying heat input over the range studied (Fig. 7.2). It follows that the
cooling rate variation with position within a sample (at constant heat input) is greater than
that effected by changing the heat input In general, the full curves trend slightly
downwards with increased cooling rate from position c to a. T w o counteractive effects on
hardenability should be considered to explain the hardness trend. They are the cooling
rate and austenite grain size. From position c to a, cooling rate increased strongly (Fig.
7.2) and austenite grain size decreased substantially (Fig. 7.3). These two effects are
counteractive in terms of hardenability, and it is inferred that grain size is over-riding in
this case, resulting in a higher hardness at position c, at least for the two lower heat
inputs. Another possible influence is the greater extent of solution of Cu, N b ( C N ) and
TiN at position c because of a longer dwell time at elevated temperature. The subsequent
lower cooling rate then allows re-precipitation of these species and consequent re-
hardening. Thus, the local hardness in the H A Z will be determined by the complex
interactions amongst the austenite grain surface area, the extent of solution of hardening
species, the cooling rate, the amount and type of re-precipitation and the nature of the
austenite transformation product.
Page 249
231
The width of the softened zone (defined as the region with hardness less than the base
plate level of 215 H V 1 ) is plotted as a function of heat input in Fig. 6.7. This width
increased with heat input and with change in sampling position from a-*b-» c, as a result
of the decreasing cooling rate. Slow cooling increases the volume of material which is
softened by overaging and/or re-solution of copper. For the 4.0 and 6.0kJ/mm welds, the
softened zone extended for 4-6.5 m m in positions b and c (Fig. 6.6) and the transverse
tensile properties could therefore be adversely affected, as was confirmed for the 4 wire
S A welds (see Section 7.4).
7.4 FACTORS AFFECTING THE HAZ STRUCTURE AND PROPERTIES
7.4.1 Effect of Multi-pass Welding
7.4.1.1 Intercritical reheating of BOP SA welds
The microstructure of the intercritically reheated actual and simulated GCHAZ consisted
of bands of small M A islands in a matrix of refined and more equiaxed ferrite grains than
in the G C H A Z (Fig. 6.15). The tendency of the M A islands to be distributed in bands is
shown in Figs. 6.16 and 6.17, suggesting the preferential nucleation of austenite in
original pearlite band areas of the base plate where there the carbon and alloying element
contents are higher (227).
The preferential nucleation of austenite in the original pearlite band sites in the
intercritically reheated G C H A Z clearly indicates that even in the G C H A Z , complete
redistribution of carbon and alloying elements did not occur. The lower A(c3) temperature
due to the higher carbon and alloy contents allows the original pearlite band regions to
Page 250
232
revert to austenite first on reheating. The more uniformly distributed M A islands in the
intercriticaUy reheated G C H A Z produced at higher heat input (Fig. 6.15) suggests that the
low cooling rate (at higher heat input) allowed longer time at high temperature for the
redistribution of carbon and alloying elements, thus resulting in a less segregated
structure.
In analysing the effect of intercritical reheating on the hardness of the GCHAZ, two
factors need to be considered. They are hardening due to Cu-rich precipitate hardening of
ferrite during cooling and softening caused by the microstructural change from a coarse
granular structure to a mixture of fine equiaxed ferrite and a lower volume fraction of M A
islands (Fig. 6.15). The relatively unchanged hardness of the G C H A Z after reheating to
800°C (Fig. 6.20) for the B O P S A weld H A Z s indicates balancing of these two
counteractive factors.
7.4.1.2 Subcritical reheating of BOP SA welds
For reheated BOP SA welds, the hardness of the GCHAZ was raised for the lowest heat
input (2.5kJ/mm) after reheating to 600° C (subcritical reheating), whereas for the higher
heat inputs (4 and 6kJ/rnrn), there was relatively little change in hardness of the G C H A Z
after subcritical reheating (Fig. 6.20).
In the case of subcritical reheating of the 4 and 6 kJ/mm welds, any Cu precipitation
hardening in the G C H A Z was counteracted by the softening due to the tempering of M A
islands, as shown by T E M (Fig. 6.19). For the 2.5kJ/mm heat input a higher level of
supersaturation of C u resulted after the first weld thermal cycle because of the faster
cooling rate at lower heat input (compared to 4 and 6kJ/mm). Thus, during subcritical
reheating, more significant precipitation hardening was induced, resulting in an increase
in hardness compared to that of the original G C H A Z . This result implies that some
Page 251
233
deterioration of toughness may occur in the subcritically reheated G C H A Z after applying
a second weld pass to an original H A Z produced by a low heat input.
7.4.1.3 Intercritically and subcritically reheated simulated GCHAZ
Both intercritical (Tp2 = 800° C) and subcritical reheating (Tp2 = 600° C) of the simulated
G C H A Z resulted in a reduction of hardness (Fig. 6.52). This result is different to that of
the reheated B O P S A welds (Section 7.3.1.1 and 7.3.1.2). In the case of B O P S A welds,
after subcritical reheating, the H A Z associated with the lowest heat input (2.5kJ/mm)
showed an increase in hardness, while relatively little change in hardness occurred for
H A Z s produced by higher heat inputs (4 and 6kJ/mm). A relatively unchanged hardness
of the G C H A Z was also found in all three B O P S A weld H A Z s after intercritical
reheating. The different hardness changes after reheating between B O P S A weld
G C H A Z s and simulated G C H A Z may be due to the different heating and cooling rates
associated with the second thermal cycles in the two cases.
For the simulated GCHAZ, the cooling rate between 800-500°C for the second thermal
cycle was 13.3°C/s, which is much higher than that in the case of B O P S A welds
(3.8°C/s). The faster cooling rate of the second thermal cycle induced less re-precipitation
hardening by C u in the ferrite of the G C H A Z after reheating to 600°C or 800°C. As a
result the overall effect of reheating to 600°C and 800°C on the simulated G C H A Z was a
reduction of hardness in this region.
The softening of the simulated GCHAZ after reheating to 900°C is due to the change of
the structure from a mixture of coarse ferrite laths and M A islands to fine equiaxed ferrite
grains and a lower volume fraction of fine M A islands, aligned in bands (Fig. 6.51).
Page 252
234
Impact toughness was improved after reheating the simulated G C H A Z to the three
temperatures (600,800 and 900°C)(Fig. 6.53). The improved toughness is the result of
the softening after reheating (Fig. 6.52), and also to grain refinement in the case of the
reheating to 800 and 900°C.
In work reported on significant loss of toughness in the intercritically reheated GCHAZ
(55,67), the M A islands were reported to be distributed along the prior austenite grain
boundaries. Since the grain boundaries are weaker than the grain interiors, the
intergranular M A islands weaken the grain boundaries, causing embrittlement. For the
present C R H S L A 80 steel, the M A islands were present in bands after intercritical
reheating. The difference in the location of the M A islands may explain the relatively high
toughness in the present steel. Furthermore, the resistance to significant deterioration of
toughness in this region is due mainly to the low carbon content of this steel and the low
volume fraction of M A islands in the H A Z .
7.4.1.4 Summary
The reheating of the simulated GCHAZ to tempering (600°C), partial transformation
(800°C) and grain refining (900°C) temperatures improved the toughness and reduced the
hardness of the original G C H A Z at a cooling rate (between 800-500°C) of 13.3°C/s
(equivalent heat input of 2.9kJ/mm). However, significant rehardening could occur if a
low heat input weld were followed by a second weld thermal cycle with a low cooling
rate (associated with either first pass preheating or a higher second pass heat input).
Page 253
235
7.4.2 Effect of Heat Input
7.4.2.1 Weld profile and HAZ width
The effect of heat input on weld profile and HAZ width is shown in Figs.
6.8,6.9,6.21,6.22, and 6.27. The weld profiles were similar for the bead-on-plate and 4
wire S A welds, but the F C A welds showed a markedly different weld profile, which is
associated with the different type of welding process. A n increase in the size of the weld
bead and the width of the H A Z with increasing heat input is evident in the F C A welds.
The larger weld bead for a higher heat input in both types of welds is consistent with the
higher energy input per unit length which results in a larger volume of weld metal. The
wide H A Z associated with high heat input is consistent with the equations (7.3) and
(7.4), deduced from Rosenthal's equations (Section 7.3). The wider H A Z for higher heat
input indicates slower H A Z cooling rate (equation (7.5)).
Despite low heat input, the BOP FCA welds had a wider HAZ than the BOP S A welds
(Fig. 6.9 and 6.22). However, the optical microstructures of the G C H A Z for the two
types of welds (Fig. 6.10 and Fig. 6.23) showed that a higher cooling rate appeared to be
associated with the F C A weld H A Z s , as indicated by finer structure and higher
percentage of the dark etching lath martensite. The faster cooling rates of the F C A weld
H A Z s are also reflected by the much higher H A Z peak hardness than for the S A welds
(Fig. 6.33).
Compared to the BOP SA welds (Fig. 6.8), the BOP FCA welds (Fig. 6.21) showed
much shallower weld penetration and a wider weld bead. The heat flow direction from the
molten weld pool for the F C A welds is, therefore, towards the bottom of the plate,
whereas for the S A welds, the deep weld penetration allows the heat flow to be three
dimensional. The heat from the molten weld pool in the case of S A welds was largely
Page 254
236
extracted by the 'infinite' volume of metal in the direction parallel to the surface, whereas
heat flow in the F C A welds was directed towards the 'finite' volume of metal bounded by
the bottom surface of the plate. However, compared to the S A weld HAZs, the initial
cooling rate of F C A weld H A Z s was high because of the low heat input and the
distributed heat source. Although heat was extracted quickly in the initial stages, the
cooling rate of the H A Z at a later stage of the cooling cycle was reduced due to warming
up of the plate. The slow down in the cooling rate thus resulted in a wide H A Z for the
B O P F C A welds.
7.4.2.2 HAZ peak hardness
The changes of HAZ peak hardness with heat input are discussed in Section 7.3 for the
B O P S A welds. Figure 6.33 shows the hardness change with heat input for the three
types of actual welds and in Fig. 6.55 for the simulated G C H A Z . In all cases, a lower
heat input resulted in a higher peak hardness of the H A Z . This observation is consistent
with a faster cooling rate of the H A Z at lower heat input, which results in a harder H A Z
structure due to structural refinement and increased amount of lath martensite (Figs. 6.10,
6.23, 6.28 and 6.54). The higher G C H A Z hardness for lower heat input is associated
with a lower y->a transformation temperature, as shown by the partial C C T diagram for
the G C H A Z (Fig. 6.60).
7.4.2.3 H A Z impact toughness
In spite of the increase in hardness with decreasing heat input, toughness did not change
substantially with heat input for simulated G C H A Z structures produced at equivalent heat
inputs between 1.9-4.9kJ/mm (Fig. 6.55). A similar trend was observed for 4 wire S A
Page 255
237
weld H A Z s with heat inputs of 2.5-10kJ/mm for 20 and 5 0 m m plates (Table 6.2, Figs
6.34 and 6.35). In general, this result can be explained on the basis of the effects on
toughness of hardening and structural refinement at lower heat inputs; and softening and
structural coarsening at higher heat inputs (Section 3.4.3).
It is evident that at high heat input, the slow cooling rates produce relatively coarse
microstructural constituents which limit the cleavage resistance (Section 3.4.2), despite
the low H A Z hardness. The coarse structure at higher heat input is indicated by larger
average prior austenite grain size in the G C H A Z along the fusion line of the actual welds
(Figs. 6.13, 6.25 and 6.30); and the low number density (Fig. 6.5) and relatively high
m a x i m u m dimension of the M A islands (Figs. 6.11 and 6.29b). The optical
micTOStructures shown in Figs. 6.10, 6.23,6.28 and 6.54 qualitatively support this
conclusion. O n the other hand, at low heat input, toughness is limited because the fast
cooling rates produce a relatively hard microstructure as shown by higher peak hardness
values (Figs. 6.33 and 6.55).
The relatively small change of HAZ toughness with heat input is also consistent with the
relatively unchanged volume fraction of M A islands for various heat inputs as shown in
Fig. 6.4 and 6.29a.
Page 256
238
7.4.2.4 Transverse tensile properties of 4 wire S A welds
Tensile properties were measured for 4 wire S A welds of 20mm plate. Examination of the
failure location indicated that the welds failed in the H A Z as a result of softening in the
H A Z . Nevertheless, yield strengths consistent with that of the base plate were obtained
for the two lowest heat inputs (2.5 and 5kJ/mm) (Table 6.3). A significant reduction of
yield and tensile strengths occurred, however, at the highest heat input (lOkJ/mm). The
upper yield strengths at two different welding speeds for the lOkJ/mm welds were much
lower than that of the base plate and lower than the minimum requirement (80 ksi or 550
M P a ) for H S L A 80 steel. The reduced strength at the highest heat input (lOkJ/mm) is
clearly associated with the wide H A Z which is mostly softer than the base plate (Fig.
6.36). This result suggests that any factors which reduce the width of the H A Z will
improve the strength of the H A Z . Another possible way to increase H A Z strength is by
applying postweld heat treatment to induce Cu precipitation hardening in the H A Z (as
discussed in Section 7.3.4).
Each fracture surface exhibited a typical cup-and-cone tension-overload fracture,
consisting of a fibrous central region and an outer annular shear lip zone. Both regions
showed typical transgranular fracture by microvoid coalescence (Fig. 6.38). The fibrous
fracture surfaces, the large values of reduction of area and the high elongation values
indicate that the samples were very ductile (Table 6.3). Ductile tension fracture implies a
high toughness in the fracture area, i.e. in the H A Z , consistent with the impact toughness
results for the actual and simulated H A Z s obtained in the present work.
In summary, high HAZ toughness was a feature of the HAZ produced by 4 wire SA
welding and by simulation at heat inputs between 2.5-10kJ/mm and 1.9-4.9kJ/mm,
respectively. H A Z toughness for all welding conditions for the 2 0 m m plate met or
exceeded the military standard for H Y 80/100 steels. However, to be used as H Y 80
Page 257
239
steel, the 2 0 m m C R H S L A 80 steel should be S A welded at a heat input less than or equal
to 5kJ/mrn to avoid a wide softened H A Z which can cause a significant reduction in the
transverse tensile properties of the weld joint
Increasing heat input had little effect on HAZ toughness, despite a significant decrease in
hardness, because of coarsening of the ferrite. The small change in H A Z toughness with
heat input is also consistent with a minor change in the volume fraction of M A islands.
7.4.3 Effect of Welding Speed on the HAZ of 4 Wire SA Welds
The effect of welding speed on HAZ microstructure and properties was investigated by
examining 4 wire S A weld H A Z s produced by different welding speeds at constant heat
input
Macrography of the weld cross-sections indicated a slight decrease in HAZ width with
increasing speed. The reduction of H A Z width is associated with a higher H A Z cooling
rate at high welding speed, as reported by CSIRO, D M T (203).
Comparing the weld profile of a single pass (or the last pass in the case of multi-pass
welding), the weld cross-sections in Fig. 6.27 showed that there is no major change in
weld profile with welding speed, as expected for the same welding procedure. However,
instead of showing a uniform weld bead, the weld cross-section for the lowest welding
speed for each of the three heat inputs showed multiple fusion boundaries (or
solidification lines) within the weld bead. For the sample of 2.5kJ/mm at lOOOmm/min
speed, Fig. 6.39 shows four fusion boundaries within a weld bead, corresponding to the
passage of the four wires used in the welding process.
Page 258
240
At low welding speed, the time delay between the passage of the previous and the
following wire is significant, and there is sufficient time for the weld pool resulting from
the first wire to partially solidify before the passage of the following wire, which causes
only partial remelting. A continuous single weld pool was not formed because of the
relatively slow speed and the separation of the wires. Since the four wires were arranged
essentially as two pair (Fig. 5.5), a point in the H A Z experiences two major thermal
pulses producing the double peak nature of the thermal profile in the H A Z , as reported by
CSIRO, D M T (202). The double fusion lines in the lOkJ/mm weld at lowest welding
speed (600rnm/min) further reflects the double tandem nature of the welding process.
The general trend with increasing welding speed was a smaller prior austenite grain size
except for the unexpectedly low values for the lowest welding speed at 2.5 and 5kJ/mm
heat inputs. The general trend is due to the faster cooling rate at higher speed leading to a
short dwell time above the austenite grain coarsening temperature. The unexpectedly
small austenite grain size for the two low heat inputs is also associated with the the nature
of the 4 wire welding process. The separation of thermal pulses experienced by the H A Z
evidently reduces the dwell time above the grain growth temperature. The effect of
separate weld pools is greater at lower heat input, since the faster cooling rate enables the
weld pool associated with the previous wire to solidify quickly and only a small volume
of this solidified weld pool is remelted by the second pair due to the lower energy input.
In contrast the highest heat input (lOkJ/mm) did not show a low austenite grain size at
the lowest speed, because the two energy pulses are still very high (~5kJ/mm each).
Although the cooling rate of the HAZ increases with increasing welding speed as
demonstrated by CSIRO, D M T (203), the effect of welding speed on H A Z microstructure
is minor. This observation is consistent with the small change in volume fraction and
average m a x i m u m dimension of the M A islands with welding speed (Fig. 6.29). The
small change of H A Z microstructure with welding speed, apart from a slight change in
austenite grain size, is associated with a relatively small change in peak H A Z hardness
Page 259
241
(Table 6.1), in H A Z toughness (Figs. 6.34 and 6.35) and in tensile properties (Table
6.3) with welding speed.
In summary, the welding speed at constant heat input did not have a substantial effect on
H A Z hardness, toughness and tensile properties, consistent with the limited variation of
H A Z microstructure. This result suggests that improvement in welding productivity of
C R H S L A 80 can be effected by increasing speed, without significant deterioration of
mechanical properties.
Due to the nature of the 4 wire SA welding procedure used, a single weld pool may not
form. The tendency for separate weld pools is high for the low heat input at low welding
speed. Under these circumstances, the 4 wire process is similar to quick succession,
multiple pass welding.
7.4.4 Effect of Postweld Heat Treatment
Postweld heat treatment (PWHT) at 450, 550 and 650°C for 1 hour was carried out on
the simulated G C H A Z at an equivalent heat input of 3.1kJ/mm for 2 0 m m plate. Peak
hardening due to Cu precipitation occurred in the G C H A Z after P W H T at 550°C (Fig.
6.59), accompanied by significant deterioration in toughness (Fig. 6.59). The impact
toughness of the G C H A Z after P W H T at 550°C was lower than the minimum
requirement of H S L A 80 steel (47J at -51°C). However, P W H T at both 450 and 650°C
resulted in a softer structure and improved toughness.
The present result is different to that reported by Lundin et al. (66) for PWHT behaviour
of 37.5mm thick Q & A A710 steel welded with 2kJ/mm heat input (Section 4.4.4). The
authors demonstrated that the G C H A Z of Q & A A710 steel is susceptible to stress relief
cracking (SRC) after 1 hour at 454, 566 and 677°C. The different P W H T behaviour of
Page 260
242
the G C H A Z in the present case is likely to be due to the difference in chemical
composition and thermomechanical processing for these two types of A710 steel.
It is interesting to note that the 25mm control rolled plate also showed that peak hardening
occurred at 500-550°C and that the strength level was not greatly affected by small
changes in the aging temperature and time for temperatures up to about 600° C. Although
the strengthening gained from aging was accompanied by a degradation in toughness
(12), the degradation in toughness was found not to be simply related to the strength
increment In the overaged condition, the strength increment is achieved without a serious
reduction in toughness (12). Aging treatment at 550° C for 1/2 hour was therefore selected
by B H P to obtain an appropriate balance between strength and toughness for the C R
H S L A 80 steel.
A similar precipitation hardening response has also been reported recently for Q&A (class
3) A S T M A 7 1 0 steels (8,193,194,195). Despite the difference in plate thickness and
thermal process prior to the aging treatment, it has been commonly reported that aging at
550°C induces peak hardening of hot rolled plates. The effect of aging time is considered
to be minor compared to that of aging temperature (8,193).
The similar peak hardening temperatures of the unaged control rolled (CR) base plate and
the G C H A Z suggests that the Cu precipitation hardening behaviour for both conditions is
similar. It also implies that the majority of the Cu-rich clusters in the aged base plate (aged
at 550*C for 1/2 hour) were redissolved in the H A Z regions during the weld heating
cycle. Thus, C u precipitation hardening in the base plate due to the aging treatment at
550°C for 1/2 hour is almost totally lost, contributing to the softening of the H A Z . A s a
result, the Cu content in solution in the H A Z reaches a similar level to that in the C R
plate. The precipitation behaviour in the H A Z during further aging is therefore similar to
that of the unaged hot rolled base plate.
Page 261
243
Although the hardness of the base plate increased after subcritical reheating to 600° C for
the B O P S A welds as indicated in Fig. 6.20, it should be noted that in this case, only a
short duration thermal pulse was applied to the sample. This result indicates that,
although the commercially treated plate is considered to show the maximum yield stress
after an aging treatment at 550°C for 1/2 hour (12), this treatment does not, in fact, induce
the maximum C u precipitation hardening response.
In contrast, tempering by PWHT at 450, 550 and 650°C for 1 hour led to a reduction in
hardness of the base plate, as a result of overaging of the Cu-rich precipitates (Fig. 6.58).
As shown in Fig. 6.58, the higher the P W H T temperature, the higher degree of
overaging and the lower the hardness value.
PWHT of the GCHAZ can result in Cu precipitation hardening as well as softening
caused by tempering of the M A islands. Figure 7.2 shows a comparison of the G C H A Z
microstructure before and after P W H T . The dark islands after P W H T (Fig. 7.4b) indicate
the decomposition of the M A islands (white etching in Fig. 7.4a) due to tempering.
In the case of PWHT at 550°C for 1 hour, the rehardening by Cu precipitation must
outweigh the softening caused by tempering of the M A islands, because of the observed
overall hardening effect. In the case of P W H T of 450°C, softening due to tempering of
the M A islands is the main reason for the slight decrease in hardness since the temperature
is too low to induce any significant Cu precipitation hardening (12). For P W H T at 650°C
for 1 hour, the softening effect of tempering of M A islands is added to the softening due
to overaging of the Cu clusters, resulting in an overall reduction in hardness and
improved toughness.
PWHT did not change the fracture mode of Charpy impact specimens. As for the fracture
surfaces for the samples simulating the various H A Z regions, all samples after P W H T
showed fracture surfaces consisting of the ductile initiation zone (Diz), and shear lips at
Page 262
(b)
Fig. 7.4 Comparison of simulated grain coarsened H A Z region microstructures
before (a) and after (b) P W H T at 550°C for 1 hour (3.1kJ/mm,
Tpt=1300°C)(320x).
Page 263
245
the sides of the fracture surface. Transgranular cleavage type of fracture (Fig. 7.5)
occurred in the central part of fracture surface, similar to the G C H A Z before P W H T .
Specimens showing higher CVN values exhibited larger areas of shear lip and ductile
initiation zone, again similar to observations for the simulated weld H A Z structures
produced by a single thermal cycle to different peak temperatures.
To increase the HAZ strength without reducing HAZ toughness below the minimum
toughness requirement, the temperature of P W H T should be set outside the age peak
hardening range (500-600°C)(12). Since Cu precipitation hardening is approximately
fully induced in the base plate, any additional aging treatment will result in overaging of
the Cu clusters and reduction of strength in the base plate, especially at a temperature
higher than 600°C (Fig. 6.58). To avoid significant reduction of base plate strength, the
P W H T temperature should be kept below the peak hardening temperature range
(<500°C). A detailed investigation is needed to determine the appropriate P W H T
temperature and time to achieve optimum properties of the H A Z and base plate.
In summary, care must be taken when applying PWHT to the HAZ. Embrittlement of the
G C H A Z was induced after P W H T at 550°C for 1 hour, as indicated by significant
reduction of G C H A Z toughness and increase in hardness due to C u precipitation
rehardening. The Cu precipitation response of the G C H A Z was found to be similar to that
of the C R base plate. A s a result of the hardening, the toughness value for the G C H A Z
was lower than the minimum requirement for H S L A 80 steel. P W H T of the G C H A Z at
450 and 650°C for 1 hour resulted in reduced hardness and improved toughness. P W H T
at all three temperatures induced various levels of softening in the base plate because of
overaging of the Cu clusters. Therefore, the P W H T temperature should be kept below the
Cu precipitation peak hardening temperature of 500°C to avoid substantial loss of base
plate strength.
Page 264
246
Fig. 7.5 Quasi-cleavage appearance of central area of fracture surface for the
simulated G C H A Z (Tpl=1300°C) after P W H T at 550°C for 1 hour
Charpy impact sample (19J at -51°C).
Page 265
247
7.5 T R A N S F O R M A T I O N IN T H E G C H A Z A N D R E S U L T A N T S T R U C T U R E A N D
PROPERTIES
7.5.1 Partial CCT Diagram of CR HSLA 80 Steel
Although transformation in the HAZ under isothermal (199) and continuous cooling
conditions (66) has been reported for Q & A (class 3) A710 steel, the H A Z transformation
behaviour of the present C R H S L A 80 steel, based on a modified A710 composition, is
less certain.
The partial CCT diagram for the GCHAZ of 20mm plate is shown in Fig. 6.60. The peak
temperature used was 1300°C. The equivalent heat input range corresponding to the four
cooling conditions was 1.9-4.9kJ/mm.
The transformation start temperature was between 600-650° C, being lower at lower heat
input A much lower y-»a transformation temperature (~150°C lower) was determined by
Lundin et al. (66) for 12.5mm Q & A (class 3) A710 steel for a similar equivalent heat
input range. The higher transformation temperature for the present steel can be attributed
to the lower carbon and alloying element content (CE of 0.41) compared to the
conventional A710 steel (average C E of 0.49). In addition, the T M C P procedure for the
present steel resulted in a smaller grain size in the base plate, providing a larger grain
boundary area for nucleation sites for austenite on reheating and resulting in smaller
austenite grains. During cooling, the y-»a transformation would be stimulated by a larger
austenite grain boundary area acting as nucleation sites for transformation product,
contributing to the higher transformation temperature.
Study of phase transformation in the GCHAZ indicated that the microstructure of the
G C H A Z resulting from equivalent heat inputs between 1.9-4.9kJ/mm is a mixture of
Page 266
248
various ferrite structures and M A islands (granular structure and/or granular bainite). As
heat input decreased, the microstructure of the G C H A Z was refined, accompanied by an
increase in hardness of this region. For the lowest heat input (1.9kJ/mm), the fast cooling
rate enabled the formation of a small volume fraction of lath martensite.
7.5.2 Properties of the Simulated GCHAZ
Toughness, hardness and microstructure for various heat inputs have been discussed
previously in Section 7.3.2, with reference to the effect of heat input on H A Z structure
and properties. The microstructure for each heat input consists predominantly of various
ferrite structures with M A islands. A structural coarsening effect is obvious as the heat
input increases (Fig. 6.54). At lower heat input, a small amount of a lath martensite is
observed in locations corresponding to the original pearlite bands in the base plate. The
hardnesses of the simulated G C H A Z s were higher for a faster cooling rate (lower heat
input) (Fig. 6.55).
Results for the simulated GCHAZ can be summarised as follows:
(1) the hardnesses of the simulated GCHAZs for the equivalent heat input range of 1.9-
4.9kJ/mm were between 203-236HV5, much lower than the conventional critical
hardness (350HV) for susceptibility of cold cracking (Section 3.2);
(2) the C V N values for the simulated G C H A Z were similar to those of the base plate
(Fig. 6.56), indicating a relatively high H A Z toughness;
(3) the y->a start temperature for the G C H A Z was in the range 600-650°C, being lower
at lower heat input.
Page 267
249
7.5.3 Effect of Copper and Nickel Contents on H A Z Microstructure and Hardness
To study the combined effect of Cu and Ni contents on HAZ transformation behaviour, a
similar partial C C T diagram (Fig. 6.61) was obtained for a low carbon equivalent 350
M P a grade steel (LCE 350) with similar composition to the C R H S L A 80, except for a
slightly higher carbon and significantly lower Cu and Ni contents (Table 5.3). The
equivalent heat input range in this case was 1.8-4.8kJ/mm, very close to the range for the
C R H S L A 80 steel.
Compared to the CR HSLA 80 steel, a higher HAZ transformation temperature was
obtained for the L C E 350 steel. However, the transformation temperature increment was
relatively small (~25°C). The lower v-»a transformation temperature for the C R H S L A
80 steel is consistent with the higher contents of Cu and Ni which suppress the
transformation of austenite. The reduction of transformation temperature due to the higher
Cu and Ni contents in C R H S L A 80 steel must be greater than the increase in
transformation temperature because of the slightly lower carbon content. As a result, the
C R H S L A 80 steel showed an overall lower transformation temperature. The mild effect
of Cu in suppressing austenite transformation has been reported by Culter et al. (177).
The effect of Ni on the stability of the austenitic phase in iron is also well documented
(228,229,230).
The simulated GCHAZ microstructures of the LCE 350 steel at different heat inputs were
also a mixture of ferrite and second phase islands as shown in Fig. 6.63. The trend in
microstructural change with heat input was similar to the C R H S L A 80 steel, i.e. a finer
microstructure was obtained at a lower heat input. However, compared to the C R H S L A
80 steel, the carbon enriched second phase constituents were mainly diffusional
transformation products (pearlite or bainite - the dark etching constituents in Fig. 6.63),
instead of M A islands (Fig. 6.54). The structure of the G C H A Z for various heat inputs
for the L C E 350 steel is softer than that of the C R H S L A 80 steel (compare Figs. 6.62
Page 268
250
and Fig. 6.55), as a result of the higher transformation temperature of the L C E 350 steel
and the lower volume fraction of M A islands.
In summary, comparison of the partial CCT diagrams for the GCHAZs of the CR HSLA
80 and L C E 350 steels revealed that for the H S L A 80 steel, the higher contents of Cu and
Ni suppressed H A Z transformation to a lower temperature, increased H A Z hardness and
changed the second phase islands in the G C H A Z structure from mainly a diffusional
product (pearlite and/or bainite) to a nondiffusional product (martensite and retained
austenite).
Page 269
251
CHAPTER 8
CONCLUSIONS
Page 270
252
The weldability of the newly developed control rolled H S L A 80 steel has been
investigated in relation to heat-affected zone microstructure and mechanical properties.
The present research was concentrated on six areas:
(i) the microstructure and properties of a single weld H A Z ;
(ii) the effect of type of welding process on H A Z structure and properties;
(iii) the effects of heat input and welding speed on H A Z properties;
(iv) simulation of the H A Z structure in actual welds;
(v) the effect of multi-pass welding and postweld heat treatment on H A Z properties; and
(vi) the effect of copper and nickel on H A Z transformation.
The conclusions of this work are as follows.
(1) In general, the HAZ of welded CR HSLA 80 steel showed a relatively high Charpy
impact toughness. This high H A Z toughness is related to the low carbon content and the
low carbon equivalent of the steel, which generate a predominantly ferritic microstructure
under normal welding conditions.
(2) Hardness surveys of the H A Z of welds produced by bead-on-plate submerged arc
(Ffl=2.5-6kJ/mm); bead-on-plate flux cored arc (HI=1.0-2.5kJ/mm); and 4 wire S A
(HI=2.5-10kJ/mm) welding; as well as simulated weld H A Z s (HI=1.9-4.9kJ/mm),
indicated that in all cases the hardness was well below 310 H V . For similar heat inputs,
the bead-on-plate single-run weld H A Z s showed higher peak hardnesses than the 4 wire
SA welds. These results are directly related to the welding process through the arc force,
weld bead shape and the subsequent cooling rate in the H A Z .
(3) The importance of weld bead profile on HAZ properties is reflected in the significant
changes in H A Z structure and hardness with changes in the welding process, despite a
nominally constant heat input
Page 271
253
(4) The commonly accepted proposition arising from the Rosenthal analysis that heat
input determines the cooling rate in the H A Z and hence its structure and properties, is
inconsistent with (3) and with the observation that marked variations occurred in the
width, structure and hardness of the H A Z within a single B O P S A weld. The shape of
the weld bead and changing heat transfer conditions around the fusion line dictate local
variations in cooling rate and hence H A Z characteristics. However, the Rosenthal
analysis was found to be more satisfactory when comparing the same H A Z position for
welds made with the same process, but different welding parameters.
(5) The microstructure of the GCHAZ generally consisted of ferrite laths and interlath MA
islands, but some lath martensite was detected in low heat input welds, particularly those
produced by F C A welding.
(6) Among the various HAZ sub-regions, the grain-coarsened region (GCHAZ) exhibited
the highest hardness and lowest impact toughness value because of the coarse structure,
which contained a relatively high volume fraction of M A islands (~ 6%). In contrast, the
partially transformed region showed the highest toughness and a hardness well below that
of the base plate. The softening of the H A Z was related to the loss of C u precipitation
hardening.
(7) Reheating of the simulated grain-coarsened region to a subcritical tempering
temperature of 600°C, an intercritical temperature of 800°C; and a grain refining
temperature of 900°C improved the toughness of the G C H A Z region. This result
suggests that overlapping and multi-pass welding can be safely conducted for this steel
without deterioration in the toughness of the G C H A Z .
(8) Although the peak hardness of the HAZ increased with decreasing heat input for the
four types of welds, the effect of decreasing heat input on H A Z toughness was relatively
small. This effect is due to the opposing influences on toughness of increasing
microstructural refinement and increasing hardness with decreasing heat input. Another
Page 272
254
contributing factor is the relatively small change with decreasing heat input of the volume
fraction of M A islands which are considered to be detrimental to toughness.
(9) Changing the welding speed by a factor of about 2 in 4 wire SA welds also had only a
slight effect on H A Z microstructure and therefore, a minor effect on the toughness,
hardness and strength properties of the H A Z .
(10) Strength compatible with that of the base plate was measured in transverse tensile
tests of the weld joint produced by 4 wire S A welding at heat inputs of 2.5-5kJ/mm.
However, for a higher heat input, significant deterioration of weld strength occurred due
to the greater width of the H A Z which was softer than the base plate. The investigation
showed however, that H A Z strength can be increased by postweld heat treatment at a
temperature of or below 500°C, by inducing minor copper precipitation hardening,
without a substantial reduction in the base plate strength.
(11) Postweld heat treatment of the simulated GCHAZ structure resulted in a significant
decrease in toughness after treatment at 550°C for 1 hour. This embrittlement is
associated with peak hardening by copper precipitation in the G C H A Z . Postweld heat
treatment at both 450 and 600°C resulted in improved toughness and a softer H A Z , due to
the tempering of the M A islands at both temperatures and overaging of Cu precipitates at
600°C.
(12) The partial continuous cooling transformation diagram determined for the grain
coarsened H A Z region showed that the y->a start transformation temperature was
between 600-650°C for a simulated heat input range of 1.9-4.9kJ/mm. A lower
transformation temperature was obtained at a lower heat input (faster cooling rate). The
microstructure of the simulated grain coarsened H A Z region was close to that of actual
weld H A Z s and consisted of a mixture of ferrite laths and M A islands. The major change
in microstructure of the simulated G C H A Z with increasing cooling rate (decreasing heat
input) was structural refinement and the appearance of low carbon lath martensite at low
Page 273
255
(13) By comparison of the C R H S L A 80 steel with a similar reference steel with minor
levels of C u and Ni, the effect of these two elements on y-*a transformation was
established. The Cu (1.1%) and Ni (0.85%) in the C R H S L A 80 steel suppressed y-»a
transformation in the simulated G C H A Z . The y-»a transformation start temperature was
reduced by about 25°C. The major microstructural change brought about by the presence
of copper and nickel was a change in the second constituent from a diffusional
decomposition product (pearlite or/and bainite) to a nondiffusional product ( M A islands).
A higher H A Z hardness was also obtained in the H S L A 80 due to the formation of the
harder second constituent ( M A islands rather than pearlite or bainite) as a result of the
lower y->a transformation temperature and the higher hardenability of the H S L A 80 steel.
Page 275
257
(1) Montemarano, T.W., Sack, B.P., Gudas, J.P., Vassilaros, M.G. and Vanderveldt
H.H., Jnl. Ship Prod., Vol. 2, No. 3, Aug., 1986, p.145 .
(2) Heller, S.R., Fioriti, I. and Vasta, J., Nav. Eng. Jnl., Feb., 1965, p.29.
(3) Kvidahl, L.G., Weld. Jnl., Vol. 64, July, 1985, p.42.
(4) Wacquez, P. and Daehle, R.V., Sheet Metal Ind., Vol. 44, No. 477, 1967, p.21.
(5) LeMay, I. and Schetky, L.M., "Copper in Iron and Steel", John Wiley & Sons,
1982.
(6) LeMay, I., Jnl. Mat, Vol. 6, No. 2, June, 1971, p.436.
(7) A S T M Designation: A710, 1984.
(8) Jesseman, R.J. and Murphy, G.J., Conf. Proc. on "Technology and applications of
HSLA steels", Philadephia, American Society for Metals, Oct, 1983, p.655.
(9) Wilson, A.D., Jnl. Metals, March, 1987, p.36.
(10) Williams, J.G., Killmore, C.R., Barrett J.F. and Church, A.K., Conf. Proc. on
"Microstructure and Properties of H S L A Steels", Pittsburgh, Nov.1987.
(11) Williams, J.G., Killmore, CR. and Harris, G.R., Conf. Proc. on "Physical
Metallurgy of Thermomechanical Processing of Steels and Other Metals", Vol. 1, ISIJ,
June, 1988.
(12) Killmore, C.R., Barrett, J.F., Cabello, A., Squires, I.F. and Williams, J.G., Conf.
Proc. on "Offshore Mechanics and Arctic Engineering", Hague, Netherlands, March,
1989.
(13) Smith, N.J., McGrath, J.T., Gianetto, J.A. and Orr, R.F., Weld. Jnl. Res. Suppl.,
March, 1989, p. 112s.
Page 276
258
(14) Denney, P.E. and Metzbower, E.A., Conf. Proc. on "Technology and applications
of H S L A steels", Philadephia, American Society for Metals, Oct, 1983, p.689.
(15) Metzbower, E.A., Conf. Proc. on "Trends in Welding Research", Gatlinburg,
Tennessee, May, 1986, p.491.
(16) Lukens, W.E., Weld. Jnl. Res. Suppl, July, 1987, p.215s.
(17) Easterling, K., "Introduction to the Physical Metallurgy of Welding", Butterworth,
1983.
(18) Akselsen, O.M., Grong, O. and Solberg, J.K., Mat Sci. and Tech., Vol.3, Aug.,
1987, p.649.
(19) Bowker, J.T., Glover, A.G. and Lazor, R.B., Conf. Proc. on "Technology and
Application of H S L A Steels", Philadephia, 1983, American Society for Metals.
(20) Thaulow, C , Paauw, A.J. and Guttormsen, K., Weld. Jnl. Res. Suppl., Sept,
1987, p.266.
(21) Hart, P.H.M. and Harrison, P.L., Weld. Jnl. Res. Suppl., Oct., 1987, p.310s.
(22) British Standard 5135, Specification for Metal Arc Welding of Carbon and Carbon-
Magnanese Steels, 1974.
(23) International Institute of Welding, U W Doc. IX-537-67, 1967.
(24) Squires, I.F., Aust Weld. Jnl., Second Quarter, 1988, p. 10.
(25) Boniszewski, T. and Watkinson, F., Met. and Mater., Vol. 5, No. 2, 1973, p.90.
(26) CSIRO Division of Manufacturing and Technology, Australia, Quarterly Progress
Report on High Productivity Welding: Aug.-Oct, 1989, Generic Technology Grant No.
15020.
Page 277
259
(27) Wang, G.R., Lau, T.W., Weatherly, G.C. and North, T.H., Met. Trans. A, Vol.
20A, Oct, 1989, p.2093.
(28) Alberry, P.J., Chew, B. and Jones, W.K.C., Metals Tech., June, 1977, p.317.
(29) Rosenthal, D., Trans. ASME, Vol. 68, 1946, p.849.
(30) Wingrove, A.L., Scan. Jnl. Met, Vol. 16, 1987, p. 174.
(31) Lin, X. and Dunne, D.P., Uni. of Wollongong, Annual Report for Australian
Welding Research Association (AWRA), "Microstructural and Hardness Gradients
Across the H A Z of a Sub, Arc Welded Cu-bearing Structural Steel", 1988.
(32) McCutcheon, D.B., McGrath, J.T., Godden, M.J., Ruddle, G.E. and Embury,
J.D., Conf. Proc. on "Technology and Application of HSLA Steels", Philadephia, 1983,
American Society for Metals, p.881.
(33) University of Wollongong, report on High Productivity Welding (HPW), 1990,
May-Aug., Generic Technology Grant No. 15020.
(34) George T. and Irani, J.J., Jnl. Aust. Inst Metals, Vol. 13, No.2, 1968, p.94.
(35) George, T., Bashford, G. and MacDonald, J., Jnl. Aust. Inst. Metals, Vol. 16,
No.l, 1971, p.36.
(36) Edward, R.H., Squires, I.F. and Barbara, F.J., Aust Weld. Jnl., Autumn, 1986,
p.ll.
(37) Chen, Z., Loretto, M.H. and Cochrane, R.C., Mat. Sci. Tech., Vol. 3, Oct, 1987,
p.836.
(38) Honeycombe, R.W.K., Conf. Proc. on "HSLA Steels-Metallurgy and
Applications", Beijing, China, 1985, p.243.
Page 278
260
(39) flcawa, H., Oshige, H. and Noi, S., Jnl. Weld. (Japan), Vol. 7, 1977, p.396.
(40) Sekino, S. and Mori, N., Conf. Proc. on "The Science and Technology of Iron and
Steel", Part I, Tokyo, 1970, Iron and Steel Institute of Japan.
(41) Albutt, KJ. and Garber, S., Jnl. Iron Steel Inst, Vol. 204, 1966, p. 1217.
(42) Cahn, R.W., "Physical metallurgy", 1965,North-Holland Publ. Co., Amsterdam.
(43) Rasanen, E. and Tenkula, J., Scan. Jnl. Met, Vol. 1, 1972, p.75.
(44) Ashby, M.F. and Easterling, K.E., Acta Metall., Vol. 30, 1982, p. 1969.
(45) Soete, W., Weld. Jnl. Res. Suppl, Vol. 50, 1971, p. 127s.
(46) Kim, H.J. and Morris, J.W., Conf. Proc. on "Trends in Welding Research",
Gatlinburg, Tennessee, May, 1986, p.273.
(47) Alberry, P.J. and Jones, W.K.C., Metals Tech., Vol. 9, Oct, 1982, p.419.
(48) Clark, J.N., Mat Sci. Tech., Vol. 1, Dec, 1985, p.1069.
(49) Clark, J.N., Mat Sci. Tech., Vol. 1, Dec., 1985, p.1081.
(50) Clark, J.N., Mat. Sci. Tech., Vol. 1, Dec, 1985, p. 1090.
(51) Nippes, E.F. and Savage, W.F., Weld. Jnl., Vol. 28, 1949, p.534s.
(52) Ahmed, N.U. and Yellup, J.M., Materials Forum, Vol. 12, 1988, p.62.
(53) Nakanishi, M., Komizo, Y. and Fukada, Y., The Sumitomo Search, No. 33, Nov.,
1986, p.22.
(54) Inagaki, M., Nakahara, K., Harada, K. and Mitani, Y., Trans. Nation. Res. Inst.
Metals (Japan), Vol. 6, No. 6, 1964, p.73.
Page 279
261
(55) Tomita, Y., Yamaba, R., Okamoto, K., Aihara, S., Haze, T. and Ito, K., Conf.
Proc. on "HSLA Steels-Metallurgy and Applications", Beijing, China, 1985, p.641.
(56) Vitek, J.M. and David, S.A., Met. Trans. A, Vol. 21 A, July, 1990, p.2021.
(57) Lewis, R. and Wu, K.C., Weld. Jnl. Res. Suppl, Vol. 42, 1963, p.241s.
(58) Nippes, E.F., Savage, W.F. and Owczarski, W.A., Weld. Jnl. Res. Suppl, Vol.
39, 1960, p.465s.
(59) Suzuki, H. and Tamura, H., Trans. Nation. Res. Inst. Metals (Japan), Vol. 1,
1959, p.119.
(60) Nippes, E.F., Gerken, J.M. and Schaaf, B.M., Weld. Jnl. Res. Suppl, Vol 34,
1955, p.31s.
(61) Suzuki, H. and Tamura, H., Trans. Nation. Res. Inst. Metals (Japan), Vol. 3,
1961, p.47.
(62) Grotke, G.E., Weld. Jnl. Res. Suppl, Vol. 43, 1964, p.265s.
(63) Nippes, E.F., Wawrousek, H. and Fleishchmann, W.L., Weld. Jnl. Res. Suppl,
Vol. 34, 1955, p. 169s.
(64) Widgery, D.J., Conf. Proc. on "Weld Thermal Simulation for Research and
Problem Solving", 'Weld Thermal Simulators: a Review', London, April, 1972, The
Welding Institute.
(65) Apps, R.L. and Andrade, A.M.V.P.D., Conf. Proc of 33rd Annual Conference of
the Australian Welding Institute, Brisbane, Oct, 1985, p.327.
(66) Lundin, CD., Menon, R. and Lawson, J.M., Weld. Jnl. Res. Suppl, Dec, 1989,
p.467s.
Page 280
262
(67) Akselsen, O.M., Solberg, J.K. and Grong, <D., Scan. Jnl. Metall, Vol. 17, 1988,
p. 194.
(68) Ramberg, M., Akselsen, O.M. and Grong, <£., Conf. Proc on "Trends in Welding
Research", Gatlinburg, Tennessee, USA, May, 1986, p.679.
(69) Nippes, E.F., Madeka, J.P. and Ratz, G.A., Conf. Proc on "Trends in Welding
Research", Gatlinburg, Tennessee, USA, May, 1986, p.641.
(70) Dolby, R.E. and Widgery, D.J., Conf. Proc. on "Weld Thermal Simulation for
Research and Problem Solving", "The Simulation of H A Z Microstructures', London,
April, 1972, The Welding Institute, M/52/70.
(71) Dolby, R.E., Conf. Proc. on "Weld Thermal Simulation for Research and Problem
Solving", 'Fracture Toughness Comparison of Weld H A Z and Thermal Simulated
Microstructures', London, April, 1972, The Welding Institute, M/53/70.
(72) Pang, W., Ahmed, N.U. and Dunne, D.P., Conf. Proc. on "Material United in the
Service of Man", J M M A and WTIA, Perth, Sept., 1990.
(73) Berkhout C.F., Conf. Proc. on "Weld Thermal Simulation for Research and
Problem Solving", London, April, 1972, The Welding Institute.
(74) Inagaki, M. and Sekiguchi, H., Trans. Nation. Res. Inst Metals (Japan), Vol. 2,
No. 2, 1960, p.40.
(75) Cottrell, C.L.M., Jnl. Iron Steel Inst, Vol. 174, 1953, p. 17.
(76) Nippes, E.F., Savage, W.F. and Allio, R.T., Weld. Jnl Res. Suppl, Vol. 36,
1957, p.531s.
(77) Christenson, A.L., Nelson, E.C. and Jackson, CE., Trans. AIME, Vol. 162,
1945, p.606.
Page 281
263
(78) Ohmori, Y., Ohatani, H. and Kunitake, T., Trans. ISU, Vol. 11, 1971, p.250.
(79) Coe, F.R., "Welding Steels Without Hydrogen Cracking", Cambridge, 1973,
Welding Institute.
(80) Alberry, P.J. and Jones, W.K.C, Metals Tech., July, 1977, p.360.
(81) Phillips, R.H., Br. Weld. Jnl, Vol. 15, 1968, p.547.
(82) Akselsen, O.M. and Simonsen, T., Weld, in the World, Vol. 25, No. 1/2, 1987,
p.26.
(83) Nilsson, K., Jernkout Ann., Vol. 153, 1969, p.121.
(84) Christensen, N. and Simonsen, T., Scan. Jnl Met, Vol. 10, 1981, p.147.
(85) Watkinson, F. and Baker, R.G., Br. Weld. Jnl., Vol. 14, 1967, p.603.
(86) Bailey, N., Met. Constr., Vol.2, 1970, p.442.
(87) Bailey, N., Weld. Jnl. Res. Suppl, Vol. 51, 1972, p.l69s.
(88) Hart, P.H.M., in Conf. Proc on "Trends in Steel and Consumables for Welding",
Abington, 1979, The Welding Institute.
(89) Evans, G.M. and Christensen, N., Scan. Jnl. Met, Vol. 2, 1973, p.91.
(90) Pavaskar, V. and Kirlaldy, J.S., Scan. Jnl. Met, Vol. 11, 1982, p.256.
(91) Harrison, P.L. and Farrar, R.A., Inter. Mat. Rev., Vol. 34, No. 1, 1989, p.35.
(92) Shorshorv, M., Dentin, E.A. and Belov, V.V., Met. Sci. Heat Treat. (USSR), Vol.
15, 1973, p.598.
(93) Sato, M. and Yamato, K., Jnl. Jpn. Weld. Soc, Vol. 50, 1981, p.ll.
Page 282
264
(94) Inagaki, M. and Hiroyuki, M., Conf. Proc on "Quality and Reliability in Welding",
Hangzhou, China, Welding Institute of Chinese Mechanical Engineering Society, Sept.,
1984.
(95) Homma, H., Ohkita, S., Matsuda, S. and Yamamoto, K., Presented at The 67th
A W S Convention, Atlanta, U.S.A., April, 1986.
(96) Lundin, CD., Conf. Proc. on "Trends in Welding Research", Gatlinburg,
Tennessee, May, 1986, p.475.
(97) Suzuki, H. and Yurioka, N., Tetsu-to-Hagane, Vol. 67, No. 10, 1982, p. 1657.
(98) U.S. Steel, "The Making, Shaping and Treatment of Steel", 1971.
(99) Karppi, R., U W Doc. DC-1102-78, 1978.
(100) Australian Welding Research Association (AWRA) Technical Note 1, The
Weldability of Steels, May, 1982.
(101) Brisson, J., Maynier, P.H., Dollet, J. and Bastien, P., Weld. Jnl. Res. Suppl,
Vol. 51, No. 4, 1972, p.208.
(102) Winterton, K., Weld. Jnl. Res. Suppl, Vol.40, No. 6, 1961, p.253 .
(103) Boothby, P.J. and Rogerson, P., Conf. Proc. on "Towards Rational and
Economic Fabrication of Offshore Structures", London, Welding Institute, Nov., 1984.
(104)Welland, W.G., Weld. Jnl., March, 1989, p.55.
(105) Karppi, R.A.J., Ruusila, J., Toyoda, M „ Satoh, K. and Vartiainen, K., Scan.
Jnl. Met, Vol. 13, 1984, p.66.
(106) International Institute of Welding, IIW Doc. 288-68, 1968, also Weld, in the
World, Vol 6, 1968, p.78.
Page 283
265
(107) Bryhan, A.J., Weld. Jnl. Res. Suppl, Vol. 50, No. 9, 1981, p.169.
(108) Tanaka, J. and Kitada, T., UW Doc LX-959-76, 1976.
(109) Lin, X. and Dunne, D.P., Conf. Proc. on "Material United in the Service of Man",
I M M A and WTLA, Perth, Sept 17th-21st, 1990, p.9-3.
(110) International Institute of Welding, UW Doc nS/TiW-893-86, 1986 (ex doc. DC-
1309-84), also Weld, in the World, Vol. 25, No. 1/2, 1987, p.2.
(Ill) Brooks, T.L. and Hart, P.H.M., The Weld. Inst. Res. Bulletin, March, 1977.
(112) German Standard, DIN 50 163 Part 1, Testing of Metallic Materials; Hardness Test
on Welding: Joints Welding.
(113) British Standard, BS 709 1983-10, Test for Hardness Across Welded Joints.
(114) French Standard, NF A 81-460, Method for the Determination of the Underbead
Hardness.
(115) Australian Standard, 2205.6.1, 1988, Methods of Destructive Testing of Welds in
Metal, Part 6, Hardness Tests, Methods 6.1: Weld joint hardness test.
(116) International Institute of Welding, TTW Doc. DC-1342-84, 1984, Determination of
the Effect of Welding on the Maximum Hardness in the Heat Affected Zone of Welded
Joints.
(117) Cochrane, R.C. and Amin, R.K., Seminar on "Hardenability of Steels", Derby,
U.K., Technical Director, Bailey, N., Abington Publishing, 17th, May, 1990, p.63.
(118) Yurioka, N., Okumura, M., Kasuya, T. and Cotton, H.J.U., Met. Constr., Vol.
19, April, 1987, p.217R.
Page 284
266
(119) Suzuki, H., Trans. Jpn. Weld. Soc, Vol. 16, No. 2, 1985, Oct, p.61. also JTW
Doc. DC-1418-86.
(120) Yurioka, N., Ohshita, S. and Tamehiro, H„ Australian Welding Research
Association (AWRA) Symposium on "Pipeline Welding in the 80's", March, 1981.
(121) Lorenz, K. and Duren, C, UW Doc. rX-B-11-82, 1982.
(122) Terasaki, T., Jnl. ISJJ, Vol. 67, Dec, 1981, p.2715.
(123) Duren, C, UW Doc. DC-1437-86, 1986.
(124) Suzuki, H., IJW Doc LX-1279-83, 1983.
(125) Australian Standard 1544.2, 1989, Methods for impact tests on metals, Part 2:
Charpy V-notch.
(126) Verburg, S.J., Philips Welding Reporter, the Netherlands, 1974/3-4.
(127) Commission of the European Communities, "Study of the Mechanical properties of
the H A Z in Welded high Strength Steels", Technical Research 'Steel', Report 5192f,
Vol. 2, Dec, 1974.
(128) Methods for Crack Opening Displacement Testing, 1972, Draft for Development
19:1972.
(129) Kudoh, J. and Pisarski, H.G., Report 294/1986, 7807.01/84/459.3, The Welding
Institute, Abington, Cambridge, Jan., 1986.
(130) Denys, R., JTW Tokyo X-1131-86, 1986.
(131) Dolby, R.E., Weld. Jnl. Res. Suppl, Aug., 1979, p.225s.
(132) Watanabe, L, Susuki, M., Tagawa, H., Kunisada, Y., Yamazaki, Y. and Iwasaki,
N., Nikkon Kokan Tech. Report, Overseas No. 47, 1986.
Page 285
267
(133) Chipperfield, CG. and Williams, J.G., Conf. Proc on "HSLA Steels-Metallurgy
and Applications", Beijing, China, 1985, p.535.
(134) Nakano, N., Bessyo, K., Lida, Y., Seta, I. and Kamada, Y., Conf. Proc. on
"Fifth International Offshore Mechanics and Arctic Engineering (OMAE) Symposium",
Vol. H, Tokyo, 1986, p.354.
(135) Uchino, K., Ohno, Y., Aihara, S., Haza, T., Hagiwara, Y„ Horil, K.,
Kawashima, Y., Tomita, Y. and Chijiiwa, R., Conf. Proc. of Fifth International
Offshore Mechanics and Arctic Engineering (OMAE) Symposium, Vol. U, Tokyo, 1986,
p.373.
(136) Eichhorn, F. and Pyrasch, D., Aust. Weld. Jnl, Spring, 1986, p.39.
(137) Yoshikawa, H., Kawashima, Y. and Konno, K., Conf. Proc. on "Physical
Metallurgy of Thermomechanical Processing of Steels and Other Metals (THERMEC-
88)", Vol. 2, Tokyo, Japan, June, 1988, p.487.
(138) Yang, Y.X., Tong, Y.G., Lin, M.T. and Kang, Z.S., Trans. China Weld. Inst,
Vol. 7, No. 4, Dec, 1986, p. 174.
(139) Mimura, H. and Aoki, K., UW Doc. DC-629-69, 1969.
(140) JJcawa, H., Oshige, H. and Tanoue, T., IIW Doc DC-1156-80, 1980.
(141) Stevenson, R., "Formable HSLA and Dual-Phase Steel", ed., A.T. Davenport,
Warrendale, Pa, 1979, The Metallurgical Society of A M .
(142) Griffith, A.A., Phil. Trans. Roy. Soc, 1921, A221, p.163.
(143) Gerbase, J., Embury, J.D. and Hobbs, R.M., "Structure and properties of dual-
phase steels", ed., R.A. Kot and J.W. Morris, Warrendale, Pa, 1979, The Metallurgical
Society of AIME.
Page 286
268
(144) He, X. J., Terao, N. and Berghezan, A., Met. Sci., Vol. 18, July, 1984, p.367.
(145) Cai, X.L., Feng, J. and Owen, W.S., Met. Trans., Vol. 16A, 1985, p. 1405.
(146) Hashimoto, K., Itoh, K., Mimura, H., Otoguro, Y., Yamaba, R. and Kikutake,
T., Conf. Proc. on "HSLA Steels-Metallurgy and Applications", Beijing, China, 1985,
p.699.
(147) Garland, J.G. and Kirkwood, P.R., Met. Constr. and Brit. Weld. Jnl, Vol. 7,
No. 6, 1975, p.320.
(148) Hulka, K. and Heisterkamp, F., Conf. Proc. on "Technology and applications of
HSLA steels", Philadephia, Oct., 1983, American Society for Metals, p.915.
(149) Cane, M.W.F. and Dolby, R.E., Weld. Res. Inter., Vol. 4, No. 3, 1974.
(150) Amano, K., Ozeki, T. and Ueda, S., Inner Report, Kawasaki Steel Corp. Steel
Lab., 1989.
(151) Bonomo, F. and Rothwell, A.B., Conf. Proc. of International Welding Congress,
Bratislava, 1971.
(152) Hannerz, N.E. and Holmquist, B.M.J., Met. Source Jnl, Vol. 8, No. 7, 1974,
p.228.
(153) Illin, V.P. and Razikov, M.I., Auto. Weld., Vol. 19, 1966, p.3.
(154) Amano, K., Shiga, C, Kusuhara, Y., Kamoi, N., Matsumura, H., Muramatsu,
S., Tabata, J., Toyosada, M. and Miyazaki,T., Conf. Proc. of Fifth International
Offshore Mechanics and Arctic Engineering (OMAE) Symposium, Vol. U, Tokyo, 1986,
p.338.
(155) Lebedev, Y.M., Letuchi, V.N. and Tsyukh, S.M., Weld. Prod., Vol. 33, No. 12,
1986, p.24.
Page 287
269
(156) Ahmed, N.U. and French, I.E., Aust. Weld. Jnl., Fourth Quarter, 1989, p.25.
(157) Cuddy, L.J., Lally, J.S. and Porter, L.F., Conf. Proc on "Technology and
applications of HSLA steels", Philadephia, American Society for Metals, Oct, 1983,
p.697.
(158) Itoh, K., Mimura, H., Matsuda, S., Yamamoto, K., Ohno, Y., Okamura, Y. and
Kawashima, Y., Conf. Proc. on "HSLA Steels-Metallurgy and Applications", Beijing,
China, 1985, p.669.
(159) Ishizaki, K., Yokoya, S. and Okada, T., "Weldability of Stainless Steel", Report,
Nippon Institute of Technology, Saitama, Japan to V A M A S meeting on Tachnical
Working Area, Weld Characteristics', NPL, Teddington, 5Dec, 1988.
(160) Bradstreet, B.J., weld. Jnl., Vol. 47, No. 7, 1986, p.316s.
(161) Lin, M.L. and Eagar, T.W., Conf. Proc on "Transport Phenomena in Materials
Processing", ed., Chen, M.M. et al, New York, 1984, American Society of Mechanical
Engineers.
(162) Ohara, M., Fujita, H. and Nishi, T., Trans. ISJJ, Vol. 26, No. 5, 1986, p.403.
(163) Kitamura, Y., Fujimori, S. and Yatake, T., Conf. Proc. of UW Asian Pacific
Regional Welding Congress, 14- 18th Nov., 1988, p.557.
(164) Knight, D.E., Aust. Weld. Jnl, Vol. 33, April, 1954, p.303.
(165) Uttachi G.D. and Messina, J.E., Aust Weld. Jnl, Vol. 47, June, 1968, p.475.
(166) Copper Development Association (CDA)(Great Britain), "Copper-bearing steels
for structural purposes", 1961, No. 61, CDA publication.
(167) Rogerson, P., Jones, C.L., Conf. Proc. on "Steels for Linepipe and Pipeline
Fittings", The Metals Society, London, 1983.
Page 288
270
(168) Nagumo, M., Conf. Proc on "Copper in Steel", ATB Metallregie, XXIII, No. 3,
1983.
(169) LeMay, I., Schetky, L.M. and Krishnadev, M.R., Conf. Proc on "High Strength
Low Alloy Steel", Wollongong, Australia, Aug., 1984.
(170) Grange, R.A., Lambert, V.F. and Harrington, J.J., Trans. ASM, Vol. 51, 1959,
p.377.
(171) Ostrovskaya, S.A., Auto. Welding, No.l, 1964, p.6.
(172) Metals Handbook, 1948 edition, p.463.
(173) Contsouradis, D., Leroy, V., Greday T. and Lecomte-Beckers, J., Conf. Proc.
on "Copper in Steel", ATB Metallurgie, XXUI, No. 3,1983.
(174) Krishnadev, M.R. and LeMay, I., Jnl. Iron Steel Inst, May, 1970, p.458.
(175) Krishnadev, M.R. and Galibois, A., "Metals Tech.", June, 1974, p.300.
(176) Tsukada, K., Kohsaka, Y., Hatakeyama, K., Shimoda, T., Iwasaki, N. and
Kaneko, Y., Nippon Kokan Technical Report, Overseas No. 32, 1981, p.l.
(177) Cutler, L.R., Sojka, G.J. and Krishnadev, M.R., Annual Report, Laval
University, Quebec, Canada, INCRA project No. 301, May, 1981, p.126.
(178) Krishnadev, M.R., Conf. Proc on "Technology and applications of HSLA
steels", Philadephia, American Society for Metals, Oct., 1983, p. 129.
(179) Jones, P.W., Br. Weld. Jnl, No. 6, 1959, p.282.
(180) Keyser, N.H. and Lorig, C.H., Weld. Jnl, Vol. 25, Oct., 1946, p.597s.
(181) Ellinger, G.A., Bisell, G.A. and Williams, M.L., Jnl. of Research-National
Bureau of Standards, Vol. 28, 1942, p.l.
Page 289
271
(182) Miyoshi, E., Hasebe, S. and Bessyo, K., nW-DC-968-76, 1976.
(183) Matsuda, F., Trans. Nation. Res. Inst Metals, Vol. 9, 1967, p.335.
(184) Watanabe, K. and Matsuzaka, T., Preprint of the National Meeting of JWS,
No. 12, spring, 1973, p.54 .
(185) Masumoto, H., Ohno, Y. and Sekino, S., Preprint of the National Meeting of
JWS, No. 15, Autumn, 1974, p. 147.
(186) Ohno, Y,. Habu, R. and sekino, S., Tetsu-to-Hagane, Vol. 58, 1972, p.306.
(187) Tanaka, J., Ikoma, T. and Takamura, T., Preprint of the National Meeting of
JWS, No. 13, Autumn, 1973, p.104.
(188) Tomita, Y., Yamaba, R., Haze, T., Ito, K. and Okamoto, K., Conf. Proc. of
Fifth International Offshore Mechanics and Arctic Engineering (OMAE) Symposium,
Vol. n, Tokyo, 1986, p.381.
(189) Lundin, CD., Menon, R. and Chen, Z., Conf. Proc. on "Trends in Welding
Research", Gatlinburg, Tennessee, May, 1986, p.559.
(190) Ito, Y. and Nakanishi, M., Jnl Jpn. Weld. Soc, No.41, 1972, p.59.
(191) Balaguer, J.P., Wang, Z. and Nippes, E.F., Weld. Jnl. Res. Suppl, April, 1989,
p.l21s.
(192) Military specification, MTL-S-24645(SH), Steel Plate, Sheet or Coil, Age-
Hardening Alloy, Structural High Yield Strength (HSLA-80), Naval Sea Systems
Command, Department of the Navy, Washington, DC, September 4,1984.
(193) Hicho, G.E., Singhal, S., Smith, L.C and Fields, R.J., Conf. Proc. on
"Technology and applications of H S L A steels", Philadephia, American Society for
Metals, Oct, 1983, p.705.
Page 290
272
(194) Hicho, G.E., Brady, C.H., Smith, L.C and Fields, R.J., Jnl. of Heat Treating,
Vol. 5, No. 1, 1987, p.7.
(195) ABE, T. Kurihara, M., Tagawa, H. and Tsukada, K., Trans. ISU, Vol. 27, 1987,
p.479.
(196) Philips, R.H., Aust. Weld. Jnl, Winter, 1982, p.31.
(197) Jessman, R.J. and Schmid, G.C, Weld. Jnl. Res. Suppl. Vol. 62, Nov., 1983,
p.320s.
(198) Deb, P., Challenger, K.D. and Burna, R.F., Mat. Sci. Tech., Vol.1, Nov., 1985,
p. 1000.
(199) Vandermeer, R.A. and Void, C.L., Conf. Proc on "Trends in Welding Research",
Gatlinburg, Tennessee, May, 1986, p.231.
(200) University of Wollongong, report on High Productivity Welding (HPW), 1989,
Feb. -April, Generic Technology Grant No. 15020.
(201) Australian Standard AS1858, Electrodes and Fluxes for Submerged-Arc Welding,
Part 1-Carbon Steels and Carbon-Manganese Steels.
(202) CSIRO Division of Manufacturing and Technology, Australia, Quarterly Report on
High Productivity Welding, May-Aug., 1990, Generic Technology Grant No. 15020.
(203) CSIRO Division of Manufacturing and Technology, Quarterly Report on High
Productivity Welding, Sept, 1990-Jan., 1991, Generic Technology Grant No. 15020.
(204) Gray, T.G.F., Spence, J. and North, T.H., Rational Welding Design, 1975,
Newnes-Butterworths.
(205) Australian Standard AS 1817, "Mathod for Vicker Hardness Test", Part 1, Testing
of Metals, 1976.
Page 291
273
(206) Moroney, M.J., "Facts from Figures", Penguin Books Ltd., 1958, p.243.
(207) Australian Standard 1391,1974, Methods for tensile testing of metals.
(208) Lin, X. and Dunne, D.P., Conf. Proc on "Image Analysis", Image Analysis
Society of Australia, University of Melbourne, 24-26th Sept, 1990.
(209) Beraha, E. and Shpigler, B., "Color Metallography", ASM, 1977, p.47.
(210) Speich, C, Metals Handbook, Vol. 8, 8th Edition, "Metallography, Structures and
Phase Diagrams", A S M , 1973, p.197.
(211) Ke, G. and Yao, W., Conf. Proc on "HSLA Steels-Metallurgy and Applications",
Beijing, China, 1985, p.369.
(212) Araki, T., Shibata, K. and Enomoto, M., Conf. Proc. of 6th International
Conference on "Martensitic Transformations", Vol. 1, Sydney, Australia, July, 1989,
Ed., B.C. Muddle, Trans Tech Publications, p. 275.
(213) Habraken, L.J. and Economopoulos, M., Conf. Proc on "Transformation and
Hardenability in Steels", 1967, Climax Molybdenum Co. of Michigan, p.69.
(214) Zhang, S., Zhang, H. and Yuan, Y., Conf. Proc on "HSLA Steels-Metallurgy
and Applications", Beijing, China, 1985, p. 113.
(215) Yan, Z., Cao, R. and Ma, H., Conf. Proc on "High Strength Low Alloy Steel",
Wollongong, Australia, Aug, 1984, p.318.
(216) CSIRO Division of Manufacturing and Technology, Quarterly Report on High
Productivity Welding, Nov. 1989-Jan. 1990, Generic Technology Grant No. 15020.
(217) CSIRO Division of Manufacturing and Technology, Quarterly Report on High
Productivity Welding, Feb.-Apr. 1990, Generic Technology Grant No. 15020.
Page 292
274
(218) Military Standard, Mil-E-23765/2C (SH), 1983, U.S. Dept of Defense.
(219) Fegredo, D.M., in Electron Microfractography, A symposium presented at the
Seventy-first Annual Meeting, American Society for Testing and Materials, San
Francisco, Calif, 23-28 June, 1968, p.60.
(220) Krishnadev, M.R., Cutler, L.R., Sojka, G.J., Gauvin, P. and Hamel, G.,
"Fractography and Materials Science", A S T M STP 733, Eds., Gilbertson, L.N. and
Zipp, R.D., American Society for Testing and Materials, 1981, p.394.
(221) Hornbogen, E., Acta Metall, Vol. 10, 1962, p. 1188.
(222) Youle, A. and Ralph, B., Metal Sci. J., Vol. 6, 1972, p. 149.
(223) Goodman, S.R., Brenner, S.S. and Low, J.R., Met. Trans., Vol. 4, Oct, 1973,
p.2363.
(224) Hornbogen, E. and Glenn, R.C, Trans. TMS-AIME, Vol. 218, 1960, p. 1064.
(225) Speich, G.R., Gula, J.A. and Fisher, R.M., "The Electron Microprobe", 1966,
Eds., McKinley, T.D., Heinrich, K.F.J. and Wittry, D.B., Wiley, New York, p.525.
(226) Hornbogen, E., Acta Metall., Vol. 10, 1962, p.525.
(227) Simpson, I. and Moore, L., Plate and Strip Development Technical Note, BHP
steel, Slab and Plate Product Division (SPPD), Port Kembla, PK/MD/87/004, Oct.,
1987.
(228) Hansen, M., "Constitution of Binary Alloys", 1958, McGraw-Hill, New York.
(229) Aaronson, H.I., Domian, H.A. and Pound, G.M., Trans. TMS-ATME, Vol. 236,
1966, p.768.
Page 293
275
(231) Chen, J.H., Kifuta, Y., Araki, T., Toneda, M. and Matsuda, Y., Acta Metall,
Vol. 32, 1984, p.1779.
(232) Kim, N.J. and Thomas, G., Met. Trans., Vol. 12A, 1981, p. 483.
(233) Yurioka, N. and Suzuki, H., International Materials Reviews, Vol. 35, No. 4,
1990, p. 217.
Page 294
276
PUBLICATIONS
Page 295
277
Lin, X. and Dunne, D.P., 'Microstructural and Hardness Changes in the Weld H A Z of a
Cu Bearing H S L A Steel after Intercritical and Subcritical Postweld Heat Treatment',
Conf. Proc on "Material United in the Service of Man", T M M A and WTIA, Perth, 17th-
21st, Sept., 1990, p.9-3.
Lin, X. and Dunne, D.P., 'Quantitative Analysis of Martensite-Austenite Islands in the
Weld Zone of a Plate Steel', Con. Proc. of Image Analysis, Image Analysis Society of
Australia, University of Melbourne, 24th-26th, Sept, 1990.
Lin, X. and Dunne, D.P., 'Microstructural and Hardness Gradients Across the H A Z of a
Sub, Arc Welded Cu-bearing Structural Steel', Submitted to Australian Welding Journal.
W . Pang, X. Lin, D.P. Dunne and N.U. Ahmed, 'Low Carbon Equivalent H S L A Plate
Steel for High Input Welding', 35th Conference of Southeast Asia Iron and Steel
Institute, Wollongong, 20th-22nd, May, 1991.