There has been substantial interest from researchers in the development and contribution of modules in NS2. One of the challenges in NS2 modeling is to seamlessly integrate real world traffic data into the NS2 network model. Normally the traffic in NS2 is generated from the traffic agents such as TCP and UDP agents whose parameters are based on certain statistical distribution. The aim of this paper is to demonstrate how traffic agents in NS2 simulator are used to generate different types of traffic based on real traffic network. In this work, a modified sniffer program was used to capture real traffic data from a production network and output to a traffic text file. This traffic test file is then used by the NS2 traffic agents in the simulated network model representing the real production network. To validate that the simulation works accurately, the output trace file of NS2 after simulation is compared with the traffic generated at the destinations of the production network. Error percentage and t-test data analyses were conducted. It was found, based on comparisons that the difference was nearly zero for traffic captured for duration of around 15 minutes simultaneously generated from four different production sites.
Keywords: NS2 Simulator, Traffic Agents, TCP, UDP, Real World Traffic Generator, Sniffer, T Test Validation.
1. INTRODUCTION
In the network research area, it is time
consuming and costly to deploy a complete experimental testbed containing multiple networked components such as computers, routers and data links to validate and verify a specific network algorithm or a certain network protocol.
The use of network simulators in these cases will save the time and money in accomplishing this task. Network simulators are also mostly useful in allowing the network researchers and designers to test new or to modify existing networking protocols in a controlled and reliable manner [1].
Network simulator is a pure event based simulator and can be of two types [2]:
• Discrete event simulator.
• Continuous event simulator.
Discrete event simulator: In discrete event simulator, the representation of time is quantified and the system state changes only when an event occurs. For example, arrival of person in queue of railway reservation or departure of person from ticket booth after taking ticket. Here, state values are always integer.
Continuous event simulator: Continuous event simulator models time as a continuous progression. Here, state values are always real values. For example, a snake covering distance or water flowing through the mountain.
Generally network simulators are discrete event simulators. As shown in table 1, network simulators can be categorized according to commercial and open source based.
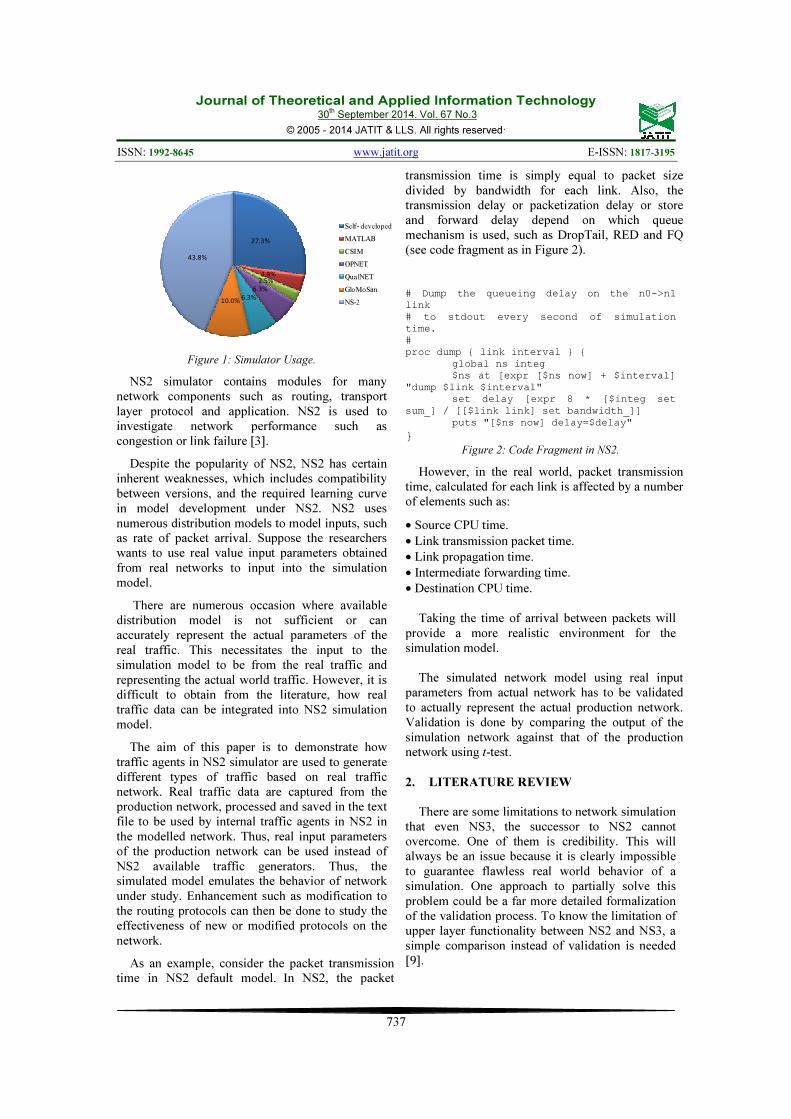
Network simulator 2 or NS2 is an object-oriented discrete event network simulator. It offers various facilities for simulation of network protocols based on TCP, UDP, routing and multi-distribution (broadcast and multicast) in the (wired or wireless) networks [3, 4]. NS2 is very popular in research because it is open-source with plenty of components library. Non-benefit organizations contribute a lot of the components library and this has made the development NS2 to be very successful [1]. Figure 1 shows the extensive use of NS2 compared to other simulation or development tools [5].
Table 1: Network Simulator.
Network Simulators Name
Commercial OPNET, QualNet
Open source NS2, NS3, OMneT++ , SSFNet, J-Sim
Journal of Theoretical and Applied Information Technology 30
NS2 simulator contains modules for many network components such as routing, transport layer protocol and application. NS2 is used to investigate network performance such as congestion or link failure [3].
Despite the popularity of NS2, NS2 has certain inherent weaknesses, which includes compatibility between versions, and the required learning curve in model development under NS2. NS2 uses numerous distribution models to model inputs, such as rate of packet arrival. Suppose the researchers wants to use real value input parameters obtained from real networks to input into the simulation model.
There are numerous occasion where available distribution model is not sufficient or can accurately represent the actual parameters of the real traffic. This necessitates the input to the simulation model to be from the real traffic and representing the actual world traffic. However, it is difficult to obtain from the literature, how real traffic data can be integrated into NS2 simulation model.
The aim of this paper is to demonstrate how traffic agents in NS2 simulator are used to generate different types of traffic based on real traffic network. Real traffic data are captured from the production network, processed and saved in the text file to be used by internal traffic agents in NS2 in the modelled network. Thus, real input parameters of the production network can be used instead of NS2 available traffic generators. Thus, the simulated model emulates the behavior of network under study. Enhancement such as modification to the routing protocols can then be done to study the effectiveness of new or modified protocols on the network.
As an example, consider the packet transmission time in NS2 default model. In NS2, the packet
transmission time is simply equal to packet size divided by bandwidth for each link. Also, the transmission delay or packetization delay or store and forward delay depend on which queue mechanism is used, such as DropTail, RED and FQ (see code fragment as in Figure 2).
# Dump the queueing delay on the n0->n1 link # to stdout every second of simulation time. # proc dump { link interval } { global ns integ $ns at [expr [$ns now] + $interval] "dump $link $interval" set delay [expr 8 * [$integ set sum_] / [[$link link] set bandwidth_]] puts "[$ns now] delay=$delay"
}
Figure 2: Code Fragment in NS2.
However, in the real world, packet transmission time, calculated for each link is affected by a number of elements such as:
• Source CPU time.
• Link transmission packet time.
• Link propagation time.
• Intermediate forwarding time.
• Destination CPU time.
Taking the time of arrival between packets will provide a more realistic environment for the simulation model.
The simulated network model using real input
parameters from actual network has to be validated to actually represent the actual production network. Validation is done by comparing the output of the simulation network against that of the production network using t-test.
2. LITERATURE REVIEW
There are some limitations to network simulation that even NS3, the successor to NS2 cannot overcome. One of them is credibility. This will always be an issue because it is clearly impossible to guarantee flawless real world behavior of a simulation. One approach to partially solve this problem could be a far more detailed formalization of the validation process. To know the limitation of upper layer functionality between NS2 and NS3, a simple comparison instead of validation is needed [9].
Journal of Theoretical and Applied Information Technology 30
A. SINGH AND P. DASHORE [10] studied the two protocols UDP and TCP to recognize the key difference between them based on their bandwidth (performance). NS2 simulator was used for designing and studying wired network, where the TCP and UDP were compared on the basis of the data transfer features, basic operation and applications. Differences in data transfer TCP provides reliable and ordered delivery of data from user to server and vice versa. UDP is connection less protocol and does not ensure the reliable delivery of data. TCP and UDP are different from each other on the basis of data transfer features.
To achieve the new requirements of the MANETs applications such as exponential on/off, pareto on/off and telnet, A. P. D. S. T. Hasson, A. J. Kadhim, and Z. S. Talib [11] proposed required modifications in “cbrgen” file by rebuilding it to generate additional types of traffics. This file was used to generate the traffic rates by generating random connections between source nodes and destinations. The original "cbrgen" file generated only CBR and TCP traffics.
N. I. Sarkar [12] investigates the impact of traffic arrival distributions (Exponential, Pareto, Poisson, and Constant bit rate) on a typical 802.11 ad hoc network using simulation and modeling. The outcome shows that the network performance for Poisson arrival is almost independent of traffic load for TCP and UDP but not for Constant bit rate (CBR). However, for both the Pareto and Exponential packet arrivals, the network performance is almost independent of load for TCP, but is sensitive to UDP
D. Mahrenholz and S. Ivanov [13] proposed a method to configure the simulation using real-world parameters and verified by experiment that emulation behaves the same way as the live network. The current setup imposes some tight limitations on the scalability of the simulation complexity.
In NS2, it is easy to generate the traffic by using the available distribution model, but it is more difficult to produce traffic, which can exhibit real characteristics such as the ones observed in the Internet, A. Varet and N. Larrieu [14], developed a tool entitled “SourcesOnOff” by considering several statistical laws and combined their effects to model the generated traffic which is closer to reality.
Network traffic generators are validated by metrics such as traffic characteristics. However, it is extremely difficult to evaluate validation results
and compares different traffic generators. Thus, researchers such as S. Molnar, P. Megyesi, and G. Szabo [15] advocate the research for finding a common set of metrics for the validation and comparative evaluation of traffic generators.
R. G. Sargent [16] gives a general introduction to verification and validations of simulation models, define the various validation techniques, and present a recommended model validation procedure.
J. P. Kleijnen [17] discusses verification in good
programming practice through modular programming, checking the simulation output through tracing and statistical testing such as Schurben-Turing and t test.
R. G. Sargent [18] discusses practical approaches on verification and validation of simulation models. He recommends eight steps to be performed in verification and validation model such as specify the acceptable range of accuracy required by the simulation models, wherein in every model iteration, at least face validity on the conceptual model and test are performed.
3. NS2 SIMULATOR
NS2 which is a part of the VINT project (Virtual Inter Network Testbed) is developed in C++. It uses IU OTCL interpreter. Through this language, the user can describe conditional parameters of the simulation such as network topology, selected from various physical links, readily used protocols, etc. The user can also create new objects in C++ and use them in NS2 by instantiations with OTCL. Here, the two languages C++and OTCL have both very close hierarchies to each other [3, 4, 6].
3.1 Communication Entity in NS2
The node (communicating entity) is the basic element of NS2 model. A node in NS2 is a class defined in OTCL which has three entities containing the classifier, the link and the agent [3].
3.2 Classifier
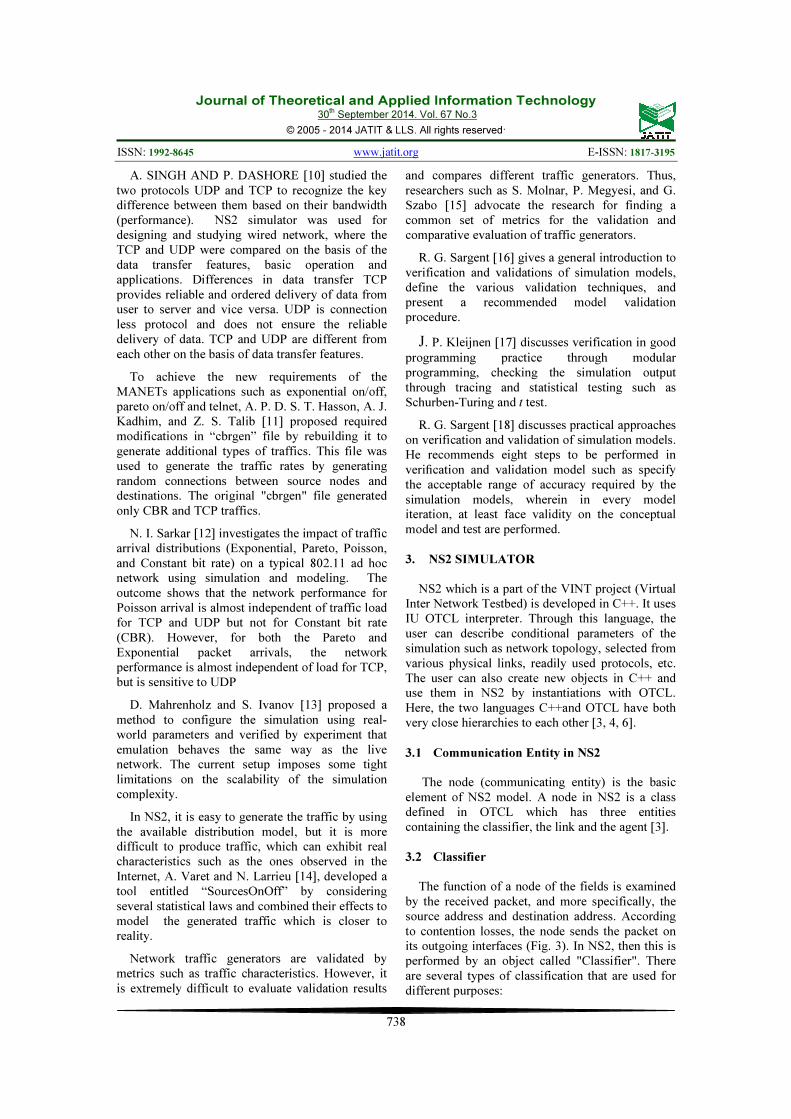
The function of a node of the fields is examined by the received packet, and more specifically, the source address and destination address. According to contention losses, the node sends the packet on its outgoing interfaces (Fig. 3). In NS2, then this is performed by an object called "Classifier". There are several types of classification that are used for different purposes:
Journal of Theoretical and Applied Information Technology 30
• "Address classifiers" is used to treat unicast packets. It’s role is directly to select packets addresses, direct the node, and select the link to the next node.
• "Port classifier" role is to select the agent to the packet which it is intended.
• "Multicast classifier" classifies packets according to both source and destination (group) addresses.
• "Multipath classifier" is devised to support equal cost multipath forwarding, where the node has multiple equal cost routes to the same destination.
• "Hash classifier" is used to classify a packet as a member of a particular flow.
3.3 Link
A link is used to connect the nodes to each other (Fig. 3). A link is defined by several parameters including: bandwidth, entry point, the lifetime of each packet, etc.
NS2 has several types of links, so we can distinguish unidirectional links from bidirectional links and wired links to wireless networks model without sound [3].
CBR
UDP Agent
(Sending)
Null Agent
(Receiving)
0
agent
_
Attach-agent
target_
Attach-agent
connectapp
_
target_
app
_
Node 3
dmu
x_
classifi
er_
Node 1
dmu
x_
classifi
er_
Node 2
Application (User demand indication)
Agents (Packet construction and destruction)
Low-Level Network (Packet Fordwarding)
A N
etw
ork
of
Ns
Ob
jects
Figure 3: The Existing Entities in a Node and the Links
between Entities.
3.4 Agent
Agents represent endpoints where packets in the network layer are constructed and consumed. These agents are the third component of the node. In NS2, the agent's role is to provide the destination address; its function is to generate the packets and the interface to the application class (Fig. 3). In NS2 there are several types of agents, each has a specified role [3]. The four types of agents and their roles are defined as follows:
• TCP agent is for emitting TCP traffic.
• UDP agent is for emitting UDP traffic.
• TCPSink agent is for the receipt of TCP traffic.
• NULL Agent is for receiving UDP packets.
3.5 TCL Language
Tool Command Language or Tcl; is a scripting language created by John Ousterhout. It is commonly used for rapid prototyping, scripted applications, GUIs and testing. Tcl is used on embedded systems platforms, both in its full form and in several other small-footprint versions [7].
Advantage of using Tcl language in NS2 is, it does not need special editors, nor does it have any complex structure that needs to be followed during coding. The sequence of statements is also not necessary to be maintained, as it automatically fetches the required instructions for topology generation and other task as and when required.
3.6 AWK Language
The AWK utility is an interpreted programming language typically used as a data extraction and reporting tool. It is a standard feature of most Unix-like operating systems. AWK was created at Bell Labs in the 1970s, and its name is derived from the family names of its authors –Alfred Aho, Peter Weinberger, and Brian Kernighan [8].
AWK uses a data-driven scripting language. It consists of a set of actions to be taken against textual data (either in files or data streams) for the purpose of producing formatted reports. AWK Scripts are very good in processing the data from the log (trace files) which we get from NS2. it is necessary for the researchers to know the throughput of the network, packet delivery ratio, calculating the send, received, dropped packets, and average end to end delay [8] .
4. METHODOLOGY
Our ultimate goal in this work is to integrate real
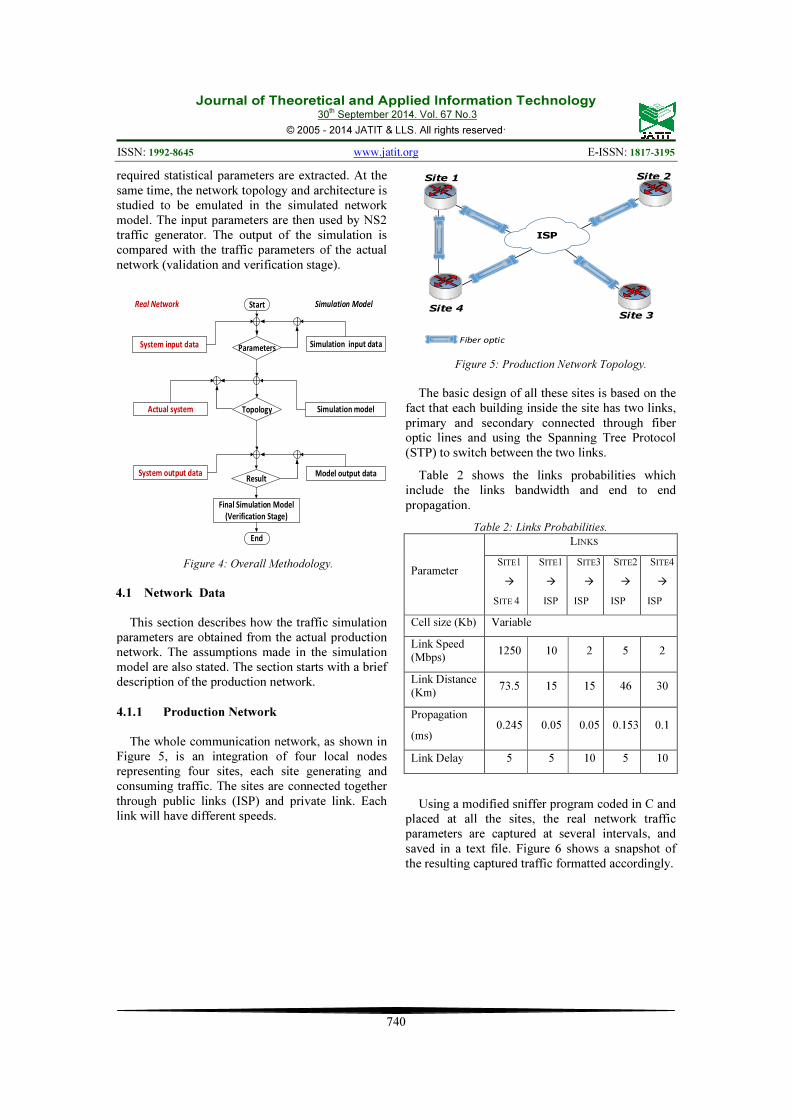
live traffic parameters from a real production network into a network simulation model. The network simulation model is itself a representation of the production network. If the network model representation of the real network is accurately modeled, then together with the real live traffic parameters, the simulated network model will produce an output similar to the one generated by the real production network. Figure 4 gives an overview of this framework.
The left part of the figure 4 represents the actual production network where traffic is captured and
Journal of Theoretical and Applied Information Technology 30
required statistical parameters are extracted. At the same time, the network topology and architecture is studied to be emulated in the simulated network model. The input parameters are then used by NS2 traffic generator. The output of the simulation is compared with the traffic parameters of the actual network (validation and verification stage).
System input data Simulation input data
Actual system Simulation model
System output data Model output dataResult
Final Simulation Model
(Verification Stage)
Parameters
Topology
Start
End
Real Network Simulation Model
Figure 4: Overall Methodology.
4.1 Network Data
This section describes how the traffic simulation
parameters are obtained from the actual production network. The assumptions made in the simulation model are also stated. The section starts with a brief description of the production network.
4.1.1 Production Network
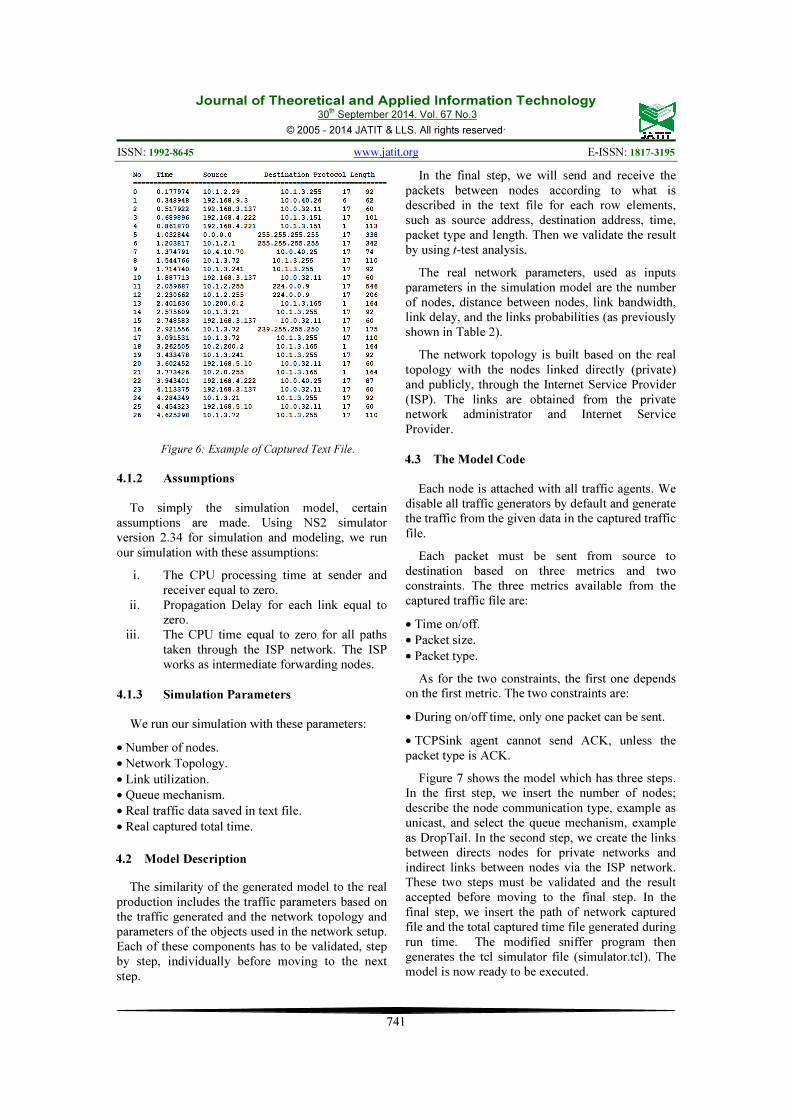
The whole communication network, as shown in Figure 5, is an integration of four local nodes representing four sites, each site generating and consuming traffic. The sites are connected together through public links (ISP) and private link. Each link will have different speeds.
Site 1 Site 2
Site 3Site 4
ISP
Fiber optic
Figure 5: Production Network Topology.
The basic design of all these sites is based on the
fact that each building inside the site has two links, primary and secondary connected through fiber optic lines and using the Spanning Tree Protocol (STP) to switch between the two links.
Table 2 shows the links probabilities which include the links bandwidth and end to end propagation.
Table 2: Links Probabilities.
Parameter
LINKS
SITE1
�
SITE 4
SITE1
�
ISP
SITE3
�
ISP
SITE2
�
ISP
SITE4
�
ISP
Cell size (Kb) Variable
Link Speed (Mbps)
1250 10 2 5 2
Link Distance
(Km) 73.5 15 15 46 30
Propagation
(ms) 0.245 0.05 0.05 0.153 0.1
Link Delay 5 5 10 5 10
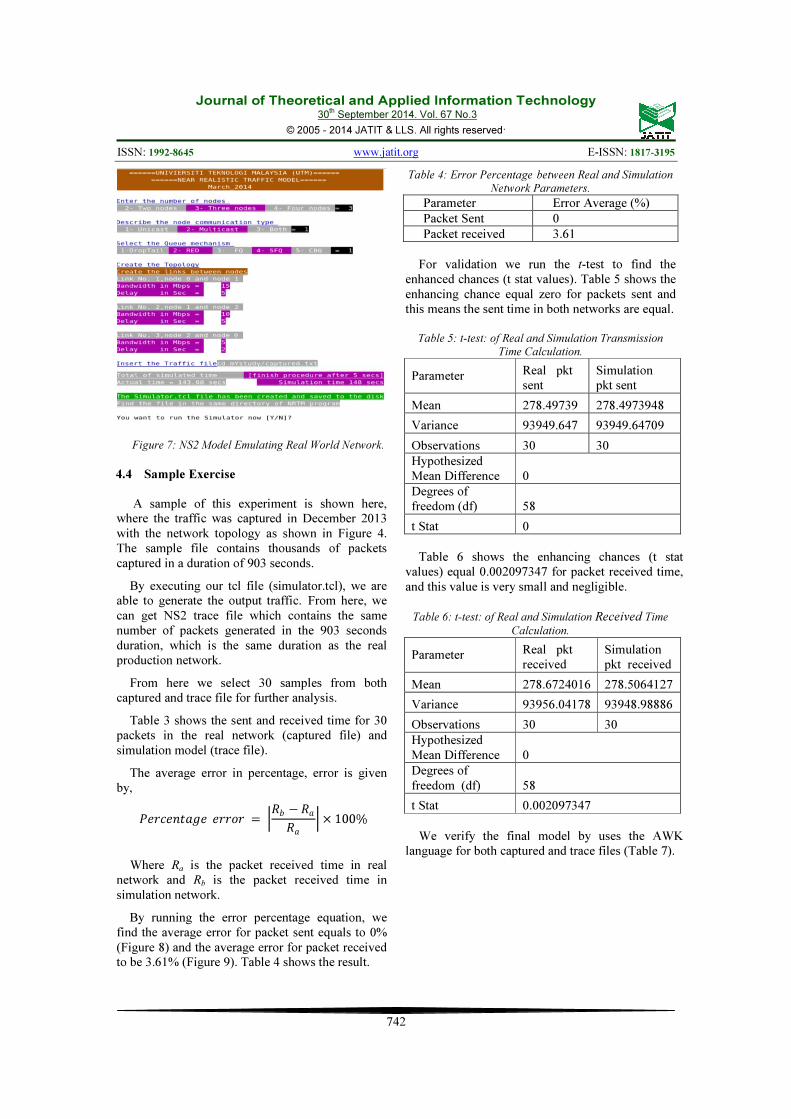
Using a modified sniffer program coded in C and placed at all the sites, the real network traffic parameters are captured at several intervals, and saved in a text file. Figure 6 shows a snapshot of the resulting captured traffic formatted accordingly.
Journal of Theoretical and Applied Information Technology 30
To simply the simulation model, certain assumptions are made. Using NS2 simulator version 2.34 for simulation and modeling, we run our simulation with these assumptions:
i. The CPU processing time at sender and receiver equal to zero.
ii. Propagation Delay for each link equal to zero.
iii. The CPU time equal to zero for all paths taken through the ISP network. The ISP works as intermediate forwarding nodes.
4.1.3 Simulation Parameters
We run our simulation with these parameters:
• Number of nodes.
• Network Topology.
• Link utilization.
• Queue mechanism.
• Real traffic data saved in text file.
• Real captured total time.
4.2 Model Description
The similarity of the generated model to the real production includes the traffic parameters based on the traffic generated and the network topology and parameters of the objects used in the network setup. Each of these components has to be validated, step by step, individually before moving to the next step.
In the final step, we will send and receive the packets between nodes according to what is described in the text file for each row elements, such as source address, destination address, time, packet type and length. Then we validate the result by using t-test analysis.
The real network parameters, used as inputs parameters in the simulation model are the number of nodes, distance between nodes, link bandwidth, link delay, and the links probabilities (as previously shown in Table 2).
The network topology is built based on the real topology with the nodes linked directly (private) and publicly, through the Internet Service Provider (ISP). The links are obtained from the private network administrator and Internet Service Provider.
4.3 The Model Code
Each node is attached with all traffic agents. We disable all traffic generators by default and generate the traffic from the given data in the captured traffic file.
Each packet must be sent from source to destination based on three metrics and two constraints. The three metrics available from the captured traffic file are:
• Time on/off.
• Packet size.
• Packet type.
As for the two constraints, the first one depends on the first metric. The two constraints are:
• During on/off time, only one packet can be sent.
• TCPSink agent cannot send ACK, unless the packet type is ACK.
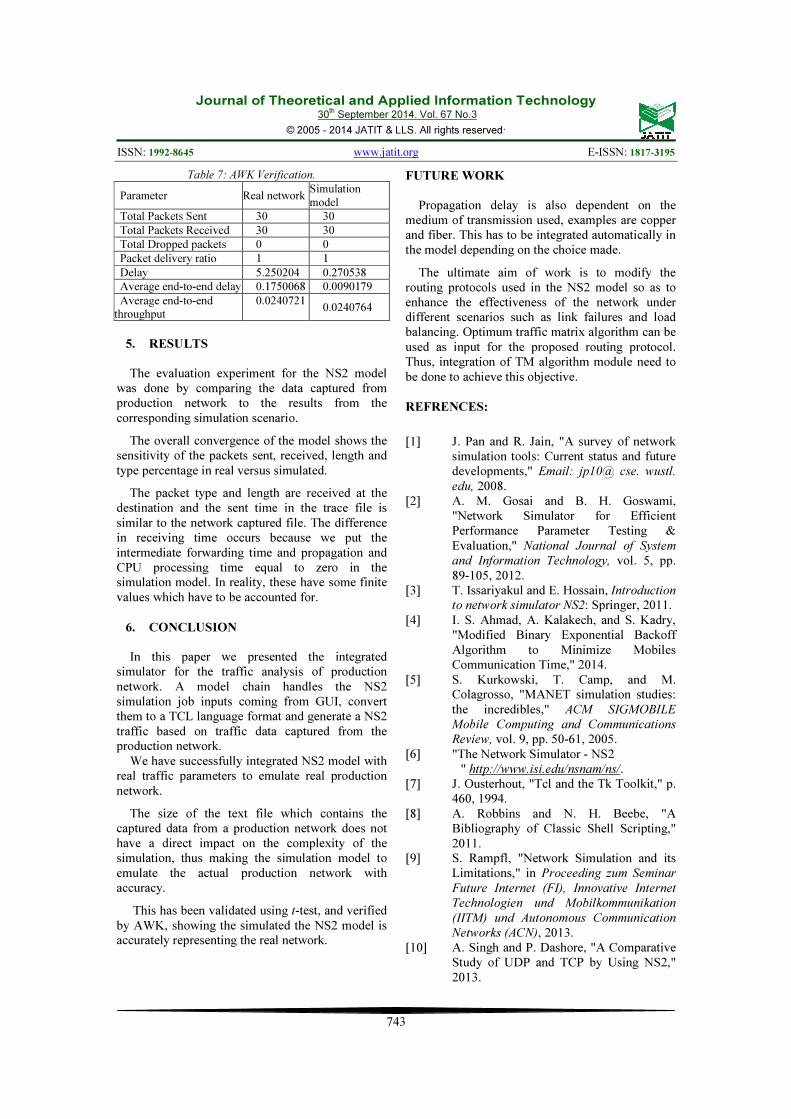
Figure 7 shows the model which has three steps. In the first step, we insert the number of nodes; describe the node communication type, example as unicast, and select the queue mechanism, example as DropTail. In the second step, we create the links between directs nodes for private networks and indirect links between nodes via the ISP network. These two steps must be validated and the result accepted before moving to the final step. In the final step, we insert the path of network captured file and the total captured time file generated during run time. The modified sniffer program then generates the tcl simulator file (simulator.tcl). The model is now ready to be executed.
Journal of Theoretical and Applied Information Technology 30
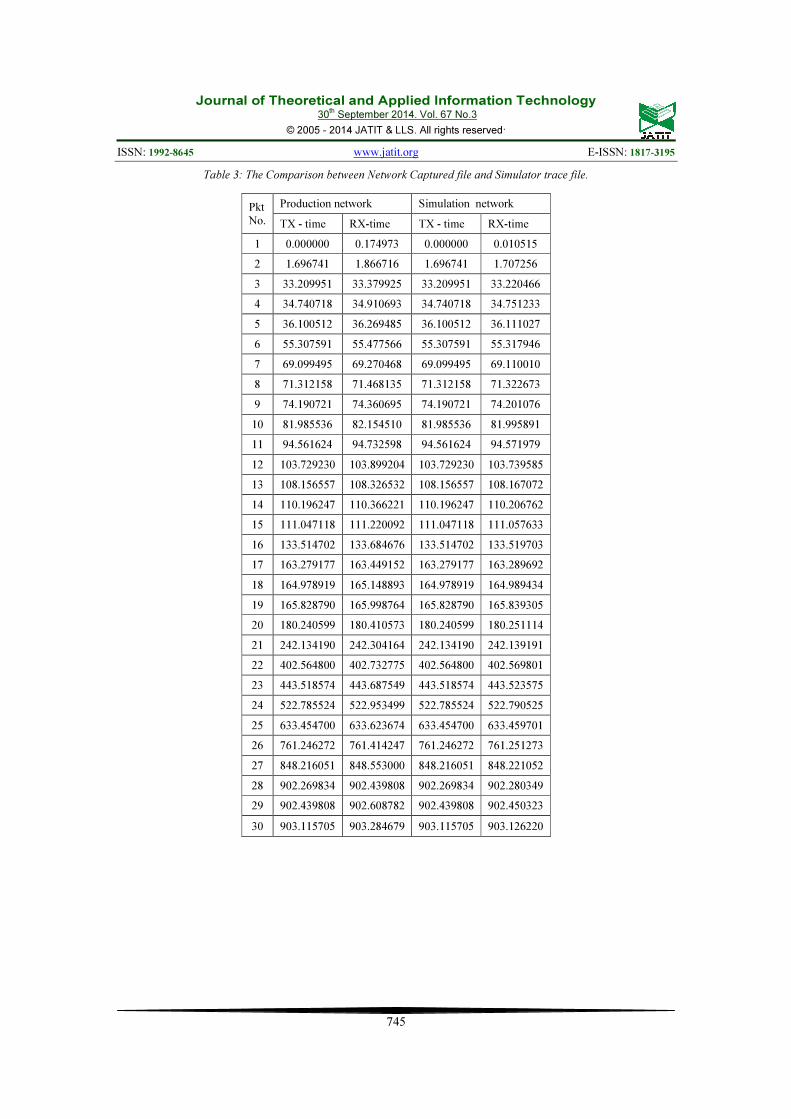
A sample of this experiment is shown here, where the traffic was captured in December 2013 with the network topology as shown in Figure 4. The sample file contains thousands of packets captured in a duration of 903 seconds.
By executing our tcl file (simulator.tcl), we are able to generate the output traffic. From here, we can get NS2 trace file which contains the same number of packets generated in the 903 seconds duration, which is the same duration as the real production network.
From here we select 30 samples from both captured and trace file for further analysis.
Table 3 shows the sent and received time for 30 packets in the real network (captured file) and simulation model (trace file).
The average error in percentage, error is given by,
���������� ���� = �� − ��
��
× 100%
Where Ra is the packet received time in real network and Rb is the packet received time in simulation network.
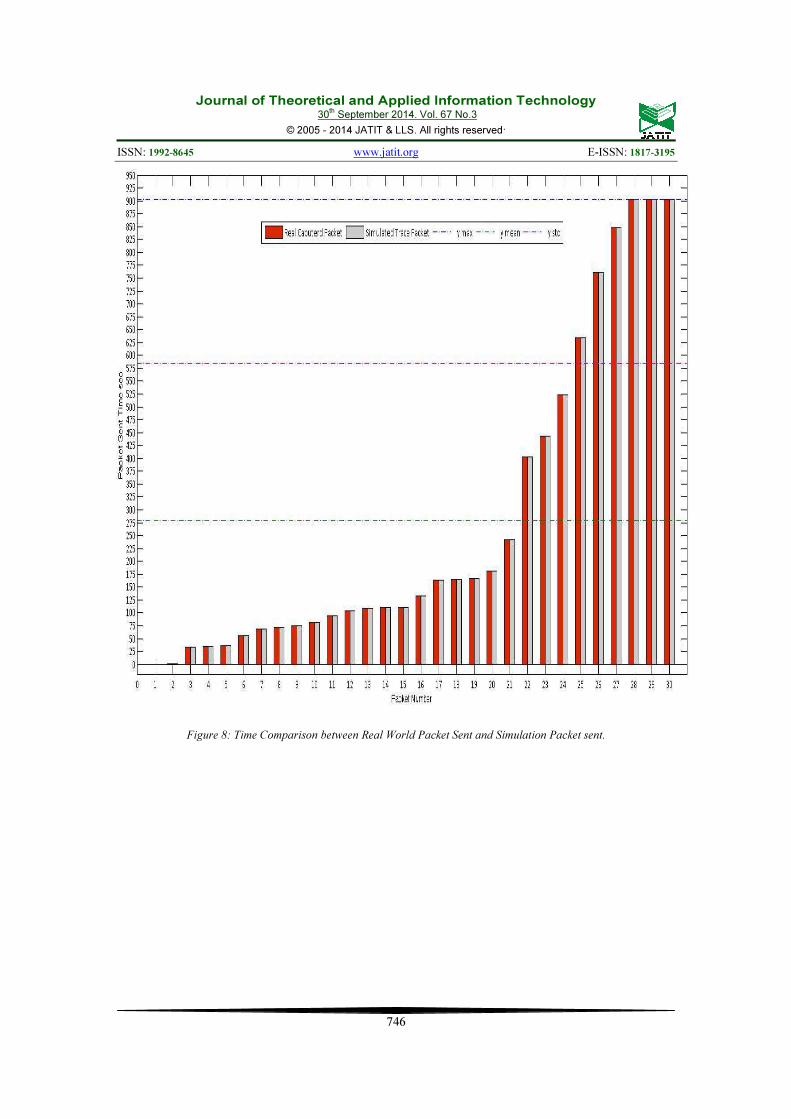
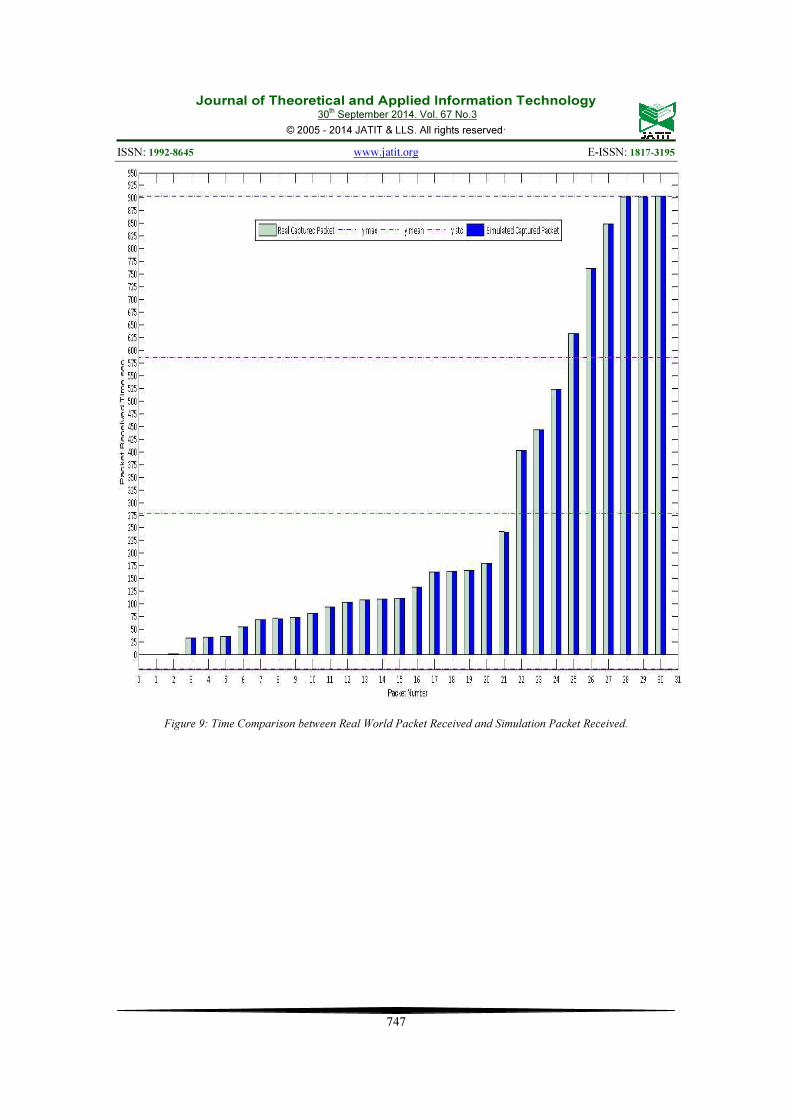
By running the error percentage equation, we find the average error for packet sent equals to 0% (Figure 8) and the average error for packet received to be 3.61% (Figure 9). Table 4 shows the result.
Table 4: Error Percentage between Real and Simulation
Network Parameters.
Parameter Error Average (%)
Packet Sent 0
Packet received 3.61
For validation we run the t-test to find the
enhanced chances (t stat values). Table 5 shows the enhancing chance equal zero for packets sent and this means the sent time in both networks are equal.
Table 5: t-test: of Real and Simulation Transmission
Time Calculation.
Parameter Real pkt sent
Simulation pkt sent
Mean 278.49739 278.4973948
Variance 93949.647 93949.64709
Observations 30 30
Hypothesized Mean Difference 0
Degrees of freedom (df) 58
t Stat 0
Table 6 shows the enhancing chances (t stat
values) equal 0.002097347 for packet received time, and this value is very small and negligible.
Table 6: t-test: of Real and Simulation Received Time
Calculation.
Parameter Real pkt received
Simulation pkt received
Mean 278.6724016 278.5064127
Variance 93956.04178 93948.98886
Observations 30 30
Hypothesized Mean Difference 0
Degrees of freedom (df) 58
t Stat 0.002097347
We verify the final model by uses the AWK
language for both captured and trace files (Table 7).
Journal of Theoretical and Applied Information Technology 30
The evaluation experiment for the NS2 model was done by comparing the data captured from production network to the results from the corresponding simulation scenario.
The overall convergence of the model shows the sensitivity of the packets sent, received, length and type percentage in real versus simulated.
The packet type and length are received at the destination and the sent time in the trace file is similar to the network captured file. The difference in receiving time occurs because we put the intermediate forwarding time and propagation and CPU processing time equal to zero in the simulation model. In reality, these have some finite values which have to be accounted for.
6. CONCLUSION
In this paper we presented the integrated simulator for the traffic analysis of production network. A model chain handles the NS2 simulation job inputs coming from GUI, convert them to a TCL language format and generate a NS2 traffic based on traffic data captured from the production network.
We have successfully integrated NS2 model with real traffic parameters to emulate real production network.
The size of the text file which contains the captured data from a production network does not have a direct impact on the complexity of the simulation, thus making the simulation model to emulate the actual production network with accuracy.
This has been validated using t-test, and verified by AWK, showing the simulated the NS2 model is accurately representing the real network.
FUTURE WORK
Propagation delay is also dependent on the medium of transmission used, examples are copper and fiber. This has to be integrated automatically in the model depending on the choice made.
The ultimate aim of work is to modify the routing protocols used in the NS2 model so as to enhance the effectiveness of the network under different scenarios such as link failures and load balancing. Optimum traffic matrix algorithm can be used as input for the proposed routing protocol. Thus, integration of TM algorithm module need to be done to achieve this objective.
REFRENCES:
[1] J. Pan and R. Jain, "A survey of network simulation tools: Current status and future developments," Email: jp10@ cse. wustl. edu, 2008.
[2] A. M. Gosai and B. H. Goswami, "Network Simulator for Efficient Performance Parameter Testing & Evaluation," National Journal of System and Information Technology, vol. 5, pp. 89-105, 2012.
[3] T. Issariyakul and E. Hossain, Introduction to network simulator NS2: Springer, 2011.
[4] I. S. Ahmad, A. Kalakech, and S. Kadry, "Modified Binary Exponential Backoff Algorithm to Minimize Mobiles Communication Time," 2014.
[5] S. Kurkowski, T. Camp, and M. Colagrosso, "MANET simulation studies: the incredibles," ACM SIGMOBILE Mobile Computing and Communications Review, vol. 9, pp. 50-61, 2005.
[6] "The Network Simulator - NS2 " http://www.isi.edu/nsnam/ns/. [7] J. Ousterhout, "Tcl and the Tk Toolkit," p.
460, 1994. [8] A. Robbins and N. H. Beebe, "A
Bibliography of Classic Shell Scripting," 2011.
[9] S. Rampfl, "Network Simulation and its Limitations," in Proceeding zum Seminar Future Internet (FI), Innovative Internet Technologien und Mobilkommunikation (IITM) und Autonomous Communication Networks (ACN), 2013.
[10] A. Singh and P. Dashore, "A Comparative Study of UDP and TCP by Using NS2," 2013.
Journal of Theoretical and Applied Information Technology 30
[11] A. P. D. S. T. Hasson, A. J. Kadhim, and Z. S. Talib, "Enhancing the NS2 Traffic Generator for the MANETs," IOSR Journal of Computer Engineering (IOSRJCE), ISSN, pp. 2278-0661, 2012.
[12] N. I. Sarkar, "Impact of traffic arrival distributions on an 802.11 ad hoc network: modeling and performance study," 2012.
[13] D. Mahrenholz and S. Ivanov, "Adjusting the NS2 Emulation Mode to a Live Network," in Kommunikation in Verteilten Systemen (KiVS), P. Müller, R. Gotzhein, and J. Schmitt, Eds., ed: Springer Berlin Heidelberg, 2005, pp. 205-217.
[14] A. Varet and N. Larrieu, "Realistic network traffic profile generation: theory and practice," Global Journal of Health Science, vol. 7, 2014.
[15] S. Molnar, P. Megyesi, and G. Szabo, "How to validate traffic generators?," in Communications Workshops (ICC), 2013 IEEE International Conference on, 2013, pp. 1340-1344.
[16] R. G. Sargent, "An overview of verification and validation of simulation models," in Proceedings of the 19th conference on Winter simulation, 1987, pp. 33-39.
[17] J. P. Kleijnen, "Verification and validation of simulation models," European Journal of Operational Research, vol. 82, pp. 145-162, 1995.
[18] R. G. Sargent, "Verification and validation of simulation models," in Proceedings of the 37th conference on Winter simulation, 2005, pp. 130-143.
Journal of Theoretical and Applied Information Technology 30