University of Wollongong Research Online University of Wollongong esis Collection University of Wollongong esis Collections 1995 e application of advanced management accounting: does it improve company performance? Imam Ghozali University of Wollongong Research Online is the open access institutional repository for the University of Wollongong. For further information contact Manager Repository Services: [email protected]. Recommended Citation Ghozali, Imam, e application of advanced management accounting: does it improve company performance?, Doctor of Philosophy thesis, Department of Accountancy, University of Wollongong, 1995. hp://ro.uow.edu.au/theses/1006
Transcript
University of WollongongResearch Online
University of Wollongong Thesis Collection University of Wollongong Thesis Collections
1995
The application of advanced managementaccounting: does it improve companyperformance?Imam GhozaliUniversity of Wollongong
Research Online is the open access institutional repository for theUniversity of Wollongong. For further information contact ManagerRepository Services: [email protected].
Recommended CitationGhozali, Imam, The application of advanced management accounting: does it improve company performance?, Doctor of Philosophythesis, Department of Accountancy, University of Wollongong, 1995. http://ro.uow.edu.au/theses/1006
THE APPLICATION OF ADVANCED MANAGEMENT ACCOUNTING: DOES IT IMPROVE COMPANY PERFORMANCE?
A thesis submitted in fulfilment of the requirements for the award of the degree
DOCTOR OF PHILOSOPHY
from
UNIVERSITY OF W O L L O N G O N G
I M A M GHOZALI, Drs, M C o m
Department of Accountancy
August 1995
I, I m a m Ghozali, certify that this thesis has not been submitted previously as part of the requirements of another degree and that it is the product of m y own independent research.
Signed: a m Ghozali
ACKNOWLEDGEMENTS
I would like to thank several individuals and organisations for their help
and support during the writing of this thesis.
Special thanks go to Dr. Gary J. Linnegar, Associate Professor in
Accounting and Finance who guided me from the inception of my topic to the
completion of this thesis. He demanded a great deal of me, but gave far more of
himself. His encouragement, wisdom, knowledge, and patience provided me with
the necessary support. I will forever be in his debt.
I would also like to thank to Prof. Dr. Michael JR Gaffikin, The Head
Department of Accountancy, University of Wollongong , who has given me an
opportunity to take Ph.D program at the University of Wollongong. Without his
assistance I would never get into Ph.D program.
I am indebted to the chief accounting officers of firms in Australia who
responded to the request for information about their companies. Without their co
operation, the study could not have been possible.
Thanks is extended to the Australian International Development Assistance
Bureau (AIDAB) which provided my scholarship for studying my PhD program
at the University of Wollongong.
I express sincere thanks to the following faculty members, with whom I
work at the Diponegoro University, for their encouragement. These are Prof. Dr.
Soewito, former dean and Dr. Sujudi M., dean at the Faculty of Economics,
Diponegoro University who allowed me to take my PhD program abroad. Drs.
iii
Mudji Rahardjo, S U and Drs. Sugiyanto, M S were also very helpful in this
regard.
Thanks is also extended to the faculty members, staff, and doctoral
students at the University of Wollongong for their help and friendships. Special
thanks to the Indonesian doctoral students at this university. Without them I will
not have survived.
Finally, I wish to express my gratitude and appreciation to the three people
who mean the most to me and who have given so much of themselves to help me
through these graduate years. First, I want to thank my daughters Karlina Aprilia
Kusumadewi and Diana Atika Ghozali. Although I have tried to participate in
many of their activities, I have also missed many. They have always understood
and encouraged me. Second, I wish to express my appreciation to my wife,
Sulistiyani. It was her encouragement which gave me the impetus to enter the PhD
program. She gave so much of herself to see me through. She suffered the times
of uncertainty that I went through in the thesis years. Without her, I would have
never been able to complete this thesis. It is to her that I dedicated this thesis.
Sulistiyani, Thank You.
iv
THE APPLICATION OF ADVANCED MANAGEMENT ACCOUNTING: DOES IT IMPROVE COMPANY PERFORMANCE?
ABSTRACT The major purposes of this study were twofold: (1) to determine the
relationship between certain contextual variables of firm characteristics and the application of advanced management accounting techniques, and (2) to identify how firm performance is affected by contextual variables and the application of advanced management accounting techniques. Eight hypotheses were formulated to accomplish the study purpose
A questionnaire was developed to gather data. The sampling frame of the population was the Top 500 listed Australian companies. A pilot study of 100 questionnaires were sent to the respondents. Revised questionnaires were mailed to all Top 500 Australian companies. T w o types of statistical analysis were adopted to test the hypotheses. Hypothesis one was tested using multiple logistic regression model. Hypotheses two through eight were tested using nonparametric statistical test, Mann-Whitney U test.
The study found that the extent of use of advanced management accounting techniques and firm size significantly reduce the probability the firm will perform above average performance of the sample firm. But the interaction variables provide evidence that any separation of size and capital intensity effect from the extent of the use of management accounting techniques is problematic. Looking at the interaction variables the results show that large firms that applied advanced management accounting techniques extensively significantly increase the probability the firm will perform above average performance of the sample firms. It is also true for high capital intensive firms that applied advanced management accounting techniques extensively.
The study also observed that contextual variables of firm characteristics influenced the application of management accounting techniques. Contextual variables age, type of industry, capital intensity, and leverage have significant influenced on the application of advanced management accounting techniques type I, II and HI. Firm size has significant influence on the application of advanced management accounting techniques type I and III. Firm risk also only has significant influence on the application of advanced management accounting techniques type II and DDL But in terms of ownership, there is no difference between public listed domestic firms and public listed foreign firms in applying management accounting techniques.
V
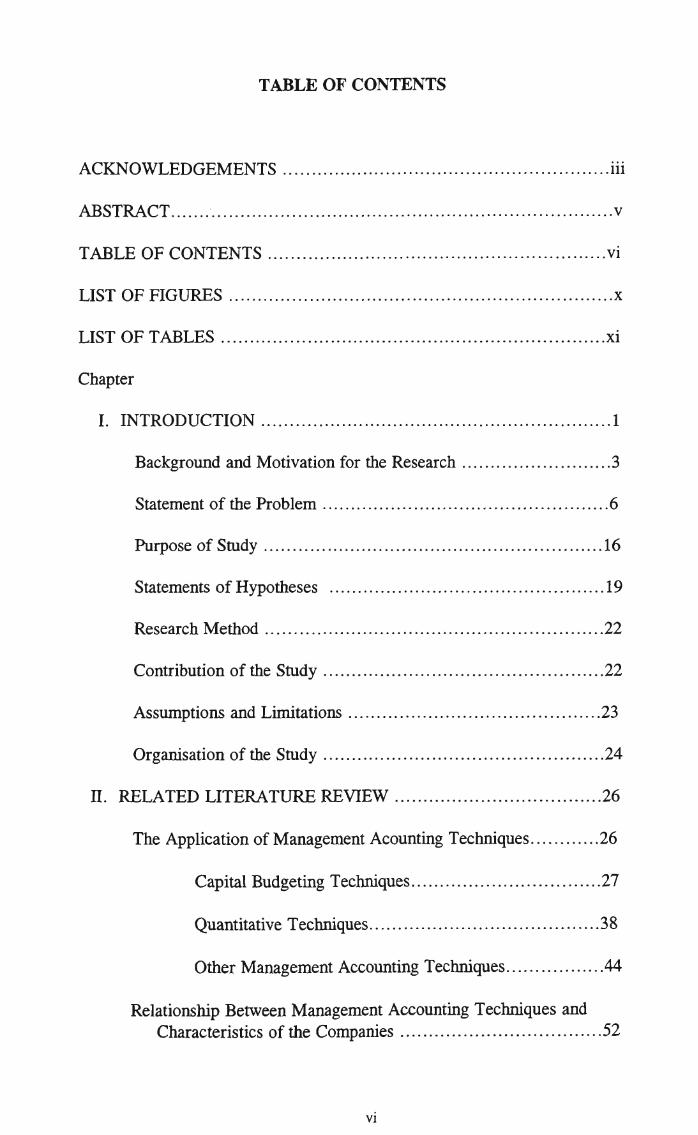
T A B L E O F C O N T E N T S
A C K N O W L E D G E M E N T S hi
ABSTRACT v
TABLE OF CONTENTS vi
LIST OF FIGURES x
LIST OF TABLES xi
Chapter
I. INTRODUCTION 1
Background and Motivation for the Research 3
Statement of the Problem 6
Purpose of Study 16
Statements of Hypotheses 19
Research Method 22
Contribution of the Study 22
Assumptions and Limitations 23
Organisation of the Study 24
n. RELATED LITERATURE REVIEW 26
The Application of Management Acounting Techniques 26
Capital Budgeting Techniques 27
Quantitative Techniques 38
Other Management Accounting Techniques 44
Relationship Between Management Accounting Techniques and Characteristics of the Companies 52
vi
Organisation Size 52
Type of Industry 54
Relationship Between Management Accounting Techniques, Companies' Characteristics and Companies' Performance 58
The Contingent Variables and Their Relationship with Firms Performance 59
The Environment of The Firm 60
The Characteristics of The Firm 63
Summary 68
m. METHODOLOGY AND RESEARCH DESIGN 71
Description of the Study 71
Definition and Operational Measure of the Variables 72
Dependent Variable 72
Independent Variables 73
Advanced Management Accounting Techniques 73
Firm Characteristics 75
Information Sources 76
Population, Sampling Frame and Data Collection Method 77
Hypothesis Development 78
Company Size 79
Company Age 80
Type of Ownership and Industry 81
Capital Intensity 82
Risk and Leverage 83
vii
Statistical Method for Data Analysis 85
Mann-Whitney U Test 85
Multiple Logistic Regression 86
Testing for the Significance of the Model 88
Testing the Individual Coefficients 90
Summary 91
IV. DATA PRESENTATION AND ANALYSIS 93
The Pilot Study 93
Full Scale Study 95
Test for Nonresponse Bias 96
Profile of the Respondents 99
Cross-Classification of the Respondents 101
Management Accounting Practice 103
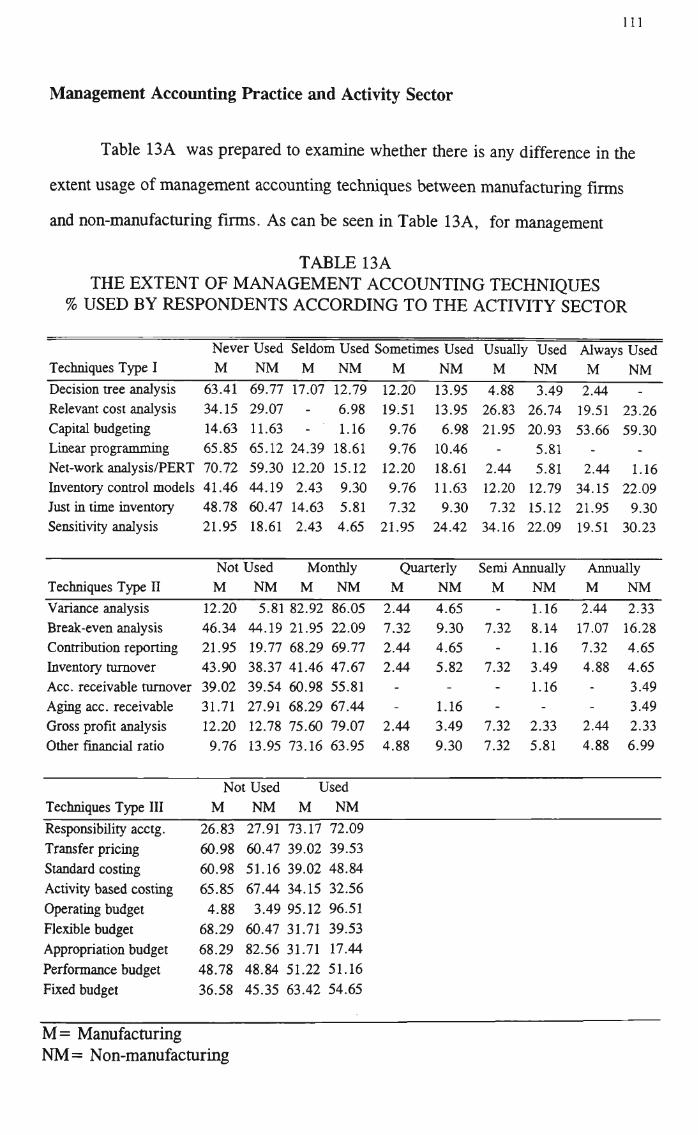
Management Accounting Practice and Activity Sector Ill
Management Accounting Practice and Type of Ownership. 115
Summary 119
V. EVALUATION OF THE STUDY'S HYPOTHESIS 123
Test of Randomness 123
Test of Internal Consistency or Reliability Test 126
Hypotheses Testing 129
Summary 158
VI. SUMMARY AND CONCLUSIONS 164
Summary 165
viii
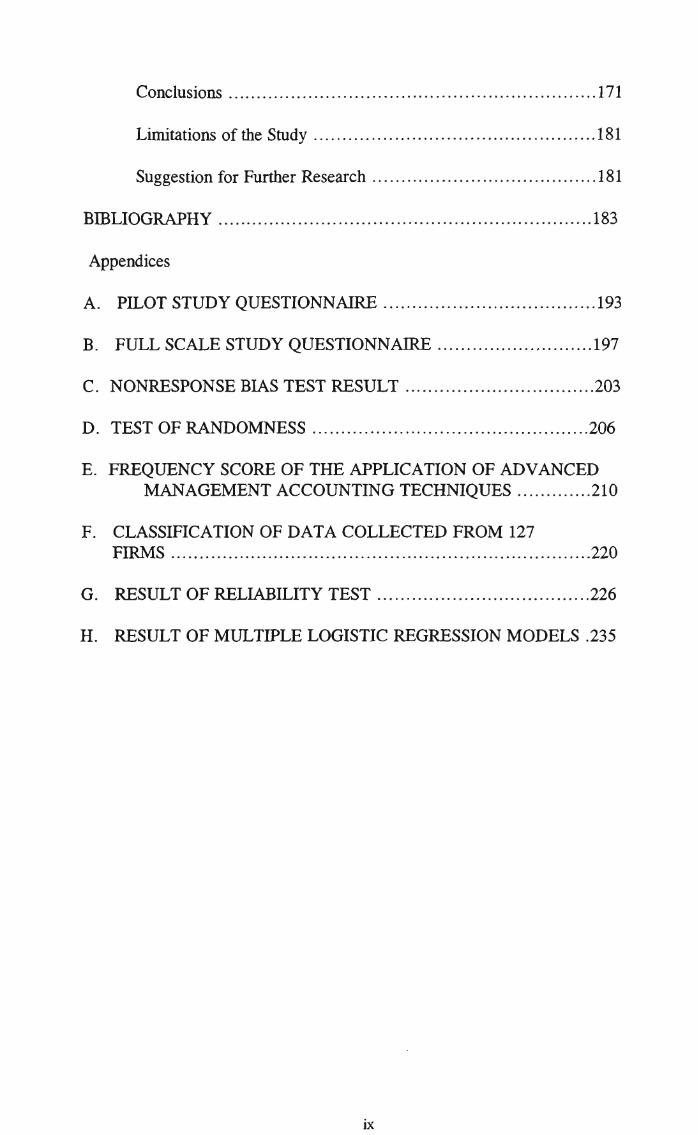
Conclusions 171
Limitations of the Study 181
Suggestion for Further Research 181
BIBLIOGRAPHY 183
Appendices
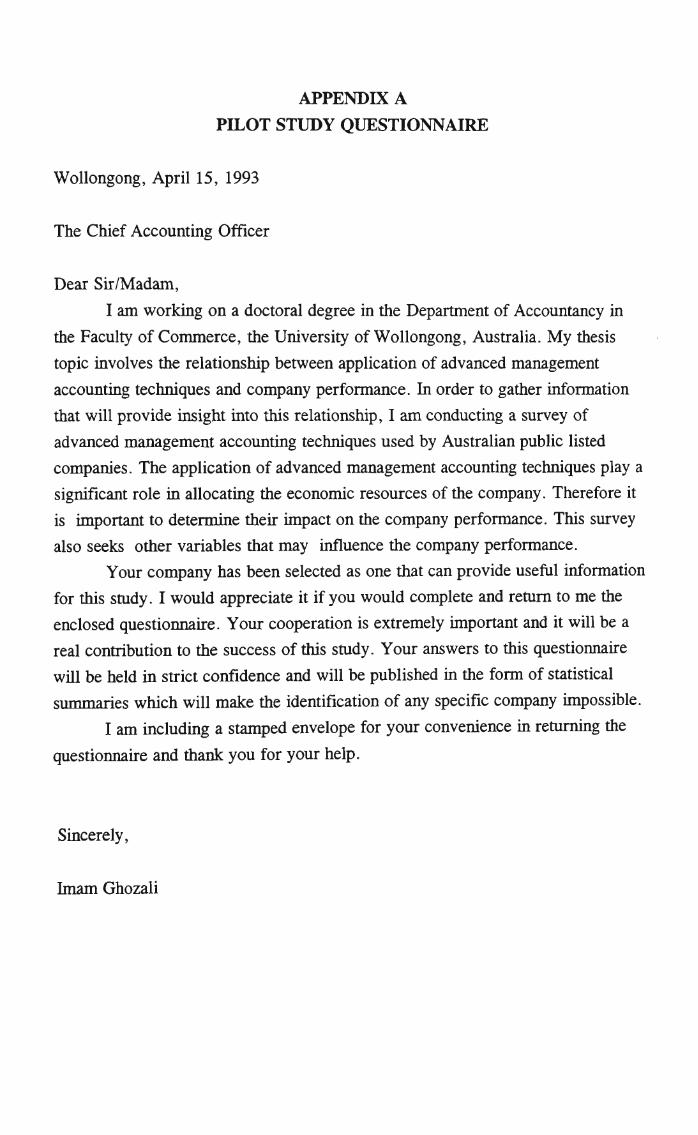
A. PILOT STUDY QUESTIONNAIRE 193
B. FULL SCALE STUDY QUESTIONNAIRE 197
C. NONRESPONSE BIAS TEST RESULT 203
D. TEST OF RANDOMNESS 206
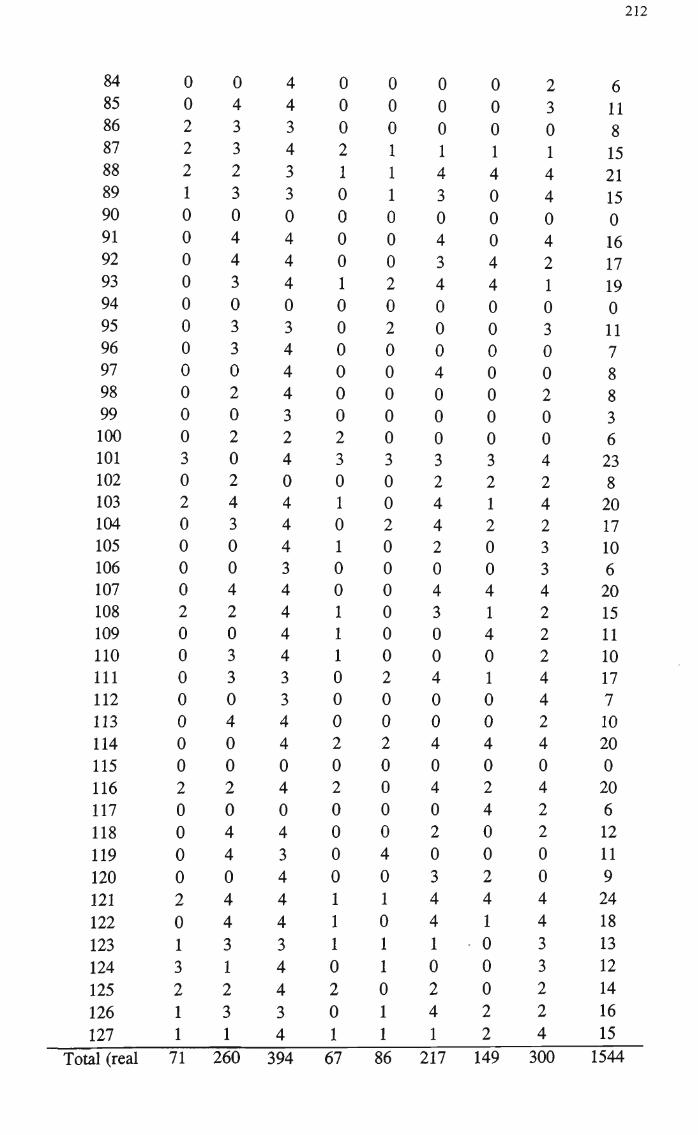
E. FREQUENCY SCORE OF THE APPLICATION OF ADVANCED MANAGEMENT ACCOUNTING TECHNIQUES 210
F. CLASSIFICATION OF DATA COLLECTED FROM 127 FIRMS 220
G. RESULT OF RELIABILITY TEST 226
H. RESULT OF MULTIPLE LOGISTIC REGRESSION MODELS .235
IX
LIST OF FIGURES
Figure Page
1. Framework for the Study 6
2. The Relationship Between Management Accounting Techniques, Firm Characteristics and Firm Performance 61
x
LIST OF TABLES
Table Page
1. Summary of the Previous Research on the Relationship Between Firm Performance and Capital Budgeting Selection Techniques 35
2. Summary of Surveys Conducted on the Extent of Usage of Operations Research Techniques 40
3. Distribution of Respondents of Pilot Study by Activity Sector 94
4. Full Scale Study Response Data .95
5. Summary of T-Test for Non-Response Bias 98
6. Distribution of Respondents by Activity Sector 99
7. Distribution of Respondents by Type of Ownership 100
8. Distribution of Respondents by Age 100
9. Cross Classification of Respondents by Type of Ownership and Activity Sector 101
10. Cross Classification of Respondents by Type of Ownership and Age 102
11. Cross Classification of Respondents by Age and Activity Sector 103
12. The Extent of Management Accounting Techniques % Used by Respondents 106
13A. The Extent of Management Accounting Techniques % Used by Respondents According to the Activity Sector Ill
13B. The Extent of Management Accounting Techniques % Used by Respondents According to the Type of Ownership 116
14. Summary of Test of Randomness 125
15. Test of Data Reliability 128
16. Descriptive Statistics of Some Independent Variables 131
17. Mann-Whitney U Test Comparison of Management Accounting Techniques by Company Size 134
xi
18. Mann-Whitney U Test Comparison of Management Accounting Techniques by Company Age 137
19. Mann-Whitney U Test Comparison of Management Accounting Techniques by Type of Industry 140
20. Mann-Whitney U Test Comparison of Management Accounting Techniques by Company Capital Intensity 143
21. Mann-Whitney U Test Comparison of Management Accounting Techniques by Company Risk 146
22. Mann-Whitaey U Test Comparison of Management Accounting Techniques by Type of Ownership 148
23. Mann-Whitney U Test Comparison of Management Accounting Techniques by Company Leverage 151
24. Logistic Regression Estimate 156
Xll
C H A P T E R I
I N T R O D U C T I O N
Management accounting systems (MAS) are designed to report information
internally to managers. They need this information to plan, control, evaluate, and
coordinate business activities, both domestically and internationally, and thus
managers at all levels seek internally-developed and reported information to
improve their decision-making. The relevance of organisational contextual
variables to the design of management accounting system has been recognised in
the accounting literature since the mid 1970s with studies by Bruns and
Waterhouse (1975), Gordon and Miller (1976), Ansari (1977) and Waterhouse and
Tiessen (1978). The aim of these studies was to identify the contextual variables
which were seen as important consideration in the design of MAS. In those
studies, the findings of contextual variables such as the external environment,
organisational structure, organisation size, and production technology encouraged
further research in management accounting.
Models adopting situational approaches to management accounting research
have focused on two broad dimensions of the management accounting system:
1. the characteristics of management accounting system
2. the use of management accounting techniques
Chenhall and Morris (1986) examined the effect organisational structure,
environmental uncertainty, and organisational interdependence on management
accounting systems design. MAS design was defined in terms of the perceived
usefulness of several information characteristics which may be associated with a
2
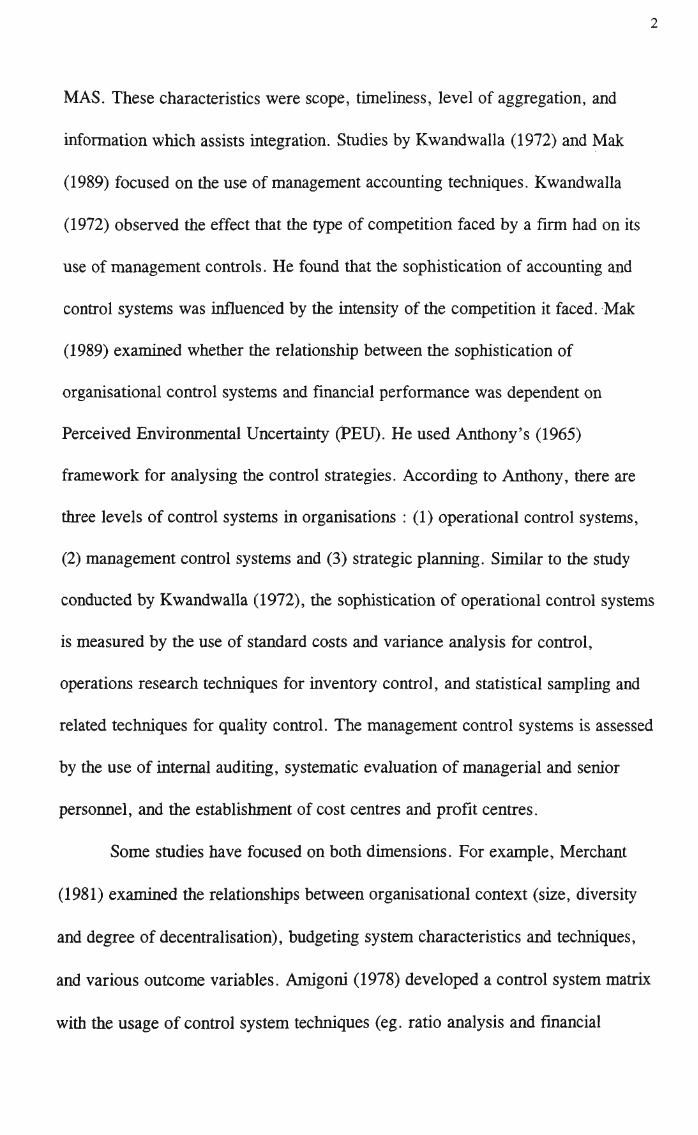
MAS. These characteristics were scope, timeliness, level of aggregation, and
information which assists integration. Studies by Kwandwalla (1972) and Mak
(1989) focused on the use of management accounting techniques. Kwandwalla
(1972) observed the effect that the type of competition faced by a firm had on its
use of management controls. He found that the sophistication of accounting and
control systems was influenced by the intensity of the competition it faced. Mak
(1989) examined whether the relationship between the sophistication of
organisational control systems and financial performance was dependent on
Perceived Environmental Uncertainty (PEU). He used Anthony's (1965)
framework for analysing the control strategies. According to Anthony, there are
three levels of control systems in organisations : (1) operational control systems,
(2) management control systems and (3) strategic planning. Similar to the study
conducted by Kwandwalla (1972), the sophistication of operational control systems
is measured by the use of standard costs and variance analysis for control,
operations research techniques for inventory control, and statistical sampling and
related techniques for quality control. The management control systems is assessed
by the use of internal auditing, systematic evaluation of managerial and senior
personnel, and the establishment of cost centres and profit centres.
Some studies have focused on both dimensions. For example, Merchant
(1981) examined the relationships between organisational context (size, diversity
and degree of decentralisation), budgeting system characteristics and techniques,
and various outcome variables. Amigoni (1978) developed a control system matrix
with the usage of control system techniques (eg. ratio analysis and financial
3
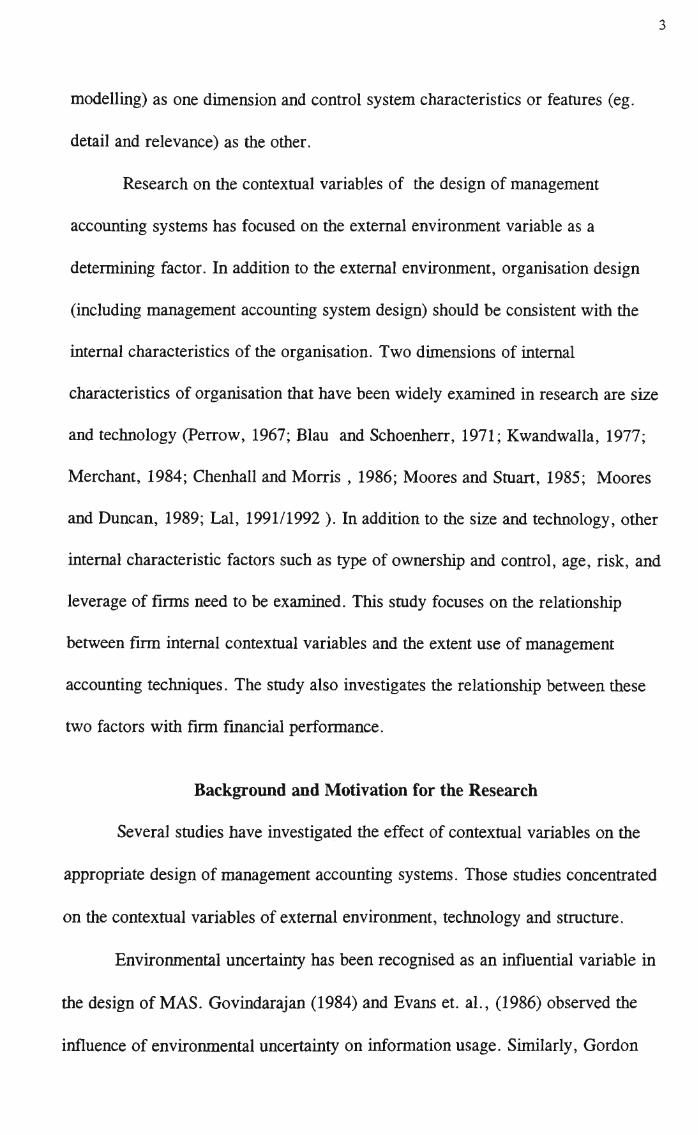
modelling) as one dimension and control system characteristics or features (eg.
detail and relevance) as the other.
Research on the contextual variables of the design of management
accounting systems has focused on the external environment variable as a
determining factor. In addition to the external environment, organisation design
(including management accounting system design) should be consistent with the
internal characteristics of the organisation. Two dimensions of internal
characteristics of organisation that have been widely examined in research are size
and technology (Perrow, 1967; Blau and Schoenherr, 1971; Kwandwalla, 1977;
Merchant, 1984; Chenhall and Morris , 1986; Moores and Stuart, 1985; Moores
and Duncan, 1989; Lai, 1991/1992 ). In addition to the size and technology, other
internal characteristic factors such as type of ownership and control, age, risk, and
leverage of firms need to be examined. This study focuses on the relationship
between firm internal contextual variables and the extent use of management
accounting techniques. The study also investigates the relationship between these
two factors with firm financial performance.
Background and Motivation for the Research
Several studies have investigated the effect of contextual variables on the
appropriate design of management accounting systems. Those studies concentrated
on the contextual variables of external environment, technology and structure.
Environmental uncertainty has been recognised as an influential variable in
the design of MAS. Govindarajan (1984) and Evans et. al., (1986) observed the
influence of environmental uncertainty on information usage. Similarly, Gordon
4
and Narayanan (1984) and Chenhall and Morris (1986) examined the relationship
between an organisation's environment and information characteristics. Gordon
and Narayanan's study found that there was a significant relationship between
Perceived Environment Uncertainty (PEU) and information characteristics. This
result suggested that information characteristics were driven by PEU. Chenhall
and Morris (1986) examined the direct and indirect effects of decentralisation,
PEU and organisational interdependence on MAS design. The results provide
strong evidence that the perceived usefulness of particular MAS characteristics is a
function of the context in which the MAS operates.
Technology in terms of production techniques (eg. small batches, large
batches, mass production and process production) is a factor that has long been
recognised since Woodward (1965) as influencing the design of internal
accounting system. Since then, a variety of studies have identified the association
between different dimensions of technology and characteristics of MAS. The
following associations are illustrative of the main findings: nature of technical
process (standardised, mass production) with the increased sophistication of the
management control system (Kwandwalla, 1977); degree of automation with
formality of budget use (Merchant, 1984); the interdependence within production
process with characteristics of information perceived to be useful (Chenhall and
Morris, 1986).
Organisational structure is one of the primary considerations in establishing
the overall control system within the organisation. There is evidence to suggest
that structure of the organisation affect the design of MAS. Bruns and Waterhouse
5
(1975) found that large and technically sophisticated firms were associated with
administrative control strategies defined by decentralisation and structuring with a
strong emphasis on MAS, whereas small and dependent firms were associated with
interpersonal control strategies described by centralisation and lack of autonomy.
Chenhall and Morris (1986) also found that decentralisation had direct association
with perceived usefulness of aggregated and integrated information.
The above studies showed that the contextual variables of internal firm
characteristics have been subject to less attention in management accounting than
external environment uncertainty, technology and structure. One of the internal
firm characteristics variables that has been studied is organisational size. Other
variables such as type of ownership and control, risk, age, capital intensity and
firm leverage have been given much less attention. Studies on the association
between firm size and MAS have found that size is related to increased use of
more sophisticated and administrative MAS. Illustration of this findings includes:
increased size was associated with sophistication of control and information system
(Kwandwalla, 1977; Moores and Stuart, 1985); increased size with degree of
formality associated with the budget process. In addition, many early researchers
have tended to avoid considering the effects of contextual variables on
organisational effectiveness. They did not directly incorporate performance into
their conceptual frameworks. In cases where performance was directly examined,
the result have been mixed. Therefore, a study to provide additional evidence of
the effect of specific contextual variables of internal firm characteristics on the
design of MAS and their relationship with firm financial performance is needed.
Statement of the Problem
Deterniining which factors influence firm level performance is not an easy
task. The problem is extremely complex because a large number of influences on
performance are at work. Some of these factors are external to the firm, while
others are internal. This study focuses on the specific variables of internal firm
characteristics on the application of advanced management accounting techniques
and their relationship with firm financial performance.
It is desirable to have a conceptual model in order to understand the impact
of the application of management accounting techniques on company performance.
Figure 1 illustrates the basic framework for the study. It relates the application of
management accounting techniques to the contextual variables of firm
characteristics and explores how firm performance is affected by both of these.
CONTEXTUAL FIRM CHARACTERISTICS
Firm size Firm age
Type of industry Firm risk
Type of ownership Firm leverage
Firm capital intensity
* 1
r MANAGEMENT ACCOUNTING TECHNIQUES
•w
* i
FIRM PERFORMANCE
Fig. 1. Framework for the study
Firm Characteristics and Performance
Firm characteristics such as size, capital intensity, risk, leverage, and
industry concentration have been discussed as important determinants of
organisation performance. Firm size reflects the resources available to the
organisation. The amount of economic activity the firm can engage in is directly
influenced by corporate size. In addition, the ability to exploit the environment is a
function of the amount of resources a corporation has. Therefore, firm size is
expected to be positively associated with performance. The argument is that larger
firms can take advantage of economies of scale enabling more efficient production
and thereby increasing profitability. Moreover, larger firms have greater
production capacity and should be able to generate greater sales; higher sales and
greater efficiency should both contribute to a strong positive relationship between
profit and size.
There have been several studies of the association between size and
financial performance. Hall and Weis (1967) and Marcus (1969) found positive
association between size and performance. Montgomery (1979) also argued that it
is the significance of economies of scale which leads to better performance in the
larger firm. However, these findings are in conflict with those produced by
Whittington (1971) and Child (1974) in their studies of UK firms. Child (1974)
reports that no relationship exists between size and performance. However, both
Whittington and Child reveal that there were differences in technology and cost
performance among industries that directly influence performance. Empirical
8
research on the association between firm performance and capital budgeting
selection techniques also found that firm size is positively associated with
performance (Klammer,1973; Kim, 1982: and Pike, 1984).
Capital intensity can be interpreted as equivalent to what contextual
theories refer to as technology. Technology determines the manner in which
organisations transform inputs to outputs. One important aspect of technology that
influences organisational productivity is the level of mechanisation. A highly
mechanised technology means greater fixed investment in capital. Investment in
capital assets per employee is expected to result in more efficient utilisation of
inputs to outputs and thus reduced costs. The net effect should be to increase profit
and profitability. Pike's study (1984) shows that capital intensity was positively
associated with performance. Similarly Weiner and Mohoney (1981) also found
that technology was highly associated with the rate of return on assets.
Studies on the influence of risk on performance have yielded conflicting
results. Armour and Teece (1978) reported a negative relationship between return
on equity and the variance in return on equity. Bowman (1980) also found
negative association between risk and returns. In their research, Fiegenbaum and
Thomas (1986) found no association between the systematic risk of a firm's stock
returns - commonly known as beta- and returns measured using accounting data.
In contrast, Fiegenbaum and Thomas (1988) and Jegers (1991) found a positive
association between variance in returns (risk) and average return for firms whose
return were above the median in their industry, and negative association for below
median performers. In their study of capital budgeting techniques, Klammer
9
(1973), Kim (1982), and Pike (1984) reported that there was a positive
relationship between risk and firm performance.
A firm's financial leverage also has an impact on the its performance. Firm
leverage represents the proportion of financing obtained via debt relative to equity
financing (issuing stock). A firm's debt-to-equity ratio affects a company's ability
to borrow and the cost of borrowing. Profit is expected to be negatively associated
with leverage capital structure strategy because increasing debt creates a fixed
financial obligation - interest. Grant and Jammine (1988) reported that high
leverage is associated with low profitability. Weiner and Mahoney's (1981) study
also found that capital structure strategy is inversely related to both profitability
and stock prices.
Firm Characteristics and Management Accounting Techniques
Management accounting techniques used in a company are expected to be a
function of the characteristics of the company. The classification of companies by
some of their characteristics may reflect underlying differences in technology,
financing, planning horizon, product and management structures. These
differences may be a catalyst for companies to adopt and use specific management
accounting techniques.
Studies by Merchant (1981, 1984) examined the effects of organisation size
and structure on budgeting system design. He hypothesised that larger, more
diverse, decentralised firms tend to use an administrative control strategy. These
hypotheses were based on the premise that increasing size and diversity create
10
problems in social control, communication and coordination. As a result, larger,
more diverse organisation would tend to decentralise and implement more
administrative control strategies involving greater formalisation and budgeting
sophistication. The overall results suggest that larger, more diverse, decentralised
firms tend to place greater emphasis on formal budgeting.
Kwandwalla (1977) also observed the relationship between organisation
size, as measured by sales revenue, and the sophistication of control and
information system (CIS). Two aspects of control and information systems
sophistication are investigated: internal and external. Kwandwalla (1977) defined
internal CIS as the usage of sophisticated management controls for monitoring
internal operations. These include such control of operations as internal audit,
personnel evaluation, establishment of the standard costs of operations as well as
the analysis of cost variations from these standards, and the use of accounting
ratios to analyse operations. External CIS is defined as the extent to which the
organisation engages in activities designed to secure vital environmental
information. A significant relationship between organisation size and the
sophistication of CIS was found and was explained by the assertion that as large
organisations tend towards higher differentiation and involvement in a variety of
markets and activities, more sophisticated control and information systems are
needed.
Moores and Stuart (1985) and Lai (1991) adopted the same variables of
control and information systems used by Kwandwalla (1977) and examined the
relationship between size and CIS. Both studies support the evidence provided by
11
Kwandwalla (1977) who found a positive relationship between organisation size
and CIS. Lai's (1991) study also indicates associations for the other dimensions of
organisation size which includes number of employees, sales revenue and market
capitalisation with both CIS internal and CIS external. These findings indicate that
large organisations tend to place greater importance on CIS internal as a result of
greater control and coordination problems, thus requiring more sophistication in
the control system than smaller organisations. Larger organisations also tend to be
involved in more diverse markets and activities and this may result in a greater
need for a sophisticated information system which can provide information on the
market, forecasts and so on.
Management Accounting Techniques and Performance
The association between the application of management accounting
techniques and firm performance has received increasing attention in the literature.
However, many studies concentrate on narrowly defined sets of management
accounting techniques such as capital budgeting and long range planning. Ansoff
et. al., (1970), Thune and House (1970), Herold (1972), Fulmer and Rue (1974),
Malik and Karger (1975) focused their studies on the impact of comprehensive
planning on financial performance.
Ansoff et al., (1970) investigated the relationship between formal planning
and financial performance. They studied the impact of planning on the success of
acquisitions in 93 Americans firms during the period 1946-1965. These firms were
classified as either planners or non-planners and evaluated the performance of each
12
group using 21 different financial criteria. The result show that planners
significantly outperform non-planners on virtually all financial criteria, including
sales, earnings, earnings per share, and return on common equity.
Thune and House (1970) attempted to determine whether change in
financial performance was associated with long range planning. To do this, they
investigated the long range planning practices of 36 firms in six industries. Five
performance measures were used: sales, stock prices, earning per share, return on
common equity, and return on total capital employed. They found that the formal
planners consistently outperformed the informal planners in drug, chemical, and
machinery industries, but no clear association was found in the food, oil and steel
industries. Herold (1972) replicated and extended Thune and House's study by
introducing a new performance measure, ie. pretax profit. His findings completely
supported those reported by Thune and House.
Another study investigating the relationship between formal planning and
financial performance was conducted by Fulmer and Rue (1974). They surveyed
386 firms in the nondurable, durable and service industries to test the hypothesis
that firms that use more sophisticated long range planning techniques exhibit better
performance than do firms utilising less sophisticated techniques. The result did
not reveal a systematic relationship between formal long range planning and
financial performance. For durable goods industries, planners outperformed the
non-planners; in the service industries, non-planners outperformed the planners;
and in the nondurable industries, the results were mixed.
13
Malik and Karger (1975) observed the effects of formal integrated long
range planning on firm performance for 38 firms in the chemical, drug, electronic,
and machinery industries. The firms within each industrial grouping were divided
into formal integrated long range planners and non-integrated planners, and their
financial performance was compared using 13 different economic measures. The
result indicated that formal planners outperformed non-planners on nine of 13
economic measures and the result were mixed for the other four measures.
A review of the empirical studies on the relationship between planning and
firm performance disclosed conflicting findings. Similar conflicting results were
also found in the study of the relationship between the use of capital budgeting
techniques and firm performance (Klammer, 1973; Kim, 1982; Pike, 1984; Haka
et. al., 1985 and Ho, 1992).
Klammer (1973) sent questionnaires to 386 of the manufacturing firms
included on Compustat to test the association between firm performance and
capital budgeting techniques. He regressed the operating rate of return with capital
budgeting techniques and other controlling variables including size, risk, and
capital intensity. His findings showed that there was no significant relationship
between firm performance and the use of sophisticated capital budgeting
techniques. Kim (1982) conducted two similar studies that had previously been
conducted by Klammer. He found a positive relationship between the degree of
sophistication of the budgeting process and firm performance. In contrast, other
studies conducted by Pike (1984), Haka et. al (1985) and Ho (1992) support
14
Klammer' findings and found a negative relationship between the adoption of
sophisticated budgeting selection techniques and firm performance.
Instead of studying specific techniques such as long range planning and
capital budgeting techniques, MacNally and Eng (1980) and Mak (1989) attempted
to investigate the relationship between various techniques and firm performance.
MacNally and Eng (1980) surveyed companies listed on the New Zealand Stock
Exchange and examined the relationship between the use of selected cost and
management accounting and decision making techniques and two types of
company characteristics: industry and output classification and financial data on
size, growth, rate of return and capital intensity. The conclusion is that no
statistically significant relationship was observed between industry and output
groupings and the "use" or "non-use" of thirteen different cost and management
accounting techniques. However, company size, rate of return and growth rate all
provided some evidence of a positive relationship with the adoption or non-
adoption of limited group of techniques.
The main weakness of MacNally's study is that each cost and management
accounting technique and decision making technique has been categorised into
whether the techniques is or is not used by a company. No attempt has been made
to establish a score for how "intensively" a company uses specific techniques.
Rather, the study considered whether the major techniques are implemented in
practice and what relationship, if any, they have with company performance.
One of the primary objectives of Mak's (1989) study was to examine
whether the relationship between the sophistication of organisational control
15
systems and financial performance was dependent on PEU. The control systems
included in the study were based on Anthony's (1965) framework of control
systems. The measurement of control system variables were adapted from the
studies by Kwandwalla (1977). Operational control system variables were
measured by the use of standard costs and variance analysis for cost control,
operation research techniques for inventory control, and statistical sampling and
related techniques for quality control. Management control systems were assessed
by the use of internal auditing, systematic evaluation of managerial and senior
personnel, establishment of cost centres and profit centres. Strategic planning
variables were measured by the use of long-range forecasting of technology, sales,
profit and markets, planning of long term investments, systematic search and
evaluation procedures for new investments, and market research for studying
customer preferences, price and demand analysis. His findings showed that
measures of fit between PEU and sophistication of the operational and
management control systems were not related to financial performance, while fit
between PEU and the sophistication of strategic planning was only weakly
associated with financial performance. A surprising finding was that firms facing
greater environmental uncertainty employ more sophisticated operational controls
systems.
Previous research has not attempted to study the impact of firm
characteristics contextual variables on the use of a wide range of management
accounting techniques and the relationship of these techniques with the firm's
financial performance. Further empirical based research is therefore required to
16
extend and update this more comprehensive approach, concentrating on the
relationship between firm characteristics, application of advanced management
accounting techniques and the performance of firms. The intent of this study is to
determine the extent and manner in which advanced management accounting
techniques employed by Australian companies are dependent on firm
characteristics and the relationship between these techniques and the company's
performance. More specifically, the research is designed to answer the following
research questions:
1. Do the application of advanced management accounting techniques influence the
performance of Australian companies?
2. Do company characteristics such as size, age, type of industry, capital
intensity, risk, leverage and type of company ownership influence the
application of advanced management accounting techniques?
Purpose of Study
The primary purpose of this study is to determine whether there is
significant positive relationship between the application of advanced management
accounting techniques and the company's performance.
A secondary purpose is to identify the following items:
1. The extent and types of advanced management accounting techniques applied by
the Australian public companies.
2. The relationship between the size of company and the extent of application of
advanced management accounting techniques.
17
3. The relationship between the age of company and the extent of application of
advanced management accounting techniques.
4. The relationship between the type of industry and the extent of application of
advanced management accounting techniques.
5. The relationship between the capital intensity of the company and the extent of
application of advanced management accounting techniques.
6. The relationship between the risk of the company and the extent of application
of advanced management accounting techniques.
7. The relationship between the type of company ownership and the extent of
application of advanced management accounting techniques.
8. The relationship between the company's leverage and the extent of application
of advanced management accounting techniques.
The term advanced management accounting techniques in this study
includes three types of techniques. The first type consists of those techniques that
the frequency of its application depends on company's activities. These techniques
can be applied many times or not at all within one year. Included in these
techniques are decision tree analysis, relevant cost analysis, capital budgeting,
linear programming, net-work analysis, inventory control models, just in time
inventory and sensitivity analysis.
The second type comprises those techniques that the frequency of its
application is periodical or at regular interval. These techniques can be applied
monthly, quarterly, semi annually, and annually. These techniques include
variance analysis, break-even analysis, contribution reporting, inventory turn over
18
analysis, account receivable turnover analysis, aging of account receivable, gross
profit analysis and other financial ratio analysis.
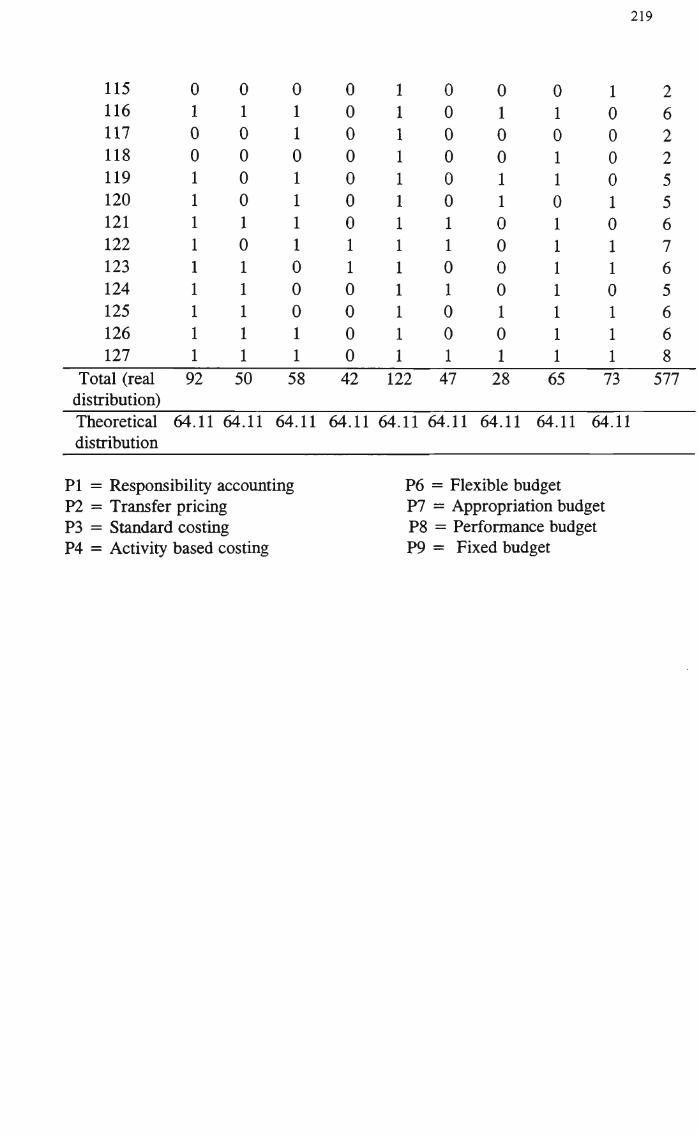
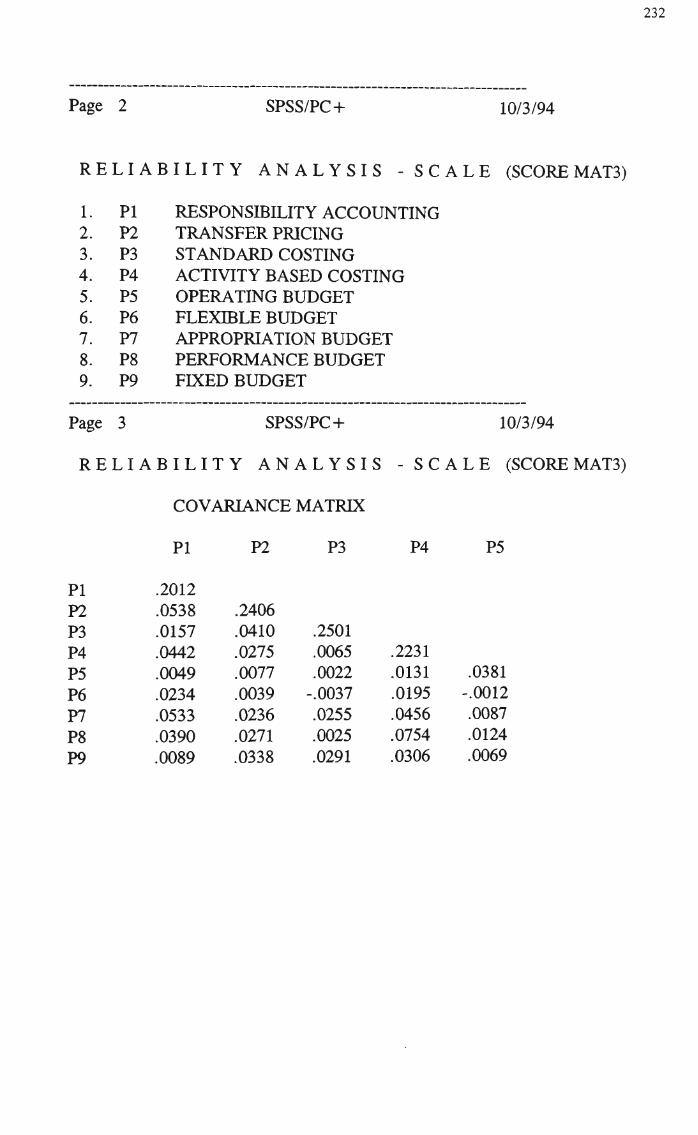
The third type consists of those techniques that the frequency of its
application is continuous for one year and these techniques can be either used or
not used. These techniques include responsibility accounting, transfer pricing,
standard costing, activity based costing, operating budget, flexible budget,
appropriation budget, performance budget and fixed budget.
Firm performance is measured by an adjusted operating rate of return. The
rate of return is calculated by dividing the operating income by the operating
assets at year end. To be comparable for each company, the operating income
must be adjusted by the differences in the application of accounting principles and
procedures and the differences in the methods of financing investment. Therefore,
an adjusted operating income is defined as income before taxes, financial
expenses, and depreciation.
Firm contextual characteristics used as independent variables are
organisation size, age, type of industry, capital intensity, risk, type of
ownership, and firm's leverage. The following definitions are used for these
firm's characteristics:
1. Size is measured by the average operating assets of the firm for six year
period, 1987-1992. Size is grouped further into large firm and
medium/small firm based on its median value. If it is above the sample
median, it is considered as large firm and vice versa.
19
2. Age is measured from the year of incorporation. If a firm has been in
business more than 28 years (median value), it is considered as old firm
and if it is in business less than or equal to 28 years will treated as new
firm.
3. Type of industry is divided into two categories: manufacturing firm and
non-manufacturing firm.
4. Capital intensity is measured by yearly depreciation expenses divided by
the yearly operating assets for each of the six year period, 1987-1992.
5. Risk is measured by the standard deviation of the firm's adjusted operating
rate of return for the six years period, 1987-1992.
6. Type of ownership is divided into two categories public domestic listed
firm and public foreign listed firm.
7. Leverage is measured by the ratio between total debts and equities for each
of the six years period, 1987-1992.
Variables of capital intensity, risk, and leverage are grouped further
into high and low categories based on median values. If it is above the sample
median value, it is defined as high and if it is below or equal its median value
it is defined as low. Further details of definition of the variables used in this
study can be seen in Chapter III.
Statements of Hypotheses
Based on the study purpose above, there are eight hypotheses proposed to
be tested.
20
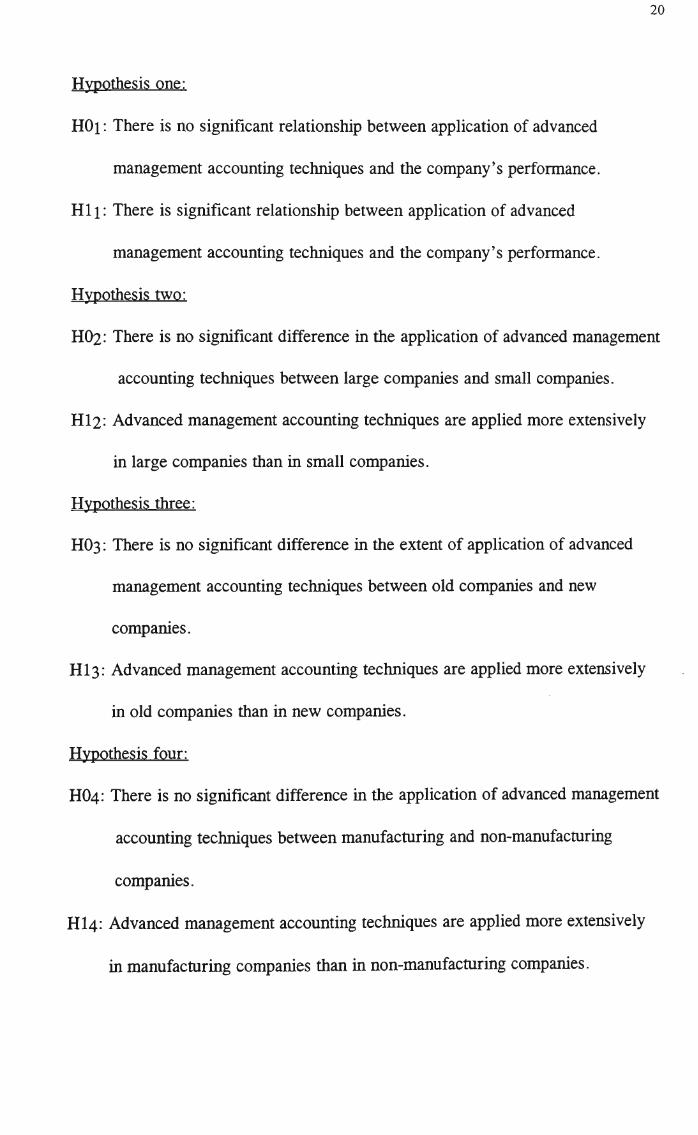
Hypothesis one:
HOi: There is no significant relationship between application of advanced
management accounting techniques and the company's performance.
Hli: There is significant relationship between application of advanced
management accounting techniques and the company's performance.
Hypothesis two:
HO2: There is no significant difference in the application of advanced management
accounting techniques between large companies and small companies.
HI2: Advanced management accounting techniques are applied more extensively
in large companies than in small companies.
Hypothesis three:
HO3: There is no significant difference in the extent of application of advanced
management accounting techniques between old companies and new
companies.
HI3: Advanced management accounting techniques are applied more extensively
in old companies than in new companies.
Hypothesis four:
HO4: There is no significant difference in the application of advanced management
accounting techniques between manufacturing and non-manufacturing
companies.
HI4: Advanced management accounting techniques are applied more extensively
in manufacturing companies than in non-manufacturing companies.
21
Hypothesis five:
HO5: There is no significant difference in the application of advanced management
accounting techniques between companies that have high capital intensity
and low capital intensity.
HI5: Advanced management accounting techniques are applied more extensively
in companies that have high capital intensity than companies that have low
capital intensity.
Hypothesis six:
H06: There is no significant difference in the application of advanced management
accounting techniques between high risk companies and low risk companies.
HI 6: Advanced management accounting techniques are applied more extensively
in high risk companies than in low risk companies.
Hypothesis seven:
HO7: There is no significant difference in the application of advanced management
accounting techniques between public domestic companies and public
foreign companies.
HI7: Advanced management accounting techniques are applied more extensively
in public foreign companies than in public domestic companies.
Hypothesis eight:
H08: There is no significant difference in the application of advanced management
accounting techniques between high leverage companies and low leverage
companies.
HI8: Advanced management accounting techniques are applied more extensive
in high leverage companies than in low leverage companies.
Research Method
The primary research methods used in this study are a review of literature
and a questionnaire survey.
The purpose of the review of literature is, first to provide an in depth
understanding of the general trend in the studies of management accounting
practice and how this practice is affected by the firm contextual variables. Second,
to provide background for the reader of the study who has an interest in the topic
and third, to obtained in depth understanding of advanced management accounting
techniques to be included in the questionnaires.
The purpose of the questionnaire is to obtain data which are analysed for
the purpose of validating the hypotheses of the study. A complete description of
the methodology for the study are provided in Chapter III.
Contribution of the Study
This study is designed to add to the theoretical framework by developing a
model that explains some of the factors influencing the company's performance.
This study should also explain the variables that influence the application of
advanced management accounting techniques used by publicly listed companies in
practice. Such a theoretical framework would help to explain why firms select
particular management accounting techniques.
23
Assumptions and Limitations
This study involves some basic assumptions and limitations.
Assumptions
The first assumption relates to the measurement of the frequency of
application of advanced management accounting techniques in each surveyed
company. In this study, the frequency of application of advanced management
accounting techniques is assumed to be measurable with the scale employed as
defined previously.
The second assumption is that chief accounting officers are in a position to
know which advanced management accounting techniques are employed in their
companies now, and have been employed since 1986.
Limitations
This study has several limitations. The first limitation is that there are
some advanced management accounting techniques which are not included in this
study, therefore conclusions can be made only with respect to the techniques
included in the study.
The second limitation is that the frequency of application of advanced
management accounting techniques may actually be influenced by variables other
than those considered in this study.
Finally, the use of a questionnaire to gather data carries certain limitations.
It introduces the possibility that the respondents may place different interpretations
on the questions than did the researcher. To overcome this limitation, a pilot study
was conducted to test the questionnaire.
24
Organisation of the Study
This study contains six chapters. Chapter I provides the background and
motivation of the study, statement of problem, the purpose of the study, the
hypothesis to be tested and the methodology used in conducting the study as well
as the contribution and limitations of the study.
Chapter n contains a review of the previous surveys that have a closer
relationship to the subject of this study. The first part reviews the findings of the
survey of the application of management accounting techniques in practice. The
second part examines the relationship between the application of management
accounting techniques and the firm contextual characteristics. The third part
discusses the relationship between the application of management accounting
techniques, firm contextual characteristic variables and the company's
performance.
Chapter HI is concerned with the methodology and research design of the
study. This chapter includes a description of the study, definition and operational
measure of the variables, population, sampling frame, data collection method, and
the development of hypotheses. The statistical methods used in the study are also
described
Chapter IV presents the result from the questionnaires and the application
of advanced management accounting techniques used by respondents. This chapter
is divided into three parts. The first part presents the result of pilot study and full
scale study, including testing of nonresponse bias. The second part describes the
25
profile of the respondents, and the last part presents the result of the application of
management accounting techniques by respondents.
Chapter V presents the evaluation of the study's hypotheses. The first part
provides the result of data testing which includes test of randomness and reliability
test. The second part describes the findings of the hypotheses testing.
Chapter VI provides the conclusions drawn from the study. It includes the
limitations of the study and suggestions for further related research.
CHAPTER II
RELATED LITERATURE REVIEW
A comprehensive search of the literature survey reveals that several studies
have been undertaken to investigate the extent to which management accounting
techniques are being applied in practice. However, no attempts were made in these
studies to examine the relationship between the application of various management
accounting techniques and the company performance. This chapter reviews the
previous surveys that have a close relationship to the subject of this dissertation.
The chapter is divided into three parts. The first part reviews the findings of the
survey of the application of management accounting techniques in practice. The
second part examines the relationship between the application of management
accounting techniques and the characteristics of the company. Finally, the third
part discusses the relationship between the application of management accounting
techniques, characteristics of the companies and the companies' performance.
THE APPLICATION OF MANAGEMENT ACCOUNTING TECHNIQUES
Measuring the extent to which companies employ selected management
accounting techniques has been the general theme of several studies over the past
decade. Most of the studies basically concentrate on a narrowly defined set of
management accounting techniques such as capital budgeting, quantitative
techniques or operation research models, and other techniques associated with
management accounting.
27
Capital Budgeting Techniques
A thorough review of the literature concerning the application of capital
budgeting techniques reveals that research in Australia [McMahon (1981),
Lilleyman (1984), Freeman and Hobbes (1991)], the UK [Pike (1988), Pike and
Sharp (1989), Ho and Pike (1992)], the US [Kim and Farragher (1981), Schall,
Sundem and Geijsbeek (1978), Klammer and Walker (1984)], and New Zealand
[Patterson (1989)] has suggested that the usage of sophisticated investment
procedures has increased over time. The sophistication includes discounted cash
flows (DCF), risk adjusted discount rate, sensitivity and probability analysis.
McMahon (1981) surveyed the 200 largest public companies in terms of
market capitalisation, listed on the Sydney Stock Exchange, and 20 large private
companies. A response rate of 48.2 percent (106 companies) was achieved. He
found that there was no significant change in the use of payback period and
accounting rate of return during the 1970s compared to the results of earlier
surveys of Australian practice [Burke (1971), Meredith (1964, 1965) and Smyth
and Burke (1968)]. However, there has been a marked increased in use of
discounted cash flow techniques. The survey also sought to discover the extent to
which Australian companies used formal methods of risk analysis in capital
investment decision making. Out of 78 companies which indicated use of DCF
techniques, approximately 53 percent used formal risk evaluation techniques. The
most popular formal risk evaluation techniques amongst large Australian
28
companies were sensitivity analysis, simulation and measure expected variation in
return.
Lilleyman (1984) sampled 371 organisations selected from three sources:
first, 250 public companies randomly selected from Industrial and Oil and Mining
listings on the Australian Stock Exchanges; second, 60 private companies
randomly selected from the Australian Business, Top 500 1982; and third, 61
government and semi-government organisations drawn from the various State
Government listings. Ninety-eight valid responses were received, a response rate
of 26.4 percent. The result indicates that, notwithstanding extensive support of the
more sophisticated DCF techniques, the traditional payback method is used by
more respondents than any other method. However, the usage ratio for the DCF
techniques, either the internal rate of return (IRR) method or the net present value
(NPV) method, is high and the respondents regarded these techniques as being the
most important in evaluating capital expenditure proposals. The most popular tools
for the risk assessment of forecasted future cash flows or expected profits is
sensitivity analysis. The actual proportions were: sensitivity analysis (61%); risk
analysis (50%); simulation and financial modelling (44%). Overall the results of
this survey are in accord with the earlier Australian surveys and support their
observations of the higher importance being attached to DCF evaluation
techniques, use of quantitative risk assessment and simulation techniques.
Freeman and Hobbes (1991) observed changes in capital budgeting
techniques in Australia between 1979 and 1989. They sampled two groups of
companies. One group comprised the top 150 Australian companies and the second
29
group, companies ranked 351st to 500th as ranked on the BIS Top 1000 Corporate
Database. Comparing their result to those McMahon (1989), shows that DCF
techniques are now used more widely. It is also suggested that IRR and NPV rate
equally as the primary techniques for large Australian companies.
The trend towards greater sophistication in investment selection techniques
and control process in the UK has been documented by Pike (1988). Based on a
sample of 100 large UK firms, he examined the capital budgeting practices
employed over an 11-year period (1975 -1986). Unlike most earlier studies,
significant increases in capital budgeting sophistication were noted. There was a
dramatic increase in the extent to which firms formally analyse project risk, that is
from 26 percent in 1975 to 86 percent in 1986. The most popular risk analysis
technique approach involves testing the sensitivity of critical investment inputs and
underlying economic assumptions. A strong movement towards the application of
probability analysis is also witnessed, most notably by the larger firms surveyed.
The capital investment evaluation techniques employed by responding companies
between 1975 and 1986 shows that DFC techniques have greatly increased in
usage from 58 percent to 84 percent.
Pike and Sharp (1989) investigated trends in the use of management science
techniques for capital investment decisions based on three surveys conducted on
the same 100 large UK firms between 1975 and 1986. The survey was conducted
at two points in time. In 1980-81 a survey was conducted on the 208 largest UK
companies. Respondents were requested to indicate current practices and those in
use five years earlier. During 1986 the same survey was distributed to the firms
30
participating in the 1980-81 survey. The management science techniques asked in
this survey consist of DFC methods, sensitivity analysis, probability analysis,
analysis, account receivable turnover analysis, aging of account receivable, gross
profit analysis and other financial ratio analysis.
74
The third group consists of those techniques that the frequency of its
application is continuous for one year and these techniques can be either used or
not used. These techniques include responsibility accounting, transfer pricing,
standard costing, activity based costing, operating budget, flexible budget,
appropriation budget, performance budget and fixed budget.
It is not an easy task to measure how the frequency of advanced
management accounting techniques are being applied in practice. Previous studies
(e.g., Chiu, 1973; MacNally and Eng, 1992) used a scoring system that is based
solely on a dichotomous yes-no measure. No attempt has been made to establish a
score for how "intensively" a company uses a specific technique. In order to get
some indication of the company's intensity in applying advanced management
accounting techniques, the scoring system employed in this study considers more
than the number of techniques that have been adopted. In addition to the
dichotomous yes-no measure, two other indices of Likert scale are considered.
The first index is applied to the first group of management accounting
techniques. This index Likert score is based on the respondent's assessments of
how intensively each of the selected advanced management accounting techniques
is being used in the firm. There are five possible responses Never Used, Seldom
Used, Sometime Used, Usually Used and Always Used. If the response is never
used, it wilfbe given score 0, seldom used 1, sometimes used 2, usually used 3,
and always used 4.
The second index is applied to the second group of management accounting
techniques. This group comprises techniques that can be applied monthly,
75
quarterly, semi-annually, annually, and not used at all. There will be five possible
responses. If the techniques applied monthly it will be given score 4, quarterly
score 3, semi-annually score 2, annually score 1, and not used will be given score
0. The third group of management accounting techniques consists of techniques
that the frequency of its application is continuous for one year, so there are only
two possible answer yes or no. If the answer is yes it will be given score 1 and if
the answer no, the score is 0.
In the testing of the study's hypotheses, the extent of use of advanced
management accounting techniques in a given firm is operationally defined as the
sum of the respective scores of each technique adopted, as reported by its chief-
accounting officer, with a possible range of 0 to 73 points.
Firm Characteristics
Firm's characteristics used as independent variables are size, age, type of
industry, capital intensity, risk, type of ownership, and firm's leverage. The
following definitions are used for these firm's characteristics: (1) size is measured
by the average operating assets of the firm for six year periods, 1987-1992. The
larger the absolute dollar amount of the average assets, the greater a firm's size;
(2) age is measured from the year it is incorporated; (3) type of industry is
classified into two categories, manufacturing and non-manufacturing; (4) capital
intensity is measured by the yearly depreciation expenses divided by the yearly
operating assets for each of the six years, 1987-1992, the larger this ratio, the
higher the capital intensity of the firm; (5) risk is measured by the standard
deviation of the firm's adjusted operating rate of return for the six years period,
76
1987-1992; the larger the standard deviation, the riskier the firm; (6) type of
ownership is classified into two categories ~ public domestic firm and public
foreign firm; (7) leverage is measured by the ratio between total debts and equities
for the six years period, 1987-1992, the larger the ratio, the higher firm's
leverage. For testing the hypotheses two through eight, variable size is grouped
into large firms and small/medium firms based on median value. If the operating
assets are above the median it will be classified as a large firm and vice versa. Age
also grouped into two, whether an old firm or a new firm. If it is below the
median, it will be treated as a new firm and if it is above the median it will be
treated as an old firm. Capital intensity, risk and leverage are grouped into high
and low based on median value. If it is above the median, it is considered as high
and if it is below the median it is considered as low.
Information Sources
The primary sources of data collection was a mail questionnaire. The
study questionnaire was designed to accomplish two objectives: (1) to determine
the extent of use of selected advanced management accounting techniques in
Australia, and (2) to collect information necessary to test empirically a certain
number of theoretical hypotheses. The questionnaire is given in appendix A. It
contains two series of questions. The first series requests general information as
well as characteristic contextual variables of the company. The second series
inquires about the extent to which the company employs advanced management
accounting techniques. In this series three groups of advanced management
77
accounting techniques are listed. For each group of techniques, a list of questions
is asked regarding the extent to which the company applies these techniques.
Other sources of information came from library research and firms' annual
reports. The purpose of the library research was to obtain an in depth
understanding of advanced management accounting techniques to be included in
the questionnaire. Data collected from the firm's annual report are used to
measure variables firm's performance, size, capital intensity, risk and leverage.
These variables were measured as average for the periods of six years (1987-
1992).
Population, Sampling Frame and Data Collection Method
The population of interest in this study was large public listed firms in
Australia. While it would be ideal to make general inferences about the
relationship between the application of advanced management accounting
techniques and firm's performance, several characteristics of this study precluded
the feasibility of sampling the entire public listed companies population. First, the
design of the data collection instrument assumes that respondent firms were large
enough to apply many differents management accounting techniques. Second, the
study examined variables which typically have more dramatic affect on larger
firms such as risk, leverage, capital intensity. Therefore, it seemed reasonable to
test that portion of the general target population where a relationship between
contextual variables of firm characteristics, application of advanced management
accounting techniques and firm's performance was to surface.
78
The sampling frame of the population tested was the Top 500 Australian
companies listed in the Australian Financial Review Listed Company Handbook
(1992) which represents approximately the Top 500 companies ranked by market
capitalisation in 1992. The total market capitalisation of these companies
represents approximately 97% of the total market capitalisation of the main board
of the Australian Stock Exchange. The entire frame or population was included in
the survey. The mode of data collection was a mail questionnaire sent to the chief
accounting officer of each of the Top 500 companies. The intended recipient of the
questionnaire for most firms was the company chief accounting officer. An initial
pilot study of one hundred (100) questionnaires was sent to determine the
feasibility of the questionnaire and to gauge interest in the study objectives. A
response rate of 29 percent indicated an existing interest from the population.
Hypotheses Development
As indicated earlier the primary study objective was to determine the
relationship between the application of advanced management accounting
techniques and firm's performance and also analysis of the effect of contextual
variables of firm characteristics on the application of advanced management
accounting techniques. Thus, the first hypothesis tested the existence of a
relationship between the application of advanced management accounting
techniques and firm performance.
Hypothesis one:
H0i: There is no significant relationship between application of advanced
management accounting techniques and company performance.
79
Hli: There is significant relationship between application of advanced
management accounting techniques and company performance.
Hypothesis two to eight, which analysed the effect of firm characteristics
on the application of advanced management accounting techniques, were
developed based on the underlying premises that management accounting
techniques used in a company are expected to be a function of the characteristics
of the company. The classification of companies by some of their characteristics
may reflect underlying differences in technology, financing, planning horizon,
product and management structure. These differences may be a catalyst for
companies to adopt and use specific management accounting techniques.
Company Size
A number of studies have tested the relationship between the use of more
sophisticated quantitative techniques and the size of a company. The size of
company was generally found to be positively related to the application of
management accounting techniques. More and Reichert (1983) analysed the
association between 23 financial management techniques and company size. The
results indicated that out of 23, 11 techniques appear to be directly related to
company size.
In the area of capital budgeting, Schall et al., (1978) found that there was a
slight tendency for larger firms to use more advanced techniques. Similar findings
have been reported by Kim and Farragher (1981). For New Zealand companies
McNally and Eng (1980) and Patterson (1989) found positive association between
company size and the use of advanced quantitative techniques. By analysing
80
Australian firms, Freeman and Hobbes (1991) also discovered that there was a
significant correlation between company size and sophistication of capital
budgeting techniques.
In the area of operations research techniques, the surveys by Vatter (1967),
Radnor and Neal (1973), and Gaither (1975) suggest that size and extent of
operations research techniques use are positively related. Of firms responding to
Vatter's survey, the 30 firms with revenues over $ 1 billion reported 100 percent
use. In Gaither's survey the five largest firms measured by number of employees
(over 5000) reported 100 percent use. Radnor and Neal found operations research
activity in 104 of 108 firms with annual revenue in excess of $ 500 million. It may
be the case that application of advanced management accounting techniques
becomes necessary as a result of increasing size and greater spans of control.
Therefore, hypothesis 2 is as follow:
H02: There is no significant difference in the application of advanced management
accounting techniques between large companies and other companies.
HI2: Advanced management accounting techniques are applied more extensively
in large companies than in other companies.
Company Age
The general case for expecting company age to be positively associated
with the extent of application of management accounting techniques has rarely
been addressed in the literature. We have not found empirical studies which
attempt to observe the application of management accounting techniques of old
81
firms (more than 30 years in operation) as compared with new firms. It can be
argued that old firms are likely to be better established, to have more experience
and to recognise more varieties of management accounting techniques than newer
firms. Hence it is hypothesised that:
HO3: There is no significant difference in the extent of application of advanced
management accounting techniques between old companies and new
companies.
HI3: Advanced management accounting techniques are applied more extensively
in older companies than in newer companies.
Type of Ownership and Industry
In this study organisations are classified into four overlapping categories.
The distinction is between public domestic companies and public foreign
companies and between manufacturing and non-manufacturing companies. This
study seeks to extend the previous studies by attempting to discern whether there
are any difference in the application of advanced management accounting
techniques between public domestic and public foreign companies, and between
manufacturing and non-manufacturing companies.
It may be hypothesised that public foreign companies and manufacturing
companies are more frequent users of management accounting techniques than
public domestic companies and non-manufacturing companies because of the
significant differences that exist between them with regard to goals, expectations
and legal constraints. It is therefore important to test empirically whether there are
82
any significant differences in the extent of application of advanced management
accounting techniques between these two type of companies. Therefore, hypothesis
4 and 7 are formulated as follow:
HO4: There is no significant difference in the application of advanced management
accounting techniques between manufacturing and non-manufacturing
companies.
HI4: Advanced management accounting techniques are applied more extensively
in manufacturing companies than in non-manufacturing companies.
HO7: There is no significant difference in the application of advanced management
accounting techniques between public domestic companies and public foreign
companies.
HI7: Advanced management accounting techniques are applied more extensively
in public foreign companies than in public domestic companies.
Capital Intensity
Capital intensity can be interpreted as equivalent to what contextual
theories refer to as technology. Indeed some empirical studies of the contextual
theory of management accounting measure technology in terms of "the degree of
automation of the production process" (Merchant, 1984). Different types of
production methods have long been recognised as influencing the design of
internal accounting systems (Otley 1980). Perrow (1967) conceptualised such
production technologies in term of whether they are routine or non-routine. The
former are capital intensive whereas the latter are labour intensive. Capital
83
intensity is measured in this study by the yearly depreciation expenses divided by
the yearly operating assets.
Study of management's choice of accounting methods also indicated that
the choice of accounting practice is influenced by whether a firm is capital
intensive or labour intensive. Hagerman and Zmijewski (1981) found that the
degree of capital intensity affects choice of accounting methods. A firm with a
high degree of capital intensity reports artificially higher income than do labour
intensive firms because they are matching past cost of depreciation with current
earning. Therefore, there is a tendency the firm would be apt to choose income
decreasing accounting methods to reduce this inequity. Therefore, hypothesis 5 is
as follow:
HO5: There is no significant difference in the application of advanced management
accounting techniques between companies that have high capital intensity
and low capital intensity.
HI5: Advanced management accounting techniques are applied more extensively
in companies that have high capital intensity than companies that have low
capital intensity.
Risk and Leverage
There are also a number of studies which indicated that management's
choice of accounting methods may be influenced by a firm's capital structure as
well as firm's risk. However, studies which try to observe the association between
firm's risk and leverage with the extent of application of advanced management
accounting techniques, are rare in the literature. Dhaliwal (1980) found that the
level of leverage affects the method of accounting for oil and gas explorations
costs. He hypothesised that firms with high degrees of leverage would oppose
accounting principles which reduced income. The explanation is that as firms incur
increased levels of debt, a twofold effect may occur. First additional borrowing
may command a higher interest rate. Second, greater income is needed to offset
interest cost. Hence, it can be argued that as a firm increase debt, it may attempt
to reduce the effects on the debt/equity ratio via income-increasing accounting
methods.
Hagerman and Zmijewski (1979) stated that firms with high systematic risk
might elect accounting principles which reduced reported earning. Accounting
profits consist of a normal return of capital plus (minus) abnormal profits (losses)
with the normal return of capital affected by the firm's risk. They contended that
firms with higher systematic risk have higher rates of return and, therefore, appear
to make excessive profits. Further, firms with periodic high earnings appear to
earn abnormal profits, subjecting the firms to political costs. Therefore, to reduce
their reported earnings, these firms would opt for accounting methods which
postpone income to later years. Using a logical extension of this study, it may be
expected that firm's risk and leverage will influence the application of advanced
management accounting techniques. Therefore it is hypothesised that:
H06: There is no significant difference in the application of advanced management
accounting techniques between high risk companies and low risk companies.
Hl6: Advanced management accounting techniques are applied more extensively
in high risk companies than in low risk companies.
85
HOs: There is no significant difference in the application of advanced
management accounting techniques between high leverage companies and
low leverage companies.
Hl8: Advanced management accounting techniques are applied more extensively
in high leverage companies than in low leverage companies.
Statistical Method for Data Analysis
Mann-Whitney U Test
Hypotheses two through eight will be tested by nonparametric test, namely
Mann-Whitney U test (M-W U test). Nonparametric tests are appropriate for data
in nominal or ordinal scale. As has been discussed earlier, the application of
advanced management accounting techniques is measured on a five point Likert
scale for accounting techniques group one and two. This scoring system is ordinal
in nature. An ordinal or ranking scale is a scale of measurement in which the
object of a set are rank-ordered on the basis of operationally defined
characteristics. Therefore, the derived measure of the extent of application of
advanced management accounting techniques does not achieve measurement
characteristics normally associated with parametric statistical techniques. Based on
this argument, this study adopted a nonparametric test, namely M-W U test as the
most appropriate manner in which to test the study's hypothesis.
Mann-Whitney U test is basically used to test whether two independent
groups have the same distribution. Suppose two groups of companies, X and Y.
The null hypothesis, HO, may be that X and Y have the same distribution. The
86
alternative hypothesis, HI, may be accepted if the probability that a score (the
frequency of application of advanced management accounting techniques) from
group X is larger than the score from group Y is greater than one-half. That is, if
x is one observation (score) from group X, and y is one observation (score) from
Y, then the alternative hypothesis, HI, is that p(x>y)> 1/2. If the evidence
supports HI, this implies that the "frequency of application of advanced
management accounting techniques" of group X is higher than group Y (Siegel,
1988).
Multiple Logistic Regression
Hypothesis one, which concerns to the relationship between application of
advanced management accounting techniques and company's performance, will be
tested by using multiple logistics regression model. One of the more common
techniques used to analyse the hypothesis which concerns the relationship between
application of management accounting techniques and company's performance is
ordinary least squares (OLS). Use of this technique requires four assumptions:
1. linearity between the dependent and independent variables,
2. normal distribution in the error terms,
3. homoscedasticity of the error terms, and
4. independence of the error terms.
However, the dependent variable in this study, firm performance, is a discrete
variable. The use of a discrete dependent variable makes the OLS technique
inapplicable because it violates two of the above assumptions; there is nonlinearity
87
between the dependent variable and independent variable, and the error terms are
heteroscedastic. Therefore, some alternative statistical technique must be
employed.
The choice of an appropriate statistical techniques is dependent upon the
data specification. For this study, the choice of techniques was based on the
derivation of the dependent variable (firm's performance ) which is measured by
its adjusted rate of return. A discrete, ordinal measure for the dependent variable
was chosen. This led to the selection of multiple logistic regression as the
statistical techniques to be used.
The dependent variable represents a measure of the relative financial
performance of the subject firm. The performance of a specific firm can be gauged
by comparing its performance to the average performance of the sample firms.
Thus, the relative performance variable for this study become (RORfirm -
RORaverage)- The difference between firm and average sample firm performance
enables one to classify individual firms as above average performers (Above) if
the difference is positive and below average performers (Below) if the difference is
negative.
In the statistical model employed in this study, the relative performance
measure is specified as dichotomous dependent variable: Above = l; Below=0.
Given the categorical form of the dependent variable, a constrained version of the
linear probability model logistic regression is appropriate. Logistics regression
interprets the right hand side of the regression equation as a probability restricted
to value 0 and 1. The logistics regression model of this study takes the form:
Prob (Above)
Log = bO + blXl + b2X2 + b3X3 + + bkXk
1 - Prob (Above)
or
LogitP = bO + blXl + b2X2 + b3X3 + + bkXk
Where "Above" represents the above average performance category. The X's
represents the application of advanced management accounting techniques and
firm's characteristics variables such as size, age, type of industry, capital
intensity, risk, type of ownership and firm's leverage. The b's represent the
logistic regression coefficients. This logistic model is estimated using nonlinear
maximum likelihood estimation techniques. The objective is to estimate the
regression parameters that maximise the probability or likelihood of observing the
data sample. That is, the logistic model determines the probability that a specific
firm with a given set of behavioural and attitudinal attributes will fall into one
performance category or the other.
Testing for the Significance of the Model
In multiple linear regression, the hypothesis that the regression equation
did not provide any information about the dependent variable is tested by
examining the ratio of the variation associated with the regression equation
compared to the residual variation about the regression plane. When the resulting
value F was large, it can be concluded that the regression equation "explained"
some variance in the dependent variable.
89
The likelihood ratio test serves a role analogous to this F test for testing the
overall fit of a logistic regression (Stanton and Bryan, 1990). To construct the test
statistic for the likelihood ratio test, first compute the likelihood of obtaining the
observation if the independent variables had no effect on whether or not the
dependent variable was " above" or "below" average performers. In this case bl
= b2 = b3 = = bk = 0, and the regression model reduces to Logit P = bO
and bO is the mean outcome, or proportion of above average performers. When
the information in the independent variables included, the likelihood L of
obtaining the set of observations increases. The question is: does the increase in
the likelihood obtained by adding the independent variables significantly contribute
to the ability to predict the dependent variables?
This question can be answered by comparing the likelihood of obtaining the
observations if the full model holds L with the likelihood of obtaining the
observations if the independent variables had no effect on the outcome (the
intercept-only model) LQ by computing the test statistic:
L
Go2 = 2 In = 2 (In L - In LQ)
L0
If the pattern of observed outcomes is more likely to have occurred when the
2 independent variables affect the outcome than when they do not, G o will be a
large number. On the other hand, if the independent variables do not influence the
outcome (i.e., the value of the dependent variable), then the likelihood of
90
obtaining the observations given the information in the independent variables will
2 be the same as that contained in the mean response bO and G o will be zero. 2
Because of sampling variation, G o will vary if the null hypothesis of no
effect of the independent variables is true, just as the values of F varied in
multiple linear regression. Therefore, it needs to compare the observed value of
2 the G o test statistics with an appropriate sampling distribution. It has been shown 2 that the likelihood ratio test statistic approximately follows a % distribution with
k-1 degree of freedom, with the quality of this approximation improving as the
sample size grows. A large value of the likelihood ratio test statistic (or
corresponding small p value) indicates that the independent variables significantly
improve the ability to predict the outcome, the dependent variable.
Testing the Individual Coefficients
To test whether the coefficients associated with each independent variables
are significantly different from zero, this study used Wald test (analogous to the t
test in multiple linear regression). The Wald test is obtained by comparing the
maximum likelihood estimate of the slope parameter, bl, to an estimate of its
standard error. The resulting ratio, under the hypothesis that bl = 0, will follow a
standard normal distribution. Walt test can be stated as follow:
bl
W =
SE(bl)
A second approach to testing whether or not the independent variables Xj
improve the predictability of the regression equation is a form of the likelihood
ratio test just described. Let L _ j be the likelihood associated with the regression
model containing all the independent variables except Xj,
LogitP = bO + blXl + +bj_iXj-i + bj + iXj + i + + bkXk
and let L be the likelihood associated with the full regression equation. Testing
whether adding the independent variable Xj significantly improves the predictive
ability of the equation is carried out by computing the test statistic
L
Gj2 = 2 In = 2 (In L - In L_j)
This test statistic is compared with the critical values of the %2 distribution with 1
degree of freedom. This test is also sometimes called the improvement chi-squares
which is analogous to the incremental F test in linear regression. All statistical
tests in this study are run using computers software statistical packaged SPSS.
Summary
This chapter described the research methodology used to accomplish the
study's objectives. The primary sources of data came from a mail questionnaire
and secondary data were gathered from library research and company annual
reports. A questionnaires was mailed to each of 500 Top Australian public listed
companies. Eight hypothesis were developed to be tested. The multiple logistic
regression was selected as the appropriate test to be used in testing the hypothesis
one concerning the relationship between application of advanced management
accounting techniques and firm's performance. Nonparametric test namely Mann-
Whitney U test was selected to be used in testing hypotheses two through eight.
92
The sampling procedure, the definition and operational measures of the variables
were also discussed. The following chapter will be devoted to analysis of results
of the questionnaire and to discuss the profile of the respondents.
CHAPTER TV
DATA PRESENTATION AND ANALYSIS
This chapter reports the results of the mail questionnaires on the
application of advanced management accounting techniques by respondents. The
first section presents the results of a pilot study and the full scale study, including
testing of nonresponse bias. The second section describes the profile of the
respondents, and the third section presents the results that is the of application of
management accounting techniques by respondents. Part of the reason was to
examine what type of management techniques widely are accepted and less
accepted in practice.
The Pilot Study
An initial pilot of 100 questionnaires were sent to the respondents. The
objectives of the pilot study were twofold. First, to determine the feasibility of the
questionnaire and interest in the study objective. Second, to test the questionnaire
to ensure that the questions were clear to the recipients. A questionnaire was
mailed to the participants of the pilot study which were randomly drawn from the
Top 500 Australian companies listed in the Australian Financial Review Listed
Company Handbook (1992). The questionnaire included a cover letter describing
the purpose of the study (see Appendix A). Pilot participants were asked not only
to complete the questionnaire, but they were also asked to comment on the clarity
of the questions and to follow further discussion regarding the questionnaire.
94
The pilot study proved to be successful in terms of testing of the
questionnaire as well as testing of response rate. Some minor revisions were
suggested by participants in the pilot. Most of the participants asked to revise the
questionnaire series B part b regarding the application of management accounting
techniques type II. The response scale on these accounting techniques were
simplified to only 5 points scale instead of monthly scale. Further suggestion from
the respondents was that each management accounting technique needs to be
explained further by giving its definition.
A response rate of 28 percent indicated an existing interest in the
population and produced an estimate of the rate of return as well as the
distribution of responses that could be expected from an expanded mailing. Table
3 displays the distribution of the respondents of pilot study by activity sector.
TABLE 3 DISTRIBUTION OF RESPONDENTS OF PILOT STUDY
BY ACTIVITY SECTOR
Activity Sector Agriculture, forestry, fishing, hunting Mining Manufacturing Electricity, gas and water Wholesale and retail trade Transport, storage and communication Finance, property and business services Community services Recreation, personal Totals
N o of Firms 3 1
12 -
5 2 5 -
-
28
%
11 4
42 -
18 7
18 -
-
100
95
Full Scale Study
After evaluating the results of the pilot study, a revised questionnaire was
mailed to all Top 500 Australian companies listed in the Australian Financial
Review Listed Company Handbook. The questionnaires were mailed on September
15, 1993 to chief-accountant officers of all Top 500 Australian listed companies.
Included in the questionnaire were a cover letter by the researcher which explained
the purpose of the study and a self-addressed envelope. After four weeks, a follow
up letter was sent to the companies that did not return the questionnaire. Copies of
all material sent as part of the full scale study are contained in Appendix B. The
results of the mailing are presented in Table 4. Out of 500 questionnaires sent,
101 usable responses were received from the first mailing , or 20 percent
responded. Another 26 usable responses were received after the follow up letter.
Total usable responses were 127 which is accounted for 25 percent response rate.
The response rate in the full scale study was slightly lower than the pilot study (25
percent versus 28 percent). This response rate compare favourable to the similar
survey in Australia by Lilleyman (1984) which accounted for 26.4 percent
response rate.
TABLE 4 FULL SCALE STUDY RESPONSE DATA
Item No of firms % Number of questionnaires sent 500 100.00 Usable responses: To initial letter 101 20.20 To follow up letter 26 5.20 Total usable responses 127 25.40
Test for Nonresponse Bias
A major problem that might appear in collecting data through mailing of
questionnaires is not receiving a response from everyone in the sample.
Nonresponse bias would be present if responders were not representative of the
total population. Unless the responses are adequate, any conclusions drawn from
such a sample would not be valid since the sample would not be representative of
the population. Some sources of nonresponse are considered beyond the control of
the researcher such as the nature of the potential respondents, the auspices of the
research, and the ability to respond. However, the researcher can have some
influence on the response rate by considering his limited control over the survey's
sponsorship, population, subject matter and implementation.
To increase the response rate the sample of this study consisted of chief-
accountant officer of the companies. Thus, the questionnaire was addressed to a
very select group who would recognise the importance of the study. An
appropriately designed cover letter is essential in this study. The first paragraph of
the letter identified the researcher and the purpose of the study. The second
paragraph stressed the importance of the subject's response by indicating that his
name was chosen as a respondent who can provide information useful for the
study. In addition, responses will be held in strict confidence and will be published
in the form of statistical summaries which will make the identification of the
company impossible.
97
In order to catch the attention and to motivate the respondent, care was
taken to personalise the correspondence. This was achieved by typing each letter
on University of Wollongong letterhead. Each letter was addressed to the chief-
accountant officer of the firm and was personally signed. A pre-addressed return
envelope was included. In order to increase response rate, Dillman (1978)
suggests a follow up program, which consists of sending follow up postcards and
reminder letters at regular interval. But he emphasises that each step should be
subject to a cost and benefit analysis. Due to the high cost of postage, the full
scale study was conducted with only one follow up letter four weeks after the
initial mailing of the questionnaire.
All of these efforts were aimed at improving not only the quality of the
data collected but also the response rate obtained. A poor response rate constitutes
a critical failing in that it may result in conclusions which are not representative of
the population under study. Moser (1971) stated that while responses to mail
surveys as low as 10 percent are not unknown, a response rate which does not rise
above 20 percent may result in survey results of little, if any, value. In view of the
low response rate of 25.40 percent, nonresponse bias will be tested in this study.
To test the possible presence of nonresponse bias, a test was constructed
identical to one suggested by Oppenheim (1973). Oppenheim suggested two
methods of testing to find out whether nonresponse bias is presence. First, by
comparing respondents with non respondents on the original sampling list (in
terms of geographical location, sex, type of qualification, and so on). Second, by
comparing early respondents with late respondents (in term of their answers to the
98
questionnaire). This study adopted the second method which assumed that
respondents who respond in later waves are assumed to have responded because of
the increase stimulus, and they are expected to look more like the nonrespondents
than those in earlier waves.
This test was accomplished by comparing mean response score of each type
of management accounting techniques applied for the first 101 early returned
questionnaires with the last 26 late returned questionnaires. A series of t-test were
then run to determine whether there was a significant difference for each pair of
means response score. For each case the hypothesis can be stated as:
HO: Ul = U2
HO: Ul * U2
The test run was a two-tailed t-test which tests the null hypothesis that there is no
difference in the means response score for each type of management accounting
technique applied of the two groups respondents. The results of these tests are
shown in Table 5.
TABLE 5 S U M M A R Y OF T-TEST FOR NON-RESPONSE BIAS
Accounting Early Response=E N Techniques Late Response=L
Type I E 101 L 26
Type H E 101 L 26
Type m E 101 L 26
* Significant at the 0.05 confidence level
Means T-value Prob Reject Score The
Null
11.8812 -0.9800 0.3360 No 13.2308 21.1188 -1.4200 0.1620 No 23.5000 4.4158 -1.6900 0.0970 No 5.0385
99
As indicated by Table 5, for each type of management accounting
technique there was no significant difference between means response score of
early responses and late responses. The observed probability were 0.3360, 0.1620
and 0.0970 for type I, type II and type HI accounting techniques. All these
observed probabilities were above the significant level of 0.05. The results
indicate a lack of a material nonresponse bias.
Profile of the Respondents
Out of 500 questionnaires mailed to chief-accountant officer, 127 usable
questionnaires returned. Table 6 displays the distribution of the respondents by
activity sector. The main activity of respondents are manufacturing, mining and
finance companies. Manufacturing and mining companies accounted more than
one-half of total respondents that is 32.28 percent and 29.92 percent of total
respondents. Finance, property and business services companies contribute 17.32
percent of total respondents. The remaining activity sectors each contributed less
than 10 percent of total respondents.This results is consistent with the pilot study
except for the mining companies. In the pilot study, only one mining company
returned the questionnaire.
T A B L E 6 DISTRIBUTION O F R E S P O N D E N T S B Y ACTIVITY S E C T O R
Activity Sector Agriculture,forestry and fishing Mining Manufacturing Wholesale and retail trade Transport, storage and communication Finance, property and business services Recreation, personal and other services Totals
No of Firms 4
38 41 10 5
22 7
127
%
3.15 29.92 32.28 7.87 3.94 17.32 5.52
100.00
100
In terms of ownership, the respondents are classified into two categories,
domestic firms and foreign firms. The types of ownership is reflected in the
different legal and political factors. These factors, such as political ideology,
system of government, specific laws concerning control of organisations may have
a significant impact on the application of management accounting techniques.
Table 7 shows the distribution of respondents by type of ownership.
TABLE 7 DISTRIBUTION OF RESPONDENTS BY TYPE OF OWNERSHIP
Type of Ownership Domestic Firms Foreign Firms Totals
No of Firms 114 13
127
%
89.76 10.24
100.00
Table 7 above shows that the majority of respondents are controlled by domestic
firms and only 10 percent are controlled by foreign firms.
It could be reasoned that old firms are more likely to be better established,
to have more experience than the new firms. When respondents are classified by
years in business operation, it indicates that nearly one-half of the respondents
have been in business operation for more than 30 years.
TABLE 8 DISTRIBUTION OF RESPONDENTS BY AGE
(YEARS IN BUSINESS)
Years in Business Operation < = 10 years 11-20 years 21 - 30 years more than 30 years Totals
N o of Firms 39 12 16 60 127
%
30.71 9.45 12.60 47.24 100.00
101
About one-third of respondents stated that they have been in business for less than
10 years and 22 percent of respondents have been in business between 10 to 30
years (see Table 8).
Cross-Classification of the Respondents
To aid in the interpretation of the study's results, the responses received
are cross-classified as shown in Tables 9, 10 and 11. Table 9 displays the cross-
classification between type of ownership and activity sector. The respondents of
domestic firms is dominated by the firms who engage in mining and manufacturing
activity. These two types of firm accounted more than one-third of total
respondents of domestic firms. For respondents of foreign firms, more than one-
half come from the manufacturing sector.
TABLE 9 CROSS CLASSIFICATION OF RESPONDENTS
BY TYPE OF OWNERSHIP AND ACTIVITY SECTOR
Type of ownership Activity sector Agriculture, forestry and fishing Mining Manufacturing Wholesale and retail trade Transport, storage and communication Finance, property and business services Recreation, personal and other services Totals 114 100.00 13 100.00
About 18.42 percent of domestic firms engage in finance and property sector and
followed by wholesale and retail sector, recreation and personal sector, transport
Domestic Firms N o of firms
3 35 34 9 5 21 7
%
2.63 30.70 29.82 7.90 4.39 18.42 6.14
Foreign Firms N o of firms
1 3 7 1 -
1 -
%
7.69 23.08 53.85 7.69
-
7.69 -
102
and storage, and agriculture, forestry. The percentage are 7.90 percent, 6.14
percent, 4.39 percent and 2.63 percent respectively.
When respondents are cross-classified by years in business operation and
type of ownership, it indicates that nearly one-half of domestic firms have been in
business more than 30 years. This figure is even higher for the foreign firms
which accounted more than two-thirds of firms have been in business for more
than 30 years (see Table 10). Almost one-third or 33.33 percent of domestic firms
have been in business for less than 10 years, while 15.39 percent of foreign firms
have been in business less than 10 years. Domestic firms who are in business
between 11-20 years and 21-30 years represent by 10.53 percent and 12.29
percent respectively.
TABLE 10 CROSS CLASSIFICATION OF RESPONDENTS
BY TYPE OF OWNERSHIP AND AGE
Type of ownership Years in business < = 10 years 11 -20 years 21 - 30 years more than 30 years Totals
Domestic Firms N o of firms % 38 33.33 12 10.53 14 12.29 50 43.85
114 100.00
Foreign N o of firms
2
1 10 13
Firms %
15.39
7.69 76.92
100.00
Table 11 shows cross-classification of respondents in term of years in
business and their activity sector. The respondents who have been in business
more than 30 years mainly come from manufacturing and mining companies which
accounted for 45 percent and 16.67 percent respectively. For the other years in
business categories, again manufacturing and mining sectors contribute a higher
103
1 -
11 5
2.50 -
27.50 12.50
-
1 -
1
-
8.33 -
8.33
1 1 2 -
6.67 6.67
13.33 -
8 3 9 1
13.33 5.00
15.00 1.67
percentage. For category in business less than 10 years, 30 percent is represented
by mining firms and 25 percent is represented by manufacturing firms.
TABLE 11 C R O S S CLASSIFICATION O F R E S P O N D E N T S
B Y A G E A N D ACTIVITY S E C T O R
Years in business < = 10 yrs 11 - 20yrs 21 - 30yrs > 30 yrs Activity Sector # firms % # firms % # firms % # firm %~~ Agriculture, forestry and fishing 1 2.50 - - 1 6.67 2 3.33 Mining 12 30.00 8 66.67 8 53.33 10 16.67 Manufacturing 10 25.00 2 16.67 2 13.33 27 45.00 Wholesale and retail trade Transport, storage and comm. Finance, property and services Recreation, personal and other Totals 40 100.00 12 100.00 15 100.00 60 100.00
Finance and property firms also contribute 27.50 percent, second after mining
firms. For categories years in business 11-20 years as well as 21 - 30 years,
once again mining firms contribute more than one-half of the respondents from
that categories. That are 66.67 percent for 11 - 20 years category and 53.33
percent for 21 - 30 years category.
Management Accounting Practice
This section is mainly devoted to the application of advanced management
accounting techniques in Australian listed companies. The results is based on
questionnaires mailed to the chief-accountant officer of the firms. As discussed in
chapter 3, there are 25 management accounting techniques asked in the
questionnaire. These 25 accounting techniques are classified into three different
types of techniques. The first type of these techniques is mainly known as
operational research techniques. This type of technique can be applied many times
or not at all within one year. To capture the extent usage of this type I techniques
by the respondents, a simple adoption/non-adoption dichotomy may be an
unsatisfactory measure. Instead of asking yes or no to the respondents, five points
Likert scale used in this study. The scale consists of five alternative responses,
never used, seldom used, sometimes used, usually used, and always used. If the
management accounting techniques never used by the firms, it will be given score
0, seldom used 1, sometimes used 2, usually used 3, and always used 4. Type I
advanced management accounting techniques consists 8 techniques. Those are
decision tree analysis, relevant costs analysis, capital budgeting, linear
programming, net-work analysis/PERT, inventory control models, just in time
inventory, and sensitivity analysis. For each respondent the maximum total score
of application type I techniques is 32 which means the respondent always used
these 8 management accounting techniques and minimum score of 0 is expected if
the respondents never used these 8 techniques.
Similar five points scale also used to measure the application of advanced
management accounting techniques type II. Type II techniques are those
techniques that are used at regular intervals. Therefore, these techniques can be
applied monthly, quarterly, semi annually, annually, and not used at all. There are
8 techniques included in the type II techniques and are mainly ratio analysis.
Those are variance analysis, break-even analysis, contribution reporting, inventory
profit analysis and other ratio analysis. If respondent applied the accounting
techniques monthly which means frequently applied in one year, it will be given
score 4, quarterly score 3, semi annually score 2, annually score 1 , and not used
at all in one year will be given score 0. Hence, total maximum score is 32 and
minimum score 0 for each respondent.
The third type of advanced management accounting techniques comprises
techniques where the frequency of application is continuous for one year.
Therefore, there are only two possible answers either used or not used. There are
9 techniques included in this type III techniques which consists of responsibility
accounting, transfer pricing, standard costing, activity based costing, operation
budget, flexible budget, appropriation budget, performance budget and fixed
budget.
The chief-accountant officers responses to the application of advanced
management accounting techniques is shown in Table 12. An examination of the
utilisation rate of type I management accounting techniques showed that capital
budgeting, sensitivity analysis and relevant cost analysis were the most frequent
used techniques. More than one-half of the respondents claimed to always use
capital budgeting techniques and 21.26 percent of respondents usually used this
techniques. More than 75 percent of the respondents claimed that they sometimes,
usually and always used sensitivity analysis techniques. Relevant cost analysis has
been used by 70 percent of the respondents with 26.77 percent and 22.05 percent
of respondents said that they usually used and always used of this technique.
Operation research techniques seemed less popular for the respondents. Decision
tree analysis was never used by 67.72 percent of respondents and this was
106
TABLE 12 THE EXTENT OF MANAGEMENT ACCOUNTING TECHNIQUES
% USED BY RESPONDENTS
Techniques Type I Never Used
Seldom Used
Sometimes Used
Usually Used "
Always Used
Total
Decision tree analysis Relevant cost analysis Capital budgeting Linear programming Net-work analysis/PERT Inventory control models Just in time inventory Sensitivity analysis
67.72 30.71 12.60 65.35 62.99
43.31
56.69 19.69
14.17 4.72 0.79 20.47 14.17
7.09
8.66 3.94
13.39 15.75 7.87 10.24 16.54
11.02
8.66 23.62
3.94 26.77 21.26 3.94 4.72
12.60
12.60 25.98
0.78 22.05 57.48 -
1.58
25.98
13.39 26.77
100 100 100 100 100
100
100 100
Techniques Type JJ Not Used
Monthly Quarterly Semi Annually
Annually Total
Variance analysis Break-even analysis Contribution reporting Inventory turnover Ace. receivable turnover Aging of ace. receivable Gross profit analysis Other financial ratio
7.87 44.88 20.47 40.17 39.37
29.13 12.60 12.60
85.04 22.05 69.29 45.67 57.48
67.72 77.95 66.93
3.94 8.66 3.94 4.72 -
0.79 3.15 7.87
0.79 7.87 0.79 4.72 0.79
-
3.94 6.30
2.36 16.54 5.51 4.72 2.36
2.36 2.36 6.30
100 100 100 100 100
100 100 100
Techniques Type HI Responsibility accounting Transfer pricing Standard costing Activity based costing Operating budget Flexible budget Appropriation budget Performance budget Fixed budget
Not Used
Used Total
27.56 72.44 100
60.63 54.33 66.93 3.94 62.99 77.95 48.82 42.52
39.37 45.67 33.07 96.06 37.01 22.05 51.18 57.48
100 100 100 100 100 100 100 100
107
followed by linear programming which accounted for 65.35 percent never used
and net-work analysis/PERT was never used by 62.99 percent of respondents.
Other techniques such as inventory control models have been used by almost than
one-half of respondents and more than 25 percent of respondents claimed to
always used this technique. New techniques such as just in time inventory have
been used by nearly one-half of respondents with 11.02 percent, 12.60 percent and
13.99 percent of respondents said that they sometimes used, usually used and
always used this techniques.
The results of the extent usage of operation research techniques in this
study is consistent with the findings of the previous studies conducted by
Lonnstedt (1973), Gaither (1975), Green et al., (1977) and Kwong (1986). On the
study of 12 listed companies known to be using operation research techniques,
Lonnstedt found that 37 percent of respondents used net-work analysis. This was
followed by linear programming which only used by 16 percent of respondents.
Green et al., (1977) also found similar results. In the study of the extent of usage
of quantitative techniques in production/operations management in large US
corporation, Green et al., observed that 25 percent of respondents were frequent
use of net-work analysis, linear programming and inventory models. Studies in
the developing countries conducted by Kwong (1986) also found the same results
compared to the studies in developed countries. Kwong surveyed 106 firms in
Singapore and 212 firms in Malaysia. The Malaysian survey found that 55 out of
198 responding firms were using some form of operation research techniques. The
degree of use of techniques indicates that inventory models and linear
108
programming were being adopted by about a quarter of the user firms. Net-work
analysis/PERT was only used by 18 users firms. The Singapore results were lower
compared to Malaysian results. Inventory models were used only by nine firms
and linear programming was used by only three users firms. A recent survey
conducted by Lam (1993) confirmed previous findings as well as the current
findings. Lam surveyed all the companies listed on the Hongkong Stock
Exchange. The result shows that a number of operations research techniques,
which have been in the literature for many years, are virtually unused by the
respondents companies. Net-work analysis/PERT and linear programming had
been used by 14 percent of the responding firms. The other two techniques,
inventory models and decision tree analysis, had been used by 18 percent and 6
percent of the respondents respectively.
There is a belief held by academics that management accounting
techniques developed in the academic literature are actually used in practice.
However, textbooks do not give evidence that support this belief. The research
findings in this study regarding the application of management accounting
techniques type I shows that four of the eight techniques gained wide acceptance in
practice. Capital budgeting, sensitivity analysis, relevant cost analysis, and
inventory control models were reported to be actually used in practice by 87.4
56.69 percent (72 firms) of the respondents, respectively. Other techniques such as
decision tree analysis, linear programming, net-work analysis/PERT and Just in
109
time inventory received minor acceptance in practice which accounted for less than
40 percent of respondents claimed being used of these techniques.
Examining advanced management accounting techniques type II used by
respondents reveals that four techniques have been used by more than three-
quarters of the respondents. Those techniques are variance analysis, contribution
reporting, gross profit analysis , and other financial ratio analysis. Other
techniques such as break-even analysis, inventory turnover analysis, account
receivable turnover analysis, and aging account receivable have been used by more
than one-half of respondents.
The frequency of using the techniques shows that 85.04 percent of
respondents use variance analysis at least monthly. This followed by contribution
reporting, aging account receivable, gross profit analysis, and other financial ratio
techniques which have been used at least monthly by more than 65 percent of
respondents. Break-even analysis have been used evenly across the categories,
22.05 percent respondents used this techniques monthly, 8.66 percent respondents
claimed used break-even techniques at least quarterly, 7.87 percent respondents
used semi-annually and about 16.54 percent respondents said that they used break
even analysis annually. It is interesting to note that popular techniques according
to textbooks such as break-even analysis had not been used widely in practice.
This study finding shows that 63.22 percent of respondents claimed had used
break-even analysis. Lam (1983) reported low usage of this technique which was
only used by 22 percent of the responding firms
110
The application of management accounting techniques type in have been
categorised into whether the techniques "is" or "is not" used by respondents.
Table 12 shows that operating budget was the most popular techniques used, being
adopted by almost all respondents which accounted for 96.06 percent of
respondents. This was followed by responsibility accounting, fixed budget, and
performance budget. Responsibility accounting has been adopted by 72.44 percent
of respondents . Fixed budget and performance budget have been adopted by
57.48 percent and 51.18 percent of respondents respectively. In contrast,
appropriation budget was a less popular techniques, used by 22.05 percent of
respondents and followed by activity based costing, flexible budget and transfer
pricing. An interesting to note that new techniques such as activity based costing is
now being adopted in Australia and is used by 33.07 percent of respondents.
In the area of budgets, the findings of this study was also supported by
previous studies. Imhoff (1978) discovered from his surveyed of 53 publicly-
traded companies included in NYSE and AMEX that 73 percent of the firms
surveyed used budget as significant factor in the evaluation of performance. He
also found that 81 percent of those firms which used budget as a performance
measure did use flexible budget. Ntow (1991) also confirmed the present study
results. In comparing budgetary control systems between American and Japanese
manufacturing firms, Ntow found that most of the firms used types of budgets
such as static budgets, flexible budgets, standard budgets, contingency budgets and
simulated budgets.
Ill
Management Accounting Practice and Activity Sector
Table 13 A was prepared to examine whether there is any difference in the
extent usage of management accounting techniques between manufacturing firms
and non-manufacturing firms. As can be seen in Table 13A, for management
TABLE 13A THE EXTENT OF M A N A G E M E N T ACCOUNTING TECHNIQUES
% USED B Y RESPONDENTS ACCORDING TO THE ACTIVITY SECTOR
Techniques Type I
Decision tree analysis
Relevant cost analysis
Capital budgeting
Linear programming
Net-work analysis/PERT
Inventory control models
Just in time inventory
Sensitivity analysis
Techniques Type II
Variance analysis
Break-even analysis
Contribution reporting
Inventory turnover
Ace. receivable turnover
Aging ace. receivable
Gross profit analysis
Other financial ratio
Techniques Type III
Responsibility acctg.
Transfer pricing
Standard costing
Activity based costing
Operating budget
Flexible budget
Appropriation budget
Performance budget
Fixed budget
Never Used Seldom Used Sometimes Used
M
63.41
34.15
14.63
65.85
70.72
41.46
48.78
21.95
NM M NM 69.77 17.07 12.79
29.07 - 6.98
11.63 - 1.16
65.12 24.39 18.61
59.30 12.20 15.12
44.19 2.43 9.30
60.47 14.63 5.81
18.61 2.43 4.65
Not Used Monthly
M
12.20
46.34
21.95
43.90
39.02
31.71
12.20
9.76
NM M NM 5.81 82.92 86.05
44.19 21.95 22.09
19.77 68.29 69.77
38.37 41.46 47.67
39.54 60.98 55.81
27.91 68.29 67.44
12.78 75.60 79.07
13.95 73.16 63.95
Not Used Used
M
26.83
60.98
60.98
65.85
4.88
68.29
68.29
48.78
36.58
NM M NM 27.91 73.17 72.09
60.47 39.02 39.53
51.16 39.02 48.84
67.44 34.15 32.56
3.49 95.12 96.51
60.47 31.71 39.53
82.56 31.71 17.44
48.84 51.22 51.16
45.35 63.42 54.65
M
12.20
19.51
9.76
9.76
12.20
9.76
7.32
21.95
NM
13.95
13.95
6.98
10.46
18.61
11.63
9.30
24.42
Quarterly
M 2.44
7.32
2.44
2.44
-
-
2.44
4.88
NM
4.65
9.30
4.65
5.82
-
1.16
3.49
9.30
Usually Used
M
4.88
26.83
21.95
-
2.44
12.20
7.32
34.16
NM
3.49
26.74
20.93
5.81
5.81
12.79
15.12
22.09
Semi Annually
M
-
7.32
-
7.32
-
-
7.32
7.32
NM
1.16
8.14
1.16
3.49
1.16
-
2.33
5.81
Always Used
M
2.44
19.51
53.66
-
2.44
34.15
21.95
19.51
NM -
23.26
59.30
-
1.16
22.09
9.30
30.23
Annually
M
2.44
17.07
7.32
4.88
-
-
2.44
4.88
NM
2.33
16.28
4.65
4.65
3.49
3.49
2.33
6.99
M = Manufacturing N M = Non-manufacturing
112
accounting techniques type I capital budgeting and sensitivity analysis were widely
accepted in practice for both manufacturing and non-manufacturing firms. Capital
budgeting was adopted by 85.37 percent of responding manufacturing firms and
88.37 percent of respondents non-manufacturing firms.
Both type of firms reported that they used capital budgeting frequently.
More than 50 percent of manufacturing as well as non-manufacturing respondents
claimed that they always used this techniques. For the categories of usually used
this technique, 21.95 percent manufacturing firms reported that they usually used
capital budgeting and 20.93 percent of non-manufacturing firms also usually used
this techniques. Sensitivity analysis was applied by 78.05 percent of manufacturing
firms and 81.39 percent of non-manufacturing firms. The frequency of applying
sensitivity analysis techniques had been spread evenly across the categories. The
percentage of manufacturing firms applying sensitivity analysis are 21.95 percent
sometimes used, 34.16 percent usually used, and 19.51 percent always used this
techniques. In the non-manufacturing sector the percentage of applying sensitivity
analysis are 24.42 percent sometimes used, 22.09 percent usually used, and 30.23
percent always used this technique. Operation research techniques were not
widely accepted in practice by either sector. About 36 percent of manufacturing
firms apply decision tree analysis. Only 29.28 percent use net-work
analysis/PERT, and about 34.15 percent employ linear programming. As in the
manufacturing sector, decision tree analysis, net-work analysis/PERT and linear
prograniming are the least applied techniques in non-manufacturing firms.
113
Decison tree analysis is used by 30.23 percent of non-manufacturing firms,
net-work analysis/PERT by 40.70 percent, and linear programming by 34.88
percent. Surprisingly, net-work analysis/PERT which is much more suitable in the
manufacturing sector had been less accepted in manufacturing firms than in non-
manufacturing firms. Inventory control models had been applied by more than
one-half of both sectors. They are applied by 58.54 percent of manufacturing
firms and 55.81 percent of non-manufacturing firms. Just in time inventory had
been adopted more in practice by manufacturing firms than non-manufacturing
firms. It is adopted by 51.22 percent of manufacturing firms and only used by
39.53 percent of non-manufacturing firms. This is not surprising since just in time
inventory is much more dedicated to manufacturing firms.
In the case of management accounting techniques type U, the most widely
accepted techniques by manufacturing firms were other financial ratio analyses,
followed by variance analysis, gross profit analysis and contribution reporting.
Financial ratio analysis is used by 90.24 percent of manufacturing firms
respondents and 73.16 percent claimed they had been used this techniques at least
monthly. Variance analysis and gross profit analysis are adopted by 87.80 percent
of responding manufacturing firms. Both techniques claimed to be used monthly
by about 82.92 percent and 75.60 percent of manufacturing firms respectively.
Contribution reporting is applied by 78.05 percent of manufacturing firms and
68.29 percent claimed that they used this technique monthly. These figures are
almost the same for non-manufacturing respondents. Variance analysis was the
most frequently applied technique being used by 94.19 percent of non-
114
manufacturing firms. This was followed by gross profit analysis which is being
applied by 87.22 percent of non-manufacturing firms, and other financial ratio
analysis is adopted by 86.05 percent of non-manufacturing firms.
In the area of management accounting techniques type UJ, both activity
sectors reported that the most widely accepted technique was operating budget.
This technique had been applied by 95.12 percent of manufacturing firms and
96.51 percent of non-manufacturing firms. Responsibility accounting also gained
wide acceptance by both sectors. It is being used by 73.17 percent of
manufacturing firms and 72.09 percent of non-manufacturing firms. Flexible
budget and appropriation budget are not popular techniques for either sector. The
percentage of manufacturing firms applying flexible budget and appropriation
budget is 31.71 percent, while the figure for non-manufacturing firms is 39.53
percent and 17.44 percent respectively. In the case of flexible budget, it is
surprising that this technique is received low acceptance in the manufacturing
sector. Other budgeting techniques that are performance budget and fixed budget
had been applied by more than one-half of responding manufacturing firms as well
as non-manufacturing firms. Transfer pricing and standard costing which were
expected to be popular techniques among manufacturing firms, in reality have low
acceptance. The figure is less than 50 percent of respondents from both sectors
claimed to use transfer pricing and standard costing.
The research's findings indicate that conventional management accounting
techniques such as capital budgeting, variance analysis, contribution reporting,
gross profit analysis, operating budget and responsibility accounting have gained
115
considerable acceptance and application in Australian public listed manufacturing
as well as non-manufacturing companies. Operation techniques such as decision
tree analysis, linear programming and net-work analysis/PERT were not popular
in Australian public listed manufacturing and non-manufacturing firms. The
relatively newer techniques such as just in time inventory and activity based
costing have gained growing acceptance in practice.
Management Accounting Practice and Type of Ownership
Table 13B is presented to highlight the effects that type of ownership might
have on the adoption of management accounting techniques. In terms of
ownership, the respondents were categorised into two type of ownership: domestic
controlled firms and foreign controlled firms.
Capital budgeting and sensitivity analysis were the most widely adopted in
practice by both types of companies. However, foreign companies tend to apply
these techniques more extensively than domestic companies. The percentage
applying capital budgeting and sensitivity analysis by foreign firms is 92.31
percent. Fifteen percent of foreign firms claimed that they usually use capital
budgeting techniques and 69.23 percent of foreign firms claimed that they always
use capital budgeting. For sensitivity analysis, 38.46 percent of foreign firms
reported that they sometimes use this technique, 23.01 percent of foreign firms
said that they usually use, and 30.77 percent of foreign firms claimed that they
always use sensitivity analysis. The percentage of domestic firms who claimed to
use capital budgeting and sensitivity analysis is 86.84 percent and 78.95 percent.
116
TABLE 13B THE EXTENT OF MANAGEMENT ACCOUNTING TECHNIQUES
% USED BY RESPONDENTS ACCORDING TO THE TYPE OF OWNERSHIP
Techniques Type I
Decision tree analysis
Relevant cost analysis
Capital budgeting
Linear programming
Net-work analysis/PERT
Inventory control models
Just in time inventory
Sensitivity analysis
Techniques Type II
Variance analysis
Break-even analysis
Contribution reporting
Inventory turnover
Ace. receivable turnover
Aging ace. receivable
Gross profit analysis
Other financial ratio
Techniques Type III
Responsibility acctg.
Transfer pricing
Standard costing
Activity based costing
Operating budget
Flexible budget
Appropriation budget
Performance budget
Fixed budget
Never Used
F
38.46
23.08
7.69
38.46
53.84
23.08
30.77
7.69
D
71.05
31.58
13.16
68.42
64.04
45.61
59.64
21.05
Not Used
F
7.69
38.46
15.39
7.69
38.46
23.08
-
7.69
D
7.90
45.61
21.05
43.85
39.47
29.83
14.04
13.16
Not Used
F
15.39
53.85
38.46
76.92
-
69.23
69.23
46.15
30.77
D
28.95
61.4
56.14
65.79
4.39
62.28
78.95
49.12
43.86
Seldom Used
F
7.69
7.69
-
38.46
23.08
-
15.39
~
D
14.91
4.39
0.88
18.42
13.16
7.90
7.90
4.39
Monthly
F
84.62
30.77
69.23
76.93
61.54
69.23
92.31
76.93
D
85.08
21.05
69.30
42.11
57.02
67.54
76.31
65.79
Used
F
84.61
46.15
61.54
23.08
100 30.77
30.77
53.85
69.23
D
71.05
38.6
43.86
34.21
95.61
37.72
21.05
50.88
56.14
Sometimes Used
F
53.85
23.08
7.69
15.39
23.08
23.08
-
38.46
D
8.77
14.91
7.90
9.65
15.79
9.65
9.65
21.93
Quarterly
F
-
-
7.69
7.69
-
-
-
~
D
4.39
9.65
3.51
4.39
-
0.88
3.51
8.77
Usually Used
F
-
15.39
15.39
7.69
-
15.39
38.45
23.08
D
4.39
28.07
21.92
3.51
5.26
12.28
9.65
26.31
Semi-Annually
F
-
7.69
-
-
-
-
-
7.69
D
0.88
7.90
0.88
5.26
0.88
-
4.39
6.14
Always Used
F
-
30.76
69.23
-
-
38.45
15.39
30.77
D
0.88
21.05
56.14
-
1.75
24.56
13.16
26.32
Annually
F
7.69
23.08
7.69
7.69
-
7.69
7.69
7.69
D
1.75
15.79
5.26
4.39
2.63
1.75
1.75
6.14
F = Foreign firms D = Domestic firms
Fifty-six percent of domestic firms reported to always use capital budgeting and
26.32 percent of domestic firms said to always use sensitivity analysis.
117
Operation research techniques such as decision tree analysis, linear
prograniming and net-work analysis/PERT were less popular among domestic
firms than foreign firms. Decision tree analysis had been applied by 28.95 percent
of domestic firms, while the percentage for foreign firms was 61.54 percent.
Similar findings also appear for linear programming which was used by 31.58
percent of domestic firms and 61.54 percent of foreign firms. Net-work
analysis/PERT is being applied by 35.96 percent of domestic firms and 46.16
percent of foreign firms. In the area of inventory control, both inventory control
models and just in time inventory techniques had been applied more extensively by
foreign firms than domestic firms. Inventory control models being applied by
76.99 percent of foreign firms and 38.45 percent of foreign firms respondents
claimed always use this techniques. In contrast, inventory control models only
being applied by 54.39 percent of domestic firms with category of always use this
techniques 24.56 percent of responding domestic firms. The percentage of foreign
firms applying just in timeinventory is 69.23 percent and the frequency of its
application were 38.45 percent of foreign firms claimed usually use and 15.39
percent said that they always use this techniques.
On the other hand, just in time inventory had been applied by only 40.36 percent
of domestic firms with the frequency of application 9.65 percent usually use and
13.16 percent always use this technique.
In the case of financial ratio techniques, foreign firms and domestics firms
did not report any differences in applying financial ratio techniques. Almost all
techniques had been applied by more than 60 percent of responding foreign and
118
domestic firms. More than one-half of respondents claimed that they apply all
techniques monthly with the exception of break-even analysis which was applied
monthly and annually. In the foreign firms, the most widely accepted techniques in
order are gross profit analysis, variance analysis, inventory turnover analysis, and
other financial ratio. Meanwhile, the most adopted techniques in the domestic
firms are variance analysis, other financial ratio, gross profit analysis and
contribution reporting.
There was not much difference in the application of management
accounting techniques type in between foreign firms and domestic firms. In the
area of budget, three types of budget techniques gained wide acceptance in
practice for both types of firms. Those budget techniques are operating budget,
fixed budget and performance budget. All responding foreign firms (13 firms)
claimed to use operating budget. This was followed by fixed budget which had
been used by 69.23 percent of foreign firms and performance budget.
The percentage of domestic firms applying operating budget, fixed budget
and performance budget is 95.61 percent, 56.14 percent and 50.88 percent
respectively. The other two types of budget that are flexible budget and
appropriation budget only received minor acceptance in practice being applied by
less than 40 percent of responding foreign and domestic firms. Responsibility
accounting also gained wide acceptance in practice. This technique was being
applied by 84.61 percent of foreign firms and 71.05 percent of domestic firms.
Standard costing had been applied more extensively by foreign firms than domestic
119
firms. It is being applied by 61.54 percent of foreign firms and 43.86 percent of
domestic firms.
The research findings show that capital budgeting and sensitivity analysis
were the most widely accepted management accounting techniques type I by both
foreign and domestic firms. The frequency of its application mostly claimed to be
usually used and always used. In contrast, operation research techniques such as
decision tree analysis, linear programming and net-work analysis/PERT only
gained minor acceptance in both foreign and domestic firms. Foreign firms applied
more extensively inventory control models and just in time inventory than
domestic firms. In the area of management accounting techniques type II which is
mainly financial ratio analysis, both foreign and domestic firms had applied almost
all techniques monthly. Only break-even analysis had been claimed to be used
monthly as well as annually. Operating budget, fixed budget and performance
budget were the most popular budget techniques applied by both foreign and
domestic firms, while flexible budget and appropriation budget only gained minor
acceptance in those two types of companies. Foreign firms used slightly more
responsibility accounting and standard costing techniques than domestic firms.
Summary
The first section of this chapter provides the results of pilot study and full
scale study. The pilot study was conducted to determine feasibility of the
questionnaire and interest in the study objective. One hundred questionnaires were
sent to the respondents and 28 responses were received or 28 percent a response
rate. This indicates an existing interest in the population. Some minor revision of
the questionnaires were suggested by respondents. In the full scale study, a revised
questionnaire was sent to all Top 500 Australian companies. Out of 500
questionnaires sent, 101 usable responses were received from the first mailing or
20 percent response rate. Further 26 usable responses were received after the
follow up letter. Total usable responses were 127 which accounted for 25 percent
response rate. Nonresponse bias was tested by comparing early respondents with
late respondents in terms of their answer to the questionnaires. This test was
accomplished by comparing mean response score of each type of management
accounting techniques applied for the first 101 early returned questionnaires with
the last 26 late returned questionnaires. The result shows a lack of a material
nonresponse bias.
The second section provides a profile of the respondents. The main
activity sector of respondents were manufacturing, mining and finance companies.
About 90 percent of respondents were controlled by domestic firms and the
remaining were controlled by foreign firms. When respondents were classified by
years in business operation, it indicates that nearly one-half of the respondents
have been in business for more than 30 years. About one-third have been in
business for less than 10 years and about one-fifth have been in business between
10 to 30 years. The respondents of domestic firm were dominated by mining and
manufacturing firms, while respondents of foreign firm were dominated by
manufacturing firms. Nearly one-half of domestic firms have been in business
operation for more than 30 years. This figure is even higher for the foreign firms
121
which accounted of two-third of firms. The respondents who have been in business
for more than 30 years mainly came from manufacturing and mining sector.
The third section presents the results of management accounting practice
adopted by the respondents. For the management accounting techniques type I, the
most frequent used of techniques were capital budgeting, sensitivity analysis and
relevant cost analysis. Operation research techniques seemed less popular with the
respondents. A new technique such as just in time inventory had gained acceptance
in practice. This technique had been used by nearly one-half of the respondents
with category of usually used 12.60 percent and always used 13.99 percent of the
respondents. The most popular techniques for management accounting techniques
type II were variance analysis, contribution reporting, gross profit analysis, and
other financial ratio analysis which had been used by more than three-quarter of
the respondents. Break-even analysis which is popular technique according to
textbooks had not been used as widely in practice. The study result shows that
break-even analysis had been used by 63.22 percent of the respondents.
In the case of management accounting techniques type III, operating budget
was the most popular technique, being adopted by almost all respondents which
accounted for 96.06 percent. This was followed by responsibility accounting, fixed
budget, and performance budget. In contrast, appropriation budget was a less
popular technique, followed by activity based costing, flexible budget and transfer
pricing. A new technique such as activity based costing is now being adopted in
Australia and it was used by 33.07 percent of the respondents. Capital budgeting
and sensitivity analysis were widely accepted in practice for both manufacturing
and non-manufacturing firms. In contrast, operations research techniques were not
widely accepted in practice by either sector. In the area of management accounting
techniques type HI, both activity sectors reported that the most widely accepted
technique was operating budget, followed by responsibility accounting. Flexible
budget and appropriation budget were not popular techniques for either sector.
In terms of ownership, capital budgeting and sensitivity analysis were the
most widely adopted in practice by domestic firms as well as foreign firms.
However, foreign firms tend to apply these techniques more extensively than
domestic firms. Operations research techniques such as decision tree analysis,
linear programming and net-work analysis/PERT were less popular among
domestic firms than foreign firms. Both inventory control models and just in time
inventory had been applied more extensively by foreign firms than domestic firms.
In the case of financial ratio analysis, foreign firms and domestic firms did not
report any differences. Similar result were also found for management accounting
techniques type HI that there was no difference in the application of management
accounting techniques type EI between foreign firms and domestic firms.
CHAPTER V
EVALUATION OF THE STUDY'S HYPOTHESES
This chapter is concerned with the statistical analysis which is applied to
test the study's hypotheses. Before presenting the findings, a test of the data
collected is given. This test includes test of randomness and internal consistency
(reliability test). Since data collected to test the hypotheses came from
questionnaires sent to the respondents, it is necessary to run test of these data
collected. The first section provides the results of data test and the second section
describes the findings of hypothesis testing.
Test of Randomness
Test of randomness basically to examine whether respondents answered the
questionnaires randomly or not. Test of randomness is carried out by comparing
the observed frequency of response score and the frequency of response score
expected if respondents answered randomly. The chi-square test is suitable for
analysing the test of randomness. Chi-square can be used to test whether a
significant difference exists between an observed number of responses falling in
each category and an expected number based upon the null hypothesis. Thus, the
chi-square test assesses the degree of correspondence between the observed and
expected observation in each category. The null hypothesis is tested by using the
following statistic:
k
X2 = X (Oi - Hi)2
i=1 Ei
Where: Oi = the observed number of cases in the ith category
Ei = the expected number of cases in the ith category when Ho is true
k = the number of categories
If the agreement between the observed and expected frequency is close, the
differences (Oi - Ei) will be small and, consequently, % will be small. However,
if the divergence is large, the value of % also will be large. Roughly speaking,
the larger the value of % , the less likely it is that the observed frequency came
from the population on which the hypotheses Ho and the expected frequencies are
based (Siegel, 1988). In this case, if the difference is significant then it means that
respondents did not answer the questionnaire randomly. In this study , the
questionnaire is divided into three types of management accounting techniques,
therefore the test of randomness is conducted for each type of management
accounting technique.
Table 14 shows the result of test randomness for each of the management
accounting techniques data with a significance level 0.05. The results indicate that
the observed % for management accounting techniques type I is 526.54. This
figure is higher than the value of chi-square according to table with degree of
freedom 7 which shows 14.07. It can be concluded that the frequency of response
score from the respondents is significantly different from the frequency of
125
response score expected. Hence, respondents did not answer the questionnaire
randomly.
T A B L E 14 S U M M A R Y OF TEST OF R A N D O M N E S S
Type of Data % Observed % Critical df Explanation Accounting Technique Type I 526.54 14.07 7 No random
responses Accounting Techniques Type II 157.71 14.07 7 No random
responses Accounting Techniques Type III 101.87 15.51 8 No random
responses a = 0.05 df = k -1
Similar results for data of management accounting techniques type II also
shows that the observed chi-square is 157.71 which is higher than its critical value
with level of significance 0.05 and degree of freedom 7 that is 14.07. It means that
the frequency of score responses for management accounting techniques type II is
significantly different from the frequency of score responses expected, or it can be
said that the respondents did not answer the question of application of management
accounting techniques type II randomly (see appendix C for the calculation).
In the case of accounting techniques type HI, the observed chi-square of
these techniques is also higher than its critical value with significance level 0.05
and degree of freedom 8. The observed chi-squares is 101.87 and the critical value
is 15.51. Again the results are confirmed that the respondents did not answer
randomly for accounting techniques type HI. From the findings above, it can be
inferred that the respondents did not answer randomly for all the applications of
126
management accounting techniques. Therefore, all data collected can be accepted
and processed further.
Test of Internal Consistency or Reliability Test
Before data can be accepted and processed further, certain condition must
be fulfilled and these are concerned with the usage of three different types of
measuring instruments in this study. The instrument used must give a reliable
measurement which means that the result obtained from the instrument on certain
occasion under certain conditions should be reproducible. The result should be the
same if it remeasures the same trait under identical conditions on another occasion
(Magnusson, 1966). This aspect of the accuracy of measuring instruments is called
reliability.
As discussed in previous chapter, the extent use of management accounting
techniques is classified into three different techniques. Those are techniques type
I, techniques type II and techniques type HI. Each type of technique is measured
by different instruments. Each instrument was tested for reliability. There are four
basic methods to estimate reliability: retest, alternative forms, split -halves, and
internal consistency (Carmine and Zeller, 1979). All four methods attempt to
determine the proportion of variance in a measurement scale that is systematic.
Basically, these methods correlate scores obtained from a scale with scores from
some form of replication of the scale. If the correlation is high, most of the
variance is of the systematic type, and with some degree of consistency, the
measures can be depended upon to yield the same result (Peter, 1979).
The basic difference among the four methods is in what the scale is to be
correlated with to compute the reliability coefficient. In test-retest, the identical set
of measures is applied to the same subjects at two different times. The two sets of
obtained scores are then correlated. In alternative forms, two similar sets of items
are applied to the same subjects at two different times. Scale items on one form
are designed to be similar to scale items on the other form. The resulting scores
from the two administrations of the alternative forms are then correlated. The
basic form of internal consistency reliability is split-halves in which item scores
obtained from the administration of a scale are split in half and the resulting half
scores are correlated. The scale is usually split in terms of odd and even numbered
items or on random basis.
The test-retest method involved at least three basic problems. First,
different results may be obtained depending on the length of time between
measurement and remeasurement. Second, if a change in the phenomena occurs
between the first and second administration, there is no way to distinguish between
the change and unreliability. Third, the retest correlation is only partly dependent
on the correlation between different items in the scale, because a portion of the
correlation of sums includes the correlation of each item with itself (Peter, 1979).
Similar problem are also found for the split-halves methods. Different results may
be obtained depending on how the items are split in half. One approach to
overcome this problem is to determine the mean reliability coefficient for all
possible ways of splitting a set of items in half. A formula which accomplishes this
step is Cronbach's coefficient alpha (1951).
128
Cronbach's alpha was used to test the reliability of data in this study. The
advantage of using Cronbach's alpha is that it requires only one administration of
the test. Cronbach's alpha was calculated for each type of management accounting
technique by using statistical package program SPSS. Table 15 shows the result
of reliability test for each management accounting techniques.
TABLE 15 TEST O F D A T A RELIABILITY
Type of Data Cronbach's Alpha Management Accounting Techniques Type I 0.7027 Management Accounting Techniques Type II 0.7927 Management Accounting Techniques Type ITI 0.5463
The result indicate that Cronbach's alpha for management accounting techniques
type I and n reached 0.7027 and 0.7927 respectively. Meanwhile, Cronbach's
alpha for management accounting techniques type III only reached 0.5463.
Reviewing the results of reliability coefficients reported in table 15 raises
the question of whether this result demonstrated satisfactory levels of reliability.
Though no hard and fast rules have been offered for evaluating the magnitude of
reliability coefficient, Nunnally (1967, p 226) suggests the following guide. In
early stage of research, modest reliability in the range of 0.50 to 0.60 will suffice.
For basic research, it is argued that increasing reliability beyond 0.80 is
unnecessary because at that level correlation are attenuated very little by
measurement error. In applied settings, in contrast to basic research, a reliability
of 0.90 is the minimum that should be tolerated and a reliability of 0.95 should be
considered the desirable standard. Since the present study is still in the early stage
129
of research, these guidelines suggests that the result of test of reliability
demonstrated at least satisfactory level.
Hypotheses Testing
Before presenting the results of hypothesis testing, a brief review is given
of the research methodology employed and the key variables involved. As
discussed in chapter 3, the extent to which advanced management accounting
techniques were applied by respondents was determined by investigating twenty-
five specific techniques. These techniques were classified into three types of
techniques, namely management accounting techniques type I, type II and type IE.
These classification were based on the frequency of its application by sample
firms. Type I techniques are those that are used at intervals that are not regular.
Type II techniques are those that are used at regular intervals such as monthly or
annually and type EI techniques are either used or not used. A Likert scaling
system is employed for each type of technique.
An overall score was computed for each type of technique which gave an
indication of the extent of use of management accounting techniques by
respondents . In the case of management accounting techniques type I, respondents
were asked to rate the extent use of techniques in the following five points scale:
0 if the management accounting techniques is never used at all.
1 if the management accounting techniques is seldom used.
2 if the management accounting techniques is sometimes used.
3 if the management accounting techniques is usually used.
130
4 if the management accounting techniques is always used.
A five points scale also applied for management accounting techniques type II. A
score of 0 is given if respondents have not used the accounting techniques, a score
of 4 is given if respondents applied the accounting techniques at least monthly, a
score of 3 is given for applying the accounting techniques quarterly, a score of 2 if
the accounting techniques applied semi-annually, and a score of 1 is given if
respondents applied the accounting techniques annually. Accounting techniques
type HI are either used or not used. A score of 1 is given if it used and a score of
0 if it is not used.
The independent variables are contextual firm characteristics. The
ownership, leverage and capital intensity. The firm characteristics variables are
defined as follow: (1) size is measured by the average operating assets of the
respondents for the six year period, 1987-1992. The larger the absolute dollar
amount of the average assets, the greater a firm's size. (2) age or years in business
operation is measured from the year it is incorporated. The longer respondents in
business operation, the older is the respondents. (3) type of industry is classified
into manufacturing firms and non-manufacturing firms. (4) capital intensity is
measured by the yearly depreciation expenses divided by the yearly operating
assets for each of the six years in the period, 1987-1992. The larger this ratio, the
higher the capital intensity of the firms. (5) risk is measured by the standard
deviation of the firm's adjusted operating rate of return for the six year period,
1987-1992. The larger the standard deviation, the riskier the firm. (6) type of
131
ownership is classified into two categories public listed domestic firm and public
listed foreign firm. (7) leverage is measured by the ratio between total debts and
equities for the six year period, 1987-1992. The larger the ratio, the higher firm's
leverage.
For testing the hypothesis two through eight, these independent variables
are categorised further into: size (large vs small), age (old vs new), capital
intensity (high vs low), risk (high vs low), and leverage (high vs low). The
categorisation of independent variables are based on its median value. Table 16
shows the descriptive statistic of some independent variables. In terms of size
which is measured by the average operating assets, the respondents of this study
on average have operating assets about $ 1,373.654 million.
T A B L E 16 DESCRIPTIVE STATISTICS O F S O M E INDEPENDENT VARIABLES
Variables Mean Median Maximum Minimu Std Dev. m
Size(A$'000) $1,373,654 $108,335 $86,966,450 $6,135 $7,793,750 Age 40 years 28 years 160 years 6 years 37 years Risk 0.076 0.045 0.643 0.007 0.092 Leverage 1.683 0.935 15.907 0.057 2.833 Capital intensity 0.030 0.026 0.238 0 0.029
The minimum operating assets reported by respondents was $ 6.135 million and
the maximum operating assets reported by respondents was $ 86,966.450 million.
Due to the wide range between minimum and maximum value of respondents'
operating assets, size is classified into large and small firms is based on its median
132
value instead of its mean. Therefore, firm who has an operating assets above its
median value is grouped as large firms and firm who has an operating assets
below its median is grouped as small firms.
On average the respondents of this study have been in business for 40
years. The shortest period in business reported by respondents was 6 years and the
longest period in business was 160 years with standard deviation 37 years. In term
of age, the respondents also classified as old and new firms based on median
value. Hence, respondents who have been in business more than the median value
28 years are classified as old firms, and those who have been is business less than
28 years are classified as new firms. The highest leverage reported by respondents
was 15.907 which means that every $ 15.907 debt is only backed up by $ 1.00
equity and the lowest leverage reported was 0.057 which means every $0,057 debt
is backed up by $1.00 which is very liquid. On average the respondents have
leverage about 1.683. Due to the wide range between its maximum value and its
minimum value of risk, leverage and capital intensity, these three variables were
grouped into high and low risk, leverage and capital intensity based on the median
value. If the respondents have risk, leverage and capital intensity value above the
median, they are classified as high and vice versa.
To test the study's hypotheses two through eight, the technique of
nonparametric statistical analysis, as discussed in chapter 3, is adopted, namely the
Mann-Whitney U-test (M-W U test). M-W U test is basically used to test whether
two independent groups have the same distribution. Suppose two groups of firms,
X and Y have the same distribution with regard to some operationally defined
characteristics, say the extent use of management accounting techniques. The null
hypothesis, H0, is that X and Y have the same distribution in the extent use of
management accounting techniques. The alternative hypothesis, Hl5 may be that
group X score is higher than group Y. The alternative hypothesis may be accepted
if the probability that a score from group X is larger than the score from group Y
is greater than one-half. That is, if x is one observation (score) from group X, and
y is one observation (score) from Y, then the alternative hypothesis, Hl5 is that
p(x>y)> 1/2. If the evidence support H1? this implies that the extent use of
management accounting techniques of group X is higher than the group Y (Siegel
and Castellan, 1988, p 129). In this study, M-W U test is calculated by using
statistical package SPSS.
Hypothesis 2
The hypothesis to be tested concerns size and the extent application of
management accounting techniques. The null hypothesis (H02) was tested against
the alternative hypothesis HI2, that advanced management accounting techniques
are applied more extensively in large companies than in other companies. Table 17
show the result of hypothesis testing. As shown in table 17, there were statistical
difference (at 0.05 significant level) in the application of advanced management
accounting techniques type I and type HI. The observed probability was 0.0024 for
accounting technique type I and 0.0279 for accounting techniques type HI. These
observed probability were less than 0.05 which means the null hypothesis was
rejected and the alternative hypothesis was accepted that advanced management
134
TABLE 17 MANN-WHITNEY U TEST COMPARISON OF MANAGEMENT
ACCOUNTING TECHNIQUES BY COMPANY SIZE (OPERATING ASSETS)
Techniques Used
Techniques Type I: Decision tree analysis Relevant cost analysis Capital budgeting Linear programming Net-work analysis/PERT Inventory control models Just in time inventory Sensitivity analysis
Techniques Type H : Variance analysis Break-even analysis Contribution reporting Inventory turnover analysis Account receivable turnover Aging account receivable Gross profit analysis Other financial ratio
Techniques Type IH : Responsibility accounting Transfer pricing Standard costing Activity based costing Operating budget Flexible budget Appropriation budget Performance budget Fixed budget
Mean Rank Score Other Firms 54.85 57.60 61.70 54.15 56.05 61.87 61.59 64.36 52.34
* Significant at 5 % level ** Significant at 1 0 % level
accounting techniques type I and III were applied more extensively in large
companies than in other (small and medium) companies. There was also statistical
difference at less than 0.10 significant level in the application of advanced
management accounting techniques type II. Therefore, advanced management
accounting techniques type n are also applied more extensively in large companies
than in small and medium companies with the observed probability 0.0927.
In the case of management accounting techniques type I, four out of eight
techniques were statistically significant at less than 0.05. Those techniques were
decision tree analysis, capital budgeting, linear programming and sensitivity
analysis which were applied more extensively by large firms than small and
medium firms. For accounting techniques type III the result shows that five out of
nine techniques were significant. Responsibility accounting, flexible budget and
performance budget were significant at less than 0.05. While transfer pricing and
appropriation budget were significant at less than 0.10. This result indicates that
responsibility accounting, transfer pricing, flexible budget, appropriation budget
and performance budget were applied more extensively in large firms than in small
and medium firms. Only three out of eight techniques were significant at less than
0.05 for management accounting techniques type H. These techniques were
contribution reporting, gross profit analysis and other financial ratio. There were
no significant differences in the other five techniques.
This result should not be surprising, since size can be considered as a
measure of the complexity of business operations. As firms grow, more data are
required for rationalising and coordinating their activities. The required data is
136
supplied by the firm's accounting system. It is therefore quite normal to expect
that the extent of use of management accounting techniques will be greater in the
larger firms than in the small and medium firms. Previous studies also have tested
the relationship between the extent of use of accounting techniques and firm's size.
More and Reichert (1983) analysed the association between twenty-three financial
management techniques and the size of firm which is measured by their total
assets. The result indicates that out of twenty-three techniques, eleven techniques
appear to be directly related to firm size. Kwandwalla (1977) also observed the
relationship between organisation size and the sophistication of control and
information system (CIS). A significant relationship between organisation size and
the sophistication of CIS was found. H e asserted that as large firms tend towards
higher differentiation and involvement in a variety of markets and activities, more
sophisticated control and information systems are needed. Moores and Stuart
(1985) and Lai (1991) adopted the same variables of CIS used by Kwandwalla and
examined the relationship between size and CIS. Both studies support the evidence
provided by Kwandwalla (1977) w h o found a positive relationship between firm
size and CIS.
Hypothesis 3
The null hypothesis was tested against the alternative hypothesis HI3 that
advanced management accounting techniques are applied more extensively in old
companies than in new companies. The results appear in table 18, and they
indicate that there were statistical differences (at less than 0.05 significant level)
137
in the application of advanced management accounting techniques type I, type E
and type IE. The observed probability for accounting techniques type I, n and HI
TABLE 18 MANN-WHITNEY U TEST COMPARISON OF M A N A G E M E N T
ACCOUNTING TECHNIQUES BY C O M P A N Y A G E
Techniques Used Techniques Type I: Decision tree analysis Relevant cost analysis Capital budgeting Linear programming Net-work analysis/PERT Inventory control models Just in time inventory Sensitivity analysis
Techniques Type H : Variance analysis Break-even analysis Contribution reporting Inventory turnover analysis Account receivable turnover Aging account receivable Gross profit analysis Other financial ratio
Techniques Type EI: Responsibility accounting Transfer pricing Standard costing Activity based costing Operating budget Flexible budget Appropriation budget Performance budget Fixed budget
* Significant at 5% level ** Significant at 10% level
was 0.0138, 0.0007 and 0.0041 respectively. Since the observed probability is less
than 0.05, the null hypothesis was rejected. It can be concluded that advanced
management accounting techniques type I, E and IE are applied more extensively
in old companies than in new companies.
Exainining table 18 in detail reveals that out of eight accounting techniques
type I, four techniques were significantly different at less than 0.05 confidence
level. This finding shows that decision tree analysis, capital budgeting, inventory
control models and just in time inventory were applied more extensively in old
firms than in new firms. In the case of management accounting techniques type E,
six out of eight techniques were found to be significantly different at less than 0.05
level with the exception of one technique significant at less than 0.10 level. Those
techniques were break-even analysis, contribution reporting, inventory turnover
analysis, account receivable turnover, aging account receivable and gross profit
analysis. All of these techniques were applied more extensively by old firms than
new firms. For management accounting techniques type EI, out of nine
techniques, five techniques were found to be significantly different at less than
0.05 level. These techniques were transfer pricing, standard costing, appropriation
budget, performance budget and fixed budget which were applied more
extensively in old firms than in new firms.
As discussed in chapter 3, even though the association between company
age and the extent use of management accounting techniques has rarely been
addressed in the literature, it is generally held that the extent of use of
management accounting techniques is positively related to the age of firms. This
study has found at the empirical level that advanced management accounting
techniques were applied more extensively in old firms than in new firms. The
explanation is that old firms are more likely to be better established, to have more
experience and to recognise more varieties of management accounting techniques
than newer firms. From this result it appears that as firms mature and extend, the
control network necessary for management becomes more pervasive. This may be
due to either a growing span of control, or to the development of control systems
requiring time to come to fruition.
Hypothesis 4
The null hypothesis was tested against the alternative hypothesis HI4 that
advanced management accounting techniques are applied more extensively in
manufacturing companies than in non-manufacturing companies. Table 19 displays
the results of hypothesis testing.
As shown in table 19, there were statistical differences at less than 0.05
significance level for all three types of management accounting techniques. The
observed probability were 0.0002, 0.0001 and 0.0002 for accounting types I, E
and EI respectively. These figures were less than 0.05 significance level, which
means that the null hypothesis was rejected. Therefore, the advanced management
accounting techniques were applied more extensively in manufacturing firms than
in non-manufacturing firms.
The significant result for management accounting techniques type I was
represented by five out of eight techniques. Those techniques are relevant cost
analysis, capital budgeting, net-work analysis/PERT, inventory control models and
just in time inventory which were significantly different at less than 0.05
TABLE 19 M A N N - W H I T N E Y U TEST COMPARISON OF M A N A G E M E N T
ACCOUNTING TECHNIQUES B Y TYPE OF INDUSTRY
Mean Rank Score Techniques Used Non-manufacture Manufacture Z One-tailed P
Techniques Type I : Decision tree analysis Relevant cost analysis Capital budgeting Linear programming Net-work analysis/PERT Inventory control models Just in time inventory Sensitivity analysis
Techniques Type E : Variance analysis Break-even analysis Contribution reporting Inventory turnover analysis Account receivable turnover Aging account receivable Gross profit analysis Other financial ratio
Techniques Type EI: Responsibility accounting Transfer pricing Standard costing Activity based costing Operating budget Flexible budget Appropriation budget Performance budget Fixed budget * Significant at 5 % level ** Significant at 10% level
account receivable turnover, aging account receivable which were significant atless
than 0.05 confidence level. Gross profit analysis was significant at less than 0.10
instead of 0.05 significant level. Out of nine management accounting techniques
type EI, five techniques were found to be significantly different. Responsibility
accounting, transfer pricing, standard costing and appropriation budget were
significant at less than 0.05, while operating budget was significant at less than
0.10.
The research findings were not surprising. In the case of management
accounting technique type I, those five techniques which were significantly
different are typical accounting techniques mostly found in manufacturing firms.
Similar results were also found for management accounting techniques type EI.
Techniques such as responsibility accounting, transfer pricing, standard costing
and operating budget were primarily developed for the manufacturing sector.
Therefore, it is quite reasonable to expect that management accounting techniques
were applied more extensively in manufacturing firms than in non-manufacturing
firms. It should be remembered that management accounting techniques were
earliest developed in the manufacturing sector, and hence the industry wide
acceptance alone could prompt manufacturing firms to apply management
accounting techniques without giving formal thought as to their usefulness.
Hypothesis 5
The null hypothesis was tested against the alternative HI5 that advanced
management accounting techniques are applied more extensively in companies that
have high capital intensity than companies that have low capital intensity. The
results appear in table 20. Table 20 shows that there were significant differences at
less than 0.05 for all type of management accounting techniques. The observed
probability for accounting type I, II and EI was 0.0016, 0.0297 and 0.0186
respectively. These observed probabilities were less than the significant level of
0.05. Therefore, the null hypothesis was rejected and alternative hypothesis was
accepted that advanced management accounting techniques are applied more
extensively in companiesthat have high capital intensity than companies that have
low capital intensity.
Looking at individual accounting techniques, the result shows that almost
all type I techniques were statistically significant at less than 0.05, except for net
work analysis/PERT where no difference was indicated. This results suggest that
decision tree analysis, relevant cost analysis, capital budgeting, linear
programming, inventory control models, just in time inventory, and sensitivity
analysis were applied more extensively by high capital intensity firms than low
capital intensity firms. In the case of management accounting techniques type E,
four out of eight techniques were found to be significantly different. Break-even
143
TABLE 20 MANN-WHITNEY U TEST COMPARISON OF MANAGEMENT
ACCOUNTING TECHNIQUES BY COMPANY CAPITAL INTENSITY
Techniques Used Techniques Type I : Decision tree analysis Relevant cost analysis Capital budgeting Linear programming Net-work analysis/PERT Inventory control models Just in time inventory Sensitivity analysis
Techniques Type E : Variance analysis Break-even analysis Contribution reporting Inventory turnover analysis Account receivable turnover Aging account receivable Gross profit analysis Other financial ratio
Techniques Type EI : Responsibility accounting Transfer pricing Standard costing Activity based costing Operating budget Flexible budget Appropriation budget Performance budget Fixed budget
Mean Rank Score Low CI 54.45 59.38 56.00 57.12 59.09 61.60 57.95 58.02 57.62
* Significant at 5 % level ** Significant at 1 0 % level
analysis was significantly different at less than 0.05 and the other three, that are
contribution reporting, account receivable turnover and aging account receivable
were significant at less than 0.10. These findings indicate that break-even analysis,
contribution reporting, account receivable turnover and aging account receivable
were applied more extensively in high capital intensity firms than in low capital
intensity firms. Three out of nine techniques of management accounting techniques
type EI were statistically significantly different at less than 0.05. Those are
operating budget, appropriation budget and fixed budget. One technique, activity
based costing, was significant at less than 0.10. It means that operating budget,
appropriation budget, fixed budget, and activity based costing were applied more
extensively in high capital intensity firms than in low capital intensity firms.
Capital intensity can be interpreted as equivalent to what contingency
theory refers to as technology. A highly mechanised technology means greater
fixed investment in capital. Previous studies also found that capital intensity may
influence a firm's choice of management accounting techniques. In their study of
capital budgeting practice, Kim and Farragher (1981) found that larger capital
intensive firms are more likely to employ sophisticated budgeting techniques than
smaller low capital intensity firms. In the area of operations research techniques,
Neal's study (1970) and Petry's study (1975) also found similar results to the
Farragher's study. Radnor and Neal (1970) detected that capital intensive
industries tended to utilise operations research techniques to a greater extent than
labour intensive industries. Perry (1975) surveyed the use of multiple measures of
project worth. He found that capital intensive industries typically used several
alternative methods to measure project worth.
Hypothesis 6
The null hypothesis was tested against the alternative hypothesis Hl6 that
advanced management accounting techniques are applied more extensively in high
risk companies than in low risk companies. The test results appear in table 21, and
they indicate that there was no significant difference between extent use of
management accounting techniques type I and the risk of firms. The observed
probability was 0.1060 which is above its significant level of 0.10, therefore the
null hypothesis can not be rejected. In contrast, management accounting
techniques type E with observed probability of 0.0709 was statistically different at
less than 0.10 significance level. Management accounting techniques type EI were
also statistically significant at less than 0.05 level with observed probability
0.0279. The result suggests that the null hypothesis was rejected and alternative
hypothesis accepted that advanced management accounting techniques type E and
EI are applied more extensively in high risk companies than in low risk
companies.
Evaluating table 21 in detail reveals that out of eight techniques type I,
only two techniques were significantly different at less than 0.05. Those are
capital budgeting and linear programming with the observed probability 0.0313
and 0.0323 respectively. Regarding accounting technique type E, two techniques
were significantly different at less than 0.10 , namely break-even analysis and
aging accounts receivable and one technique was significantly different at less than
0.05, that is inventory turnover analysis. For management accounting techniques
146
type IE, two techniques were significantly different. Flexible budget was
significantly different at less than 0.05 with observed probability 0.0037 and
TABLE 21 MANN-WHITNEY U TEST COMPARISON OF MANAGEMENT
ACCOUNTING TECHNIQUES BY COMPANY RISK
Mean Rank Score
Techniques Used Techniques Type I : Decision tree analysis Relevant cost analysis Capital budgeting Linear prograrnming Net-work analysis/PERT Inventory control models Just in time inventory Sensitivity analysis
Techniques Type E : Variance analysis Break-even analysis Contribution reporting Inventory turnover analysis Account receivable turnover Aging account receivable Gross profit analysis Other financial ratio
Techniques Type E I : Responsibility accounting Transfer pricing Standard costing Activity based costing Operating budget Flexible budget Appropriation budget Performance budget Fixed budget * Significant at 5 % level
L o w Risk 68.04 63.59 67.22 69.39 69.02 66.50 67.74 64.83 65.71
performance budget was significantly different at less than 0.10 with observed
probability 0.0667.
The present study results confirmed previous study by Kim and Farragher
(1981). In their study of capital budgeting practice, Kim and Farragher use
coefficient of variation of the rate of return on assets as a measure of the firm's
risk. Their study failed to show a clear-cut relationship between risk and capital
budgeting techniques. In the area of management science techniques which include
decision theory, PERT,
and goal programming, they found that lower risk companies used management
science techniques more than higher risk companies. It can be speculated that
management science or operations research techniques may be helpful in reducing
the overall riskiness of the company.
Hypothesis 7
The null hypothesis was tested against alternative hypothesis HI7 that
advanced management accounting techniques are applied more extensively in
public listed foreign companies than in public listed domestic companies. Table 22
displays the results of hypothesis testing.
As shown in table 22, the results fail to reject the null hypothesis for
management accounting techniques type II and EI. The observed probability of
accounting techniques type E and IE were 0.1339 and 0.1667 respectively. These
figures were above its significant level at 0.10, therefore null hypothesis was not
rejected that there is no significant difference in the application of advanced
TABLE 22 MANN-WHITNEY U TEST COMPARISON OF MANAGEMENT
ACCOUNTING TECHNIQUES BY TYPE OF OWNERSHIP
Techniques Used Techniques Type I: Decision tree analysis Relevant cost analysis Capital budgeting Linear prograrnming Net-work analysis/PERT Inventory control models Just in time inventory Sensitivity analysis
Techniques Type E : Variance analysis Break-even analysis Contribution reporting Inventory turnover analysis Account receivable turnover Aging account receivable Gross profit analysis Other financial ratio
Techniques Type EI : Responsibility accounting Transfer pricing Standard costing Activity based costing Operating budget Flexible budget Appropriation budget Performance budget Fixed budget
* Significant at 5 % level ** Significant at 1 0 % level
management accounting techniques type n and EI between public listed domestic
companies and public listed foreign companies. However, there was significant
difference for management accounting techniques type I. The observed probability
was 0.0115 which was below 0.05 significant level. This suggests that alternative
hypothesis was accepted that management accounting techniques type I are applied
more extensively in public listed foreign firms than in public listed domestic firms.
Out of eight techniques of type I, four techniques were significantly
different at less than 0.05 significance level. These techniques include decision
tree analysis, linear programming, inventory control models and just in time
inventory. Meanwhile, only two techniques of type E were significantly different.
Inventory control models was significant at less than 0.05 significant level and
gross profit analysis was significant at less than 0.10. In the case of inventory
turnover analysis, the result is consistent with inventory control models included
in management accounting technique type I. For management accounting
techniques type EI, all techniques were insignificant which suggest that there is no
difference in the application of management accounting techniques type IE
between domestic firms and foreign firms.
At the theoretical level, there is no reason to expect that type of ownership
to influence the extent of application of management accounting techniques. Since
both types of firm are public listed companies, they are indeed surrounded by
uncertainties, and to cope with these uncertainties more and better data are needed
which is supplied by the management accounting system. In terms of management
accounting techniques type II and EI the results show that there is no difference
between domestic and foreign firms in applying the management accounting
techniques. However, the present study also shows that the management
150
accounting techniques type I are applied more extensively in foreign firms than in
domestic firms.
Hypothesis 8
The null hypothesis was tested against the alternative hypothesis HI8 that
advanced management accounting techniques are applied more extensively in high
leverage companies than in low leverage companies. The test results appear in
table 23, and indicate there was no significant difference between the extent use of
management accounting techniques type I and the firm leverage. The observed
probability was 0.1452 which is above the significance level of 0.10. Hence, the
null hypothesis can not be rejected. In contrast, management accounting
techniques type E and EI were significantly different. The observed probability for
accounting techniques type E was 0.0266 which was significant at less than 0.05
and the observed probability for technique type EI was 0.0830 which was
significant at less than 0.10. These results suggest that management accounting
techniques type E and EI were applied more extensively in high leverage firms
than in low leverage firms.
All accounting techniques type I were not significantly different and this
test fails to reject null hypothesis. Out of eight type E techniques, four techniques
were found to have a significant difference. Contribution reporting and accounts
receivable turnover were significant at less than 0.05 with the observed probability
0.0158 and 0.0174 respectively. Break-even analysis and aging account receivable
were significant at less than 0.10 level with observed probability 0.0584 and
151
TABLE 23 MANN-WHITNEY U TEST COMPARISON OF MANAGEMENT
ACCOUNTING TECHNIQUES BY COMPANY LEVERAGE
Techniques Used
Techniques Type I: Decision tree analysis Relevant cost analysis Capital budgeting Linear programming Net-work analysis/PERT Inventory control models Just in time inventory Sensitivity analysis
Techniques Type E : Variance analysis Break-even analysis Contribution reporting Inventory turnover analysis Account receivable turnover Aging account receivable Gross profit analysis Other financial ratio
Techniques Type EI: Responsibility accounting Transfer pricing Standard costing Activity based costing Operating budget Flexible budget Appropriation budget Performance budget Fixed budget
To measure the firm's intensity in applying management accounting
techniques, indices of Likert scale was employed. Variables of firm contextual
characteristics consists of organisation size, age, type of industry, capital intensity,
risk, type of ownership, and firm's leverage. Firm performance was measured
using an adjusted operating rate of return. The primary sources of data collection
was a mail questionnaire. Other sources of information came from library research
and firm's annual reports. The population of interest in this study was large public
listed firms in Australia. The sampling frame of the population tested was the Top
169
500 Australian companies listed in the Australian Financial Review Listed
Handbook. The intended recipient of the questionnaire was the firm chief-
accountant officer. An initial pilot study of 100 questionnaires were sent to
determine feasibility of the questionnaire and interest in the study objectives.
To accomplish the study objectives, eight hypotheses were proposed and
tested. The first hypothesis tested the existence of a relationship between the
application of advanced management accounting techniques and firm performance.
Hypotheses two through eight tested the effect of firm contextual characteristics on
the application of advanced management accounting techniques. Two types of
statistical analyses were adopted to test the hypotheses. Hypothesis one is tested by
using multiple logistic regression model. Hypotheses two through eight are tested
by nonparametric statistical test namely, Mann-Whitney U Test.
Chapter TV presents the result of the mailing questionnaires. A pilot study
of 100 questionnaires were sent to the respondents which were randomly drawn
from the Top 500 Australian companies listed in the Australian Financial Review
Listed Company Handbook. A response rate of 28 percent indicated an existing
interest in the research. After evaluating the results of the pilot study, a revised
questionnaire was mailed to all Top 500 Australian listed companies on September
15, 1993. Out of 500 questionnaires sent, 101 usable responses were received
from the first mailing, or 20.20 percent response rate. Another 26 usable
responses were received after the follow up letter. Total usable responses were
127 which is accounted for 25 percent response rate.
Test for nonresponse bias was conducted to test whether 127 usable
responses were representative of the population. The test was conducted by
comparing early respondents with the late respondents in terms of their answers to
the questionnaire as suggested by Oppenheim (1973). This test is accomplished by
comparing mean response scores of each type of management accounting
techniques applied for the first 101 early returned questionnaires with the last 26
late return questionnaires. The result shows that for each type of management
accounting techniques there was no significant difference between means response
scores of early responses and late responses. It indicates a lack of a material
nonresponse bias.
Profile of The Respondents
The main activity sector of respondents were manufacturing, mining , and
finance companies. About 90 percent of respondents were controlled by domestic
firms and the remaining were controlled by foreign firms. When respondents were
classified by years in business operation, nearly one-half of the respondents have
been in business for more than 30 years. About one-third have been business for
less than 10 years and about one-fifth have been in business between 10 to 30
years. The respondents of domestic firms was dominated by mining and
manufacturing firms, while respondents of foreign firms was dominated by
manufacturing firms. Nearly one-half of responding domestic firms have been in
business operation for more than 30 years. This figure is even higher for the
responding foreign firms which is accounted of two-third of firms. The
171
respondents w h o have in business for more than 30 years mainly came from
manufacturing and mining sector.
Conclusions
Management Accounting Practice
An examination of the utilisation rate of type I management accounting
techniques showed that capital budgeting, sensitivity analysis, and relevant cost
analysis were the most frequently used techniques. Operations research techniques
seemed less popular for the respondents. More than 60 percent of respondents
claimed never used decision tree analysis, linear programming, and net-work
analysis/PERT. Inventory control models has been used by more than one-half of
the respondents. It is surprising to note that new management accounting
techniques such as just in time inventory had gained popularity. Nearly one-half of
respondents had used this technique. The result of the extent usage of operations
research techniques in this study is consistent with the findings of previous studies
conducted by Lonnstedt (1973), Gaither (1975), Green et al., (1977), and Kwong
(1986). These researchers also found low usage of operations research techniques.
In the case of management accounting techniques type II, it is noted that
four techniques have been widely used in practice by the respondents. Those
techniques are variance analysis, contribution reporting, gross profit analysis, and
other financial ratio analysis which were used by more than three-quarters of the
respondents. Other techniques such as break-even analysis, inventory turnover
analysis, account receivable turnover analysis, and aging of account receivable
172
also widely accepted in practice, and were used by more than one-half of
respondents. These type II management accounting techniques were mainly
applied by respondents at least monthly.
In terms of management control techniques which is mainly management
accounting techniques type III, operating budget was the most widely used
technique. This techniques was being adopted by 96.06 percent of the respondents.
This was followed by responsibility accounting, fixed budget, and performance
budget. In contrast, appropriation budget was a less popular technique, used by
one-fifth of the respondents and followed by activity based costing, flexible budget
and transfer pricing. A new technique such as activity based costing shows
growing acceptance in Australia. This technique is now being adopted by more
than 33.07 percent of the respondents.
In the area of budgets, the findings of this study confirmed previous studies
conducted by Imhoff (1978) and Ntow (1991). Imhoff found that 81 percent of
firms which used budget as a performance measure did use flexible budget. Our
findings show that flexible budget has been used by 37.01 percent of the
respondents. In comparing budgetary control systems between American and
Japanese manufacturing firms, Ntow (1991) found that most of the firms used
types of budgets such as static budget, flexible budget, standard budget,
contingency budget, and simulated budget.
Management Accounting Practice and Activity Sector
When respondents are classified into manufacturing and non-manufacturing
firms the results show that capital budgeting and sensitivity analysis were widely
accepted in practice by both manufacturing and non-manufacturing firms.
Operations research techniques were not widely accepted in practice by either
sector. Inventory control models had been applied by more than one-half of each
sector. Just in time inventory had been more adopted in practice by manufacturing
firms than non- manufacturing firms. This result is not so surprising since just in
time inventory is basically used for production processes.
In the case of management accounting techniques type n, there is no
difference between manufacturing and non-manufacturing firms. The most widely
accepted techniques by both sector were other financial ratio analysis, followed by
variance analysis, gross profit analysis, and contribution reporting. For
management accounting techniques type III, both activity sectors reported that the
most widely accepted technique was operating budget which had been applied by
more than 95 percent of both sectors. Responsibility accounting also gained wide
acceptance by both sectors. It is being used by more than 72 percent of
manufacturing as well as non-manufacturing firms. In the case of flexible budget,
it is surprising that this technique received less acceptance in manufacturing
sector.
When respondents were categorised into domestic firms and foreign firms,
the results show that capital budgeting and sensitivity analysis were most widely
adopted in practice by both types of firms. However, foreign firms tend to apply
174
these techniques more extensively than domestic firms. Operations research
techniques such as decision tree analysis, linear prograrnming and net-work
analysis/PERT were less popular among domestic firms than foreign firms.
Similar findings were made for inventory control models and just in time
inventory. These techniques have been applied more extensively by foreign firms
than domestic firms.
In the case of management accounting techniques type JJ, foreign firms and
domestics firms did not report any differences in applying the techniques. Almost
all techniques had been applied by more than 60 percent of responding foreign and
domestic firms. Similar result were found for the management accounting
techniques type Ul there was no difference between foreign firms and domestic
firms in applying the techniques.
Hypothesis Testing
Hypothesis One Stated:
There is no significant relationship between application of advanced
management accounting techniques and the company's performance. This
hypothesis was tested by building multiple logistic regression models. Four models
of logistic regression were obtained which could explain the relationship between
application of advanced management accounting techniques and the company's
performance. The four models were significant at 0.01 and the likelihood ratio
ranged from 56.569 to 60.796, and the chi-squares ranged from 85.220 to 89.447.
The first three models show that variable extent use of management accounting
175
techniques, size, risk, type of ownership, interaction between size and
management accounting techniques, and interaction between management
accounting techniques and capital intensity were significant at 5% and 10%
significance level. Surprisingly, all three models had negative coefficients of
parameters for management accounting techniques and size which is contrary to
what it was expected.
This result can be interpreted that ceteris parabis, the extent of use of
advanced management accounting techniques significantly reduces the probability
the firm will perform above average performance of the sample firms. Size also
significantly reduces the firms ability to perform above average performance of the
sample firms. Variables risk and type of ownership had positive coefficient
parameters which means that, high risk firms and foreign firms are significantly
more likely to perform above average performance of the sample firms. Variables
of age, type of industry, capital intensity, and firm leverage do not appear to be
important determinants of the firm performance. The interaction variables provide
evidence that any separation of size and capital intensity effect from the extent use
of management accounting techniques is problematic. These interaction variables
could explain the negative effect of size and extent use of management accounting
techniques on firm performance. Therefore, these two variables can not be
interpreted individually. Looking at the interaction variables it can be said that
large firms that applied advanced management accounting techniques extensively
significantly increases the probability the firm will perform above average
performance of the sample firms. It is also true high capital intensive firms that
applied advanced management accounting techniques extensively increased the
probability the firm will perform above average performance of the sample firms.
Based on these three models, the fourth model was run using only those
significant variables. The result is still consistent with the first three models. The
fourth models is considered as the best models to explain the first hypothesis.
Hypothesis two stated:
There is no significant difference in the application of advanced
management accounting techniques between large companies and other
(small/medium) companies. For management accounting techniques type I and III,
the Mann-Whitney U test rejected the null hypothesis at the 5 percent level of
significant. Consequently, the alternative hypothesis was accepted, that is,
management accounting techniques type I and III were applied more extensively in
large companies than in small and medium companies. There was also statistical
difference at less than 0.10 significance level in the application of management
accounting techniques type II. This also suggests that management accounting
techniques type JJ was applied more extensively in large companies than in small
and medium companies.
This findings may, in part, be explained by the fact that organisational size
can be considered as a measure of the complexity of business operations. As firms
grow, more data are required for rationalising and coordinating their activities.
The required data is supplied by the firm's accounting system. Therefore, it is
177
quite normal to expect the extent of use of management accounting techniques to
be greater in larger firms than in small and medium firms.
Hypothesis three stated:
There is no significant difference in the extent of application of advanced
management accounting techniques between old companies and new companies.
The Mann-Whitney U test rejected the null hypothesis at the 5 percent level of
significance for all three types of management accounting techniques. Thus, it can
be said that advanced management accounting techniques type I, II and III are
applied more extensively in old companies than in new companies. This result can
be explained by suggesting that old firms are more likely to be better established,
to have more experienced and to recognise more varieties of management
accounting techniques than newer firms. From this result it also appears that as
firms mature and extend, the control network necessary for management become
more pervasive. This may due to either a growing span of control, or to the
development of control systems requiring time to come to fruition.
Hypothesis four stated:
There is no difference in the application of advanced management
accounting techniques between manufacturing and non-manufacturing companies.
The result shows that there were statistical differences at less than 0.05 significant
level for all three types of management accounting techniques. Therefore, the
advanced management accounting techniques were applied more extensively in
178
manufacturing firms than in non-manufacturing firms. The research findings was
not surprising since management accounting techniques included in this study are
mostly found in the manufacturing sector. Furthermore, it should be remembered
that management accounting techniques were earliest developed in the
manufacturing sector. Therefore, it is reasonable to expect that management
accounting techniques were applied more extensively in manufacturing firms than
in non-manufacturing firms.
Hypothesis five stated:
There is no significant difference in the application of advanced
management accounting techniques between companies that have high capital
intensity and low capital intensity. The result shows that there were significant
differences at less than 0.05 significant level for all type of management
accounting techniques. This means that null hypothesis was rejected and the
alternative hypothesis was accepted that advanced management accounting
techniques are applied more extensively in high capital intensive firms than in low
capital intensive firms.
Capital intensity can be interpreted as equivalent to what contingency
theory refers to as technology. Technology determines how organisations
transform inputs into outputs. A highly mechanised technology means greater
fixed investment in capital. Thus the level of mechanisation also reflects differing
firm capabilities across manufacturing firms. The study finding is consistent with
previous research. Kim and Farragher (1981) reported that studies which have
179
considered the capital intensity of the firm are more likely to employ sophisticated
accounting techniques. Hagerman and Zmijewski (1979) also observed that the
degree of capital intensity affects the choice of accounting methods.
Hypothesis six stated:
There is no significant difference in the application of advanced
management accounting techniques between high risk companies and low risk
companies. The Mann-Whitney U test rejected the null hypothesis for management
accounting techniques type JJ and Ul at the 0.05 and 0.10 level of significance
respectively. This result suggests that advanced management accounting
techniques type U and HI are applied more extensively in high risk companies than
in low risk companies. For management accounting technique type I, there was no
difference in the application of these techniques between high risk companies and
low risk companies.
Hypothesis seven stated:
There is no significant difference in the application of advanced
management accounting techniques between public listed domestic companies and
public listed foreign companies. The result fail to reject the null hypothesis for
management accounting techniques type U and HJ. However, there was significant
difference for management accounting techniques type I. This means that the
alternative hypothesis was accepted that management accounting techniques type I
was applied more extensively in foreign companies than in domestic companies.
180
At a theoretical level, there is no reason to expect type of ownership to
influence the extent use of management accounting techniques. Both types of firms
are public listed companies and they are indeed surrounded by uncertainties. To
cope with these uncertainties more and better data are needed which is supplied by
the management accounting system.
Hypothesis eight stated:
There is no significant difference in the application of advanced
management accounting techniques between high leverage companies and low
leverage companies. The test result shows there was no significant difference
between the extent use of management accounting techniques type I and firm
leverage. In the case of management accounting techniques type JJ and JJJ, the null
hypothesis is rejected and alternative hypothesis is accepted that advanced
management accounting techniques type II and IJJ were applied more extensively
in high leverage companies than in low leverage companies.
The probable explanation of this finding is that as firms incur increased
levels of debt, a twofold effect may occur. First additional borrowing may
command a higher interest rate. Second, greater income is needed to offset interest
cost. Therefore, it can be argued that as a firm increases debt, it may attempt to
reduce the effects on the debt/equity ratio by choosing certain accounting
techniques which will increase its income. Accounting techniques included in the
management accounting techniques type II and III have direct effect on generating
income for the firms.
181
Limitations of the Study
The use of questionnaires to gather data in this study carries certain
inherent limitations. Since the response rate only reached 25%, the question arises
as to whether the responses obtained are representative of the population. An
attempt was made in the study to address the effect of this limitation by testing of
nonresponse bias and none was detected.
The use of a questionnaire also introduces the possibility that the
respondents may place a different interpretation on the questions than did the
researchers. Efforts were made to overcome this limitation by including the
definition for each of the management accounting techniques in the questionnaire.
In addition, a pilot study was conducted to test the questionnaire.
There are some advanced management accounting techniques which are not
included in this study and the frequency of application of advanced management
accounting techniques may actually be influenced by variables other than those
considered in this study. Therefore, conclusions can be made only with respect to
the management accounting techniques and other variables included in the study.
Suggestion for Further Research
This study was broad in scope and exploratory in nature. As such, it
touched on many aspects of management accounting techniques, but did not
provide an in depth analysis of any aspect. In this study, the extent of use of
management accounting techniques is measured by the frequency of the techniques
applied within one year, there is no attempt to measure the quality of its
182
application. Thus, one possible research study is to conduct similar study that
focuses on the quality of application of management accounting techniques.
From the results of study, it appears that there was an observed increase in
the use of some techniques as companies mature. It may be useful to speculate on
whether the increase is the result of maturity, or whether it is related to the timing
of the introduction of technology to support these techniques. It is suggested for
further research to use a longitudinal study matching age and the introduction of
the techniques with the early availability of common technology to support the
techniques.
From the results of the logistic regression model, only three variables and
two interaction variables show significant differences. Furthermore, the relative
performance of the firms in this study is measured by comparing the individual
firm performance with the average performance of the sample firms. It is
suggested for further research to include more variables other than used in this
study. Since the respondents came from many different sectors, it is suggested to
use standard industry performance instead of using average performance of the
sample firms.
BIBLIOGRAPHY
Amigoni, F. 1978. Planning Management Control Systems. Journal of Business Finance and Accounting, 5 (Autumn) : 279-291.
Ansari, S.L. 1977. An Integrated Approach to Control Systems Design. Accounting, Organisations and Society : 101-112.
Ansoff, H. I. et al., 1970. Does Planning Pay? The Effect of Planning on Success of Acquisitions in American Firms. Long Range Planning, 3:2-7.
Anthony, R. N. 1965. Planning and Control Systems: A Framework for Analysis. Graduate School of Business Administration, Harvard University (Boston).
Asalani, Kiani R. 1977. Do Corporate Controllers Use Quantitative Tools Currently Taught in Managerial Accounting? The Accounting Journal, (Winter): 278-294.
Armour, H.O. and Teece, D.J. 1978. Organisational Structure and Economic Performance: A Test of Multidivisional Hypothesis. Bell Journal of Economic, 9,1: 106-121.
Belkaoui, A. and Pavlik, E. 1992. The Effects of Ownership Structure and Diversification Strategy on Performance. Managerial and Decision Economics, Vol 13: 343-352.
Blau, P.M. and Schoenherr, R.A. 1971. The Structure of Organisations. New York: Basic Books.
Bowman, E.H. 1980. A Risk/Return Paradox for Strategic Management. Sloan Management Review, 21, 3: 17-31.
Bruns, W. J. and Waterhouse, J. H. 1975. Budgetary Control and Organisation Structure. Journal of Accounting Research, 13: 177-203.
Bryman, A. and Cramer, D. 1992. Quantitative Data Analysis for Social Scientists. London: Routledge.
Burke, E.J. 1971. A Survey of Capital Budgeting Practices By Australian Companies 1970-1971. The University of Newcastle. Faculty of Economics and Commerce Research Monograph.
Burrell,G. and Morgan G. 1979. Sociological Paradigms and Organisational Analysis. London: Heinemann
Burns, T. and Stalker, G. 1961. The Management of Innovation. London: Tavistock.
184
Carmines, E. G. and Zeller, R. A. 1979. Reliability and Validity Assessment. London : Sage Publication.
Chenhall, R. H. and Morris, D. 1986. The Impact of Structure, Environment, and Interdependence on the Perceived Usefulness of Management Accounting Systems. The Accounting Review, 61: 16-35.
Chiu, James S. 1973. An Empirical Investigation of Management Accounting Techniques in The Manufacturing Companies of Taiwan. Un-published PhD Dissertation. University of Missouri.
Child, John. 1974. Managerial and Organisational Factors Associated with Company Performance. The Journal of Management Studies, (May): 173-189.
Christy, G.A. 1966. Capital Budgeting Current Practices and Their Efficiency. Bureau of Business and Economic Research. University of Oregon.
Cohen, Jeffrey R. and Paquette, Laurence. 1991. Management Accounting Practices: Perceptions of Controllers. Journal of Cost Management, (Fall): 73-83.
Covin, J.G., Prescot, J.E. and Slevin, D.P. 1990. The Effects of Technological Sophistication on Strategic Profiles, Structure and Firm Performance. Journal of Management Studies, (September): 485-510.
Cronbach, L. J. 1951. Coefficient Alpha and The Internal Structure Tests. Psychometrika, 16 (September) : 297-334.
Daft, R.L. and Macintosh, N.B. 1978. A New Approach To Design and Use of Management information. California Management Review, (Fall): 82-92.
Datta, D.K., Rajagopalan, N. and Rasheed, A.M.A. 1991.Diversification and Performance: Critical Review and Future Directions. Journal of Management Studies, (September): 529-558.
Dhaliwal, D. S. 1980. The Effect of The Firm's Capital Structure on The Choice of Accounting Methods. The Accounting Review, (June) : 78-84.
Dillman, D. A. 1978. Mail and Telephone Surveys - The Total Design Method.
N e w York: John Wiley and Sons.
Duncan, R.B. 1972. Characteristics of Organisational Environments and Perceived Environmental Uncertainty. Administrative Science Quaterly, Vol. 17 No.
3: 313- 327.
185
Evans, J. H., Lewis, B. L. and Patton, J. M. 1986. A n Economic Approach to Contingency Theory and Management Control. Accounting, Organisations, and Society : 483-498.
Fiegenbaum, A. and Thomas, H. 1986. Dynamic and Risk Measurement Perspectives on Bowman's Risk-Return Paradox for Strategic Management: An Empirical Study. Strategic Management Journal, 7: 395-408.
.1988. Attitudes Towards Risk and The Risk-Return Paradox: Prospect Theory Explanations. Academy of Management Journal, 31: 85-106.
Freeman, M. and Hobbes, G. 1991. Costly Information Informed Investors and The Use of Sophisticated Capital Budgeting Techniques. A A A N Z Conference paper (July): 68-74.
Fulmer, R.M. and Rue, L.W. 1974. The Practice and Profitability of Long Range Planning. Managerial Planning, 3: 2-7.
Gaither, Norman. 1975. The Adoption of Operations Research Techniques By Manufacturing Organisation. Decision Sciences, Vol. 6: 797-813.
Gilbert, N. 1993. Analysing Tabular Data: Loglinear and Logistics Models for Social Researchers. London: U C L Press Limited.
Green, Thad B., Newsom, Walter B. and Jones, S. Roland. 1977. A Survey of The Application of Quantitative Techniques To Production/Operations Management in Large Corporations. Academy of Management Journal, Vol. 20: 669-676.
Green, Forrest B. and Amenkheinan, Felix. 1992. Accounting Innovations: A Cross-Sectional Survey of Manufacturing Firms. Journal of Cost Management, (Spring): 58-64.
Gordon, L.A. and Miller, D. 1976. A Contingency Framework for The Design of Accounting Information Systems. Accounting, Organisation and Society,
Vol.1 No. 1: 59-69.
and Narayanan, V. K. 1984. Management Accounting Systems, Perceived Environment Uncertainty and Organisation Structure: A n Empirical Investigation. Accounting, Organisations and Society, Vol 9 N o
1: 33-47 .
Govindarajan, V. 1984. Appropriatness of Accounting Data in Performance Evaluation: An Empirical Examination of Environmetal Uncertainty as A n
186
Intervening Variable. Accounting, Organisations and Society, Vol 9 No 2-125-135.
Grant, R.M. and Jammine, A.P. 1988. Performance Differences Between The Wrigley/Rumelt Strategic Categories. Strategic Management Journal, 9-333-346.
Hagerman, R. L. and Zmijewski, M. E. 1979. Some Economic Determinants of Accounting Policy Choice. Journal of Accounting and Economics, (August): 141-162.
.1981. An Income Strategy Approach to The Positive of Accounting Standard Setting/Choice. Journal of Accounting and Economics, (August): 129-150.
Haka, S.F., Gordon, L.A. and Pinches, G.E. 1985. Sophisticated Capital Budgeting Selection Techniques and Firm Performance. The Accounting Review, (October): 651-669.
.1987. Capital Budgeting Techniques and Firm Specific Contingencies: A Correlational Analysis. Accounting, Organisations and Society, 12 No 1: 31-48.
Hall, M. and Weiss, L. 1967. Firm Size and Profitability. Review of Economics and Statistics, 49, 3: 319-331.
Hamilton, R.T. and Shergill, G.S. 1989. Organisational Structure and Company Performance: Some N e w Zealand Evidence. Pacific Accounting Review, (December):88-99.
.1992. The Relationship Between Strategy-Structure Fit and Financial Performance in N e w Zealand: Evidence of Generality and Validity with Enhanced Controls. Journal of Management Studies, (January): 95-113.
Hayes, D.C. 1977. The Contingency Theory of Managerial Accounting. The Accounting Review, Vol. 52 No. 1:22-39.
Herold, D. M. 1972. Long Range Planning and Organisational Performance - A Cross Valuation Study. Academy of Management Journal, 15: 91-102.
Hill, Charles W.L. 1988. Corporate Control Type, Strategy,Size and Financial Performance. Journal of Management Studies, (September): 403-417.
Ho, Simon S.M. 1992. The Impact of Using Risk Analysis in Capital Budgeting on Earning Performance: The U K Experience. The International Journal of Accounting, 27: 1-14.
187
Holzmann, O.J., Copeland, R.M. and Hayya, J. 1975. Income Measures of Conglomerate Performance. Quaterly Review of Economics and Business, 15(3): 67-78.
Hopwood, A.G. 1972. An Empirical Study of The Role of Accounting Data in Performance Evaluation. Empirical Research in Accounting. Supplement to Journal of Accounting Research: 156-182.
Imhoff, A. 1978. Management Accounting Techniques: A Survey. Management Accounting, (November): 41-45.
Jegers, M. 1991. Prospect Theory and Risk-Return Relation Some Belgian Evidence. Academy of Management Journal, 34.
Johnson, H.T. and Kaplan, R.S. 1987. Relevance Lost The Rise and Fall of Management Accounting. Boston: Harvard Business School Press.
Kenis, I. 1979. Effects of Budgetary Goal Characteristics on Managerial Attitudes and Performance. The Accounting Review, Vol 54, N o 4: 707-721.
Khandwalla, P.N. 1972. The Effect of Different Types of Competition on The Use of Management Controls. Journal of Accounting Research, (Autumn): 275-285.
. 1977. The Design of Organisations. New York: Harcourt Brace Jovanovich.
Kim, S.H. 1975. Capital Budgeting by The Machinery Industry and Its Impact on Overall Profitability. Un- published Dissertation. St Louis University.
and Farragher, Edward J. 1981. Current Capital Budgeting Practices. Management Accounting, (June): 26-30.
. 1982. An Empirical Study on The Relationship Between Capital Budgeting Practices and Earnings Performance. Engineering Economist,
(Spring): 185-196.
Klammer, Thomas. 1973. The Association of Capital Budgeting Techniques with Firm Performance. The Accounting Review, (April): 353-364.
and Walker, Michael C. 1984. The Continuing Increase in The Use of Sophisticated Capital Budgeting Techniques. California Management
Review , (Fall): 137-148.
Kwong, Han Chun. 1986. The Practice of Operations Research in Malaysia and
Singapore. Omega, Vol.14: 333-344.
188
Kudla, R.J. 1980. The Effects of Strategic Planning on Common Stock Returns. Academy of Management Journal, 1: 5-20.
Lai, M. 1991/1992. Organisational Size, Structuring of Activities, and Control Informations System Sophistication Levels: A n Empirical Study. Management International Review, Vol 31: 101-113.
Lawrence, P.R. and Lorsch, J.W. 1967. Organisation and Environment: Managing Differentiation and Integration Harvard University, Boston.
Lieberson, S. and O'Connor, J.F. 1972. Leadership and Organisational Performance: A Study of Large Corporation. American Sociological Review, 37(2): 117-130.
Lilleyman, P.G.1984. Capital Budgeting: Current Practices of Australian Organisation. The Australian Accountant, (March): 130-133.
Lonnstedt, L. 1973. The Use of Operational Research in Twelve Companies Quoted on The Stockhlom Stock Exchange. Operational Research Quaterly, Vol. 24: 535-545.
Lyall, David, Okoh, Kwasi and Puxty, Anthony. 1990. Cost Control Into The 1990s. CIMA Management Accounting, (February): 44-45.
Magnusson, D. 1966. Test Theory. Stockholm: Addison Wesley Publish. Co.
Mak, Y. T. 1989. Contingency Fit, Internal Consistency and Financial Performance. Journal of Business Finance and Accounting, 16 (Spring): 273-300.
Malik, Z. A. and Karger, D. W. 1975. Does Long Range Planning Improve Company Performance? Management Review, 64: 26-31.
Marcus, M. 1969. Profitability and Size of Firm: Some Further Evidence. Review of Economics and Statistics, Vol. 51: 104-107.
McDougall, F.M. and Round, D.K. 1984. A Comparison of Diversifying and Nondiversifying Australian Industrial Firms. Academy of Management Journal, Vol. 27, No. 2: 384-398.
McMahon, Richard G.P. 1981. The Determination and Use of Investment Hurdle Rates in Capital Budgeting: A Survey of Australian Practice. Accounting and Finance: 15-25.
McNally, G.M. 1979. Cost and Management Accounting in Major New Zealand Manufacturing Companies. The Accountant's Journal: 392-397.
189
and Eng, Lee Hock. 1980. Management Accounting Practices and Company Characteristic. Abacus, (December): 142-150.
Melicher, R.W. and Rush, D.F. 1973. The Performance of Conglomerate Firms: Recent Risk and Return Experience Journal of Finance, 28: 381-388.
Merchant, K. A. 1981. The Design of The Corporate Budgeting System: Influences on Managerial Behavior and Performance. The Accounting Review, Vol 56, N o 4: 813-829.
• 1984. Influences on Departmental Budgeting: An Empirical Examination of A Contingency Model. Accounting, Organisations and Society, Vol 9, N o 3/4: 291-307.
Meredith, G.G. 1964. Administrative Control of Capital Expenditure: A Survey of Australian Public Companies. University of Queensland Papers (September): 33-52.
. 1965. Capital Rationing and The Determination of The Firm's Performance Standards for Capital Investment Analysis. University of Queensland Papers (December): 85-114.
Montgomery, C.A. 1982. The Measurement of Firm Diversification: Some New Empirical Evidence? Academy of Management Journal, 25: 299-307.
Moores, K and Smart, G. S. 1985. Management Accounting Control Systems, Preceived Environmental Uncertainty, Structure, Size, and Success: New Zealand Evidence. Proceedings of Accounting Association of Australia and New Zealand Conference (Sydney): 1-24.
and Duncan, K. R. 1989. A Reconciliation of Market Competition, Decentralisation, Size, and Financial Performance Result: A n Extension Testing Moderating Efects. Human Relation: 67-80
Moore, James and Reichert, Alan K. 1983. An Analysis of The Financial Management Techniques Currently Employed By U.S. Corporations. Journal of Business Finance and Accounting, 8,3: 389-419.
. 1989. A Multivariate Study of Firm Performance and The Use of Modern Analytical Tools and Financial Techniques. Interfaces, (May-June): 79-87.
Moser, C. A. and Kalton, G. 1971. Survey Methods in Social Investigation. London: Heinemann Educational Books Unlimited.
190
Murphy, J.C. and Braund, S.L. 1990. Management Accounting and New Manufacturing Technology. Management Accounting, (February): 38-40.
Norusis, M. J. 1991. The SPSS Guide to Data Analysis for SPSS/PC+. SPSS Inc.
Ntow, Kwabena Anyane. 1991. A Comparison of Budgetary Control Systems in American and Japanese Manufacturing Firms. Asia Pasicif Journal of Management, Vol. 8. No. 2: 201-221.
Oppenheim, A. N. 1966. Questionnaire Design and Attitude Measurement. New York: Basic Books Inc.
Otley, D.T. 1978. Budget Use and Managerial Performance. Journal of Accounting Research: 122-149.
Patterson, Cleveland S. 1989. Investment Decision Criteria Used By Listed New Zealand Companies. Accounting and Finance, (November): 73-89.
Perrow, C. 1967. A Framework for The Comparative Analysis of Organisations. American Sociological Review, Vol. 32 No. 2: 194-208.
Peter, J. P. 1979. Reliability: A Review of Psychometric Basic and Recent Marketing Practices. Journal of Marketing Research, Vol XVI (February): 6-17.
Perry, G.H. 1975. Effective Use of Capital Budgeting Tools. Business Horizons, (October): 57-65.
Pike, Richard H. 1984. Sophisticated Capital Budgeting Systems and Their Association with Corporate Performance. Managerial and Decision Economics, Vol. 5: 91- 97.
. 1988. An Empirical Study of The Adoption of Sophisticated Capital Budgeting Practices and Decision-Making Effectiveness.Accounting and Business Research, (Autumn): 341-351.
and Sharp, John. 1989. Trends in The Use of Management Science Techniques in Capital Budgeting. Managerial and Decision Economics,
Vol 10: 135-140.
and Ho, Simon S.M. 1992. Adoption of Probabilistic Risk Analysis in Capital Budgeting and Corporate Investment. Journal of Business Finance
and Accounting, (April): 387-405.
Piper, J. 1978. Determinant of Financial Control Systems for Multiple Retailers -Some Case Study Evidence. University of Loughborough.
191
Pindyck, R. S. and Rubinfeld, D. L. 1988. Econometric Models and Economic Forecasts. Singapore: McGraw-Hill Book Company.
Prosper, P.A. and Smith, J.E. 1971. Conglomerate Mergers and Public Policy. Journal of Economic Issues, 5: 117-120.
Radnor, Michael and Neal, Rodney D. 1973. The Progress of Management Science Activities in Large U S Industrial Corporations. Operations Research, (March-April) 427- 449.
Reid, S.R. 1968. Mergers, Managers and The Economy. New York: McGraw-Hill.
Sapp, R.W. and Seiler, R.E. 1981. The Relationship Between Long-Range Planning and Financial Performance of U.S. Commercial Banks. Managerial Planning, (September/ October): 32-36.
Schall, Lawrence D., Sundem, Gary L. and Geijsbeek, William R.1978. Survey and Analysis of Capital Budgeting Methods. The Journal of Finance (March): 281-287.
Scarbrough, Paul, Nanni, Alfred J. and Sakurai, Michiharu. 1991. Japanese Management Accounting Practices and The Effects of Assembly and Process Automation. Management Accounting Research: 27-46.
Shield, Michael D., Chow, Chee W., Kato, Yutaka and Nakagawa, Yu. 1991. Management Accounting Practices in The U.S. and Japan: Comparative Survey Findings and Research Implications. Journal of International Financial Management and Accounting, 3: 61-77'.
Siegel, S. and Castellan, N. J. 1988. Nonparametric Statistics for The Behavioral Sciences. New York: McGraw Hill Book Company.
Smyth, E.B. and Burke, W. L. 1968. Survey of Financial Organisation and Control in Australian Companies. The University of New South Wales Research Monograph Series No. 1.
Stafford McWilliams. 1992. Listed Company Handbook. The Australian Financial
Review.
Staton, A. G. and Bryan, K. S. 1990. Primer of Applied Regression and Analysis
of Variance. N e w York: MacGrawhill Inc.
Thomas, A.P. 1986. The Contingency Theory of Corporate Reporting: Some Empirical Evidence. Accounting, Organisations and Society, Vol.11 No.3:
253-270.
192
• 1991. Towards A Contingency Theory of Corporate Financial Reporting Systems. Accounting Auditing and Accountability Journal, Vol.4 No.4:40-57.
Thomas, George and DaCosta, Jo-Anne. 1979. A Sample Survey of Corporate Operations Research. Interfaces, (August): 102-111.
Thompson, J.D. 1967. Organisations in Action. New York: McGraw-Hill.
Thune, S. S. and House, R. J. 1970. Where Long Range Planning Pays Off. Business Horizon, 13: 81-87.
Turabian, K. L. 1987. A Manual For Writers of Papers, Theses, and Dissertations. Chicago: The University of Chicago Press.
Vatter, William J. 1967. The Use of Operations Research in American Companies. The Accounting Review, (October): 721-730.
Waterhouse, J.H. and Tiessen, P. 1978. A Contingency Framework for Management Accounting System Research. Accounting, Organisation and Society, Vol. 3 No.l: 65- 76.
Whittington, G. 1971. The Prediction of Profitability. Cambridge: Cambridge University Press.
Wiener, N. and Mahoney, T.A. 1981. A Model of Corporate Performance as A Function of Environmental, Organisational, and Leadership Influences. Academy of Management Journal, Vol. 24 No. 3: 453-470.
Wood, D.R., Jr., and LaForge, J. M. 1979. The Impact of Comprehensive Planning on Financial Performance. Academy of Management Journal, 22(3): 516-526.
Woodward, J. 1965. Industrial Organisation: Theory and Practice. London: Oxford University Press.
Yoshikawa, Takeo, Innes, John and Mitchell, Falconer. 1989. Japanese Management Accounting: A Comparative Survey. Management Accounting, (November): 20-23.
APPENDIX A PILOT STUDY QUESTIONNAIRE
Wollongong, April 15, 1993
The Chief Accounting Officer
Dear Sir/Madam,
I a m working on a doctoral degree in the Department of Accountancy in
the Faculty of Commerce, the University of Wollongong, Australia. M y thesis
topic involves the relationship between application of advanced management
accounting techniques and company performance. In order to gather information
that will provide insight into this relationship, I a m conducting a survey of
advanced management accounting techniques used by Australian public listed
companies. The application of advanced management accounting techniques play a
significant role in allocating the economic resources of the company. Therefore it
is important to determine their impact on the company performance. This survey
also seeks other variables that may influence the company performance.
Your company has been selected as one that can provide useful information
for this study. I would appreciate it if you would complete and return to m e the
enclosed questionnaire. Your cooperation is extremely important and it will be a
real contribution to the success of this study. Your answers to this questionnaire
will be held in strict confidence and will be published in the form of statistical
summaries which will make the identification of any specific company impossible.
I a m including a stamped envelope for your convenience in retarning the
questionnaire and thank you for your help.
Sincerely,
Imam Ghozali
R E S E A R C H Q U E S T I O N N A I R E
This questionnaire contains two series of question. Series A requests
general information of your company. In series B three (3) types of management
accounting techniques are listed. For each type of the techniques , a list of
questions regarding the extent to which your company employed these techniques
is provided.
SERIES A
Instruction: Please check one or fill the appropriate response to the following
questions.
I. G E N E R A L I N F O R M A T I O N
a. Please give the following details of your company
(optional).
Company Name:
Address :
b. Is control of your company:
( ) domestic?
( ) foreign?
c. What year your company commence business?
d. What is the activity sector of your company?
( ) Agriculture, forestry, fishing, hunting
( ) Mining
( ) Manufacturing
( ) Electricity, gas and water
( ) Wholesale and retail trade
( ) Transport, storage and communication
( ) Finance, property and business services
( ) Community services
( ) Recreation, personal and other services
e. Size of your company
Number of employees (1991-1992)
Sales (1991-1992)
Based on the indicators above, how would you
classify the size of your company? (check one)
( ) Medium
( ) Large
SERIES B
n. R E S E A R C H Q U E S T I O N S
The questionnaire in this section seeks to determine the extent to which
your company is using the management accounting techniques listed below and the
year in which those techniques were being adopted for the first time.
a. Management Accounting Techniques: Type T
Instruction: Please check the frequency of any and all of the following
techniques that are used in your company and indicate the year it's adoption for
the first time.
Decision tree analysis
Relevant cost analysis
Capital budgeting
Linear programming
Net-work analysis/PERT
Inventory control models
Just in time inventory
Sensitivity analysis
Never
Used
(
(
(
(
(
(
(
(
Seldom Sometimes Usually Always Year
Used Used Used Used Adopted
b. Management Accounting Techniques: Type II
Instruction: Please indicate the frequency of any and all of the following
techniques that are used in your company by circling the appropriate number on
the scale and also indicate the year of it's adoption.
1 = monthly 2 = 2 months 3 = 3 months
4 = 4 months 5 = 5 months 6 = 6 months
7 = 7 months 9 = 9 months
10 = 10 months
11 = 11 months 12 = 12 months
Variance analysis
Break-even analysis
Contribution reporting
Inventory turnover analysis
Account receivable turnover
Aging of account receivable
Gross profit analysis
Other financial ratio analysis
Monthly Scale Year Adopted
1 2 3 4 5 6 7 8 9 10 11 12
1 2 3 4 5 6 7 8 9 10 11 12
1 2 3 4 5 6 7 8 9 10 11 12
1 2 3 4 5 6 7 8 9 10 11 12
1 2 3 4 5 6 7 8 9 10 11 12
1 2 3 4 5 6 7 8 9 10 11 12
1 2 3 4 5 6 7 8 9 10 11 12
1 2 3 4 5 6 7 8 9 10 11 12
c. Management Accounting Techniques: Type III
Instruction : Please check whether your company uses or does not use any and
all of the following techniques. If yes, indicate the year of it's adoption for the
first time.
No Yes Year Adopted
Responsibility accounting ( ) ( )
Transfer pricing ( ) ( )
Standard Costing ( ) ( )
Activity based costing ( ) ( )
Operating budget ( ) ( )
Flexible budget ( ) ( )
Appropriation budget ( ) ( )
Performance budget ( ) ( )
Fixed budget ( ) ( )
Would you be prepared for further discussion on the subject by telephone or at
your office? Yes () N o ()
If (yes) please indicate office and telephone number for contact.
Would you please comment the clarity of the question?
THANK YOU FOR YOUR HELP
APPENDIX B FULL SCALE STUDY QUESTIONNAIRE
Wollongong, September 15, 1993
The Chief Accounting Officer
Dear Sir/Madam,
I a m working on a doctoral degree in the Department of Accountancy in
the Faculty of Commerce, the University of Wollongong, Australia. M y thesis
topic involves the relationship between application of advanced management
accounting techniques and company performance. In order to gather information
that will provide insight into this relationship, I am conducting a survey of
advanced management accounting techniques used by Australian public listed
companies. The application of advanced management accounting techniques play a
significant role in allocating the economic resources of the company. Therefore it
is important to determine their impact on the company performance. This survey
also seeks other variables that may influence the company performance.
Your company has been selected as one that can provide useful information
for this study. I would appreciate it if you would complete and return to m e the
enclosed questionnaire. Your cooperation is extremely important and it will be a
real contribution to the success of this study. Your answers to this questionnaire
will be held in strict confidence and will be published in the form of statistical
summaries which will make the identification of any specific company impossible.
I a m including an addressed envelope for your convenience in returning
the questionnaire and thank you for your help.
Sincerely,
Imam Ghozali
RESEARCH QUESTIONNAIRE This questionnaire contains two series of question. Series A requests
general information of your company. In series B three (3) types of management
accounting techniques are listed. For each type of the techniques , a list of
questions is asked regarding the extent to which your company employs these
techniques.
SERIES A Instruction: Please check one or fill the appropriate response to the following
questions.
GENERAL INFORMATION a. Please give the following details of your company
(optional).
Company Name:
Address :
b. Is control of your company:
( ) domestic?
( ) foreign?
c. What year did your company commence business? 19
d. What is the activity sector of your company?
( ) Agriculture, forestry, fishing, hunting
( ) Mining
( ) Manufacturing
( ) Electricity, gas and water
( ) Wholesale and retail trade
( ) Transport, storage and communication
( ) Finance, property and business services
( ) Community services
( ) Recreation, personal and other services
e. Size of your company
Number of employees (1991-1992)
Sales (1991-1992) $million
Based on the indicators above, how would you
classify the size of your company? (check one)
( ) Medium
( ) Large
SERIES B RESEARCH QUESTIONS
The questionnaire in this section seeks to determine the extent to which
your company is using the management accounting techniques listed below and the
year in which those techniques were being adopted for the first time.
a. Management Accounting Techniques: Type I
Instruction: Please check the frequency of any and all of the following
techniques that are used in your company and indicate the year it's adoption for
the first time.
Never Seldom Sometimes Usually
Used Used Used Used
Decision tree analysis
Relevant cost analysis
Capital budgeting
Linear programming
Net-work analysis/PERT
Inventory control models
Just in time inventory
Sensitivity analysis
Always
Used
(
Year
Adopted
b. Management Accounting Techniques: Type II
Instruction: Please check the frequency of any and all of the following
techniques that are used in your company and indicate the year of it's adoption for
the first time.
Variance analysis
Break-even analysis
Contribution reporting
Inventory turnover analysis
Account receivable turnover
Aging account receivable
Gross profit analysis
Other financial ratio analysis
Not
Used
Monthly Quarterly Semi Annually Year
annually Adopted
c. Management Accounting Techniques: Type III
Instruction : Please check whether your company uses or does not use any and
all of the following techniques. If yes, indicate the year of it's adoption for the
first time.
No Yes Year Adopted
Responsibility accounting ( ) ( )
Transfer pricing ( ) ( )
Standard Costing ( ) ( )
Activity based costing ( ) ( )
Operating budget ( ) ( )
Flexible budget ( ) ( )
Appropriation budget ( ) ( )
Performance budget ( ) ( )
Fixed budget ( ) ( )
Would you be prepared for further discussion on the subject by telephone or at
your office? Yes () N o ( )
If (yes) please indicate office and telephone number for contact. (0 )
Thank you for your valuable time in completing this questionnaire. Your
information will assist in identifying the type and frequency of use of various
management accounting techniques in Australian companies.
Please return the completed questionnaire in the envelope supplied, to:
Mr. Imam Ghozali
Department of Accountancy
University of Wollongong
Northfields Avenue
Wollongong N S W 2522
201
Definition of Management Accounting Techniques Type I:
Decision tree analysis: involves a schematic analysis of a multiperiod or
sequential decision-making problem under risk.
Relevant cost analysis: an analysis of all cost that will change between the
alternative course of action being considered.
Capital Budgeting: the process of choosing projects by considering the present
value of cashflow and deciding how to raise the fund required by the project.
Linear programming: a mathematical tool for finding profit-maximising ( or cost-
minimising ) combination of products to produce when there are linear constraints
on the resources available.
Net-work analysis/PERT: a system under which an activity such as factory
production is organised and controlled on the basis of the sequenced time periods
required for each operating step.
Inventory control models: the process of planning, monitoring and efficiently
managing inventory by using mathematical models (eg. E O Q , M R P I and M R P
H).
Just in time inventory: system of managing inventory for manufacturing where
each component is purchased or manufactured just before it is used or sold.
Sensitivity analysis: is the study of how the outcome of a decision-making process
changes as one or more of the assumptions change.
Definition of Management Accounting Techniques Type II:
Variance analysis: the investigation of the causes of variances in a standard
costing system.
Break-even analysis: a method to investigate the relationship among cost,
volume, and profit to determine the volume at which w e break-even in an
operation.
Contribution reporting: a method of preparing income statement that separates
variable costs form fixed costs in order to emphasise the importance of cost
behaviour patterns for purpose of planning and control.
Inventory turnover analysis: number of times the average inventory sold per
years.
Account receivable turnover: represents the average length of time that the firm
must wait after making a sale before receiving cash. Also called the average
collection period.
202
Aging of account receivable: an analysis of the elements of individual account
receivable according to the time elapsed after the dates of billing or due dates.
Gross profit analysis: a quantitative expression of proximate causes of change
from one year to another in the elements of the gross profit.
Other financial ratio: other ratio between balance sheet items and financial
statement items.
Definition of Management Accounting Techniques Type III:
Responsibility accounting: an accounting system by considering various units as
separate entities, or profit centres, giving management of each units responsibility
for the units revenues and expenses.
Transfer pricing: the amounts charged by one segment of an organisation for
product or service that it supplies to another segment of the same organisation.
Standard costing: a product costing and cost-control system in which standard
costs of direct material, direct labor, and overhead are applied to work in process.
Activity based costing: a product or service costing method that assigns costs to
the cost objective using a variety of cost drivers usually called activities.
Operating budget: budget of the income statement together with supporting
schedules.
Flexible budget: budget that projects receipt and expenditures as a function of
activity levels.
Appropriation budget: a budget of certain types of expenditures in a business that
are planned and controlled on the basis of define appropriations for specific time
periods.
Performance budget: a budget that shows the difference between actual results
and expected performance planned in a budget.
Fixed budget: a budget that provides for specified amounts of expenditures and
receipts that do not vary with activity levels. Sometimes called a "static budget".
APPENDIX C NONREPONSE BIAS TEST RESULT
SPSS/PC + The Statistical Package for IBM PC 10/3/94
This program is run by Mr. Imam Ghozali
TRANSLATE FROM 'c:\thesis\lotus\ttestxl.wkl* /FIELDNAMES.
Data written to the active file. 5 variables and 127 cases written. 5 of 603 storage units used.
Page 1 SPSS/PC + 10/3/94
This procedure was completed at 20:11:03
Page 2 SPSS/PC + 10/3/94
T-Test /Group Response (0,1) /Variable xl.
Page 3 SPSS/PC + 10/3/94
Independent samples of RESPONSE
Group 1: RESPONSE EQ .0 Group 2: RESPONSE EQ 1.0
t-test for: XI (Accounting Techniques Type I)
Number Standard Standard of Cases Mean Deviation Error
Group 1 101 11.8812 6.055 .603 Group 2 26 13.2308 6.352 1.246
Pooled Variance Estimate Separate Variance Estimate
F 2-Tail t Degrees of 2-Tail t Degrees of 2-Tail Value Prob. Value Freedom Prob. Value Freedom Prob.
1.10 .713 -1.00 125 .318 -.98 37.55 .336
SPSS/PC + The Statistical Package for IBM PC 10/3/94
This program is run by Mr. Imam Ghozali
TRANSLATE FROM 'c:\thesis\lotus\ttestsl.wkl' /FIELDNAMES.
Data written to the active file. 5 variables and 127 cases written. 5 of 603 storage units used.
Page 1 SPSS/PC + 10/3/94
This procedure was completed at 20:42:08 T-Test /Groups Response (0,1) /Variables si.
Page 2 SPSS/PC + 10/3/94
Independent samples of RESPONSE
Group 1: RESPONSE EQ .0 Group 2: RESPONSE EQ 1.0
t-test for: SI (Accounting Techniques Type II)
Number Standard Standard of Cases Mean Deviation Error
Group 1 101 21.1188 8.619 .858 Group 2 26 23.5000 7.328 1.437
Pooled Variance Estimate Separate Variance Estimate
F 2-Tail t Degrees of 2-Tail t Degrees of 2-Tail Value Prob. Value Freedom Prob. Value Freedom Prob.
1.38 .355 -1.29 125 .199 -1.42 44.56 .162
205
Page 1 SPSS/PC + 10/3/94
This program is run by Mr. Imam Ghozali
TRANSLATE FROM 'c:\thesis\lotus\ttestpl.wkl' /FIELDNAMES.
Data written to the active file. 5 variables and 127 cases written. 5 of 603 storage units used.
Page 2 SPSS/PC + 10/3/94
This procedure was completed at 20:44:30 T-Test /Groups Response (0,1) /Variables pi.
Page 3 SPSS/PC + 10/3/94
Independent samples of RESPONSE
Group 1: RESPONSE EQ .0 Group 2: RESPONSE EQ 1.0
t-test for: PI (Accounting Techniques Type HJ)
Number Standard Standard of Cases Mean Deviation Error
Group 1 101 4.4158 1.961 .195 Group 2 26 5.0385 1.587 .311
Pooled Variance Estimate Separate Variance Estimate
F 2-Tail t Degrees of 2-Tail t Degrees of 2-Tail Value Prob. Value Freedom Prob. Value Freedom Prob.
1.53 .226 -1.50 125 .137 -1.69 46.71 .097
APPENDIX D
TEST OF RANDOMNESS
1. Test of randomness for type I management accounting techniques answering
score
a. Hypothesis.
HO : The frequency distribution of type I management accounting
techniques score is fit with its theoritical distribution.
HI : The frequency distribution of type I management accounting
techniques score is not fit with its theoretical distribution.
C N r ^ T f O r f T t - t f O O O c n c N c n o o o O T ^ q T - H O C N T - H r ; ^ W c n ^ i n c n - ^ - c n c N i n c n ' ^ T l - T ^ T t T j - c N C N c n c N i n T j -
T - H T - H T - H O O T - H O O T - H
< - H C N c n - ^ - i n s o r ^ o o o s O T - H
O T - H O O O O O O
c N c n ^ i n s o r ^ o o o s O T ^ c N T - H T - H T - H T — I T — I T - H T — I T - H C N C N C N
CM
o CM
00
X
X
o X
m
X
X
cn
X
Os so cn t"» T-H T-H SO "<* 00 TH cn in CN in os so in TJ-
so CN OO Tt
r ~-socNr^sot^-t^t^ s o s o i n c n c N - ^ - c n t ^
C N C N O O O S C N T t r - 0 0 o o p - e n c n O s s o p ^ O s rOTj-T-HT-HinoseneN o o i n o s o s c n p - T - H r -i n o s i n » n T - H i n c n T - H T-H T-H cn CN
Reliability Test of Management Accounting Techniques Type I
Page 1 SPSS/PC + 10/3/94
RELIABILITY /VARIABLES XI TO X8 /SCALE (MAT1)= XI TO X8 /STATISTICS COVARIANCES CORRELATIONS.
METHOD 2 (COVARIANCE MATRIX) WILL BE USED FOR THIS ANALYSIS
****** 1064 BYTES OF SPACE REQUIRED FOR RELIABILITY ******
Page 2 SPSS/PC + 11/1/93 TEST OF RELIABILITY MANAGEMENT ACCOUNTING TECHNIQUES TYPE I
RUN BY IMAM GHOZALI
RELIABILITY ANALYSIS -SCALE (SCORE MAT 1)
1. 2. 3. 4. 5. 6. 7. 8.
XI X2 X3 X4 X5 X6 X7 X8
DECISION TREE ANALYSIS RELEVANT COST ANALYSIS CAPITAL BUDGETING LINEAR PROGRAMMING NET-WORK ANALYSIS/PERT INVENTORY CONTROL MODELS JUST IN TIME INVENTORY SENSITIVITY ANALYSIS
COVARIANCE MATRIX
XI X2 X3 X4 X5
XI X2 X3 X4 X5
.8516
.2353
.3391
.1764
.0603
2.4422 .6618 .1585 .1990
1.8228 .2575 .1627
.6488
.2157 .9901
Page 3 SPSS/PC + 10/3/94
R E L I A B I L I T Y A N A L Y S I S - S C A L E (SCOREMAT 1)
COVARIANCE MATRIX
XI X2 X3 X4 X5
X6 X7 X8
.2092
.1855
.4626
.6420
.6119
.3399
.7309
.4211
.8674
.3901
.2256
.3001
.4138
.3380
.2058
X6 X7 X8
X6 X7 X8
2.9159 1.3332 .8372
2.3346 .2311 2.0424
228
Page 4 SPSS/PC + 10/3/94
RELIABILITY ANALYSIS -SCALE (SCORE MAT 1)
CORRELATION MATRIX
XI X2 X3 X4 X5
XI X2 X3 X4 X5 X6 X7 X8
1.0000 .1631 .2722 .2372 .0657 .1328 .1316 .3507
1.0000 .3137 .1260 .1280 .2406 .2563 .1522
1.0000 .2368 .1211 .3170 .2041 .4496
1.0000 .2691 .2836 .1833 .2607
1.0000 .2435 .2223 .1448
X6 X7 X8
X6 1.0000 X7 .5110 1.0000
Page 5 SPSS/PC + 10/3/94
RELIABILITY ANALYSIS -SCALE (SCORE MAT 1)
CORRELATION MATRIX
X6 X7 X8
X8 .3431 .1058 1.0000
# OF CASES = 127.0
RELIABILITY COEFFICIENTS 8 ITEMS
ALPHA = .7027 STANDARDIZED ITEM ALPHA = .7061
Reliability Test of Management Accounting Techniques Type II
Page 1 SPSS/PC + 10/3/94 TEST OF RELIABILITY MANAGEMENT ACCOUNTING TECHNIQUES TYPE II RUN BY IMAM GHOZALI
RELIABILITY /VARIABLES SI TO S8 /SCALE (SCOREMAT2)= SI TO S8 /STATISTICS COVARIANCES CORRELATIONS
METHOD 2 (COVARIANCE MATRIX) WILL BE USED FOR THIS ANALYSIS
****** 1064 BYTES OF SPACE REQUIRED FOR RELIABILITY ******
Page 2 SPSS/PC + 10/3/94
RELIABILITY ANALYSIS -SCALE (SCOREMAT)
VARIANCE ANALYSIS BREAK-EVEN ANALYSIS CONTRIBUTION REPORTING INVENTORY TURNOVER ANALYSIS ACCOUNT RECEIVABLE TURN OVER AGING ACCOUNT RECEIVABLE GROSS PROFIT ANALYSIS OTHER FINANCIAL RATIO ANALYSIS
1. 2. 3. 4. 5. 6. 7. 8.
SI S2 S3 S4 S5 S6 S7 S8
COVARIANCE MATRIX
SI S2 S3 S4 S5
SI S2 S3 S4 S5
1.3596 .1430 .4587 .1363 .0949
2.6634 .6613 .9246 1.0399
2.7842 .9568
1.3468
3.5433 2.3195 3.8130
Page 3 SPSS/PC + 10/3/94
R E L I A B I L I T Y A N A L Y S I S - S C A L E (SCORE MAT2)
COVARIANCE MATRIX
SI S2 S3 S4 S5
S6 S7 S8
.1296
.3146
.2042
1.0191 .5589 .4679
1.0935 .9569 .7263
1.8605 .6555 .8378
2.7500 .8608 .9651
S6 S7 S8
S6 S7 S8
3.3606 1.1807 .8030
1.9635 .9993 2.1244
Page 4 SPSS/PC+ 10/3/94
R E L I A B I L I T Y A N A L Y S I S - S C A L E (SCORE MAT2)
CORRELATION MATPJX
SI S2 S3 S4 S5
SI S2 S3 S4 S5 S6 S7 S8
1.0000 .0751 .2358 .0621 .0417 .0606 .1925 .1202
1.0000 .2428 .3010 .3263 .3406 .2444 .1967
1.0000 .3046 .4133 .3575 .4093 .2986
1.0000 .6310 .5391 .2485 .3054
1.0000 .7682 .3146 .3391
S6 S7 S8
S6 S7
1.0000 .4596 1.0000
Page 5 SPSS/PC+
RELIABILITY ANALYSIS
CORRELATION MATRIX
S6 S7 S8
S8 .3005 .4893 1.0000
# OF CASES = 127.0
RELIABILITY COEFFICIENTS 8 ITEMS
ALPHA = .7927 STANDARDIZED ITEM ALPHA = .7806
Reliability Test of Management Accounting Techniques Type in
Page 1 SPSS/PC + 10/3/94
TEST OF RELIABILITY MANAGEMENT ACCOUNTING TECHNIQUES TYPE ffl
RUN BY IMAM GHOZALI
RELIABILITY /VARIABLES PI TO P9 /SCALE (SCOREMAT3)= PI TO P9 /STATISTICS COVARIANCES
CORRELATIONS. METHOD 2 (COVARIANCE MATRIX) WILL BE USED FOR THIS ANALYSIS
****** 13o4 BYTES OF SPACE REQUIRED FOR RELIABILITY ****
10/3/94
SCALE (SCORE MAT2)
232
Page 2 SPSS/PC+ 10/3/94
R E L I A B I L I T Y A N A L Y S I S - S C A L E (SCORE MAT3)
1. 2. 3. 4. 5. 6. 7. 8. 9.
PI P2 P3 P4 P5 P6 P7 P8 P9
Page 3
RESPONSIBILITY ACCOUNTING TRANSFER PRICING STANDARD COSTING ACTIVITY BASED COSTING OPERATING BUDGET FLEXIBLE BUDGET APPROPRIATION BUDGET PERFORMANCE BUDGET FIXED BUDGET
SPSS/PC + 10/3/94
R E L I A B I L I T Y A N A L Y S I S - S C A L E (SCOREMAT3)
COVARIANCE MATRIX
PI P2 P3 P4 P5
PI P2 P3 P4 P5 P6 P7 P8 P9
.2012
.0538
.0157
.0442
.0049
.0234
.0533
.0390
.0089
.2406
.0410
.0275
.0077
.0039
.0236
.0271
.0338
.2501
.0065
.0022 -.0037 .0255 .0025 .0291
.2231
.0131
.0195
.0456
.0754
.0306
.0381 -.0012 .0087 .0124 .0069
Page 4 SPSS/PC+ 10/3/94
R E L I A B I L I T Y A N A L Y S I S - S C A L E (SCORE MAT3)