NAVAL POSTGRADUATE SCHOOL MONTEREY, CALIFORNIA THESIS G ANALYSIS OF F/A-18 ENGINE MAINTENANCE COSTS USING THE BOEING DEPENDABILITY COST MODEL by Thomas A. Meadows December, 1994 Principal Advisor: Shu S. Liao Approved for public release; distribution is unlimited. 19950119 025
Transcript
NAVAL POSTGRADUATE SCHOOLMONTEREY, CALIFORNIA
THESIS G
ANALYSIS OF F/A-18 ENGINEMAINTENANCE COSTS USING THE
BOEING DEPENDABILITYCOST MODEL
by
Thomas A. Meadows
December, 1994
Principal Advisor: Shu S. Liao
Approved for public release; distribution is unlimited.
19950119 025
REPORT DOCUMENTATION PAGE I Form Appoved OMB No. 0704-0188
Public reporting burden for this colection of information is estimated to average 1 hour per response, including the time for reviewing instruction, searchingexisting data sources, gathering and maintaining the data needed, and completing and reviewing the collection of information. Send comments regarding thisburden estimate or any other aspect of this collection of information, including suggestions for reducing this burden, to Washington Headquarters Services,Directorate for Information Operations and Reports, 1215 Jefferson Davis Highway, Suite 1204, Arlington, VA 22202-4302, and to the Office of Managementand Budget, Paperwork Reduction Project (0704-0188) Washington DC 20503.
1. AGENCY USE ONLY (Leave blank) 2. REPORT DATE 3. REPORT TYPE AND DATES COVEREDDecember 1994 Master's Thesis
4. TITLE AND SUBTITLE ANALYSIS OF F/A-18 ENGINE 5. FUNDING NUMBERSMAINTENANCE COSTS USING THE BOEING DEPENDABILITYCOST MODEL
6. AUTHOR(S) Thomas A. Meadows
7. PERFORMING ORGANIZATION NAME(S) AND ADDRESS(ES) 8. PERFORMINGNaval Postgraduate School ORGANIZATIONMonterey CA 93943-5000 REPORT NUMBER
9. SPONSORING/MONITORING AGENCY NAME(S) AND ADDRESS(ES) 10. SPONSORING/MONITORING
AGENCY REPORT NUMBER
11. SUPPLEMENTARY NOTES The views expressed in this thesis are those of the author and do not reflectthe official policy or position of the Department of Defense or the U.S. Government.
12a. DISTRIBUTION/AVAILABILITY STATEMENT 12b. DISTRIBUTION CODEApproved for public release; distribution is unlimited.
13. ABSTRACT (maximum 200 words)This thesis explores the use of a computerized aircraft maintenance system cost model to analyze the F/A-18 engine maintenance system. The Dependability Cost Model is a Paradox Data Base model, developedby the Boeing Corporation, and is currently used in the airline industry to estimate costs associated withmaintaining aircraft or the implementation of service bulletin changes to the aircraft. Research wasconducted to determine the feasibility of adapting this model to the F/A-18 using existing maintenanceinformation systems, and the possibilty of forecasting future funding requirements driven by enginecomponent service life changes.
This research concluded that the Dependability Cost Model is a powerful management tool in theanalysis of aircraft maintenance system costs. However, its use as a budget estimation tool in a rapidlychanging cost environment presented a number of difficulties and yielded marginal results.
17. SECURITY CLASSIFI- 18. SECURITY CLASSIFI- 19. SECURITY CLASSIFI- 20. LIMITATION OFCATION OF REPORT CATION OF THIS PAGE CATION OF ABSTRACT ABSTRACTUnclassified Unclassified Unclassified UL
NSN 7540-01-280-5500 Standard Form 298 (Rev. 2-89)Prescribed by ANSI Std. 239-18 298-102
iiI
Approved for public release; distribution is unlimited.
ANALYSIS OF F/A-18 ENGINE MAINTENANCE COSTS USINGTHE BOEING DEPENDABILITY COST MODEL
by
Thomas A. Meadows
Lieutenant, United States Navy
B.S., United States Naval Academy, 1984
Submitted in partial fulfillmentof the requirements for the degree of
MASTER OF SCIENCE IN MANAGEMENT
from the
NAVAL POSTGRADUATE SCHOOLDecember 1994
Author: L 7 / -/_r
Thomas A. Meadows
Approved by: _____
Shu S. Lio, Principal Advisor
Dan Boger, Asso te Advisor
Department of Systems agement
Ul°°
ABSTRACT
This thesis explores the use of a computerized aircraft maintenance system
cost model to analyze the F/A-18 engine maintenance system. The Dependability
Cost Model is a Paradox Data Base model, developed by the Boeing Corporation,
and is currently used in the airline industry to estimate costs associated with
maintaining aircraft or the implementation of service bulletin changes to the
aircraft. Research was conducted to determine the feasibility of adapting this
model to the F/A-18 using existing maintenance information systems, and the
possibility of forecasting future funding requirements driven by engine component
service life changes.
This research concluded that the Dependability Cost Model is a powerful
management tool in the analysis of aircraft maintenance system costs. However,
its use as a budget estimation tool in a rapidly changing cost environment presented
a number of difficulties and yielded marginal results.
Table 2.1 Ownership Costs Versus Dependability Costs
The company began investigating the possibility of
measuring aircraft performance by more than schedule
reliability, the traditional method, and research led to the
concept of dependability dollars per flight hour. Boeing
developed the Dependability Cost Model (DCM) to calculate and
analyze the costs associated with this concept and through
5
this model created a broader understanding of the complex cost
drivers within their aircraft maintenance systems.
A. INTRODUCTION
The concept of dependability costs for aircraft is an
economic indicator containing all the elements mentioned in
the above definition. Specifically, these elements are line
maintenance, shop maintenance, scheduled maintenance, cost of
holding spare parts and schedule interruptions. These
dependability cost elements are used to determine the cost
drivers within the maintenance system, and the DCM allows the
user to compare various system modifications, highlighting the
high cost areas of an operational or proposed system.
Cost outputs from the DCM are generated from three data
bases, each containing information simulating a portion of the
maintenance system. Flexibility exists within the model to
examine one aircraft, a mixed fleet of aircraft, compare an
existing system with a proposed system, or calculate costs
using as few or as many component inputs as desired. The
outputs can be expressed in annual cost per airplane, annual
cost per component, annual cost per fleet or a present valueof the fleet for a specified number of years. This allows the
user a method of cost analysis which detects areas of high
costs. Through a greater understanding of the associated cost
drivers, the user can exercise options to reduce the overall
cost of operations.
Boeing was able to identify a relatively small number of
components responsible for a high percentage of the overall
costs [Ref. 2]. For example, the exterior lighting
system of the 737 aircraft was found to absorb a much larger
portion of cost than expected. Conventional thinking would
have never suspected the light bulbs of a multi-million dollar
aircraft to contribute a significant amount to the total
operating costs. However, once the high removal rates, labor
6
costs and aircraft downtime associated with the bulb failure
are factored into the overall picture, this system was found
to be quite costly. Through redesign of the exterior lighting
covers for quick access, the labor involved was substantially
reduced, thereby reducing the overall aircraft maintenance
costs. This example illustrates the potential embodied within
the model for analysis of an operating maintenance system.
A key feature of the model allows the user to compare two
systems by assessing the economic impact resulting from a
service bulletin change or other possible maintenance
modifications. This lends itself to use as a cost/benefit
analysis tool for the airlines or for military usage, perhaps
a budgeting tool. If a system change is required, the costs
can be predicted with reasonable accuracy for adjustments in
current funding or for future requirements.
B. COST ELEMENTS
The DCM uses five primary cost elements [Ref. 3].
These are line maintenance costs, shop maintenance costs,
spares costs, scheduled maintenance costs, and schedule
interruption costs. Each of these elements will vary in
relative importance as the component reliability, price and
other factors of the maintenance system interact.
1. Line Maintenance Costs
Line maintenance costs are defined as the costs to
perform unscheduled labor on a component that occurs on the
line. It encompasses the frequency of unscheduled maintenance
actions, time to perform those actions and any other actions
required to restore the aircraft to a flying condition. Total
line maintenance costs are further divided into removal
activities and non-removal activities. Line removal activity
costs are calculated from the product of aircraft flights,
average flight hours, number of aircraft, quantity per
aircraft, labor rates, overhead burden factor and average
7
maintenance hours per each removal. This product is thendivided by the mean time between unscheduled removal, yieldinga cost for line removal activities as shown in Equation (1)
LLABREM = Line labor costs for removal activities;Flts = Flights per year per airplane;NA = Number of airplanes in the fleet;Qty = Component quantity per airplane;Aveflthr = Average flight hours per flight;Mnthrrem = Average maintenance hours per removal;Dirlab = Direct labor hour rate;Bf = Burden factor;
MTBUR = Mean time between unscheduled removal.
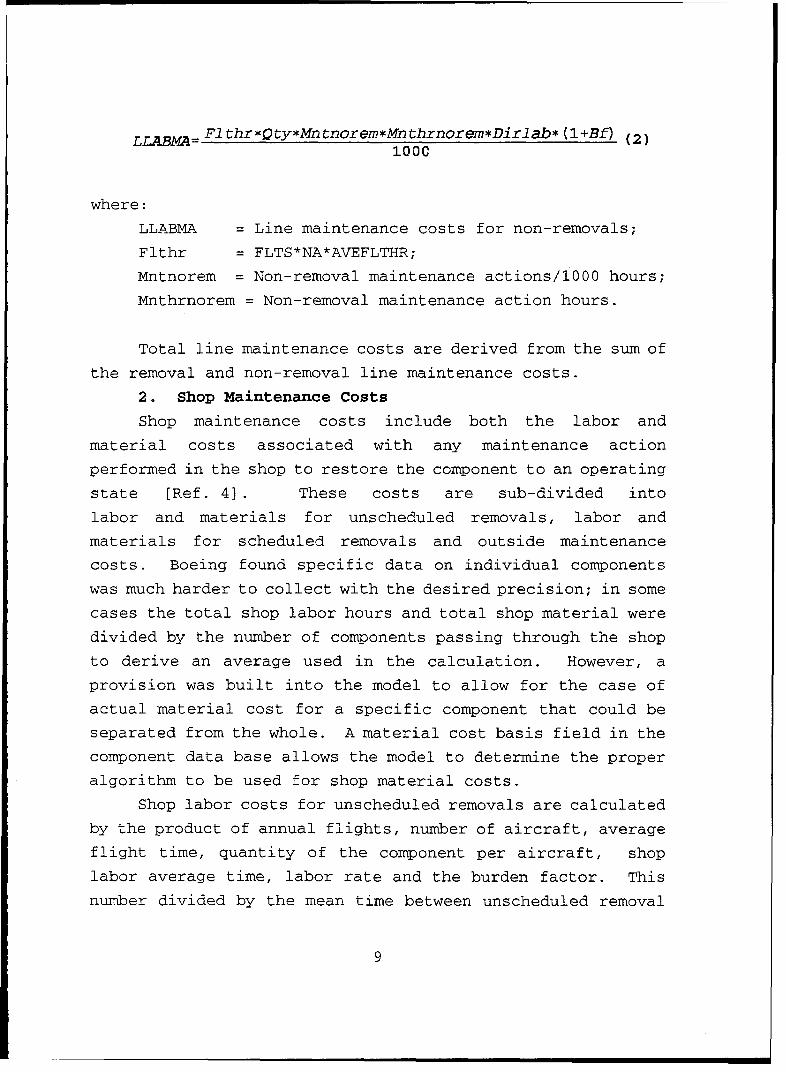
Non-removal activity costs are calculated in a similarfashion with the primary difference being that the number ofmaintenance actions for non-removal per 1000 flight hours isused instead of the average maintenance hours per removal and1000 hours is used in the denominator. The formula shown inEquation (2) represents line labor maintenance costs for non-removal activities.
where:SHOPLAB = Shop labor for unscheduled removals;Slabhr = Shop labor average time to repair.
Shop labor costs for a scheduled removal is a similarcalculation but uses overhaul labor average time instead ofshop labor average time in the numerator and mean time betweenoverhauls as the denominator. This is shown in Equation (4).
OVRLAB = Shop labor for scheduled removals;Ovrlabhr = Overhaul shop labor average time;MTBO = Mean time between overhaul.
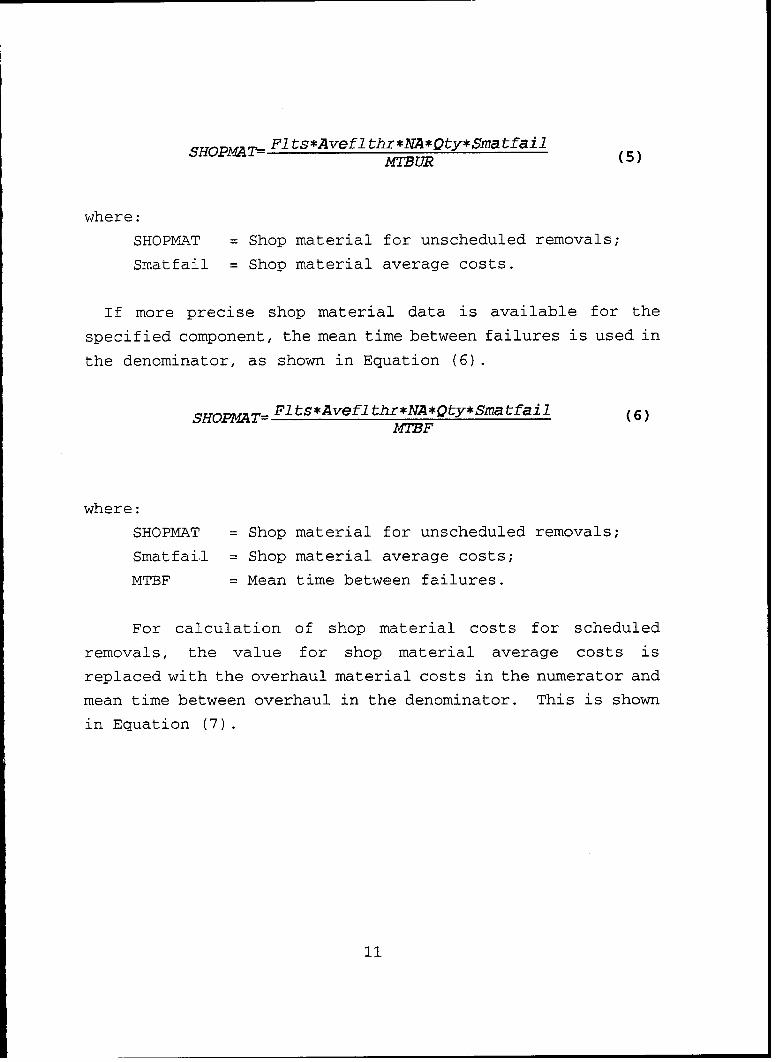
Shop material costs for an unscheduled removal aredetermined by using one of two methods depending on thematerial cost basis field mentioned in the opening paragraphof this section. If it is necessary to use the average data,the denominator of the algorithm is the mean time betweenunscheduled removals as shown in Equation (5).
10
SHOPMAT Fl ts*Avefl thr*NA*Qty*SmatfailJATBUR (5)
where:
SHOPMAT = Shop material for unscheduled removals;
Smatfail = Shop material average costs.
If more precise shop material data is available for the
specified component, the mean time between failures is used in
the denominator, as shown in Equation (6).
SHOPMAT= Flts*Aveflthr*NA*Qty*Smatfail (6)MTBF
where:
SHOPMAT = Shop material for unscheduled removals;
Smatfai-l = Shop material average costs;
MTBF = Mean time between failures.
For calculation of shop material costs for scheduled
removals, the value for shop material average costs is
replaced with the overhaul material costs in the numerator and
mean time between overhaul in the denominator. This is shown
in Equation (7).
11
TOVERAT= Fl ts*Avefl thr*Qty*NA*OvramatMTBO (7)
where:
TOVERMAT = Shop material costs for scheduled removals;
Overmat = Overhaul shop material average per removal.
The remaining portion of the total shop cost is the
outside maintenance costs. This captures the miscellaneous
costs such as shipping and any maintenance performed by an
outside source and is calculated via Equation (8).
Numcancels = Number of cancellations per 100 departures;
Cancelcost = Costs incurred from a cancelled event.
Air-turnback is a schedule interruption resulting from an
aircraft aborting a mission after departure and returning to
the point of origin for repair. The rate of occurrence per
100 departures is taken from historical data and used in a
manner similar to cancellations. Equation (17) provides the
definition.
ATBCOST= Flts*NA*Qty*Numatbks*Airtbkcost
100 (17)
where:
ATBCOST = Total costs of air-turnbacks;
Numatbks = Air-turnbacks per 100 departures;
Airtbkcost = Costs of each air-turnback;
The final interruption category is aircraft diversion.
This is defined as an in-flight abort resulting in the
aircraft landing at a field other than the point of origin or
the intended destination. It also is taken from historical
data and used in Equation (18) as a rate of occurrence per 100
departures.
17
DIVCOST= Flts*NA*Qty*Numdivs*Divercost100 (18)
where:
DIVCOST = Total diversion costs;
Numdivs = Number of diversions per 100 departures;
Divercost = Costs of a single diverted aircraft.
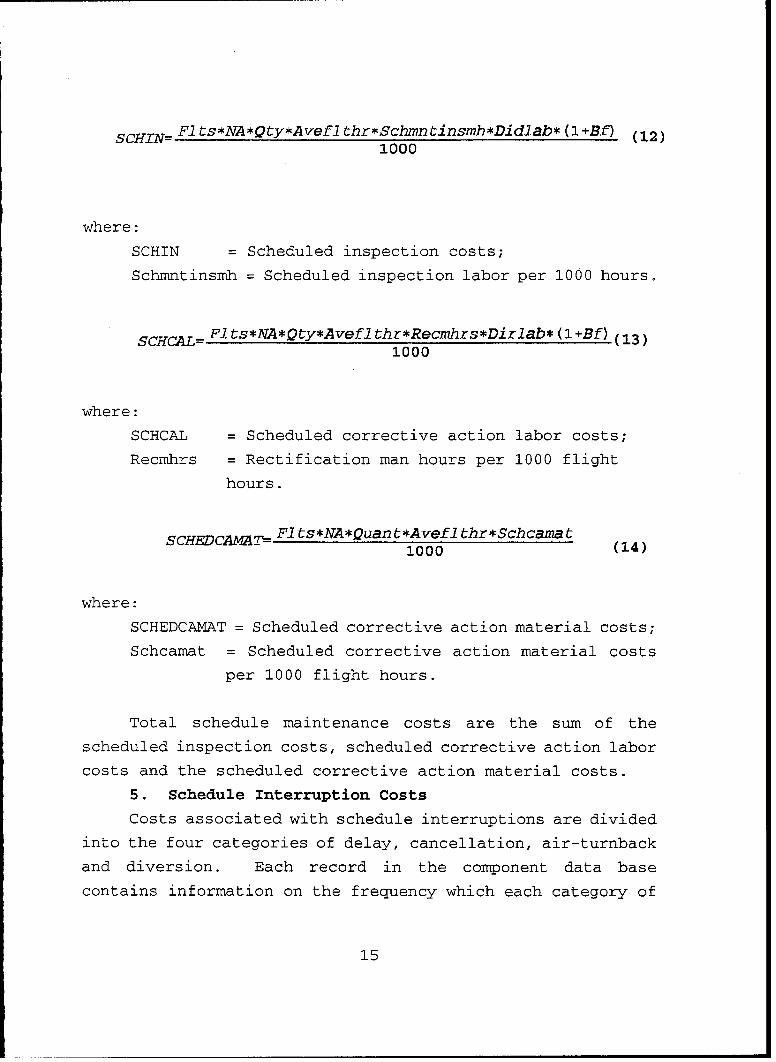
Total schedule interruption costs are determined through
the sum of the four interruption cost categories discussed
above.
C. COST DRIVERS
Two primary cost drivers account for the majority of
dependability costs within a typical airline maintenance
system. These are the removal rate of the component and the
schedule interruption rate caused by the component
[Ref. 6]. Numerous secondary cost drivers are present
such as labor rate, overhead rate, and maintenance action rate
to name a few, but the two primary cost drivers normally
account for the majority of dependability costs.
Removal rate affects three of the five cost elements
found within the model, giving this driver a greater potentialimpact on total operating costs. Most of the secondary cost
drivers affect the cost elements through routine maintenance
checks, without the component being removed, but removal of
the component normally incurs a larger percentage of the
maintenance and material costs.
Schedule interruption rate is a major concern within the
airline industry due to excessive tangible costs involved.However, the intangible costs resulting from an impact on the
airlines' customers make this an extremely difficult cost to
quantify. Boeing recommends airline companies collect cost
18
data for these interruptions through their marketing research
facilities. This cost driver affects only one of the five
cost elements, but the high cost of one interruption has
placed this cost driver very high on the airline industry's
priority list. In contrast, military tactical aviation does
not incur such tangible costs as a result of an interrupted
schedule nor is customer good will a major concern. There is
concern with lost training opportunities or mission sorties,
but seldom, if ever, are these losses expressed as a monetary
value. This cost driver, and the entire cost element, may
decrease substantially in relative importance for military
aviation.
1. Removal Rate
Simply put, the removal rate is how often the part must
be removed from the aircraft. However, the tremendous number
of factors involved in this rate make it very complex. A
component will not contribute significant costs other than
acquisition, installation and scheduled maintenance if it
performs flawlessly for an indefinite period. The rate at
which the component is removed and/or replaced drives the
associated labor and material costs.
Many components have a designated service life and are
removed at the end of that life to be overhauled. This aspect
of the removal rate within the DCM is captured by the mean
time between overhaul. Another aspect of this value includes
unscheduled removals in which the part has failed and the
failure results in the premature overhaul of the component.
Shop maintenance costs are heavily dependent on this value for
both the labor and material costs incurred during overhaul.
Another important element of the removal rate is the mean
time between unscheduled removals. This number, expressed in
flight hours, represents the actual removal rate of the
component. It can capture all the unscheduled removals of a
component or only the remainder of unscheduled removals not
19
already captured by the mean time between overhaul.
Overlapping definitions of these two could result in the
double counting of unscheduled removals resulting in a
component overhaul. Care must be taken to consistently apply
those removals resulting in overhaul to the desired value.
Both of the above values contribute to the removal rate
of the component, and their relative importance is dependent
on the individual component characteristics. Only one or the
other is typically used for a specific calculation of line,
shop or unscheduled maintenance costs. During the calculation
of spares required the model combines the two factors and uses
the overall removal rate as an input for the Poisson
distribution.
2. Schedule Interruption Rate
This rate has four inputs to determine the overall
interruption rate caused by the component. These inputs are
delays, cancellations, air-turnbacks and diverts. Each of
these interruption events are measured in occurrences per 100
flights caused by a specific component. An overall
interruption rate is never calculated by the model. Instead,
the costs incurred from each event are derived and the four
cost values are summed to arrive at the total interruption
costs. The high cost per occurrence involved with the airline
industry is the primary reason interruption rate is so
significant.
3. Secondary Cost Drivers
There are many secondary cost drivers within the model
that have an indirect effect on the total operating costs.
These have little effect when acting alone, but acting through
the removal rate, can result in a significant contribution to
the overall costs.
Most significant of these secondary cost drivers is the
labor rate. This value represents the average hourly wage
rate paid to maintenance personnel but does not include fringe
20
benefits. It acts through the removal rate in all three of
the five cost elements dependent on removals, but has an
additional impact through a fourth element. This fourth
element is the scheduled maintenance cost element, which is
heavily influenced by the maintenance action rate, but may be
overshadowed as the primary driver. These scheduled
maintenance costs are determined from the maintenance actions
per 1000 flight hours and the average time required to perform
routine checks as discussed earlier.
Burden factor is similar to the labor rate in its effect
on the cost elements but its relative impact on the cost
elements is much less. Expressed as a percentage of direct
labor hourly wage rate, it compensates for the fringe benefits
received by maintenance personnel.
Component price can have a substantial impact on the
operating cost, especially with a high quantity per aircraft.
However, price has only an indirect effect on the cost
elements. Removal rate influences the relationship of
component price to operating costs through the spares required
and whether the component is expendable or repairable. A high
priced component with exceptional reliability will have little
or no impact on operating costs.
D. MODEL STRUCTURE
The basic structure of the model incorporates three data
bases used for inputs and, through the manipulation of this
data, generates the cost information simulating the operation
of an aircraft maintenance system. Information contained in
the first data base represents the economic factors of the
specific aircraft and the economy in general. The second
contains information dealing with the aircraft components or
line replaceable units (LRUs). Route information is compiled
in the third data base helping to simulate operating
conditions more precisely.
21
From the initial input data the model calculates
dependability costs and uses this information to compare any
changes due to system modifications made by the user. Output
data is presented in three columns showing the baseline data,
the data calculated from any modifications and a final column
highlighting the differences between the original system and
the modified system. Also, a wide range of cost information
broken down by specific component or different aspects of the
aircraft maintenance system is available.1. Aircraft and Economic Inputs
All variables concerning the aircraft fleet and economic
conditions are contained in this data base. Table 2.2 shows
these inputs and their respective definitions. Variables
designated to reflect operational activity include the fleet
size, number of flights per year and the average time for each
flight. Fleet size consists of the current number of aircraft
existing in the fleet, but proposed additions can be included.
Also, a data field is present to drive the model into the use
of a particular route structure, if desired. This route
structure will be discussed later in the section dealing with
the route structure data base.
The economic factors input through this data base areused to calculate annual dependability costs or the
computations can be presented for any number of years entered
into the study length field. If the present value analysis is
chosen, the model uses the minimum attractive rate of return
and the general rate of inflation to determine the economic
benefit derived from a proposed change.
A spares factor is included in this data baserepresenting inventory costs expressed as a percentage of the
part price. It is required for the calculation of the spares
holding costs and used in addition to the expend field. The
expend field is an abbreviation of expendable material
provisionary days and reflects the days required to replenish
22
the spares inventory. Both fields are essential to the
derivation of spares holding costs.
Costs for a single occurrence of each type of
interruption event are also given through this data base.
These costs are an average dollar amount the airline expends
either through rescheduling or loss of future business
resulting from an impact on the customers.
2. Component Inputs
The component data base contains all values associated
with individual aircraft components. Each record of the data
base holds information pertaining to a unique aircraft part.
These component records are organized by aircraft system/sub-
system, an organizational system used by the AirTransportation Association (ATA). It is used by Boeing to
breakdown the aircraft into its basic components. The first
field of the data base contains a ten digit assigned number
(ASN) divided into four sets of digits. The initial set of
digits represents the major aircraft system and each
subsequent set of digits is used to further specify any sub-
system association. This allows the data to be sorted by
aircraft system/sub-system and can be used to narrow the scope
of the analysis to a particular aircraft system.
Subsequent fields within this data base contain the
information required to perform the calculations discussed
earlier. Only the primary inputs affecting dependability
costs are shown in Table 2.3. Other fields exist in the data
base for administrative purposes. These fields are used torecord the sources of information, the engineer responsible
for a particular project, and other administrative functions.
23
Input Variable J Definition
AVEFLTHRS Average flight hours for one flight
FHPY Average annual flight hours for one aircraft
NA Total number of aircraft in the fleet
NAM Number of aircraft currently in the fleet
EAM Proposed number of aircraft in the fleet
DIRLABOR Direct labor hourly rate
BF Burden factor accounting for
employee fringe benefits
DELAYCOSTS Average hourly cost of a schedule delay
CXNCOSTS Average cost of a schedule cancellation
ATBCOSTS Average cost of an air-turnback
DIVCOST Average cost of a diverted aircraft
SPAREFAC Spares factor: inventory costs of holding
spare parts (% of part price)
EXPEND Expendable material provisionary days
MARR Minimum attractive rate of return
INFLATION General inflation rate
STDYLEN Study length in years
MEL CODE Minimum equipment list code
ENGINE Engine type
ROUTE Specifies use of model route structure
MODEL Aircraft model
SERIES Aircraft series
Table 2.2 Aircraft and Economic Inputs
24
INPUT VARIABLES DEFINITIONS
ASN Assigned Number: (Example 01-23-456-789)
NOMENCLATURE Name of part or system
QPA Quantity per airplane
DELAY Number of delays per 100 departures
CAN Number of cancellations per 100 departures
ATB Number of airborne turnbacks per 100
departures
DIV Number of diverts per 100 departures
DELAY TIME Average length of schedule delays
MTBF Mean time between failures in flight hours
MTBUR Mean time between unscheduled removals
ATFR Average time for repair (removals)
MA/1000 Maintenance actions per 1000 flight hours
ATFMA Average time for maintenance actions
(Non-removals)
SHOP LABOR HOURS Average shop labor hours per removal
SHOP MATERIAL Average shop material costs per removal
MTBO Mean time between overhauls
OVERHAUL LABOR HOURS Average shop labor hours per overhaul
OVERHAUL MATERIAL Average material cost per overhaul
PRICE Part price
EXPENDABLE Is the part a consumable? Yes or No
SHOP LENGTH Shop turnaround time in days
MEL CODE Minimum equipment list code
SCHED MAINT/1000 HRS Scheduled maintenance actions per 1000 flight
hours
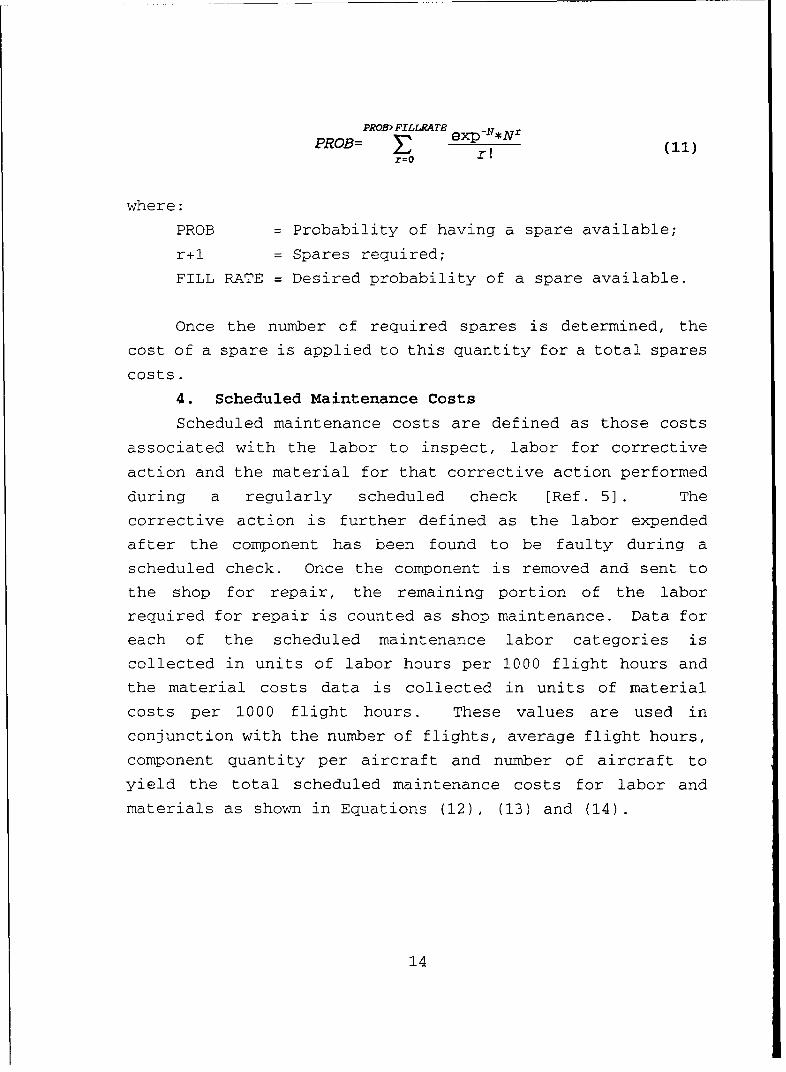
NO. OF SPARES Number of spares required
FILL RATE Desired probability of having a spare on hand
MATERIAL COST BASIS Material costs based on average or actual
SCA LABOR Scheduled corrective action labor per 1000
flight hours
SCA MATERIAL Scheduled corrective action material per 1000
I flight hours
Table 2.3 Component Data Base Inputs
25
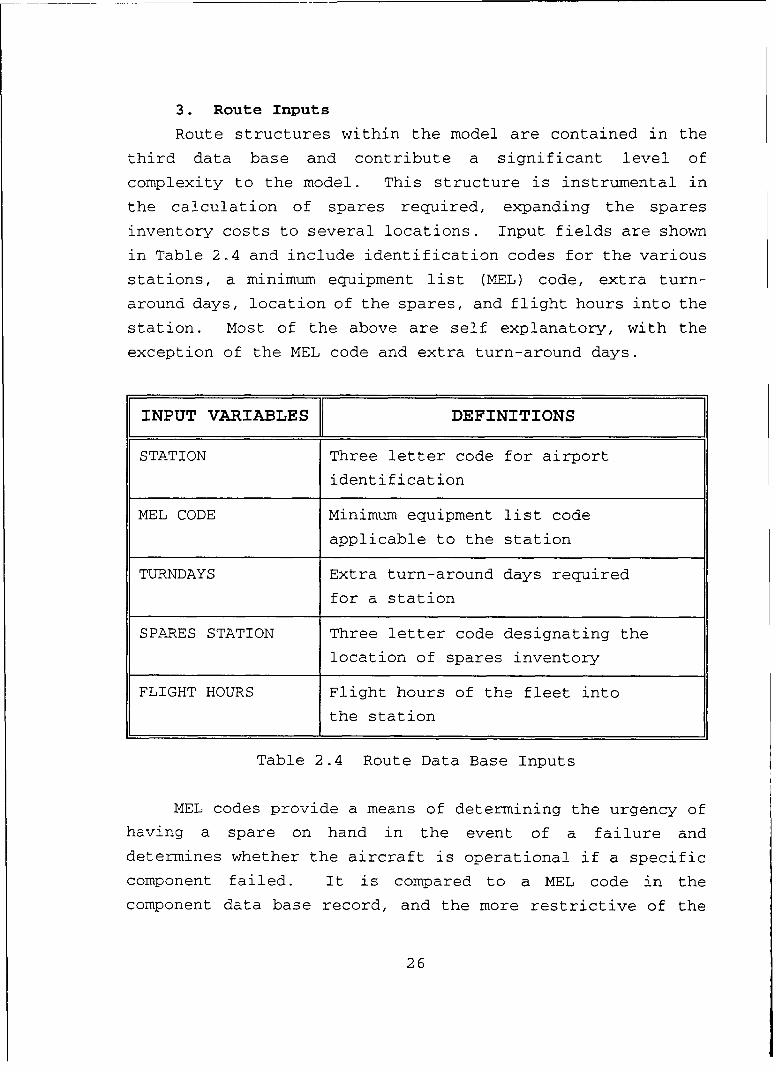
3. Route Inputs
Route structures within the model are contained in the
third data base and contribute a significant level of
complexity to the model. This structure is instrumental in
the calculation of spares required, expanding the spares
inventory costs to several locations. Input fields are shown
in Table 2.4 and include identification codes for the various
stations, a minimum equipment list (MEL) code, extra turn-
around days, location of the spares, and flight hours into the
station. Most of the above are self explanatory, with the
exception of the MEL code and extra turn-around days.
INPUT VARIABLES DEFINITIONS
STATION Three letter code for airport
identification
MEL CODE Minimum equipment list code
applicable to the station
TURNDAYS Extra turn-around days required
for a station
SPARES STATION Three letter code designating the
location of spares inventory
FLIGHT HOURS Flight hours of the fleet into
the station
Table 2.4 Route Data Base Inputs
MEL codes provide a means of determining the urgency of
having a spare on hand in the event of a failure and
determines whether the aircraft is operational if a specific
component failed. It is compared to a MEL code in the
component data base record, and the more restrictive of the
26
two is used. Through this comparison the maintenance
facilities of the distant station can be simulated and
contrasted with the aircraft's home base, showing that a
failure in a remote location will be more costly. Thus, an
effect on the spares inventory will be taken into account for
both locations, increasing the total spares costs.
If the extra turn-around days field contains a value for
the station it reflects a difference in the station's ability
to perform the required maintenance in a timely manner. The
route's extra turn-around days are added to the component's
turn-around time from the component data base. This extra
time to receive and repair a component at the station will
drive the spares required to a higher value, incurring a
steeper cost.
A route structure in the model allows the user to tailor
the model to a more precise simulation of the actual operating
conditions. When the route field of the airplane and economic
data base is left blank the route structure is not used
simulating the operations from a single location. Tactical
military aircraft in peacetime typically operate from a single
base and the complexity of the route structure will not apply
to this analysis.
4. Outputs
After the required data base information is compiled and
stored in the appropriate data base files, the user has a
number of options for both inputs and outputs. If the user
wishes to edit model inputs prior to calculation, this option
is available. Also, the user can choose between running the
model using only the original information for calculations, or
editing the original data for a comparison to any proposed
changes. Calculations can be performed for the present year
or a present value analysis over a specified period.
Once the calculations are completed the model presents an
output menu containing the options of LRU inputs, LRU outputs,
27
output totals or spares totals. Selection of LRU inputs will
provide a list of individual components used in the
calculations and all the information contained in the data
base files for that component. The LRU output will present
the calculated costs of the individual components used in the
calculation. A total system cost broken down by cost elements
is given under the output totals option and, if a comparison
of systems was chosen, the cost data is presented in three
columns showing the original, proposed and a column
highlighting the differences between the two systems. Spares
totals will give spare availability, totals for each station
and total cost of spares inventory.
E. SUMMARY
Boeing has shifted the emphasis on operating costs away
from the traditional airline approach, which focused primarily
on reliability. The shift to dependability dollars and their
attempt to highlight the cost drivers has had a significant
impact on understanding the complexity of aircraft maintenance
systems. A focus on the root causes, or drivers, of these
costs will aid the attempt to control and reduce them in the
future. Economic conditions within the airline industry have
forced aircraft manufacturers to concentrate on developing a
competitive edge, and the control of operating costs is one
method Boeing uses to provide that edge to their customers.
This model provides flexibility to the user by tailoring
inputs to simulate operating conditions and the capability to
analyze the benefits of a proposed change prior to
implementation. Understanding the cost drivers within a
maintenance system can have applications to any company or
military unit seeking to maximize efficiency of the funds
expended.
28
III. DATA BASE CONSTRUCTION
This chapter presents the information sources,
assumptions and methods used to construct the data basesrequired for Boeing's Dependability Cost Model (DCM). Datawas collected from various sources for the engine of the F/A-
18, the F404-GE-400, and manipulated into the desired format.The author found the U. S. Navy's current maintenance
information systems contained the necessary data, but timeconstraints of this research effort required simplifying
assumptions to be made in certain areas. These assumptions
are discussed in detail throughout this chapter. Informationwas collected in the form of printed reports and computer textfiles, then imported and/or typed into spreadsheets foranalysis and ease of manipulation. After the data base was
constructed in a spreadsheet file, this file was imported intothe Paradox data base program for use with the DCM.
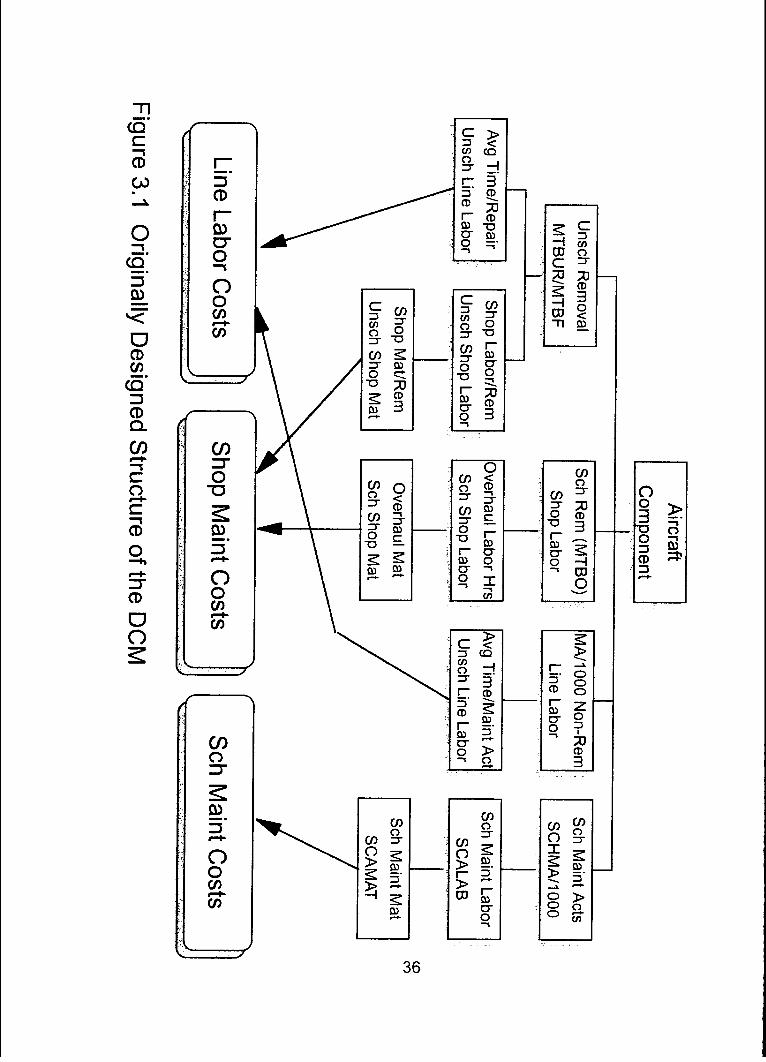
A. MODEL'S ORGANIZATIONAL STRUCTURE ALTERED
The DCM was built for a maintenance system designed andoperated by the airline industry. The airline maintenance
organization designed into the model differs tremendously from
the one used by the U. S. Navy. Naval aircraft maintenance isperformed at the three levels of organizational, intermediateand depot. These levels are commonly referred to as 'l0ol
level, "I" level and depot level. Labor and material costsare incurred at each level, but the model highlights laborcosts for two levels and material costs for only one of these.The model's distinction between line and shop maintenance does
not completely correlate to any of the three levels used inthe Naval service. This led the author to specifically definethe maintenance levels addressed by this research effort andgather information pertaining to those levels. The resultingoutput from the model will not capture all the costs of the
29
F/A-18's engine maintenance, but only those within the
variable definitions chosen by the author.
Line maintenance, as implied by the model's construction,
corresponds closely with the "0'1 level maintenance. For this
level of maintenance, the model calculates only the associated
labor costs and neglects any material costs incurred. Labor
costs are based on the maintenance actions performed and the
time required to perform those actions. A detailed discussion
of the actual data gathered and the manipulation of that data
will be presented in a subsequent section.
Costs incurred due to shop maintenance are calculated for
both the labor and materials expended while performing
aircraft maintenance at this level. Shop maintenance was used
to simulate the "I" level of the Navy's aircraft maintenance
system. The information gathered by the author concerning
material costs was taken from the Aviation Intermediate
Maintenance Department, located at Naval Air Station Lemoore,
CA. The availability of information was decisive in limiting
the definition of shop maintenance to this level.Depot level maintenance costs are beyond the scope of
this research effort. However, the model does contain a
provision for outside maintenance costs that could be used to
capture this expense. A detailed analysis of both labor and
material costs incurred from an outside source is not
available through this model. Outside maintenance costs are
entered as a single variable and any distinction between labor
and material components would not be relevant to an airline's
internal cost analysis.
Another element of dependability cost is the scheduled
maintenance costs. During this calculation the model does not
distinguish between line or shop maintenance. These costs are
based solely on the data base fields of scheduled maintenance
per 1000 flight hours, scheduled corrective action labor and
scheduled corrective action material usage. Information
30
gathered by the author did not yield the detail necessary to
accurately distinguish scheduled maintenance activity from
overall maintenance activity. An alternative use of these
data fields was to calculate cannibalization costs.
Cannibalization is the removal of a working componentfrom one aircraft for replacement in a second aircraft in
order to restore the second to an operating condition. During
this research effort, the author developed the impression that
cannibalization was a major problem within the Navy's aircraftmaintenance system. This practice increases the down time ofthe aircraft being cannibalized, adversely affecting the
overall readiness of the aircraft fleet. Often short termoperational requirements are met through cannibalization at
the expense of long term fleet readiness.
A possible solution is increased funding for spare parts
inventory, but there is a trade-off between increasedinventory costs and reduced cannibalization costs. An
economically efficient balance of the two can only beestablished if decision makers are aware of both costs, and
their relationship to each other.
This led to an attempt to highlight the costs associated
with cannibalization. The Engine Component ImprovementFeedback Reports (ECIFRs) gave data on cannibalization man
hours and the number of actions at both the "0" level and "I"
level as a combined total. Providing this data, without
regard to a particular level, allowed the author to use the
scheduled maintenance portion of the model as a
cannibalization costs calculation. Unfortunately, only thelabor hours and maintenance actions associated withcannibalization were contained in the ECIFRs, and materialcosts were not available. Therefore, only the labor costs due
to cannibalization will be calculated by the model. Thisleaves the material costs of cannibalization as an unknown.
Therefore, the economically efficient balance between
31
increased spare parts inventory costs and decreased
cannibalization costs, discussed above is beyond the scope of
this thesis.
Other components of dependability costs to be calculated
by the model, spares holding costs and schedule interruption
costs, were not redefined by the author. Assumptions dealing
with the variables driving these costs will be discussed in a
subsequent section.
Through these modifications to the organizational
definitions, the author was able to build a data base from
information contained in the Navy's maintenance information
sources. Table 3.1 summarizes the changes from the original
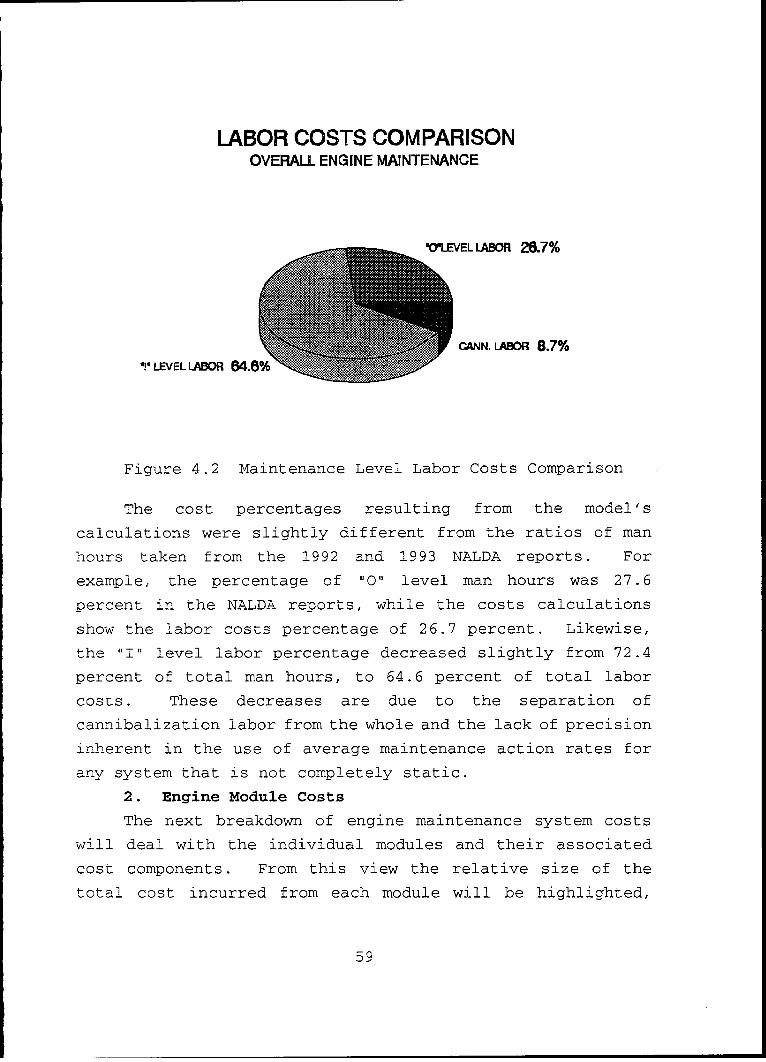
calculations were slightly different from the ratios of man
hours taken from the 1992 and 1993 NALDA reports. For
example, the percentage of "0" level man hours was 27.6
percent in the NALDA reports, while the costs calculations
show the labor costs percentage of 26.7 percent. Likewise,
the "I" level labor percentage decreased slightly from 72.4
percent of total man hours, to 64.6 percent of total labor
costs. These decreases are due to the separation of
cannibalization labor from the whole and the lack of precision
inherent in the use of average maintenance action rates for
any system that is not completely static.
2. Engine Module Costs
The next breakdown of engine maintenance system costs
will deal with the individual modules and their associated
cost components. From this view the relative size of the
total cost incurred from each module will be highlighted,
59
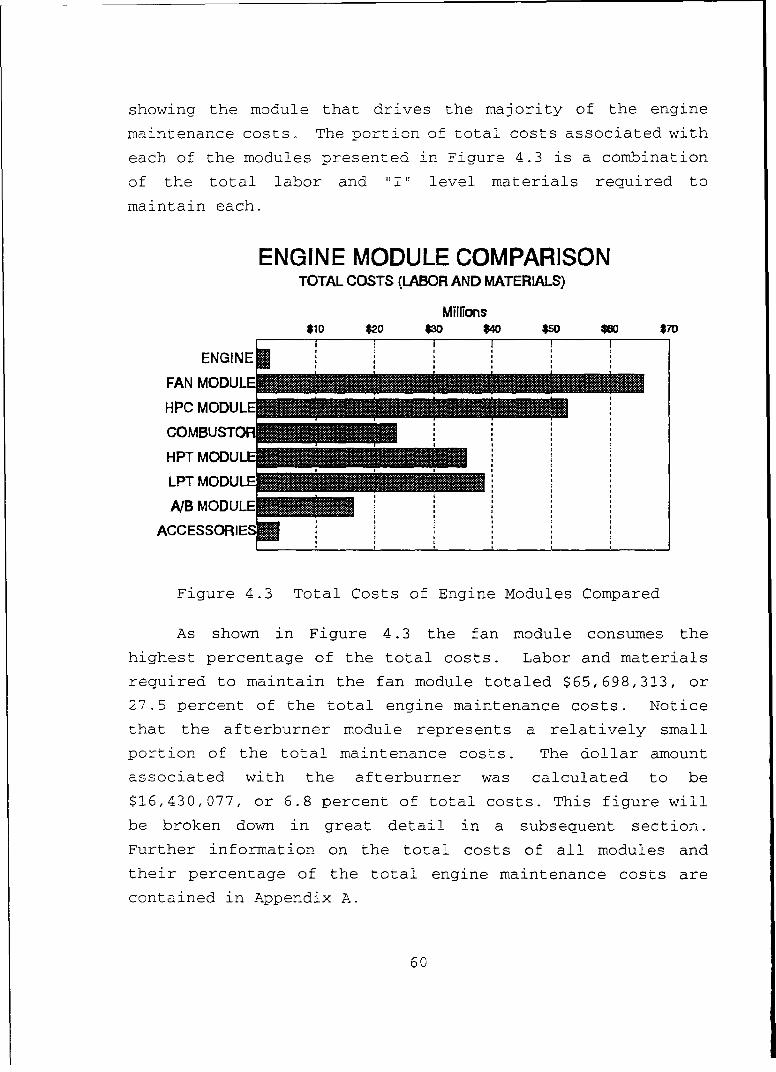
showing the module that drives the majority of the engine
maintenance costs. The portion of total costs associated with
each of the modules presented in Figure 4.3 is a combination
of the total labor and "I" level materials required to
maintain each.
ENGINE MODULE COMPARISONTOTAL COSTS (LABOR AND MATERIALS)
Millions$10 $200 $ $40 Wo $80 $70
ii i Il
ENGINE ...
FAN MODULE'-REEoM-
HPC MODULE I I-I a a S
COMBUSTOR . . .
HPT MODULE ['LPT MODULE I I I: :
NB MODULE-.
ACCESSORIES, . , ,
Figure 4.3 Total Costs of Engine Modules Compared
As shown in Figure 4.3 the fan module consumes the
highest percentage of the total costs. Labor and materials
required to maintain the fan module totaled $65,698,313, or
27.5 percent of the total engine maintenance costs. Notice
that the afterburner module represents a relatively small
portion of the total maintenance costs. The dollar amount
associated with the afterburner was calculated to be
$16,430,077, or 6.8 percent of total costs. This figure will
be broken down in great detail in a subsequent section.
Further information on the total costs of all modules and
their percentage of the total engine maintenance costs are
contained in Appendix A.
60
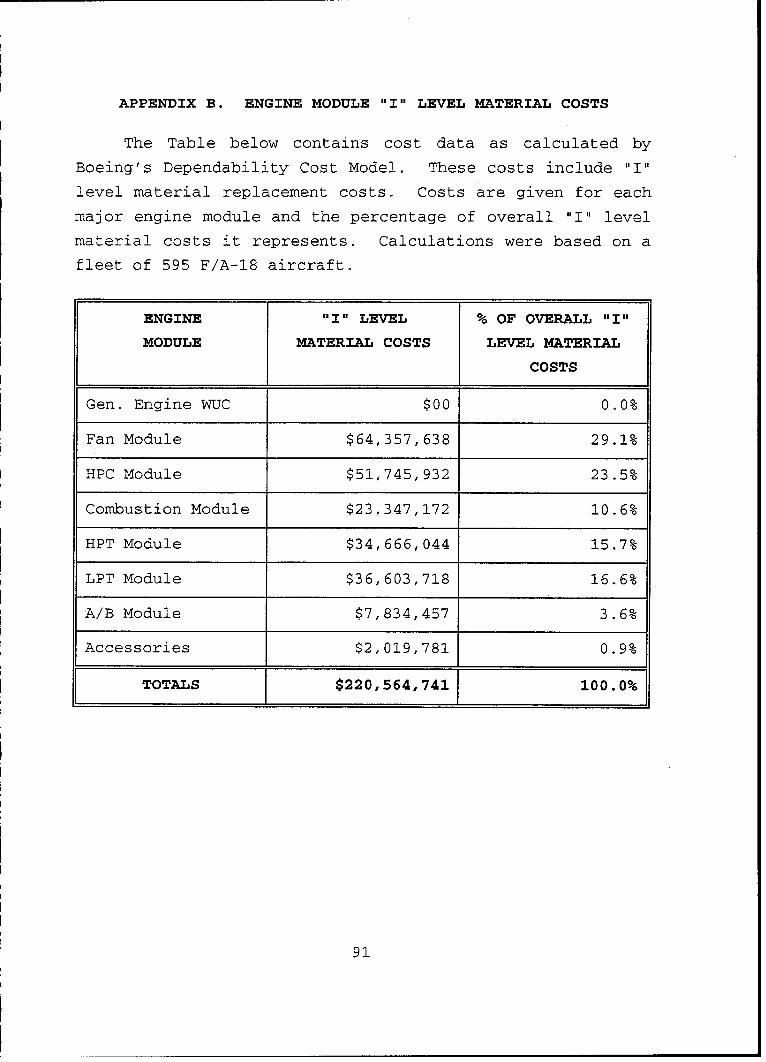
a. Material Costs by Engine Module
Total costs of the individual modules were separated
into the components of labor and materials. A breakdown of
the "I" level materials associated with each module is shown
in Figure 4.4. Material costs were calculated from the
average material usage on major engine modules reported by the
AIMD, located at NAS Lemoore [Ref. 26]. Using the
overall average costs for the major modules prevents any
analysis from proceeding beyond that level of detail. Any
greater detail requires knowledge of the exact composition of
those averages.
ENGINE MODULE COMPARISON"l" Level Material Costs
Millions$10 $20 $30 $40 $50 $60 $70
FAN MODULE ' ".....$' "..
HPCMODULE
COMBUSTOR .
HPT MODULE
LPT MODULE
A/B MODULE B , ,
ACCESSORIES . . .. .
Figure 4.4 "I" Level Material Costs by Module
Once again the major contributor to the maintenance costs
is the fan module. Total "I" level material costs for the fan
module were calculated to be $64,357,638, or 29.2 percent of
the total. The afterburner module consumes a small portion of
the "I" level material costs, only $7,834,457, or 3.6 percent
of the total. Further detail on other modules is presented in
Appendix B.
61
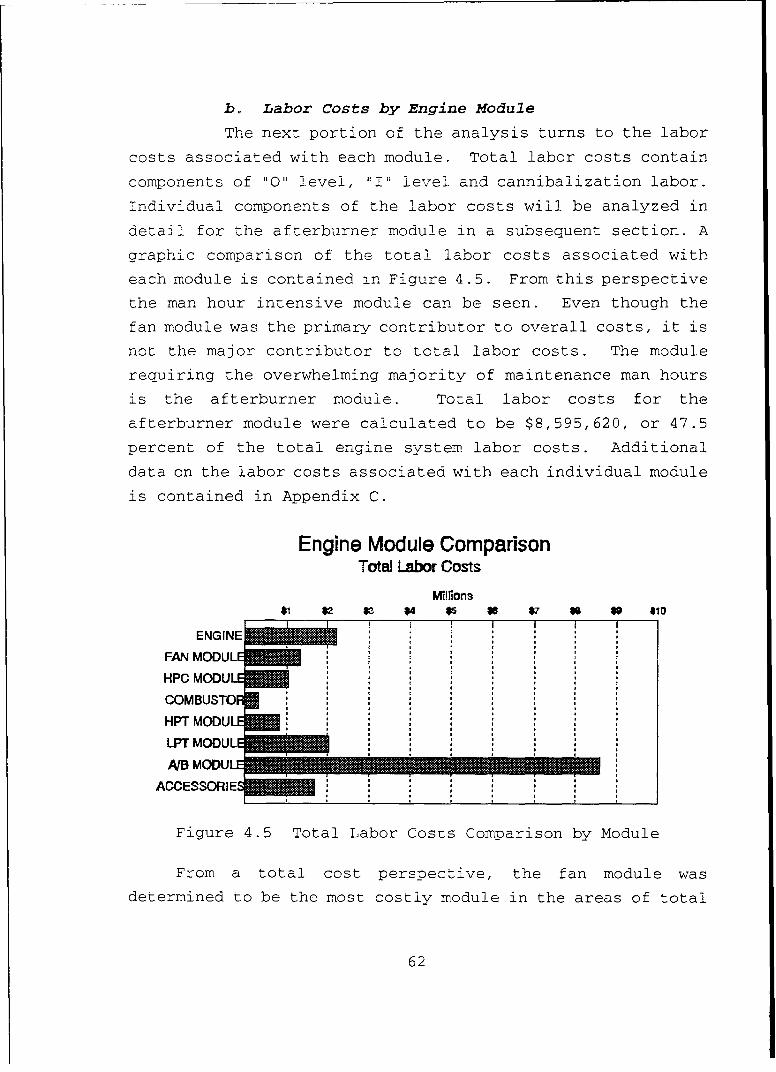
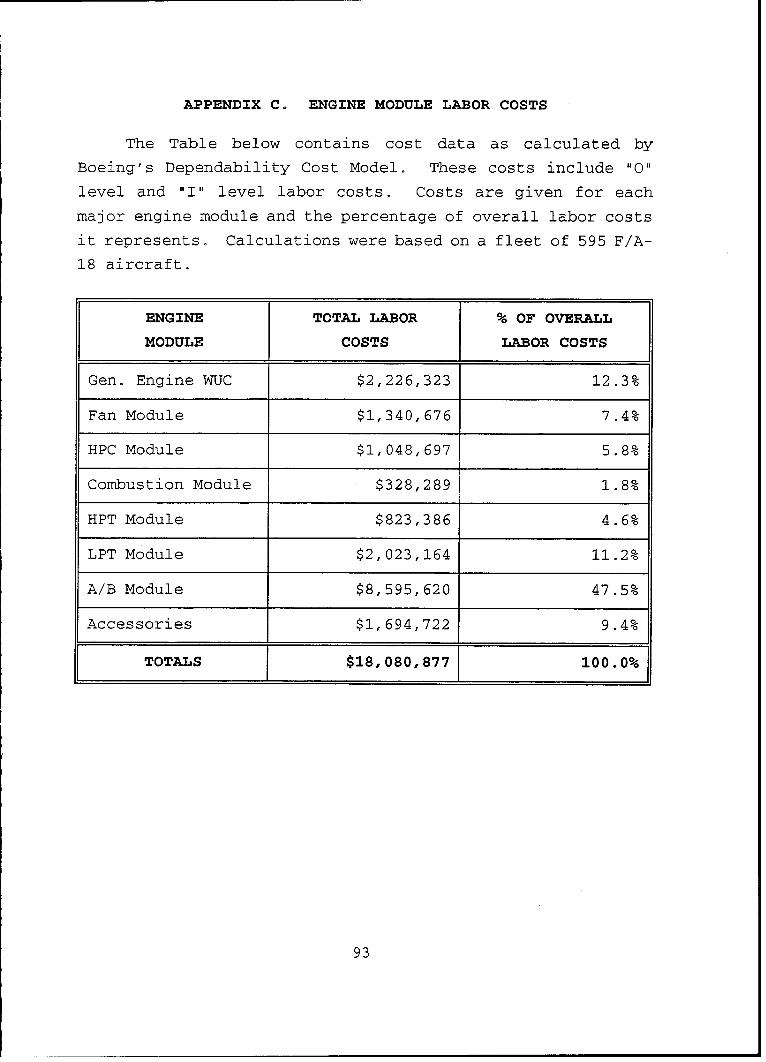
b. Labor Costs by Engine Module
The next portion of the analysis turns to the labor
costs associated with each module. Total labor costs contain
components of "0" level, 'I" level and cannibalization labor.
individual components of the labor costs will be analyzed in
detail for the afterburner module in a subsequent section. A
graphic comparison of the total labor costs associated with
each module is contained in Figure 4.5. From this perspective
the man hour intensive module can be seen. Even though the
fan module was the primary contributor to overall costs, it is
not the major contributor to total labor costs. The module
requiring the overwhelming majority of maintenance man hoursis the afterburner module. Total labor costs for the
afterburner module were calculated to be $8,595,620, or 47.5
percent of the total engine system labor costs. Additional
data on the labor costs associated with each individual module
is contained in Appendix C.
Engine Module ComparisonTotal Labor Costs
Millons$1 42 $3 $4 $6 $ *7 i P 4l0
ENGINE
FAN MODULfEr
HPC MODUL
COMBUSTO m
HPT MODUL
LPT MODULEAIDBMODU , , -,
ACCESSORIE== ......
Figure 4.5 Total Labor Costs Comparison by Module
From a total cost perspective, the fan module was
determined to be the most costly module in the areas of total
62
costs and "I" level material costs. Separation of the labor
component from the total cost picture revealed the afterburner
module as the primary contributor to the total labor costs.
The following section will break down the labor costs of the
afterburner module, showing the level of detail possible from
this model.
C. DETAILED ANALYSIS OF THE AFTERBURNER MODULE COSTS
This section will review the major cost components of
labor and materials for the afterburner section. Then thelabor costs will be divided into its components of 1O" level,
"I" level and cannibalization labor. A final analysis of the
afterburner section will trace the source of the labor costs
down to the specific WUC on which the labor was expended.
This will demonstrate the level of detail available through
computer modeling of a maintenance system. The level of
detail is more limited by the data collected and the
organization of that data than by the model.
1. Labor and Material Components
The afterburner is a low cost module relative to the
overall costs and those of the other modules. The average "I"level material replacement costs of an engine module range
from a high of $127,307 (fan module) to a low of $10,588
(afterburner module) [Ref. 27]. Ranking the modules
by total maintenance costs, the afterburner module ranks last
of the major modules, followed only by the accessories and the
general engine category. However, in terms of labor costs,
the afterburner module is by far the most expensive. As
pointed out in the previous section, the model's calculations
show that 47.5 percent of all engine labor costs result from
the maintenance performed on this module. Also, data
collected during this research effort was much more detailed
in the area of maintenance actions and led the author to focus
63
more on this aspect of maintenance costs. For these reasons,
the afterburner module was chosen for the detailed analysis.
The components of engine maintenance costs, total labor
and "I" level materials are shown in Figure 4.6. Total module
costs are comprised of 52.3 percent labor and 47.7 percent
materials, equating to dollar amounts of $8,595,620 and
$7,834,457, respectively.
Afterburner Module Cost ComponentsTotal Labor vs 'I" Level Materials
MATERIAL 47.7%
LABOR 52.3%
Figure 4.6 Afterburner Labor versus Material Costs
2. Afterburner Module Labor Costs Analysis
This section will break the labor costs associated with
the afterburner module into components of "0" level, "I" level
and cannibalization labor. Information concerning the
separation of labor costs at the differing levels of
maintenance was taken from a printout produced by the model.
This printout gives all the inputs used during the cost
calculations, listed by ASN. It contains multiple columns of
data showing an average annual cost incurred per aircraft in
each cost element. Data from this printout is graphically
64
presented below in Figure 4.7, using the three cost elements
of "0" level, "I" level and cannibalization labor. This
figure indicates that the major contributor of labor costs is
the "I" level, possessing 62.2 percent of the total labor
costs for maintenance on the afterburner module.
Labor Costs Components
'o Lowvl 35.1%
Cannibeiizatbn 2.7%
"I'• •L, 62.2%
Figure 4.7 Afterburner Labor Cost Components
3. Afterburner Labor Costs by WUC
A further breakdown of these costs will consist of
identifying the specific WUC responsible for the labor
expended. Information of this nature could potentially be
useful in the identification of a single part incurring an
abnormally high percentage of the overall labor. Once
identified the part can be redesigned for greater
maintainability, reducing overall maintenance system costs.
The initial presentation of this data will detail the
total average annual labor costs incurred per aircraft by WUC.
This information is presented in Figure 4.8. Figures 4.9
65
through 4.11 show the average annual labor costs per aircraft
for the separate labor components of "0" level, "I" level and
cannibalization labor, also presented by WUC. Data collected
by the author contained information on 27 WUCs within the
afterburner module that were used in the cost calculations.
Only the WUCs containing the highest percentages of the labor
from each component are presented in the following figures.
Each figure shows the WUCs that comprise the top 90 percent of
the labor costs from their respective labor component.
Total Labor CostsBy Work Unit Code
ANNUAL COSTS PER AIRPLANEDollars
$1,000 2.0o0 $3000 $4=oo $5,000
27-48-VO&OcX-~V___
27-48-400-C ON
27-48-700-OC .
27-48..V0.00 C "_.:_._ _ . ._. ..,
27-48-1300'-0X
27--4,600-
Figure 4.8 Upper 90 Percent of Total Labor Costs by WUC
Figure 4.8 indicates that ASN 27-46-VOO-000 requires the
major portion of the labor required for maintenance of the
afterburner module. This ASN (or WUC of 2746V00) is the
afterburner main spray bar. During the author's visit to AIMD
IKM Lemroore it was mentioned as being particularly troublesorre [Ref. 28]
with respect to "I" level maintenance. Model calculations
show this particular part accounts for 31.2 percent of the
total labor incurred due to afterburner module maintenance.
66
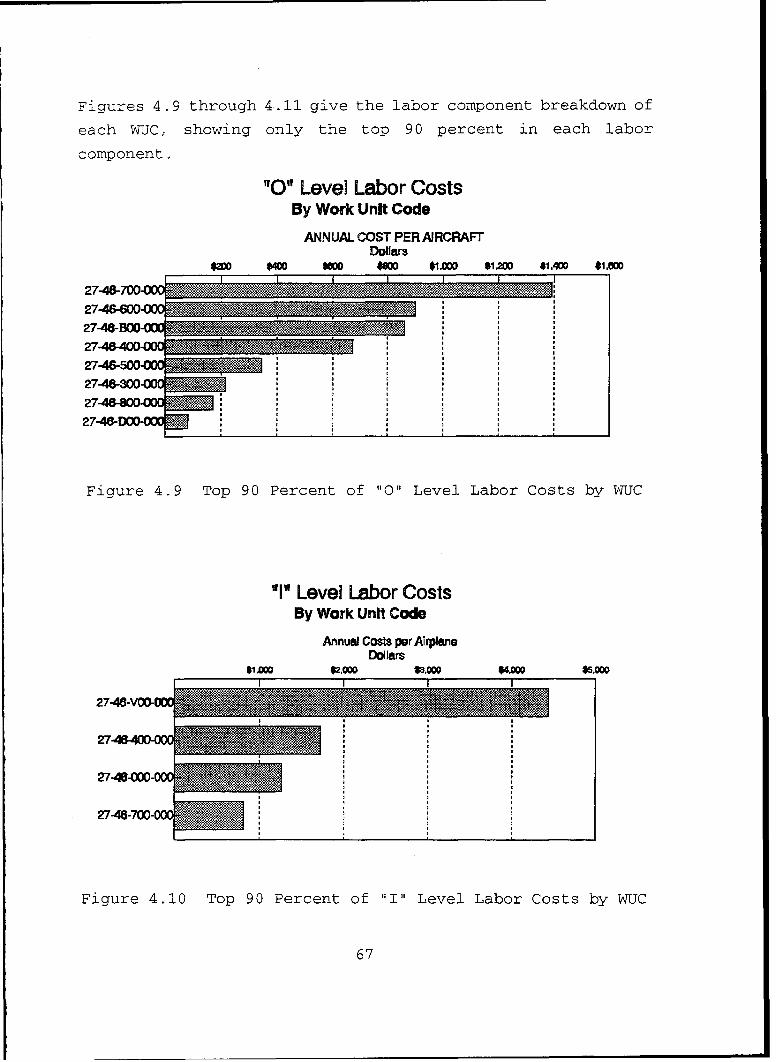
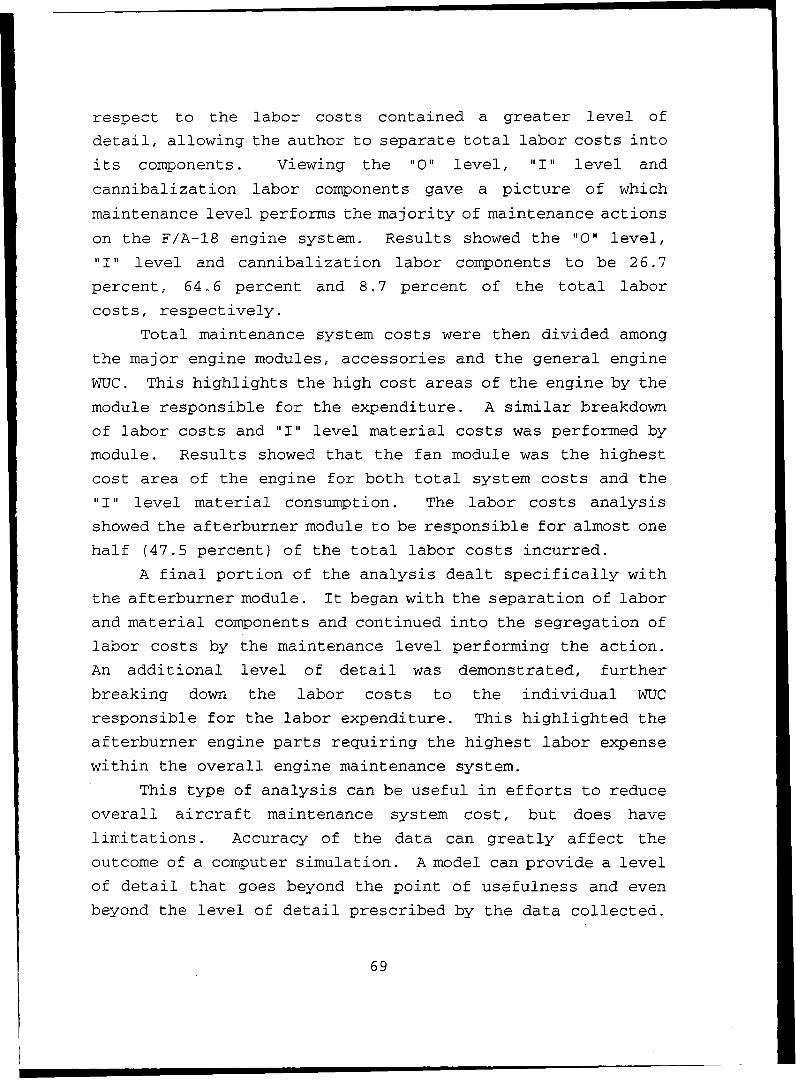
Figures 4.9 through 4.11 give the labor component breakdown of
each WUC, showing only the top 90 percent in each labor
component.
"00" Level Labor CostsBy Work Unit Code
ANNUAL COST PER AIRCRAFTDollars
$00 M ND $90 1.000 $1,200 $1.400 1.e000
27-4&-700 O .. ....- "..WNM
27-46-600OC M'.27-40-BOO-Oc . ~
27-46-300oo•27-46-800-0
Figure 4.9 Top 90 Percent of "0" Level Labor Costs by WUC
"1" Level Labor CostsBy Work Unit Code
Annual Costs per AirplaneDollars
W= 4 *2.000 S3,0M 4,000 1*8.000
27-48-700-0i0
Figure 4.10 Top 90 Percent of "I" Level Labor Costs by WUC
67
Cannibalization Labor CostsBy Work Unh Code
ANNUAL COSTS PER AIRPLANEDollars
____$50 $100 $150 $200
27-46-(XX-00
27A-4500-00
27.46•1-Al
27-46-700-00
27-4l6-00-00
27-46-9M0M0
Figure 4.11 Top 90 Percent Cannibalization Labor Costs by WUC
From the figures presented above, the detail possible
through computer modeling is apparent. The calculations
performed correlated with the impression gathered by the
author during field visits as in the case of the afterburner
spray bar. As seen in Figure 4.10, the majority of the labor
expended for afterburner maintenance at the "I" level is on
this part, and this is the most significant portion of the
total labor expended in afterburner maintenance.
D. SUMMARY
The preceding chapter examined the cost outputs derived
from the DCM. Initially, total system maintenance costs were
separated into the components of labor and materials.
Material costs were determined to be the major contributor to
the total maintenance system costs, accounting for 92.4
percent of the total. Due to the level of detail available
within the materia! cost data, a further analysis of the
material costs was not possible.
Labor costs were presented as the remaining 7.6 percent
of the total maintenance system costs. Data collected with
68
respect to the labor costs contained a greater level of
detail, allowing the author to separate total labor costs into
its components. Viewing the "0" level, "I" level and
cannibalization labor components gave a picture of which
maintenance level performs the majority of maintenance actions
on the F/A-18 engine system. Results showed the "0" level,
"I" level and cannibalization labor components to be 26.7
percent, 64.6 percent and 8.7 percent of the total labor
costs, respectively.
Total maintenance system costs were then divided among
the major engine modules, accessories and the general engine
WUC. This highlights the high cost areas of the engine by the
module responsible for the expenditure. A similar breakdown
of labor costs and "I" level material costs was performed by
module. Results showed that the fan module was the highest
cost area of the engine for both total system costs and the
"I" level material consumption. The labor costs analysis
showed the afterburner module to be responsible for almost one
half (47.5 percent) of the total labor costs incurred.
A final portion of the analysis dealt specifically with
the afterburner module. It began with the separation of labor
and material components and continued into the segregation of
labor costs by the maintenance level performing the action.
An additional level of detail was demonstrated, further
breaking down the labor costs to the individual WUC
responsible for the labor expenditure. This highlighted the
afterburner engine parts requiring the highest labor expense
within the overall engine maintenance system.
This type of analysis can be useful in efforts to reduce
overall aircraft maintenance system cost, but does have
limitations. Accuracy of the data can greatly affect the
outcome of a computer simulation. A model can provide a level
of detail that goes beyond the point of usefulness and even
beyond the level of detail prescribed by the data collected.
69
Efforts to collect data can place a manpower burden on the
administration of a maintenance system, incurring costs beyond
any benefit received by the increased detail of the data.
For example, the final breakdown of labor costs to the
specific WUC in this chapter has exceeded the precision of the
data collected. Assumptions concerning the average
maintenance action times made in Chapter III were too broad to
realistically consider the model output valid to this level of
detail. The cost information presented in this research
effort is merely an estimate and is not intended to be
precise. The final portion of the analysis was presented for
demonstration purposes and gave a general idea of the actual
distribution of the maintenance resources, but is not accurate
enough to relate precisely to the reality of everyday
maintenance actions.
The next chapter of this thesis will discuss the model
outputs from a real world perspective and give the author's
overall impression of its usefulness. A major topic of thediscussion will be the applicability of this model to Naval
tactical aviation and some problems associated with its
adaptation to the F/A-18. Also, alternative uses and possible
modifications will be presented.
70
V. DCM APPLICATION TO THE F/A-18
This chapter will discuss the problems associated with
adaptation of the DCM to the F/A-18 engine maintenance system.
After this discussion, the model is used to calculate the FY94"I" level material cost of AIMD, NAS Lemoore and compare this
estimate to the cost forecasted in their mid-year budget call.
A final use of the model will be to forecast the annual "I"
level material cost for FY95 based on service life adjustments
to major engine components.
The cost estimations below have been limited to the
material costs for a number of reasons. First, the data used
while constructing the data base consisted of maintenance
actions and man hours of high maintenance action WUCs taken
from the ECIFRs. High maintenance action items were defined
in the ECIFR as the top 80 percent of total actions and man
hours. Therefore, any estimation of actual labor costs would
be significantly underestimated. This level of detail allows
for the analysis of high maintenance action components, but a
full accounting of all actions is not possible.
Second, the material costs used for this analysis were
average module costs for all "I" level material expensesincurred. The use of total "I" level material costs divided
by total engine modules pushed through the system fully
captures all material costs, allowing a solid base for further
estimation without losing a percentage of the total material
costs.
Third, funding for total engine maintenance originates
from two appropriation accounts. All material costs are
funded through the operation and maintenance appropriation,
but labor expenses are paid through a combination of military
personnel appropriation and the operations and maintenance
appropriation. Labor performed by military personnel
originates from the military personnel appropriation, which
71
would include "0'o level labor and a portion of "I" level
labor. The remaining "I" level labor performed by civilian
personnel would be funded through the operations and
maintenance appropriation. This mixture of appropriations for
labor costs obscures the issue of reducing appropriated funds
in this area. Any analysis focusing on the reduction of
appropriated funds would require knowing the relationship of
military versus civilian labor. Data used in this project
does not distinguish between military and civilian labor nor
does the model contain any provision for this distinction.
Maintenance costs originating from the operations and
maintenance appropriations have been an area of concern in the
recent past. The rapid and unexpected growth of maintenance
costs have strained the funding resources appropriated through
this account. Engine component service life reductions have
driven these cost increases and adversely impacted fleet
readiness by absorbing funds intended for the other items
within this appropriation. Material costs make up the
majority of this increase, but a small percentage can be
attributed to the increased labor costs.
Because of the nature of the data, complexity of
appropriation accounts and the relative size of labor and
material cost components, the focus here will be on the
material cost portion of this issue.
A. DCM ADAPTATION TO THE U.S. NAVY
The DCM was not designed for the organizational structure
used by the Navy. This forced the author to limit the scope
of this research effort and redefine many of the variables.
The original purpose of the model was to identify the high
cost drivers of an entire aircraft maintenance system. This
research applied the model only to the engine system of one
aircraft. The multiple levels of maintenance in the Navy's
organization precluded the analysis of the entire engine
72
maintenance system costs, and as discussed in Chapter III,
depot level costs and "O1 level material costs were excludedfrom this analysis. The model's design allows for only two
levels of maintenance and the material costs associated with
one of those levels. Constrained by the model's design and in
some cases data collected, the author attempted to capture asmuch of the engine maintenance system costs as practical. The
resulting analysis presented in the previous chapter showed
only the costs associated with "0" and "I" level labor and "I"level materials. The total Navy maintenance organization
exceeded the capacity of the model's design, but analysis of
the areas within the scope of this research effort provide
some insight into the maintenance system costs. Additionalproblems encountered with the F/A-18 will be addressed below.
B. DCM ADAPTATION TO THE F/A-18
A significant problem with the use of this model for the
F/A-18 engine is the use of flight time averages to predict
engine module removals. The F/A-18 uses an onboard engine
monitoring system to track and record engine data throughvarious sensors. This system records engine thermal cycles,
rotor speeds and many other factors to determine the service
life remaining on engine components. Service lives are given
as engine life cycle fatigue, effective full thermal cycles,equipment operating time, etc. and tracked continuously on a
computerized maintenance information system. Any part withinan engine module reaching its life limit will result in themodule's removal from the engine. All scheduled removals of
the engine components are based on these criteria which are
better suited for tracking engine wear than flight time.
Any correlation to flight time is purely coincidental.The number of flight hours between engine component removals
depends on how aggressively the aircraft is flown. For
example, a typical flight transporting the aircraft from one
73
base to another could require full power only once, on take
off, while a flight consisting of air combat maneuvering could
require a pilot to modulate the throttle between idle and full
power several times during each training engagement. Each
throttle movement creates temperature and rotor speed changes,
increasing wear on the engine components. Total component
wear on the engine for the two flights would be drastically
different.
The cross country transportation may involve only a few
"effective full thermal cycles" in a two hour flight, but the
air combat mission may involve more than a dozen in a one hour
flight. Thus, an engine component removal would occur in
relatively few flight hours for an aggressive training
mission, but the less demanding missions would require engine
component replacements after a relatively high number of
flight hours had been flown.
To compensate for this problem, any flight hour average
would need to be taken over a long period. A period of two
years, as used in this project, is a sufficient length to
cover the full work-up and deployment cycle of a squadron. It
could possibly average out the differing intensities of the
operations. But the negative side of the long period average
is an inherent inability to capture any system changes.This presents problems of some magnitude for the
maintenance funding of the F/A-18. Changes in the service
life of engine components have occurred frequently in the
recent past, creating a major problem in the prediction of
required funding. The following sections discuss this problem
in detail and attempt to use the DCM as a cost estimation tool
by adjusting the model inputs for engine component service
life reductions.
74
C. MODEL FORECAST OF FY94 "I" LEVEL MATERIAL COSTS
After the initial cost data was generated for the entire
fleet of 595 aircraft, another run of the model was performed
utilizing the actual number of aircraft supported by AIMD NAS
Lemoore, 218 [Ref. 29]. Cost data from this run was
compared to the forecasted annual material costs taken from
the AIMD NAS Lemoore mid-year budget call [Ref. 30].
Their estimate was $84,844,490 and the model estimated the
annual "I" level material costs to be $80,815,619. The
model's cost estimate differs by roughly 4.7 percent, which is
a significant error. However, the historical data used during
data base construction does not contain the latest revisions
to engine component service lives nor does this data fully
reflect changes occurring in 1992 and 1993. These changes
would cause the model to underestimate the material expenses.
Table 5.1 shows the engine life cycle fatigue (ELCF) changes
that occurred during the period covered by the data
[Ref. 31].
The timing of these changes degrades the accuracy of
historical data used in the data base. An average removal
rate taken over the entire period of 1992 and 1993 would not
fully represent the impact of a change occurring during the
period. The later a change occurred in the period, the less
influence it would have on the average. Only changes
occurring before, and fully implemented throughout the period
would be fully represented by the average.
Additional changes to component service lives have
occurred since the end of the data collection period. These
changes are not reflected in the averages used in model
calculations and further exacerbate the underestimation
problem. Table 5.2 gives a list of changes occurring from
January 1994 through July 1994.
75
COMPONENT ORIGINAL CHANGED DATE OFELCF ELCF CHANGE
COMPONENT ORIGINAL CHANGED DATE OFELCF ELCF CHANGE
FAN MODULEFan Aft Shaft 9030 4600 1/94
HP COMPRESSOR MODULEStage 1-2 Comp. Spool 2240 1700 1/94
1500 7/94Forward Shaft 4910 4000 7/94
HP TURBINE MODULEHP Turbine Disk 10500 7200 7/94
LP TURBINE MODULELP Turbine Disk 10520 6240 1/94Forward Seal 22030 18000 1/94Conical Shaft 12370 6700 1/94
Table 5.2 ELCF Changes January 1994 Through July 1994
76
These changes highlight the problem associated with using
historical averages in a changing cost environment. Averages
will always lag behind actual changes to some degree. The
severity of the lag will depend on the length of time the
average covers and the magnitude of the change. This will
create a situation of over or underestimation depending on the
direction of movement in the value being averaged. If the
period of data collection is too long, the average will not
respond rapidly enough, or if too short, could be adversely
affected by short term spikes. In the case of the model's
estimate for annual "I" level material costs, the author
believes the underestimation was due to the reduction of
component service lives both during and after the data
collection period. The lag in the data with respect to the
1992 and 1993 changes and the exclusion of the 1994 changes
resulted in the low estimation.
D. BUDGET FORECAST FROM THE DCM
A feature of the model discussed in Chapter II would
allow the user to manually edit the component inputs to
compensate for service life reductions on engine components.
This would allow a budgetary planner to view the cost
differential between the existing system and any proposed
change to the system. Use of this feature would allow
decision makers to forecast the additional costs incurred due
to the change, leading to funding adjustments or the
development of alternate plans if additional funding was not
possible. However, this method only allows a planner to
compensate for known changes while much of the problem has
been the recurring unexpected changes.
The author adjusted the mean flight hours between
removals on the components listed in Table 5.2 in an attempt
to estimate an annual "I" level material cost based on the
most recent service life changes. These adjustments were
77
performed by equating the ratio of new ELCF over original
ELCF, to the adjusted mean flight hours between removal over
the original mean flight hours between removal, and then
solving for the adjusted mean flight hours between removals.
Original mean flight hours between removals and the adjusted
values are compared in Table 5.3.
ORIGINAL MEAN ADJUSTED MEANMODULE FLIGHT HOURS FLIGHT HOURS
BETWEEN REMOVAL BETWEEN REMOVAL
FAN MODULE 899 458
HP COMPRESSOR MODULE 978 655
HP TURBINE MODULE 982 673
LP TURBINE MODULE 779 421
Table 5.3 Removal Rates Adjusted for ELCF Changes
These adjusted values were then used in the model to
forecast an annual funding requirement for the F/A-18 enginebased on the recent service life changes. The resulting
estimate for the annual "I" level material cost incurred by
AIMD NAS Lemoore, CA. was $130,149,966. This estimate
inherently assumes the system will operate on the adjustedmean flight hour between removals for an entire year.
Also, as mentioned earlier the original mean flight hours
between removals do not fully compensate for the changes shownin Table 5.1. Those changes would further reduce the mean
flight time between removals, but the degree to which the
original data captured the 1992 and 1993 changes is unknown.
Additional information on the number of removals occurring
before and after the change would be required for this
clarification. Both of the above factors will cause the
forecasted annual "i" level material cost to be
underestimated.
Another possible distortion of this forecast is a large
78
portion of the "I" level material costs are incurred from the
replacement of parts found to be defective after the module is
removed. If the flight time between removals decrease, this
could also lead to a decrease in the number of additional
parts found to be defective. A reduction in the additional
part defects found during module removals would decrease the
average costs per module, implying that the $130,149,966
annual it I H level material cost forecast could be
overestimated.
Whether the model's estimate is too high or too low can
not be determined from the information contained in this
project. A final validity check can be performed only after
next year's funds are expended, and further changes would
influence the accuracy of a historical comparison. This
particular use of the model goes beyond the designer's
intentions. Also, the ratio method used to adjust the mean
flight hour values was a crude estimate and assumes a constant
intensity of the missions flown. In the author's opinion, the
model has potential as a budget estimating tool for a stable
system. For a dynamic system such as the F/A-18 engine system
it could be used with caution, but simplifying assumptions and
adjustments would affect the accuracy of the estimates.
E. SUMMARY
This chapter has attempted to check the accuracy of the
model as compared to current cost estimates and explain any
inaccuracies. It has also discussed some issues associated
with the use of this model with the F/A-18 engine system, and
forecasted the resulting "I" level material costs based on
recent service life changes. This alternative use of the
model is beyond the designer's original intentions, but recent
funding problems in the engine maintenance system are severe
enough to warrant a search for a solution. Inability to
79
forecast funding levels adversely impacts fleet readiness and
reduces the operations and maintenance funds available for
other programs.
Also, the model was built to highlight high cost areas of
an entire aircraft maintenance system and was not specifically
designed for an engine system. As shown in Chapter IV, the
analysis of high cost areas provides a valuable insight, but
use as a cost estimation tool is of questionable reliability.
The author's attempt to forecast a future funding level was a
marginal success. Input data was altered and a forecast
produced, but this forecast cannot be validated. Construction
of the data base gives reason to suspect an underestimation,
but material cost factors could cause an overestimation. A
relative strength of the two factors cannot be inferred from
the available data.
80
VI. SUMMARY, CONCLUSIONS AND RECOMMENDATIONS
This chapter summarizes the entire research effort,
discusses the author's concluding thoughts and offers
suggestions for further research. Areas of discussion will
include the Dependability Cost Model's applicability to the
Navy's F/A-18 and Naval Aviation in general. The possibility
of designing future models specifically tailored for military
aviation and their use in the reduction of aircraft
maintenance system costs is also addressed. In closing,
recommendations will be made on further research in the area
of aircraft maintenance system cost reductions.
A. SUMMARY
After a brief mention of the funding problems associated
with F/A-18 engine maintenance system, the author proposed to
examine an aircraft maintenance system cost model developed by
the Boeing Corporation and determine its applicability toNaval aviation maintenance. Benefits derived from the
successful use of this model could be increased economic
efficiency of the aircraft maintenance system or possibly atool for estimating future funding requirements. A secondary
goal of this research was to determine whether the Navy canuse this type of model with the existing maintenance
information resources.
Chapter II provided a detailed look at the model,
explaining the required inputs and methods of manipulation
used by the model. The complexity of this model was shownduring this chapter and much of its potential was not used inthis research effort, specifically, the route structure
showing the cost impacts due to multiple maintenance locations
and the spares holding cost element estimating the inventory
costs associated with the maintenance system. The route
structure is not viewed as a significant loss of value to this
research because the operations of the F/A-18 normally involve
81
a single location. However, the lack of data forcing the
author to exclude spares holding costs from the scope of this
research is a severe deficiency.
The construction of the data base for the F/A-18 and the
information sources used are described in Chapter III.
Information within the Navy's maintenance system was more than
adequate with respect to component reliability and labor
expended, but material cost data was not obtained for the
entire fleet. Gathering reliability data was constrained by
time rather than the availability of information. Material
cost data was difficult to find, and the data used by this
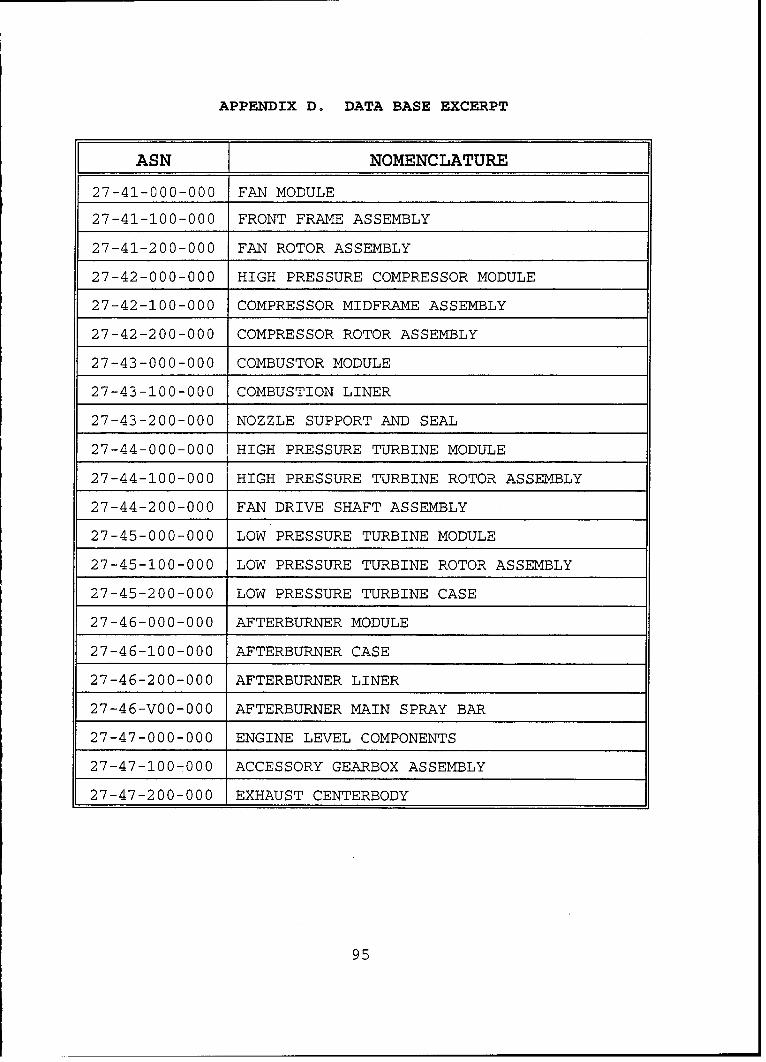
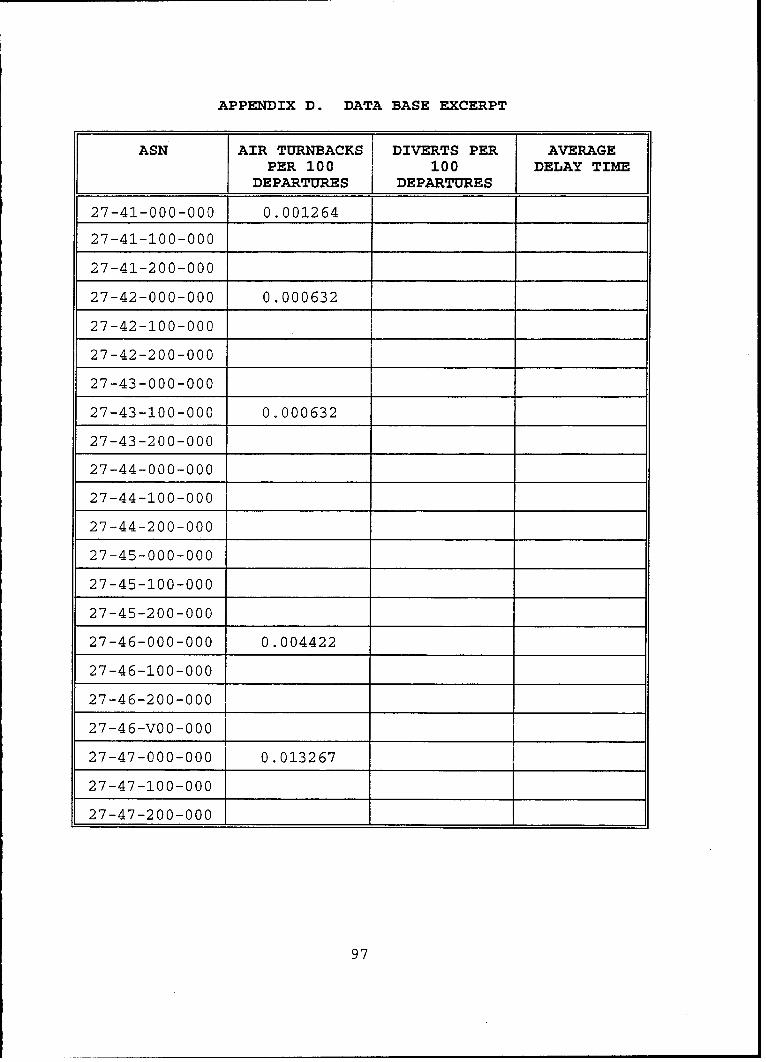
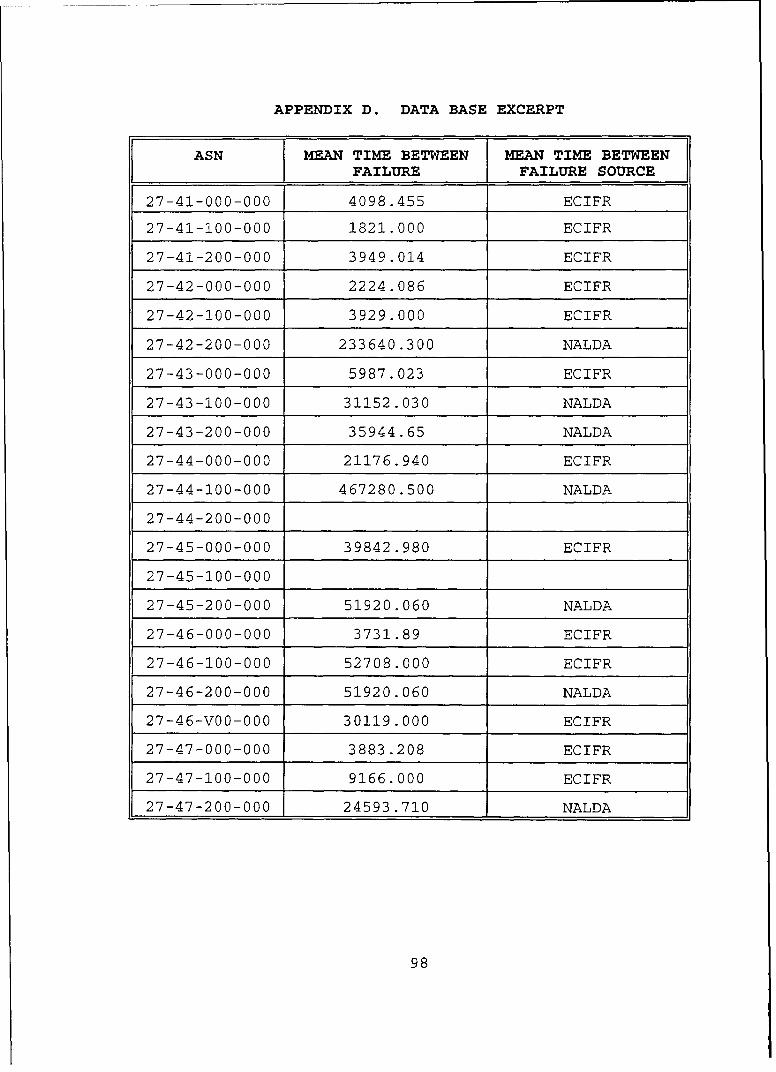
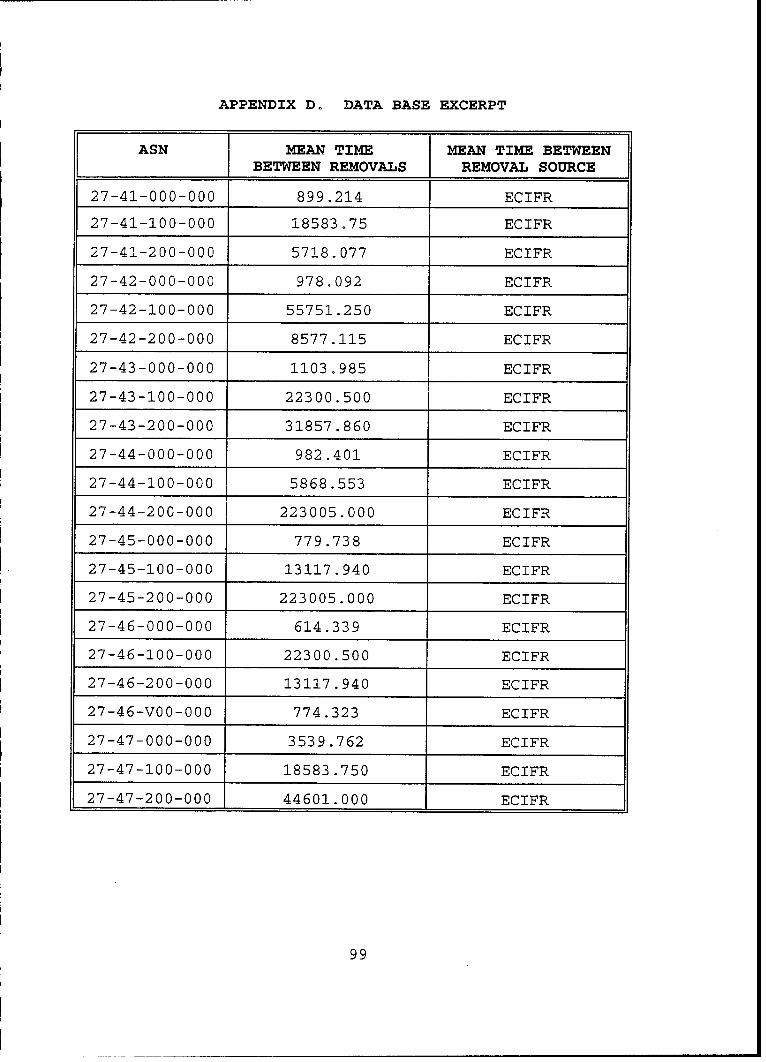
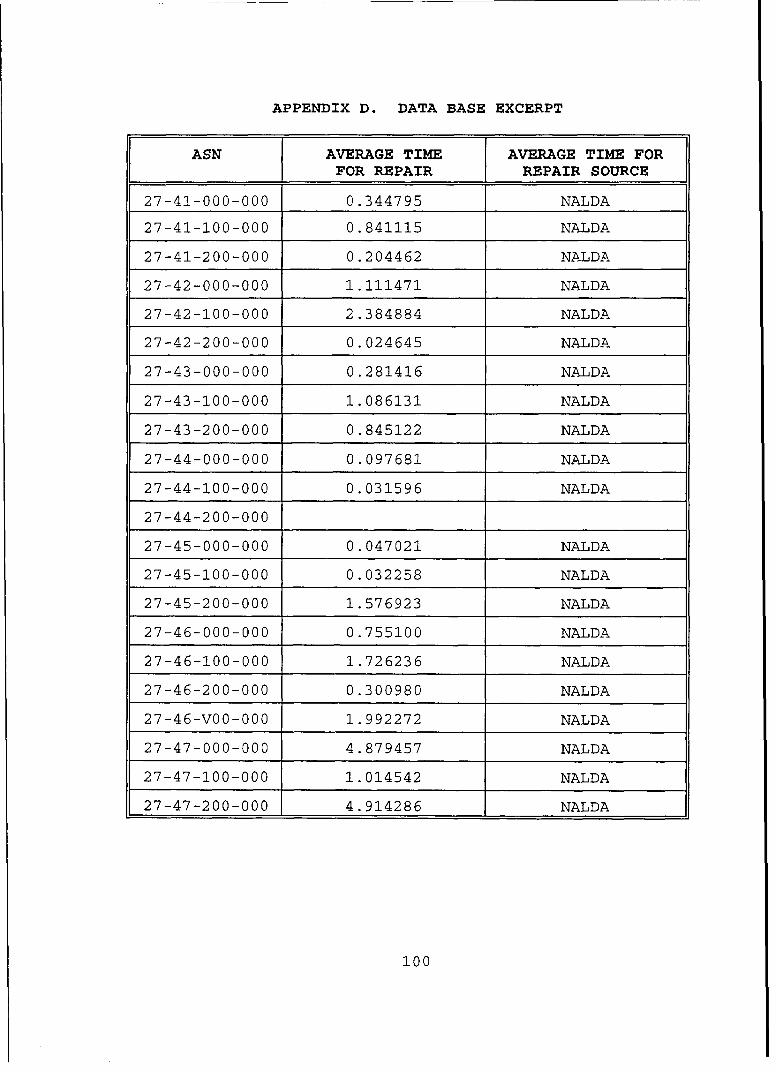
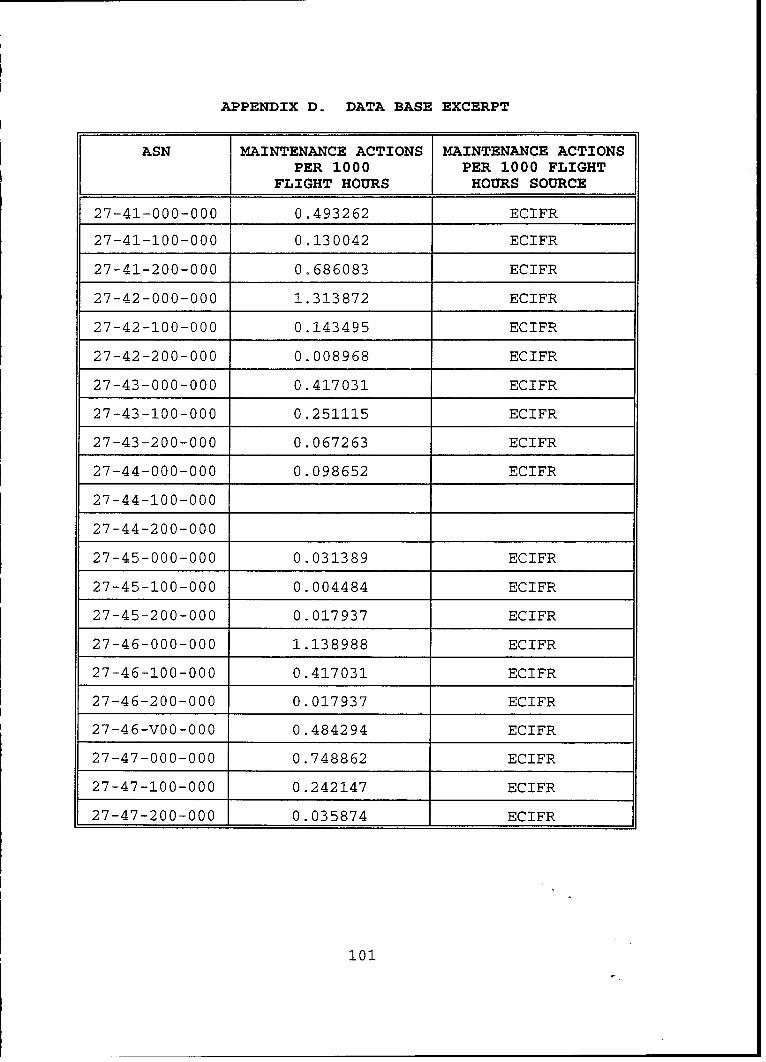
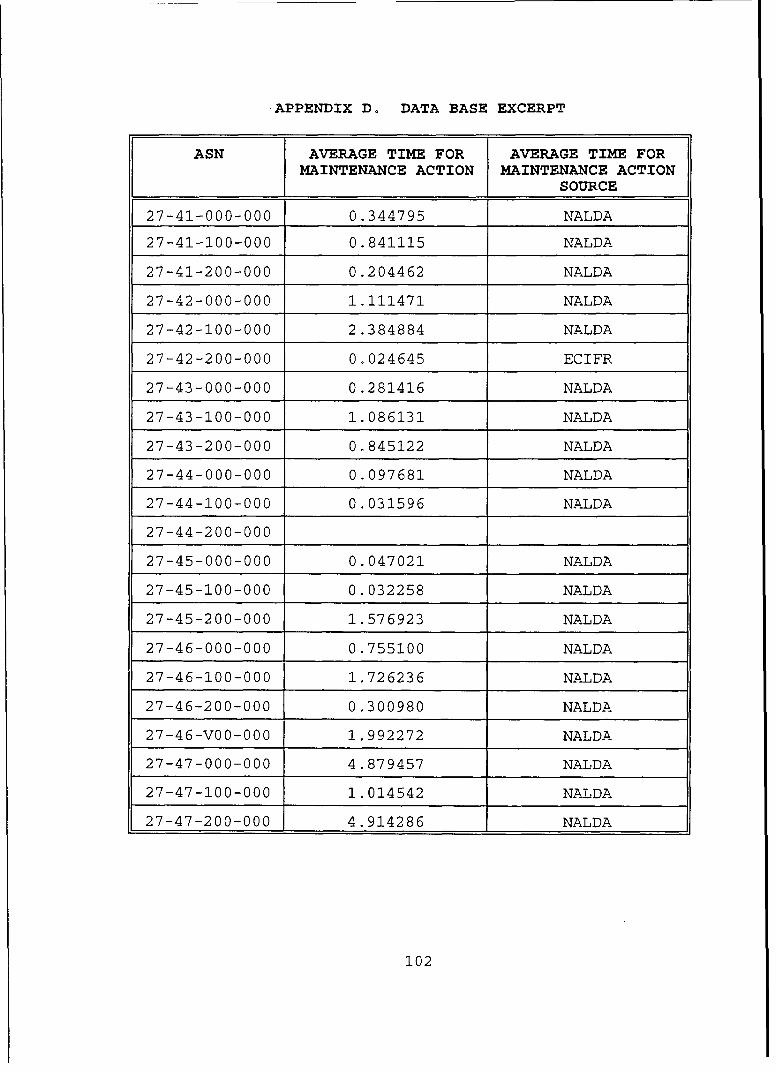
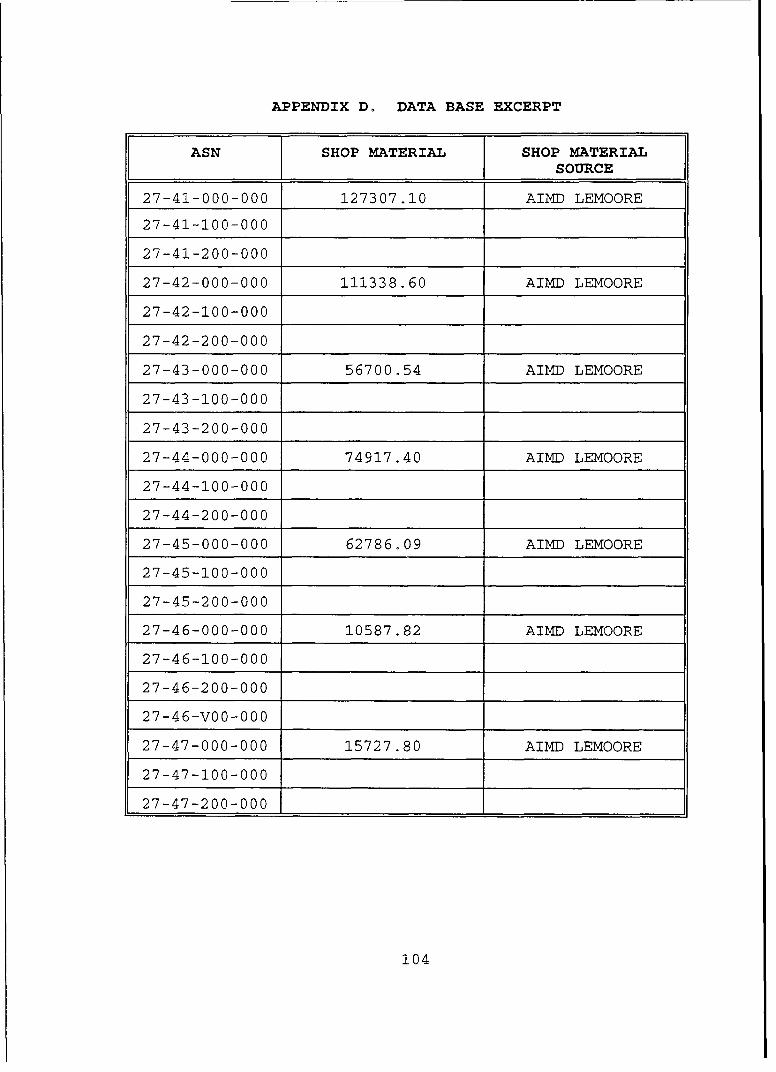
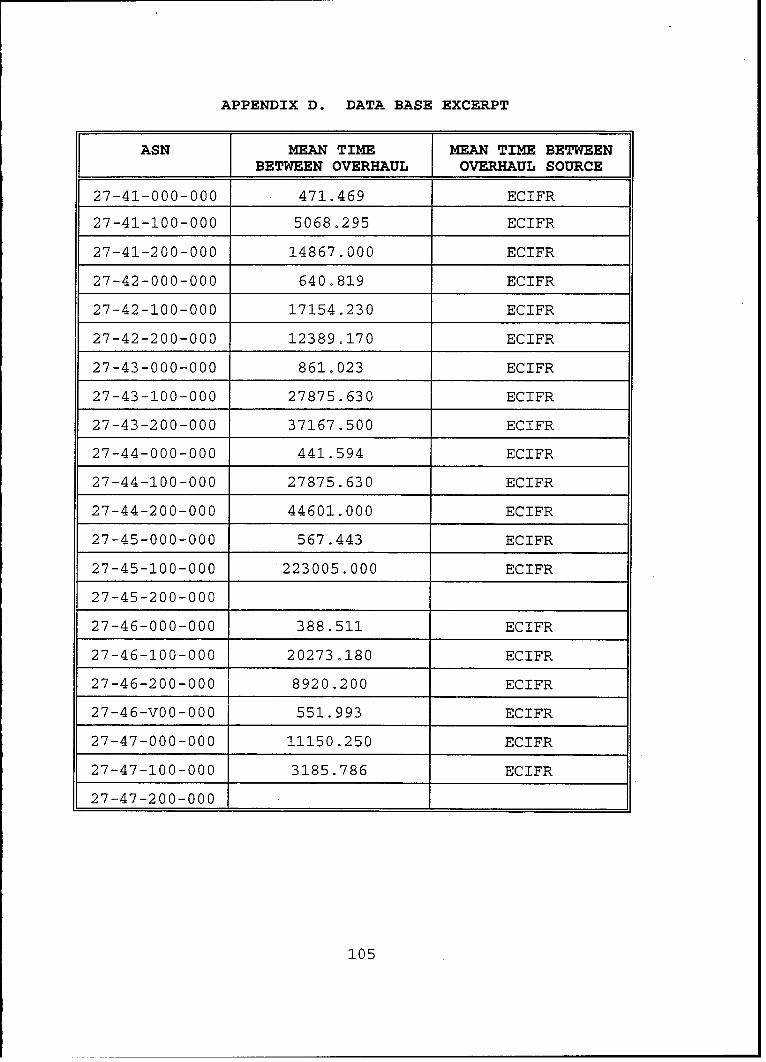
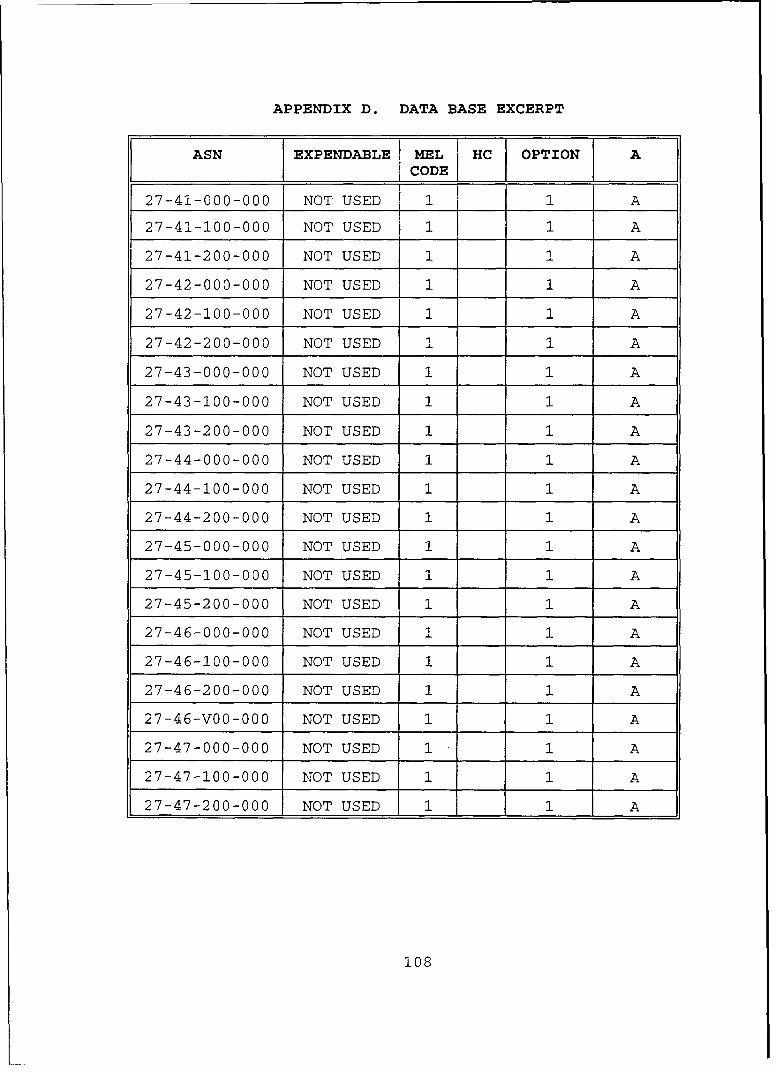
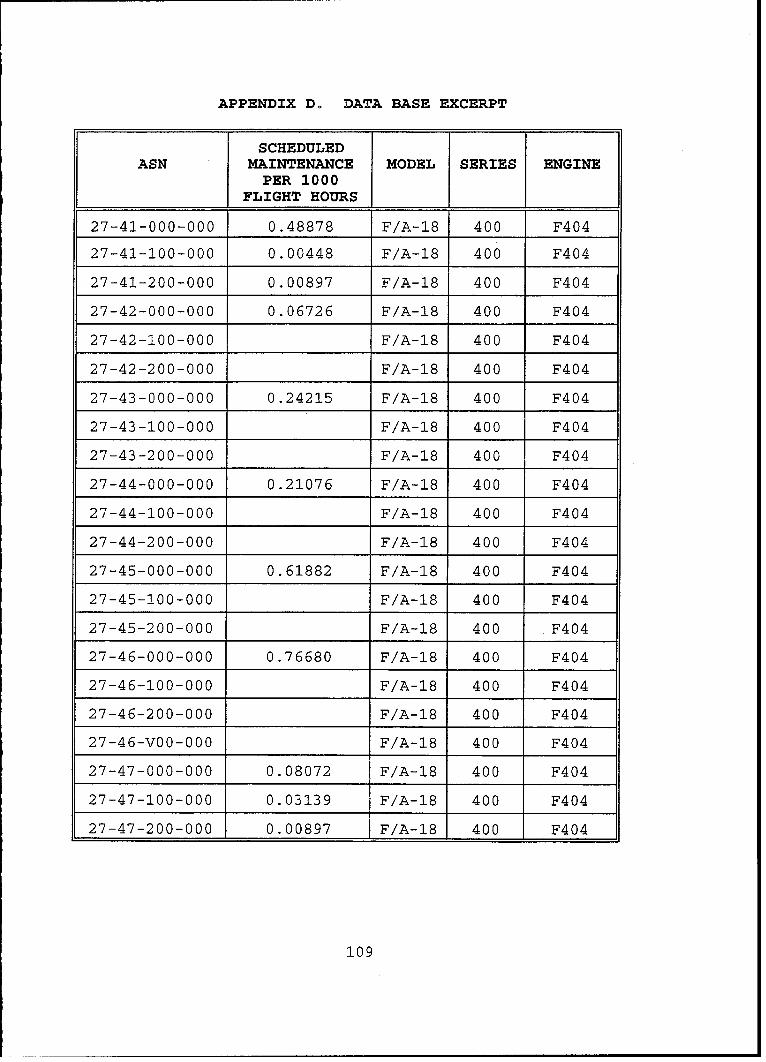
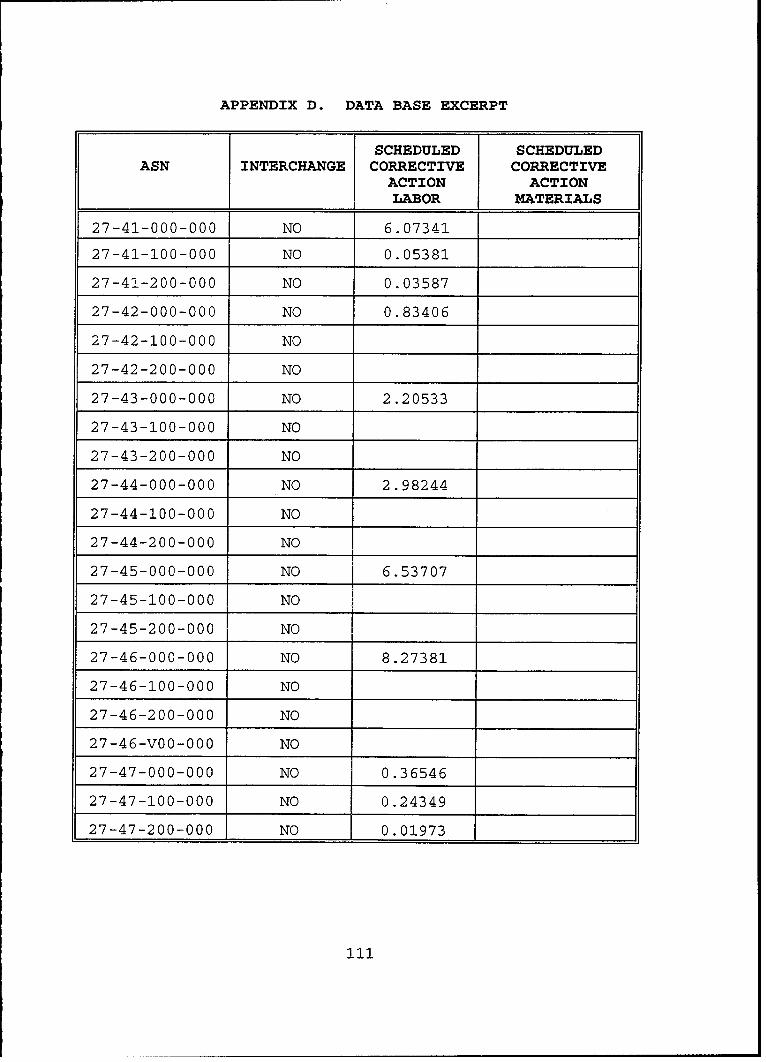
project was narrowly focused on one AIMD facility. Appendix
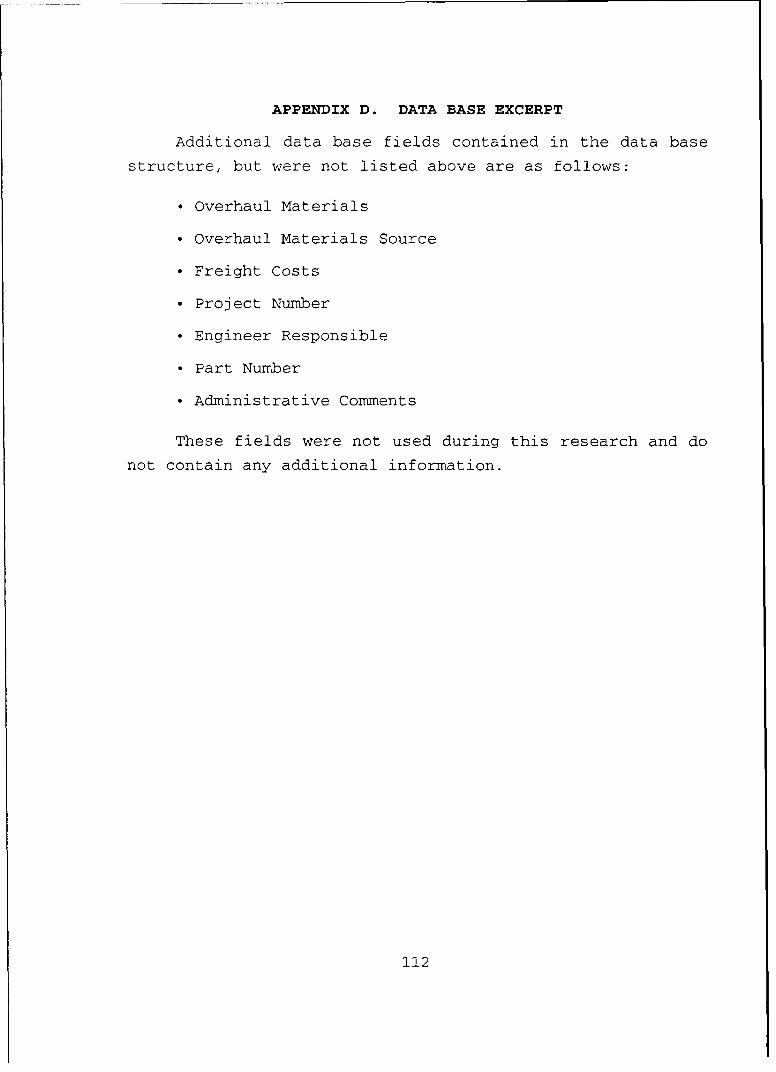
D contains a portion of the data base constructed. This data
base sample contains information on the six major modules of
the engine and other sample WUCs with each module.
A demonstration of the model's output was given in
Chapter IV. The first calculation was a dependability cost
estimate for the entire fleet of aircraft. This cost estimate
contained "0" and "I" level labor and "I" level materials for
a fleet of 595 F/A-18 aircraft and was estimated to be
$238,655,618.
Initially total engine maintenance system costs were
separated into components of total ('0" and "I" level) labor
and "I" level materials. This showed the "I" level material
costs to be the most significant contributor to the total cost
picture. According to the data used, 92.4 percent of the
total costs were incurred from "I" level material consumption.
Total labor accounted for 7.6 percent of the total costs.
A further breakdown of the labor costs separated labor into
the components of "0" level, "I" level and cannibalization
labor. The resulting percentages were 26.7 percent, 64.6
percent and 8.7 percent, respectively.
The cost analysis then turned to the six major engine
modules. Total costs were determined for each module, and the
82
fan module proved to be the highest cost item. Separating the
costs of each module into labor and material components showed
the fan module responsible for 29.2 percent of total "I" level
material costs and the afterburner module absorbing 47.5
percent of the "0" and "I" level labor costs.
A final portion of Chapter IV demonstrated a detailed
analysis of maintenance costs associated with the afterburner
module. Examination of labor and material components of the
total costs showed 52.3 percent resulting from the labor
expended on this module. Labor costs were then broken down by
WUC into the annual costs per airplane. This showed the
afterburner main spray bar accounting for 31.2 percent of the
total labor costs incurred by this module. Information such
as this indicates how a particular part can absorb an
abnormally high percentage of the total costs, but does not
necessarily indicate a problem. A part may require such
maintenance for reliable operation, but this information could
allow a decision maker to target specific areas for cost
reduction efforts.
Chapter V discussed issues adversely affecting the use of
this model with both the Navy's maintenance organization and
the F/A-18. A fundamental problem of the differing
organizational structures prevents this model from being
applied to the total Naval maintenance organization. As
designed, the DCM has enormous potential to highlight a piece
of the Navy's maintenance organization, but three maintenance
levels exceed the capability of a model designed for only two
maintenance levels.
Problems associated with the use of this model on the
engine system of the F/A-18 were also addressed. Rapidly
changing services lives and the use of flight time averages
are the most severe restrictions in this area. Module service
lives based on engine fatigue criteria do not relate to a
constant flight time between removals. Varying intensities of
83
the missions flown can cause a large error in an average taken
over a short period, but service life changes prevent long
term averages from being precise. Any distortion of the input
data will affect the final output.
An alternative use of the model as a budget forecasting
tool was demonstrated in the final portion of Chapter V. The
author attempted to validate the model's output through a
comparison with AIMD NAS Lemoore's FY94 budget estimate.
Model inputs were altered to conform with the actual number of
aircraft supported by AIMD NAS Lemoore. The model's estimate
differed from the FY94 mid-year budget estimate by 4.7
percent. This inaccuracy can be partially explained by the
service life reductions that occurred during and after the
period represented by data collection. After altering the
input data for service life changes that have occurred in
1994, a final estimate was made for FY95 "I" level material
costs. An estimate of $130,149,966 was calculated, but a
validation of this estimate is not possible with the data
contained in this research effort.
B. CONCLUSIONS
Through examination of the data actually collected, it is
apparent that current maintenance information systems used by
the Navy hold the component reliability data to build a data
base without altering the variable definitions. However, the
material cost data would be difficult to obtain on a broad
scale. Specific data on a particular maintenance entity, such
as that used from the AIMD NAS Lemoore, was not difficult to
obtain, but may not apply to all AIMD facilities. Therefore,
the use of this model to forecast the funding requirements for
the Navy as a whole would be grossly inaccurate. However, the
highlighting of costs for a particular maintenance entity
could provide valuable information.
The structure of this model is not well-suited for the
84
entire Naval maintenance system, because the complexity of the
Navy's maintenance organization exceeds the model's structure.
However, this structure could be useful to highlight the costs
of a specific "o" level or "I" level maintenance entity.
Combining the two levels of maintenance created the need to
redefine input variables and exclude portions of the total
maintenance system from the cost analysis.
An alternative use for the model was explored by the
author. This was an attempt to use this model as a budget
forecasting tool. The increases in annual funding
requirements driven by recent service life changes have
created a severe problem for budgetary planners, maintenance
personnel and operators of the F/A-18. Accurately forecasting
the annual funding requirements could ease the burden on the
operations and maintenance appropriation, allowing funding
resources to be applied where originally intended.
However, forecasting funding requirements for known
service life changes only addresses one half of the issue.
Long lead times required for budget submissions force planners
to estimate maintenance funding based on today's knowledge of
component service lives. Any service life reduction occurring
between budget submission and the end of the budget executionwill cause actual expenses to exceed the budgeted amount.
While this model can forecast additional funds required to
finance a known change, it cannot be used to foresee future
service life changes. Thus, the more difficult portion of
this problem, predicting a service life change, will continue
to plague the F/A-18 community.
C. RECOMMENDATIONS
On several occasions the author has discussed the
differences between the Navy's maintenance organization and
the maintenance structure designed into Boeing's DCM. The two
are drastically different and the DCM is not capable of
85
calculating the total maintenance system costs for the Navy's
maintenance organization. Despite this limitation there are
pieces of the Navy's maintenance organization that could
benefit from the use of this model.
An application of this model to a single 110" level
activity could provide valuable information to that activity.
The model's structure of line and shop maintenance could be
related directly to the line division and other work centers
of a single squadron. Information taken from the use of this
model could be used to highlight areas of potential cost
reduction, increasing the economic efficiency of maintenance
practices.
Another possible use of the DCM would be tracking the
practices of a single "I" level facility. This research
effort focused on a single "I" level maintenance activity for
the cost estimation example, and the estimate derived from
model calculations was close enough to be encouraging. The
data base was constructed from fleet-wide averages, and the
use of local averages for a particular activity could provide
accurate cost estimates as well as highlight areas of
potential savings.
Originally the model was designed for application to the
entire aircraft maintenance system. The scope of this project
was limited to a portion of the Navy's maintenance system and
the engine system of one aircraft. Further research applying
the model to the entire F/A-18 or other Naval aircraft could
highlight maintenance system costs from a broader perspective.
Results of this effort showed the fan module as the primary
driver of engine material costs and the afterburner module
driving the engine labor costs. Expanding the picture to the
entire aircraft may highlight additional points of interest
for redesign or a needed change of current maintenance
practices.
Several deficiencies of the DCM as related to Navy
86
maintenance were mentioned throughout the text of this
project. The author feels it would be possible to construct
a model correcting these deficiencies. Some additions would
be incorporation of another level of maintenance activity,
material costs for all maintenance levels, additional labor
rates peculiar to each maintenance level and eliminating the
schedule interruption cost element. This would provide a more
realistic simulation of the Navy's maintenance organization,
but the added complexity could render a larger modelpractically useless. The DCM is well designed and the author
found it relatively easy to use despite the lack of any priorknowledge of Paradox programs. Preserving the user-friendly
aspect of a model should be a primary consideration in the
construction of any similar models.
The greatest deficiency in this research effort was the
inability to use the spares holding cost element of the model.Data collection, constrained by the time allowed for this
project prevented the author from analyzing the relationship
between spares inventory costs and cannibalization maintenance
costs. Cannibalization is a volatile issue in Navymaintenance due to its impact on readiness, but what is the
true cost of cannibalization? The analysis in Chapter IVshowed cannibalization labor costs to be 8.7 percent of the
total '0" and "I" level labor costs, but can this expenditure
be avoided through an increased spare parts inventory? Also,would it be economically efficient to increase inventories to
preclude all occurrences of cannibalization? The addition of
material costs of cannibalization could substantially increase
the total cannibalization costs, but data was not available to
calculate these material costs. In Chapter III the author
theorized that an increase in spares inventory could reduce
cannibalization, but at what point do added inventory costs
exceed the benefits derived from decreased cannibalization?
This model can be used to calculate cannibalization
87
maintenance costs and the spares holding costs. Through
manipulation of the data inputs, the number of spares on hand
can be set to levels actually held in the Navy's supply
system. Thus, an estimate of the actual spares inventory
costs could be compared to the cannibalization maintenance
costs. Adjustments can then be made to the inventory values
showing the additional costs of each unit added to the
inventory. The model will not reduce the cannibalization rate
based on an increasing spares inventory, but the necessary
reduction in the cannibalization rate to economically
compensate for the increased inventory costs could be
calculated. The addition of a statistical model predicting a
behavior of the cannibalization rate could then provide a
point of minimum total costs to the system, achieving an
economically efficient balance between the increased inventory
costs and decreased cannibalization maintenance costs.
Another difficulty would be establishing the cost of all
potential benefits of decreased cannibalization. If increased
readiness is considered as part of the benefit derived from
decreased cannibalization, the total economic benefit would be
difficult to calculate. This would require placing a dollar
value on readiness and this could be very difficult. Defining
an exact unit of readiness as well as a cost per unit of
readiness would be required. At best, this value would
contain some subjectivity and the higher the monetary value of
readiness, the greater its impact on the above analysis.
88
APPENDIX A. TOTAL ENGINE MODULE COSTS
The Table below contains cost data as calculated by
Boeing's Dependability Cost Model. These costs include "O"level labor, "I" level labor and "I" level materialreplacement costs. Costs are given for each major enginemodule and the percentage of overall engine costs itrepresents. Calculations were based on a fleet of 595 F/A-18
aircraft.
ENGINE MODULE TOTAL MODULE % OF OVERALL
MAINTENANCE COSTS MAINTENANCE
Gen. Engine WUC $2,226,323 0.9%
Fan Module $65,698,314 27.5%
HPC Module $52,794,628 22.1%
Combustion Module $23,675,461 9.9%
HPT Module $35,489,429 14.9%
LPT Module $38,626,881 16.2%
A/B Module $16,430,077 6.9%
Accessories $3,714,503 1.6%
TOTALS $238,655,616 [ 100.0%
89
90
APPENDIX B. ENGINE MODULE "I" LEVEL MATERIAL COSTS
The Table below contains cost data as calculated by
Boeing's Dependability Cost Model. These costs include "I"
level material replacement costs. Costs are given for each
major engine module and the percentage of overall "I" level
material costs it represents. Calculations were based on a
fleet of 595 F/A-18 aircraft.
ENGINE "I" LEVEL % OF OVERALL "I"
MODULE MATERIAL COSTS LEVEL MATERIALCOSTS
Gen. Engine WUC $00 0I0%
Fan Module $64,357,638 29.1%
HPC Module $51,745,932 23.5%
Combustion Module $23,347,172 10.6%
HPT Module $34,666,044 15.7%
LPT Module $36,603,718 16.6%
A/B Module $7,834,457 3.6%
Accessories $2,019,781 0.9%
TOTALS $220,564,741 100.0%
91
92
APPENDIX C. ENGINE MODULE LABOR COSTS
The Table below contains cost data as calculated by
Boeing's Dependability Cost Model. These costs include "0"
level and "I" level labor costs. Costs are given for each
major engine module and the percentage of overall labor costs
it represents. Calculations were based on a fleet of 595 F/A-
18 aircraft.
ENGINE TOTAL LABOR % OF OVERALL
MODULE COSTS LABOR COSTS
Gen. Engine WUC $2,226,323 12.3%
Fan Module $1,340,676 7.4%
HPC Module $1,048,697 5.8%
Combustion Module $328,289 1.8%
HPT Module $823,386 4.6%
LPT Module $2,023,164 11.2%
A/B Module $8,595,620 47.5%
Accessories $1,694,722 9.4%
TOTALS $18,080,877 100.0%]
93
94
APPENDIX D. DATA BASE EXCERPT
ASN NOMENCLATURE
27-41-000-000 FAN MODULE
27-41-100-000 FRONT FRAME ASSEMBLY
27-41-200-000 FAN ROTOR ASSEMBLY
27-42-000-000 HIGH PRESSURE COMPRESSOR MODULE
27-42-100-000 COMPRESSOR MIDFRAME ASSEMBLY
27-42-200-000 COMPRESSOR ROTOR ASSEMBLY
27-43-000-000 COMBUSTOR MODULE
27-43-100-000 COMBUSTION LINER
27-43-200-000 NOZZLE SUPPORT AND SEAL
27-44-000-000 HIGH PRESSURE TURBINE MODULE
27-44-100-000 HIGH PRESSURE TURBINE ROTOR ASSEMBLY
27-44-200-000 FAN DRIVE SHAFT ASSEMBLY
27-45-000-000 LOW PRESSURE TURBINE MODULE
27-45-100-000 LOW PRESSURE TURBINE ROTOR ASSEMBLY
27-45-200-000 LOW PRESSURE TURBINE CASE
27-46-000-000 AFTERBURNER MODULE
27-46-100-000 AFTERBURNER CASE
27-46-200-000 AFTERBURNER LINER
27-46-VOO-000 AFTERBURNER MAIN SPRAY BAR
27-47-000-000 ENGINE LEVEL COMPONENTS
27-47-100-000 ACCESSORY GEARBOX ASSEMBLY
27-47-200-000 EXHAUST CENTERBODY
95
APPENDIX D. DATA BASE EXCERPT
ASN QUANTITY DELAYS CANCELSPER PER 100 PER 100
AIRCRAFT DEPARTURES DEPARTURES
27-41-000-000 2 0.001264
27-41-100-000 2 0.000632
27-41-200-000 2
27-42-000-000 2 0.001264
27-42-100-000 2
27-42-200-000 2
27-43-000-000 2
27-43-100-000 2
27-43-200-000 2
27-44-000-000 2
27-44-100-000 2
27-44-200-000 2
27-45-000-000 2
27-45-100-000 2
27-45-200-000 2
27-46-000-000 2 0.003159
27-46-100-000 2
27-46-200-000 2
27-46-VOO-000 2 0.000632
27-47-000-000 2 0.004422
27-47-100-000 2 0.000632
27-47-200-000 2
96
APPENDIX D. DATA BASE EXCERPT
ASN AIR TURNBACKS DIVERTS PER AVERAGEPER 100 100 DELAY TIME
DEPARTURES DEPARTURES
27-41-000-000 0.001264
27-41-100-000
27-41-200-000
27-42-000-000 0.000632
27-42-100-000
27-42-200-000
27-43-000-000
27-43-100-000 0.000632
27-43-200-000
27-44-000-000
27-44-100-000
27-44-200-000
27-45-000-000
27-45-100-000
27-45-200-000
27-46-000-000 0.004422
27-46-100-000
27-46-200-000
27-46-VOO-000
27-47-000-000 0.013267
27-47-100-000
27-47-200-000
97
APPENDIX D. DATA BASE EXCERPT
ASN MEAN TIME BETWEEN MEAN TIME BETWEENFAILURE FAILURE SOURCE
27-41-000-000 4098.455 ECIFR
27-41-100-000 1821.000 ECIFR
27-41-200-000 3949.014 ECIFR
27-42-000-000 2224.086 ECIFR
27-42-100-000 3929.000 ECIFR
27-42-200-000 233640.300 NALDA
27-43-000-000 5987.023 ECIFR
27-43-100-000 31152.030 NALDA
27-43-200-000 35944.65 NALDA
27-44-000-000 21176.940 ECIFR
27-44-100-000 467280.500 NALDA
27-44-200-000
27-45-000-000 39842.980 ECIFR
27-45-100-000
27-45-200-000 51920.060 NALDA
27-46-000-000 3731.89 ECIFR
27-46-100-000 52708.000 ECIFR
27-46-200-000 51920.060 NALDA
27-46-VOO-000 30119.000 ECIFR
27-47-000-000 3883.208 ECIFR
27-47-100-000 9166.000 ECIFR
27-47-200-000 24593.710 NALDA
98
APPENDIX D. DATA BASE EXCERPT
ASN MEAN TIME MEAN TIME BETWEENBETWEEN REMOVALS REMOVAL SOURCE
27-41-000-000 899.214 ECIFR
27-41-100-000 18583.75 ECIFR
27-41-200-000 5718.077 ECIFR
27-42-000-000 978.092 ECIFR
27-42-100-000 55751.250 ECIFR
27-42-200-000 8577.115 ECIFR
27-43-000-000 1103.985 ECIFR
27-43-100-000 22300.500 ECIFR
27-43-200-000 31857.860 ECIFR
27-44-000-000 982.401 ECIFR
27-44-100-000 5868.553 ECIFR
27-44-200-000 223005.000 ECIFR
27-45-000-000 779.738 ECIFR
27-45-100-000 13117.940 ECIFR
27-45-200-000 223005.000 ECIFR
27-46-000-000 614.339 ECIFR
27-46-100-000 22300.500 ECIFR
27-46-200-000 13117.940 ECIFR
27-46-V00-000 774.323 ECIFR
27-47-000-000 3539.762 ECIFR
27-47-100-000 18583.750 ECIFR
27-47-200-000 44601.000 ECIFR
99
APPENDIX D. DATA BASE EXCERPT
ASN AVERAGE TIME AVERAGE TIME FORFOR REPAIR REPAIR SOURCE
27-41-000-000 0.344795 NALDA
27-41-100-000 0.841115 NALDA
27-41-200-000 0.204462 NALDA
27-42-000-000 1.111471 NALDA
27-42-100-000 2.384884 NALDA
27-42-200-000 0.024645 NALDA
27-43-000-000 0.281416 NALDA
27-43-100-000 1.086131 NALDA
27-43-200-000 0.845122 NALDA
27-44-000-000 0.097681 NALDA
27-44-100-000 0.031596 NALDA
27-44-200-000
27-45-000-000 0.047021 NALDA
27-45-100-000 0.032258 NALDA
27-45-200-000 1.576923 NALDA
27-46-000-000 0.755100 NALDA
27-46-100-000 1.726236 NALDA
27-46-200-000 0.300980 NALDA
27-46-VOO-000 1.992272 NALDA
27-47-000-000 4.879457 NALDA
27-47-100-000 1.014542 NALDA
27-47-200-000 4.914286 NALDA
100
APPENDIX D. DATA BASE EXCERPT
ASN MAINTENANCE ACTIONS MAINTENANCE ACTIONSPER 1000 PER 1000 FLIGHT
FLIGHT HOURS HOURS SOURCE
27-41-000-000 0.493262 ECIFR
27-41-100-000 0.130042 ECIFR
27-41-200-000 0.686083 ECIFR
27-42-000-000 1.313872 ECIFR
27-42-100-000 0.143495 ECIFR
27-42-200-000 0.008968 ECIFR
27-43-000-000 0.417031 ECIFR
27-43-100-000 0.251115 ECIFR
27-43-200-000 0.067263 ECIFR
27-44-000-000 0.098652 ECIFR
27-44-100-000
27-44-200-000
27-45-000-000 0.031389 ECIFR
27-45-100-000 0.004484 ECIFR
27-45-200-000 0.017937 ECIFR
27-46-000-000 1.138988 ECIFR
27-46-100-000 0.417031 ECIFR
27-46-200-000 0.017937 ECIFR
27-46-V00-000 0.484294 ECIFR
27-47-000-000 0.748862 ECIFR
27-47-100-000 0.242147 ECIFR
27-47-200-000 0.035874 ECIFR
101
.APPENDIX D. DATA BASE EXCERPT
ASN AVERAGE TIME FOR AVERAGE TIME FORMAINTENANCE ACTION MAINTENANCE ACTION
SOURCE
27-41-000-000 0.344795 NALDA
27-41-100-000 0.841115 NALDA
27-41-200-000 0.204462 NALDA
27-42-000-000 1.111471 NALDA
27-42-100-000 2.384884 NALDA
27-42-200-000 0.024645 ECIFR
27-43-000-000 0.281416 NALDA
27-43-100-000 1.086131 NALDA
27-43-200-000 0.845122 NALDA
27-44-000-000 0.097681 NALDA
27-44-100-000 0.031596 NALDA
27-44-200-000
27-45-000-000 0.047021 NALDA
27-45-100-000 0.032258 NALDA
27-45-200-000 1.576923 NALDA
27-46-000-000 0.755100 NALDA
27-46-100-000 1.726236 NALDA
27-46-200-000 0.300980 NALDA
27-46-VOO-000 1.992272 NALDA
27-47-000-000 4.879457 NALDA
27-47-100-000 1.014542 NALDA
27-47-200-000 4.914286 NALDA
102
APPENDIX D. DATA BASE EXCERPT
ASN SHOP LABOR HOURS SHOP LABORHOURS SOURCE
27-41-000-000 14.90301 NALDA
27-41-100-000 6.748432 NALDA
27-41-200-000 6.526769 NALDA
27-42-000-000 18.17415 NALDA
27-42-100-000 6.701163 NALDA
27-42-200-000 26.46825 NALDA
27-43-000-000 11.16350 NALDA
27-43-100-000 6.924574 NALDA
27-43-200-000 9.307317 NALDA
27-44-000-000 15.04860 NALDA
27-44-100-000 12.62528 NALDA
27-44-200-000 13.78966 NALDA
27-45-000-000 16.21912 NALDA
27-45-100-000 14.48710 NALDA
27-45-200-000 3.676923 NALDA
27-46-000-000 15.47913 NALDA
27-46-100-000 6.604183 NALDA
27-46-200-000 13.61078 NALDA
27-46-VOO-000 73.71077 NALDA
27-47-000-000 1.298302 NALDA
27-47-100-000 18.45943 NALDA
27-47-200-000 0.832143 NALDA
103
APPENDIX D. DATA BASE EXCERPT
ASN SHOP MATERIAL SHOP MATERIALSOURCE
27-41-000-000 127307.10 AIMD LEMOORE
27-41-100-000
27-41-200-000
27-42-000-000 111338.60 AIMD LEMOORE
27-42-100-000
27-42-200-000
27-43-000-000 56700.54 AIM]D LEMOORE
27-43-100-000
27-43-200-000
27-44-000-000 74917.40 AIMD LEMOORE
27-44-100-000
27-44-200-000
27-45-000-000 62786.09 AIMD LEMOORE
27-45-100-000
27-45-200-000
27-46-000-000 10587.82 AIMD LEMOORE
27-46-100-000
27-46-200-000
27-46-VOO-000
27-47-000-000 15727.80 AIMD LEMOORE
27-47-100-000
27-47-200-000
104
APPENDIX D. DATA BASE EXCERPT
ASN bMEAN TIME MEAN TIME BETWEENBETWEEN OVERHAUL OVERHAUL SOURCE
Additional data base fields contained in the data base
structure, but were not listed above are as follows:
"• Overhaul Materials
"• Overhaul Materials Source
"• Freight Costs
"* Project Number
"* Engineer Responsible
"• Part Number
"* Administrative Comments
These fields were not used during this research and do
not contain any additional information.
112
LIST OF REFERENCES
1. Dependability Cost Model Guide For Use With ParadoxVersion 4.0. M. Koehler, June 1993, p. 6.
2. Aviation Week and Space Technology, "Boeing Develops NewTool to Analyze Aircraft Costs," December 1993, p. 43.
3. Measuring the Costs of Dependability, Boeing CompanyPresentation, Dave Doring, 1993, p. 3.
4. Dependability Cost Model Guide For Use With Paradox
Version 4.0. M. Koehler, June 1993, p. 24.
5. Ibid., p. 33.
6. Measuring the Costs of Dependability, Boeing CompanyPresentation, Dave Doring, 1993, p. 4.
7. Telephone conversation between the author and MattKoehler from the Boeing Company, Designer of theDependability Cost Model, September 1, 1994.
8. Engine Component Improvement Feedback Reports for F/A-18A, F/A-18B, F/A-18C and F/A-18D, Work Unit Code byOrganizational Level Action Taken Code, October 92-September 93.
9. Dependability Cost Model Guide For Use With ParadoxVersion 4.0. M. Koehler, June 1993, p. 12.
10. Engine Component Improvement Feedback Reports for F/A-18A, F/A-18B, F/A-18C and F/A-18D, Cannibalization SummaryBy Work Unit Code, October 92-September 93.
11. Dependability Cost Model Guide For Use With ParadoxVersion 4.0. M. Koehler, June 1993, p. 40.
12. Memorandum from AIMD Officer, Naval Air StationLemoore, Ca. to Commander Air Forces Pacific (N421), F404-GE-400 Engine Module Costs Data Call, February 17, 1994.
13. Engine Component Improvement Feedback Reports for theF/A-18A, F/A-18B, F/A-18C and F/A-18D, Maintenance Actionsand Manhours by Work Unit Code, October 92-September 93.
14. Engine Component Improvement Feedback Reports for theF/A-18A, F/A-18B, F/A-18C and F/A-18D, Maintenance Manhoursper Maintenance Action and Flight Hour, October 92-September93.
113
15. Reliability/Maintainability Analysis Report, NumberR0733, Naval Aviation Logistics Data Analysis, January 92-December 93, August 10, 1994.
16. Flight Hour and Inventory Utilization Report, NumberR0710, Naval Aviation Logistics Data Analysis, January 92-December 93, August 10, 1994.
17. Engine Component Improvement Feedback Reports for theF/A-18A, F/A-18B, F/A-18C and F/A-18D, Work Unit Code byOrganizational Level Action Taken Code, October 92-September93.
18. Engine Component Improvement Feedback Reports for theF/A-18A, F/A-18B, F/A-18C and F/A-18D, Work Unit Code byIntermediate Level Action Taken Code, October 92-September93.
19. Engine Component Improvement Feedback Reports for theF/A-18A, F/A-18B, F/A-18C and F/A-18D, Maintenance Manhoursper Maintenance Action and Flight Hour, October 92-September93.
20. Repair Cycle Data Reports, Aviation IntermediateMaintenance Department, Naval Air Station Lemoore,California, December 93-July 94.
21. Equipment Condition Analysis, Number R0710, FlightActivity and Inventory Utilization, NALDA Data Base, January92-December 93, August 10, 1994.
22. Telephone conversation between the author and Mr. AlanDoermann from the Naval Center for Cost Analysis (NCA-61),August 24, 1994.
23. Naval Supply System Publication 553, 1983, p. 36.
24. Executive Office of the President, Office of Managementand Budget, Washington, D.C., Circular A-94, Revised,Guidelines and Discount Rates for Benefit-Cost Analysis ofFederal Programs, October 29, 1992, p. 9.
25. Department of the Navy, Office of the Comptroller,NAVCOMPT Notice 7111, Guidance for the Preparation andSubmission of FY 1995 Budget Estimates for the Department ofthe Navy (DON) Budget Review, April 23, 1993, Enclosure (2),p. 1.
26. Memorandum from AIMD Officer, NAS Lemoore to CommandNaval Air Forces Pacific (N421), Subject: F404-GE-400Engine Module Cost Data Call, February 17, 1994.
114
27. Ibid., p. 1.
28. Conversation with ADC Bowers, Aviation IntermediateMaintenance Department, Naval Air Station Lemoore, CA.,August 26, 1994.
29. Telephone conversation between the author and LCDRMartin Jones, Aviation Intermediate Maintenance Department,Naval Air Station Lemoore, CA., September 19,1994.
30. Naval Message from Naval Air Station Lemoore, CA., DateTime Group 021830Z FEB 94, to Commander Naval Air ForcesPacific, Subject: 94 Flight Hour Program AviationOperations and Maintenance Funding Midyear Call Data,February 2, 1994, p. 2.
31. Facsimile Transmission from Aviation IntermediateMaintenance Department, Naval Air Station Cecil Field, FL.,to Aviation Intermediate Maintenance Department, Naval AirStation Lemoore, CA., Subject: F404 Engine ProgramShortfalls, January 27, 1994, p. 2.
115
116
INITIAL DISTRIBUTION LIST
No. Copies1. Defense Technical Information Center ...... 2