78
19th Annual Midwest Swine Nutrition Conference Proceedings Indianapolis, Indiana—September 4, 2019

19th AnnualMidwestSwineNutrition ConferenceProceedings
Indianapolis, Indiana—September 4, 2019

Midwest Swine Nutrition Conference
2019 SponsorsAB Vista Feed Ingredients
ADM Animal NutritionAjinomoto Animal Nutrition
AlltechAPC
AzomiteBASF CorporationBayer CropScience
BiomatrixBoehringer Ingelheim Animal Health
Cargill Animal NutritionChr. Hansen Animal Health and Nutrition
CJ AmericaCooper Farms
CSA Animal NutritionDarling Ingredients
Diamond VDistributors Processing
DSM Nutritional ProductsDuPont/Danisco Animal Nutrition
Elanco Animal HealthEvonik-Degussa Corporation
EW NutritionFats and Proteins Research Foundation
Hamlet ProteinHubbard Feeds
International Ingredient CorporationKalmbach Feeds
KeminKent Nutrition Group
KWS Cereals USALallemand Animal Nutrition
MicronutrientsNational Pork BoardNovus International
NutriQuestPhibro Animal Health
Phileo Lesaffre Animal CarePIC North America
Provimi North AmericaPurina Animal Nutrition
Ralco NutritionThe Maschhoffs
United Animal HealthVetagro
Vita Plus CorporationZinpro Corporation
Zoetis
Appreciation is expressed to the Indiana Farm Bureau and their staff for hosting the 2019 Midwest Swine Nutrition Conference and providing the facilities for this function for the past 15 years.

Industry RepresentativesDennis Liptrap, Ralco Nutrition—Overall Chairman
Ronnie Moser, United Animal HealthCasey Bradley, DSM Nutritional Products
University of KentuckyGary Cromwell—Sponsor Recruitment, Treasurer
Merlin Lindemann, Editor of ProceedingsPurdue University
Scott Radcliffe—VideographerBrian Richert
Tip ClineUniversity of Illinois
Hans SteinJim PettigrewRyan Dilger
Michigan State UniversityDale Rozeboom
Gretchen HillThe Ohio State University
Sheila Jacoby
Setup and Printing of ProceedingsDennis Duross, Ag Communications Services,
University of Kentucky
Website Development and MaintenanceCody Ortt and Velvet Barnett
University of Kentucky
Meeting Room and FacilitiesIndiana Farm Bureau
Randy Kron, PresidentDiane Helton, Administrative Assistant
Lunch and Refreshments at BreaksAramark
Mario Puccinelli, Food Service Director
Midwest Swine Nutrition Conference
Program Committee

Midwest Swine Nutrition Conference
Schedule of Presentations
8:15 Registration
9:00 WelcomeDennis Liptrap, Ralco Nutrition
9:05 Biotechnology Processing to Produce High-quality Single Cell Proteins from Renewable Biomass: An UpdateMargareth Overland, Norwegian University of Life Sciences, Arboretveien, As. Norway
9:50 Update on Amino Acids in High Fiber Diets: Threonine and Branch Chained Ami-no AcidsHans Stein, University of Illinois
10:25 Break
11:00 The Role of Fiber in the Regulation of Brain Function: Implication for Welfare and Appetite Regulation in the PigKola Ajuwon, Purdue University
11:30 Mushroom Products in Nursery Pig DietsBrian Richert, Purdue University
12:00 Lunch
1:00 The 2018 Farm Bill—Opportunities for Animal Agriculture Lowell Randel, The Randel Group
1:45 Longitudinal Effects of Early-Life Iron Status on the Microbiota-Gut-Brain AxisRyan Dilger, University of Illinois
2:20 Break
2:50 Dextrin Soluble Fiber Alters the Piglet Microbiome and Gut HealthTim Johnson, Purdue University
3:25 Assessment of Teleological Changes in Visceral Organs from Birth to 150 kg Body WeightMerlin Lindemann, University of Kentucky
4:00 Closing Remarks

Midwest Swine Nutrition Conference
Table of Contents
Biotechnology Processing to Produce High-quality Single Cell Proteins from Renewable Biomass: An Update ...........................................................................................5Margareth Øverland
Update on Amino Acids in High Fiber Diets: Threonine and Branch Chained Amino Acids ...................................................................................................................... 11Woong B. Kwon and Hans H. Stein
The Role of Fiber in the Regulation of Brain Function: Implication for Welfare and Appetite Regulation in the Pig .............................................................................. 19Kolapo M. Ajuwon
Mushroom Products in Nursery Pig Diets ................................................................................ 31Jacob Richert, Susan Eicher, Omoanghe Isikhuemhen, Jim Nelssen, and Brian Richert
The 2018 Farm Bill—Opportunities for Animal Agriculture ............................................ 43Lowell W. Randel
Longitudinal Effects of Early-Life Iron Status on the Microbiota-Gut-Brain Axis .... 47Stephen A. Fleming and Ryan N. Dilger
Dextrin Soluble Fiber Alters the Piglet Microbiome and Gut Health ............................ 59Tim Johnson, Clayton Chastain, Carmen Wickware, Brian Richert, and Scott Radcliffe
Assessment of Teleological Changes in Visceral Organs from Birth to 150 kg Body Weight ...................................................................................................................... 69Sarah Elefson, Ning Lu, and Merlin Lindemann

5
Biotechnology Processing to Produce High-quality Single Cell Proteins
from Renewable Biomass: An UpdateMargareth Øverland
Department of Animal and Aquacultural Sciences Faculty of Biosciences
Norwegian University of Life Sciences, NO-1432Aas, Norway Phone: +47 67 23 2655
SummaryThis paper provides an overview on our research activities at the Norwegian University of Life Sci-ences on how we develop novel protein sources such as yeast from natural renewable resources such as Norwegian Spruce and seaweeds by use of advanced biotechnology. The use of natural gas to produce bacterial protein in diets for terrestrial farm animals and fish is also discussed. Studies on the use of these microbial protein sources in diets for Atlantic salmon and piglets show that bacte-rial meal and yeast can support high growth performance and promote a healthy gut. The research suggest that the production of microbial ingredients by new technology can make an important con-tribution to securing the sustainability of the agricultural and aquacultural industries in Norway and elsewhere.
Introduction The world food supply is facing several challenges. The rapidly growing global human population and trends towards increasing standards of living lead to large challenge for food security (Boland et al., 2013; Godfray et al., 2010). Changing climatic conditions and increasing competition for land, water and energy, and fully exploited capture fisheries, emphasize the urgent need for sustainable feed ingredients developed from under-utilized renewable natural resources. Due to a protein shortage around the world, and greater demand for food, the ocean will play an increas-ing role in providing the world’s protein supply. Aqua-culture production has now exceeded the wild catch, and it is playing an important role in providing the world’s protein supply. This creates large demand for high-quality feed resources. While marine ingredients such as fish oil and fish-meal are limited, increased use of some plant proteins as fish feed is questionable from a sustainability standpoint. Reducing competition with human food resources will be key for sustainability, and microbial feed ingredients can play an important role. They have a rapid growth rate, they do not require any agricultural land, they use little fresh water, and they can be produced from non-food biomass like trees and seaweeds. Overall, microbial ingredients do not compete directly with human food.
Microbial Feed Ingredients The increased demand for sustainable food devel-opment has led to an increasing interest in developing microbial feed ingredients both for the aquaculture and agriculture industry. Microbial products, particularly yeast, are potential sustainable ingredients in aquafeeds and feeds for terrestrial animals due to the ability to con-vert low-value non-food biomass from forestry and ag-ricultural industry into high-value feed with limited de-pendence on arable land, water and changing climatic conditions (Øverland et al., 2013). Underutilized wood and co-products from agriculture and forestry can pro-vide resources for production of feed ingredients from lignocellulosic biomass. Main categories of microbial proteins are bacteria, yeast and fungi, and microalgae. Gas-based fermenta-tion technology to produce methanotrophic bacteria, such as Methylococcus capsulatus grown on natural gas as the energy and carbon source, is advancing (Øverland et al., 2010). Other options are to use bacteria that can utilize H2 and CO2 as a substrate, but this technology is still in its infancy. Technology to produce microalgae by heterotrophic fermentation or from autotrophic cul-tivation is also developing and microalgae are increas-ingly used as a protein and energy source in fish feeds.

6
Figure 1. Bacterial protein production from natural gas.
Bacterial Meal In our research at the Norwegian University of Life Sciences (NMBU) together with industrial partners, we have developed and documented the effect of bacterial protein produced from natural gas in diets for terrestrial farm animals and fish (Øverland et al., 2010). The main component of natural gas, methane, is found widely in nature, and is an attractive substrate for bacterial pro-tein production. Natural gas is abundant and cheap, and the cost of natural gas is reasonable, which suggests that protein production from natural gas could be a realistic large-scale alternative. The naturally occurring metha-notroph Methylococcus capsulatus (Bath) has shown to be highly efficient in converting methane to bacterial protein. Figure 1 shows the production of bacterial meal pro-duced by fermentation of natural gas and the use of the methanotrophic bacteria, Methylococcus capsulatus, together with minor amounts of the heterogenic bac-teria Ralstonia sp., Brevibacillus agri. and Aneuriniba-cillus sp.. In addition, oxygen and ammonia are added to the process together with a mineral solution. A loop fermenter is used for bacterial biomass production in a continuous fermentation process. The biomass is con-tinuously harvested, centrifuged, and ultra-filtrated to remove excess water, and exposed to high temperature for a short time to sterilize the product, and finally spray dried to a powder with less than 10% water. Bacterial meal contains about 70% crude protein and 10% crude fat and is, thus, similar to fish meal in proximate composition. The amino acid composition is well balanced and similar to that of fishmeal, but con-tents of lysine and methionine are lower and trypto-phan is higher. Bacterial meal grown on natural gas also contain about 7-8% RNA and about 2% DNA, but this
depends on the growth rate. Considerable research has been carried out on bacterial meal produced by natu-ral gas fermentation as a protein source for a number of animal species, including pigs, chickens, mink, foxes, dogs, Atlantic salmon and rainbow trout (Øverland et al., 2010). Our results have shown that bacterial meal is a high quality protein source with favorable amino acids compositions. Bacterial meal has shown to support high growth performance, and no health problems has been encountered when bacterial meal partially replaced conventional protein sources in nutritionally balanced diets. Bacterial meal also contains a wide range of bioac-tive components such as peptidoglycans, naturally oc-curring antioxidants, and nucleic acids that has shown to have a positive effect on gastro-intestinal health in Atlantic salmon (Romarheim et al., 2011; 2013). Due to lower natural gas prices combined with higher demand for protein-rich feed resources, and ac-cess to improved methods, the gas-based fermentation technology is now profitable. Thus our innovation has now reached a new stage where international actors have taken this further towards commercialization. We expect that bacterial meal will soon be available on the market.
Yeast from Lignocellulosic Biomass While the use of natural gas offers new feed solu-tions, another option is to use sustainable biomass from land and ocean to produce yeast. Use of micro-bial protein sources such as yeast is not exactly new; in fact, yeast was used in Eastern Europe as a protein source produced from waste streams from the paper industry when the protein supply was scarce during the late 1940s to 1960s. Since then the technology has advanced, which enables us to produce yeast at a lower
7
cost. Parallel with this, the demand for high-quality pro-tein feedstuffs has increased, thus yeast can now serve as an alternative feed resource. Using lignocellulosic biomass like spruce trees as a substrate for feed production is particularly appealing for a country like Norway, with limited land area and challenging climatic conditions. Growing protein-rich feed crops such as peas and beans on a large scale is dif-ficult there, but the large amounts of renewable natural resources from forests can be converted into feed using new technology. Processing of lignocellulosic biomass such as spruce trees for yeast production requires four major steps: thermo-chemical processing pre-treat-
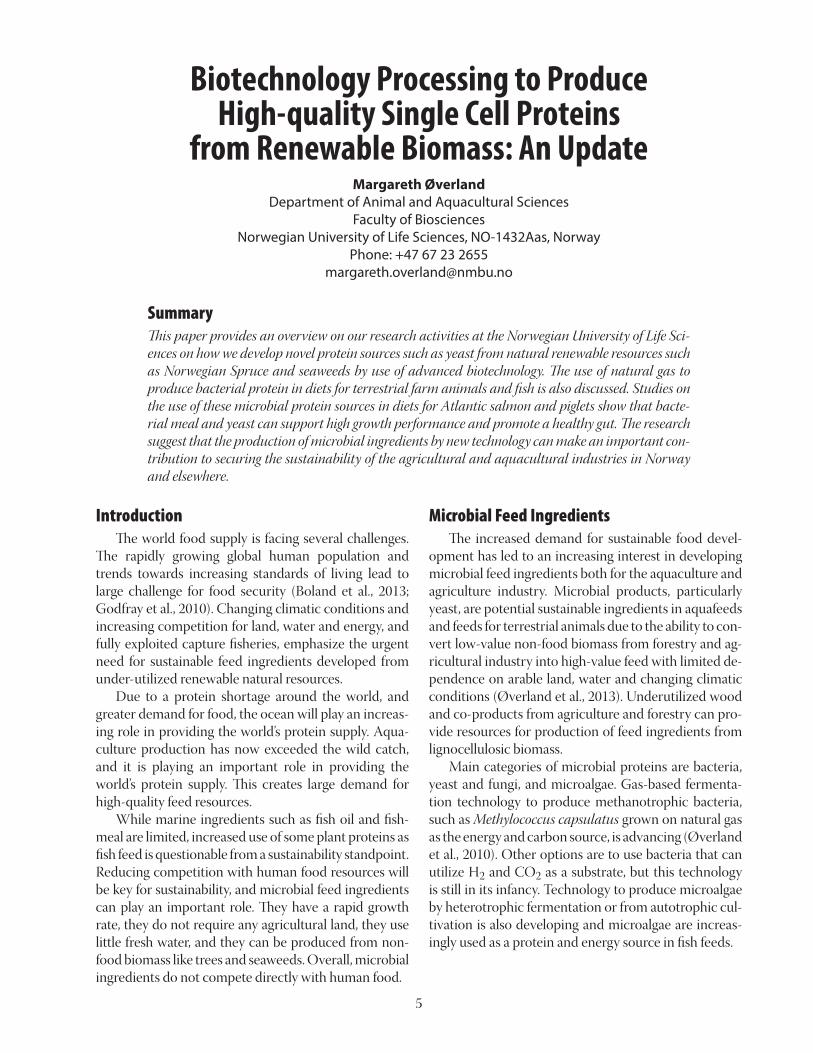
ment, enzymatic hydrolyses, fermentation technology using special yeast strains to convert the sugars into microbial biomass, and down-stream processing to pro-duce a high-quality yeast-based protein source (Figure 2). Researchers at Foods of Norway are now optimizing the process along the value chain. A major breakthrough in the technology is the dis-covery of new enzymes called Lytic Polysaccharide Mo-nooxygenases (LPMO) by colleagues at NMBU and the recent discovery that if these enzymes are used with a catalyst, the upstream processing to convert the cellu-lose and hemicellulose in the tree biomass to sugar be-comes more efficient (Vaaje-Kolstad et al., 2010; Bissaro
Figure 2. Flow chart of yeast production from lignocellulosic biomass involving four major steps: 1) pre-treatment of the biomass to remove lignin and to make cellulose and hemicellu-lose more accessible to hydrolysis, 2) enzymatic hydrolysis to convert cellulose and hemi-cellulose into C6 aIId C5 sugars, 3) fermentation of sugars, nitrogen, phosphate, and other nutrients, and 4) down-stream processing into a dry yeast product for use as a protein source in fish feed. Source: Øverland and Skrede, 2017.
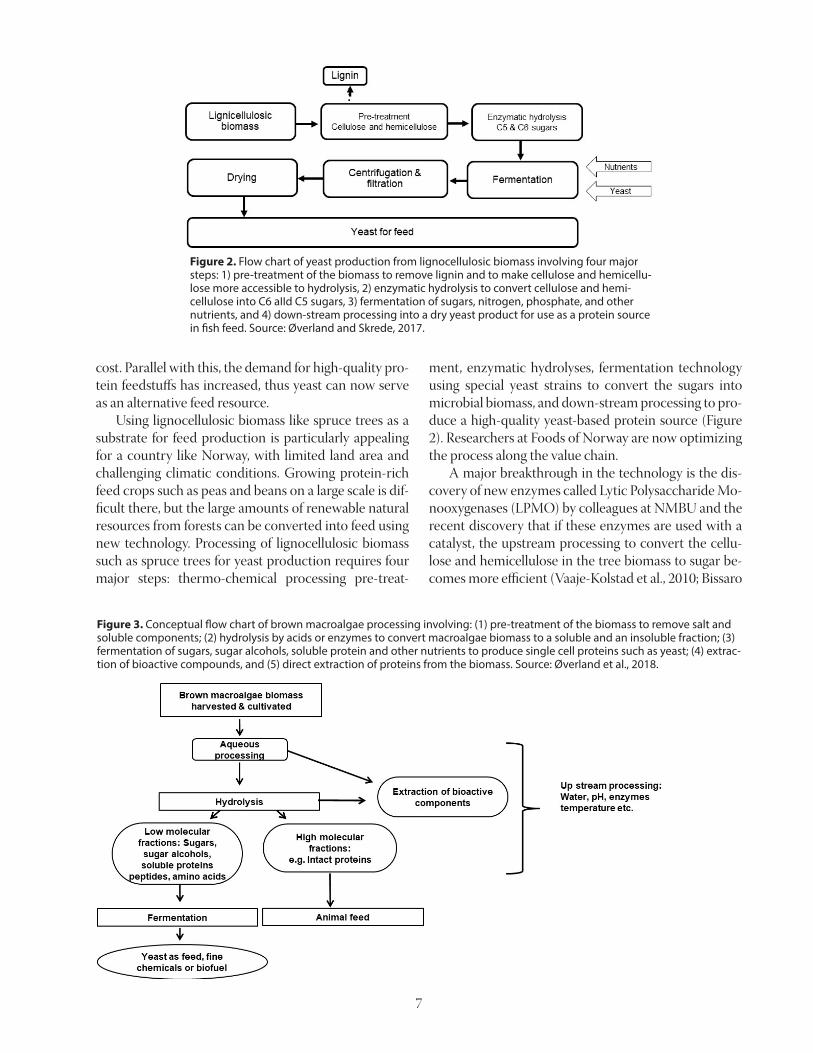
Figure 3. Conceptual flow chart of brown macroalgae processing involving: (1) pre-treatment of the biomass to remove salt and soluble components; (2) hydrolysis by acids or enzymes to convert macroalgae biomass to a soluble and an insoluble fraction; (3) fermentation of sugars, sugar alcohols, soluble protein and other nutrients to produce single cell proteins such as yeast; (4) extrac-tion of bioactive compounds, and (5) direct extraction of proteins from the biomass. Source: Øverland et al., 2018.

8
et al., 2017). Together with industrial partners such as Borregaard AS, we are currently optimizing each step of the value-chain from tree biomass to the final yeast product.
Seaweed as a Feed Resource We also have access to sustainable biomass from the oceans. Norway, with it’s long coastline and clean wa-ters, offers large potentials for cultivation of seaweed. Seaweeds have several advantages over land-based plants; they have a high growth rate, and can therefore produce large amounts of biomass, they don’t require any agricultural land or fertilizers, they don’t require any fresh water and they can be cultivated in sea water. They also have a positive environmental impact due to their ability to capture nutrients from agricultural run-offs and fish farms and to bind CO2 from the sea. Seaweed is an interesting biomass with many properties and it can be used for a wide range of products, including feed. The use of seaweed as a feed resource for fish and monogas-tric farm animals was recently reviewed by Øverland et al. (2018). In Foods of Norway, we are currently working with the cultivated brown seaweed Saccharina latissima. The nutrient value of brown seaweed is relatively low due to high water and ash contents, a low protein con-tent, and a high content of carbohydrates which are virtually non-digestible for monogastrics. To use sea-weed as a feed resource, the nutritional value must be upgraded by novel technology. Figure 3 shows how we can upgrade the nutritional value of brown seaweeds in a biorefinery process to make use of the whole bio-mass. We hydrolyze the seaweed into sugars and other nutrients by novel enzymes and use the low molecular weight fractions in the fermentation process to produce high-protein yeast. We are also isolating bioactive com-pounds from the seaweed that can serve as health pro-moting components in fish feed. Alternatively, proteins can be isolated from the seaweed directly but this will require development of cost efficient methods. We are currently working on optimizing the con-dition for seaweed hydrolyses, including developing methods to hydrolyse seaweed to get a high sugar yield. Our results suggest that the best sugar yield was ob-tained at high seaweed inputs to the bioreactor and that the inclusion of alginate lyase together with a commer-cial enzyme cocktail was especially important at higher inclusion rates of seaweed in the bioreactor. We are also producing yeast as a protein source for fish feed based on a combination of 2nd generation sug-ars from spruce trees and 3rd generation sugars from
seaweeds in an integrated biorefinery process. In this process, the spruce trees provide sugars, while seaweed hydrolysate provides sugars and other essential nutri-ents for the fermentation media. Results suggest that this media supports high growth rates of yeast, without needing to enrich the media with additional nutrients, except for ammonia as a nitrogen source (Sharma et al., 2018).
Yeast in Diets for Salmon and Piglets The yeast obtained by our biorefinery processing is evaluated in growth performance and health studies with Atlantic salmon and piglets to document the nutri-tional value and possible health-beneficial effects. The yeast have a crude protein content of approximately 50-58%, and favorable amino acid composition (Øverland et al., 2013). Yeast also contains a number of bioactive components such as β-glucans, mannoproteins, and nu-cleic acids that can have positive health effects. Nutri-tional value of yeast, however, may vary depending on the species, fermentation process and downstream pro-cessing conditions. Optimum drying and downstream processing of yeast provide opportunities for increased nutritional value (Hansen et al., 2018). Several experiments with yeast as a protein source for salmon have been performed in freshwater and sea-water. In general, the results show that fish perform well when fed yeast-based diets compared to a high-quality fish meal control as well as plant-based diets. Feeding diets containing moderate levels of yeast also has posi-tive health effects, including improved gut barrier func-tion and stimulation of the innate immunity (Grammes et al., 2013). Recently, we have also shown that yeast can serve as a high-quality protein source in diets for wean-ling piglets. Diets containing increasing levels of Can-dida utilis yeast, replacing up to 40% of the protein from conventional proteins sources, supported high feed intake and growth rates of the piglets. Preliminary re-sults also showed that feeding yeast increased apparent total tract digestibility of crude protein, increased the villi heights in the jejunum and ileum, and the villi:crypt ratio in jejunum, and reduced the severity of diarrhea (Cruz et al., in press). More in-depth analyses of effect of yeast on gut transcriptomic, and gut, liver and blood metabolites to better understand the effect of yeast on performance, digestive physiology and health are ongo-ing (Håkenåsen et al., 2019). In general, our results show that yeast produced from underutilized renewable nat-ural resources such as spruce trees is a promising pro-tein source with health-beneficial properties for both aquaculture and agriculture.
9
Conclusion Continued research and development in production of microbial ingredients can make an important contri-bution to securing the sustainability of the agricultural and aquacultural industry. Advances in the microbial protein technology have been driven by large industrial actors in close collaboration with universities and re-search institutes. As the technology advances and the de-mand for such ingredients increases, industrial partners will play a larger role in taking the technology further. Large international industrial actors already have strong expertise in fermentation technology. When the tech-nology is proven profitable and demand from the feed market exists, the industry can easily scale up to com-mercial production. This will require collaboration and knowhow to optimize the upstream processing of the second-generation and third-generation sugar feedstock.
ReferencesBissaro, B., Røhr, Å.K., Müller, G., Chylenski, P., Skau-
gen, M., Forsberg, Z., Horn, S.J., Vaaje-Kolstad, G., and Eijsink, V.G.H. 2017. Oxidative cleavage of poly-saccharides by monocopper enzymes depends on H2O2. Nature Chemical Biology 13:1123-1128.
Boland, M.J., Rae, A.N., Vereijken, J.M., Meuwissen, M.PM., Fischer, A.R.H., van Boekel, M., Rutherfurd S.M., Gruppen, H., Moughan P.J., and Hendriks, W.H. 2013.The future supply of animal-derived pro-tein for human consumption. Trends in Food Sci-ence & Technology 29:62-73.
Cruz, A., Ingrid M. Håkenåsen, I. M., Skugor, A., Myd-land, L. T., Caroline P. Åkesson, C. P., Hellestveit, S. S., Sørby, R., Press, C. McL., Øverland, M. 2019. Candida utilis yeast as a protein source for weaned piglets: Effects on growth performance and diges-tive function. Livestock, in press.
Godfray, H.C.J., Beddington. J.R., Crute, I.R., Haddad, L., Lawrence, D., Muir, J.F., Pretty, J., Robinson, S., Thomas, S.M., and Toulmin, C. 2010. Food Security: the challenge of feeding 9 billion people. Science 327:812-818.
Grammes, F., Reveco, F.E., Romarheim, O. H., Lands-verk, T., Mydland, L.T., and Øverland. M. 2013. Can-dida utilis and Chlorella vulgaris counteract intes-tinal inflammation in Atlantic salmon (Salmo salar L.). PLoS ONE ; Volum 8. (12).
Hansen, J. Ø., Lagos L., Lei P., Reveco-Urzua F.E., Han-sen L.D., Mydland L.T., and Øverland M. 2018. Ef-fect of down-stream processing of bakers yeast (Saccharomyces cerevisiae) on digestibility and im-mune response in Atlantic salmon (Salmo salar). ISFNF2018. Las Palmas Spain, June 3-7, 2018.
Håkenåsen, M. Øverland, A.Y.M. Sundaram, R. Ånes-tad, L.T. Mydland.. 2019. Effect of feeding Candida utilis yeast on gastrointestinal development and health in post-weaning piglets. 70th Annual Meet-ing of the EAAP, Ghent, Belgium, August 26 – 30, 2019.
Øverland, M., Mydland, L.T., and Skrede, A. 2018. Ma-rine macroalgae as a source of protein and bioactive compounds in feed for monogastric animals. Jour-nal of the Science of Food and Agriculture 99:13-24.
Øverland, M., and Skrede, A. 2017. Yeast derived from lignocellulosic biomass as a sustainable feed re-source for use in aquaculture. Journal of the Science of Food and Agriculture 97:733-742.
Øverland, M., Tauson, A.-H., Shearer, K., and Skrede, A. 2010. Evaluation of methane-utilising bacteria as feed ingredients for monogastric animals. Archive of Animal Nutrition. 64: 171–189.
Øverland, M., Karlsson, A., Mydland, L. T., Romarheim, O. H., and Skrede, A. 2013. Evaluation of Candida utilis, Kluyveromyces marxianus and Saccharomyces cerevisiae yeasts as protein sources in diets for Atlan-tic salmon (Salmo salar). Aquaculture 402–403:1–7.
Romarheim, O.H., Øverland, M., Mydland, L.T., Skrede, A., and Landsverk, T. 2011. Bacteria grown on natu-ral gas prevent soybean meal-induced enteritis i At-lantic salmon. Journal of Nutrition 141:124-130.
Romarheim, O.H., Landsverk, T., Mydland, L.T., Skrede, A., and Øverland, M. 2013. Cell wall fractions from Methylococcus capsulatus prevent soybean meal-induced enteritis in Atlantic salmon (Salmo salar). Aquaculture 402-403:13-18.
Shrama S., Hansen L.D., Hansen J.Ø., Mydland, L.T., Horn, S.J., Øverland, M., Eijsink, V.G.H., and Vuo-risto, K.S. 2018. Microbial protein produced from brown seaweed and spruce wood as a feed ingre-dient. Journal of Agricultural and Food Chemistry 66(3):8328-8335.
Vaaje-Kolstad, G., Westereng, B., Horn, S.J., Liu, Z., Zhai, H., Sørlie, M., and Eijsink, V.G.H. 2010. An oxidative enzyme boosting the enzymatic conversion of re-calcitrant polysaccharides. Science 330(6001):2019-2022.
Acknowledgements This work was supported by Foods of Norway, a Centre for Research-based Innovation (the Research Council of Norway; grant no. 237841/030) and by BIO-FEED – Novel salmon feed by integrated bioprocessing of non-food biomass (the Research Council of Norway; grant no. 239003/O30) at the Norwegian University of Life Sciences (NMBU).

10
11
Update on Amino Acids in High Fiber Diets: Threonine and Branch Chained Amino Acids
Woong B. Kwon and Hans H. Stein Department of Animal Sciences
University of Illinois, Urbana 61874 Phone: 217-333-0013
SummaryUsing co-products from the grain processing industries has become more common in swine diets to take advantage of less feed costs. However, most of these co-products contain high dietary fiber which can affect nutrient utilization by pigs. In particular, there are questions of how dietary fiber affects amino acid utilization in pigs. In addition to dietary fiber, co-products from corn and sor-ghum have high leucine concentrations. If large amounts of corn or sorghum co-products are used in swine diets, pigs will have excess dietary leucine which may result in reduced feed intake and growth performance. Effects of dietary fiber on threonine requirement has been determined, and the effects of elevated dietary concentrations of leucine on metabolism of isoleucine, valine, and tryptophan has also been reported. Results of these experiments have indicated that increased fiber levels in diets increase the requirement for threonine, and excess dietary leucine in diets reduce growth performance, protein retention, and serotonin synthesis for growing pigs. Increased dietary tryptophan levels in diets alleviate negative impact of excess dietary leucine on growth performance and serotonin synthesis for growing pigs.
Introduction Co-products from corn- or wheat processing are widely used in diet formulation for swine to reduce feed costs. These co-products typically contain a larger proportion of dietary fiber, which can affect nutrient utilization by pigs (Urriola et al, 2013). An increase in dietary fiber will increase endogenous losses of nutri-ents including amino acids (AA; Cervantes-Pahm et al., 2014), particularly Thr, because endogenous pro-tein that is lost from the small intestine is rich in mucin, which contains high levels of Thr (de Lange et al., 1989; Stein et al., 1999). Thus, high dietary fiber concentra-tion that is introduced by using grain co-products may increase the endogenous losses of Thr, which may in-crease the requirement for Thr in the diet (Zhu et al., 2005; Mathai et al., 2016). Leucine, Val, and Ile are categorized as the branched-chain AA (BCAA) because of the structural similarity of their side chains (Harper et al., 1984). All 3 BCAA share the enzymes that are involved in the first 2 steps of their catabolic pathway (Wiltafsky et al., 2010). Among the BCAA, Leu has been considered a key regulator that stimulates catabolism of all 3 BCAA in the liver (Harper
et al., 1984). In general, co-products from corn and sor-ghum have high leucine concentrations compared with other ingredients (NRC, 2012). Thus, it is more likely that diets have excess leucine if large amounts of corn or sorghum co-products are used. When excess Leu in diets is offered to pigs, degradation of all 3 BCAA may increase by stimulating effects of Leu or its metabolite (α-keto isocaproate) on BCAA catabolizing enzymes (Wiltafsky et al., 2010). Excess dietary leucine may also reduce pig feed intake and growth performance (Gatnau et al., 1995; Wiltafsky et al., 2010) because of reduced synthesis of serotonin in the brain. Excess Leu may prevent Trp, which is the precursor for serotonin, from being transported from blood to brain, and there-fore reduce the availability of Trp for serotonin synthesis (Henry et al., 1992). Serotonin is a cerebral neurotrans-mitter that plays an important role in feed intake regu-lation (Le Floc’h and Sève, 2007). As a consequence, feeding high-fiber diets may change requirements for a number of indispensable AA and it is the objective of the current contribution to summarize current knowl-edge about the requirement for Thr, Trp, and BCAA in high fiber diets fed to growing pigs.

12
Effects of Dietary Fiber on the Thr:Lys Ratio in Diets for Growing Pigs Effects of dietary fiber on Thr:Lys ratio were deter-mined (Mathai et al, 2016) by using a low-fiber basal diet with approximately 0.40% SID Thr and 0.90% SID Lys. Five additional diets were formulated by adding crystalline L-Thr to the basal diet in increments of 0.08% to create diets containing approximately from 0.49 to 0.81% SID Thr. A high-fiber basal diet was also formu-lated by adding 15% soybean hulls to the low-fiber basal diet at the expense of corn starch and 5 additional diets were formulated by adding crystalline Thr to this diet. The 12 diets were fed for 28 days to pigs that were 26.29 ± 4.64 kg at the start of the experiment with 2 pigs per pen and 8 replicate pens per treatment. Results indicated that ADG and G:F increased (linear and quadratic, P < 0.05) as the Thr:Lys ratio increased in both low and high fiber diets (Table 1). There were no effects of Thr level on ADFI among low-fiber diets, but ADFI increased (linear, P < 0.05) as Thr concentration increased in high-fiber diets. Regression analysis estimated the ideal SID Thr:Lys ratio at 0.66 and 0.63 for ADG and G:F, respectively, for pigs fed low-fiber diets and at 0.71 and 0.63, respectively, for pigs fed high-fiber di-ets (Figure 1). The estimated require-ment for the ideal Thr:Lys ratio for optimizing ADG was greater for pigs fed the high-fiber diets (0.71) than for the pigs fed the low-fiber diets (0.66). This increase in the estimated require-ment indicates that dietary fiber may increase the requirement for Thr in growing pigs. The reason for this obser-vation is that fiber may have negative effects on energy, lipid, and N digest-ibility (Urriola et al., 2013; Cervantes-Pahm et al., 2014). Dietary fiber may also result in a greater requirement of Thr in animals fed high-fiber diets be-cause of increased endogenous losses and increased microbial activity in the hindgut (Zhu et al., 2005). A follow-up experiment was con-ducted to determine the N balance in pigs fed low-fiber or high-fiber di-ets that were formulated to have SID
Thr:Lys ratios of 45:100 or 60:100. Thirty-six growing pigs with initial body weight of 29.0 ± 0.74 kg were housed in metabolism crates that were equipped with a slatted floor, a feeder, and a nipple drinker. Pigs were allotted to 4 diets with 9 replicate pigs per diet using a randomized complete block design. All pigs were fed 810g of feed twice daily, which was believed to be ap-proximately 90% of ad libitum feed intake for pigs. Urine and fecal samples were collected for 5 d following a 7-d adaptation period. Results confirmed that retention of N was greater (P < 0.05) for pigs fed the low-fiber diets compared with pigs fed the high-fiber diets regardless of the Thr:Lys ratio (Table 2). This indicates that dietary fiber may af-
Figure 1. Fitted linear breakpoint and quadratic plots of average daily gain (ADG) as a function of standardized ileal digestible (SID) Thr to Lys ratio with observed treatment means in pigs fed low fiber diets (a) and high fiber diets (b; from Mathai et al., 2016).
14
Figures
(a)
(b)
Figure 1. Fitted linear breakpoint and quadratic plots of average daily gain (ADG) as a function
of standardized ileal digestible (SID) Thr to Lys ratio with observed treatment means in pigs fed
low fiber diets (a) and high fiber diets (b; from Mathai et al., 2016).

13
Figure 2. Hypothalamic serotonin of growing pigs (N = 30; n = 6) fed diets with increasing concentrations of standardized ileal digestible (SID) Leu relative to the requirement (NRC, 2012; from Kwon et al., 2019b).
15
Figure 2. Hypothalamic serotonin of growing pigs (N = 30; n = 6) fed diets with increasing
concentrations of standardized ileal digestible (SID) Leu relative to the requirement (NRC, 2012;
from Kwon et al., 2019b).
0.00
0.02
0.04
0.06
0.08
0.10
0.12
50 100 150 200 250 300 350
Hyp
otha
lam
ic se
roto
nin,
ng/
mg
SID Leu relative to requirement, %
Linear P = 0.014Quadratic P = 0.937
fect the flow and retention of N in the pig (Urriola et al., 2013), because inclusion of fiber in the diet increases total N output and simultaneously decreases urinary N excretion by shifting N excretion towards fecal ex-cretion. Results also confirmed that N retention was greater (P < 0.05) for pigs fed the high-Thr diets compared with pigs fed the low-Thr diets re-gardless of inclusion of dietary fiber. This indicates that the high-Thr diets was closer to the requirement for optimal protein accretion than the low-Thr diets in 25- to 50-kg growing pigs. However, the difference in N retention between the high-Thr diets indicates that pigs on the high-fiber, high-Thr diets were not receiving enough Thr to meet the requirement of the pigs.
Branched-chain Amino Acid Interactions in Diets Fed to Growing Pigs Two experiments were conducted to test the hy-pothesis that elevated dietary concentrations of Leu impacts metabolism of Ile, Val, and Trp (Kwon et al., 2019a, b). Five experimental diets based on identical quantities of corn, soybean meal, wheat, and barley and formulated to contain 100, 150, 200, 250, or 300% of the requirement for SID Leu were used in Exp. 1. Forty pigs with initial body weight of 30.0 ± 2.7 kg were housed individually in metabolism crates and allotted to the 5 dietary treatments (8 replicates per treatment). Results indicated that excess dietary Leu reduced (linear, P < 0.05) ADG, ADFI, and G:F (Table 3). Re-duced growth performance is most likely due to re-duced feed intake caused by excess dietary Leu because excess dietary Leu may generate imbalanced supply of BCAA for protein synthesis that resulted from degrada-tion of BCAA (Wiltafsky et al., 2010). Increased (linear, P < 0.05) plasma urea N as dietary Leu increased may be a result of the reduced availability of Val and Ile and further indicates that excess Leu creates AA imbalance (Table 4). In addition, decreased (linear, P < 0.05) N re-tention and biological value of protein in diets that were observed as dietary Leu increased is indicative of the reduced utilization of dietary N for protein deposition (Gatnau et al., 1995). Pigs can detect BCAA imbalances in a diet and they will avoid eating that diet, which indi-cates that there is an innate mechanism against imbal-anced supply of indispensable AA in the diet (Gloaguen et al., 2012). Results also indicates that excess dietary
Leu reduced (linear, P < 0.05) serotonin concentration in the hypothalamus (Figure 2). Serotonin is important for appetite regulation and is synthesized from Trp in the brain, and excess dietary Leu may hinder uptake of Trp in the brain (Henry et al., 1992). Thus, the decreased serotonin concentration in hypothalamus that was ob-served as dietary Leu increased, indicates that excess dietary Leu may reduce Trp uptake into the brain, re-sulting in decreased serotonin synthesis in the hypo-thalamus. This may have contributed to the reduced feed intake observed for pigs fed diets with excess Leu. A follow-up experiment was conducted to test the hypothesis that increased dietary Trp is needed in diets containing excess dietary Leu to prevent a drop in hy-pothalamic serotonin concentrations and to maintain growth performance of animals (Kwon et al., 2019a). A basal diet based on corn, soybean meal, wheat, and bar-ley was formulated to contain 100% of the requirement for SID Leu (NRC, 2012). Two additional diets were for-mulated by adding crystalline L-Leu to the basal diet to increase the concentration of SID Leu to 200 or 300% of the requirement. These 3 diets were formulated to have a SID Trp:Lys ratio of 18%. Six additional diets were for-mulated by adding either 0.05% or 0.10% crystalline L-Trp to each of the 3 original diets. Thus, there was a total of 9 diets that were arranged in a 3 × 3 factorial with 3 levels of Leu (100, 200, or 300% of the SID requirement) and 3 levels of SID Trp (18, 23, or 28% SID Trp:Lys). The 9 diets were fed for 21 days to pigs that were 28.2 ± 1.9 kg at the start of experiment with 2 pigs per pen and 8 replicate pens per treatment. Individual pig weights were recorded at the conclusion of the experiment and on the last day of the experiment, one pigs per pen was
14
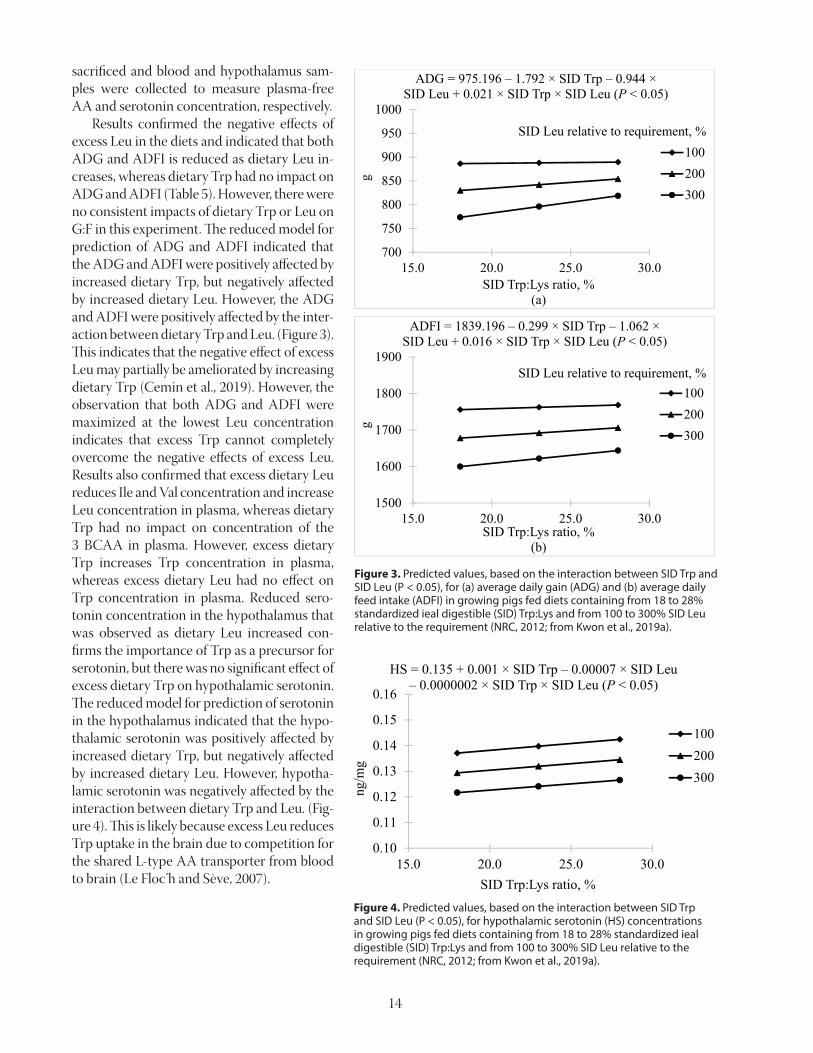
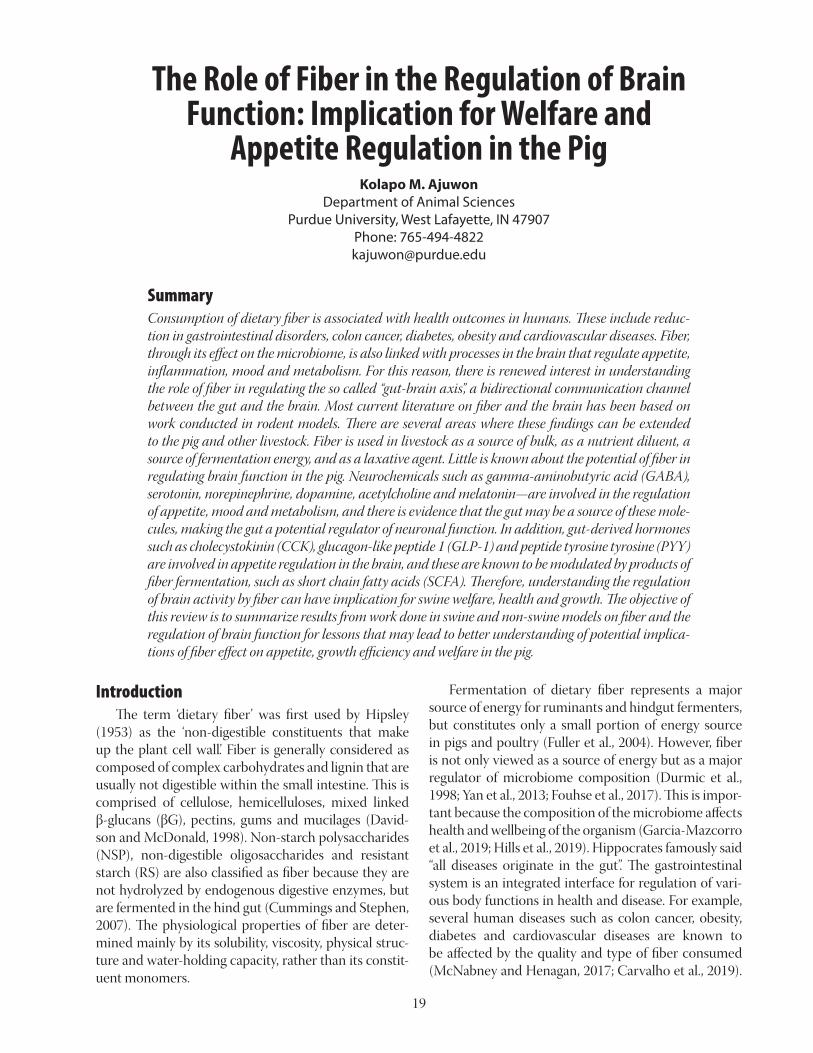
sacrificed and blood and hypothalamus sam-ples were collected to measure plasma-free AA and serotonin concentration, respectively. Results confirmed the negative effects of excess Leu in the diets and indicated that both ADG and ADFI is reduced as dietary Leu in-creases, whereas dietary Trp had no impact on ADG and ADFI (Table 5). However, there were no consistent impacts of dietary Trp or Leu on G:F in this experiment. The reduced model for prediction of ADG and ADFI indicated that the ADG and ADFI were positively affected by increased dietary Trp, but negatively affected by increased dietary Leu. However, the ADG and ADFI were positively affected by the inter-action between dietary Trp and Leu. (Figure 3). This indicates that the negative effect of excess Leu may partially be ameliorated by increasing dietary Trp (Cemin et al., 2019). However, the observation that both ADG and ADFI were maximized at the lowest Leu concentration indicates that excess Trp cannot completely overcome the negative effects of excess Leu. Results also confirmed that excess dietary Leu reduces Ile and Val concentration and increase Leu concentration in plasma, whereas dietary Trp had no impact on concentration of the 3 BCAA in plasma. However, excess dietary Trp increases Trp concentration in plasma, whereas excess dietary Leu had no effect on Trp concentration in plasma. Reduced sero-tonin concentration in the hypothalamus that was observed as dietary Leu increased con-firms the importance of Trp as a precursor for serotonin, but there was no significant effect of excess dietary Trp on hypothalamic serotonin. The reduced model for prediction of serotonin in the hypothalamus indicated that the hypo-thalamic serotonin was positively affected by increased dietary Trp, but negatively affected by increased dietary Leu. However, hypotha-lamic serotonin was negatively affected by the interaction between dietary Trp and Leu. (Fig-ure 4). This is likely because excess Leu reduces Trp uptake in the brain due to competition for the shared L-type AA transporter from blood to brain (Le Floc’h and Sève, 2007).
Figure 3. Predicted values, based on the interaction between SID Trp and SID Leu (P < 0.05), for (a) average daily gain (ADG) and (b) average daily feed intake (ADFI) in growing pigs fed diets containing from 18 to 28% standardized ieal digestible (SID) Trp:Lys and from 100 to 300% SID Leu relative to the requirement (NRC, 2012; from Kwon et al., 2019a).
16
Figure 3. Predicted values, based on the interaction between SID Trp and SID Leu (P < 0.05),
for (a) average daily gain (ADG) and (b) average daily feed intake (ADFI) in growing pigs fed
diets containing from 18 to 28% standardized ieal digestible (SID) Trp:Lys and from 100 to
300% SID Leu relative to the requirement (NRC, 2012; from Kwon et al., 2019a).
700
750
800
850
900
950
1000
15.0 20.0 25.0 30.0
g
SID Trp:Lys ratio, %(a)
ADG = 975.196 – 1.792 × SID Trp – 0.944 ×SID Leu + 0.021 × SID Trp × SID Leu (P < 0.05)
100200300
SID Leu relative to requirement, %
1500
1600
1700
1800
1900
15.0 20.0 25.0 30.0
g
SID Trp:Lys ratio, %(b)
ADFI = 1839.196 – 0.299 × SID Trp – 1.062 ×SID Leu + 0.016 × SID Trp × SID Leu (P < 0.05)
100200300
SID Leu relative to requirement, %
17
Figure 4. Predicted values, based on the interaction between SID Trp and SID Leu (P < 0.05),
for hypothalamic serotonin (HS) concentrations in growing pigs fed diets containing from 18 to
28% standardized ieal digestible (SID) Trp:Lys and from 100 to 300% SID Leu relative to the
requirement (NRC, 2012; from Kwon et al., 2019a).
0.10
0.11
0.12
0.13
0.14
0.15
0.16
15.0 20.0 25.0 30.0
ng/m
g
SID Trp:Lys ratio, %
HS = 0.135 + 0.001 × SID Trp – 0.00007 × SID Leu – 0.0000002 × SID Trp × SID Leu (P < 0.05)
100200300
Figure 4. Predicted values, based on the interaction between SID Trp and SID Leu (P < 0.05), for hypothalamic serotonin (HS) concentrations in growing pigs fed diets containing from 18 to 28% standardized ieal digestible (SID) Trp:Lys and from 100 to 300% SID Leu relative to the requirement (NRC, 2012; from Kwon et al., 2019a).

15
Table 1. Growth performance of AA supplemented diets with low or high concentration of fiber1,2,3
ItemStandardized ileal digestible Thr:Lys ratio
SEMP-value
0.45 0.54 0.63 0.72 0.81 0.90 Linear QuadraticLow fiber
ADG, g 696 769 797 830 836 803 29 < 0.01 < 0.05ADFI, g 1,785 1,799 1,777 1,812 1,862 1,830 102 0.376 0.917G:F, g/g 0.38 0.42 0.45 0.46 0.45 0.44 0.02 0.001 < 0.001
High fiberADG, g 763 882 878 900 933 763 35 < 0.001 < 0.05ADFI, g 1,828 1,872 1,835 1,864 1,945 1,828 65 < 0.05 0.409G:F, g/g 0.42 0.46 0.47 0.47 0.47 0.46 0.01 < 0.01 < 0.01
1 Data from Mathai et al., 2016.2 Data are means of 8 observations per treatment.3 Values for ADG and G:F were greater (P < 0.05) for the high-fiber diets than for the low-fiber diets, but for
ADFI, no differences between low- and high-fiber diets were observed.
Table 2. Nitrogen balance of pigs fed diets with major deficiency or marginal deficiency of Thr and with low or high concentrations of fiber1,2
Fiber level:SID3 Thr:Lys ratio:
Low fiber High fiber Pooled SEM
P-value0.45 0.60 0.45 0.60 Fiber Thr Fiber × Thr
N intake, g/5 d 182 185 162 171 4.8 < 0.05 0.17 0.48N output in feces, g/5 d 38bc 35.2c 41b 47a 2.6 < 0.05 0.3 < 0.05N output in urine, g/5 d 29 23 26 15 2.1 < 0.05 < 0.05 0.22ATTD4 of N, % 80.1 81.6 75.6 73.2 1.5 < 0.05 0.69 0.06N retention, g/5 d 119 131 99 113 3.6 < 0.05 < 0.05 0.85N retention, % 64.5 69.8 59.5 64.9 2.1 < 0.05 < 0.05 0.99a–c Means within a row lacking a common superscript letter differ (P < 0.05).1 Data are means of 9 observations per treatment, except for the treatment with high fiber and the 0.60 SID Thr:Lys
ratio, which had only 7 observations.2 Data from Mathai et al., 2016.3 SID = standardized ileal digestible.4 ATTD = apparent total tract digestibility.
Conclusions Results of Thr experiments indicate that increased fiber levels in diets to growing pigs increase the require-ment for Thr. For 25- to 50-kg growing pigs, the ideal Thr:Lys ratio is 0.71 to optimize ADG, but if low-fiber diets are fed, the ideal Thr:Lys ratio is 0.66 to optimize ADG. Results also indicate that dietary fiber affects the flow and retention of N resulting in increased total N output and simultaneously decreased urinary N excre-tion by shifting N- excretion towards fecal excretion in pigs. The increase in N retention in pigs fed the high-Thr diets indicates that those diets provided for the pigs that were closer to the requirement of the animals than the low-Thr diets. However, the difference in N retention between the high-Thr diets indicates that a higher fiber diet may require a greater inclusion level of Thr relative to Lys. Results of Leu experiments indicate that excess dietary Leu reduces growth performance of pigs, which is most likely due to reduced ADFI, lack of free Val and Ile as substrates for protein synthesis, and consequently reduced protein synthesis as dietary SID Leu increased. Excess dietary Leu also reduces serotonin synthesis in
the hypothalamus, which may have contributed to the reduced ADFI observed for pigs fed diets with excess Leu. Results also indicate that increased dietary Trp levels alleviate negative impact of excess dietary Leu on growth performance and serotonin synthesis in grow-ing pigs.
ReferencesCemin, H. S., M. D. Tokach, S. S. Dritz, J. C. Wood-
worth, J. M. DeRouchey, and R. D. Goodband. 2019. Meta-regression analysis to predict the influence of branched-chain and large neutral amino acids on growth performance of pigs. J. Anim. Sci. 97:2505–2514. doi: 10.1093/jas/skz118
Cervantes-Pahm, S. K., Y. Liu, A. Evans, and H. H. Stein. 2014. Effect of novel fiber ingredients on ileal and to-tal tract digestibility of energy and nutrients in semi-purified diets fed to growing pigs. J. Sci. Food Agric. 94:1284–1290. doi:10.1002/jsfa.6405

16
Table 5. Least squares means for growth performance of growing pigs fed diets with varying ratios between dietary standardized ieal digestible (SID) Leu and SID Trp1,2
SID Leu relative to requirement1, %:SID Trp:Lys , %:
100 200 300SEM18 23 28 18 23 28 18 23 28
ADG, g3 867 898 852 845 869 905 750 815 777 61ADFI, g4 1,675 1,724 1,630 1,657 1,656 1,720 1,519 1,584 1,506 95G:F5 0.52 0.52 0.52 0.51 0.52 0.53 0.49 0.51 0.51 0.021 Data from Kwon et al., 2019a.2 The requirement for Leu was from NRC (2012).3 Results indicated that ADG from d 0 to d 21 at different combinations of SID Trp and SID Leu could be described by the following
model: 975.196 – 1.792 × SID Trp – 0.944 × SID Leu + 0.021 × SID Trp × SID Leu (P < 0.05).4 Results indicated that ADFI from d 0 to d 21 at different combinations of SID Trp and SID Leu could be described by the following
model: 1839.196 – 0.299 × SID Trp – 1.062 × SID Leu + 0.016 × SID Trp × SID Leu (P < 0.05).5 Results indicated that G:F could not be predicted from dietary SID Trp or SID Leu.
de Lange, C. F. M., W. C. Sauer, R. Mosenthin, and W. B. Souffrant. 1989. The effect of feeding different pro-tein-free diets on the recovery and amino acid com-position of endogenous protein collected from the distal ileum and feces in pigs. J. Anim. Sci. 67:746–754. doi:10.2527/jas1989.673746x
Gatnau, R., D. R. Zimmerman, S. L. Nissen, M. Wannem-uehler, and R. C. Ewan. 1995. Effects of excess di-etary leucine and leucine catabolites on growth and immune responses in weanling pigs. J. Anim. Sci. 73:159–165. doi: 10.2527/1995.731159x
Gloaguen, M., N. Le Floc’h, E. Corrent, Y. Primot, and J. van Milgen. 2012. Providing a diet deficient in valine but with excess leucine results in a rapid decrease in feed intake and modifies the postprandial plasma amino acid and α-keto acid concentrations in pigs. J. Anim. Sci. 90:3135–3142. doi: 10.2527/jas.2011-4956
Harper, A. E., R. H. Millar, and K. P. Block. 1984. Branched-chain amino acid metabolism. Annu. Rev. Nutr. 4:409–454. doi: 10.1146/annurev.nu.04.070184.002205
Table 3. Growth performance of pigs fed diets with graded levels of standardized ileal digestible (SID) Leu relative to requirement1,2,3
ItemSID Leu relative to requirement, %
SEMP-value
100 150 200 250 300 Linear QuadraticADG, g 698 645 673 593 559 47 < 0.001 0.522ADFI, g 1,416 1,409 1,411 1,360 1,278 31 < 0.001 0.050G:F, g/g 0.50 0.46 0.48 0.44 0.44 0.03 0.023 0.8351 Data from Kwon et al., 2019b.2 The requirement for Leu was from NRC (2012).3 Each least squares mean represents 8 observations.
Table 4. Plasma urea N and N balance of growing pigs fed diets with graded levels of standard-ized ileal digestible (SID) Leu relative to requirement1 during a 5-d collection period1,2,3
ItemSID Leu relative to requirement, %
SEMP-value
100 150 200 250 300 Linear QuadraticPlasma urea N, μg/mL 5.63 6.25 6.88 6.63 7.38 0.60 0.047 0.779N balance
N intake, g/5 d 165 165 163 163 159 5.9 0.187 0.729N output in feces, g/5 d 29 29 27 29 26 1.7 0.151 0.732N output in urine, g/5 d 28 30 30 30 31 2.5 0.235 0.528ATTD4 of N, % 82.4 82.7 83.3 82.1 83.7 0.7 0.315 0.776N retention, g/5 d 108 106 106 103 102 3 0.082 0.994N retention, % 65.4 64.3 64.9 63.6 64.3 1.3 0.136 0.447Biological value5, % 79.4 77.7 77.8 77.5 76.8 1.4 0.021 0.579
1 Data from Kwon et al., 2019b.2 The requirement for Leu was from NRC (2012).3 Each least squares mean represents 8 observations.4 ATTD = apparent total tract digestibility.5 Biological value was calculated as [N retained/(N intake – N output in feces)] × 100 (Rojas and Stein,
2013).

17
Henry, Y., B. Seve, Y. Colleaux, P. Ganier, C. Saligaut, and P. Jego. 1992. Interactive effects of dietary lev-els of tryptophan and protein on voluntary feed intake and growth performance in pigs, in rela-tion to plasma free amino acids and hypotha-lamic serotonin. J. Anim. Sci. 70:1873–1887. doi: 10.2527/1992.7061873x
Kwon, W. B., K. J. Touchette, A. Simongiovanni, K. Syri-opoulos, A. Wessels, and H. H. Stein. 2019a. Effects of dietary leucine and tryptophan supplementations on serotonin metabolism and growth performance of growing pigs. In: Proceedings of the 6th EAAP International Symposium on Energy and Protein Metabolism and Nutrition. Belo Horizonte, Brazil. (Abstract accepted)
Kwon, W. B., K. J. Touchette, A. Simongiovanni, K. Syri-opoulos, A. Wessels, and H. H. Stein. 2019b. Effects of dietary leucine concentration on branched-chain amino acid metabolism in growing pigs. J. Anim. Sci. 97 (E-Suppl. 2).
Le Floc’h, N., and B. Sève. 2007. Biological roles of tryp-tophan and its metabolism. Potential implications for pig feeding. Livest. Sci. 112:23–32. doi: 10.1016/j.livsci.2007.07.002
Mathai, J. K., J. K. Htoo, J. E. Thomson, K. J. Touchette, and H. H. Stein. 2016. Effects of dietary fiber on the ideal standardized ileal digestible threonine:lysine ratio for twenty-five to fifty kilogram growing gilts. J. Anim. Sci. 94:4217–4230. doi:10.2527/jas.2016-0680
NRC. 2012. Nutrient Requirements of Swine. 11th rev. ed. Natl. Acad. Press, Washington, DC.
Stein, H. H., N. L. Trottier, C. Bellaver, and R. A. Easter. 1999. The effect of feeding level and physiological sta-tus on total flow and amino acid composition of en-dogenous protein at the distal ileum in swine. J. Anim. Sci. 77:1180–1187. doi:10.2527/1999.7751180x
Urriola, P. E., S. K. Cervantes-Pahm, and H. H. Stein. 2013. Fiber in swine nutrition. In: L. I. Chiba, editor, Sustainable swine nutrition. 1st ed. John Wiley & Sons, Ames, IA. p. 255–276.
Wiltafsky, M. K., M. W. Pfaffl, and F. X. Roth. 2010. The effects of branched-chain amino acid interactions on growth performance, blood metabolites, enzyme ki-netics and transcriptomics in weaned pigs. Br. J. Nutr. 103:964–976. Doi: 10.1017/S0007114509992212
Zhu, C. L., M. Rademacher, and C. F. M. de Lange. 2005. Increasing dietary pectin level reduces utilization of digestible threonine intake, but not lysine intake, for body protein deposition in growing pigs. J. Anim. Sci. 83:1044–1053. doi:10.2527/2005.8351044x

18
19
Introduction The term ‘dietary fiber’ was first used by Hipsley (1953) as the ‘non-digestible constituents that make up the plant cell wall’. Fiber is generally considered as composed of complex carbohydrates and lignin that are usually not digestible within the small intestine. This is comprised of cellulose, hemicelluloses, mixed linked β-glucans (βG), pectins, gums and mucilages (David-son and McDonald, 1998). Non-starch polysaccharides (NSP), non-digestible oligosaccharides and resistant starch (RS) are also classified as fiber because they are not hydrolyzed by endogenous digestive enzymes, but are fermented in the hind gut (Cummings and Stephen, 2007). The physiological properties of fiber are deter-mined mainly by its solubility, viscosity, physical struc-ture and water-holding capacity, rather than its constit-uent monomers.
Fermentation of dietary fiber represents a major source of energy for ruminants and hindgut fermenters, but constitutes only a small portion of energy source in pigs and poultry (Fuller et al., 2004). However, fiber is not only viewed as a source of energy but as a major regulator of microbiome composition (Durmic et al., 1998; Yan et al., 2013; Fouhse et al., 2017). This is impor-tant because the composition of the microbiome affects health and wellbeing of the organism (Garcia-Mazcorro et al., 2019; Hills et al., 2019). Hippocrates famously said “all diseases originate in the gut”. The gastrointestinal system is an integrated interface for regulation of vari-ous body functions in health and disease. For example, several human diseases such as colon cancer, obesity, diabetes and cardiovascular diseases are known to be affected by the quality and type of fiber consumed (McNabney and Henagan, 2017; Carvalho et al., 2019).
The Role of Fiber in the Regulation of Brain Function: Implication for Welfare and
Appetite Regulation in the PigKolapo M. Ajuwon
Department of Animal Sciences Purdue University, West Lafayette, IN 47907
Phone: 765-494-4822 [email protected]
SummaryConsumption of dietary fiber is associated with health outcomes in humans. These include reduc-tion in gastrointestinal disorders, colon cancer, diabetes, obesity and cardiovascular diseases. Fiber, through its effect on the microbiome, is also linked with processes in the brain that regulate appetite, inflammation, mood and metabolism. For this reason, there is renewed interest in understanding the role of fiber in regulating the so called “gut-brain axis”, a bidirectional communication channel between the gut and the brain. Most current literature on fiber and the brain has been based on work conducted in rodent models. There are several areas where these findings can be extended to the pig and other livestock. Fiber is used in livestock as a source of bulk, as a nutrient diluent, a source of fermentation energy, and as a laxative agent. Little is known about the potential of fiber in regulating brain function in the pig. Neurochemicals such as gamma-aminobutyric acid (GABA), serotonin, norepinephrine, dopamine, acetylcholine and melatonin—are involved in the regulation of appetite, mood and metabolism, and there is evidence that the gut may be a source of these mole-cules, making the gut a potential regulator of neuronal function. In addition, gut-derived hormones such as cholecystokinin (CCK), glucagon-like peptide 1 (GLP-1) and peptide tyrosine tyrosine (PYY) are involved in appetite regulation in the brain, and these are known to be modulated by products of fiber fermentation, such as short chain fatty acids (SCFA). Therefore, understanding the regulation of brain activity by fiber can have implication for swine welfare, health and growth. The objective of this review is to summarize results from work done in swine and non-swine models on fiber and the regulation of brain function for lessons that may lead to better understanding of potential implica-tions of fiber effect on appetite, growth efficiency and welfare in the pig.

20
There is also evidence that depression may be related to the quality of fiber consumed through its effect on the composition of the microbiome and the gut brain axis (Taylor and Holscher, 2018). Fiber may regulate this axis by regulating products of dietary fiber fermentation. Products of microbial activities such as SCFA, peptides, phenols, salicylates, pyruvate, lactate, ethanol, H2 and succinate, in addition to serving as potential sources of energy source for host cells, are also able to activate the host enteric nervous system which is integrated with the central nervous system (CNS) through the para-sympathetic (via the vagus nerve) and sympathetic (via the prevertebral ganglia) nervous systems. Thus, fiber utilization may have effects in regulating behaviors, mood, stress resistance and appetite of the organism (Kyriazakis and Emmans, 1995; Ye et al., 2015; Miki et al., 2016). Although pigs are non-ruminant animals, they have a large intestine with robust fermentative capacity in the cecum and colon (Agyekum and Nyachoti, 2017). Pigs are important agricultural animals as well as an estab-lished biomedical model. Understanding the mecha-nisms of fiber effect in the brain may have application for optimizing swine health and welfare. Research in pigs (Malbert et al., 2013; Yamakawa et al., 2015) has shown that activation of the vagus nerve is sufficient to elicit observable changes in the brain, suggesting a po-tential for dietary fiber to elicit responses in the brain through this nerve as part of the gut-brain axis.
Fiber and Regulation of Microbiome Composition in the Pig The neonatal piglet gut is believed to be sterile be-fore birth, but is rapidly colonized by maternal and envi-ronmentally-derived microbes soon after, happening in succession to eventually lead to an adult-like microbial community (Isaacson et al., 2002; Pajarillo et al., 2014a). The gut microbial composition and ecological succes-sion of the intestinal microbiota in early life is shaped by a number of complex internal and external factors. For instance, dietary change, probiotics and prebiotics ad-ministration, and supplementation of in-feed antibiot-ics all play important roles in determining the profile of gut microbial community in pigs (Pajarillo et al., 2014b; Bian et al., 2016; Chae et al., 2016). Thus, understanding of the dynamics of the gut microbiota throughout the life of the pig, especially in the immediate perinatal pe-riod and after weaning, is of interest as it influences the overall health, welfare and growth performance of pigs.
The mature pig gastrointestinal tract (GIT) has a di-verse and complex microbial community. In the colon, the total number of bacteria in the pig colon is estimat-ed to be 1×10¹⁰ - 1×10¹¹ per gram of gut content (Gas-kins et al. 2002). Although the microbial community in the neonatal pig is largely determined by consumption of milk (Frese et al., 2015), fiber intake is known to af-fect microbial composition even in the neonatal pig (Zhang et al., 2016). Liu et al. (2018) showed that the microbiome and SCFA composition in weanling pig-lets can be readily altered by changing the dietary fiber composition. This indicates that the microbiome in the pig is rapidly and highly amenable to fiber intake. Yan et al. (2013) showed that consumption of inulin in-creased the diversity of bacteria population. Heinritz et al. (2016) demonstrated that high-fiber diets based on wheat bran increased copy numbers of ‘beneficial’ bac-teria including lactobacilli and bifidobacteria, while the low fiber diet fostered bacterial groups associated with a negative impact on gut health. Zhao et al. (2018) inves-tigated the impact of dietary fibers on the performance, fecal short-chain fatty acids, nutrient digestibility, and bacterial community in weaned piglets and found that dietary supplementation with wheat bran and oat bran resulted in greater weight gain and feed efficiency than animals without these ingredients, and the performance increase was associated with greater abundances of Ac-tinobacteria and Firmicutes or Fibrobacteres in the fecal samples from piglets fed wheat bran and oat bran. Feed-ing resistant starch was also associated with an increase in relative abundance of Lachnospiraceae- and Rumi-nococcus-affiliated phylotypes in the fecal microbiome of growing pigs (Trachsel et al., 2019). Microbiome composition may be directly associ-ated with feed efficiency in pigs (Yang et al., 2017). Mc-Comark et al. (2017) characterized the microbiome of pigs and related it to residual feed intake (RFI), a mea-sure of efficiency of growth and nutrient utilization in pigs. They found increased fecal enrichment of Chris-tensenellaceae, Oscillibacter, and Cellulosilyticum in low RFI (more feed-efficient) pigs. They also found a low ileal abundance of Nocardiaceae (Rhodococcus) and a higher isobutyric acid concentration in the low RFI pigs. Verschuren et al. (2018) fed pigs either a corn/soybean meal (CS) or a diet based on wheat/barley/by-products (WB) and found a diet and sex-dependent relationship between feed efficiency and fecal microbial composi-tion in grower-finisher pigs. These studies suggest a pos-sible link between the intestinal microbiota and feed efficiency in pigs. However, the mechanism(s) of this association are still poorly understood.

21
Figure 1. Portal and arterial blood concentrations of total SCFA (A) and butyrate (B) after intake of the wheat- and rye-based diets. Values are means ± SEM, n = 4. P.V., portal vein; M.A., mesenteric artery. Source: Bach Knudsen et al., 2005.
A
B.
Figure 2. Hypothalamic expression of interleukin 1 β (IL-1β) (A) and superoxide dismutase (SOD) (B) in weanling pigs fed diets supplemented with 0.25% of either Fructoligosaccharide (FOS) or cellulose for 4 weeks. Pigs were killed after 4 weeks and hypothalamus used for RT-PCR. Bars represent means ± SE. *, indicated significance at P < 0.05.
0
0.5
1
1.5
2
2.5
3
FOS Cellulose
IL‐1β
mRN
A/18
s
*
00.20.40.60.81
1.21.41.61.82
FOS Cellulose
SOD mRN
A/18
s
*
Figure 2. Hypothalamic expression of interleukin 1 β (IL-1β) (A) and superoxide dismutase (SOD) (B) in weanling pigs fed diets supplemented with 0.25% of either Fructoligosaccharide (FOS) or cellulose for 4 weeks. Pigs were killed after 4 weeks and hypothalamus used for RT-PCR. Bars represent means ± SE. *, indicated significance at P < 0.05.
Short Chain Fatty Acids, Mediators of Fiber Effect on Gut-Brain Communication Recent research progress in the last decade has revealed that the microbiota has significant effect in regulating host physiology and function of most organ systems (Clarke et al., 2014). Thus, microbial presence affects central nervous system function with far-reach-ing effects on behavior, metabolism and activity (Samp-son and Mazmanian, 2015). The microbiota has effects in the brain through endocrine, vagus nerve-dependent and immune modulatory mechanisms and from direct action of microbial metabolites as signaling molecules in the brain (Lyte, 2013; Selkrig et al., 2014). Short chain fatty acids play important roles as mediators of micro-bial action in the brain. Butyrate, the C4 SCFA product of fiber fermentation, is especially important as a regu-lator of brain function. Although most of the butyrate
produced from fiber fermentation is used as an energy source by intestinal epithelial cells (Canani et al., 2011; Hamer et al., 2008), some butyrate can cross the epi-thelial barrier and enter the circulation via the hepatic portal vein, which connects the gastrointestinal tract, spleen and liver (Peters et al., 1992). Consumption of rye has led to increased circulating butyrate concentra-tion in the pig (Bach Knudsen, 2005; Figure 1). There are very few studies that have determined the physiological concentrations of butyrate in the brain or cerebrospinal fluid (CSF). This may be partly due to its rapid hepatic extraction from portal blood and metabolism. It can be expected that butyrate levels in brain tissue or CSF are extremely low. Use of dynamic positron emission to-mography tracing of radio-labelled butyrate in primates revealed brain uptake of butyrate to be less than 0.006% with a high turnover rate (Kim et al., 2013), suggesting

22
that at this low concentration, butyrate may have lim-ited direct physiological effects in the brain. However, supplementation of butyrate producing bacteria, Clos-tridium butyricum, is associated with an increase in brain butyrate in mice (Liu et al., 2015), an indication that under the right conditions, it is theoretically pos-sible to elevate brain butyrate concentration. Recep-tors and transporters that specifically bind SCFAs and other monocarboxylic acids, such as sodium-coupled monocarboxylate transporter (SMCT1) and mono-carboxylate transporter 1 (MCT1), are expressed by a large variety of cell types in the brain, including neu-rons, astrocytes, microglia, and oligodendrites (Moreira et al., 2009; Vijay and Morris, 2014). Butyrate is indeed able to cross the blood brain barrier, as demonstrated by the study of Minamiyama et al. (2004) who showed that oral butyrate induced a dose-dependent increase in neuronal and glial nuclear histone H3 acetylation in mice. However, butyrate does not necessarily need to en-ter the brain to affect the brain, but it can also indirectly influence processes in the brain by stimulating periph-eral nervous system, e.g., the vagus nerve, or through regulation of immune function. Experimentally, bu-tyrate administration resulted in brain modifications that led to behavioral changes in mice. Levenson et al. (2004) showed that sodium butyrate administration led to increased neuronal plasticity. Butyrate also en-hanced long-term memory formation or long-term po-tentiation (LTP) (Lattal et al., 2007; Vecsey et al., 2007) by transforming short-term memory into long-term memory (Haettig et al., 2011; Intlekofer et al., 2013). These effects were related to the histone deacetylation inhibitor effects of butyrate. Oral butyrate supplemen-tation to pigs triggered regional brain glucose metabo-lism changes in several brain structures, including the hippocampus (Val-Laillet et al., 2018), indicating that butyrate may affect brain metabolism in the pig as well. There may be a welfare implication of butyrate effect in the brain because butyrate was shown to mimic the beneficial effects of environmental enrichment in mice (Fischer et al., 2007). This may be especially important in the pig where environmental enrichment is associat-ed with higher indices of animal welfare or production (Beattie et al., 1995; Mkwanazi et al., 2019). Therefore, enriching diets in fiber that increase the abundance of butyrate producing bacteria, such as Clostridium clus-ters IV and XIVa (Stackebrandt et al., 1999; Barcenilla et al., 2000; Kläring et al., 2013), may have significant effects in regulating brain function and welfare in pigs.
Fiber, Microbiome and Regulation of Inflammation in the Brain, Implication for Health, Welfare and Behavior of Pigs Butyrate administration and consumption of soluble fiber have been shown to reduce inflammation in the brain of rodents (Sherry et al., 2010; Matt et al., 2018), and these experiments may have implication in the pig as well. Consumption of highly fermentable fiber led to a higher recovery of mice from LPS-induced sickness (Sherry et al., 2010). Consumption of soluble fiber was also associated with an increase in the IL-1antagonist, IL-1RA, and a decrease in IL-1β and tumor necrosis α (TNF-α) in the brain. Induction of IL-4 was partly re-sponsible for the anti-inflammatory effect of soluble fiber because some of the beneficial effects of soluble fiber, such as social withdrawal caused by endotoxin, was lost in IL-4 knockout animals (Sherry et al., 2010). Butyrate may be able to prime immune cells in the brain because germ free mice have immature and less active microglia, which could be normalized by adding an SCFA cocktail consisting of acetate, propionate and bu-tyrate to the drinking water (Erny et al., 2015). The SCFA not simply inhibit microglia, but rather support precise tuning to ensure necessary functioning under non-in-flammatory conditions. Butyrate has anti-inflammatory effects in brain resident macrophages (microglia), re-ducing NF-kB signaling and inducing apoptosis, leading to neuroprotection (Chen et al., 2007). Prebiotic fiber ameliorated cognitive decline and had anti-inflamma-tory, senescence-delaying effects in the mouse model of accelerated ageing (Nakamura et al., 2014). There is a dearth of information in the pig on the regulation of inflammation in the brain. Our work in weanling pigs revealed that consumption of fructooli-gosaccharide (FOS) supplemented diet for 4 weeks resulted in reduced expression of IL-β and increased expression of superoxide dismutase (SOD) in the hypo-thalamus compared to pigs that were fed cellulose (Fig-ure 2). Although the applicability of a result like this to swine welfare and production is unclear, hypothalamic inflammation is known to impair body function (Arru-da et al., 2011; Wojtulewicz et al., 2017); thus, potential reduction in brain inflammation may have practical ap-plication for enhancing swine health, welfare and pro-duction. Getting a deeper understanding of effect on fiber on inflammation in the brain of pigs is warranted.
Fiber, Microbiome and Regulation of Stress Response Animals are often exposed to stressful situations in the course of normal production operations. Given the negative effect of stress on animal health, welfare and

23
performance, stress mitigation strategies are very impor-tant considerations in animal production. Pigs are often subjected to different forms of stress ranging from relo-cation, overcrowding, excessive heat, handling, weaning, long distance transportation or disease (Martínez-Miró et al. 2016). Stress leads to the activation of the hypotha-lamic-pituitary-adrenal axis, which leads to release of corticosteroids (cortisol and corticosterone) (Spencer and Deak, 2017). Stress has a negative consequence on health, welfare, reproduction and growth performance in pigs (Hyung et al., 1998; Hicks et al., 1998; Lee et al., 2005; Smulders et al., 2006). Interestingly, the gut micro-biome composition may be related to stress adaptability. The classic work by Sudo et al. (2004) in mice showed that germ free (GF) mice were more susceptible to restraint stress, with higher plasma adrenocorticotropic hormone (ACTH) and corticosterone, than specific pathogen free (SPF) mice. However, the exaggerated hypothalamic pi-tuitary adrenal axis (HPA) stress response by GF mice was reversed by reconstitution with Bifidobacterium infantis, a probiotic strain. In addition, transplantation of feces from SPF mice into GF mice normalized the el-evated HPA response of GF mice when performed at a younger age, not when older. This may have an implica-tion in swine such that early life exposure to “friendly” commensal microbes could help mitigate effect of stress later in the productive life of animals. Several other studies conducted in rodents have demonstrated that altering the microbiome may af-fect stress response, with an implication for potential use of these organism as “stress relieving” probiotics in pigs. Treatment with Bifidobacteria infantis normalized stress-evoked behavioral deficits in the forced swim test as well as accompanying immune and neurotransmitter perturbations (Desbonnet et al., 2010). Bifidobacteria longum and Bifidobacterium breve differentially at-tenuated stress-induced anxiety (Savignac et al., 2014). Lactobacillus helveticus and B. longum, when used to-gether, prevented stress-induced decreases in hippo-campal neurogenesis (Ait-Belgnaoui et al., 2014), and Lactobacillus farciminis normalized HPA responses (Ait-Belgnaoui et al., 2012), and likewise, Lactobacil-lus rhamnosus diminished stress-evoked anxiety- and depressive-like symptoms and HPA responses (Bravo et al., 2011). Additionally, Lactobacillus plantarum di-minished depressive-like behavior, HPA responses, and proinflammatory cytokine profiles following early-life stressor exposure (Liu et al., 2016). Butyrate can also produce antidepressant-like effects (Schroeder et al., 2007). In horses (Destrez et al., 2019), dietary change from a high fiber to a low fiber high starch diet increased incidences of behavioral indicators of anxiety, suggest-
ing that fiber consumption, through alteration of the microbiome, could be protective in stressful situations in animals. The work by Herfel et al. (2011) in neona-tal piglets showed that feeding a synthetic soluble fiber polydextrose (PDX) to neonatal pigs successfully in-creased the potentially stress-protective lactic acid-pro-ducing bacteria Lactobacillus spp. Furthermore, Mudd et al. (2017) found in young piglets that higher fecal Ruminococcus predicted decreased serum cortisol, an evidence that microbiome composition could regulate stress response in the pig. However, other investigators (Holt et al., 2006; Jensen et al., 2013) did not find a sig-nificant effect of high fiber diets on salivary cortisol con-centrations, stereotypic behaviors or feeding motiva-tion in pigs. Therefore, work is needed on the potential of fiber to modulate stress response in the pig that may lead to determination of appropriate fiber, prebiotic or probiotic formulation that may produce the maximum benefits in mitigating adverse stress response.
Fiber, Microbiome and the Regulation of Appetite in Pigs There is great interest in understanding fiber effects on satiety in the pig from production and welfare per-spectives. The gut is implicated in the regulation of sa-tiety because it secretes several regulatory peptide hor-mones that are stimulated by gut nutrient content that interact with receptors at various points in the ‘gut-brain axis’ to affect short term and intermediate term feelings of hunger and satiety. The major gut hormones implicat-ed in appetite control include PYY, GLP-1, oxyntomodu-lin, CCK, ghrelin, pancreatic polypeptide and amylin (De Silva and Bloom, 2012). PYY and GLP1 are anorectic gut hormones and are released together following a meal to mediate postprandial satiety. PYY is a hormone synthe-sized and released in response to food intake from the endocrine L-cells mainly in the distal part of the gastroin-testinal tract, such as ileum and colon, and has several gut functions that contribute to postprandial satiety and de-creased food intake (Karhunen at el., 2008). These func-tions mediate, among others, ileal and colonic breaks to slow gastric emptying and promote digestive activities including regulation of insulin secretion and glucose ho-meostasis (Boey et al., 2007; Karhunen et al., 2008). Consumption of diets containing bulky fibers in-creases postprandial satiety (Sun et al., 2015), perhaps through mechanisms such as increase in gut-fill, delayed gastric emptying, release of satiety-inducing gut pep-tides and the increased availability of SCFA in the distal gut coincident with a reduction in post-prandial glucose absorption. In sows, a high fiber diet increases gut fill (Souza da Silva et al., 2012). Consumption of resistant

24
starch increased net portal appearance of PYY in pigs (Ingerslev et al., 2017), suggesting a potential for PYY in regulating appetite in the pig in response to fiber intake. However, pigs fed a wheat arabinoxylan (AX) and oat β-glucan (BG) diet had only a numerically higher plas-ma GLP-1 area under the curve (AUC) when compared with pigs fed a wheat starch (WS) diet (Pluschke et al., 2018). Thus, whether fiber type regulates GLP1 in the pig is still unclear. There is evidence that SCFA may be directly responsible for increased PPY and GLP1 from enteroendocrine cells in response to fiber consumption (Psichas et al., 2015; Larraufie et al., 2018) in rodent and human systems, although direct implication of SCFA in the regulation of PYY in the pig is unclear as Ingerslev et al. (2017) detected an increase in net portal PYY ap-pearance after consumption of a fiber diet without a sig-nificant change in portal SCFA concentration. Dietary fiber also affects postprandial CCK release. Fibers, such as hydrolyzed guar gum fiber (Heini et al., 1999), barley beta-glucan (Bourdon et al., 1999), bean flakes, oatmeal and oat bran fibers (Bourdon et al., 2001), have been shown to produce greater postprandial CCK levels with prolonged elevations than low fiber diets. Fiber effect on satiety may be dependent on the type of fiber consumed. Fibers with a slow rate of fermentation and high produc-tion of butyrate are considered most satiating (Souza da Silva et al., 2013). Additional research on the regulation of GLP1 and PYY by fiber in the pig is warranted be-cause of its potential implication in appetite regulation.
Welfare and Production Implications of Fiber in the Pig Welfare considerations are very important in swine production practices because animal performances are linked to their welfare status. The gestating sow has been the model of choice for investigating the potential effect of fiber in promoting pig welfare. Effects of fiber on ges-tating pig welfare is partly through promotion of satiety (Sun et al., 2015). Fiber consumption is also known to reduce post-prandial non-feeding oral (Ramonet et al., 1999) and other stereotypic behaviors in the pig (Souza da Silva et al., 2013). The work by Sapkota et al. (2016) in gestating sows found that consumption of that resis-tant starch and soyhulls improved welfare of sows by reducing aggression and increasing satiety in limit-fed gestating sows without a negative effect on production. Additional work by Bernardino et al. (2016) revealed reduction in aggression in the offspring of sows fed a high fiber diet during gestation, suggesting that mater-nal fiber supplementation during gestation may have a beneficial carryover effect by reducing aggression in the offspring. However, apart from potential effects on
satiety, it is still unclear how the physiochemical prop-erties of different fiber types reduce aggression or pro-mote welfare in the pig. It is known that gut bacteria both produce and respond to the same neurochemi-cals, such as GABA, serotonin, norepinephrine, dopa-mine, acetylcholine and melatonin that the brain uses to regulate mood and cognition, and the regulation of the abundance of these molecules by dietary fiber may be the mechanism by which fiber affects feeling of well-being, which may reflect in less aggressive or stereotypi-cal behavior in the pig. From the work by Reigstad et al. (2015), SCFA directly induced serotonin production from enterochromaffin cells. Thus, highly fermentable fiber may promote welfare through this mechanism in the pig. However, the impact of fiber on the composi-tion of key neurochemicals in the pig brain and effects on behavior and welfare are still unknown. A systematic and integrated analysis of the potential effect of fiber on welfare, appetite and behavior in the pig will involve de-termination of fiber effects on the microbiome, micro-bial end products, brain neurochemicals, coupled with welfare, behavior and productivity assessments.
Conclusions Potential practical implications of feeding a high fi-ber or highly fermentable fiber on growing pig growth efficiency is warranted. Apart from gestating sows that are limit fed, modern growing pigs are fed ad libitum to take advantage of their genetic potential. Therefore, the use of fiber at a level that limits feed intake should be avoided. A holistic approach must be taken on fiber supplementation to pigs to take advantage of both po-tential welfare benefits without compromising growth performance.
ReferencesAgyekum, A.K. and C. M. Nyachoti. 2017. Nutritional
and metabolic consequences of feeding high-fiber diets to swine: A Review. Engineering 3: 716-725.
Ait-Belgnaoui, A., A. Colom , V. Braniste, L. Ramalho , A. Marrot, C. Cartier, E. Houdeau, V. Theodorou, and T. Tompkins. 2014. Probiotic gut effect prevents the chronic psychological stress induced brain activity abnormality in mice. Neurogastroenterol. Motil. 26: 510–520. http://dx.doi.org/10.1111/nmo.12295.
Ait-Belgnaoui, A., H. Durand, C. Cartier, G. Chaumaz, H. Eutamene, L. Ferrier, E. Houdeau, J. Fioramonti, L. Bueno, and V. Theodorou. 2012. Prevention of gut leakiness by a probiotic treatment leads to attenu-ated HPA response to an acute psychological stress in rats. Psychoneuroendocrinology 37: 1885–1895. http://dx.doi.org/10.1016/j.psyneuen.2012.03.024.
25
Arruda, A.P., M. Milanski, A. Coope, A.S. Torsoni, E. Ropelle, D.P. Carvalho, J. P. Carvalheira , and L.A. Velloso. 2011. Low-grade hypothalamic inflamma-tion leads to defective thermogenesis, insulin resis-tance, and impaired insulin secretion. Endocrinol-ogy 152:1314-26. doi: 10.1210/en.2010-0659.
Bach Knudsen, K.E., A. Serena, A.K. Kjaer, H. Jørgensen, and R. Engberg. 2005. Rye bread enhances the pro-duction and plasma concentration of butyrate but not the plasma concentrations of glucose and insu-lin in pigs. J. Nutr. 135:1696-1704.
Barcenilla, A., S.E. Pryde, J.C. Martin, S.H. Duncan, C.S. Stewart, C. Henderson, and H.J. Flint. 2000. Phylo-genetic relationships of butyrate-producing bacteria from the human gut. Appl. Environ. Microbiol. 66: 1654e1661.
Beattie, V E., N.Walker, and I.A. Sneddon. 1995. Effects of environmental enrichment on behaviour and productivity of growing pigs. Animal Welfare 4(3): 207-220. Universities Federation for Animal Wel-fare.
Bernardino, T., P. Tatemoto, B. Morrone, P.H. Mazza Ro-drigues, and A.J. Zanella. 2016. Piglets born from sows fed high fibre diets during pregnancy are less aggres-sive prior to weaning. PLoS One 11(12):e0167363. doi: 10.1371/journal.pone.0167363
Bian, G., S. Ma, Z. Zhu, Y. Su, E.G. Zoetendal, R. Mackie, J. Liu, C. Mu, R. Huang, H. Smidt, and W. Zhu. 2016. Age, introduction of solid feed and weaning are more important determinants of gut bacterial succession in piglets than breed and nursing mother as revealed by a reciprocal cross-fostering model. Environ. Micro-biol.18:1566–1577. doi: 10.1111/1462-2920.13272.
Boey, D., A. Sainsbury, and H. Herzog. 2007. The role of peptide YY in regulating glucose homeostasis. Pep-tides 28:390–395. Epub 2007/01/11. doi: 10.1016/j.peptides.2006.07.031.
Bourdon, I., B. Olson, R. Backus, B.D. Richter, P.A. Da-vis, and B.O. Schneeman. 2001. Beans, as a source of dietary fiber, increase cholecystokinin and apoli-poprotein b48 response to test meals in men. J. Nutr. 131:1485–1490.
Bourdon, I., W. Yokoyama, P. Davis, C. Hudson, R. Back-us, D. Richter, B. Knuckles, and B.O. Schneeman. 1999. Postprandial lipid, glucose, insulin, and cho-lecystokin in responses in men fed barley pasta en-riched with beta-glucan. Am. J. Clin. Nutr. 69:55–63.
Bravo, J.A., P. Forsythe, M.V. Chew, E. Escaravage, H.M. Savignac, T.G. Dinan, J. Bienenstock, and J.F. Cryan. 2011. Ingestion of Lactobacillus strain regulates emotional behavior and central GABA receptor ex-pression in a mouse via the vagus nerve. Proc. Natl.
Acad. Sci. U S A. 108: 16050–16055.http://dx.doi.org/10.1073/pnas.1102999108.
Canani, R.B., M.D. Costanzo, L. Leone, M. Pedata, R. Meli, and A. Calignano. 2011. Potential beneficial ef-fects of butyrate in intestinal and extraintestinal dis-eases. World J. Gastroenterol. 17: 1519e1528. http://dx.doi.org/10.3748/ wjg.v17.i12.1519.
Carvalho, D.V., L.M.A. Silva, E.G. Alves Filho, F.A. San-tos, R.P. Lima, A.F.S.C. Viana, P.I.G. Nunes, S.G.D.C. Fonseca, T.S. Melo, D.A. Viana, M.I. Gallão, and E.S. Brito. 2019. Cashew apple fiber prevents high fat diet-induced obesity in mice: an NMR metabolomic evaluation. Food Funct. 10:1671-1683. doi: 10.1039/c8fo01575a.
Chae, J.P., E.A. Pajarillo, J.K. Oh, H. Kim, and D.K. Kang. 2016. Revealing the combined effects of lactulose and probiotic enterococci on the swine faecal mi-crobiota using 454 pyrosequencing. Microb. Bio-technol. 9:486–495. doi: 10.1111/1751-7915.12370.
Chen, P.S., C.C. Wang, C.D. Bortner, G.S. Peng, X. Wu, H. Pang, R.B. Lu, P.W. Gean, D.M. Chuang, and J.S. Hong. 2007. Valproic acid and other histone deacet-ylase inhibitors induce microglial apoptosis and at-tenuate lipopolysaccharide-induced dopaminergic neurotoxicity. Neuroscience 149:203-212.
Clarke, G., R.M. Stilling, P.J. Kennedy, C. Stanton, J.F. Cryan, and T.G. Dinan. 2014. Minireview: gut mi-crobiota: the neglected endocrine organ. Mol. Endo-crinol. 28: 1221e1238. http://dx.doi.org/10.1210/me.2014-1108.
Cummings, J.H. and A.M. Stephen. 2007. Carbohydrate terminology and classification. Eur. J. Clin. Nutr. 61 (Suppl 1): S5–S18.
Davidson, M.H. and A. McDonald. 1998. Fiber: forms and functions. Nutr. Res. 18:617–624.
Desbonnet, L., L. Garrett, G. Clarke, B. Kiely, J.F. Cryan, and T.G. Dinan. 2010. Effects of the probiotic Bifido-bacterium infantis in the maternal separation model of depression. Neuroscience 170: 1179–1188. http://dx.doi.org/10.1016/j.neuroscience.2010.08.005.
De Silva, A. and S.R. Bloom. 2012. Gut Hormones and Appetite Control: A Focus on PYY and GLP-1 as Therapeutic Targets in Obesity. Gut Liver 6:10-20. doi: 10.5009/gnl.2012.6.1.10.
Destrez, A., P. Grimm, and V. Julliand. 2019. Dietary-induced modulation of the hindgut microbiota is re-lated to behavioral responses during stressful events in horses. Physiol. Behav. 202:94-100. doi: 10.1016/j.physbeh.2019.02.003.
Durmic, Z., D.W. Pethick, J.R. Pluske, and D.J. Hampson. 1998. Changes in bacterial populations in the colon of pigs fed different sources of dietary fibre, and the

26
development of swine dysentery after experimental infection. J. Appl. Microbiol. 85:574–582.
Erny, D., A.L. Hrabě de Angelis, D. Jaitin, P. Wieghofer, O. Staszewski, E. David, H. Keren-Shaul, T. Mahla-koiv, K. Jakobshagen, T. Buch, V. Schwierzeck, O. Utermöhlen, E. Chun, W.S. Garrett, K.D. McCoy, A. Diefenbach, P. Staeheli, B. Stecher, I. Amit, and M. Prinz. 2015. Host microbiota constantly control maturation and function of microglia in the CNS. Nat. Neurosci. 18:965-77. doi: 10.1038/nn.4030.
Fischer, A., F. Sananbenesi, X. Wang, M. Dobbin, and L.H. Tsai. 2007. Recovery of learning and memory is associated with chromatin remodeling. Nature 447: 178e182. http://dx.doi.org/10.1038/nature05772.
Fouhse, J.M., M.G. Gänzle, A.D. Beattie, T. Vasanthan, and R.T. Zijlstra. 2017. Whole-Grain Starch and Fi-ber Composition Modifies Ileal Flow of Nutrients and Nutrient Availability in the Hindgut, Shifting Fecal Microbial Profiles in Pigs. J. Nutr. 147:2031-2040. doi: 10.3945/jn.117.255851.
Frese, S.A., K. Parker, C.C. Calvert, and D.A. Mills. 2015. Diet shapes the gut microbiome of pigs during nurs-ing and weaning. Microbiome 3:28. doi: 10.1186/s40168-015-0091-8. eCollection.
Fuller, M.F. 2004. The encyclopedia of farm animal nu-trition. Wallingford: CABI Publishing. https://doi.org/10.1079/9780851993690.0000
Garcia-Mazcorro, J.F., S.L. Ishaq, M.V. Rodriguez-Her-rera, C.A. Garcia-Hernandez, J.R. Kawas, and T.G. Nagaraja. 2019. Review: Are there indigenous Sac-charomyces in the digestive tract of livestock ani-mal species? Implications for health, nutrition and productivity traits. Animal 15:1-9. doi: 10.1017/S1751731119001599.
Gaskins, H.R., C.T. Collier, and D.B. Anderson. 2002. Antibiotics as growth promotants: mode of action. Anim. Biotechnol. 13:29–42.
Haettig, J., D.P. Stefanko, M.L. Multani, D.X. Figueroa, S.C. McQuown, and M.A. Wood. 2011. HDAC in-hibition modulates hippocampus-dependent long-term memory for object location in a CBP-depen-dent manner. Learn. Mem. 18: 71e79. http://dx.doi.org/10.1101/lm.1986911.
Hamer, H.M., D. Jonkers, K. Venema, S. Vanhoutvin, F.J. Troost, and R.J. Brummer. 2008. Review article: the role of butyrate on colonic function. Aliment. Phar-macol. Ther. 27: 104e119. http://dx.doi.org/10.1111/j.1365-2036.2007.03562.x.
Heini, A.F.1., C. Lara-Castro, H. Schneider, K.A. Kirk, R.V. Considine, and R.L. Weinsier. 1998. Effect of hydrolyzed guar fiber on fasting and postprandial satiety and satiety hormones: a double-blind, place-
bo-controlled trial during controlled weight loss Int. J. Obes. Relat. Metab. Disord. 22: 906-909.
Heinritz, S.N., E. Weiss, M. Eklund, T. Aumiller, C.M.E Heyer, S. Messner, A. Rings, S. Louis, S.C Bischoff, and R. Mosenthin. 2016. Impact of a high-fat or high-fiber diet on intestinal microbiota and meta-bolic markers in a pig model. Nutrients 8:1–16.
Herfel, T.M., S.K. Jacobi, X. Lin, V. Fellner, D.C. Walker, Z.E. Jouni, and J. Odle. 2011. Polydextrose enrich-ment of infant formula demonstrates prebiotic char-acteristics by altering intestinal microbiota, organic acid concentrations, and cytokine expression in suckling piglets. J. Nutr. 141:2139-45. doi: 10.3945/jn.111.143727
Hicks, T.A., J.J. McGlone, C.S. Whisnant, H.G. Kattesh, and R.L. Norman. 1998. Behavioural, endocrine, immune and performance measures for pigs ex-posed to acute stress. J. Anim. Sci. 76:474–83. doi: 10.2527/1998.762474x
Hills, R.D. Jr., B.A Pontefract, H.R. Mishcon, C.A. Black, S.C. Sutton, and C.R. Theberge. 2019. Gut microbi-ome: profound implications for diet and disease. Nu-trients 11(7). pii: E1613. doi: 10.3390/nu11071613. Review.
Hipsley, E. H. 1953. Dietary fibre and pregnancy toxae-mia. Brit. Med. J. 2: 420–422.
Holt, J.P., L.J. Johnston, S.K. Baidoo, and G.C. Shurson. 2006. Effects of a high-fiber diet and frequent feed-ing on behavior, reproductive performance, and nutrient digestibility in gestating sows. J. Anim. Sci. 84:946–55.
Hyung, Y., M. Ellis, and R.W. Johnson. 1998. Effects of feeder type, space allowance, and mixing on the growth performance and feed intake pat-tern of growing pigs. J. Anim. Sci. 76:2771–8. doi: 10.2527/1998.76112771x
Ingerslev, A.K., S.J. Mutt, H.N. Lærke, M.S. Hedemann, P.K. Theil, K.L. Nielsen, H. Jørgensen, K.H. Herzig, and K.E. Bach Knudsen. 2017. Postprandial PYY increase by resistant starch supplementation is in-dependent of net portal appearance of short-chain fatty acids in pigs. PLoS One 12(10):e0185927. doi: 10.1371/journal.pone.0185927
Intlekofer, K.A., N.C. Berchtold, M. Malvaez, A.J. Car-los, S.C. McQuown, M.J. Cunningham, M.A. Wood, and C.W. Cotman. 2013. Exercise and sodium bu-tyrate transform a subthreshold learning event into long-term memory via a brain-derived neurotrophic factor-dependent mechanism. Neuropsychophar-macol. 38: 2027e2034. http://dx.doi.org/10.1038/npp.2013.104.

27
Isaacson, R. and H.B. Kim HB. 2012. The intestinal mi-crobiome of the pig. Anim. Health Res. Rev. 13:100–109.
Jensen, M.B., L.J. Pedersen, P.K. Theil, C.C. Yde, and K.E. Bach Knudsen. 2012. Feeding motivation and plasma metabolites in pregnant sows fed diets rich in dietary fiber either once or twice daily. J. Anim. Sci. 90:1910–1919.
Karhunen, L.J., K.R. Juvonen, A. Huotari, A.K. Purho-nen, and K.H. Herzig. 2008. Effect of protein, fat, carbohydrate and fibre on gastrointestinal pep-tide release in humans. Regul. Pept. 149:70–8. doi: 10.1016/j.regpep.2007.10.008.
Kim, S.W., J.M. Hooker, N. Otto, K. Win, L. Muench, C. Shea, P. Carter, P. King, A.E. Reid, N.D. Volkow, and J.S. Fowler. 2013. Whole-body pharmacokinet-ics of HDAC inhibitor drugs, butyric acid, valproic acid and 4-phenylbutyric acid measured with car-bon-11 labeled analogs by PET. Nucl. Med. Biol. 40: 912e918. http://dx.doi.org/10.1016/j.nucmed-bio.2013.06.007.
Kläring, K., L. Hanske, N. Bui, C. Charrier, M. Blaut, D. Haller, C.M. Plugge, and T. Clavel. 2013. Intes-tinimonas butyriciproducens gen. nov., sp. nov., a butyrate producing bacterium from the mouse in-testine. Int. J. Syst. Evol. Microbiol. 63: 4606e4612. http://dx.doi.org/10.1099/ijs.0.051441-0.
Kyriazakis I., and G.C. Emmans. 1995. The voluntary feed intake of pigs given feeds based on wheat bran, dried citrus pulp and grass meal, in relation to mea-surements of feed bulk. Br. J. Nutr. 73:191-207.
Larraufie, P., C. Martin-Gallausiaux, N. Lapaque, J. Dore, F.M. Gribble, F. Reimann, and H.M. Blottiere. 2018. SCFAs strongly stimulate PYY production in human enteroendocrine cells. Sci. Rep. 8(1):74. doi: 10.1038/s41598-017-18259-0.
Lattal, K.M., R.M. Barrett, and M.A. Wood. 2007. Sys-temic or intrahippocampal delivery of histone deacetylase inhibitors facilitates fear extinction. Behav. Neurosci. 121:1125e1131. http://dx.doi.org/10.1037/0735-7044.121.5.1125.
Lee, C., L.R. Gilesc, W.L. Brydena, J.L. Downing P.C. Owense, A.C. Kirby, and P.C. Wynn. 2005. Perfor-mance and endocrine responses of group housed weaner pigs exposed to the air quality of a commer-cial environment. Livest. Prod. Sci. 93:255–62. doi: 10.1016/j.livprodsci.2004.10.003.
Levenson, J.M., K.J. O’Riordan, K.D. Brown, M.A. Trinh, D.L. Molfese, and J.D. Sweatt. 2004. Regulation of histone acetylation during memory formation in the hippocampus. J. Biol. Chem. 279: 40545e40559. http://dx.doi.org/10.1074/ jbc.M402229200.
Liu, B., W. Wang, X. Zhu, X. Sun, J. Xiao, D. Li, Y. Cui, C. Wang, and Y. Shi. 2018. Response of gut microbiota to dietary Fiber and metabolic interaction with SC-FAs in piglets. Front Microbiol. 9:2344. 48.
Liu, J., J. Sun, F. Wang, X. Yu, Z. Ling, H. Li, H. Zhang, J. Jin, W. Chen, M. Pang, J. Yu, Y. He, and J. Xu. 2015. Neuroprotective effects of clostridium butyricum against vascular dementia in mice via metabolic butyrate. Biomed. Res. Int. 2015:e412946. http://dx.doi.org/10.1155/2015/412946.
Liu, Y.W., W.H. Liu, C.C. Wu, Y.C. Juan, Y.C. Wu, H.P. Tsai, S. Wang, and Y.C. Tsai. 2016). Psychotropic effects of Lactobacillus plantarum PS128 in early life-stressed and naive adult mice. Brain Research 1631: 1–12. http://dx.doi.org/10.1016/j.brain res.2015.11.018.
Lyte, M. 2013. Microbial endocrinology in the micro-biome-gut-brain axis: how bacterial production and utilization of neurochemicals influence be-havior. PLoS Pathog. 9: e1003726. http://dx.doi.org/10.1371/journal.ppat.1003726.
Malbert, C.H. 2013. The brain-gut axis: insights from the obese pig model. Bull. Acad. Natl. Med. 197:1683-94; discussion 1694-9. Review. French.
Martínez-Miró, S., F. Tecles, M. Ramón, D. Escribano, F. Hernández, J. Madrid, J. Orengo, S. Martínez-Subiela, X. Manteca, and J.J. Cerón. 2016. Causes, consequences and biomarkers of stress in swine: an update. BMC Vet. Res. 12:171. doi: 10.1186/s12917-016-0791-8. Review.
Matt, S.M., J.M. Allen, M.A. Lawson, L.J. Mailing, J. A. Woods, and R.W. Johnson. 2018. Butyrate and di-etary soluble fiber improve neuroinflammation as-sociated with aging in mice. Front Immunol. 9:1832. doi: 10.3389/fimmu.2018.01832.
McCormack, U.M., T. Curião, S.G. Buzoianu, M.L. Pri-eto, T. Ryan, P. Varley, F. Crispie, E. Magowan, B.U. Metzler-Zebeli, D. Berry, O. O’Sullivan, P.D. Cotter, G.E. Gardiner, and P.G. Lawlor. 2017. Exploring a possible link between the intestinal microbiota and feed efficiency in pigs. Appl. Environ. Microbiol. 83(15). pii: e00380-17. doi: 10.1128/AEM.00380-17.
McNabney, S.M and T.M.Henagan. 2017. Short chain fatty acids in the colon and peripheral tissues: a fo-cus on butyrate, colon cancer, obesity and insulin resistance. Nutrients 9(12): pii: E1348. doi: 10.3390/nu9121348. Review.
Miki, T., M. Eguchi, K. Kurotani, T. Kochi, K. Kuwahara, R. Ito, Y. Kimura, H. Tsuruoka, S. Akter, I. Kashino, I. Kabe, N. Kawakami, and T. Mizoue. 2016. Dietary fi-ber intake and depressive symptoms in Japanese em-ployees: The Furukawa Nutrition and Health Study. Nutrition 32:584-9. doi: 10.1016/j.nut.2015.11.014.
28
pionate stimulates GLP-1 and PYY secretion via free fatty acid receptor 2 in rodents. Int. J. Obes. (Lond). 39:424-9. doi: 10.1038/ijo.2014.153.
Ramonet, Y., M.C. Meunier-Salaün, and J.Y. Dourmad. 1999. High-fiber diets in pregnant sows: digestive utilization and effects on the behavior of the ani-mals. J. Anim. Sci. 77:591–9.
Reigstad, C.S., C.E. Salmonson, J.F. Rainey 3rd, J.H. Szurszewski, D.R. Linden, J.L. Sonnenburg, G. Farru-gia, and P.C. Kashyap. 2015. Gut microbes promote colonic serotonin production through an effect of short-chain fatty acids on enterochromaffin cells. FASEB J. 29:1395-403. doi: 10.1096/fj.14-259598.
Sampson, T.R. and S.K. Mazmanian. 2015. Control of brain development, function, and behavior by the microbiome. Cell Host Microbe 17: 565e576. http://dx.doi.org/ 10.1016/j.chom.2015.04.011.
Sapkota, A., J.N. Marchant-Forde, B.T. Richert, and D.C. Lay. 2016. Including dietary fiber and resis-tant starch to increase satiety and reduce aggres-sion in gestating sows. J. Anim. Sci. 94:2117-27. doi: 10.2527/jas.2015-0013.
Savignac, H. M., B. Kiely, T.G. Dinan, and J.F. Cryan. 2014. Bifidobacteria exert strain specific effects on stress-related behavior and physiology in BALB/c mice. Neurogastroenterol. and Motil. 26: 1615–1627. http://dx.doi.org/10.1111/nmo.12427.
Schroeder, F. A., C. L. Lin, W.E. Crusio, and S. Akbar-ian. 2007. Antidepressant-like effects of the his-tone deacetylase inhibitor, sodium butyrate, in the mouse. Biol. Psychiatry 62: 55–64. ttp://dx.doi.org/10.1016/j.biopsych.2006.06.036.
Selkrig, J., P. Wong, X. Zhang, and S. Pettersson. 2014. Metabolic tinkering by the gut microbiome: impli-cations for brain development and function. Gut Microbes 5:369-80. doi: 10.4161/gmic.28681.
Sherry, C.L., S.S. Kim, R.N. Dilger, L.L. Bauer, M.L. Moon, R.I. Tapping, G.C. Fahey, K.A. Tappenden, and G.G. Freund. 2010. Sickness behavior induced by endotoxin can be mitigated by the dietary solu-ble fiber, pectin, through up-regulation of IL-4 and Th2 polarization. Brain Behav. Immun. 24:631–40. doi:10.1016/j.bbi.2010.01.015
Smulders, D., G. Verbeke, P. Mormède, and R. Geers. 2006. Validation of a behavioural observation tool to assess pig welfare. Physiol. Behav. 89:438–47. doi: 10.1016/j.physbeh.2006.07.002.
Souza da Silva, C., J.E. Bolhuis W.J. Gerrits, B. Kemp, and J.J. van den Borne. 2013. Effects of dietary fibers with different fermentation characteristics on feed-ing motivation in adult female pigs. Physiol Behav. 110–111:148–157.
Minamiyama, M., M. Katsuno, H. Adachi, M. Waza, C. Sang, Y. Kobayashi, F. Tanaka, M. Doyu, A. Inukai, and G. Sobue. 2004. Sodium butyrate ameliorates phenotypic expression in a transgenic mouse model of spinal and bulbar muscular atrophy. Hum. Mol. Genet. 13: 1183e1192. http://dx.doi.org/10.1093/hmg/ddh131.
Mkwanazi, M.V., C.N. Ncobela, A.T. Kanengoni, and M. Chimonyo. 2019. Effects of environmental en-richment on behaviour, physiology and perfor-mance of pigs - A review. Asian-Australas. J. Anim. Sci. 32:1-13. doi: 10.5713/ajas.17.0138.
Moreira, T.J.T.P., K. Pierre, F. Maekawa, C. Repond, A. Cebere, S. Liljequist, and L. Pellerin. 2009. Enhanced cerebral expression of MCT1 and MCT2 in a rat ischemia model occurs in activated microglial cells. J. Cereb. Blood Flow. Metab. 29: 1273e1283. http://dx.doi.org/ 10.1038/jcbfm.2009.50.
Mudd, A.T., K. Berding, M. Wang, S.M. Donovan, and R.N. Dilger. 2017. Serum cortisol mediates the re-lationship between fecal Ruminococcus and brain N-acetylaspartate in the young pig. Gut Microbes 8:589-600. doi: 10.1080/19490976.2017.1353849.
Nakamura, S., N. Kondo, Y. Yamaguchi, M. Hashigu-chi, K. Tanabe, C. Ushiroda, M. Kawahashi-Tokuhi-sa, K. Yui, M. Miyakoda, and T. Oku. 2014. Daily feeding of fructooligosaccharide or glucomannan delays onset of senescence in SAMP8 mice. Gas-troenterol. Res. Pract. 2014:303184. http://dx.doi.org/10.1155/2014/303184.
Pajarillo, E.A., J.P. Chae, M.P. Balolong, H.B. Kim, and D.K. Kang. 2014. Assessment of fecal bacterial di-versity among healthy piglets during the weaning transition. J. Gen. Appl. Microbiol. 60:140–6.
Pajarillo, E.A., J.P. Chae, M.P. Balolong, H.B. Kim, K.S. Seo, and D.K. Kang. 2014. Pyrosequencing-based analysis of fecal microbial communities in three purebred pig lines. J. Microbiol. 52:646–651. doi: 10.1007/s12275-014-4270-2.
Peters, S.G., E.W. Pomare, and C.A. Fisher. 1992. Portal and peripheral blood short chain fatty acid concen-trations after caecal lactulose instillation at surgery. Gut 33:1249e1252.
Pluschke, A.M., B.A. Williams, D. Zhang, S.T. Ander-son, E. Roura, and M.J. Gidley. 2018. Male grower pigs fed cereal soluble dietary fibres display biphasic glucose response and delayed glycaemic response after an oral glucose tolerance test. PLoS One 13(3):e0193137. doi: 10.1371/journal.pone.0193137.
Psichas, A., M.L. Sleeth, K.G. Murphy, L. Brooks, G.A. Bewick, A.C. Hanyaloglu, M.A. Ghatei, S.R. Bloom, and G. Frost. 2015. The short chain fatty acid pro-
29
Spencer, R.L. and T. Deak T. 2017. A users guide to HPA axis research. Physiol Behav. 178:43-65. doi: 10.1016/j.physbeh.2016.11.014.
Stackebrandt, E., I. Kramer, J. Swiderski, and H. Hippe. 1999. Phylogenetic basis for a taxonomic dissection of the genus Clostridium. FEMS Immunol. Med. Microbiol. 24: 253e258.
Sudo N., Y. Chida, Y. Aiba, J. Sonoda, N. Oyama, X.N. Yu, C. Kubo, and Y. Koga. 2004. Postnatal microbial colonization programs the hypothalamic-pituitary-adrenal system for stress response in mice. J. Physi-ol. 558:263–275.
Sun, H.Q., C.Q. Tan, H.K. Wei, Y. Zou, G. Long, J.T. Ao, H.X. Xue S.W. Jiang, and J. Peng. 2015. Effects of dif-ferent amounts of konjac flour inclusion in gestation diets on physio-chemical properties of diets, post-prandial satiety in pregnant sows, lactation feed in-take of sows and piglet performance. Anim. Reprod. Sci. 152:55–64.
Taylor AM, and Holscher HD. A review of dietary and microbial connections to depression, anxiety, and stress. Nutr. Neurosci. 2018 Jul 9:1-14. doi:10.1080/1028415X.2018.1493808.
Trachsel, J., C. Briggs, N.K. Gabler, H.K Allen, and C.L. Loving. 2019. Dietary resistant potato starch alters intestinal microbial communities and their metabo-lites, and markers of immune regulation and bar-rier function in swine. Front Immunol. 10:1381. doi: 10.3389/fimmu.2019.01381.
Val-Laillet, D., S. Guérin, N. Coquery, I. Nogret, M. Formal, V. Romé, L. Le Normand, P. Meurice, G. Randuineau, P. Guilloteau, C.H. Malbert, P. Parnet, J.P. Lallès, and J.P. Segain. 2018. Oral sodium butyr-ate impacts brain metabolism and hippocampal neurogenesis, with limited effects on gut anatomy and function in pigs. FASEB J. 32:2160-2171. doi: 10.1096/fj.201700547RR.
Vecsey, C.G., J.D. Hawk, K.M. Lattal, J.M. Stein, S.A. Fa-bian, M.A. Attner, S.M. Cabrera, C.B. McDonough, P.K. Brindle, T. Abel, and M.A. Wood. 2007. Histone deacetylase inhibitors enhance memory and synap-tic plasticity via CREB: CBP dependent transcrip-tional activation. J. Neurosci. 27: 6128e6140. http://dx.doi.org/10.1523/JNEUROSCI.0296-07.2007.
Verschuren, L.M.G., M.P.L. Calus, A.J.M. Jansman, R. Bergsma, E.F. Knol, H. Gilbert, and O. Zemb. 2018. Fecal microbial composition associated with varia-
tion in feed efficiency in pigs depends on diet and sex. J. Anim. Sci. 96:1405-1418. doi: 10.1093/jas/sky060.
Vijay, N., and M.E. Morris. 2014. Role of monocarboxyl-ate transporters in drug delivery to the brain. Curr. Pharm. Des. 20:1487e1498.
Wojtulewicz, K., D. Tomaszewska-Zaremba, and A.P. Herman. 2017. Endotoxin-induced inflammation suppresses the effect of melatonin on the release of lh from the ovine pars tuberalis explants-ex vivo study. Molecules 22(11). pii: E1933. doi: 10.3390/molecules22111933.
Yamakawa, K., P.S. Rajendran, T. Takamiya, D. Yagishita, E.L. So, A. Mahajan, K. Shivkumar, and M. Vaseghi. 2015. Vagal nerve stimulation activates vagal affer-ent fibers that reduce cardiac efferent parasympa-thetic effects. Am. J. Physiol. Heart Circ. Physiol. 309:H1579-90. doi: 10.1152/ajpheart.00558.2015.
Yan, H., R. Potu, H. Lu, V. Vezzoni de Almeida, T. Stew-art, D. Ragland, A. Armstrong, O. Adeola, C.H. Nakatsu, and K.M. Ajuwon KM. 2013. Dietary fat content and fiber type modulate hind gut mi-crobial community and metabolic markers in the pig. PLoS One 8(4):e59581. doi: 10.1371/journal.pone.0059581.
Yang, H., X. Huang, S. Fang, M. He, Y. Zhao, Wu Z, M. Yang, Z. Zhang, C. Chen, and L. Huang. 2017. Un-raveling the fecal microbiota and metagenomic functional capacity associated with feed efficiency in pigs. Front Microbiol. 8:1555.
Ye, Z., V. Arumugam, E. Haugabrooks, P. Williamson, and S. Hendrich. 2015. Soluble dietary fiber (Fiber-sol-2) decreased hunger and increased satiety hor-mones in humans when ingested with a meal. Nutr Res. 35:393-400. doi: 10.1016/j.nutres.2015.03.004
Zhang, L., C. Mu, X. He, Y. Su, S. Mao, Zhang J, H. Smidt, and W. Zhu. 2016. Effects of dietary fibre source on microbiota composition in the large in-testine of suckling piglets. FEMS Microbiol. Lett. 363:1–6.
Zhao, J., P. Liu, Y. Wu, P. Guo, L. Liu, N. Ma, C. Levesque, Y. Chen, J. Zhao, J. Zhang, and X. Ma. 2018. dietary fiber increases butyrate-producing bacteria and im-proves the growth performance of weaned piglets. J. Agric. Food Chem. 66:7995-8004. doi: 10.1021/acs.jafc.8b02545.

30
31
Introduction Research to discover the relationship between gas-trointestinal health and immunological response in farm animal’s related to their productivity is an impor-tant and growing area of research. Ultimately ‘gut health’ represents the outcome of the gastrointestinal tract in response to its capacity and ability to respond and adapt to the insults and challenges it encounters (Pluske et al., 2017). Gut health in pigs can be compromised even in the absence of a disease challenge. The low feed intake after weaning for example means an absence of luminal nutrition (Dong and Pluske, 2007). Stressors and chal-lenges associated with weaning also cause changes to the structure and function of the gastro-intestinal tract
(GIT; Celi et al., 2017; Kim et al., 2012; Jayaraman and Nyachoti, 2017; Moeser et al., 2017; Pluske et al., 1997). Together the immediate post-weaning period in pigs not only causes structural but also functional changes to the small intestine (Camilleri et al., 2012; Pluske et al., 1996), and also contributes to an intestinal inflamma-tory status that in turn compromises the villous-crypt architecture (McCracken et al., 1999; Pié et al., 2004), GIT barrier function (Camilleri et al., 2012; Kim et al., 2012; Moeser et al., 2017; Wijtten et al., 2011), and dis-ruption of the microbiota (Fouhse et al., 2016; Gresse et al., 2017; Schachtschneider et al., 2013). Complex in-teractions occurring in the GIT between nutrition, the mucosa, and the microbiota impact gut health in early life (Pluske et al., 2017).
Mushroom Products in Nursery Pig DietsJacob Richert1, Susan Eicher2, Omoanghe Isikhuemhen3,
Jim Nelssen1, and Brian Richert4 1Department of Animal Sciences and Industry, Kansas State University, Manhattan KS 66506
2USDA-ARS, Livestock Behavior Research Unit, West Lafayette, IN 47907
3Department of Natural Resources and Environmental Design, North Carolina A&T, Greensboro NC 27411
4Department of Animal Sciences, Purdue University, West Lafayette IN 47907
Phone: 765-494-4837; email: [email protected]
SummaryMedicinal mushrooms have been around for thousands of years, most of which produce biometabo-lites that can possibly treat diseases. Cordyceps Sinesus has been reported to have been used in west-ern Nepal to cure multiple diseases including, diarrhea, headache, cough, rheumatism, and liver disease. Through the first 3 experiments, the Cordyceps mushroom powder at the 300 ppm inclusion level provided similar growth performance to the antimicrobial carbadox when the diets contained pharmacological levels of zinc or copper. However, the response was only about one-half the carba-dox response when the diets did not contain pharmacological levels of Zn and Cu. It appeared that levels about 300 ppm may hinder pig growth performance early in the nursery period and the ability of the mushroom powder step-down program to greatly increase feed intake as the nursery period went on is very intriguing and requires further research, at these lower inclusion levels of mushroom powder. Carbadox produced a consistent 1-1.5 kg increase in nursery pig body weight at the end of each study. In the third experiment the response to the combination of pharmacological levels of Zn and Cu was greater than any other treatment evaluated, including carbadox, and was greater than previously observed at this facility, however the minerals’ future is already being limited in the EU and may be limited here in the US in time as well. The full mechanism the mushroom powder is working through still needs to be elucidated but it may be through antimicrobial and anti-viral characteristics to this mushroom as well as a shift in the microbiome and/or potential long term intestinal immune modifications. The 300 ppm mushroom and step-down treatments were both comparable in results to Carbadox and with more research mushroom powder could serve as a possible antimicrobial replacement in nursery diets.
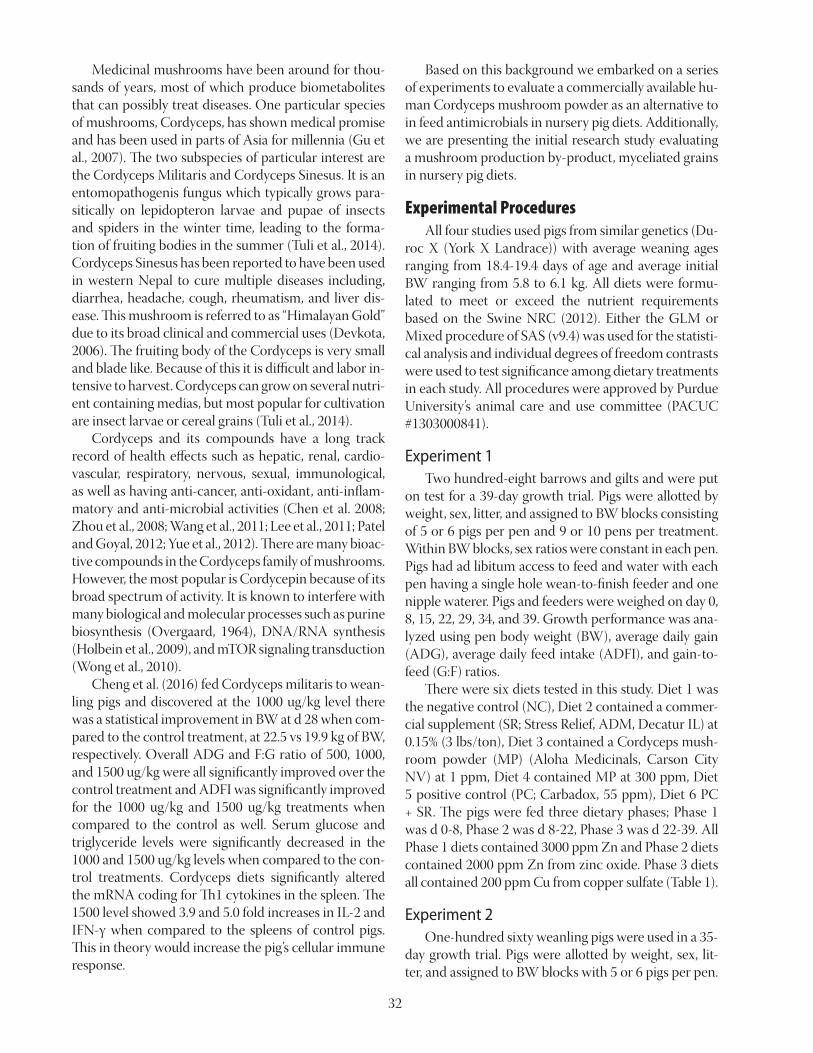
32
Medicinal mushrooms have been around for thou-sands of years, most of which produce biometabolites that can possibly treat diseases. One particular species of mushrooms, Cordyceps, has shown medical promise and has been used in parts of Asia for millennia (Gu et al., 2007). The two subspecies of particular interest are the Cordyceps Militaris and Cordyceps Sinesus. It is an entomopathogenis fungus which typically grows para-sitically on lepidopteron larvae and pupae of insects and spiders in the winter time, leading to the forma-tion of fruiting bodies in the summer (Tuli et al., 2014). Cordyceps Sinesus has been reported to have been used in western Nepal to cure multiple diseases including, diarrhea, headache, cough, rheumatism, and liver dis-ease. This mushroom is referred to as “Himalayan Gold” due to its broad clinical and commercial uses (Devkota, 2006). The fruiting body of the Cordyceps is very small and blade like. Because of this it is difficult and labor in-tensive to harvest. Cordyceps can grow on several nutri-ent containing medias, but most popular for cultivation are insect larvae or cereal grains (Tuli et al., 2014). Cordyceps and its compounds have a long track record of health effects such as hepatic, renal, cardio-vascular, respiratory, nervous, sexual, immunological, as well as having anti-cancer, anti-oxidant, anti-inflam-matory and anti-microbial activities (Chen et al. 2008; Zhou et al., 2008; Wang et al., 2011; Lee et al., 2011; Patel and Goyal, 2012; Yue et al., 2012). There are many bioac-tive compounds in the Cordyceps family of mushrooms. However, the most popular is Cordycepin because of its broad spectrum of activity. It is known to interfere with many biological and molecular processes such as purine biosynthesis (Overgaard, 1964), DNA/RNA synthesis (Holbein et al., 2009), and mTOR signaling transduction (Wong et al., 2010). Cheng et al. (2016) fed Cordyceps militaris to wean-ling pigs and discovered at the 1000 ug/kg level there was a statistical improvement in BW at d 28 when com-pared to the control treatment, at 22.5 vs 19.9 kg of BW, respectively. Overall ADG and F:G ratio of 500, 1000, and 1500 ug/kg were all significantly improved over the control treatment and ADFI was significantly improved for the 1000 ug/kg and 1500 ug/kg treatments when compared to the control as well. Serum glucose and triglyceride levels were significantly decreased in the 1000 and 1500 ug/kg levels when compared to the con-trol treatments. Cordyceps diets significantly altered the mRNA coding for Th1 cytokines in the spleen. The 1500 level showed 3.9 and 5.0 fold increases in IL-2 and IFN-γ when compared to the spleens of control pigs. This in theory would increase the pig’s cellular immune response.
Based on this background we embarked on a series of experiments to evaluate a commercially available hu-man Cordyceps mushroom powder as an alternative to in feed antimicrobials in nursery pig diets. Additionally, we are presenting the initial research study evaluating a mushroom production by-product, myceliated grains in nursery pig diets.
Experimental Procedures All four studies used pigs from similar genetics (Du-roc X (York X Landrace)) with average weaning ages ranging from 18.4-19.4 days of age and average initial BW ranging from 5.8 to 6.1 kg. All diets were formu-lated to meet or exceed the nutrient requirements based on the Swine NRC (2012). Either the GLM or Mixed procedure of SAS (v9.4) was used for the statisti-cal analysis and individual degrees of freedom contrasts were used to test significance among dietary treatments in each study. All procedures were approved by Purdue University’s animal care and use committee (PACUC #1303000841).
Experiment 1 Two hundred-eight barrows and gilts and were put on test for a 39-day growth trial. Pigs were allotted by weight, sex, litter, and assigned to BW blocks consisting of 5 or 6 pigs per pen and 9 or 10 pens per treatment. Within BW blocks, sex ratios were constant in each pen. Pigs had ad libitum access to feed and water with each pen having a single hole wean-to-finish feeder and one nipple waterer. Pigs and feeders were weighed on day 0, 8, 15, 22, 29, 34, and 39. Growth performance was ana-lyzed using pen body weight (BW), average daily gain (ADG), average daily feed intake (ADFI), and gain-to-feed (G:F) ratios. There were six diets tested in this study. Diet 1 was the negative control (NC), Diet 2 contained a commer-cial supplement (SR; Stress Relief, ADM, Decatur IL) at 0.15% (3 lbs/ton), Diet 3 contained a Cordyceps mush-room powder (MP) (Aloha Medicinals, Carson City NV) at 1 ppm, Diet 4 contained MP at 300 ppm, Diet 5 positive control (PC; Carbadox, 55 ppm), Diet 6 PC + SR. The pigs were fed three dietary phases; Phase 1 was d 0-8, Phase 2 was d 8-22, Phase 3 was d 22-39. All Phase 1 diets contained 3000 ppm Zn and Phase 2 diets contained 2000 ppm Zn from zinc oxide. Phase 3 diets all contained 200 ppm Cu from copper sulfate (Table 1).
Experiment 2 One-hundred sixty weanling pigs were used in a 35-day growth trial. Pigs were allotted by weight, sex, lit-ter, and assigned to BW blocks with 5 or 6 pigs per pen.

33
Within BW blocks sex ratios were constant in each pen. There were 5 dietary treatments: 1) a negative control diet without a feed antimicrobial; 2) a positive control diet containing 55 ppm carbadox; 3) 300 ppm Cordy-ceps MP; 4) 600 ppm MP; and 5) a step-down treatment containing 900, 900, 450, 300, and 150 ppm mushroom powder for weeks 1, 2, 3, 4, and 5, respectively. The pigs were fed four dietary phases over the 35-day period (Ta-ble 2). Phase 1 was d 0-7, Phase 2 was d 7-14, Phase 3 was d 14-21, Phase 4 was d 21-35. All Phase 1, 2, and 3 diets contained 2700 ppm Zn from zinc oxide and all Phase 4 diets contained 200 ppm Cu from copper sulfate. Pigs had ad libitum access to feed and water through a 5-hole dry nursery feeder and single cup waterer per pen. Pigs and feeders were weighed on day 0, 7, 14, 21, 28, and 35. A fecal sample from one medium barrow and gilt per pen were collected by rectal massage on d 14 and frozen at -20° C until later analyzed for volatile fatty ac-ids (VFA) and future microbiome analysis. Concentra-tions of fecal VFA’s were determined by a gas chromato-graphic method (Erwin et al., 1961). Blood samples were collected from one medium weight barrow and gilt per pen on d 14 and 34. The blood samples were used to de-termine plasma Tumor Necrosis Factor alpha (TNF-α) concentrations (ELISA; R&D Systems Inc, McKinley Place NE Minneapolis MN) and leukocyte PCR analy-sis (d 14 only). The white blood cell samples and stan-dards were analyzed using porcine-specific primers and probes to determine expression of TLR2, IL-6, IL-10 (Applied Biosystems Inc.) using an ABI Prism 7000 se-quence detection system (Applied Biosciences Inc.).
Experiment 3 One-hundred sixty gilts and barrows were used for a 33-day growth trial. Pigs were divided by weight, sex, litter, and assigned to BW blocks with 7 pigs per pen. Within BW blocks sex ratios were constant in each pen. Pigs and feeders were weighed on day 0, 7, 14, 21, 27, 33. The individual body weights and pen feed intake were recorded to determine pen ADG, ADFI, and G:F ratios. There were five diets tested in this study. Nursery diet 1 was the negative control containing no pharma-cological levels Zn or Cu; Diet 2 contained Cordyceps MP (Aloha Medicinals, Carson City NV) at 300 ppm; Diet 3 contained Carbadox at 55 ppm; Diet 4 contained Carbadox (55 ppm) in combination with 300 ppm MP; Diet 5 contained 125 ppm Cu d 0-33 and 3000 ppm Zn from d 0-7 declining to 2000 ppm from d 7-33 (CuZn). The pigs were fed four dietary phases; Phase 1 was d 0-7, Phase 2 was d 7-14, Phase 3 was d 14-21, Phase 4 was d 21-33 (Table 2). Blood samples were collected from 1 median weight barrow and gilt in each pen on d 14
Table 1. Experiment 1 Basal diet formulation
Ingredient, % Phase 1 Phase 2 Phase 3Corn 36.985 45.960 52.640Soybean meal, CP 48% 15.600 20.750 30.080DDGS, 7% Fat 0.000 5.000 10.000Swine Grease 0.000 0.000 3.000Soybean Oil 4.000 3.000 0.000Limestone 0.760 0.910 1.360MonoCal Phos. 0.450 0.600 0.660Vitamin Premix1 0.250 0.250 0.250Trace Mineral Premix2 0.150 0.150 0.150Se Premix3 0.050 0.050 0.050Phytase4 0.100 0.100 0.100Salt 0.250 0.300 0.350Plasma Protein 5.000 0.000 0.400SD Blood Meal 1.000 1.000 0.000Soy Conc. 4.000 4.000 0.000Fish Meal 5.000 4.000 0.000Dried Whey 25.000 12.500 0.000Lysine-HCL 0.160 0.300 0.400DL-Methionine 0.230 0.200 0.145L-Threonine 0.080 0.130 0.125L-Tryptophan 0.020 0.020 0.010Carbadox – 10 0.000 0.000 0.000Zinc Oxide 0.415 0.280 0.000Banmith-48 0.000 0.000 0.100Treatment Premix5 0.500 0.500 0.500Total 100.00 100.00 100.00
Calculated NutrientsME, Kcal/kg 3478.6 3414.8 3400.2NE, Kcal/kg 2682.5 2572.4 2501.1CP, % 24.38 23.00 21.89Total Lys, % 1.73 1.56 1.43SID Lys 1.55 1.40 1.25SID Met 0.55 0.53 0.44SID M+C 0.91 0.82 0.73SID Thr 0.97 0.88 0.78SID Tryp 0.29 0.26 0.23SID Iso 0.86 0.82 0.77SID Val 1.06 0.95 0.85Ca,% 0.90 0.85 0.75P, % 0.76 0.68 0.57Avail. Phos., % 0.60 0.50 0.371Provided per kg of diet: vitamin A, 6,614 IU; vitamin D3, 661 IU; vitamin E, 44 IU; vitamin K, 2.2 mg; riboflavin, 9 mg; panto-thenic acid, 22 mg; niacin, 33 mg and B12 38.6 mg.2Provided per kg of diet digestible minerals: iron, 121.3 mg; zinc, 121.2 mg; manganese, 15.0 mg; copper, 11.33 mg; iodine, and 0.46 mg.3Provided 0.3 ppm Se4Provided 600 FTU per kg of the diet5 Diet 1 was the negative control containing a 0.5% corn premix, Diet 2 contained a commercial supplement (Stress Relief, ADM, Decatur IL) at 0.15% (3 lbs/ton), Diet 3 contained a Cordyceps mushroom powder (MP) (Aloha Medicinals, Carson City NV) at 1 ppm, Diet 4 contained MP at 300 ppm, Diet 5 contained Carbadox (55 ppm), Diet 6 contained a combination of Stress Relief and Carbadox.

34
to determine plasma TNF-α concentrations (R&D Systems Inc, Minneapolis MN). Fecal sampling occurred on d 32 of the study by rectal stimulation of 1 median weight bar-row and gilt of each pen for fecal VFA analy-sis and future microbiome analysis.
Experiment 4 Forty-eight barrows were weaned and were group housed by treatment and fed the Phase 1 diet for 4 days to get over the wean-ing stress before being isolated in individ-ual pens. On Day 4 pigs were weighed and placed in their individual pen. Pigs were in the individual pens for 17 days. Pigs were fed a Phase 2 diet for 7 days and Phase 3 diet for 10 days (Table 2). Individual housing provid-ed 12 pigs per treatment for this preliminary study. Diets included: 1) Negative Control without pharmacological levels of Zn and Cu; 2) Oyster mushroom myceliated grain at 2.5% replacing corn in the NC; 3) Oyster mushroom myceliated grain at 5% replacing corn in the NC; and 4) Positive control (Car-badox at 55 ppm).
Results Experiment 1 During the first 8 days of the study there was a trend for Carbadox to have increased ADG (P = 0.091), ADFI (P = 0.107) and d 8 BW (P = 0.082) compared to the NC (Table 3). Pigs fed the 300 ppm MP treatment tend-ed to have greater ADFI (P = 0.082) than pigs fed the 1 ppm MP. For the Phase 2 period (d 8 to 22), pigs fed Carbadox significantly increased ADG (P = 0.004) and ADFI (P = 0.016), and tended to have increased feed efficiency (P =0.090) compared to the NC treatment. Pigs fed 300 ppm MP tended to have greater ADFI (P = 0.072) than pigs fed the 1 ppm MP treatment. There was also a trend for decreased feed efficiency when comparing the 300 ppm treatment to the NC treatment (P =0.059). During Phase 3 (d 22 to 39) stress relief (P=0.091) and Carba-dox (P=0.093) both tended to have improved ADG compared to the NC. The combination of stress relief and Carbadox were numeri-cally the greatest for ADG and ADFI during Phase 3, as well as having the greatest end-ing BW at 21.50 kg. Overall d 0-39 carbadox
Table 2. Basal diet formulation for Experiments 2, 3 and 4
Ingredient, % Phase 1 Phase 2 Phase 3 Phase 4Corn 36.265 42.415 46.420 53.885Soybean meal, 48% CP 14.000 16.950 26.500 28.925DDGS, 7% fat 0.000 5.000 7.500 10.000Choice white grease 0.000 0.000 0.000 3.000Soybean oil 5.000 4.000 3.000 0.000Limestone 0.650 0.810 0.890 1.415Monocal. Phos., 21% P 0.480 0.530 0.180 0.560Vitamin premix1 0.250 0.250 0.250 0.250Trace mineral premix2 0.125 0.125 0.125 0.125Selenium premix3 0.050 0.050 0.050 0.050Phytase4 0.100 0.100 0.100 0.100Salt 0.250 0.250 0.300 0.350Plasma protein 5.000 2.500 0.000 0.000Spray-dried blood meal 1.500 1.000 0.000 0.000Soy concentrate 5.000 3.250 0.000 0.000Fish meal 4.650 4.500 5.000 0.000Dried whey 25.750 17.150 8.600 0.000Lysine-HCL 0.130 0.275 0.300 0.435DL-Methionine 0.230 0.210 0.160 0.150L-Threonine 0.060 0.110 0.110 0.140L-Tryptophan 0.010 0.025 0.015 0.015Copper sulfate 0.000 0.000 0.000 0.08Banmith-48 0.000 0.000 0.000 0.100Treatment premix5 0.500 0.500 0.500 0.500Total 100.00 100.00 100.00 100.00Calculated nutrientsMetabolizable energy, kcal/kg
3529.0 3472.9 3427.3 3401.5
Net energy, kcal/kg 2743.3 2658.4 2567.4 2516.8Crude protein, % 24.46 23.22 23.12 21.53Total lysine, % 1.73 1.62 1.52 1.43Standardized ileal digestible amino acids, %Lysine 1.55 1.45 1.35 1.25Methionine 0.54 0.53 0.50 0.44Methionine+cysteine 0.91 0.85 0.79 0.73Threonine 0.97 0.90 0.84 0.78Tryptophan 0.28 0.26 0.24 0.23Isoleucine 0.86 0.81 0.82 0.75Valine 1.08 0.97 0.91 0.83Ca,% 0.85 0.85 0.80 0.75P, % 0.76 0.72 0.62 0.55Available P, % 0.55 0.50 0.38 0.281 Provided per kg of diet: vitamin A, 6,614 IU; vitamin D3, 661 IU; vitamin E, 44
IU; vitamin K, 2.2 mg; riboflavin, 9 mg; pantothenic acid, 22 mg; niacin, 33 mg and B12, 38.6 mg.
2 Provided per kg of diet digestible minerals: iron, 121.3 mg; zinc, 121.2 mg; manganese, 15.0 mg; copper, 11.33 mg; iodine, and 0.46 mg.
3 Provided 0.3 ppm Se.4 Provided 600 FTU per kg of the diet.5 Exp.2. All Phase 1, 2, 3 diets had zinc oxide (0.375%) and Phase 4 had copper
sulfate (0.08%) and the experimental treatments were blended with fine ground corn. There were 5 dietary treatments: a negative control diet without a feed antimicrobial; a positive control diet containing 55 ppm carbadox; 300 or 600 ppm mushroom powder; and a step down treatment containing 900, 900, 450, 300, and 150 ppm mushroom powder for weeks 1, 2, 3, 4, and 5, respectively.
5 Exp.3. All Phases of basal diets did not contain any pharmacological levels of Zn or Cu. There were 5 dietary treatments: a negative control containing no pharmacological levels Zn or Cu; Diet 2 contained Cordyceps MP at 300 ppm; Diet 3 contained Carbadox at 55 ppm; Diet 4 contained Carbadox (55 ppm) in combination with 300 ppm MP; Diet 5 contained 125 ppm Cu d 0-33 and 3000 ppm Zn from d 0-7 declining to 2000 ppm from d 7-33 (CuZn).
5 Exp. 4. Phases 1, 2, and 3 were fed and the basal diets did not contain any pharmacological levels of Zn or Cu. There were 4 dietary treatments: a nega-tive control, positive control contained Carbadox at 55 ppm, and the myceli-ated grain treatments of 2.5 and 5.0% myceliated grain replaced the basal diet corn in each phase.

35
fed pigs had greater ADG (P = 0.005), ADFI (P=0.040), and feed efficiency (P < 0.05) than NC pigs and at d 39 Carbadox fed pigs were significantly heavier (P=0.005) than the NC at 21.2 kg, and 20.1 kg, respectively. Pigs fed 300 ppm MP tended to have increased ADFI over 1 ppm MP (P = 0.104) and NC (P = 0.103) but reduced feed efficiency (P = 0.080) compared to the NC pigs.
Experiment 2 During Phase 1 of the trial (d 0 to7) there was a ten-dency for a linear reduction in BW (P =0.066) as the mushroom concentration increased in the diet (Table 4). During Phase 2 (d 7-14) there was a trend for a cu-bic mushroom response in ADFI (P=0.072) and ADG (P =0.103), resulting in a cubic mushroom response in BW at d 14 of age (P =0.036). These cubic responses were caused by the pigs fed the 300 ppm MP dose hav-ing 8.7% greater ADG and 9.8% greater ADFI above the 0 ppm negative control pigs followed by the lowest ADG and ADFI at the 600 ppm level and the 900 ppm dose having a partial recovery of the pig growth perfor-mance. For Phase 3 (d 14-21) observed no statistical dif-ferences in performance among treatments (P > 0.10). During the first week of Phase 4 (d 21 to 28), pigs fed
carbadox had increased ADG (P = 0.032) and increased feed efficiency (P = 0.011) over pigs fed the NC. There was also a tendency for a linear increase in ADG (P = 0.092) and improvement in feed efficiency (P = 0.083) as mushroom concentration increased to 600 ppm. Dur-ing the second week of Phase 4 (d 28 to 35) there was a tendency for cubic ADFI response (P = 0.096) for mush-room inclusion with a 13% greater ADFI at the lowest 150 ppm inclusion followed by a 10.7% lower ADFI at the 300 ppm level and ADFI then increasing at the 600 ppm level close to the NC. For the entire Phase 4 period, d 21-35, pigs fed Carbadox had greater ADG (P =0.016) and tended to have improved feed efficiency (P = 0.086). For the pigs fed the MP there was a tendency for ADG (P = 0.062) to linearly increase to 600 ppm. Overall (d 0 to 35), pigs fed the 300 ppm MP diet tended (P =0.108) to have better feed efficiency compared to those fed the step-down MP treatment. However, there were no oth-er dietary treatment effects for the overall nursery study growth performance. The d 14 fecal VFA concentrations displayed a qua-dratic mushroom response in propionic acid and total VFA concentrations (P < 0.03), and a tendency (P < 0.10) was observed in butyric, and valeric acids (Table
Table 3. Nursery Growth Performance for Experiment 1
Diets1 NC SR 1ppm 300ppm Carb Carb&SR SE2Probability, P<
Carb SR Carb X SR 1 vs 300 300 vs NCPens/diet 10 10 9 9 10 10Initial Wt, kg 6.03 6.03 6.03 6.05 6.04 6.02 0.010 0.944 0.552 0.228 0.270 0.184
Day 0-8ADG, g 157 159 143 164 188 165 11.7 0.091 0.343 0.246 0.205 0.635ADFI, g 176 176 168 194 199 185 10.2 0.107 0.450 0.463 0.082 0.224G:F 0.878 0.910 0.853 0.846 0.943 0.894 0.032 0.426 0.787 0.184 0.873 0.467d8 BW, kg 7.28 7.30 7.18 7.36 7.55 7.34 0.094 0.093 0.316 0.201 0.169 0.537
Day 8-22 (Phase 2)ADG, g 315 323 299 326 353 370 15.1 0.004 0.394 0.727 0.214 0.618ADFI, g 428 449 418 465 468 494 18.3 0.016 0.178 0.889 0.072 0.144G:F 0.740 0.720 0.715 0.704 0.753 0.751 0.014 0.090 0.380 0.492 0.546 0.059d22 BW, kg 11.69 11.82 11.36 11.92 12.49 12.52 0.273 0.005 0.753 0.861 0.152 0.549
Day 22-39 (Phase 3)ADG, g 483 499 497 506 499 528 14.1 0.093 0.091 0.595 0.637 0.244ADFI, g 794 822 805 839 822 854 23.1 0.179 0.182 0.911 0.305 0.171G:F 0.608 0.608 0.621 0.604 0.608 0.620 0.009 0.468 0.460 0.454 0.180 0.746d39 BW, kg 19.90 20.30 19.80 20.52 20.97 21.50 0.412 0.005 0.232 0.848 0.221 0.284
Day 0-39ADG, g 356 366 353 371 383 397 10.6 0.005 0.227 0.824 0.232 0.301ADFI, g 536 555 535 572 567 587 15.9 0.040 0.191 0.975 0.104 0.103G:F 0.665 0.661 0.663 0.650 0.676 0.678 0.006 0.026 0.848 0.593 0.148 0.0801 Diets: NC = negative control; SR = Stress Relief product at 0.15%; 1 ppm = mushroom powder at 1ppm; 300 ppm = mushroom powder
at 300 ppm; Carb = Carbadox at 55 ppm; Carb + SR = Carbadox at 55 ppm plus Stress Relief product at 0.15%.2 Statistical Contrasts: Carb = the main effect of carbadox (Carb and Carb+SR vs NC and SR); SR = Main effect of Stress Relief (SR and
Carb+SR vs NC and Carb); Carb x SR = The interaction between Carbadox and Stress Relief; 1 vs 300 = comparison between 1 and 300 ppm MP; 300 vs NC = comparison between 300 ppm MP and negative control (NC) diets.
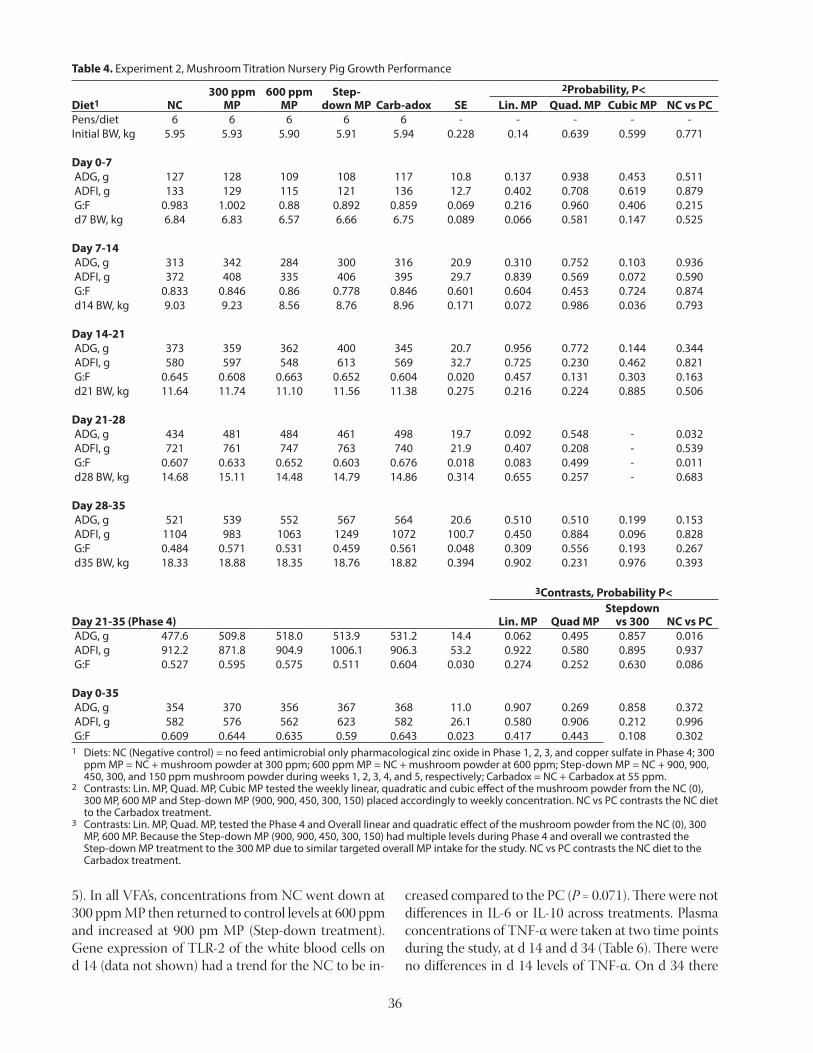
36
Table 4. Experiment 2, Mushroom Titration Nursery Pig Growth Performance
Diet1 NC300 ppm
MP600 ppm
MP Step-
down MP Carb-adox SE2Probability, P<
Lin. MP Quad. MP Cubic MP NC vs PCPens/diet 6 6 6 6 6 - - - - -Initial BW, kg 5.95 5.93 5.90 5.91 5.94 0.228 0.14 0.639 0.599 0.771
Day 0-7 ADG, g 127 128 109 108 117 10.8 0.137 0.938 0.453 0.511 ADFI, g 133 129 115 121 136 12.7 0.402 0.708 0.619 0.879 G:F 0.983 1.002 0.88 0.892 0.859 0.069 0.216 0.960 0.406 0.215 d7 BW, kg 6.84 6.83 6.57 6.66 6.75 0.089 0.066 0.581 0.147 0.525
Day 7-14 ADG, g 313 342 284 300 316 20.9 0.310 0.752 0.103 0.936 ADFI, g 372 408 335 406 395 29.7 0.839 0.569 0.072 0.590 G:F 0.833 0.846 0.86 0.778 0.846 0.601 0.604 0.453 0.724 0.874 d14 BW, kg 9.03 9.23 8.56 8.76 8.96 0.171 0.072 0.986 0.036 0.793
Day 14-21 ADG, g 373 359 362 400 345 20.7 0.956 0.772 0.144 0.344 ADFI, g 580 597 548 613 569 32.7 0.725 0.230 0.462 0.821 G:F 0.645 0.608 0.663 0.652 0.604 0.020 0.457 0.131 0.303 0.163 d21 BW, kg 11.64 11.74 11.10 11.56 11.38 0.275 0.216 0.224 0.885 0.506
Day 21-28 ADG, g 434 481 484 461 498 19.7 0.092 0.548 - 0.032 ADFI, g 721 761 747 763 740 21.9 0.407 0.208 - 0.539 G:F 0.607 0.633 0.652 0.603 0.676 0.018 0.083 0.499 - 0.011 d28 BW, kg 14.68 15.11 14.48 14.79 14.86 0.314 0.655 0.257 - 0.683
Day 28-35 ADG, g 521 539 552 567 564 20.6 0.510 0.510 0.199 0.153 ADFI, g 1104 983 1063 1249 1072 100.7 0.450 0.884 0.096 0.828 G:F 0.484 0.571 0.531 0.459 0.561 0.048 0.309 0.556 0.193 0.267 d35 BW, kg 18.33 18.88 18.35 18.76 18.82 0.394 0.902 0.231 0.976 0.393
Day 21-35 (Phase 4)
3Contrasts, Probability P<
Lin. MP Quad MPStepdown
vs 300 NC vs PC ADG, g 477.6 509.8 518.0 513.9 531.2 14.4 0.062 0.495 0.857 0.016 ADFI, g 912.2 871.8 904.9 1006.1 906.3 53.2 0.922 0.580 0.895 0.937 G:F 0.527 0.595 0.575 0.511 0.604 0.030 0.274 0.252 0.630 0.086
Day 0-35 ADG, g 354 370 356 367 368 11.0 0.907 0.269 0.858 0.372 ADFI, g 582 576 562 623 582 26.1 0.580 0.906 0.212 0.996 G:F 0.609 0.644 0.635 0.59 0.643 0.023 0.417 0.443 0.108 0.3021 Diets: NC (Negative control) = no feed antimicrobial only pharmacological zinc oxide in Phase 1, 2, 3, and copper sulfate in Phase 4; 300
ppm MP = NC + mushroom powder at 300 ppm; 600 ppm MP = NC + mushroom powder at 600 ppm; Step-down MP = NC + 900, 900, 450, 300, and 150 ppm mushroom powder during weeks 1, 2, 3, 4, and 5, respectively; Carbadox = NC + Carbadox at 55 ppm.
2 Contrasts: Lin. MP, Quad. MP, Cubic MP tested the weekly linear, quadratic and cubic effect of the mushroom powder from the NC (0), 300 MP, 600 MP and Step-down MP (900, 900, 450, 300, 150) placed accordingly to weekly concentration. NC vs PC contrasts the NC diet to the Carbadox treatment.
3 Contrasts: Lin. MP, Quad. MP, tested the Phase 4 and Overall linear and quadratic effect of the mushroom powder from the NC (0), 300 MP, 600 MP. Because the Step-down MP (900, 900, 450, 300, 150) had multiple levels during Phase 4 and overall we contrasted the Step-down MP treatment to the 300 MP due to similar targeted overall MP intake for the study. NC vs PC contrasts the NC diet to the Carbadox treatment.
5). In all VFA’s, concentrations from NC went down at 300 ppm MP then returned to control levels at 600 ppm and increased at 900 pm MP (Step-down treatment). Gene expression of TLR-2 of the white blood cells on d 14 (data not shown) had a trend for the NC to be in-
creased compared to the PC (P = 0.071). There were not differences in IL-6 or IL-10 across treatments. Plasma concentrations of TNF-α were taken at two time points during the study, at d 14 and d 34 (Table 6). There were no differences in d 14 levels of TNF-α. On d 34 there

37
was a Quadradic mushroom effect (P = 0.027), as 300 and the step down (150 ppm at d 34) MP treatments de-creased TNF-α, but the 600 ppm level stayed relatively similar to the NC in concentration.
Experiment 3 During phase 1 of the trial (d 0 to 7) there were sig-nificant increases in ADG, ADFI, feed efficiency, and d 7 BW (P < 0.01) for CuZn, and Carbadox significant increases in ADG, G:F, and d 7 BW with a tendency for an increase in ADFI (P = 0.0807) compared to the NC. There was a Mushroom x Carbadox tendency for an in-teraction in Phase 1 ADFI (P = 0.0955) with 300 ppm MP increasing ADFI over the NC but numerically decreas-ing ADFI when combined with Carbadox. For Phases 2 and 3 CuZn increased ADG, ADFI, G:F, and BW (P < 0.05) compared to the NC. Carbadox also increased ADG, ADFI, G:F, and BW in Phase 2 (P < 0.05) com-pared to the NC. In Phase 3 Carbadox improved ADG, ADFI, and BW (P < 0.05) compared to the NC. Phase 2 and 3 had no statistical differences for Mushroom or MxC interaction. In Phase 4 Mushroom, Carbadox, and CuZn had increased ADG and ADFI (P < 0.05). In Phase 4, CuZn fed pigs were improved in ADG, and ADFI (P < 0.05), however the CuZn fed pigs had reduced G:F com-pared to the NC. Overall, Carbdox had greater ADG, ADFI, and G:F ( P<0.05), while CuZn increased ADG
and ADFI (P < 0.05) both compared to the NC. While CuZn increased ADG and ADFI dramatically, it did not improve feed efficiency over the NC treatment. For the overall study the MP tended (P = 0.0759) to increase ADFI over the NC. Pigs fed the CuZn diet averaged 88 g/d better ADG over the negative control, with similar feed efficiency to the NC. The final BW for the CuZn treatment was 2.9 kg greater than the NC. Carbadox has well documented positive growth performance effects in the nursery, in this study these results were reproduced with Carbadox significantly improved performance in every category over the Negative control, adding 1.7 kg of BW by the end of the study. The mushroom treatment appears to have a delayed effect, the pigs were slightly numerically improved over the negative control pigs throughout the study in ADG, but in the final week of Phase 4, matched Carbadox performance in ADG and tended to increase overall ADFI (P<0.08). Additionally, the treatment of Carbadox + Mushroom had similar ADG throughout the study compared to Carbadox until the second week of phase 4, where the treatment was gaining an addition-al 67 g/d compared to the Carbadox alone treatment. There were no differences in fecal Acetic acid con-centrations among treatments (P >0.1; data not shown). For all other VFA’s and total VFA’s there was a MP by carbadox interaction where the MP or carbadox by itself
Table 5. Experiment 2, Fecal Volatile Fatty Acids on day 14
Diet1 NC300 ppm
MP600 ppm
MPStep-down
MP Carbadox SEProbability, P <
Lin. MP Quad. MP Cubic MP NC vs PCA2 69. 6 62.3 70.8 72.3 68.6 3.19 0.251 0.185 0.126 0.828P 32.1 26.3 30.4 36.6 32.3 2.19 0.086 0.013 0.430 0.933iB 2.5 1.8 2.4 2.6 2.9 0.30 0.473 0.143 0.156 0.365B 18.7 14.4 17.6 21.6 24.0 2.40 0.276 0.099 0.537 0.129iV 2.9 2.0 2.9 3.4 3.9 0.48 0.262 0.179 0.297 0.166V 3.9 2.6 3.7 4.8 4.5 0.62 0.181 0.061 0.407 0.481Total 129.5 109.3 127.8 141.3 136.2 7.22 0.111 0.030 0.188 0.5231 Diets: NC (Negative control) = no feed antimicrobial only zinc oxide in Phase 1, 2, 3, and copper sulfate in Phase 4; 300 ppm MP = NC +
mushroom powder at 300 ppm; 600 ppm MP = NC + mushroom powder at 600 ppm; Step-down MP = NC + 900, 900, 450, 300, and 150 ppm mushroom product during weeks 1, 2, 3, 4, and 5, respectively; Carbadox = NC + Carbadox at 55 ppm.
2 Volatile Fatty Acids: A=Acetic acid; P=Propionic acid; iB=isoButyric acid; B=Butyric acid; iV=isovaleric acid; V=Valeric acid; Total = Total VFA concentrations.
Table 6. Experiment 2, Plasma TNF-α concentrations.
Diets1 NC300 ppm
MP600 ppm
MPStep-down
MP Carba-dox SEProbability, P<
Lin. MP Quad. MP Cubic MP NC vs PCTNF-α, d 14 71.1 75.3 78. 9 82.6 58.7 6.69 0.219 0.970 0.981 0.207
Lin. MP Quad.MP Step-down
vs 300 NC vs PCTNF-α, d 34 77.3 49.5 74.4 56.8 60.8 10.02 0.822 0.027 0.592 0.2081 Diets: NC (Negative control) = no feed antimicrobial only zinc oxide in Phase 1, 2, 3, and copper sulfate in Phase 4; 300 ppm MP = NC +
mushroom powder at 300 ppm; 600 ppm MP = NC + mushroom powder at 600 ppm; Step-down MP = NC + 900, 900, 450, 300, and 150 ppm mushroom product during weeks 1, 2, 3, 4, and 5, respectively; Carbadox = NC + Carbadox at 55 ppm.

38
increased VFA’s but when combined they decreased the VFA’s (P < 0.10) compared to the NC. There was also a main effect of carbadox to decrease valeric acid concen-trations (P= 0.0257). Concentrations of plasma TNF-α at d-14 postweaning had a trend for a Carbadox (P = 0.083), as well as a MP by Carbadox interaction (P = 0.057). Carbadox decreased TNF-α while the combination of Carbadox and 300 ppm mushroom further reduced the TNF-α to the lowest concentrations (data not shown).
Experiment 4 During group housing there was a trend (P<0.10) for improved growth from day 0 to 4 for the PC compared to the NC. Once moved into individual pens, an enteric disease broke and particularly affected a high percent-age of the NC+2.5MG treatment pigs. This made d 4-11 data extremely variable as some pigs lost weight and had negative feed efficiency. However, from d 0-11 pigs fed the PC had increased ADG, ADF, and G:F (P <
0.05) compared to the NC. From day 11-21 there was a quadratic MG effect with the NC and 5% MG diets out-performing the 2.5% MG diet in both ADG and ADFI (P < 0.05). This also carried the effect to the overall re-sults, with a quadratic effect in ADG, ADFI, and G:F (P < 0.05). Carbadox also had a tendency for improved overall ADFI when compared to NC (P = 0.085). There was a difference in day 11 BW with the carbadox pigs being heavier than the NC pigs (P = 0.044). There was a difference in day 21 BW with a quadratic MG effect, with the 2.5% MG diet being worse than the NC and 5% MG diet. Ending BW between PC and 5% MG were relatively similar at 10.37 and 10.18 kg, respectively.
Discussion Experiment 1 was an initial investigative study on the potential effects of Cordyceps mushroom powder on nursery pig performance, as well as the effects of ADM’s stress relief pack alone or in combination with
Table 7. Experiment 3, Mushroom by Carbadox nursery Pig Growth Performance
Diet1 NC300 ppm
MPCarb-adox
Carbadox + 300 ppm
Zinc + Copper SE
Probability, P<Mush. Effect
Carb. Effect
MxC Interaction
NC vs ZnCu
Pens/diet 6 6 6 6 6Initial BW, kg 5.81 5.82 5.82 5.85 5.83 0.027 0.195 0.164 0.274 0.399
Day 0-7ADG, g 76 103 135 127 160 12.8 0.466 0.004 0.196 0.001ADFI, g 113 144 154 145 187 11.3 0.346 0.081 0.096 0.001G:F 0.670 0.700 0.857 0.873 0.842 0.038 0.577 0.001 0.880 0.004d7 BW, kg 6.35 6.53 6.76 6.74 6.94 0.095 0.392 0.004 0.278 0.001
Day 7-14ADG, g 107 95 162 165 246 14.8 0.757 0.001 0.627 0.001ADFI, g 196 211 234 243 343 14.3 0.407 0.024 0.818 0.001G:F 0.546 0.436 0.679 0.675 0.719 0.035 0.123 0.001 0.152 0.003d14 BW, kg 7.09 7.20 7.89 7.89 8.66 0.161 0.757 0.001 0.738 0.001
Day 14-21ADG, g 281 298 338 323 377 18.3 0.961 0.036 0.410 0.002ADFI, g 365 383 437 418 541 21.8 0.999 0.023 0.408 0.001G:F 0.773 0.781 0.779 0.776 0.694 0.026 0.908 0.983 0.835 0.043d21 BW, kg 9.06 9.28 10.26 10.15 11.29 0.247 0.820 0.001 0.518 0.001
Day 21-33 (Phase 4)ADG, g 431 455 476 504 487 10.1 0.018 0.001 0.847 0.001ADFI, g 641 680 709 744 787 14.9 0.021 0.001 0.931 0.001G:F 0.674 0.668 0.675 0.677 0.620 0.012 0.869 0.681 0.725 0.005d33 BW, kg 14.23 14.74 15.97 16.20 17.14 0.273 0.192 0.001 0.617 0.001
Day 0-33ADG, g 255 270 308 314 343 8.2 0.207 0.001 0.577 0.001ADFI, g 433 463 492 507 572 12.0 0.076 0.001 0.536 0.001G:F 0.590 0.584 0.626 0.619 0.599 0.007 0.333 0.001 0.984 0.3731 Diets: Negative control (NC) = no feed antimicrobial and no pharmacological zinc oxide or copper sulfate; 300 ppm MP = NC +
mushroom powder at 300 ppm; Carbadox = NC + Carbadox at 55 ppm; Carbadox+300 ppm = NC + Carbadox at 55 ppm and 300 ppm mushroom powder; Zinc + Copper = 125 ppm Cu d 0-33 from copper sulfate and 3000 ppm Zn from d 0-7 declining to 2000 ppm from d 7-33 from zinc oxide.
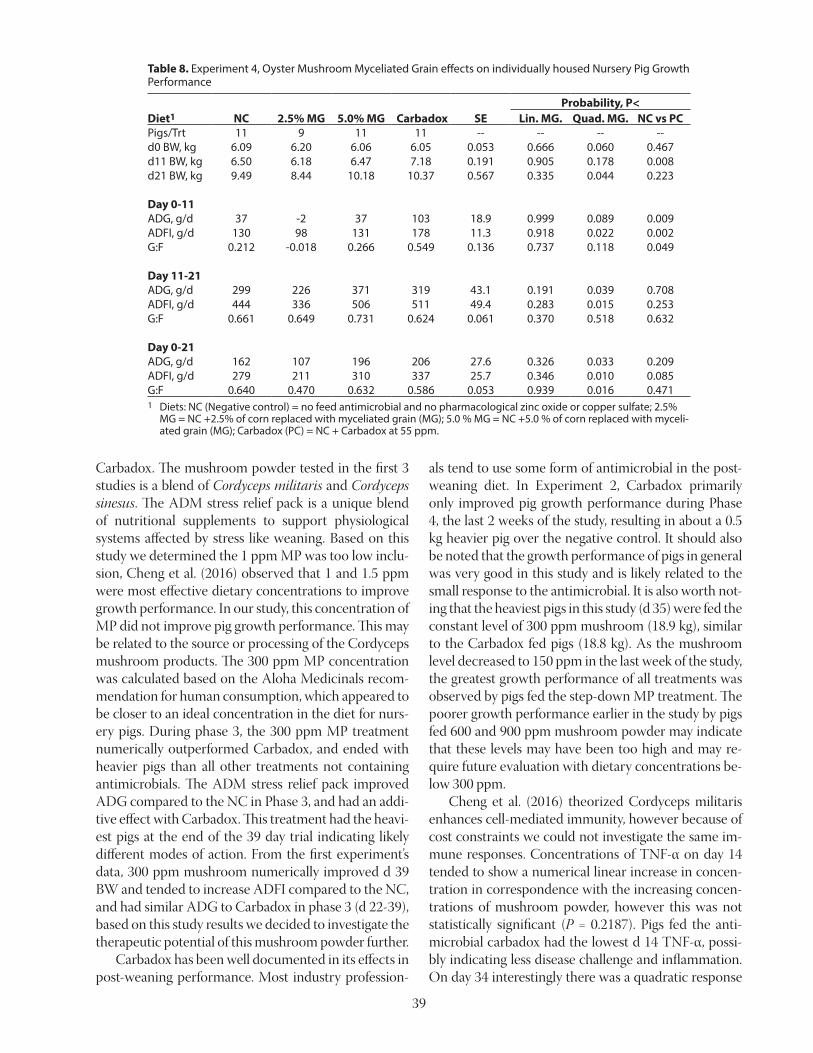
39
Table 8. Experiment 4, Oyster Mushroom Myceliated Grain effects on individually housed Nursery Pig Growth Performance
Diet1 NC 2.5% MG 5.0% MG Carbadox SEProbability, P<
Lin. MG. Quad. MG. NC vs PCPigs/Trt 11 9 11 11 -- -- -- --d0 BW, kg 6.09 6.20 6.06 6.05 0.053 0.666 0.060 0.467d11 BW, kg 6.50 6.18 6.47 7.18 0.191 0.905 0.178 0.008d21 BW, kg 9.49 8.44 10.18 10.37 0.567 0.335 0.044 0.223
Day 0-11 ADG, g/d 37 -2 37 103 18.9 0.999 0.089 0.009ADFI, g/d 130 98 131 178 11.3 0.918 0.022 0.002G:F 0.212 -0.018 0.266 0.549 0.136 0.737 0.118 0.049
Day 11-21 ADG, g/d 299 226 371 319 43.1 0.191 0.039 0.708ADFI, g/d 444 336 506 511 49.4 0.283 0.015 0.253G:F 0.661 0.649 0.731 0.624 0.061 0.370 0.518 0.632
Day 0-21 ADG, g/d 162 107 196 206 27.6 0.326 0.033 0.209ADFI, g/d 279 211 310 337 25.7 0.346 0.010 0.085G:F 0.640 0.470 0.632 0.586 0.053 0.939 0.016 0.4711 Diets: NC (Negative control) = no feed antimicrobial and no pharmacological zinc oxide or copper sulfate; 2.5%
MG = NC +2.5% of corn replaced with myceliated grain (MG); 5.0 % MG = NC +5.0 % of corn replaced with myceli-ated grain (MG); Carbadox (PC) = NC + Carbadox at 55 ppm.
Carbadox. The mushroom powder tested in the first 3 studies is a blend of Cordyceps militaris and Cordyceps sinesus. The ADM stress relief pack is a unique blend of nutritional supplements to support physiological systems affected by stress like weaning. Based on this study we determined the 1 ppm MP was too low inclu-sion, Cheng et al. (2016) observed that 1 and 1.5 ppm were most effective dietary concentrations to improve growth performance. In our study, this concentration of MP did not improve pig growth performance. This may be related to the source or processing of the Cordyceps mushroom products. The 300 ppm MP concentration was calculated based on the Aloha Medicinals recom-mendation for human consumption, which appeared to be closer to an ideal concentration in the diet for nurs-ery pigs. During phase 3, the 300 ppm MP treatment numerically outperformed Carbadox, and ended with heavier pigs than all other treatments not containing antimicrobials. The ADM stress relief pack improved ADG compared to the NC in Phase 3, and had an addi-tive effect with Carbadox. This treatment had the heavi-est pigs at the end of the 39 day trial indicating likely different modes of action. From the first experiment’s data, 300 ppm mushroom numerically improved d 39 BW and tended to increase ADFI compared to the NC, and had similar ADG to Carbadox in phase 3 (d 22-39), based on this study results we decided to investigate the therapeutic potential of this mushroom powder further. Carbadox has been well documented in its effects in post-weaning performance. Most industry profession-
als tend to use some form of antimicrobial in the post-weaning diet. In Experiment 2, Carbadox primarily only improved pig growth performance during Phase 4, the last 2 weeks of the study, resulting in about a 0.5 kg heavier pig over the negative control. It should also be noted that the growth performance of pigs in general was very good in this study and is likely related to the small response to the antimicrobial. It is also worth not-ing that the heaviest pigs in this study (d 35) were fed the constant level of 300 ppm mushroom (18.9 kg), similar to the Carbadox fed pigs (18.8 kg). As the mushroom level decreased to 150 ppm in the last week of the study, the greatest growth performance of all treatments was observed by pigs fed the step-down MP treatment. The poorer growth performance earlier in the study by pigs fed 600 and 900 ppm mushroom powder may indicate that these levels may have been too high and may re-quire future evaluation with dietary concentrations be-low 300 ppm. Cheng et al. (2016) theorized Cordyceps militaris enhances cell-mediated immunity, however because of cost constraints we could not investigate the same im-mune responses. Concentrations of TNF-α on day 14 tended to show a numerical linear increase in concen-tration in correspondence with the increasing concen-trations of mushroom powder, however this was not statistically significant (P = 0.2187). Pigs fed the anti-microbial carbadox had the lowest d 14 TNF-α, possi-bly indicating less disease challenge and inflammation. On day 34 interestingly there was a quadratic response

40
showing the lower levels of mushroom powder (150 and 300 ppm) late in the nursery had lower concentrations of TNF-α compared to the high dose of 600 ppm and NC pigs. Growth performance at the end of the study was not poor on the 600 ppm diet, however this may indicate 600 ppm MP was too high inclusion and was stimulating an immune response or gut inflammation. The 300 ppm treatment showed the most promising results again in this study, however it appears a refined titration study could be beneficial with lower levels in the step-down. In Experiment 3, it was decided to evaluate what this mushroom product would do with a true nega-tive control diet, with no added Zn or Cu. Based on ADM’s stress relief product demonstrating an additive effect when fed with Carbadox in Exp. 1 it was worth exploring to see if the MP also had an additive effect on growth performance. Mushroom powder improved performance slightly early, but primarily had a delayed response. During the final week MP 300 matched Car-badox in ADG, as well as had an additive effect in the final phase when added into the Carbadox treatment. Carbadox significantly improved pig performance in every category over the Negative control, adding 1.7 kg of BW by the end of the study. The Cu and Zn treatment outperformed every treatment other than the final week when the combination of Carbadox and MP300 were the fastest gaining treatment. Final BW for the CuZn treatment pigs were 2.9 kg greater than the negative control. It also appears MP300 may not be as effective when combined with a true negative control. It appears the MP performs better with Zn and Cu includ-ed in the diet based on the first 2 studies. Interestingly MP300 had the greatest total VFA concentrations out of any treatment, but the combination of Carbadox and MP300 had lowest total VFA concentrations. In theory greater VFA concentrations indicates greater hind gut fermentation and a lower pH and should allow the en-terocytes to have access to more VFA energy, but this did not translate into added growth performance. This is also the opposite of what the concentrations looked like in the titration study for the 300 ppm level, warrant-ing further investigation as to what this level of mush-room does to VFA concentrations and the microbiome. Plasma TNF-α concentrations on d14 were greatest in the 300 ppm mushroom treatment, which is again con-flicting with the previous titration study. There was a tendency for reduced TNF-α concentrations in Carba-dox fed pigs. However, in the combination of Carbadox and 300 ppm MP the TNF-α levels decreased in con-centration further than Carbadox alone.
The Mushroom treatment could provide some ben-efit to pigs. However, a majority of the growth response is late in the nursery phase. Based on previous results it is possible the level of the mushroom needs adjusted to different levels at certain time points, a refined titration study may be warranted. Further research is needed to investigate whether there is a possible carryover effect into the grow-finish stage of production. Further re-search is also needed on the composition of this mush-room product, to determine why the effect is delayed. Additional investigation into whether there is a com-pound in the mushroom that is not improving the pigs growth performance early in the nursery phase when some increased feed intake is observed with the MP. With myceliated grains being a by-product of the mushroom industry that is traditionally discarded, the purpose of this last small study was to determine if nursery pigs would have any adverse reaction to MG in the diet. This was a preliminary study for future work in feeding myceliated grains of various mushrooms to pigs. It appears the pigs will eat the diets, however with the early disease outbreak there is not much data on how they will perform on the diets immediately post-weaning. Myceliated grains are commonly just cereal grains (often sorghum) that the mushrooms are grown on, and mushrooms deposit some of their bioactive compounds in their root structure. If effective this could be a unique alternative to feeding the whole mushroom, which will have competition with humans for food and medicinal purposes. In conclusion, pigs will eat these diets, however this area of research requires much more investigation to determine if it is feasible to feed on a large commercial scale, and if it is possibly a replace-ment for antibiotics / antimicrobials. In conclusion, the 300 ppm MP provided similar growth performance to the antimicrobial carbadox when the diets contained pharmacological levels of zinc or copper. However, the full mechanism still needs to be elucidated but it may be through antimicrobial and anti-viral characteristics to this mushroom as well as a shift in the microbiome and/or potential long term intesti-nal immune modifications. When considering the eco-nomics of feeding this human-grade mushroom prod-uct, the 300 ppm mushroom product is slightly more expensive at approximately $33/ton compared $26/ton for the carbadox treatment. When feeding the 150 ppm level at the end of the second study, feed costs were less than the carbadox positive control. The 300 ppm mush-room and step-down treatments were both comparable in results to Carbadox and with more research mush-room powder could serve as a possible antimicrobial replacement to Carbadox.
41
ReferencesCamilleri M., K. Madsen, R. Spiller, B. G. van Meerveld,
and G. N. Verne. 2012. Intestinal barrier function in health and gastrointestinal disease. Neurogas-trol. and Motil. 24:503-12. doi:10.1111/j.1365-2982.2012.01921.x.
Celi P., A. J. Cowieson, F. Fru-Nji, R. E. Steinert, A.M. Kluenter, and V. Verlhac. 2017. Gastrointestinal functionality in animal nutrition and health: new opportunities for sustainable animal production. Anim. Feed Sci. Technol. 234:88-100. doi:10.1016/j.anifeedsci.2017.09.012.
Chen L. S., C. M. Stellrecht, and V. Gandhi. 2008. RNA-directed agent, cordycepin, induces cell death in multiple myeloma cells. Brit. J. Haematol. 140:391–682. doi:10.1111/j.1365-2141.2007.06955.x.
Cheng, Y. H., C. M. Wen, A. Dybus, and W. S. Proskura. 2016. Fermentation of Cordyceps militaris enhance-ment performance and modulate immune response of weaned piglets. South African J. Anim. Sci. 46:121-128. doi:10.4314/sajas.v46i2.2.
Devkota S. 2006. Yarsagumba [Cordyceps sinensis (Berk.) Sacc.]; traditional utilization in Dolpa dis-trict, western Nepal. Our Nat. 4:48–55. doi:10.3126/on.v4i1.502.
Dong G. Z., and J. R. Pluske. 2007. The low feed in-take in newly-weaned pigs: problems and pos-sible solutions. Asian Aust. J. Anim. Sci. 20:440-52. doi:10.5713/ajas.2007.440.
Fouhse J. M., R. T Zijlstra, and B. P. Willing. 2016. The role of gut microbiota in the health and disease of pigs. Anim. Front. 6:30-36. doi:10.2527/af.2016-0031.
Gresse R., F. Chaucheyras-Durand, M. A. Fleury, T. van de Wiele, E. Forano, and S. Blanquet- Diot. 2017. Gut microbiota dysbiosis in postweaning piglets: understanding the keys to health. Trends Microbiol. 25:851-73. doi:10.1016/j.tim.2017.05.004.
Gu Y. X., Z. S. Wang, S. X. Li, and G. S. Yuan. 2007. Effect of multiple factors on accumulation of nucleosides and bases in Cordyceps militaris. Food Chem. 102:1304–1309. doi:10.1016/j.food-chem.2006.07.018.
Holbein S., A. Wengi, L. Decourty, F. M. Freimoser, A. Jacquier, and B. DichtlrnaI. 2009. Cordycepin inter-feres with 30 end formation in yeast independently of its potential to terminate RNA chain elongation. RNA. 15:837–849. doi:10.1261/rna.1458909.
Jayaraman B., and C. M. Nyachoti. 2017. Husbandry practices and gut health outcomes in weaned pig-lets: a review. Anim. Nutr. 3:205-11. doi:10.1016/j.aninu.2017.06.002.
Kim J. C., C. F. Hansen, B. P Mullan, and J. R. Pluske. 2012. Nutrition and pathology of weaner pigs: nu-tritional strategies to support barrier function in the gastrointestinal tract. Anim. Feed Sci. Technol. 173:3-16. doi:10.1016/j.anifeedsci.2011.12.022.
Lee J. H., S. M Hong, J. Y. Yun, H. Myoung, and M. J. Kim. 2011. Anti-cancer effects of cordycepin on oral squamous cell carcinoma proliferation and apopto-sis in vitro. J. Cancer Ther. 2:224–234. doi:10.4236/jct.2011.22029.
McCracken B. A., M. E Spurlock, M. A. Roos, F. A Zuck-erman, and H. R. Gaskins. 1999. Weaning anorexia may contribute to local inflammation in the piglet small intestine. J. Nutr. 129:613-19. doi:10.1093/jn/129.3.613.
Moeser A. J., C. S. Pohl, and M. Rajput. 2017. Weaning stress and gastrointestinal barrier development: im-plications for lifelong gut health in pigs. Anim. Nutr. 3:313-321. doi:10.1016/j.aninu.2017.06.003.
NRC. In: Nutrient requirements of swine. 2012. 11th rev. Washington, DC: Natl. Acad. Press.
Overgaard K. H. 1964. The inhibition of 5-phospho-ribosyl-1-pyrophosphate formation by Cordyce-pin triphosphate in extracts of Ehrlich ascites tu-mor cells. Biochim. Biophys. Acta. 80:504–507. doi:10.1016/0926-6550(64)90154-9.
Patel S., and A. Goyal. 2012. Recent developments in mushrooms as anti- cancer therapeutics: a review. 3 Biotech. 2:1–15. doi:10.1007/s13205-011-0036-2.
Pié S., J. P. Lallès, F. Blazy, J. Laffitte, B. Seve, and I. P. Os-wald. 2004. Weaning is associated with an upregula-tion of expression if inflammatory cytokines in the intestine of piglets. J. Nutr. 134:641-47. doi:10.1093/jn/134.3.641
Pluske J. R., D. J. Hampson, and I. H. Williams. 1997. Factors influencing the structure and function of the small intestine in the weaned pig: a review. Livest. Prod. Sci. 51:215-36. doi:10.1016/S0301-6226(97)00057-2.
Pluske J. R., I. H. Williams, and F. X. Aherne. 1996. Maintenance of villous height and crypt depth in piglets by providing continuous nutrition af-ter weaning. Anim. Sci. 62:131-44. doi:10.1017/S1357729800014417.
Pluske, J. R., D. L. Turpin, and J. C. Kim. 2018. Gastroin-testinal tract (gut) health in the young pig. An. Nutr. 4(2):187-196. doi:10.1016/j.aninu.2017.12.004.
Schachtschneider K. M., C. J. Yeoman, R. E. Isaacson, B. A. White, L. B Schook, and M. Pieters. 2013. Modulation of systemic immune responses through commensal gastrointestinal microbiota. PLoS One. 8(1):e53969. doi:10.1371/ journal.pone.0053969.

42
Tuli, H. S., S. S. Sandhu, and A. K. Sharma. 2014. Phar-macological and therapeutic potential of Cordyceps with special reference to Cordycepin. Biotech. 4:1-12. doi: 10.1007/s13205-013-0121-9.
Wang Z. M., X. Peng, K.L.D. Lee, J.C.O. Tang, P.C.K. Cheung, and J. Y. Wu. 2011. Structural characterisa-tion and immunomodulatory property of an acidic polysaccharide from mycelial culture of Cordyceps sinensis fungus Cs-HK1. Food Chem. 125:637–643. doi:10.1016/j.foodchem.2010.09.052.
Wijtten P.J.A., J. van der Meulen, and M.W.A. Verstegen. 2011. Intestinal barrier function and absorption in pigs after weaning: a review. Br. J. Nutr. 105:967-81. doi:10.1017/S0007114510005660.
Wong Y. Y., A. Moon, R. Duffin, A. Barthet-Barateig, H. A. Meijer, M. J. Clemens, and C. H. de Moor. 2010. Cordycepin inhibits protein synthesis and cell adhesion through effects on signal transduc-tion. J. Biol. Chem. 285:2610–2621. doi:10.1074/jbc.m109.071159.
Yue K., M. Ye, Z. Zhou, W. Sun, and X. Lin. 2012. The genus Cordyceps:a chemical and pharmacologi-cal review. J. Pharm. Pharmacol. 65:474-493. doi: 10.1111/j.2042-7158.2012.01601.x.
Zhou X., L. Luo, W. Dressel, G. Shadier, D. Krumbiegel, P. Schmidtke, F. Zepp, and C. U. Meyer. 2008. Cordy-cepin is an immunoregulatory active ingredient of Cordyceps sinensis. Am. J. Chin. Med. 36:967–980. doi:10.1142/S0192415X09006387.

43
2018 Farm Bill The Agricultural Improvement Act of 2018, bet-ter known as the 2018 Farm Bill, was signed into law by President Trump on December 20, 2018. The sign-ing was the culmination of multiple years of delibera-tions, hearings, and meetings to authorize agricultural programs for a five-year period through 2023. The Con-gressional Budget Office estimates that the total cost of the 2018 Farm Bill will be $867 billion over the 10-year budget window, with outlays of $428 billion over the five-year life of the bill. The 2018 Farm Bill is considered to be budget neutral, which means that overall spending under the legislation would be the same as if the pro-grams included in the 2014 Farm Bill were simply ex-tended with no changes. The 2018 bill has been called “evolutionary” as op-posed to “revolutionary” because there are not signifi-cant changes to many of the major components of the legislation such as nutrition, farm subsidies and crop insurance. As with most recent Farm Bills, the vast ma-jority of funding, 76%, will go to nutrition programs. The next three highest spending categories are crop insur-ance (9%), commodities (7%) and conservation (7%). See Figure 1.
Animal Agriculture and the Farm Bill In recent Farm Bill debates, animal agriculture was fractionated and forced to play defense against policies and regulations that threatened to harm the industry. Is-sues such as packer concentration and country of origin labeling drew the focus of key animal industry organiza-
The 2018 Farm Bill— Opportunities for Animal Agriculture
Lowell W. Randel The Randel Group, LLC
241 18th Street South, Suite 620 Arlington, VA 22202
Phone: 202-406-0212 [email protected]
SummaryThe 2018 Farm Bill includes a variety of new policies and programs that represent strong opportu-nities for animal agriculture. Unlike many of the past Farm Bill debates, animal agriculture pro-actively came together to play “offense” and work together to build support for funding a suite of programs through the Farm Bill to address emerging animal disease and pest threats. The animal agriculture community was also successful in authorizing a new Agricultural Genome to Phenome Initiative that provides equal recognition to animal and plant science.
Figure 1. Projected outlays under the 2018 Farm Act, 2019-2023.
tions and made the advancement of proactive policies to benefit animal agriculture more difficult. While the specter of controversial policies was not absent for the 2018 Farm Bill, the animal agriculture community took a more proactive approach to policies than in previous years. The Animal Agriculture Coali-tion, a group of animal producer and related organiza-tions in Washington, DC, formed a task force to look at potential initiatives to support the needs of animal agri-culture. That process resulted in the development of ini-tiatives focused on addressing the threats of emerging animal diseases and pests that have each drawn broad support from groups around the country.

44
Background Animal agriculture is a major economic driver for our nation. According to the Farm Income Atlas administered by USDA’s Eco-nomic Research Service, total cash receipts for animal and animal products was over $176 billion in 2017. This represents almost fifty percent of all farm cash receipts. In addition, a recent study entitled “Economic Analysis of Animal Agriculture 2004-2014”, commis-sioned by the United Soybean Board, found that the total economic impact of the livestock and poultry industry in the United States was $440.7 billion in 2014. This represents over 2.3 million jobs and almost $77 billion in farm in-come. Animal agriculture is also responsible for approx-imately $20 billion in income taxes and over $7 billion in property taxes (Figure 2). Unfortunately, the economic contributions of the animal agriculture industry in the United States are un-der the constant threat of emerging animal pests and diseases that have the potential to devastate production capacity and competitiveness. In recent years, disease outbreaks have cost billions in production losses and re-sponse costs. According to the Animal and Plant Health Inspection Service (APHIS), the recent avian influenza outbreak cost taxpayers $1 billion in response, clean up, and indemnity costs and required the depopulation of nearly 50 million birds. That doesn’t include lost export markets, temporary shortages, or price increases for certain poultry and their products. Threats to animal agriculture span multiple species and disease type. Other examples include:• Porcine Reproductive and Respiratory Syndrome
(PRRS) - Recent estimates show that the annual eco-nomic impact of porcine reproductive and respira-tory syndrome is $664 million.
• Foot and Mouth Disease (FMD) - Experts estimate it cost the United Kingdom $3 billion in direct pub-lic costs and over $5 billion in costs to the private sector. An uncontrolled outbreak of FMD in the United States could have devastating economic im-pacts. Livestock exports alone were valued at more than $19 billion in 2017.
• Exotic Newcastle Disease - The 2002 outbreak of ex-otic Newcastle disease in Western states which cost over $160 million and caused 4.5 million birds to be depopulated.
Such outbreaks can have a major impact on trade, lasting long after the outbreak is under control. In addi-tion to high profile outbreaks, there are also critical gaps
Figure 1. U.S. total 2014 output ($1,000)
Source: 2014 Economic Analysis of Animal Agriculture, United Soybean Board
in meeting pest and disease challenges facing minor species. Investments in safeguarding animal agriculture promotes sustainable economic development and pre-vents catastrophic events that could threaten our na-tion’s food supply. A proactive and concerted effort by the federal gov-ernment, states, industry and universities is needed to help address these threats and protect the nation’s animal agriculture industry. In response to this need, a series of initiatives were developed for inclusion in the 2018 Farm Bill.
Animal Disease Prevention and Management The 2018 Farm Bill adds a new section to the Live-stock Subtitle of Miscellaneous Title (Title XII). Section 12101, entitled Animal Disease Prevention and Man-agement sets forth new policy and funding for three programs, the National Animal Disease Preparedness and Response Program (NADPRP), the National Ani-mal Health Laboratory Network (NAHLN) and the National Animal Vaccine and Veterinary Countermea-sures Bank (NAVVCB).
National Animal Disease Preparedness and Response Program (NADPRP) There are immediate needs to bolster the Animal and Plant Health Inspection Service’s support for dis-ease and pest prevention and mitigation efforts. To help build this capacity, the creation of the National Animal Disease Preparedness and Response Program (NAD-PRP) was proposed for inclusion in the 2018 Farm Bill. Modeled after the successful Plant Pest and Disease Disaster Prevention Program the NADPRP will bring together the federal government with states, industry, universities, and other interested groups to reduce the impact of high-consequence animal diseases, provide rapid detection and response capabilities to respond to

45
animal diseases, develop disease prevention and mitiga-tion technologies including vaccines, prevent the en-trance and spread of foreign animal diseases into the United States, and identify and support critical research needs. The NADPRP would support projects organized around the following goal areas: • Enhancing animal pest and disease analysis and sur-
veillance. • Expanding outreach and education.• Targeting domestic inspection activities at vulner-
able points in the safeguarding continuum. Enhanc-ing and strengthening threat identification technol-ogy.
• Improving biosecurity.• Enhancing emergency preparedness and response
capabilities, including training additional emergen-cy response personnel.
• Conducting technology development to enhance electronic sharing of animal health data for risk analysis between State and Federal animal health of-ficials.
• Enhancing the development and effectiveness of an-imal health technologies to treat and prevent animal disease, including— • veterinary biologics and diagnostics; • animal drugs for minor uses and minor species; • animal medical devices; • emerging veterinary countermeasures.
These goals represent critical needs and opportuni-ties to strengthen, prevent, detect, and mitigate animal pests and diseases. APHIS will implement an annual process by which priorities will be set for funding un-der the NADPRP. Eligible entities to receive funding through the program include: universities, state agen-cies, and livestock producer groups.
National Animal Health Laboratory Network (NAHLN) The Farm Bill also supports the National Animal Health Laboratory Network (NAHLN) and its efforts to establish a surveillance, emergency response and tech-nology development system that provides resources for surveillance testing, information management, qual-ity assurance and the development and validation of new diagnostic tests. The importance of the NAHLN is highlighted in the October 2015 bipartisan Blue Rib-bon Panel report: A National Blueprint for Biodefense, which calls on the federal government to provide full funding for the NAHLN. Funding will support the net-work’s early warning system so that veterinarians and scientists can quickly detect emerging and foreign zoo-
notic diseases as well as support applied research and technology development to ensure that science based tools are available to prevent and mitigate impacts to animal or public health or the food supply. In addition to the mandatory funding discussed later, the Farm Bill also increases the authorization for appropriations for the NAHLN from $15 million to $30 million annually.
National Animal Vaccine and Veterinary Countermeasures Bank (NAVVCB) The 2018 Farm Bill authorizes the establishment of a new National Animal Vaccine and Veterinary Coun-termeasures Bank (NAVVCB). To complement the re-search and prevention programs, additional infrastruc-ture is needed to ensure the capacity to deliver vaccines for high consequence diseases such as FMD. An out-break of FMD would immediately close all export mar-kets. Economists at Iowa State University examined the economy-wide impacts of eliminating export markets for 10 years for beef and pork and found the cumulative impact on the beef and pork sectors over the 10-year period would be $128.23 billion, an average of $12.8 bil-lion per year. The annual jobs impact of such reduction in industry revenue is 58,066 in direct employment and 153,876 in total employment. Corn and soybean farm-ers would lose $44 billion and nearly $25 billion, respec-tively, making the impact on these four industries alone almost $200 billion. Currently, the U.S. does not have access to enough FMD vaccine. The current vaccine bank arrangement has several problems in addition to insufficient funding. These include the turn-around time from the onset of an outbreak until finished vaccine can be delivered and the limited number of doses and antigen strains main-tained. Worldwide vaccine production is limited, and there is no surge capacity available to produce the mil-lions of doses needed in the event of a large-scale out-break in the United States. The ability to rapidly vaccinate against FMD, is cen-tral to the U.S. disease control strategy should an out-break occur. Such an arrangement would, at minimum, provide vaccine antigen concentrate for all FMD strains currently circulating in the world. Additionally, it would ensure resources are in place for production capacity (including surge capacity) that would produce, in the shortest amount of time possible, a sufficient vaccine to meet needs in the early stages of an outbreak.
Funding for Animal Disease Prevention and Management The Farm Bill provides a total of $150 million in man-datory funding to support the three components of the

46
Animal Disease Prevention and Management Section. $120 million is made available for fiscal years 2019-2022 and is available immediately until expended. Of these funds, no less than $20 million will go to the NADPRP. The remaining $100 million will be divided between the three components at the Secretary’s discretion. $30 million is provided for fiscal year 2023 and every year thereafter. Of the $30 million, no less than $18 million per year shall support the NADPRP. The remaining $12 million will be divided between the NAHLN and the NAVVCB.
Agricultural Genome to Phenome Initiative (AGPI) In addition to the opportunities presented by the three components of Animal Disease Prevention and Management, the 2018 Farm Bill also establishes a new Agricultural Genome to Phenome Initiative (AGPI) to be administered by the National Institute of Food and Agri-culture (NIFA). The AGPI began in the House version of the Farm Bill as a program that would support only re-search on plant science. However, the animal agriculture community raised significant concerns about omitting animal science from the program. A list of over 50 nation-al and state animal organizations was compiled in sup-port of equal inclusion of animal science in the AGPI. As the Farm Bill process moved to the Senate, language was included that provided equal treatment of animals and plants under the AGPI. The final version of the Farm Bill includes $40 million in authorization to support research on genome to phenome in both animals and plants. Funding under AGPI would go towards the follow-ing areas:• Studying agriculturally significant crops and animals
in production environments to achieve sustainable and secure agricultural production;
• Ensuring that current gaps in existing knowledge of agricultural crop and animal genetics and phenom-ics are filled;
• Identifying and developing a functional understand-ing of relevant genes from animals and agronomical-ly relevant genes from crops that are of importance to the agriculture sector of the United States;
• Ensuring future genetic improvement of crops and animals of importance to the agriculture sector of the United States;
• Studying the relevance of diverse germplasm as a source of unique genes that may be of importance in the future; and
• Enhancing genetics to reduce the economic impact of pathogens on crops and animals of importance to the agriculture sector of the United States.
Efforts are underway to build Congressional support for appropriations to fund the AGPI in fiscal year 2020. Over 35 animal and plant organizations sent a letter to Congressional leaders in the House and Senate request-ing funding for the AGPI. In addition, a Congressional briefing was held in June 2019 to discuss the importance of genome to phenome science and the types of break-throughs that would be possible should the initiative re-ceive funding.
Summary The 2018 Farm Bill is a good example of what can be achieved when the animal agriculture community comes together in a proactive way to advance impor-tant policy initiatives. The community was successful in establishing and securing funding for a suite of new programs to address critical threats related to emerging diseases and pests. Animal agriculture was also success-ful in making sure that the new Agricultural Genome to Phenome Initiative provides equal support and recog-nition to both animals and plants. The next step for the community is to work closely with USDA to ensure that these new programs are implemented effectively.
ReferencesUSDA-ERS. 2019. Agricultural Improvement Act of
2018: Highlights and Implications. https://www.ers.usda.gov/agriculture-improvement-act-of-2018-highlights-and-implications/. (Accessed 15 July 2019).
United Soybean Board. September 2015. Economic Analysis of Animal Agriculture 2004-2014. http://unitedsoybean.org/topics/animal-ag/the-im-pact-of-animal-ag/. (Accessed 15 July 2019).
USDA-APHIS. 2016. Avian Influenza Findings Em-phasize the Need for Good Biosecurity. https://www.aphis.usda.gov/publications/animal_health/2015/fs_hpai_biosecurity.pdf. (Accessed 15 July 2019).
US-GAO. March 2019. Foot and Mouth Disease: US-DA’s Efforts to Prepare for a Potential Outbreak Could Be Strengthened. https://www.gao.gov/as-sets/700/697467.pdf (Accessed 15 July 2019).
Congressional Research Service. February 22, 2019. The 2018 Farm Bill (P.L. 115-334): Summary and Side-by-Side Comparison. https://crsreports.congress.gov/product/pdf/R/R45525 (Accessed 15 July, 2019).
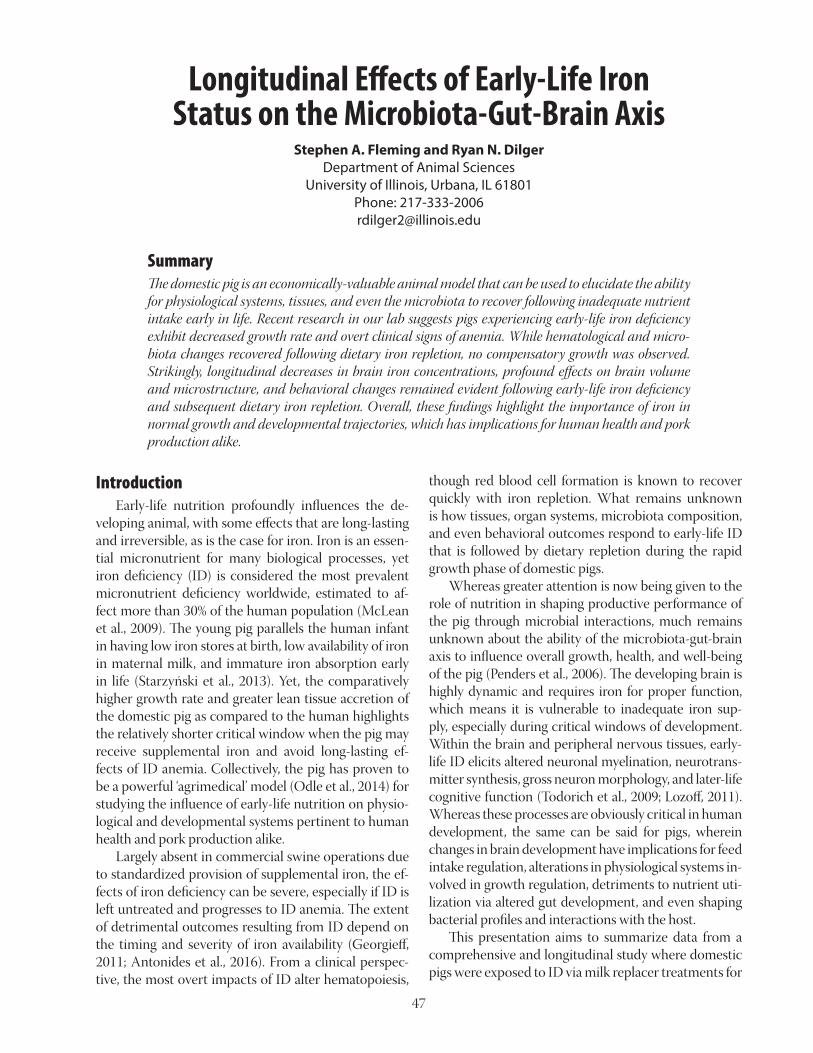
47
Introduction Early-life nutrition profoundly influences the de-veloping animal, with some effects that are long-lasting and irreversible, as is the case for iron. Iron is an essen-tial micronutrient for many biological processes, yet iron deficiency (ID) is considered the most prevalent micronutrient deficiency worldwide, estimated to af-fect more than 30% of the human population (McLean et al., 2009). The young pig parallels the human infant in having low iron stores at birth, low availability of iron in maternal milk, and immature iron absorption early in life (Starzyński et al., 2013). Yet, the comparatively higher growth rate and greater lean tissue accretion of the domestic pig as compared to the human highlights the relatively shorter critical window when the pig may receive supplemental iron and avoid long-lasting ef-fects of ID anemia. Collectively, the pig has proven to be a powerful ‘agrimedical’ model (Odle et al., 2014) for studying the influence of early-life nutrition on physio-logical and developmental systems pertinent to human health and pork production alike. Largely absent in commercial swine operations due to standardized provision of supplemental iron, the ef-fects of iron deficiency can be severe, especially if ID is left untreated and progresses to ID anemia. The extent of detrimental outcomes resulting from ID depend on the timing and severity of iron availability (Georgieff, 2011; Antonides et al., 2016). From a clinical perspec-tive, the most overt impacts of ID alter hematopoiesis,
though red blood cell formation is known to recover quickly with iron repletion. What remains unknown is how tissues, organ systems, microbiota composition, and even behavioral outcomes respond to early-life ID that is followed by dietary repletion during the rapid growth phase of domestic pigs. Whereas greater attention is now being given to the role of nutrition in shaping productive performance of the pig through microbial interactions, much remains unknown about the ability of the microbiota-gut-brain axis to influence overall growth, health, and well-being of the pig (Penders et al., 2006). The developing brain is highly dynamic and requires iron for proper function, which means it is vulnerable to inadequate iron sup-ply, especially during critical windows of development. Within the brain and peripheral nervous tissues, early-life ID elicits altered neuronal myelination, neurotrans-mitter synthesis, gross neuron morphology, and later-life cognitive function (Todorich et al., 2009; Lozoff, 2011). Whereas these processes are obviously critical in human development, the same can be said for pigs, wherein changes in brain development have implications for feed intake regulation, alterations in physiological systems in-volved in growth regulation, detriments to nutrient uti-lization via altered gut development, and even shaping bacterial profiles and interactions with the host. This presentation aims to summarize data from a comprehensive and longitudinal study where domestic pigs were exposed to ID via milk replacer treatments for
Longitudinal Effects of Early-Life Iron Status on the Microbiota-Gut-Brain Axis
Stephen A. Fleming and Ryan N. Dilger Department of Animal Sciences
University of Illinois, Urbana, IL 61801 Phone: 217-333-2006 [email protected]
SummaryThe domestic pig is an economically-valuable animal model that can be used to elucidate the ability for physiological systems, tissues, and even the microbiota to recover following inadequate nutrient intake early in life. Recent research in our lab suggests pigs experiencing early-life iron deficiency exhibit decreased growth rate and overt clinical signs of anemia. While hematological and micro-biota changes recovered following dietary iron repletion, no compensatory growth was observed. Strikingly, longitudinal decreases in brain iron concentrations, profound effects on brain volume and microstructure, and behavioral changes remained evident following early-life iron deficiency and subsequent dietary iron repletion. Overall, these findings highlight the importance of iron in normal growth and developmental trajectories, which has implications for human health and pork production alike.

48
the first four weeks of life. Subsequently, all pigs were transitioned to a series of industry-standard, iron-ade-quate, phased diets to identify what effects of early-life ID persisted in terms of growth performance, hemato-logical outcomes, tissue development, behavioral per-formance, and microbiota profiles.
Experimental ProceduresAnimals and Experimental Design Forty-two naturally-farrowed, intact male pigs were obtained from a commercial swine farm after receiv-ing colostrum/milk for up to 48 h and transferred to the University of Illinois Piglet Nutrition and Cognition Laboratory (PNCL) at postnatal day (PND) 2. Pigs re-ceived an intramuscular injection of a prophylactic anti-biotic (0.1 mL Excede; Zoetis, Parsippany, NJ) within 24 h of birth. Contrary to typical agricultural procedures, no pigs were ever provided supplemental iron adminis-tration via iron dextran injection. Upon arrival to PNCL on PND 2, pigs (n = 21 per treatment) were assigned to one of two experimental milk replacers (control vs. ID; described below) that were provided ad libitum until PND 32 (phase 1). Thereafter, all pigs (i.e., both treat-ment groups; n = 10 per treatment) were transitioned onto a common series of industry-standard diets until PND 62 that were also provided ad libitum (phase 2). A detailed timeline of experimental procedures is shown in Figure 1. For phase 1, pigs were housed individually in custom cages (87.6 cm long, 88.9 cm wide, 50.8 cm high), which were composed of three acrylic walls, one stainless steel wall, and vinyl-coated, expanded-metal flooring. Pigs were allowed to physically interact with one another for approximately 15 min each day, and each pig was pro-vided a toy for enrichment in their home-cage through-out the study. Facility lighting was maintained on a 12
h light and dark cycle from 0800 to 2000 h, with am-bient temperature set at 26.6°C for the first 21 days of the study, and gradually lowered to 22°C during the last seven days of phase 1. For phase 2, 20 pigs from phase 1 were transferred to the University of Illinois Veterinary Medicine Research Farm at PND 32 and housed there until study completion. While in this facility, pigs were housed individually in floor pens (1.5 m2) and the rear-ing environment was maintained on a 12 h light and dark cycle from 0800 to 2000 with ambient temperature set at 22°C.
Dietary Treatments and Feeding Procedures For phase 1, pigs were provided one of two milk replacer treatments that were nutritionally-adequate apart from varying in iron content. The control diet (CONT) was formulated to meet all nutrient require-ments of the growing pig (National Research Coun-cil, 2012) and was formulated to contain 106.3 mg Fe/kg milk replacer powder. The ID diet formulation was identical to the CONT diet, with the exception that ferrous sulfate heptahydrate (i.e., the sole iron source in CONT) was removed, with this dietary treatment providing only 13.6 mg Fe/kg milk replacer powder. Milk replacer treatments were reconstituted fresh daily with 200 g of powder per 800 g water. Thus, formulated iron concentrations in reconstituted pig milk replacers were 21.3 and 2.72 mg Fe/L milk replacer for the CONT and ID treatments, respectively. All pigs were provided ad libitum access to liquid milk replacer treatments throughout phase 1. For phase 2, all pigs were transitioned onto the same common series of industry-relevant, iron-adequate di-ets (containing 180–300 mg Fe/kg of diet), regardless of their phase 1 treatment group. Pigs were provided ad libitum access to standard complex diets and standard
Figure 1. Experimental timeline and sequencing of sam-ple collection and study measurements. Abbreviations: CONT, control; ID, iron deficient; PND, postnatal day.
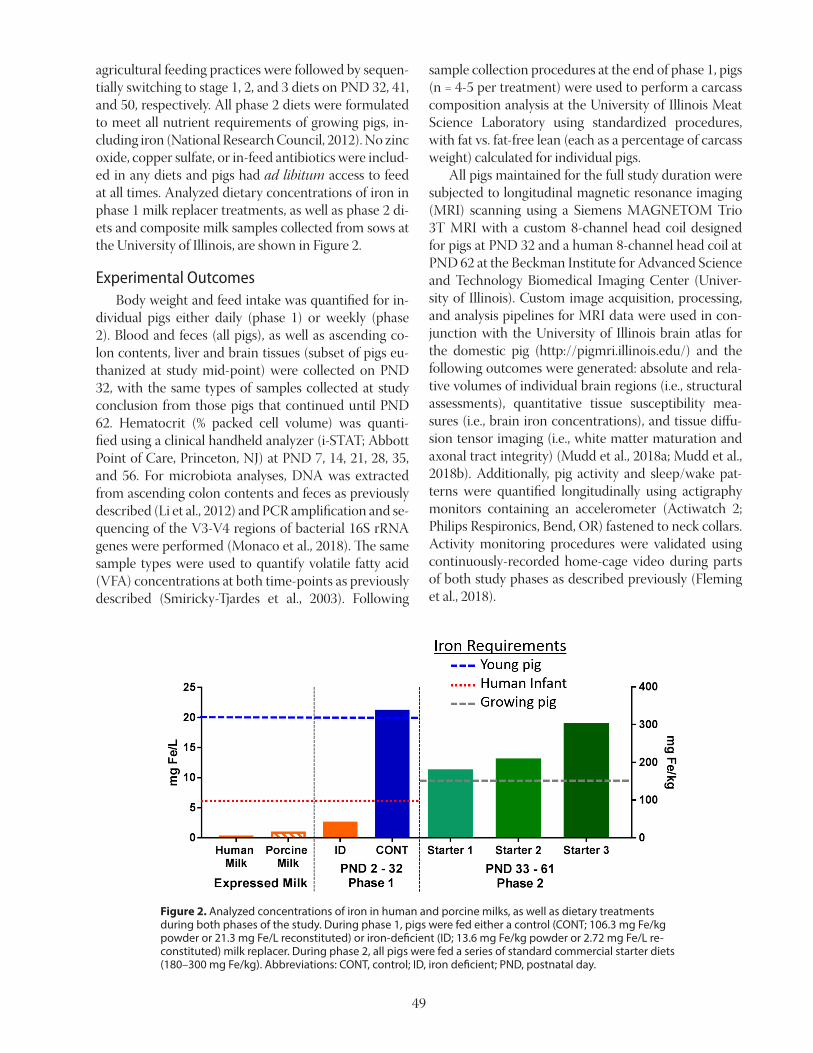
49
agricultural feeding practices were followed by sequen-tially switching to stage 1, 2, and 3 diets on PND 32, 41, and 50, respectively. All phase 2 diets were formulated to meet all nutrient requirements of growing pigs, in-cluding iron (National Research Council, 2012). No zinc oxide, copper sulfate, or in-feed antibiotics were includ-ed in any diets and pigs had ad libitum access to feed at all times. Analyzed dietary concentrations of iron in phase 1 milk replacer treatments, as well as phase 2 di-ets and composite milk samples collected from sows at the University of Illinois, are shown in Figure 2.
Experimental Outcomes Body weight and feed intake was quantified for in-dividual pigs either daily (phase 1) or weekly (phase 2). Blood and feces (all pigs), as well as ascending co-lon contents, liver and brain tissues (subset of pigs eu-thanized at study mid-point) were collected on PND 32, with the same types of samples collected at study conclusion from those pigs that continued until PND 62. Hematocrit (% packed cell volume) was quanti-fied using a clinical handheld analyzer (i-STAT; Abbott Point of Care, Princeton, NJ) at PND 7, 14, 21, 28, 35, and 56. For microbiota analyses, DNA was extracted from ascending colon contents and feces as previously described (Li et al., 2012) and PCR amplification and se-quencing of the V3-V4 regions of bacterial 16S rRNA genes were performed (Monaco et al., 2018). The same sample types were used to quantify volatile fatty acid (VFA) concentrations at both time-points as previously described (Smiricky-Tjardes et al., 2003). Following
sample collection procedures at the end of phase 1, pigs (n = 4-5 per treatment) were used to perform a carcass composition analysis at the University of Illinois Meat Science Laboratory using standardized procedures, with fat vs. fat-free lean (each as a percentage of carcass weight) calculated for individual pigs. All pigs maintained for the full study duration were subjected to longitudinal magnetic resonance imaging (MRI) scanning using a Siemens MAGNETOM Trio 3T MRI with a custom 8-channel head coil designed for pigs at PND 32 and a human 8-channel head coil at PND 62 at the Beckman Institute for Advanced Science and Technology Biomedical Imaging Center (Univer-sity of Illinois). Custom image acquisition, processing, and analysis pipelines for MRI data were used in con-junction with the University of Illinois brain atlas for the domestic pig (http://pigmri.illinois.edu/) and the following outcomes were generated: absolute and rela-tive volumes of individual brain regions (i.e., structural assessments), quantitative tissue susceptibility mea-sures (i.e., brain iron concentrations), and tissue diffu-sion tensor imaging (i.e., white matter maturation and axonal tract integrity) (Mudd et al., 2018a; Mudd et al., 2018b). Additionally, pig activity and sleep/wake pat-terns were quantified longitudinally using actigraphy monitors containing an accelerometer (Actiwatch 2; Philips Respironics, Bend, OR) fastened to neck collars. Activity monitoring procedures were validated using continuously-recorded home-cage video during parts of both study phases as described previously (Fleming et al., 2018).
Figure 2. Analyzed concentrations of iron in human and porcine milks, as well as dietary treatments during both phases of the study. During phase 1, pigs were fed either a control (CONT; 106.3 mg Fe/kg powder or 21.3 mg Fe/L reconstituted) or iron-deficient (ID; 13.6 mg Fe/kg powder or 2.72 mg Fe/L re-constituted) milk replacer. During phase 2, all pigs were fed a series of standard commercial starter diets (180–300 mg Fe/kg). Abbreviations: CONT, control; ID, iron deficient; PND, postnatal day.

50
Figure 3. Early-life ID caused reduced body weight gain (A) that could not be corrected by subsequent iron repletion, yet hemato-crit (B) was restored after receiving iron-adequate diets. Interactive effects of diet and PND were observed (P < 0.01) and SEM bars are presented. *Treatment difference (P < 0.05) at a particular time-point. a-eMeans lacking a common superscript letter differ (P < 0.05). Abbreviations: CONT, control; ID, iron deficient; PCV, packed cell volume; PND, postnatal day.
Statistical Analyses All researchers involved in this study remained blinded to dietary treatment identity until final data analyses had been completed. Data were analyzed us-ing the MIXED procedure of SAS (version 9.4; SAS In-stitute, Cary, NC); pig was included in the model as a random variable. All outcomes collected from the same pig at multiple time-points (i.e., longitudinal measures) were analyzed using a 2-way repeated measures analysis of variance (ANOVA). Interactive effects were defined as an interaction between diet (CONT vs. ID) and PND. All data collected at a single time-point were analyzed using a one-way ANOVA to determine the effect of phase 1 dietary iron status. Nine pigs were omitted from sampling procedures due to failure to thrive or compli-cations during neuroimaging procedures. Data were analyzed for outliers (defined as having a Studentized residual with an absolute value greater than 3), which were removed prior to statistical analysis. Significance was accepted at P < 0.05 and data are presented as least squares means with pooled SEM.
ResultsGrowth, Body Composition, and Hematocrit Significant effects on body weight for diet (P < 0.001) and PND (P < 0.001) were observed, with ID pigs weigh-ing less than CONT pigs. Separation in body weight be-tween CONT and ID pigs occurred beginning on PND 15 (P = 0.03), with ID pigs weighing less than CONT pigs from that time-point and continuously through PND 61 (Figure 3). Additionally, a clear separation in hematocrit was observed at PND 21 and 28, though this outcome had normalized by PND 56 after all pigs had received an iron-adequate nursery diet for 24 d (treatment ×
time interaction, P < 0.001). Whereas ADG and ADFI of ID pigs were decreased compared with CONT pigs during both study phases, body composition at PND 32 did not differ between treatment groups (Table 1). Ad-ditionally, efficiency of gain during phase 2 did not differ between treatment groups (P = 0.07). In terms of organ characteristics, early-life ID did not influence absolute brain weight at either PND 32 or 62 (P > 0.14), but when expressed relative to body weight, ID pigs exhibited in-creased (P < 0.001) relative brain weights at both time-points (Table 2). The opposite was observed for liver and small intestinal weights, with dietary differences observed for absolute weights (P < 0.01) at both PND 32 and 62. Whereas differences in relative liver and small intestinal weights were not evident at PND 32 (P > 0.10), ID pigs exhibited higher relative weights of these organs compared with CONT pigs at PND 62 (P < 0.01).
Microbiota and Volatile Fatty Acid Profiles At both the phylum and genus levels, microbial com-position in ascending colon contents and fecal samples were altered at PND 32 due to consumption of CONT vs. ID milk replacers during this phase (Table 3). Bacte-rial profiles appeared to vary between sample types, but ID consistently increased (P < 0.05) relative abundances of species within the Prevotella and Lactobacillus gen-era at the end of phase 1. Additionally, ID pigs exhibited numerical and significant (P < 0.05) increases in species within the Escherichia genus at this time-point. Regard-less of early-life iron status, bacterial composition had almost completely normalized between CONT and ID pigs by PND 62, with all pigs having received the same diets throughout phase 2. The only remnant of early-life iron status observed was an increase (P < 0.05) in Bifido-bacterium (albeit a small change in relative abundance),
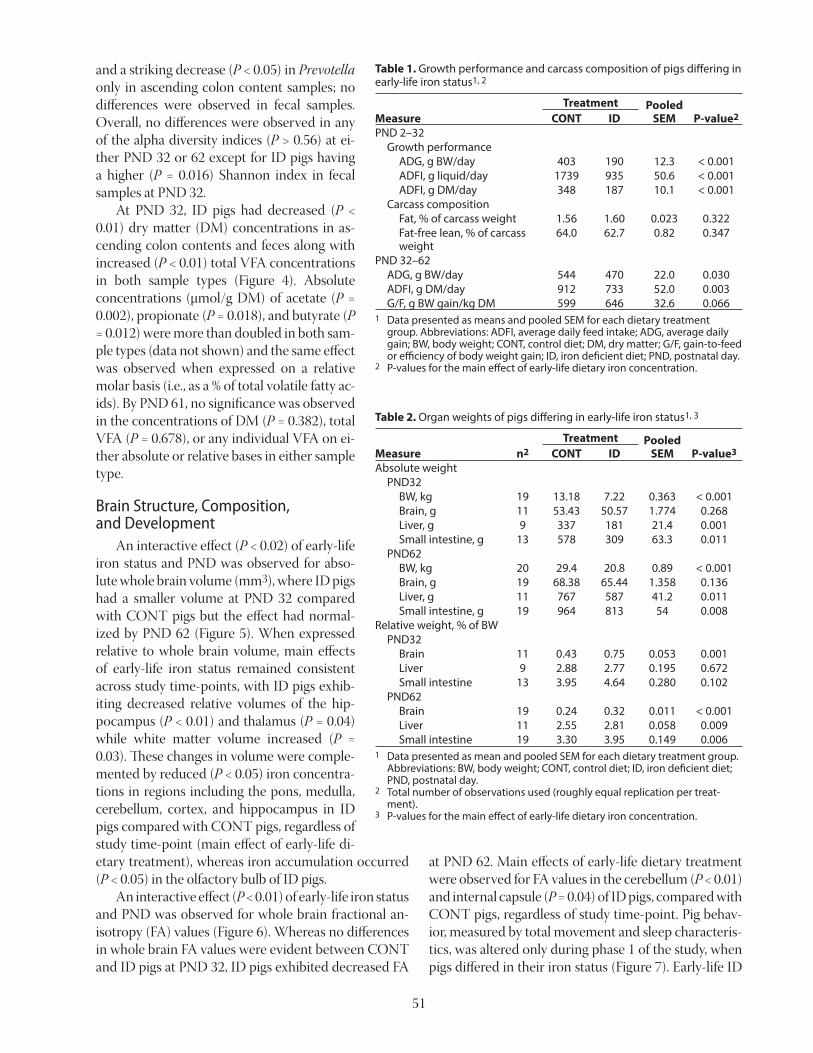
51
Table 1. Growth performance and carcass composition of pigs differing in early-life iron status1, 2
MeasureTreatment Pooled
SEM P-value2CONT IDPND 2–32
Growth performanceADG, g BW/day 403 190 12.3 < 0.001ADFI, g liquid/day 1739 935 50.6 < 0.001ADFI, g DM/day 348 187 10.1 < 0.001
Carcass compositionFat, % of carcass weight 1.56 1.60 0.023 0.322Fat-free lean, % of carcass weight
64.0 62.7 0.82 0.347
PND 32–62ADG, g BW/day 544 470 22.0 0.030ADFI, g DM/day 912 733 52.0 0.003G/F, g BW gain/kg DM 599 646 32.6 0.066
1 Data presented as means and pooled SEM for each dietary treatment group. Abbreviations: ADFI, average daily feed intake; ADG, average daily gain; BW, body weight; CONT, control diet; DM, dry matter; G/F, gain-to-feed or efficiency of body weight gain; ID, iron deficient diet; PND, postnatal day.
2 P-values for the main effect of early-life dietary iron concentration.
Table 2. Organ weights of pigs differing in early-life iron status1, 3
Measure n2Treatment Pooled
SEM P-value3CONT IDAbsolute weight
PND32BW, kg 19 13.18 7.22 0.363 < 0.001Brain, g 11 53.43 50.57 1.774 0.268Liver, g 9 337 181 21.4 0.001Small intestine, g 13 578 309 63.3 0.011
PND62BW, kg 20 29.4 20.8 0.89 < 0.001Brain, g 19 68.38 65.44 1.358 0.136Liver, g 11 767 587 41.2 0.011Small intestine, g 19 964 813 54 0.008
Relative weight, % of BWPND32
Brain 11 0.43 0.75 0.053 0.001Liver 9 2.88 2.77 0.195 0.672Small intestine 13 3.95 4.64 0.280 0.102
PND62Brain 19 0.24 0.32 0.011 < 0.001Liver 11 2.55 2.81 0.058 0.009Small intestine 19 3.30 3.95 0.149 0.006
1 Data presented as mean and pooled SEM for each dietary treatment group. Abbreviations: BW, body weight; CONT, control diet; ID, iron deficient diet; PND, postnatal day.
2 Total number of observations used (roughly equal replication per treat-ment).
3 P-values for the main effect of early-life dietary iron concentration.
and a striking decrease (P < 0.05) in Prevotella only in ascending colon content samples; no differences were observed in fecal samples. Overall, no differences were observed in any of the alpha diversity indices (P > 0.56) at ei-ther PND 32 or 62 except for ID pigs having a higher (P = 0.016) Shannon index in fecal samples at PND 32. At PND 32, ID pigs had decreased (P < 0.01) dry matter (DM) concentrations in as-cending colon contents and feces along with increased (P < 0.01) total VFA concentrations in both sample types (Figure 4). Absolute concentrations (µmol/g DM) of acetate (P = 0.002), propionate (P = 0.018), and butyrate (P = 0.012) were more than doubled in both sam-ple types (data not shown) and the same effect was observed when expressed on a relative molar basis (i.e., as a % of total volatile fatty ac-ids). By PND 61, no significance was observed in the concentrations of DM (P = 0.382), total VFA (P = 0.678), or any individual VFA on ei-ther absolute or relative bases in either sample type.
Brain Structure, Composition, and Development An interactive effect (P < 0.02) of early-life iron status and PND was observed for abso-lute whole brain volume (mm3), where ID pigs had a smaller volume at PND 32 compared with CONT pigs but the effect had normal-ized by PND 62 (Figure 5). When expressed relative to whole brain volume, main effects of early-life iron status remained consistent across study time-points, with ID pigs exhib-iting decreased relative volumes of the hip-pocampus (P < 0.01) and thalamus (P = 0.04) while white matter volume increased (P = 0.03). These changes in volume were comple-mented by reduced (P < 0.05) iron concentra-tions in regions including the pons, medulla, cerebellum, cortex, and hippocampus in ID pigs compared with CONT pigs, regardless of study time-point (main effect of early-life di-etary treatment), whereas iron accumulation occurred (P < 0.05) in the olfactory bulb of ID pigs. An interactive effect (P < 0.01) of early-life iron status and PND was observed for whole brain fractional an-isotropy (FA) values (Figure 6). Whereas no differences in whole brain FA values were evident between CONT and ID pigs at PND 32, ID pigs exhibited decreased FA
at PND 62. Main effects of early-life dietary treatment were observed for FA values in the cerebellum (P < 0.01) and internal capsule (P = 0.04) of ID pigs, compared with CONT pigs, regardless of study time-point. Pig behav-ior, measured by total movement and sleep characteris-tics, was altered only during phase 1 of the study, when pigs differed in their iron status (Figure 7). Early-life ID

52
Table 3. Effects of early-life iron status on relative abundances of selected bacterial phyla and genera (% of total sequences detected), along with alpha diversity indices of ascending colon content and fecal samples from pigs1
Outcome
Ascending Colon Contents FecesTreatment Treatment
CONT ID CONT IDPND 32
Number of samples 6 7 13 11Relative abundance
Actinobacteria 0.24 ± 0.46 0.71 ± 0.44 0.71 ± 0.87 3.72 ± 0.94*
Bifidobacterium ND ND 0.01 ± 0.39 0.96 ± 0.43*
Bacteroidetes 62.4 ± 5.05 56.3 ± 4.67 45.3 ± 3.17 43.9 ± 3.45Bacteroides 27.91 ± 6.96 15.49 ± 6.45 30.00 ± 7.17 1.06 ± 7.52*
Butyricimonas 3.74 ± 1.37 1.00 ± 1.32* 1.29 ± 0.52 1.46 ± 0.55Prevotella 1.48 ± 4.65 7.14 ± 4.58* 0.90 ± 1.46 2.78 ± 1.49*
Firmicutes 23.9 ± 7.7 25.5 ± 7.55 44.0 ± 3.53 41.2 ± 3.84Blautia 1.33 ± 0.94 1.05 ± 0.91 1.67 ± 0.84 3.44 ± 0.91Lactobacillus 0.31 ± 2.25 5.99 ± 2.11* 1.10 ± 0.78 4.12 ± 0.85*
Proteobacteria 5.26 ± 3.53 10.2 ± 3.48 3.19 ± 0.96 6.80 ± 1.05*
Campylobacter 0.04 ± 1.12 2.31 ± 1.04 0.09 ± 0.14 0.27 ± 0.15Desulfovibrio 1.15 ± 0.34 0.38 ± 0.31 1.68 ± 0.29 1.07 ± 0.32Escherichia 0.75 ± 1.41 2.48 ± 1.36 0.87 ± 0.99 4.62 ± 1.07*
Alpha diversity indicesObserved OTU 3,161 ± 678.8 3,035 ± 674.5 3,120 ± 177.6 3,739 ± 193.0*
Shannon 7.46 ± 0.743 7.36 ± 0.739 7.22 ± 0.449 8.27 ± 0.474*
Simpson reciprocal 34.69 ± 14.875 27.65 ± 14.583 35.38 ± 14.024 48.720 ± 14.328Chao 1 6,015 ± 1,469.7 5,677 ± 1,462.4 6,214 ± 395.0 6,955 ± 429.4
PND 62Number of samples 10 10 9 10Relative abundance
Actinobacteria 0.07 ± 0.03 0.15 ± 0.03 0.34 ± 0.10 0.21 ± 0.10Bifidobacterium 0.03 ± 0.03 0.11 ± 0.03* 0.21 ± 0.05 0.11 ± 0.05
Bacteroidetes 59.05 ± 2.14 56.71 ± 2.14 47.73 ± 6.79 45.70 ± 6.75Bacteroides 0.84 ± 0.51 1.33 ± 0.51 5.35 ± 2.80 5.70 ± 2.78Butyricimonas 0.14 ± 0.08 0.22 ± 0.08 0.59 ± 0.09 0.52 ± 0.09Prevotella 44.88 ± 2.93 36.03 ± 2.93* 21.67 ± 11.69 18.95 ± 11.67
Firmicutes 28.66 ± 2.16 32.65 ± 2.16 42.65 ± 7.82 43.94 ± 7.78Blautia 0.60 ± 0.17 0.76 ± 0.17 1.09 ± 0.40 1.11 ± 0.39Lactobacillus 1.26 ± 0.59 1.80 ± 0.59 1.46 ± 0.79 1.89 ± 0.77
Proteobacteria 9.05 ± 1.50 7.66 ± 1.50 4.52 ± 1.42 5.07 ± 1.39Campylobacter 4.31 ± 3.39 3.59 ± 3.38 0.82 ± 0.64 0.67 ± 0.62Desulfovibrio 0.11 ± 0.09 0.16 ± 0.09 0.37 ± 0.11 0.22 ± 0.10Escherichia ND ND ND ND
Alpha diversity indicesObserved OTU 3,103 ± 112.9 3,356 ± 112.9 4,006 ± 437.3 3,915 ± 435.4Shannon 7.16 ± 0.166 7.54 ± 0.166 7.99 ± 0.562 8.06 ± 0.559Simpson reciprocal 22.93 ± 4.0770 30.36 ± 4.0629 45.03 ± 21.75 44.15 ± 21.64Chao 1 6,344 ± 245.8 6,864 ± 245.8 8,075 ± 858.6 7,777 ± 852.5
1 Data are expressed as mean ± SEM for each dietary treatment group. Main effects of dietary treat-ment (CONT vs ID) is presented with an asterisk (*) denoting a treatment difference (P < 0.05) within the same sample type at the respective time-point. Relative abundances of phyla and genera are presented as a percentage of total sequences detected, and genera names are denoted as itali-cized. Abbreviations: CONT, control diet; ID, iron deficient diet; ND, not detected; OTU, operational taxonomic unit; PND, postnatal day.
increased total movement of ID pigs and shifted sleep-wake patterns by decreasing the time spent asleep and number of to-tal sleep bouts compared with CONT pigs. How-ever, the mean length of sleep event was not in-fluenced by early-life iron status and all measures were normalized be-tween CONT and ID pigs throughout phase 2 of the study.
Discussion We used the domes-tic pig as an ‘agrimedical’ model to study whether the effects of early-life iron deficiency on growth, tis-sue development, and mi-crobial profiles persisted after subsequently receiv-ing iron-adequate diets. Moreover, we were able to apply novel neuroimaging and behavioral techniques to elucidate the longitudi-nal influence of early-life iron status on brain devel-opment during and after iron deficiency. Overall, our results indicate that although hematological and microbiota outcomes recovered, the effects of early-life iron deficiency on growth performance and brain maturation could not be rectified by subsequent provision of dietary iron.
Growth, Body Composition, and Hematocrit Body weight did not differ between groups at the beginning of the study or for the first two weeks of life. Once ID anemia was clearly established in the ID group by PND 15 (i.e., as assessed by hematocrit), ID pigs ex-hibited reduced body weights compared with CONT
pigs, which remained through study conclusion. No treatment differences in hematocrit were evident at PND 7 or 14, likely due to the ability of pigs to rely on residual iron stores obtained in utero for a short period of time during the post-natal period. No pigs on study received supplemental iron as injectable iron dextran, so while porcine milk is iron-deficient, it is possible

53
Figure 4. Early-life ID caused loose stool (decreased dry matter, A) and increased VFA concentrations (B) in ascending colon content and fecal samples, but the ef-fects were corrected by subsequent iron repletion. Data are expressed as mean ± SEM for each dietary treatment group. *Treatment difference (P < 0.05) at a particular time-point due to early-life dietary iron concentration. Abbreviations: CONT, control; ID, iron deficient; PND, postnatal day; VFA, volatile fatty acids.
Figure 5. Early-life ID reduced the absolute whole brain volume (A) and rela-tive volumes (B) and iron content of individual brain regions (C), but increased relative white matter volume in pigs and these effects were not corrected by subsequent iron repletion. Data are expressed as mean ± SEM for each dietary treatment group. a-cBars without a common superscript letter or treatment comparisons with an asterisk (*) differ (P < 0.05) due to the main effect of early-life dietary iron concentration. Abbreviations: CONT, control; ID, iron deficient; PND, postnatal day.
to prevent ID by feeding an iron-ade-quate milk replacer as was evidenced in CONT pigs never exhibiting signs of ID. While body weight gain decreased due to ID, body composition was not affected at the end of study phase 1 and the efficiency of gain during phase 2 was similar between groups. Feed intake was reduced in ID pigs beginning in the sec-ond week of life and essentially lasted through study conclusion. Further stud-ies are warranted to investigate mecha-nisms for how ID causes decreased body growth, but our findings are congruent with other studies in young pigs (An-tonides et al., 2015) and human infants (Branca and Ferrari, 2002) alike. In addition to detriments to overall body weight, both liver and small intes-tine weights (absolute) were reduced in ID pigs compared to CONT pigs at both time-points. However, relative liver and small intestinal weights of ID pigs did not differ from CONT pigs at PND 32, but were increased by PND 62. This finding suggests that after the period of early-life ID, compensatory organ growth may occur with dietary iron repletion to the extent that hypertro-phy manifests (Therkildsen et al., 2016). When it comes to the brain, however, this organ appears to be preferentially spared during a period of ID, as abso-lute brain weight did not differ at either time-point even though body weights were vastly different between ID and CONT pigs. As such, ID pigs had rela-tively higher brain mass, though as dis-cussed below, weight does not equate to either volume or developmental outcomes. Overall, these findings con-tribute to the concept that iron is an es-sential nutrient for proper growth and development, and confirm that hema-topoiesis is exquisitely sensitive to di-etary iron status and can be recovered with dietary iron repletion.

54
Microbiota and Volatile Fatty Acid Profiles Mounting evidence suggests that iron status has a significant impact on the microbiota by altering micro-bial diversity within the gastrointestinal tract and the growth of potentially-pathogenic, iron-requiring bac-teria versus non-iron-requiring bacteria (Dostal et al., 2011; Jaeggi et al., 2015). In accordance with previous research (Isaacson and Kim, 2012), the main bacterial phyla in our study included Bacteroidetes, Firmicutes, and Proteobacteria. At the genera level, our findings indicate that ID elicited a colonic environment where non-iron-requiring, beneficial gut bacteria such as Lac-tobacillus and Bifidobacterium thrived, as has been doc-umented by others (Werner et al., 2011). Unexpectedly, we also observed that iron-requiring bacteria, such as Escherichia, were also higher in ID pigs. To our knowl-edge, only one other study has reported an increase in Escherichia abundance in anemic animals where it was related to prevalence of diarrhea. We did determine that fecal dry matter decreased from approximately 20% to 10% in ID pigs, but there were no clinical indications of active E. coli-related infection (i.e., scours), so it is dif-
Figure 6. Early-life ID reduced fractional anisotropy (FA) values in the whole brain (A) and individual brain regions (B; no effect of PND, so only the main effect of early-life iron concentration shown), likely by delaying myelination and therefore leading to less efficient neuronal signaling (C). Radial and axial diffusivity measures represent the movement of water molecules (captured by neuroimaging proce-dures) either perpendicular to or in the same direction as the long axis of a neuronal axon. As brain development occurs, myelination means more efficient saltatory conduction with movement of water along an axis, hence an increase in overall FA measures. Data are expressed as mean ± SEM for each dietary treatment group.a-c Bars without a common superscript letter differ (P < 0.05) due to the main effect of early-life dietary iron concentration. Abbreviations: AD, axial diffusivity; CONT, control; FA, fractional anisotropy; ID, iron deficient; PND, postnatal day; RD, radial diffusivity.
ficult to explain how expansion of Escherichia species occurred. As an indirect measure of iron status on microbial composition, VFA concentrations were drastically in-creased in ID pigs, confirming that shifts in microbial composition had occurred in multiple parts of the co-lon. It was reported in a previous study in children that increased abundance of Prevotella species, known for their fermentative capabilities, led to increased VFA concentrations (Power et al., 2013). While we observed clear shifts toward more Prevotella species in ID pigs at PND 32, it remains difficult to comprehend how greater fermentation could occur without changing the con-centration or type of fermentable substrate in the diet. As such, much work remains in determine the complex interplay among bacterial species and between the mi-crobiota and host when faced with an environmental insult like early-life ID. That being said, few differences in microbial diversity or richness were evident, and mi-crobial composition and VFA concentrations normal-ized between CONT and ID pigs after a period of iron repletion, so any effects of early-life ID appeared to be correctable.

55
Figure 7. Early-life ID increased activity (A) and shifted sleep-wake patterns by decreasing the time spent asleep (B; % of total time) and number of total sleep bouts (C) during phase 1 of the study. Mean length of sleeping bouts (D) was not influenced by early-life iron status and all measures were normalized between CONT and ID pigs throughout phase 2 of the study. Data are expressed as mean ± SEM for each dietary treatment group. *Treatment difference (P < 0.05) at a particular time-point due to early-life dietary iron concentration. Abbreviations: AC, activity count (arbitrary unit of movement); CONT, control; ID, iron deficient; PND, postnatal day.
Brain Structure, Composition, and Development Iron deficiency influences structural brain develop-ment and results in lasting functional deficits but it re-mains unclear which, if any, structural changes can be recovered via the diet. Analysis of whole brain volumes revealed smaller brains in dietary ID pigs at PND 32, but after dietary iron repletion, ID and CONT pig brain vol-umes were not different, suggesting compensatory brain volume growth in the ID pig brain. It was previously reported that ID influences expression of genes related to axon guidance and expansion in the 4-week-old pig hippocampus (Schachtschneider et al., 2016), so it is pos-sible that neuron growth and expansion were inhibited during the period of dietary ID. Moreover, ID was shown to reduce the relative volume of regions including the hippocampus and thalamus, while increasing white mat-ter volume, all of which may have resulted from altera-tions in myelination events. The observed effects in the hippocampus and thalamus are supported by previous evidence indicating prenatal, postnatal, and perinatal ID result in similar effects (Lozoff and Georgieff, 2006).
In addition to volumetric changes due to early-life ID, decreases in iron accumulation within specific re-gions and reduced markers of neuronal maturation were evident in our pig study. Collectively, changes in volume, iron content, and connectivity (as measured by diffusion tensor imaging outcomes) suggest that brain development in ID pigs was delayed relative to CONT pigs. While the brain is considered a privileged organ in many respects, the untoward and systemic effects of early-life ID during a period of rapid neuronal growth means that structure, and potentially function, can be influenced even when brain mass is not affected. Dif-fusion tensor measures provide non-invasive measures of microstructural water movement and are related to axonal growth and myelinating events. Fractional an-isotropy (FA) is a cumulative outcome that accounts for rate of water diffusion and direction of diffusion in tissue and results from a wide variety of developmen-tal events, much in the same way that growth is sum-mative of all metabolic events. As such, FA values are highly sensitive to environmental insult, as observed for ID pigs in our study, though it should be noted that both CONT and ID pigs exhibited positive brain develop-
56
mental trajectories. However, regardless of time-point, ID pigs exhibited decreased FA values in brain regions including the cerebellum and internal capsule when compared with CONT pigs. The cerebellum is pri-marily involved in the coordination of movement and even though the pig is a precocial species with a more mature cerebellum at birth compared with humans, ID was found to decrease FA in this region. Similarly, the internal capsule is a highly-myelinated region that serves as an intersection of many axons traversing both hemispheres of the brain. Alterations in either of these brain structures may directly influence behavior, which may influence growth performance and well-being of the pig. To our surprise, early-life ID increased activity and shifted sleep-wake patterns by decreasing the time spent asleep and total number of sleep events during phase 1 of the study. The exact physiological mecha-nism leading to these changes remains unknown and will require specific and sensitive behavioral tasks to elucidate the regions involved. Interestingly, the mean length of sleeping bouts was not influenced by early-life iron status and all measures of activity were normalized between CONT and ID pigs throughout phase 2 of the study, so these changes in behavior appear to have been corrected after iron repletion. Considering the reduc-tion in growth and feed intake by ID pigs, future studies should also focus on structure and function of the hy-pothalamus as a relatively small region that is critical in energy homeostasis and feed intake regulatory control.
Conclusion Careful control over dietary iron intake using the domestic pig as an ‘agrimedical’ model allows for gen-eration of knowledge that benefits pork production and human health alike. Herein, we described how ID induced soon after birth caused significant changes in growth performance, hematopoiesis, tissue develop-ment, and even microbial composition of the young pig. While the blood, microbiota, and even activity outcomes were largely recovered following dietary iron repletion, the untoward effects on growth performance and brain development could not be corrected. Struc-tural and functional alterations in metabolic and cogni-tive domains within the brain have direct implications on pig growth and welfare, so taking early-life nutrition into account is important to maintain sustainability and profitability of the pork industry.
ReferencesAntonides, A. et al. 2015. Pre-weaning dietary iron de-
ficiency impairs spatial learning and memory in the cognitive holeboard task in piglets. Frontiers in Be-havioral Neuroscience 9.
Antonides, A., S. van Laarhoven, F. J. van der Staay, and R. E. Nordquist. 2016. Non-anemic iron deficiency from birth to weaning does not impair growth or memory in piglets. Frontiers in Behavioral Neuro-science 10.
Branca, F., and M. Ferrari. 2002. Impact of micronutri-ent deficiencies on growth: the stunting syndrome. Ann. Nutr. Metab. 46(suppl 1): 8-17.
Dostal, A. et al. 2011. Iron depletion and repletion with ferrous sulfate or electrolytic iron modifies the com-position and metabolic activity of the gut microbio-ta in rats. J. Nutr. 142: 271-277.
Fleming, S. A., M. Chichlowski, B. M. Berg, S. M. Dono-van, and R. N. Dilger. 2018. Dietary sialyllactose does not influence measures of recognition memory or diurnal activity in the young pig. Nutrients 10: 395.
Georgieff, M. K. 2011. Long-term brain and behavioral consequences of early iron deficiency. Nutr. Rev. 69 Suppl 1: S43-48.
Isaacson, R., and H. B. Kim. 2012. The intestinal micro-biome of the pig. Anim. Health Res. Rev. 13: 100-109.
Jaeggi, T. et al. 2015. Iron fortification adversely affects the gut microbiome, increases pathogen abundance and induces intestinal inflammation in Kenyan in-fants. Gut 64: 731-742.
Li, M. et al. 2012. Microbial composition and in vitro fermentation patterns of human milk oligosaccha-rides and prebiotics differ between formula-fed and sow-reared piglets. J. Nutr. 142: 681-689.
Lozoff, B. 2011. Early iron deficiency has brain and be-havior effects consistent with dopaminergic dys-function. J. Nutr. 141: 740S-746S.
Lozoff, B., and M. K. Georgieff. 2006. Iron deficiency and brain development. Semin. Pediatr. Neurol. 13: 158-165.
McLean, E., M. Cogswell, I. Egli, D. Wojdyla, and B. de Benoist. 2009. Worldwide prevalence of anaemia, WHO Vitamin and Mineral Nutrition Information System, 1993-2005. Public Health Nutr. 12: 444-454.
Monaco, M. H. et al. 2018. Evaluation of sialyllactose supplementation of a prebiotic-containing formula on growth, intestinal development, and bacterial colonization in the neonatal piglet. Curr Dev Nutr 2: nzy067.

57
Mudd, A. et al. 2018a. Early-life iron deficiency reduces brain iron content and alters brain tissue composi-tion despite iron repletion: A neuroimaging assess-ment. Nutrients 10: 135.
Mudd, A. T., J. E. Fil, L. C. Knight, and R. N. Dilger. 2018b. Dietary iron repletion following early-life di-etary iron deficiency does not correct regional volu-metric or diffusion tensor changes in the developing pig brain. Front. Neurol. 8: 735.
National Research Council. 2012. Nutrient Require-ments of Swine: Eleventh Revised Edition. The Na-tional Academies Press, Washington, DC.
Odle, J., X. Lin, S. K. Jacobi, S. W. Kim, and C. H. Stahl. 2014. The suckling piglet as an agrimedical model for the study of pediatric nutrition and metabolism. Annual Review of Animal Biosciences 2: 419-444.
Penders, J. et al. 2006. Factors influencing the composi-tion of the intestinal microbiota in early infancy. Pe-diatrics 118: 511-521.
Power, S. E., P. W. O’Toole, C. Stanton, R. P. Ross, and G. F. Fitzgerald. 2013. Intestinal microbiota, diet and health. Br. J. Nutr. 111: 387-402.
Schachtschneider, K. M. et al. 2016. Impact of neona-tal iron deficiency on hippocampal DNA methyla-tion and gene transcription in a porcine biomedical model of cognitive development. BMC Genomics 17: 856.
Smiricky-Tjardes, M. R. et al. 2003. In vitro fermenta-tion characteristics of selected oligosaccharides by swine fecal microflora1. J. Anim. Sci. 81: 2505-2514.
Starzyński, R. R. et al. 2013. Iron Supplementation in Suckling Piglets: How to Correct Iron Deficiency Anemia without Affecting Plasma Hepcidin Levels. PLoS ONE 8: e64022.
Therkildsen, M. et al. 2016. Compensatory growth re-sponse in pigs, muscle protein turn-over and meat texture: effects of restriction/realimentation period. Anim. Sci. 75: 367-377.
Todorich, B., J. M. Pasquini, C. I. Garcia, P. M. Paez, and J. R. Connor. 2009. Oligodendrocytes and myelina-tion: The role of iron. Glia 57: 467-478.
Werner, T. et al. 2011. Depletion of luminal iron alters the gut microbiota and prevents Crohn’s disease-like ileitis. Gut 60: 325-333.

58

59
Introduction Weaning is well known throughout the swine indus-try as one of the more stressful times in the life of a pig and is associated with many gastrointestinal (GI) altera-tions including a reduced villus height to crypt depth ra-tio (villus:crypt), changes to the intestinal microbiome, and poor regulation of an underdeveloped immune system (Pluske et al., 1997; Heo et al., 2013). Altera-tions to the pig GI tract often cause diarrhea, decrease absorptive capacity, increase intestinal inflammation, and decrease growth performance following weaning (Pluske et al., 1996; Wijtten et al., 2011; Campbell et al., 2013), and usually occur due to sudden environmental, social, and dietary changes around the time of weaning (Lalles et al., 2007; Hötzel et al., 2011). These changes have previously been attributed to stress (Moeser et al., 2007) or decreased feed intake (Pluske et al., 1997);
however, a study done by Kelly et al. (1991) reported reduced villus height and increased crypt depth in pigs after weaning when fed through gastric intubation, indi-cating that the reduced absorptive capacity was not due to decreased feed intake. Higher incidence of diarrhea following weaning can be linked to the proliferation of Escherichia coli which may be exacerbated by decreased barrier function causing an imbalanced microbiome and pathogenic infection (Chen et al., 2013). Antibiotics are added to the feed to combat any negative effects of weaning. However, antibiotic use in livestock produc-tion is coming under increased public scrutiny due to concerns over antibiotic resistance, for both humans and pigs, and there is a serious push by the industry, fu-eled by pressure from the public, to reduce usage (Van Boeckel et al., 2015). To reduce the need for antibiot-ics, a multitude of new strategies have been researched
Dextrin Soluble Fiber Alters the Piglet Microbiome and Gut Health
Tim Johnson, Clayton Chastain, Carmen Wickware, Brian Richert, and Scott Radcliffe Department of Animal Sciences
Purdue University, West Lafayette, IN 47907 Phone: 765-494-8091
SummaryDigestive dysbiosis, impaired gut barrier function, and disease are common during piglet weaning. It is thought that optimization of the gut microbiome community may ameliorate weaning stress. The objective of this study was to determine if soluble fiber could influence the gut microbiome pre- and post-weaning. Forty barrows were used in a 35 d experiment with the objective of evaluating effects of supplemental soluble fiber (dextrin) pre- and post-weaning on growth performance and SCFA production. Pigs were blocked by genetics and BW, and randomly allotted to treatments in a 2 x 2 factorial design with or without fiber pre-weaning and with or without fiber post-weaning. Fiber was suspended in chocolate milk and administered orally through a syringe from 14 d prior to weaning until 4 d post-weaning, after which it was included in the diet at 1%. Growth performance was not affected (p > 0.10) by treatment. Pigs that received fiber had a trend for decreased crypt depth, a potential indication for reduced intestinal stress. In the microbiome, an increase in Desul-fovibrionaceae was observed in pigs that never received supplemental fiber, a genus which has been implicated in increased gut inflammation. A trend for an interaction of pre- and post-weaning fiber supplementation was observed for acetate (P = 0.052) and butyrate (P = 0.087) concentrations in large intestine contents. Pigs fed fiber only in the nursey had the highest acetate concentration, while pigs never receiving fiber had the lowest concentration. Microbiota analysis supported the short chain fatty acid (SCFA) analysis, because pigs that received fiber pre- and/or post-weaning had more SCFA producing bacteria, specifically known SCFA producing genera such as Butyrivibrio, Butyricimonas, Acetivibrio, and Turicibacter, as well as other beneficial commensal bacteria. This study shows the importance of fiber in shaping the gut health of swine, especially during the pre-weaning period and merits continued study to determine the optimal fibers that should be used, the delivery method, and the impact on disease resistance.

60
to decrease intestinal permeability and diarrhea while increasing absorptive capacity and maintaining growth performance achieved when animals are treated with antibiotics (Allen et al., 2013). Increased intestinal permeability can be caused by a reduced concentration of tight junction proteins, such as occludin, in the intestinal mucosa (Oswald, 2006). When tight junction protein expression is decreased, bacteria and other pathogenic substances can pass through the intestinal wall paracellularly which can ac-tivate the immune system (Turner, 2006), leading to in-testinal inflammation (Campbell et al., 2013). Intestinal permeability and integrity can be altered by pro-inflam-matory cytokines (McKay and Baird, 1999). Short chain fatty acids (SCFAs) are produced by beneficial bacteria, and an alteration in SCFA concentrations typically in-dicates a shift in the bacterial community composition (Franklin et al., 2002). Microbiota in the gut have proven to be an important aspect involved in the overall health and development of the pig (Frese et al., 2015). Inclusion of dietary fiber alters the gut microbiota composition, acting as a prebiotic energy source (Bauer et al., 2006), and has been shown to cause many benefi-cial health effects for the pig. Wang and Gibson (1993) reported after incubating fructo-oligosaccharides and inulin, two sources of soluble fiber, with human feces, the pH of the feces decreased as did the concentration of Clostridium perfringens and E. coli. Fiber has also been reported to reduce gut inflammation and reduce intesti-nal permeability (Grooms et al., 2013), which could limit the number of harmful bacteria that are able to cross the intestinal barrier around the time of weaning. Soluble fibers, specifically, have been reported to re-duce lesions caused by inflammation in both the ileum and colon, influence gene expression of immune cells in mice (Bassaganya-Riera et al., 2011), decrease fecal pH, and increase calcium absorption (Whisner et al., 2016). In rats, the soluble fiber dextrin was reported to benefit gut health by increasing cecal weight, increase goblet cell count and alter mucin composition (Knapp et al., 2013). It is thought that these beneficial effects are brought about by altering the gut microbial community to a more beneficial community and one that produces more SCFAs. Five soluble fibers, including dextrin, were shown to alter the microbial community by increasing bifidobacteria and Lactobacillus species in an in vitro model (Maathuis et al., 2009). The purpose of this study was to supplement the diet of pigs both pre- and post-weaning with dextrin to test the ability of a soluble fiber to modify the gut microbiome composition or allevi-ate negative health symptoms that occur shortly after weaning.
MethodsAnimals and Experimental Design All animal procedures were approved by the Purdue Animal Care and Use Committee (PACUC #1303000841). A total of 40 barrows (Landrace x Ches-terwhite cross that were genetically selected and bred to have an increased allergic susceptibility to soy-based feed (Cabrix et al., 2011)) were blocked by BW and genetics, and randomly allotted within block to a 2x2 factorial experiment with or without fiber pre-wean-ing and with or without fiber post-weaning. The study lasted for 5 weeks: beginning 14 d prior to weaning (d -14) and ending 21 d post-weaning (d 21). From d -14 to d 0, pigs were housed with the sow in their respective farrowing crate. The morning of d 0, pigs were weaned and moved to group housed pens, and on d 4 pigs were moved to individual pens where they remained for the remainder of the experiment. Dextrin (Equate, Bentonville, AR) was supplied to pigs (dissolved in chocolate milk) at a rate of 1 g/d of on days -14 to -8, 2 g/d of on d -7 to -1 and 3 g/d on d -1 until d 4 relative to weaning (d 0). The goal fiber dose was 0.045 g/kg BW/d according to doses in human trials (Whisner et al., 2016). Starting on d 4, fiber was mixed into the feed at 1% of the diet. Pigs not receiving fiber during the oral dosing period received chocolate milk with no added fiber.
Sample Collection On d 0 and d 21, 8 and 31 pigs were euthanized, respectively. Intestinal tissue was collected from the ileum and cecum while digesta and mucosal swab samples were taken from the ileum, cecum, colon and feces. Ileal tissue was preserved in 10% neutral buffered formalin for subsequent histological analyses. Ileal and cecal tissue were scraped and flash frozen in 1 mL of InvitrogenTM TRIzol® reagent (ThermoFisher Scien-tific; Waltham, MA, USA) for subsequent isolation of mRNA. Digesta was taken from the distal end of the il-eum, the cecum, and the proximal large intestine, where it was placed on ice for microbiome analysis. Extracted DNA was used for the construction of a 16S rRNA gene library following a standardized proto-col (Kozich et al., 2013). Briefly, Illumina indexed reads were created using PCR amplification of the V4 region of bacterial 16S rRNA gene. Amplification success was determined through gel electrophoresis as a quality check. No bands were observed in the negative control samples using water as the DNA template. Amplified DNA was normalized using a SequalPrep Normaliza-tion Plate (Invitrogen), and pooled into a single library
61
for each 96-well plate. Library concentration was de-termined using the KAPA Library Quantification Kit (Roche) and library average fragment length was deter-mined using the Bioanalyzer (Agilent) with a high sen-sitivity kit. Following the confirmation of proper DNA concentration, the pooled samples, mock community, and water, were sequenced (Illumina, MiSeq v2 kit, 500 cycle). Sequences were demultiplexed according to oligonucleotide bar code sequence with Illumina soft-ware. All equipment for extraction, amplification, and sequencing are located within Purdue University. Raw reads were analyzed using mothur (v 1.39.3). The general pipeline for mothur is as follows: make con-tigs from raw reads, align contigs to reference sequences (Quast et al. 2012; SILVA database release 132), screen and filter sequences to remove low quality reads (am-biguous bases allowed = 0, maximum read length = 275, homopolymers allowed = 8), group sequences based on sequence similarity, classify sequences with reference to known taxonomic classifications (Cole et al. 2013; RDP training set 16), cluster sequences, and run diversity metrics.
Animal Growth and Gut Health Metrics Feed intake and animal weights were measured based on the pen at different life stages. Pigs were group housed from d -14 until d 4 (i.e. farrowing crate or treat-ment group pen). Thus, BW, average daily gain (ADG), average daily feed intake (ADFI), and gain:feed ratio (G:F) were determined on a pen basis from d 0 to d 4 and on an individual animal basis from d 4 to d 21. Ileal cross sections that were placed in formalin were sent to the Purdue University Histology Lab in the Col-lege of Veterinary medicine for sample preparation and imaging. Six villi and six crypts were measured for each pig. The villi were measured from the tip of the villus to the base of the villus. Crypts were measured from the base of the villus to the bottom of the crypt region. Short chain fatty acid concentrations were deter-mined from fecal samples acidified with 25% metaphos-phoric acid, separated by centrifugation and filtration, and analyzed with gas chromatography (3900 CP-8400, Varian Medical SystemsTM, Palo Alto, CA, USA).
Statistical Analysis Pig was used as the experimental unit (n=39) for growth performance, gene expression, histology and SCFA concentrations. Data were analyzed using PROC GLM in SAS 9.4© (SAS Inst. Inc., Cary, NC). All data were analyzed as a 2x2 factorial with or without fiber pre-weaning and with or without fiber post-weaning. Values were considered significant at P ≤ 0.05, and a
trend at P ≤ 0.10. For microbiome data, metastats was used to determine statistical significance between treat-ment groups and a multiple test correction q-value, cal-culated using the false discovery rate method, was done using R (R Core Team 2013).
ResultsAnimal Growth and Performance Fiber supplementation had limited to no impact on animal feed intake, weight gain, or feed efficiency. There was no difference in ADG while pigs were nursing (P > 0.05; Table 1), but on d 0, there was a trend (P = 0.087) for pigs receiving fiber to weigh less than those not re-ceiving fiber. This trend became significant four days af-ter weaning, with pigs receiving fiber following weaning having decreased body weight (P = 0.022; Table 1). From d 4 to d 11, there were no differences in ADG or ADFI (P > 0.05; Table 1), however there was a trend for pigs receiving fiber after weaning to have decreased G:F d 4 to 11 (P = 0.056; Table 1). From d 11 to 21 there was a trend in ADG for the interaction between diet and stage of supplementation (P = 0.085; Table 1), but there were no differences in ADFI, G:F, or d 21 BW (P > 0.05; Table 1). There were no differences found between treatments from d 0 to 21 for ADG, ADFI, or G:F (P > 0.05; Table 1). Overall, fiber included in the diet slightly reduced body weight for about 1 week after weaning, but by three weeks post-weaning, there were no differences in any animal growth performance measures.
Histology Pigs euthanized prior to weaning on d 0 had no dif-ferences in villus height, crypt depth, or villus:crypt (P > 0.05), however, differences were observed in pig’s intestinal morphology by the end of the study on d 21. Providing supplementary fiber to pigs prior to wean-ing tended to decrease crypt depth (P = 0.0904), while villus height remained unchanged (P > 0.05; Table 2), resulting in the villus:crypt tending to be increased by pre-weaning fiber (P = 0.093). The addition of fiber after weaning resulted in no difference in villus height, crypt depth, or villus:crypt (P > 0.05; Table 2).
Short Chain Fatty Acid (SCFA) Analysis Addition of fiber to the diet in general caused an increase in the concentration of short chain fatty ac-ids especially for pigs that received fiber during pre-weaning. Fiber-supplementation caused a tendency for a diet x stage of supplementation interaction for the total amount of SCFAs (P = 0.085; Table 3). Pigs that re-ceived fiber at any point had numerically increased con-centrations of total SCFAs (mmol/L) compared to the
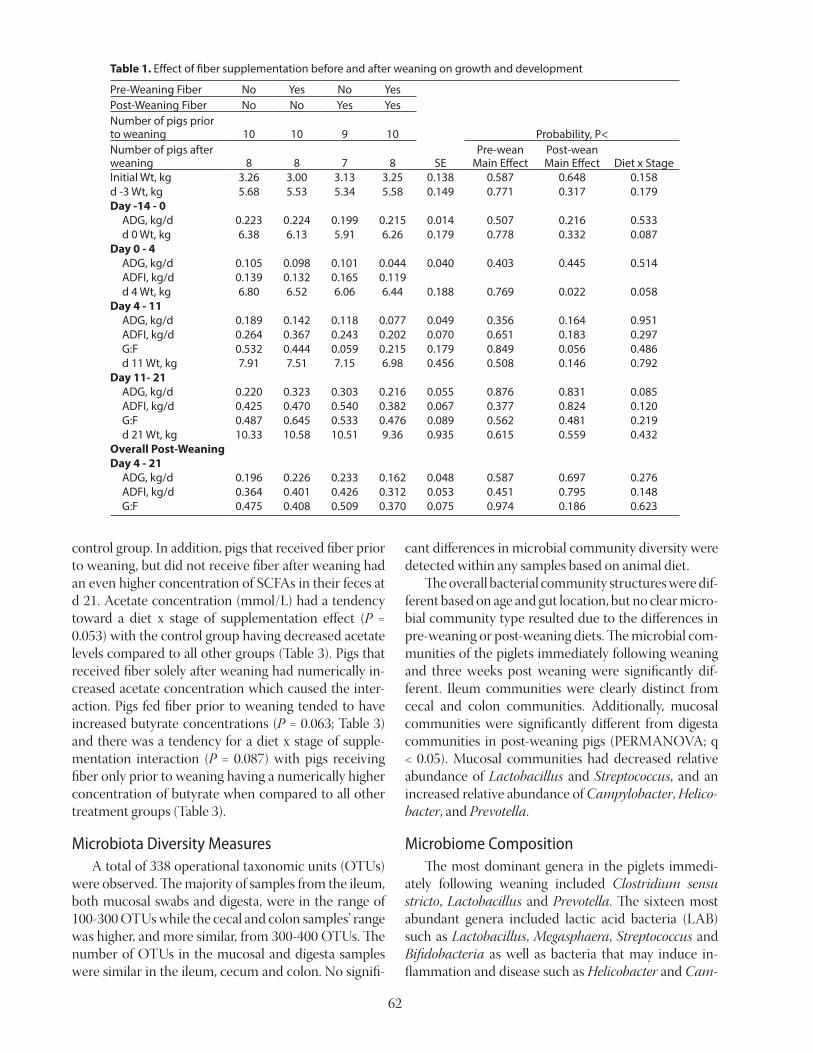
62
control group. In addition, pigs that received fiber prior to weaning, but did not receive fiber after weaning had an even higher concentration of SCFAs in their feces at d 21. Acetate concentration (mmol/L) had a tendency toward a diet x stage of supplementation effect (P = 0.053) with the control group having decreased acetate levels compared to all other groups (Table 3). Pigs that received fiber solely after weaning had numerically in-creased acetate concentration which caused the inter-action. Pigs fed fiber prior to weaning tended to have increased butyrate concentrations (P = 0.063; Table 3) and there was a tendency for a diet x stage of supple-mentation interaction (P = 0.087) with pigs receiving fiber only prior to weaning having a numerically higher concentration of butyrate when compared to all other treatment groups (Table 3).
Microbiota Diversity Measures A total of 338 operational taxonomic units (OTUs) were observed. The majority of samples from the ileum, both mucosal swabs and digesta, were in the range of 100-300 OTUs while the cecal and colon samples’ range was higher, and more similar, from 300-400 OTUs. The number of OTUs in the mucosal and digesta samples were similar in the ileum, cecum and colon. No signifi-
cant differences in microbial community diversity were detected within any samples based on animal diet. The overall bacterial community structures were dif-ferent based on age and gut location, but no clear micro-bial community type resulted due to the differences in pre-weaning or post-weaning diets. The microbial com-munities of the piglets immediately following weaning and three weeks post weaning were significantly dif-ferent. Ileum communities were clearly distinct from cecal and colon communities. Additionally, mucosal communities were significantly different from digesta communities in post-weaning pigs (PERMANOVA; q < 0.05). Mucosal communities had decreased relative abundance of Lactobacillus and Streptococcus, and an increased relative abundance of Campylobacter, Helico-bacter, and Prevotella.
Microbiome Composition The most dominant genera in the piglets immedi-ately following weaning included Clostridium sensu stricto, Lactobacillus and Prevotella. The sixteen most abundant genera included lactic acid bacteria (LAB) such as Lactobacillus, Megasphaera, Streptococcus and Bifidobacteria as well as bacteria that may induce in-flammation and disease such as Helicobacter and Cam-
Table 1. Effect of fiber supplementation before and after weaning on growth and development
Pre-Weaning Fiber No Yes No YesPost-Weaning Fiber No No Yes YesNumber of pigs prior to weaning 10 10 9 10 Probability, P<Number of pigs after weaning 8 8 7 8 SE
Pre-wean Main Effect
Post-wean Main Effect Diet x Stage
Initial Wt, kg 3.26 3.00 3.13 3.25 0.138 0.587 0.648 0.158d -3 Wt, kg 5.68 5.53 5.34 5.58 0.149 0.771 0.317 0.179Day -14 - 0
ADG, kg/d 0.223 0.224 0.199 0.215 0.014 0.507 0.216 0.533d 0 Wt, kg 6.38 6.13 5.91 6.26 0.179 0.778 0.332 0.087
Day 0 - 4ADG, kg/d 0.105 0.098 0.101 0.044 0.040 0.403 0.445 0.514ADFI, kg/d 0.139 0.132 0.165 0.119d 4 Wt, kg 6.80 6.52 6.06 6.44 0.188 0.769 0.022 0.058
Day 4 - 11ADG, kg/d 0.189 0.142 0.118 0.077 0.049 0.356 0.164 0.951ADFI, kg/d 0.264 0.367 0.243 0.202 0.070 0.651 0.183 0.297G:F 0.532 0.444 0.059 0.215 0.179 0.849 0.056 0.486d 11 Wt, kg 7.91 7.51 7.15 6.98 0.456 0.508 0.146 0.792
Day 11- 21ADG, kg/d 0.220 0.323 0.303 0.216 0.055 0.876 0.831 0.085ADFI, kg/d 0.425 0.470 0.540 0.382 0.067 0.377 0.824 0.120G:F 0.487 0.645 0.533 0.476 0.089 0.562 0.481 0.219d 21 Wt, kg 10.33 10.58 10.51 9.36 0.935 0.615 0.559 0.432
Overall Post-WeaningDay 4 - 21
ADG, kg/d 0.196 0.226 0.233 0.162 0.048 0.587 0.697 0.276ADFI, kg/d 0.364 0.401 0.426 0.312 0.053 0.451 0.795 0.148G:F 0.475 0.408 0.509 0.370 0.075 0.974 0.186 0.623

63
Table 3. Main and interaction effects of fiber supplementation pre- and post-weaning on SCFA concentrations and percentages
Pre-Weaning Fiber No Yes No YesPost-Weaning Fiber No No Yes Yes Probability, P<Number of pigs after weaning 8 8 7 8 SE
Pre-wean Main Effect
Post-wean Main Effect Diet x Stage
Total SCFA, mmol/L 142 178 162 153 13.22 0.272 0.854 0.085Acetate, mmol/L 72 86 95 83 6.56 0.827 0.138 0.052Propionate, mmol/L 39 44 46 39 4.50 0.870 0.816 0.160Butyrate, mmol/L 23 36 24 25 3.68 0.063 0.165 0.087Valerate, mmol/L 6.09 9.42 5.30 5.17 1.05 0.137 0.025 0.108Isobutyrate, mmol/L 1.15 0.836 1.35 0.873 0.195 0.053 0.549 0.680Isovalerate, mmol/L 1.17 0.741 1.03 0.922 0.217 0.198 0.914 0.425Acetate, % of total 51 49 54 55 2.04 0.880 0.020 0.486Propionate, % of total 27 25 26 25 1.04 0.119 0.529 0.651Butyrate, % of total 16 20 15 15 1.43 0.139 0.045 0.261Valerate, % of total 4.37 5.29 3.10 3.24 0.581 0.366 0.009 0.506Isobutyrate, % of total 0.821 0.472 0.881 0.591 0.163 0.061 0.583 0.854Isovalerate, % of total 0.908 0.406 0.938 0.632 0.216 0.074 0.555 0.650
Table 2. Interactive effects of fiber supplementation pre- and post-weaning on villus height, crypt depth, and villus:crypt on d 21 post-weaning
Fiber pre-weaning No Yes No Yes Probability, P<Fiber post-weaning No No Yes Yes SE Pre-wean Post-wean Diet x Stage Villus Height, μm 378 367 364 336 20.49 0.336 0.275 0.675Crypt depth, μm 346 314 325 295 18.01 0.09 0.266 0.975Villus:Crypt 1.074 1.222 1.111 1.257 0.089 0.093 0.671 0.994
pylobacter (Fig. 1a). There were no genera with a relative abundance statistically different from that of another diet group after only the pre-weaning diet. The inabil-ity to identify statistically significant changes was likely caused by the low number of samples collected (n = 4 af-ter pre-weaning period) and the low number of samples with sufficient number of high quality sequences (n = 2 in ileum groups). While shifts in the relative abundance of genera after the pre-weaning period were not statisti-cally significant, there were noticeable shifts in Lactoba-cillus, Clostridium sensu stricto, and, Prevotella between pigs that received fiber and those that did not (Figure 1a) that likely deserve future consideration. In the ileal digesta and mucosa, pigs that received fiber in the diet had a numerically increased abundance of Clostridium sensu stricto and unclassified Pasteurellacaceae, and Lactobacillus decreased in relative abundance. This ef-fect was the opposite in the colon digesta where animals receiving fiber had a numerical increase in Lactobacillus and a decrease in Prevotella. Three weeks after weaning, the microbial communi-ties were still dominated by the same OTUs as were ob-served immediately after weaning, but more OTUs be-came dominant. The major members of the community included Campylobacter, unclassified Clostridiales, Lac-tobacillus, Megasphaera, Prevotella, and Veillonellaceae. There were statistical shifts in OTUs of the cecal and
colon microbial community (metastats, q <0.05) at the endpoint of the study, mainly OTUs with an abundance of less than 1% of the community (Fig. 2). There were many OTUs with different relative abundance between the following pairs of groups F/F—NF/NF (Fig. 2a), F/NF—NF/NF (Fig. 2b), and F/F—F/NF (Fig. 2c) when in the cecum and colon, but none that were statistically different in the ileum (n = 7 or 8) or in the animals im-mediately following weaning in any intestinal location (n = 4). When considering differentially present OTUs in these three pairs of samples, the NF/NF group mainly had OTUs with decreased abundance, including SCFA producing bacteria such as Butyrivibrio, Butyricimo-nas, Acetivibrio, and Turicibacter. There were only two OTUs found with increased abundance in the NF/NF group which were identified as most closely related to Desulfovibrio and Pseudoscardovia. On the other hand, when comparing the F/F and F/NF groups OTUs were increased and decreased in both treatment groups. While there were many differences, including poten-tially beneficial bacteria, between the F/NF group from the NF/NF group, only Clostridium IV was increased in the NF/F group compared with the NF/NF group. Thus, it appears that receiving fiber pre-weaning has a larger impact on the long term composition of the gut micro-bial community.

64
Discussion This study was designed with the goal of alleviating the negative effects that are typically observed around the time of weaning. These negative effects may occur from the stress involved with weaning, or due to the re-fusal of feed for several hours after weaning (Aherne et al., 1993). As the need for animal protein sources for hu-man consumption rises, so does the usage of antimicro-bials in livestock production (Van Boeckel et al., 2015). Reducing the need for antimicrobial use in animals is included in the One-Health approach to reduce anti-biotic resistance in pathogens. The swine industry, as with all other users of antibiotics, is working to develop different means of lowering the need for antimicrobi-als through supplementation of various pathogen-sup-pressing feed additives. Inclusion of fiber in swine diets is reported to im-prove swine health in a variety of ways (Perry and Ying, 2016). Fiber has been reported by Jenkins et al., (2002) to increase the concentration of SCFAs which are capa-ble of being used by the enterocytes as an energy source. SCFA have been reported to boost the efficiency of the immune system by increasing the amount of natural killer cells (Pratt et al., 1986) and liberates glutamine to be used as an energy source by lymphocytes (Jenkins et al., 1999). In our study, dietary dextrin increased fecal SCFA concentrations. Most notable was the increase in
butyrate production which has been associated with re-ductions in inflammatory genes, increased growth per-formance, increased intestinal absorptive capacity, and decreased E. coli abundance (Lu et al.,2008). Fiber supplementation has also been reported to act as a prebiotic source in the gut which allows the growth of more beneficial bacteria (Bauer et al., 2006). Rossi et al., (2001) reported a reduction of E. coli in pigs, incubat-ed with the infectious bacteria, following the inclusion of inulin into the diet. In the current study, dietary dex-trins during the pre-weaning period caused reduction in the number of bacteria that are associated with gut inflammation, in addition to an increase in the amount of microbiota associated with beneficial functions. Pigs that received fiber during the pre-weaning period (F/F and F/NF groups) each had increased SCFA producing bacteria (q < 0.05) compared to pigs that never received fiber in the cecum and colon for both mucosal and di-gesta samples (Fig. 2A-B). Butyrivibrio, Butyricimonas, Acetivibrio, and Turicibacter were all increased when dextrin was given during the pre-weaning period and have been shown previously to produce SCFAs (Azman et al., 2015; Ulger Toprak et al., 2015; Zhong et al., 2015). Pigs that never received fiber had increased Desulfovi-brionaceae (q < 0.05), a family with members implicated in increased inflammation (Figliuolo et al., 2017), in both cecum and colon mucosal samples. In addition,
Figure 1. Stacked bar graphs showing the relative abundance of genera (y-axis) for individual pigs (A) or diet group (B; x-axis). Panel A: pre-weaning pigs; Fiber n = 4, No Fiber n = 4. Panel B: post-weaning pigs; F/F n = 8, NF/F n = 7, F/NF n = 8, NF/NF n = 8.
* Samples that had low sequence counts that were not included in the analysis

65
Figure 2. Differentially abundant OTUs by diet type. Bar plots showing the most distinguishing genera between diet comparisons. Only OTUs with q < 0.05 were considered as being distinguishing. Error bars are from standard error. No distinguishing OTUs found between the any of the ileal samples for either mucosal swabs or digest as well as pre-weaning pigs or F/NF – NF/F for any type of sample.
pigs fed fiber during the pre-weaning period had an increase in beneficial strict anaerobic commensal Clos-tridia, including members of Clostridium IV, Clostridi-um XIVb and Clostridium sensu stricto which may pro-duce SCFAs and promote a healthy immune pathways and maintain gut homestasis (Lopetuso et al., 2013) and Comamonas which aids in proper epithelial cell regula-tion (Pédron et al., 2012). Pigs that received fiber only in the post-weaning period (NF/F) seem to be of an in-termediate community type. There were no genera with different relative abundance with the NF/NF group and only one genera different with the F/F group. Thus, fiber supplementation in the post-weaning period did not re-sult in the beneficial microbial community shift like pre-weaning fiber supplementation.
While pre-weaning dextrin appears to have pro-moted many beneficial bacteria compared with the NF/NF group, there were still many OTUs that had different relative abundance between the F/F and F/NF groups. Interestingly, many of the differentially abundant OTUs between these two groups were either increased or de-creased in either diet group. For example, Acetovibrio and Butyrivibrio both produce SCFAs but Acetovibrio was increased in the F/NF group, while Butyrivibrio was increased in the F/F group. This suggests that fiber post-weaning may not have changed the function of the community as a whole, but instead shifted which popu-lations were present to carry out necessary functions. This was previously seen in the human gut – higher order taxa of microbial communities do not shift due

66
to small or short-term diet changes; the genera may change but the functions they provide are similar (Ar-umugam et al. 2011). Thus, it appears that some com-munity divergence occurred during the post-weaning period without fiber in the F/NF group, but the overall community function appears similar between the two groups. Mucosal communities were significantly different from digesta communities in post-weaning pigs. Deter-mining differences between mucosal-associated and lu-minal bacterial communities is uncommon, but may be important in the determination of gut health (Van den Abbeele et al. 2013). While metabolites produced in the lumen can still have an impact on the animal (Don-aldson et al. 2016), mucosal microbial communities are thought to be of more relevance to gut health because mucosal communities are have a longer retention time in the gut, in closer contact to the epithelium, and thus can have a more direct impact on the structure and function of the intestinal barrier (Martens et al. 2008; Van den Abbeele et al. 2013). Weaning is associated with reductions in villus height and increases in crypt depths (Cera et al., 1988). This is indicative of intestinal inflammation as well as increases in intestinal sloughing (Land, 2015). In this study, no changes in villi heights were observed be-tween treatment groups, though a trend for a reduction in crypt depths was observed with fiber supplementa-tion, leading to a trend for an increase in villus:crypt. This implies that addition of fiber did not increase the absorptive capacity in the ileum, but reduced the amount of stress placed on the small intestine (Nabuurs and Hoogendoorn, 1993). Seeing this reduction in in-testinal stress coupled with SCFA production, growth performance would be expected to increase. However, when analyzed over the entire study, there were no dif-ferences in ADG or ADFI among treatment groups.
Conclusion Data from this study indicates that feeding fiber prior to or after weaning results in increased SCFA production, reduced intestinal stress, a reduction in the number of microbiota associated with gut inflam-mation and an increase in bacteria with beneficial func-tions. Feeding fiber at any point in the study resulted in increased total SCFA production, most notably bu-tyrate and acetate within the ileum, cecum, and colon. Bacteria that produce SCFAs were also observed to be increased in animals fed fiber. A trend for an increase in villus height:crypt depth was also reported with the addition of fiber prior to weaning. The microbiome analysis supported this finding and implied that fiber
addition especially prior to weaning reduces the abun-dance of some microbiota that are associated with gut inflammation. Different types and sources of fiber have reported to produce different effects in pigs. More work on how different fibers benefit the pig at weaning is war-ranted.
ReferencesAherne, F., M. Hogberg, and H. Jones. 1993. Manage-
ment and nutrition of the newly weaned pig. In: Pork Industry Handbook
Allen, H. K., U. Y. Levine, T. Looft, M. Bandrick, and T. A. Casey. 2013. Treatment, promotion, commotion: antibiotic alternatives in food-producing animals. Trends in Microbiology 21:114–119.
Azman, S., A. F. Khadem, J. B. van Lier, G. Zeeman, and C. M. Plugge. 2015. presence and role of anaerobic hydrolytic microbes in conversion of lignocellulosic biomass for biogas production. Crit. Rev. Environ. Sci. Technol. 45:2523–2564. doi:10.1080/10643389.2015.1053727.
Bassaganya-Riera, J., M. DiGuardo, M. Viladomiu, A. de Horna, S. Sanchez, A. W. C. Einerhand, L. Sanders, and R. Hontecillas. 2011. Soluble fibers and resistant starch ameliorate disease activity in interleukin-10-deficient mice with inflammatory bowel disease. J. Nutr. 141:1318–1325.
Bauer, E., B. A. Williams, and M. W. A. Verstegen. 2006. Fermentable carbohydrates: potential dietary modulators of intestinal physiology, microbiology and immunity in pigs. Biol. Grow. Anim. 4:33–63. doi:10.1016/S1877-1823(09)70089-X.
Cabrix, R, A. Schinckel, T. Stewart, E. Herman, R Helm, and N. Nielsen. (2011) Development of tools to study immune-mediated allergenic responses to food and feed. In: Designing Soybeans for 21st Century Mar-kets. Ed. R.Wilson. AOCS Press. pp 239-252
Campbell, J. M., J. D. Crenshaw, and J. Polo. 2013. The biological stress of early weaned piglets. J. Anim. Sci. Biotechnol. 4:19. doi:10.1186/2049-1891-4-19.
Cera, K. R., D. C. Mahan, and R. F. Cross. 1988. Effect of age, weaning, and postweaning diet on small intesti-nal growth and jejunal morphology in young swine. 66:574–584. doi: 10.2527/jas1988.662574x
Chen, H., X. Mao, J. He, B. Yu, Z. Huang, J. Yu, P. Zheng, and D. Chen. 2013. Dietary fibre affects intestinal mucosal barrier function and regulates intestinal bacteria in weaning piglets. Br. J. Nutr. 110:1837–1848. doi:10.1017/S0007114513001293.
Cole J. R., Q. Wang, J. A. Fish, B. Chai, D. M. McGar-rell, Y. Sun et al.. 2013. Ribosomal Database Project: data and tools for high throughput rRNA analysis. Nucleic Acids Research 42(D1):D633–42
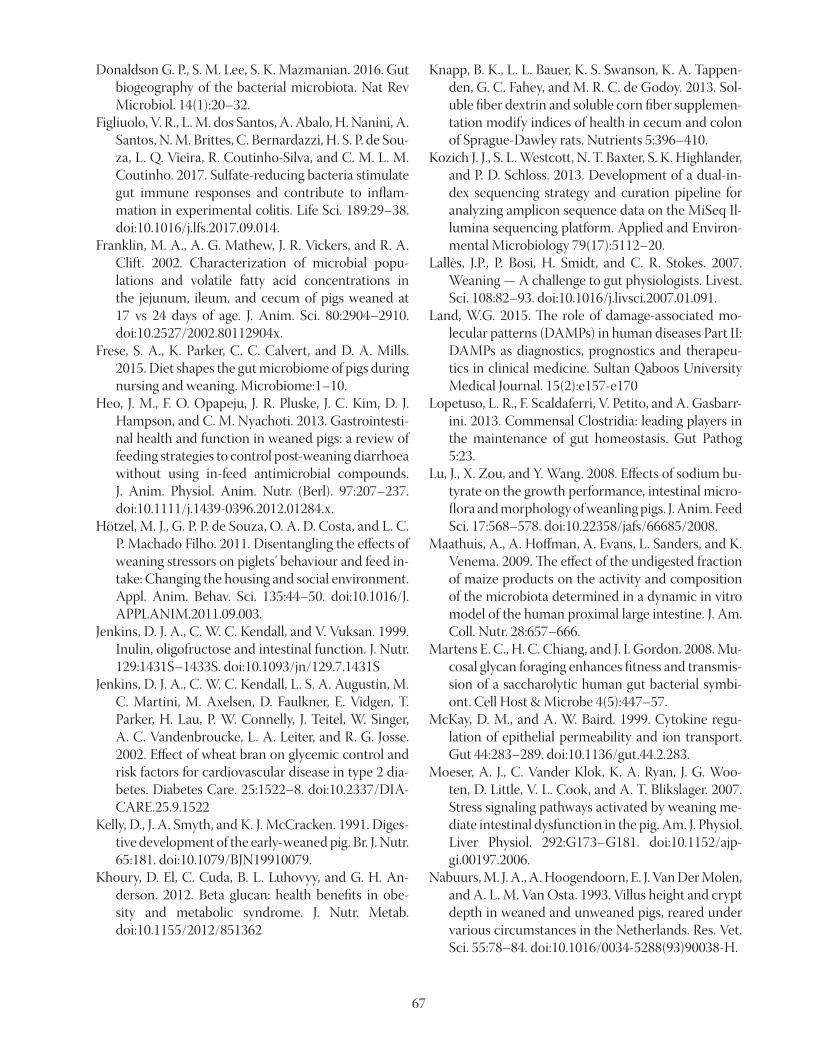
67
Donaldson G. P., S. M. Lee, S. K. Mazmanian. 2016. Gut biogeography of the bacterial microbiota. Nat Rev Microbiol. 14(1):20–32.
Figliuolo, V. R., L. M. dos Santos, A. Abalo, H. Nanini, A. Santos, N. M. Brittes, C. Bernardazzi, H. S. P. de Sou-za, L. Q. Vieira, R. Coutinho-Silva, and C. M. L. M. Coutinho. 2017. Sulfate-reducing bacteria stimulate gut immune responses and contribute to inflam-mation in experimental colitis. Life Sci. 189:29–38. doi:10.1016/j.lfs.2017.09.014.
Franklin, M. A., A. G. Mathew, J. R. Vickers, and R. A. Clift. 2002. Characterization of microbial popu-lations and volatile fatty acid concentrations in the jejunum, ileum, and cecum of pigs weaned at 17 vs 24 days of age. J. Anim. Sci. 80:2904–2910. doi:10.2527/2002.80112904x.
Frese, S. A., K. Parker, C. C. Calvert, and D. A. Mills. 2015. Diet shapes the gut microbiome of pigs during nursing and weaning. Microbiome:1–10.
Heo, J. M., F. O. Opapeju, J. R. Pluske, J. C. Kim, D. J. Hampson, and C. M. Nyachoti. 2013. Gastrointesti-nal health and function in weaned pigs: a review of feeding strategies to control post-weaning diarrhoea without using in-feed antimicrobial compounds. J. Anim. Physiol. Anim. Nutr. (Berl). 97:207–237. doi:10.1111/j.1439-0396.2012.01284.x.
Hötzel, M. J., G. P. P. de Souza, O. A. D. Costa, and L. C. P. Machado Filho. 2011. Disentangling the effects of weaning stressors on piglets’ behaviour and feed in-take: Changing the housing and social environment. Appl. Anim. Behav. Sci. 135:44–50. doi:10.1016/J.APPLANIM.2011.09.003.
Jenkins, D. J. A., C. W. C. Kendall, and V. Vuksan. 1999. Inulin, oligofructose and intestinal function. J. Nutr. 129:1431S–1433S. doi:10.1093/jn/129.7.1431S
Jenkins, D. J. A., C. W. C. Kendall, L. S. A. Augustin, M. C. Martini, M. Axelsen, D. Faulkner, E. Vidgen, T. Parker, H. Lau, P. W. Connelly, J. Teitel, W. Singer, A. C. Vandenbroucke, L. A. Leiter, and R. G. Josse. 2002. Effect of wheat bran on glycemic control and risk factors for cardiovascular disease in type 2 dia-betes. Diabetes Care. 25:1522–8. doi:10.2337/DIA-CARE.25.9.1522
Kelly, D., J. A. Smyth, and K. J. McCracken. 1991. Diges-tive development of the early-weaned pig. Br. J. Nutr. 65:181. doi:10.1079/BJN19910079.
Khoury, D. El, C. Cuda, B. L. Luhovyy, and G. H. An-derson. 2012. Beta glucan: health benefits in obe-sity and metabolic syndrome. J. Nutr. Metab. doi:10.1155/2012/851362
Knapp, B. K., L. L. Bauer, K. S. Swanson, K. A. Tappen-den, G. C. Fahey, and M. R. C. de Godoy. 2013. Sol-uble fiber dextrin and soluble corn fiber supplemen-tation modify indices of health in cecum and colon of Sprague-Dawley rats. Nutrients 5:396–410.
Kozich J. J., S. L. Westcott, N. T. Baxter, S. K. Highlander, and P. D. Schloss. 2013. Development of a dual-in-dex sequencing strategy and curation pipeline for analyzing amplicon sequence data on the MiSeq Il-lumina sequencing platform. Applied and Environ-mental Microbiology 79(17):5112–20.
Lallès, J.P., P. Bosi, H. Smidt, and C. R. Stokes. 2007. Weaning — A challenge to gut physiologists. Livest. Sci. 108:82–93. doi:10.1016/j.livsci.2007.01.091.
Land, W.G. 2015. The role of damage-associated mo-lecular patterns (DAMPs) in human diseases Part II: DAMPs as diagnostics, prognostics and therapeu-tics in clinical medicine. Sultan Qaboos University Medical Journal. 15(2):e157-e170
Lopetuso, L. R., F. Scaldaferri, V. Petito, and A. Gasbarr-ini. 2013. Commensal Clostridia: leading players in the maintenance of gut homeostasis. Gut Pathog 5:23.
Lu, J., X. Zou, and Y. Wang. 2008. Effects of sodium bu-tyrate on the growth performance, intestinal micro-flora and morphology of weanling pigs. J. Anim. Feed Sci. 17:568–578. doi:10.22358/jafs/66685/2008.
Maathuis, A., A. Hoffman, A. Evans, L. Sanders, and K. Venema. 2009. The effect of the undigested fraction of maize products on the activity and composition of the microbiota determined in a dynamic in vitro model of the human proximal large intestine. J. Am. Coll. Nutr. 28:657–666.
Martens E. C., H. C. Chiang, and J. I. Gordon. 2008. Mu-cosal glycan foraging enhances fitness and transmis-sion of a saccharolytic human gut bacterial symbi-ont. Cell Host & Microbe 4(5):447–57.
McKay, D. M., and A. W. Baird. 1999. Cytokine regu-lation of epithelial permeability and ion transport. Gut 44:283–289. doi:10.1136/gut.44.2.283.
Moeser, A. J., C. Vander Klok, K. A. Ryan, J. G. Woo-ten, D. Little, V. L. Cook, and A. T. Blikslager. 2007. Stress signaling pathways activated by weaning me-diate intestinal dysfunction in the pig. Am. J. Physiol. Liver Physiol. 292:G173–G181. doi:10.1152/ajp-gi.00197.2006.
Nabuurs, M. J. A., A. Hoogendoorn, E. J. Van Der Molen, and A. L. M. Van Osta. 1993. Villus height and crypt depth in weaned and unweaned pigs, reared under various circumstances in the Netherlands. Res. Vet. Sci. 55:78–84. doi:10.1016/0034-5288(93)90038-H.

68
Oswald, I. P. 2006. Role of intestinal epithelial cells in the innate immune defense of the pig intestine. Vet. Res. 37:359–368. doi:10.1051/vetres:2006006.
Pédron, T., C. Mulet, C. Dauga, L. Frangeul, C. Cher-vaux, G. Grompone, and P. J. Sansonetti. 2012. A crypt-specific core microbiota resides in the mouse colon. mBio 3.
Perry, J. R., and W. Ying. 2016. A review of physiological effects of soluble and insoluble dietary fibers. J. Nutr. Food Sci. 6. doi:10.4172/2155-9600.1000476
Pluske, J. R., I. H. Williams, and F. X. Aherne. 1996. Maintenance of villous height and crypt depth in piglets by providing continuous nutrition af-ter weaning. Anim. Sci. 62:131–144. doi:10.1017/S1357729800014417.
Pluske, J. R., D. J. Hampson, and I. H. Williams. 1997. Factors influencing the structure and function of the small intestine in the weaned pig: a review. Livest. Prod. Sci. 51:215–236. doi:10.1016/S0301-6226(97)00057-2.
Pratt, V. C., K. A. Tappenden, M. I. McBurney, and C. J. Field. 1996. Short-chain fatty acid-supple-mented total parenteral nutrition improves nonspecific immunity after intestinal resec-tion in rats. J. Parenter. Enter. Nutr. 20:264–271. doi:10.1177/0148607196020004264
Quast C., E. Pruesse, P. Yilmaz, J. Gerken, T. Schweer, P. Yarza, et al. 2012. The SILVA ribosomal RNA gene database project: improved data process-ing and web-based tools. Nucleic Acids Research 18;41(D1):D590–6.
R Core Team. R: A language and environment for statis-tical computing [Internet]. Vienna, Austria: R Foun-dation for Statistical Computing; 2013.
Rossi, F., E. Cox, B. Goddeeris, D. Portetelle, J. Wavreille, and A. Thewis. 2001. Inulin incorporation in the weaned pig diet: intestinal coliform interaction and effect on specific systemic immunity. In: J. E. Lind-berg and B. Ogle, editors. Digestive Physiology of Pigs : Proceedings of the 8th Symposium. CABI Pub, New York. p. 299–301
Turner, J. R. 2006. Molecular basis of epithelial bar-rier regulation. Am. J. Pathol. 169:1901–1909. doi:10.2353/ajpath.2006.060681.
Ulger Toprak, N., T. Bozan, Y. Birkan, S. Isbir, and G. Soyletir. 2015. Butyricimonas virosa: the first clini-cal case of bacteraemia. New Microbes New Infect. 4:7–8. doi:10.1016/J.NMNI.2014.12.004.
Van Boeckel, T. P., C. Brower, M. Gilbert, B. T. Grenfell, S. A. Levin, T. P. Robinson, A. Teillant, and R. Laxmi-narayan. 2015. Global trends in antimicrobial use in food animals. Proc. Natl. Acad. Sci. 112:5649–5654. doi:10.1073/pnas.1503141112.
Van den Abbeele P., C. Belzer, M. Goossens, M. Kleere-bezem, W. M. De Vos, O. Thas, et al. 2013. Butyrate-producing Clostridium cluster XIVa species specifi-cally colonize mucins in an in vitro gut model. The ISME Journal 7(5):949–61.
Wang, X., and G. R. Gibson. 1993. Effects of the in vitro fermentation of oligofructose and inulin by bacteria growing in the human large intestine. J. Appl. Bac-teriol. 75:373–380. doi:10.1111/j.1365-2672.1993.tb02790.x.
Whisner, C. M., B. R. Martin, C. H. Nakatsu, J. A. Story, C. J. MacDonald-Clarke, L. D. McCabe, G. P. McCabe, and C. M. Weaver. 2016. Soluble corn fiber increases calcium absorption associated with shifts in the gut microbiome: A randomized dose-response trial in free-living pubertal females. J. Nutr. 146:1298–1306.
Wijtten, P. J. A., J. Van Der Meulen, and M. W. A. Verste-gen. 2011. Intestinal barrier function and absorption in pigs after weaning: A review. Br. J. Nutr. 105:967–981. doi:10.1017/S0007114510005660.
Zhong, Y., M. Nyman, and F. Fåk. 2015. Modulation of gut microbiota in rats fed high-fat diets by processing whole-grain barley to barley malt. Mol. Nutr. Food Res. 59:2066–2076. doi:10.1002/mnfr.201500187.

69
Introduction Visceral organs (VO) are crucial to sustaining life in animals. They play a critical role in the metabolism of nutrients that are needed by the animal for growth and development, although overall they have little contribu-tion to the total value of the pig carcass at market. The examnation of relative weights of organs, particularly in laboratory animals, is widely used in nutritional, bio-logical, and medical studies (Doornenbal et al., 1981) as a crude estimation of biological priority. Visceral organs are usually expressed as something other than absolute weight of the organ, as the absolute weight of the organ alone does not give much information unless it is relat-ed to the body weight (BW) (Doornenbal et al., 1981). An understanding of VO development can help to better evaluate the physiological state of the animal as well as nutrient requirements during that state. For ex-ample, selecting pigs for leanness so that there is mini-mal fat on the hog at market has become a common practice (Theil et al., 2012; Cliplef et al., 1993). However,
pigs selected for less back-fat have also been shown to have larger VO, resulting in an overall lower dressing percentage of the carcass (Pond et al., 1988; Cliplef et al., 1993). VO are energy demanding and they are re-sponsible for a large proportion of body energy expen-diture (Anugwa et al., 1989; Nyachoti et al., 2000) and oxygen consumption (Nyachoti et al., 2000) differs de-pending on the size of the organs. An increase in the oxygen consumption as a result of larger visceral organs reduces growth efficiency in other tissues (Nyachoti et al., 2000; Wiseman, 2006). Pigs that have a larger organ size relative to body weight may have a higher mainte-nance requirement (Tess et al., 1986). There have been reports that there is a difference in the weight of the organs among breeds (Cliplef et al., 1993), type of diet consumed (Anugwa et al., 1989), and amount of dieit consumed (de Lange et al., 2003). There have been sev-eral reports that diets that are high in fiber result in larg-er VO (Jørgensen et al., 1985; Pond et al., 1988; Anugwa et al., 1989; de Lange et al., 2003) In addition, maturity (de Lange et al., 2003) sex, environment, and interaction
Assessment of Teleological Changes in Visceral Organs from Birth
to 150 kg Body WeightSarah Elefson, Ning Lu, and Merlin Lindemann
Department of Animal and Food Sciences University of Kentucky, Lexington 40546
Phone: 859-257-7524 [email protected]
SummaryVisceral organs (VO) are necessary for life in animals as they are responsible for the majority of functions in the body including digestion of feed and distribution, metabolism, and excretion nutri-ents in/from the body. Over the course of two studies, visceral organs of pigs (total n= 96) were evalu-ated from birth through 150 kilograms body weight (BW). As BW increased VO absolute weight and gastrointestinal tract (GIT) length increased (linear and/or quadratic, P < 0.05). As the pig surpasses 25 kg, relative weight of VO decrease as BW increases (linear and/or quadratic, P < 0.05). Length of the GIT continuously increased in a linear fashion (P < 0.05) from the time that the pig is born through 150 kg. The relative length of the small intestine to the total length of the intestine tends to decrease linearly (P < 0.05) as the pig approaches 150 kg, although it is worth noting that from birth the relative length of the small intestine is close to 80% of the total intestinal length. Intestinal volume continued to increase (linear, P < 0.05) as BW increased. Relative volume to the total volume of the GIT of the large intestine increased (linear, P < 0.05) while the relative volume of the small intestine decreased (linear and/or quadratic, P < 0.05). In all, results show that the measurements of VO are dependent on the BW of the pig. However, while BW plays a major role in the measure-ments to the VO, there are other factors that need to be taken into consideration that effect VO size including genetics, environment, and diet.

70
between the previously listed factors also influence de-velopment of the pig (Wagner et al., 1999). Therefore, the objective of this study was to assess longitudinal changes that occur in VO growth by obtaining frequent measurement of VO development in pigs from late ges-tation through 150 kg BW.
Experimental ProceduresAnimals and Experimental Design The studies were carried out at the University of Ken-tucky and were conducted under protocols approved by the Institutional Animal Care and Use Committee of the University of Kentucky. Two studies were conduct-ed in order to determine the VO measurements of pigs across a range of body weight (BW). Firstly (Study 1), a pool of crossbred pigs (n=116) had ad libitum access to water and a common diet that met or exceeded all NRC (2012) requirements for body weight (BW) over five different growth phases (25-50, 50-75, 75-100, 100-125, and 125-150 kg) for the entire study. All diets contained 20% DDGS. When the overall average BW of the pigs was close to the weight of interest (25, 50, 75, 100, 125, and 150 kg), 8 pigs (4 gilts and 4 barrows) with BW clos-est to 25, 50, 75, 100, 125, and 150 kg were slaughtered. A second study (Study 2) was then conducted to obtain similar information on pigs before they reached 25 kg BW. In the second study, 48 crossbred pigs were selected for sacrifice (n=6, 3 gilts and 3 males) over 6 time points from birth (pre-suckle) through 42 d post-weaning (~25 kg BW). After weaning, pigs had ad libi-tum access to a common diet that met or exceeded all NRC (2012) requirements. Over the 6 time points of the study, pigs were randomly selected for slaughter. The times in which pigs were slaughtered included: birth, days 7, 14, and 21 (weaning), and days 7, 14, 28, and 42 post-weaning.
Data and Sample Collection Study 1. On the days of slaughter, pigs were weighed at the farm, transported to the University of Kentucky Meat Science Laboratory, and then slaughter by stun-ning by electric shock followed by exsanguination. The liver, kidneys, heart, pancreas, and spleen were re-moved from the body and weighed. The stomach, small intestine, cecum, and large intestine were rinsed of con-tents with tap water and the empty organ weight was re-corded. The lengths of the small and large intestine were measured and recorded. In addition, a segment of the small intestine at 0, 25, 50, 75, and 100% of total small intestinal length, and a segment of the large intestine at 0, ~67, and 100% of total large intestinal length were removed and measured for circumference. Assuming the diameter of the intestinal lumen changes evenly throughout the gastrointestinal tract (GIT) sections, the volume of the small and large intestine were calculated with the equation for a tapered cylinder. The volumes of stomach and cecum were measured by the maximal volume of water that ould be filled in those organs. Study 2. Body weight was recorded weekly as well as at the time of slaughter. All VO weights were recorded, the volume of the stomach and cecum were measured by filling the empty organ with phosphate buffered sa-line until it was subjectively determined as “full”. The intestines were measured for length and sections of the small and large intestine were taken (small intestine: 0%, 25%, 50%, 75%, and 100%; large intestine: 0%, 50%, and 100%) and measured for circumference. The recorded dimensions of the intestine, length and circumference, were used to determine the overall volume of the GIT by volume of a tapered cylinder. Again, this was done with the assumption that the intestinal lumen changes evenly throughout the GIT sections.
Table 1. Absolute (g) and relative (%) weight of visceral organs in pigs from 30-150 kg1
ItemSlaughter weight, kg
30 50 75 100 125 150Liver2, 3, 4 624 (2.07) 1025 (1.95) 1455 (1.90) 1633 (1.64) 1776 (1.41) 2018 (1.37)Heart2, 4, 5 151 (0.50) 226 (0.43) 292 (0.38) 351 (0.35) 421 (0.34) 483 (0.33)Pancreas2, 4 53 (0.18) 91 (0.17) 101 (0.13) 124 (0.13) 152 (0.12) 157 (0.11)Spleen2, 3, 4, 5 67 (0.22) 96 (0.18) 103 (0.13) 110 (0.11) 151 (0.12) 184 (0.13)Kidneys2, 3, 4 155 (0.51) 266 (0.51) 329 (0.43) 341 (0.34) 389 (0.31) 423 (0.29)Stomach2, 3, 4 186 (0.61) 318 (0.61) 383 (0.50) 429 (0.43) 534 (0.42) 582 (0.40)Small intestine2, 4, 5 915 (3.03) 1229 (2.33) 1319 (1.72) 1247 (1.25) 1490 (1.19) 1555 (1.06)Cecum2, 4 66 (0.22) 116 (0.22) 114 (0.15) 164 (0.17) 206 (0.16) 202 (0.14)Large intestine2, 3, 4, 5
346 (1.14) 650 (1.23) 993 (1.30) 1171 (1.18) 1368 (1.09) 1589 (1.08)
1 Values in the parentheses represent the relative weight to bodyweight, n=8.2 Linear response to slaughter weight (P < 0.05) for absolute weight. 3 Quadratic response to slaughter weight (P < 0.05) for absolute weight. 4 Linear response to slaughter weight (P < 0.05) for relative weight. 5 Quadratic response to slaughter weight (P < 0.05) for relative weight.

71
Table 2. Absolute (m) and relative (%) length of gastrointestinal tract in pigs from 30-150 kg1
ItemSlaughter weight, kg
30 50 75 100 125 150Small intestine2, 3, 4 12.51
(81.4)14.92 (80.4)
17.24 (80.0)
17.87 (79.6)
19.22 (80.0)
19.93 (79.9)
Large intestine2, 3, 4 2.85 (18.6)
3.63 (19.6)
4.31 (20.0)
4.58 (20.4)
4.79 (20.0)
5.00 (20.1)
Total2, 3 15.36 18.54 21.54 22.45 24.01 24.931 Values in the parentheses represent the relative length to total length, n=8.2 Linear response to slaughter weight (P < 0.05) for absolute weight. 3 Quadratic response to slaughter weight (P < 0.05) for absolute weight. 4 Linear response to slaughter weight (P < 0.05) for relative weight. 5 Quadratic response to slaughter weight (P < 0.05) for relative weight.
Table 3. Absolute (mL) and relative (%) organ volume of the gastrointestinal tract in pigs from 30 to 150 kg1
ItemSlaughter weight, kg
30 50 75 100 125 150Absolute (mL) and relative (%) organ volumeStomach2 612 (15) 831 (13) 1864 (17) 1949 (14) 2854 (19) 2921 (16)Small intestine2, 3, 4 1385 (36) 2203 (33) 3339 (30) 3877 (29) 3892 (26) 4615 (25)Cecum2, 3, 4, 5 606 (16) 1427 (21) 1842 (17) 2069 (16) 2583 (17) 2520 (14)Large intestine2, 4 1290 (33) 2184 (33) 3927 (36) 5434 (41) 5723 (38) 8037 (45)Total2 3893 6644 10973 13329 15053 180921 Values in the parentheses represent the relative volume to total volume, n=8.2 Linear response to slaughter weight (P < 0.05) for absolute volume. 3 Quadratic response to slaughter weight (P < 0.05) for absolute volume. 4 Linear response to slaughter weight (P < 0.05) for relative volume. 5 Quadratic response to slaughter weight (P < 0.05) for relative volume.
Statistical Analysis All data were subjected to PROC GLM procedure in SAS (SAS Inst., Inc., Cary, NC), results were reported as least square means. A linear statistical model was used to analyze data and in-cluded terms for slaughter weight, sex, and slaughter weight X sex interaction for Study 1 and age, sex, and age X sex interaction for Study 2. VO growth was evaluated with orthogonal polynomial contrasts in PROC GLM to determine linear and quadratic effects of slaughter weight/age on response measures. To determine the volume of the intestines, the cir-cumference and the length were used in a tapered cyl-inder formula:
V = ∏ (r + r21
221 2r + r ) h1
3
where V = volume, r1 = the first end of the cylinder, r2 = the second end of the cylinder, and h = height between each recorded circumference, and then all parts were added together for overall volume. Each new measure-ment location was determined to be the end of the cyl-inder. Effects were considered significant at P < 0.05, whereas a trend was considered as 0.10 < P < 0.05.
Results Overall measurements of VO increased (Table 1) through the course of Study 1. All absolute weights of VO increased linearly (P < 0.05) as BW increased throughout the study. The liver, spleen, kidneys, stom-ach and large intestine absolute weight also had a qua-dratic response (P < 0.05) as BW increased. As BW increased, absolute weight of organs increased but the relative weight decreased; the decrease in the relative weight with increasing BW in Study 1 shows that the organs growth slows as the pig surpasses 75 kg. Abso-
lute weight and absolute length of the GIT increased, but the relative weight decreased as BW increased (Ta-ble 2, linear and/or quadratic, P < 0.05). Length of small and large intestine relative to the total length decreased and increased, respectively, as BW increased (linear, P < 0.05). The absolute volume of GIT segments increased with increasing BW (linear and/or quadratic, P < 0.05). The relative volume for the cecum and small intestine to total volume decreased (Table 3, linear and/or quadrat-ic, P < 0.05), increased for large intestine relative volume (linear, P < 0.05), but was not altered for relative volume of the stomach with increasing BW. In Study 2, as the pig aged, BW increased linearly (Table 4, P < 0.05). All absolute weights of VO increased in a linear and quadratic fashion (P < 0.05) as BW in-creased. Most relative weights of VO increased in a linear (P < 0.05) fashion as body weight increased and the relative weight of the heart, lung, spleen, and GIT also increased quadratically (P < 0.05). The length of the small and large intestine increased linearly (Table 5, P < 0.05) as BW of the pig increased over time. The relative length of the small and large intestine compared to the total length of the intestine appeared to remain approxi-mately static for the entirety of the study. The absolute volume of the GIT increased both linearly and quadrati-cally (Table 6, P < 0.05) while the relative volume of the
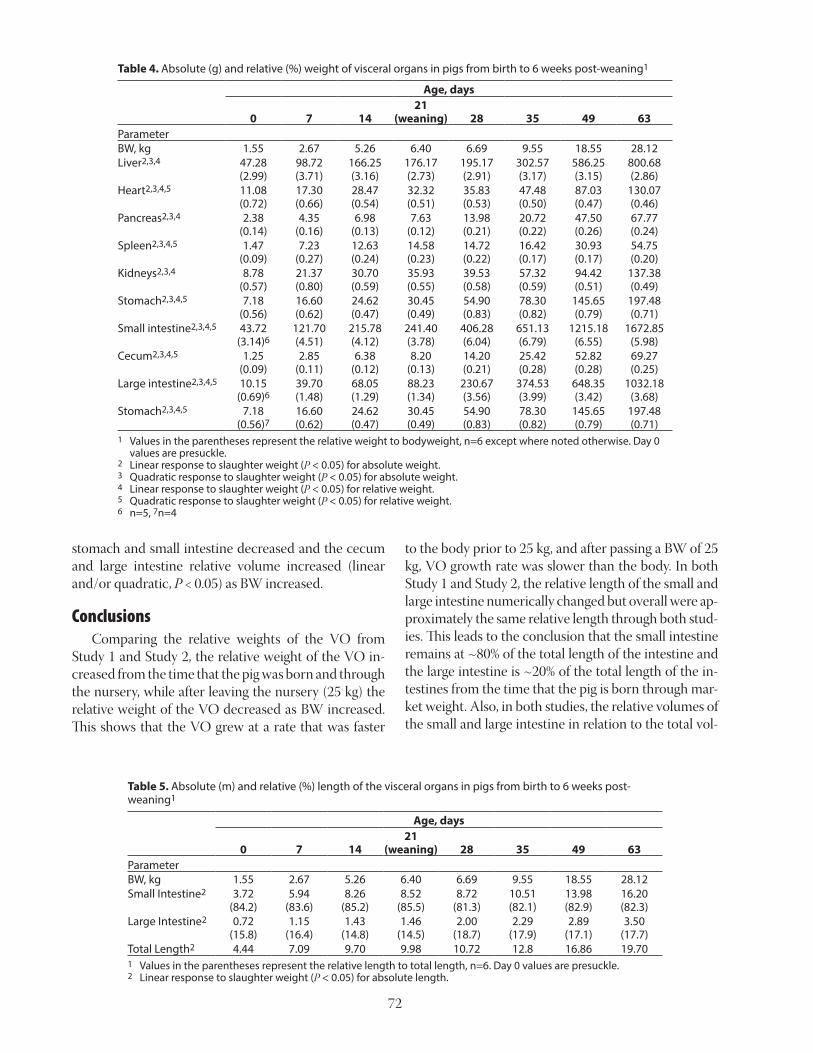
72
Table 4. Absolute (g) and relative (%) weight of visceral organs in pigs from birth to 6 weeks post-weaning1
Age, days
0 7 1421
(weaning) 28 35 49 63ParameterBW, kg 1.55 2.67 5.26 6.40 6.69 9.55 18.55 28.12Liver2,3,4 47.28
(2.99)98.72(3.71)
166.25(3.16)
176.17(2.73)
195.17(2.91)
302.57(3.17)
586.25(3.15)
800.68(2.86)
Heart2,3,4,5 11.08(0.72)
17.30(0.66)
28.47(0.54)
32.32(0.51)
35.83(0.53)
47.48(0.50)
87.03(0.47)
130.07(0.46)
Pancreas2,3,4 2.38(0.14)
4.35(0.16)
6.98(0.13)
7.63(0.12)
13.98(0.21)
20.72(0.22)
47.50(0.26)
67.77(0.24)
Spleen2,3,4,5 1.47(0.09)
7.23(0.27)
12.63(0.24)
14.58(0.23)
14.72(0.22)
16.42(0.17)
30.93(0.17)
54.75(0.20)
Kidneys2,3,4 8.78(0.57)
21.37 (0.80)
30.70 (0.59)
35.93 (0.55)
39.53 (0.58)
57.32 (0.59)
94.42 (0.51)
137.38 (0.49)
Stomach2,3,4,5 7.18(0.56)
16.60(0.62)
24.62(0.47)
30.45(0.49)
54.90(0.83)
78.30(0.82)
145.65(0.79)
197.48(0.71)
Small intestine2,3,4,5 43.72(3.14)6
121.70(4.51)
215.78(4.12)
241.40(3.78)
406.28(6.04)
651.13(6.79)
1215.18(6.55)
1672.85(5.98)
Cecum2,3,4,5 1.25(0.09)
2.85(0.11)
6.38(0.12)
8.20(0.13)
14.20(0.21)
25.42(0.28)
52.82(0.28)
69.27(0.25)
Large intestine2,3,4,5 10.15(0.69)6
39.70(1.48)
68.05(1.29)
88.23(1.34)
230.67(3.56)
374.53(3.99)
648.35(3.42)
1032.18(3.68)
Stomach2,3,4,5 7.18(0.56)7
16.60(0.62)
24.62(0.47)
30.45(0.49)
54.90(0.83)
78.30(0.82)
145.65(0.79)
197.48(0.71)
1 Values in the parentheses represent the relative weight to bodyweight, n=6 except where noted otherwise. Day 0 values are presuckle.
2 Linear response to slaughter weight (P < 0.05) for absolute weight. 3 Quadratic response to slaughter weight (P < 0.05) for absolute weight. 4 Linear response to slaughter weight (P < 0.05) for relative weight. 5 Quadratic response to slaughter weight (P < 0.05) for relative weight.6 n=5, 7n=4
Table 5. Absolute (m) and relative (%) length of the visceral organs in pigs from birth to 6 weeks post-weaning1
Age, days
0 7 1421
(weaning) 28 35 49 63ParameterBW, kg 1.55 2.67 5.26 6.40 6.69 9.55 18.55 28.12Small Intestine2 3.72
(84.2)5.94
(83.6)8.26
(85.2)8.52
(85.5)8.72
(81.3)10.51(82.1)
13.98(82.9)
16.20(82.3)
Large Intestine2 0.72(15.8)
1.15(16.4)
1.43(14.8)
1.46(14.5)
2.00(18.7)
2.29(17.9)
2.89(17.1)
3.50(17.7)
Total Length2 4.44 7.09 9.70 9.98 10.72 12.8 16.86 19.701 Values in the parentheses represent the relative length to total length, n=6. Day 0 values are presuckle.2 Linear response to slaughter weight (P < 0.05) for absolute length.
stomach and small intestine decreased and the cecum and large intestine relative volume increased (linear and/or quadratic, P < 0.05) as BW increased.
Conclusions Comparing the relative weights of the VO from Study 1 and Study 2, the relative weight of the VO in-creased from the time that the pig was born and through the nursery, while after leaving the nursery (25 kg) the relative weight of the VO decreased as BW increased. This shows that the VO grew at a rate that was faster
to the body prior to 25 kg, and after passing a BW of 25 kg, VO growth rate was slower than the body. In both Study 1 and Study 2, the relative length of the small and large intestine numerically changed but overall were ap-proximately the same relative length through both stud-ies. This leads to the conclusion that the small intestine remains at ~80% of the total length of the intestine and the large intestine is ~20% of the total length of the in-testines from the time that the pig is born through mar-ket weight. Also, in both studies, the relative volumes of the small and large intestine in relation to the total vol-

73
Table 6. Absolute (mL) and relative (%) volume of visceral organs in pigs from birth to 6 weeks post-weaning1
Age, days
0 7 1421
(weaning) 28 356 49 63ParameterBW, kg 1.55 2.67 5.26 6.40 6.69 9.55 18.55 28.12Stomach2, 3, 4 11.28
(15)634.74(18)
39.33(10)
33.20(8)
91.08(13)
104.00(9)
228.75(7)
314.54(7)
Small Intestine2, 3, 4, 5 56.02(74)
126.83(62)
260.47(65)
278.09(67)
391.06(47)
619.39(53)
1663.45(53)
2477.08(50)
Cecum2, 3, 4 0.71(1)
6.63(3)
16.77(4)
20.82(5)
33.48(5)
56.21(5)
276.67(9)
252.47(5)
Large Intestine2, 3, 4, 5 9.48(10)
32.10(17)
87.43(21)
87.04(20)
273.02(36)
403.10(34)
1018.89(32)
1824.19(38)6
Total Volume2, 3 74.32 200.30 404.00 419.15 788.64 1182.71 3187.75 4796.571 Values in the parentheses represent the relative length to total length, n=6. Day 0 values are presuckle. 2 Linear response to slaughter weight (P < 0.05) for absolute volume. 3 Quadratic response to slaughter weight (P < 0.05) for absolute volume. 4 Linear response to slaughter weight (P < 0.05) for relative volume. 5 Quadratic response to slaughter weight (P < 0.05) for relative volume.6 n=5
ume of the GIT, decreased and increased, respectively, from the time the pig was born through 150 kg. Overall this leads to the obvious, and unsurprising, conclusion that the VO weight of the pig is dependent on the BW of pig. In Study 2, there is a continuous increase in volume of the GIT, while in Study 1 volume both increases and decreases depending on the GIT segment in question. These data may provide important information about GIT capacity, nutrient needs and nutrient handling capacity across the growth stages of market pigs and provide baseline data for assessment of the effects of a variety of factors including genetics, sex, maturity, diet, and environment on various VO measurements in the pig.
ReferencesAnugwa, F. O., V. H. Varel, J. S. Dickson, W. G. Pond, and
L. P. Krook. 1989. Effects of dietary fiber and protein concentration on growth, feed efficiency, visceral organ weights and large intestine microbial popula-tions of swine. J. of Nutr. 119:879-886.
Cliplef, R. L. M., and R. M. McKay. 1993. Visercal organ weights of swine selected for reduced bacfat thick-ness and increases growth rate. Can. J. Anim. Sci. 73:201-206.
de Lange, C. F. M., P. C. H. Morel, and S. H. Birkett. 2003. Modeling chemical and physical body composition of the growing pig. J. Anim. Sci. 81(E Suppl. 2):E159-E165.
Doornenbal, H. T., and A. K. W. Tong. 1981. Growth, development and chemical composition of the pig. IV. Relative growth of visceral organs. Growth 45:279-285.
Jørgensen, H., X. Zhao, and B. O. Eggum. 1996. The influence of dietary fibre and environmental tem-perature on the development of the gastrointesin-tal tract, digestibility, degree of fermentation in the hind-gut and energy metabolism in pigs. Br. J. Nutr. 75:365-378.
NRC. 2012. Nutrient requirements of swine. 11th ed. National Academy Press, Washington, DC.
Nyachoti, C., C. De Lange, B. McBride, S. Leeson, and H. Schulze. 2000. Dietary influence on organ size and in vitro oxygen consumption by visceral organs of growing pigs. Livest. Prod. Sci. 65(3):229-237.
Pond, W. G., H. G. Jung, and V. H. Varel. 1988. Effect of dietary fiber on young adult genetically lean, obese and contemporary pigs: Body weight, caracass mea-suremetns, organ weights, and digesta content. J. Anim. Sci. 66:699-706.
Tess, M., G. Dickerson, J. Nienaber, and C. Ferrell. 1986. Growth, development and body composition in three genetic stocks of swine. J. Anim. Sci. 62(4):968-979.
Theil, P. K., M. O. Nielsen, M. T. Sørensen, and C. Lau-ridsen. 2012. Lactation, milk and suckling. p 1-47. Danish Pig Research Centre Copenhagen, Denmark.
Wagner, J. R., A. P. Schinckel, W. Chen, J. C. Forrest, and B. L. Coe. 1999. Analysis of body compostion changes of swine during growth and development. J. Anim. Sci. 77:1442-1466.
Wiseman, TG. 2006. Genetic and gender influences on the changing phenotypic, total body and body com-ponent mineral compositions of pigs from 20 to 125 kilogram body weight. PhD Diss. The Ohio State University, Columbus, OH.

74
Midwest Swine Nutrition Conference
Number of Years of Sponsorship from 2000 to 2019No. of Years Company
19 AlltechUnited Animal Health (previously JBS United)
18 Elanco Animal Health Hubbard FeedsProvimi North America (previously Akey) Purina Animal Nutrition (previously Land
O’Lakes/Purina Mills)
17 PIC North America Zinpro Corporation
16 Ajinomoto Animal Nutrition (previously Ajinomoto Heartland)
APCDSM Nutritional ProductsEvonik-Degussa CorporationInternational Ingredient CorporationNovus International
15 BASF CorporationFats and Proteins Research Foundation
14 Agri-KingCooper FarmsDuPont (previously Danisco Animal Nutrition)National Pork BoardPrince Agri ProductsRalco NutritionZoetis (previously Pfizer Animal Health,
Alpharma)
13 ADM Animal NutritionChr. Hansen Animal Health and NutritionDistributors ProcessingDarling Ingredients (previously Griffin
Industries)Kemin
12 Kent Nutrition GroupPhibro Animal Health
10 The Maschhoffs
9 Lallemand Animal NutritionMicronutrientsPioneer Hi-Bred InternationalPOET Nutrition
No. of Years Company
8 AB Vista Feed IngredientsBayer CropScience (formerly Monsanto)Novartis Animal HealthStuart ProductsVita Plus Corporation
7 Diamond V MillsKalmbach FeedsNutriQuest
5 Cargill Animal NutritionHamlet ProteinKing Techina GroupNewsham Choice GeneticsNutriad
4 CJ AmericaPharmgate Animal Health
3 Pancosma
2 CHSCSA Animal NutritionMurphy-BrownMycogen SeedsPhileo Lesaffre Animal CarePfizer
1 ChemGenGladwin A. Read Co.Norel Animal NutritionNRCS Conservation Innovation GrantNutrafermaStandard Nutrition ServicesVi-Cor Animal Health and Nutrition
New sponsors this year:AzomiteBiomatrixBoehringer Ingelheim Animal HealthEW NutritionKWS Cereals USAVetagro


