19 th INTERNATIONAL CONGRESS ON ACOUSTICS MADRID, 2-7 SEPTEMBER 2007 1 VOCAL TRACT INTERACTIONS IN RECORDER PERFORMANCE PACS: 43.75.Ef Woodwinds Chen, Jer-Ming 1 ; Laurin, Dan 2 ; Smith, John 1 ; Wolfe, Joe 1 1 School of Physics, University of New South Wales, Sydney NSW 2052 Australia 2 Kungl. Musikhögskolan, Valhallavägen 105, 115 91 Stockholm, Sweden ABSTRACT In wind performance, skilled practitioners regularly report manipulating their vocal tract configuration to change the timbre, pitch and to produce other musical effects. With instruments such as the saxophone and didgeridoo, one might expect moderate coupling of the tract, bore and valve. In the recorder, one would not expect the tract to be strongly coupled due to the presence of the wind-way. However, some recorder players actively teach the involvement of the tract to elicit varied musical effects. To understand the acoustical contribution of the vocal tract in recorder performance, we measured the tract’s acoustic impedance spectrum during performance. We used a method developed earlier to study the vocal tract impedance spectra in saxophone and didgeridoo performance. This technique is fast, robust (noise levels in the mouth are high), and importantly, allows the measurement plane (inside the mouth) to be distant from the transducers. Placing the measurement head within an alto recorder mouthpiece enables us to “look into” the vocal tract and make acoustic impedance measurements as the musician plays. In this manner, vocal tract impedances of two tongue configurations associated with differing timbre were measured on a virtuoso player, revealing differences in the range below 2 kHz. BACKGROUND Studies on flutes and recorders have mainly been concerned with the behaviour of the instrument itself, investigating for example, the effect of flue channel geometries [1], the labium [2], its effects on jet formation [3], the effect of wall properties on output sound [4] as well as the linear acoustics of the instrument by considering the recorder bore acting in series with the flue- labium window [5, 6]. Only a few studies have examined the involvement of the player’s vocal tract with recorder-like systems: the effect of the upstream resonator volume on recorder playing frequency [7] and the influences of mouth resonances on flute playing frequency [8] for example. In both cases the influence of upstream resonance was limited and virtually negligible. At first hand, one would expect only weak acoustical coupling between the recorder bore and the vocal tract because of the presence of the windway – the narrow section leading from the player’s mouth to the open flue. The cross sectional area of the windway is much smaller than that of the vocal tract and the instrument bore, and the discontinuity in the characteristic impedances between each section is likely to lead to low transmission coefficients at most frequencies. An exception might be expected when the wavelength is twice the length of the windway, or integral fractions of this. However, some recorder players actively teach the involvement of the vocal tract to elicit musical effects and musicians are the experts concerning the subtle effects connected with their instruments. To investigate the effects of the recorder player's vocal tract, we measured the tract's acoustic impedance spectrum during performance. Sufficiently accurate measurements of this spectrum can, in principle, be used to solve for the area function of the tract: the cross sectional area as a function of position along it. For instance, the lowest frequency resonances give information about the configuration of the palate and tongue. The impedance spectrum gives less detailed information about the area-function than do NMR and X-ray radiography, but it is quieter than the former and safer than the latter. Further, it has the advantage that it gives acoustic
Transcript
19th INTERNATIONAL CONGRESS ON ACOUSTICS
MADRID, 2-7 SEPTEMBER 2007
1
VOCAL TRACT INTERACTIONS IN RECORDER PERFORMANCE PACS: 43.75.Ef Woodwinds Chen, Jer-Ming1; Laurin, Dan2; Smith, John1; Wolfe, Joe1 1School of Physics, University of New South Wales, Sydney NSW 2052 Australia 2Kungl. Musikhögskolan, Valhallavägen 105, 115 91 Stockholm, Sweden ABSTRACT In wind performance, skilled practitioners regularly report manipulating their vocal tract configuration to change the timbre, pitch and to produce other musical effects. With instruments such as the saxophone and didgeridoo, one might expect moderate coupling of the tract, bore and valve. In the recorder, one would not expect the tract to be strongly coupled due to the presence of the wind-way. However, some recorder players actively teach the involvement of the tract to elicit varied musical effects. To understand the acoustical contribution of the vocal tract in recorder performance, we measured the tract’s acoustic impedance spectrum during performance. We used a method developed earlier to study the vocal tract impedance spectra in saxophone and didgeridoo performance. This technique is fast, robust (noise levels in the mouth are high), and importantly, allows the measurement plane (inside the mouth) to be distant from the transducers. Placing the measurement head within an alto recorder mouthpiece enables us to “look into” the vocal tract and make acoustic impedance measurements as the musician plays. In this manner, vocal tract impedances of two tongue configurations associated with differing timbre were measured on a virtuoso player, revealing differences in the range below 2 kHz. BACKGROUND Studies on flutes and recorders have mainly been concerned with the behaviour of the instrument itself, investigating for example, the effect of flue channel geometries [1], the labium [2], its effects on jet formation [3], the effect of wall properties on output sound [4] as well as the linear acoustics of the instrument by considering the recorder bore acting in series with the flue-labium window [5, 6]. Only a few studies have examined the involvement of the player’s vocal tract with recorder-like systems: the effect of the upstream resonator volume on recorder playing frequency [7] and the influences of mouth resonances on flute playing frequency [8] for example. In both cases the influence of upstream resonance was limited and virtually negligible. At first hand, one would expect only weak acoustical coupling between the recorder bore and the vocal tract because of the presence of the windway – the narrow section leading from the player’s mouth to the open flue. The cross sectional area of the windway is much smaller than that of the vocal tract and the instrument bore, and the discontinuity in the characteristic impedances between each section is likely to lead to low transmission coefficients at most frequencies. An exception might be expected when the wavelength is twice the length of the windway, or integral fractions of this. However, some recorder players actively teach the involvement of the vocal tract to elicit musical effects and musicians are the experts concerning the subtle effects connected with their instruments. To investigate the effects of the recorder player's vocal tract, we measured the tract's acoustic impedance spectrum during performance. Sufficiently accurate measurements of this spectrum can, in principle, be used to solve for the area function of the tract: the cross sectional area as a function of position along it. For instance, the lowest frequency resonances give information about the configuration of the palate and tongue. The impedance spectrum gives less detailed information about the area-function than do NMR and X-ray radiography, but it is quieter than the former and safer than the latter. Further, it has the advantage that it gives acoustic
19th INTERNATIONAL CONGRESS ON ACOUSTICS – ICA2007MADRID
2
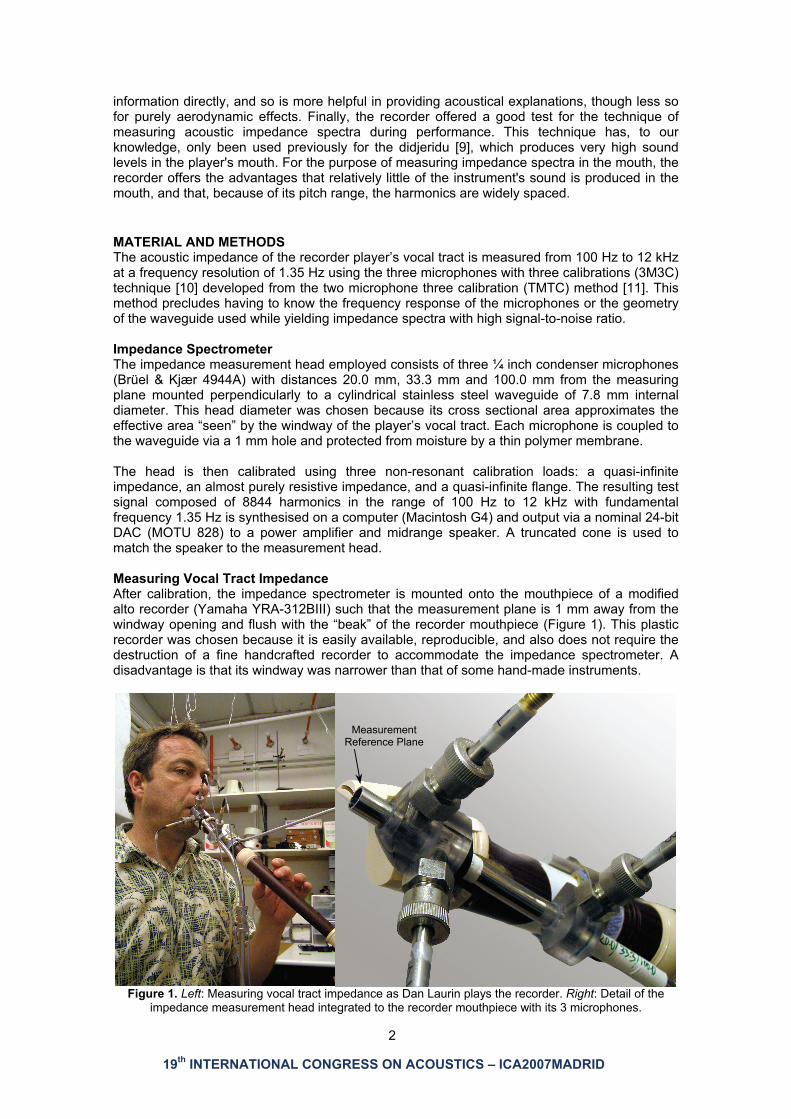
information directly, and so is more helpful in providing acoustical explanations, though less so for purely aerodynamic effects. Finally, the recorder offered a good test for the technique of measuring acoustic impedance spectra during performance. This technique has, to our knowledge, only been used previously for the didjeridu [9], which produces very high sound levels in the player's mouth. For the purpose of measuring impedance spectra in the mouth, the recorder offers the advantages that relatively little of the instrument's sound is produced in the mouth, and that, because of its pitch range, the harmonics are widely spaced. MATERIAL AND METHODS The acoustic impedance of the recorder player’s vocal tract is measured from 100 Hz to 12 kHz at a frequency resolution of 1.35 Hz using the three microphones with three calibrations (3M3C) technique [10] developed from the two microphone three calibration (TMTC) method [11]. This method precludes having to know the frequency response of the microphones or the geometry of the waveguide used while yielding impedance spectra with high signal-to-noise ratio. Impedance Spectrometer The impedance measurement head employed consists of three ¼ inch condenser microphones (Brüel & Kjær 4944A) with distances 20.0 mm, 33.3 mm and 100.0 mm from the measuring plane mounted perpendicularly to a cylindrical stainless steel waveguide of 7.8 mm internal diameter. This head diameter was chosen because its cross sectional area approximates the effective area “seen” by the windway of the player’s vocal tract. Each microphone is coupled to the waveguide via a 1 mm hole and protected from moisture by a thin polymer membrane. The head is then calibrated using three non-resonant calibration loads: a quasi-infinite impedance, an almost purely resistive impedance, and a quasi-infinite flange. The resulting test signal composed of 8844 harmonics in the range of 100 Hz to 12 kHz with fundamental frequency 1.35 Hz is synthesised on a computer (Macintosh G4) and output via a nominal 24-bit DAC (MOTU 828) to a power amplifier and midrange speaker. A truncated cone is used to match the speaker to the measurement head. Measuring Vocal Tract Impedance After calibration, the impedance spectrometer is mounted onto the mouthpiece of a modified alto recorder (Yamaha YRA-312BIII) such that the measurement plane is 1 mm away from the windway opening and flush with the “beak” of the recorder mouthpiece (Figure 1). This plastic recorder was chosen because it is easily available, reproducible, and also does not require the destruction of a fine handcrafted recorder to accommodate the impedance spectrometer. A disadvantage is that its windway was narrower than that of some hand-made instruments.
Figure 1. Left: Measuring vocal tract impedance as Dan Laurin plays the recorder. Right: Detail of the
impedance measurement head integrated to the recorder mouthpiece with its 3 microphones.
Measurement Reference Plane
19th INTERNATIONAL CONGRESS ON ACOUSTICS – ICA2007MADRID
3
With the impedance spectrometer built into the recorder mouthpiece, we can therefore measure the upstream vocal tract impedance as ‘seen’ by the recorder windway and bore. Playing a single note on the recorder using the tongue/palate configuration of interest, the corresponding vocal tract impedance is measured while that note is sustained for several seconds. To improve signal-to-noise ratio as the musician plays, the probe signal synthesized from the calibration is looped for eight complete cycles, the recorded signals averaged, and treated to yield the acoustic impedance spectra for that vocal tract configuration. Recorder Player’s Vocal Tract Measurements of vocal tract impedance were made on Dan Laurin, a Grammy award winning recorder virtuoso and professor of the recorder at Stockholm’s Royal University College of Music (KMH). Laurin teaches the use of different embouchures and throat configurations to obtain various musical effects [12], including the “high palate” and “low palate” configurations. “High palate” involves raising one’s soft palate and simultaneously depressing the back of the tongue (like a yawn) producing a recorder tone described as “thin” and “clear”, while “low palate” is associated with a constriction at the soft palate and the back of the tongue to produce a recorder tone described as “thick” and “muddy”. The alto recorder (integrated with the impedance measurement spectrometer, described above) is played chromatically for notes F4 to E6 using the “high palate” and “low palate” vocal tract configurations. Respective vocal tract impedances are then measured, along with corresponding recorder sound samples. These two palate configurations are repeated and sound samples recorded for the same notes on Laurin’s personal instrument, a handcrafted wooden recorder (A4 = 415 Hz) made by Frederick Morgan of Daylesford, Australia. Laurin observed that the change in timbre associated with the two throat configurations were more prominent on his instrument than on the Yamaha recorder provided for impedance measurement, probably due to the larger windway cross-section. RESULTS AND DISCUSSION Measurements for each note and vocal tract configuration yielded impedance spectra that were highly repeatable and had relatively low noise so no further treatment of impedance data such as signal averaging or smoothing was required. Vocal Tract Impedance For all cases measured, consistent and significant structural features are observed in the impedance spectra up to 2 kHz (associated mainly with glottal and tongue placement), while subtler structural variation can be seen at higher frequencies (even for the same nominal tract configuration). This relates to minute changes in the player’s vocal tract configuration (in the order of millimetres) and is not unexpected. The broad features of the impedance spectra are consistent when playing notes F4 through E6 chromatically for each tract configuration. It has been suggested that, for some instruments and conditions, the vocal tract resonances may be tuned to the playing frequency [13]; this is clearly not the case here. Comparing impedance spectra of the two vocal tract configurations, however, reveals marked differences in structure, indicating the tract resonances are different. Figure 2 shows impedance and sound spectra for two notes (D5 and A#5) each played in both the “high palate” and “low palate” configurations. The first vocal tract resonance is observed around 270±50 Hz for both “high palate” and “low palate”. This resonance is relatively weakly dependent on tongue position but it does depend on the degree of opening of the glottis. The similarity between the two may indicate the same glottal posture is used in both tract configurations. The magnitude (3-4 MPa.s.m-3) and frequency (270±50 Hz) of this first resonance is consistent with measurements for a nearly closed glottis [14]. This may be related to Mukai’s observation that expert players of some wind instruments usually play with their glottis nearly closed [15], enhancing vocal tract resonances by increasing reflection at the glottis. The first tract resonance is observed to occur at a frequency a little higher (about 50 Hz) for “low palate” than for “high palate”, while the resonance magnitude remains fairly comparable.
19th INTERNATIONAL CONGRESS ON ACOUSTICS – ICA2007MADRID
4
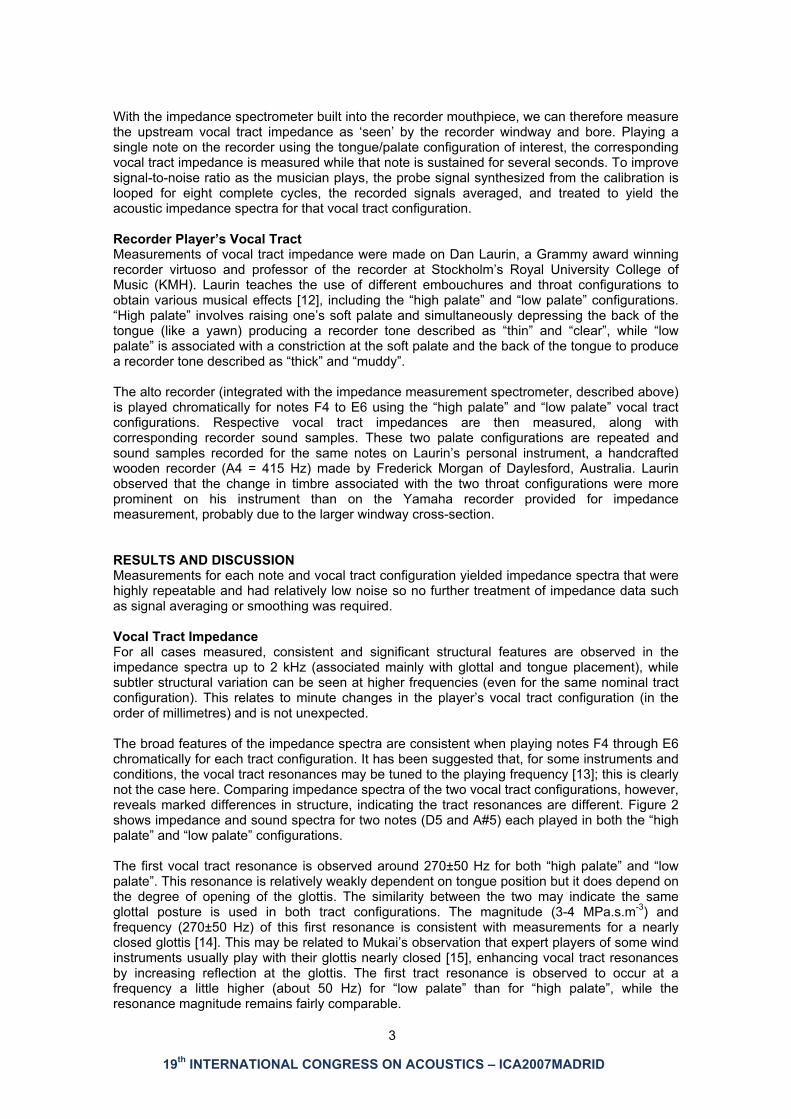
Figure 2. Vocal tract impedance spectra (top) measured for notes D5 (left) and A#5 (right) when played
with the “high palate” and “low palate” configurations. Corresponding sound spectra (bottom) are presented as broadband and harmonic components for the first 10 harmonics. A broadband boost in the 6
to 8 kHz noise floor is seen for “low palate”. The most dramatic difference in impedance spectra of the two vocal tract configurations occurs at the second vocal tract impedance maximum. A well-defined impedance peak in excess of 10 MPa.s.m-3 occurs between 500 Hz and 1.1 kHz in the “low palate” configuration. Such a vocal tract resonance frequency and magnitude for “low palate” is consistent with a constriction similar to that described by some wind players as the vowel “ee” [14]. In contrast, this region in the “high palate” configuration is associated with impedances smaller than 1 MPa.s.m-3 and with impedance minima approaching 0.1 MPa.s.m-3 (Figure 2), in a manner similar for an “aw” vowel [14]. Again, despite changes in acoustic impedance approaching the order of two magnitudes, there is no evidence of tuning a low resonance to match the fundamental or a higher harmonic of a note played. Output Sound Spectrum The harmonic structures of recorder notes played using the two throat configurations are somewhat similar, with pitch typically differing by not more than five cents. However a closer examination of sound spectra reveals subtle differences between the recorder notes played using the two vocal tract configurations. Comparing harmonic contents of notes F4-E6 (Figure 3, left), we see the presence of slightly stronger harmonics in the 1.7 to 3.7 kHz region for “low palate” than for “high palate”. The origin of this effect is obscure. In transverse flutes, the angle of the jet can lead to asymmetrical behaviour and thus lead to variation in harmonic ratio. In the recorder, however, it is difficult to see how the player might change this angle, and what it might have to do with broadband signal and the disposition of the palate. Of greater interest is the broadband component of the recorder sound because descriptors of the sound difference (‘muddy’ etc) suggest a broadband signal. Broadband components with the harmonics removed (noise floor) are compared in Figures 2, 3 and 4. We note that at 6 to 8 kHz, the “low palate” broadband signal is typically 3-6 dB stronger than that of the “high palate”, for sounds having similar harmonic level, which in turn suggests similar volume flow velocity.
19th INTERNATIONAL CONGRESS ON ACOUSTICS – ICA2007MADRID
5
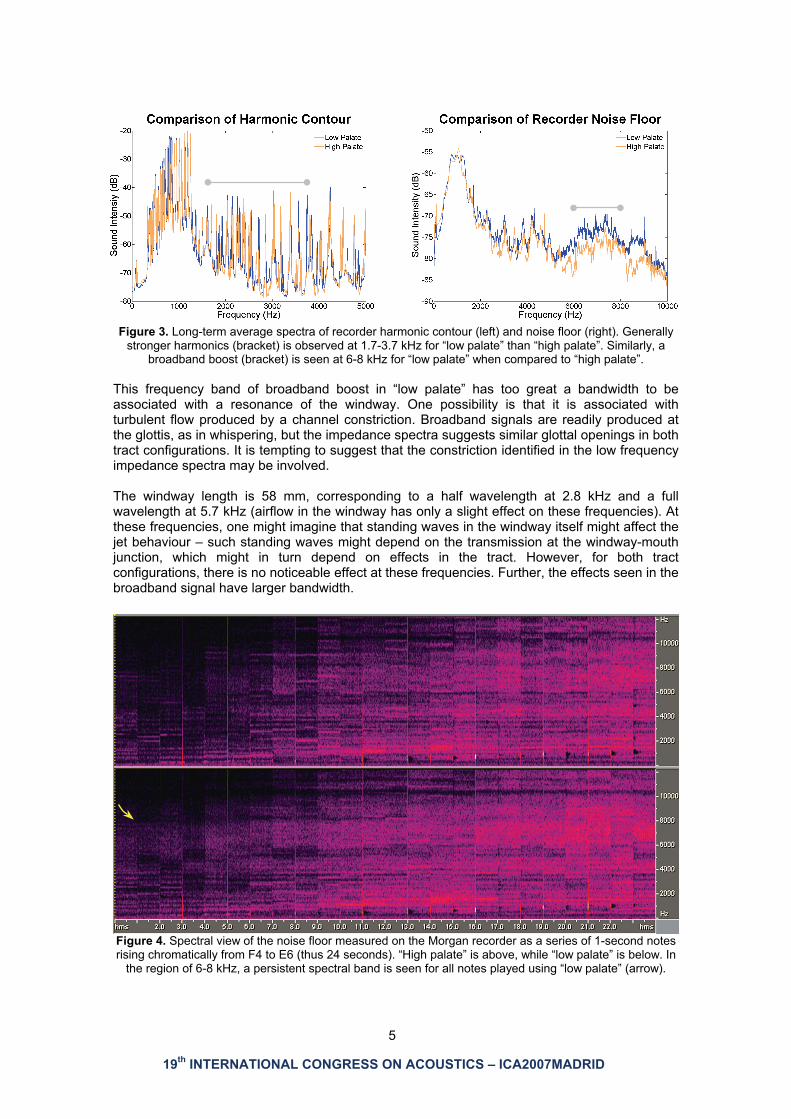
Figure 3. Long-term average spectra of recorder harmonic contour (left) and noise floor (right). Generally
stronger harmonics (bracket) is observed at 1.7-3.7 kHz for “low palate” than “high palate”. Similarly, a broadband boost (bracket) is seen at 6-8 kHz for “low palate” when compared to “high palate”.
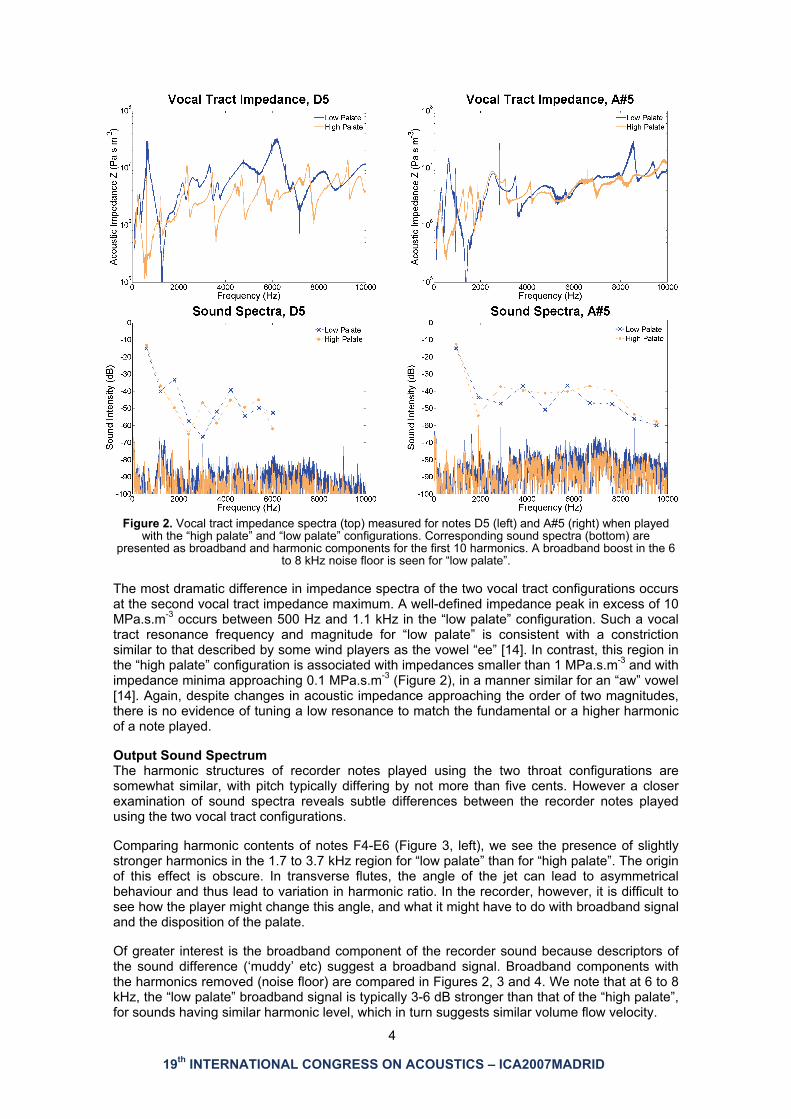
This frequency band of broadband boost in “low palate” has too great a bandwidth to be associated with a resonance of the windway. One possibility is that it is associated with turbulent flow produced by a channel constriction. Broadband signals are readily produced at the glottis, as in whispering, but the impedance spectra suggests similar glottal openings in both tract configurations. It is tempting to suggest that the constriction identified in the low frequency impedance spectra may be involved. The windway length is 58 mm, corresponding to a half wavelength at 2.8 kHz and a full wavelength at 5.7 kHz (airflow in the windway has only a slight effect on these frequencies). At these frequencies, one might imagine that standing waves in the windway itself might affect the jet behaviour – such standing waves might depend on the transmission at the windway-mouth junction, which might in turn depend on effects in the tract. However, for both tract configurations, there is no noticeable effect at these frequencies. Further, the effects seen in the broadband signal have larger bandwidth.
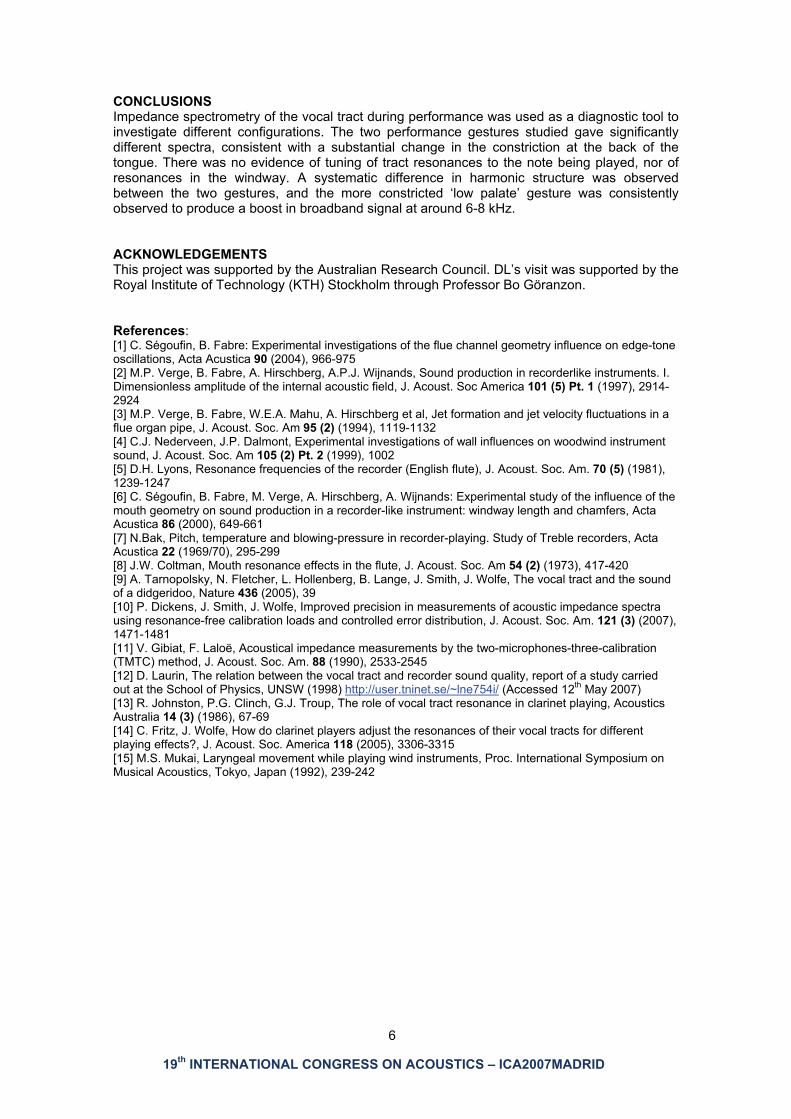
Figure 4. Spectral view of the noise floor measured on the Morgan recorder as a series of 1-second notes rising chromatically from F4 to E6 (thus 24 seconds). “High palate” is above, while “low palate” is below. In
the region of 6-8 kHz, a persistent spectral band is seen for all notes played using “low palate” (arrow).
19th INTERNATIONAL CONGRESS ON ACOUSTICS – ICA2007MADRID
6
CONCLUSIONS Impedance spectrometry of the vocal tract during performance was used as a diagnostic tool to investigate different configurations. The two performance gestures studied gave significantly different spectra, consistent with a substantial change in the constriction at the back of the tongue. There was no evidence of tuning of tract resonances to the note being played, nor of resonances in the windway. A systematic difference in harmonic structure was observed between the two gestures, and the more constricted ‘low palate’ gesture was consistently observed to produce a boost in broadband signal at around 6-8 kHz. ACKNOWLEDGEMENTS This project was supported by the Australian Research Council. DL’s visit was supported by the Royal Institute of Technology (KTH) Stockholm through Professor Bo Göranzon. References: [1] C. Ségoufin, B. Fabre: Experimental investigations of the flue channel geometry influence on edge-tone oscillations, Acta Acustica 90 (2004), 966-975 [2] M.P. Verge, B. Fabre, A. Hirschberg, A.P.J. Wijnands, Sound production in recorderlike instruments. I. Dimensionless amplitude of the internal acoustic field, J. Acoust. Soc America 101 (5) Pt. 1 (1997), 2914-2924 [3] M.P. Verge, B. Fabre, W.E.A. Mahu, A. Hirschberg et al, Jet formation and jet velocity fluctuations in a flue organ pipe, J. Acoust. Soc. Am 95 (2) (1994), 1119-1132 [4] C.J. Nederveen, J.P. Dalmont, Experimental investigations of wall influences on woodwind instrument sound, J. Acoust. Soc. Am 105 (2) Pt. 2 (1999), 1002 [5] D.H. Lyons, Resonance frequencies of the recorder (English flute), J. Acoust. Soc. Am. 70 (5) (1981), 1239-1247 [6] C. Ségoufin, B. Fabre, M. Verge, A. Hirschberg, A. Wijnands: Experimental study of the influence of the mouth geometry on sound production in a recorder-like instrument: windway length and chamfers, Acta Acustica 86 (2000), 649-661 [7] N.Bak, Pitch, temperature and blowing-pressure in recorder-playing. Study of Treble recorders, Acta Acustica 22 (1969/70), 295-299 [8] J.W. Coltman, Mouth resonance effects in the flute, J. Acoust. Soc. Am 54 (2) (1973), 417-420 [9] A. Tarnopolsky, N. Fletcher, L. Hollenberg, B. Lange, J. Smith, J. Wolfe, The vocal tract and the sound of a didgeridoo, Nature 436 (2005), 39 [10] P. Dickens, J. Smith, J. Wolfe, Improved precision in measurements of acoustic impedance spectra using resonance-free calibration loads and controlled error distribution, J. Acoust. Soc. Am. 121 (3) (2007), 1471-1481 [11] V. Gibiat, F. Laloë, Acoustical impedance measurements by the two-microphones-three-calibration (TMTC) method, J. Acoust. Soc. Am. 88 (1990), 2533-2545 [12] D. Laurin, The relation between the vocal tract and recorder sound quality, report of a study carried out at the School of Physics, UNSW (1998) http://user.tninet.se/~lne754i/ (Accessed 12th May 2007) [13] R. Johnston, P.G. Clinch, G.J. Troup, The role of vocal tract resonance in clarinet playing, Acoustics Australia 14 (3) (1986), 67-69 [14] C. Fritz, J. Wolfe, How do clarinet players adjust the resonances of their vocal tracts for different playing effects?, J. Acoust. Soc. America 118 (2005), 3306-3315 [15] M.S. Mukai, Laryngeal movement while playing wind instruments, Proc. International Symposium on Musical Acoustics, Tokyo, Japan (1992), 239-242