TIMBER HARVEST AND WooD PRODUCTS1\1ANUFACTUREIN ALASKA: 1996 UPDATE (DRAFT) Prepared By Alexandra Hill Teresa Hull Prepared for: USDA Forest Service Pacific N01ihwest Experiment Station Forestry Sciences Laboratory Anchorage, Alaska September 1997 INSTITUTE OF SOCIAL AND ECONOMIC RESEARCH UNIVERSITY OF ALASKA ANCHORAGE 3211 PROVIDENCE DRIVE ANCHORAGE, ALASKA 99508
Transcript
TIMBER HARVEST AND WooD
PRODUCTS1\1ANUFACTUREIN
ALASKA: 1996 UPDATE (DRAFT)
Prepared By Alexandra Hill
Teresa Hull
Prepared for:
USDA Forest Service Pacific N01ihwest Experiment Station
Forestry Sciences Laboratory Anchorage, Alaska
September 1997
INSTITUTE OF SOCIAL AND ECONOMIC RESEARCH
UNIVERSITY OF ALASKA ANCHORAGE
3211 PROVIDENCE DRIVE
ANCHORAGE, ALASKA 99508
INTRODUCTION
This report provides information about the timber and wood products industry gathered from a variety of sources. It includes data for the entire state and for three regions, and brings together previously available data on timber harvests and wood products exports, as well as new data derived from information ISER collected in surveys of loggers and wood processors. We hope the data will be useful for both public and private planning efforts, as well as informed policy debate over management and development of the forest products industry.
ALASKA'S FORESTS
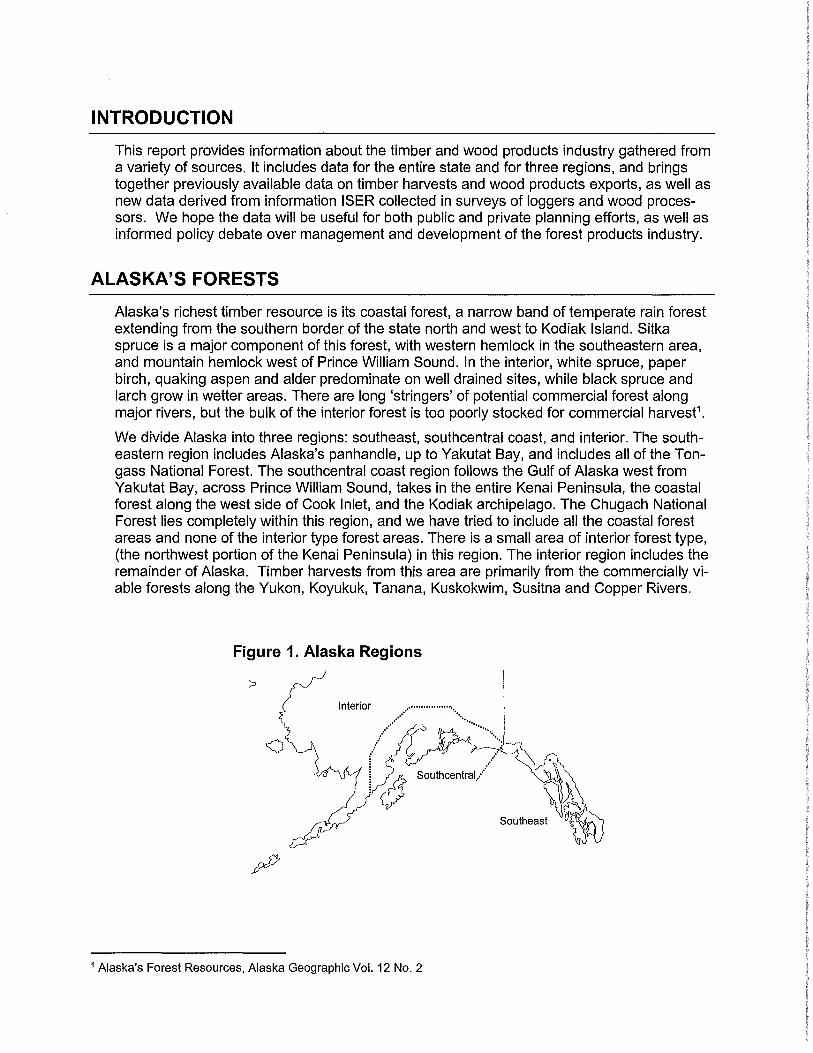
Alaska's richest timber resource is its coastal forest, a narrow band of temperate rain forest extending from the southern border of the state north and west to Kodiak Island. Sitka spruce is a major component of this forest, with western hemlock in the southeastern area, and mountain hemlock west of Prince William Sound. In the interior, white spruce, paper birch, quaking aspen and alder predominate on well drained sites, while black spruce and larch grow in wetter areas. There are long 'stringers' of potential commercial forest along major rivers, but the bulk of the interior forest is too poorly stocked for commercial harvest 1
•
We divide Alaska into three regions: southeast, southcentral coast, and interior. The southeastern region includes Alaska's panhandle, up to Yakutat Bay, and includes all of the Tongass National Forest. The southcentral coast region follows the Gulf of Alaska west from Yakutat Bay, across Prince William Sound, takes in the entire Kenai Peninsula, the coastal forest along the west side of Cook Inlet, and the Kodiak archipelago. The Chugach National Forest lies completely within this region, and we have tried to include all the coastal forest areas and none of the interior type forest areas. There is a small area of interior forest type, (the northwest portion of the Kenai Peninsula) in this region. The interior region includes the remainder of Alaska. Timber harvests from this area are primarily from the commercially viable forests along the Yukon, Koyukuk, Tanana, Kuskokwim, Susitna and Copper Rivers.
Alaska's forest products industry contributes to the state economy in several ways. The largest is employment: jobs in timber harvesting and processing provide income to Alaska residents. Where Alaska residents are corporation owners (such as small proprietorships and Native corporations), profits may also go to Alaska owners. And businesses operating in the state pay taxes here. Employment in Alaska's forest products industry has been declining since 1990 (see Figure 2). The industry has been centered in southeast Alaska, originally in the Tongass National Forest, and in recent years on Native-owned lands in southeast as well. Long-term contracts with the U. S. Forest Service (USFS) kept two pulp mills and several saw mills supplied since the 1950s. However, the economics of pulp and raw lumber production have not proved attractive in recent years. In the 1970s, the Tongass timber harvest accounted for 80-90 percent of Alaska's total harvest; this declined in the 1980s to about 40 percent, and by 1996 less than 20 percent of the estimated state total 2
• The Sitka pulp mill closed in 1994 and the Ketchikan pulp mill in March 1997. Installed mill capacity has declined to only about one-quarter the level of less than 10 years ago (Table 1). Tongass timber harvests will likely continue to decline, and a greater share of the total harvest will come from private ownership. Since private owners find it more profitable to export logs without local processing, numbers of jobs will continue to decline also.
Private timber harvests in Alaska are primarily Native-owned timber. These harvests rose sharply in the 1980s to become more than half of southeast's total harvest, and they comprise virtually the entire harvest in southcentral. Privately owned timber is not subject to primary processing requirements, and is usually exported as round logs. Figure 3 shows round log ex-
ports by region, which fairly accurately reflect trends in Native harvests. In southeast Alaska, Native harvests peaked in the late 1980s and then declined. Many village corporations in the region have largely exhausted their supplies of commercially viable timber. In southcentral, Native harvests increased through the early 1990s. Production could continue near current levels for some time, although major increases in the future are unlikely.
In addition to these major parts of the industry, there is some logging in the Chugach National Forest, in the Haines and Tanana Valley State Forests, on University of Alaska land, on land owned by local governments, and on private land other than Native corporation land. Altogether, these sources make up only about two percent of the state's harvest.
2 Percentages estimated from Warren, Production, Prices, Employment and Trade in Northwest Forest Industries, various quarters and from USFS Region 1 O preliminary 1996 numbers
3 Knapp, Gunnar; Native Timber Harvests in Southeast Alaska; p37
ISER FOREST PRODUCTS INDUSTRY DATA DRAFT 1996 UPDATE
2 9/30/97
(/l
.0 0
J
4,500
4,000 --
3,500
3,000
rcr 2,500 :; C: C: <(
~ 2,000 rcr '-(l)
> <(
1,500
1,000 --
500 ... _
1960
----1965
Employment Chart
Figure 2. Wood Products Employment, 1960 - 1995
Logging / ~
Pulp & Paper ~··~~ .. \
I
' I
1970 1975 1980 1985
Page 1
.. I
..... ... , .. ,
Sawmills
1990 1995
ct) 600,000 (])
~ ""O ~ 0 ~ 4-, 0 00
""O
~ 400,000 ;::$ 0
,...c:: ~
200,000
Figure 3. Softwood Log Exports by Region
Total
Southeast
- - - - ---.. .. .. .. Southcentral
-.. ---...... ,,, ,,. .. .. - - ..,fll
,,, ,,, ....... ---.. .. .. .. ....
1988 1989 1990 1991 1992 1993 1994 1995 1996
Alaska's forest products industry today was shaped by the two long-term contracts for wood to be harvested from the Tongass and supplied to southeast Alaska's pulp mills. As the supply of old growth forest elsewhere declined, sawtimber from the Tongass increased in value, and the pulp companies could increase profits by selling their better quality logs as cants and lumber and pulping only lower quality wood. Most saw logs go through only minimal processing, and are exported as cants (logs flattened on two sides). Low-cost timber provided under the 50-year contracts made the sawmills profitable, but those long-term contracts depended on pulp mill operations. When Alaska Pulp Corporation shut down the Sitka mill, the USFS cancelled the remainder of the corporation's long-term contract, ending its supply of low-cost saw timber as well as pulp logs. Sawmill employment dropped by half from 1991 to 1995. The closure of the Ketchikan Pulp Company's (KPC) mill has not led to an immediate contract cancellation. The forest service has agreed to make enough timber available under a renegotiated version of the contract to keep KPC's sawmills in Ketchikan and Metlakatla open for at least two years. Tongass timber will still be available through independent sales. In the last decade, these sales have accounted for from one sixth to one third of Tongass timber harvested. Without KPC to purchase lower quality logs for its pulp mill, it remains to be seen how attractive independent sales will be.
Logging and sawmill operations will continue to make up the greater part of wood processing employment. However, ISER surveys of loggers and wood products manufacturers in the spring of 1996 revealed small amounts of diverse forest products employment throughout the state: logs are sold as firewood and house logs and are made into furniture, bowls, souvenirs and musical instruments. About 8 percent of jobs reported in our wood processors' survey were for these companies. These jobs represented about 3 - 5 percent of all forest products jobs.
ALASKA TIMBER HARVESTS
Tongass National Forest Tongass harvests (Figure 4) have varied widely in the past 35 years depending on markets for cants and pulp as well as other factors. The closure in March 1997 of KPC's pulp mill means there is no longer a large local market for lower grade logs and mill residue. And, much of the harvest is too low grade for sawmills, and operators using Tongass timber will likely be looking to export chips. It is not only markets for wood products that will determine future Tongass harvests, but also the new revision of the Tongass Land Use Management Plan.
Other Public Lands The harvest from the Chugach National Forest has grown relative to that of the Tongass, but is still is only a tiny fraction -around two percent in 1994 and less in 1995- of its harvest volume. Total volume has varied over the last 10 years from 0.4 to 6.5 million board feet (MMBF). In 1996, the Chugach National Forest harvest was 3.3 MMBF. Several proposals to increase logging to harvest timber killed by spruce bark beetles have not resulted in much harvest increase. Much of the beetle kill is on the Kenai Peninsula, where recreation and tourism interests often oppose logging, and future harvest levels in this area are uncertain.
ISER FOREST PRODUCTS INDUSTRY DATA DRAFT 1996 UPDATE
5 9/30/97
Figure 4. Tongass Harvest Volume, 1960 - 1995
600 $900
$800
$700
~ 400 $600 = .,
$500 ~ ~ ,,. .... - .,, ~ I "° I $400 ~ ,,
~ 200 $300 ~
$200 -Harvest Volume
- - - Average Value, Lumber Exports $100
0 $0
1960 1965 1970 1975 1980 1985 1990 1995
The amount of timber harvested from lands owned by the State of Alaska has varied in the last decade from under 10 MMBF to over 25 MMBF. Recently, the state has tried to promote greater harvest of spruce bark beetle killed timber, both to salvage the economic value of this timber and to reduce wild fore hazard. As with federal efforts to harvest beetle killed spruce, success has varied. Much of the harvest from state lands is exported with no Alaska processing.
The state owns a substantial amount of the commercial forest land in the Tanana Valley and Haines State Forests. Unlike federal lands, where timber from the southeast dominates, interior harvests have made up a substantial percentage of state owned timber. Since 1985, interior harvests have ranged from 16 to 70 percent of total state harvest. Some observers believe that greater market acceptance of hardwood lumber could open the door for greater harvests of interior forests 4
, where hardwoods are mixed with currently marketable white spruce.
Private Lands Harvests on private land have exceeded those on federal land every year since 1983. As discussed above, Native harvests comprise virtually the entire private timber harvest. There are no good data on private timber harvests. The USFS estimates private as well as public harvests for southeast and southcentral Alaska by looking at exports and mill activity, estimating the amount of private harvests which is not exported, and estimating the harvest which would have been necessary to produce those figures. For 1991-1994, the Alaska Department of Natural Resources (DNR) was able to estimate private harvests, based on information about acres harvested that operators provided under requirements of the Forest Practices Act. In 1996, ISER conducted a telephone survey of logging companies in which we asked how much wood was harvested, who owned the timber, and whether the logs were exported or sold domestically. From this information we were able to develop an estimate of the 1995 harvest on private land. The Alaska Department of Commerce and Economic Development is planning similar surveys covering 1996, and results from these surveys will be provided under separate cover. Until then, 1995 data is the most recent available.
The USFS reports 484.5 MMBF of private harvest in 1995, and ISER estimates 607 MMBF. The difference stems from:
• different assumptions about the amount of private harvest exported as round logs (the major factor),
• different estimates of Tongass logs exported, and
• slightly different estimation periods (ISER's is calendar year, USFS is federal fiscal year).
Figure 5 shows Alaska's timber harvests with the total using each of the two series compared. The DNR/ ISER estimates are higher for three of the five years of comparison, and about the same in 1991 and 1994. We believe the USFS estimates may be somewhat low; in 1995 those estimates would require all privately harvested timber as well as almost 60 MMBF of Tongass harvest to be exported. Only one of the five of our survey respondents who had harvested Native-owned timber reported exporting all of his harvest; the others sold an average of 5 to 10 percent of their harvest locally.
4 Alaska DCED, Division of Trade and Development, Alaska Economy Performance Report, 1996.
ISER FOREST PRODUCTS INDUSTRY DATA 7 9/30/97 DRAFT 1996 UPDATE
Wood Processing Most of Alaska's wood processing activity has been 1) pulp mills, and 2) sawmills processing Tongass timber. In general, it's more profitable to export Alaska timber without processing, as shown by the average unit values Alaska exporters received for their various wood products (Figure 6). Until 1995, exported logs brought, on the average, higher prices per thousand board feet than exported lumber. This disparity also reflects producers' choices about which wood to export. Top quality logs (exported in the round) naturally are more valuable than lower quality logs, even after those logs are milled into lumber.
much of timber is low quality, suitable primarily for pulp mills. Alaska harvesters aren't necessarily restricted to Alaska pulp mills. In 1994, 73,000 tons of chips were exported from Homer. The amount doubled to 146,000 tons in 1995, with the increase fueled by steadily rising chip prices through late 1995. By the fourth quarter of 1996, average chip prices were half of 1995's annual average, and 1996 quarterly chip exports were 20 to 30 percent below 1995 levels.
Wood Products Survey In addition to the logging survey, ISER conducted a wood products manufacturers survey. We contacted all major wood processors and many smaller firms. Our respondents reported exports of cants and lumber, chips, and pulp slightly in excess of the US Department of Commerce data. The employment data we collected also totals about the same as Alaska Department of Labor data5 Therefore, there's no reasonable way to weight this survey, although we do know that we didn't interview all small wood processors. We believe the processors we did speak to represent the range of processing activities throughout the state, and that the total volume of the small processors, while greater than indicated by our survey, is still only a very small part of Alaska's wood processing industry.
Our respondents reported a wide variety of products. Besides the major products of cants, flitches, lumber and pulp, they also reported:
Frame cabins Log cabins House Logs Siding Paneling
Flooring Cabinets Firewood Furniture Shingles
Door Stock Molding Shop Board Musical Instruments Wood for temples and shrines
Most of these products stayed in Alaska for local consumption. A very small amount-less than 2 percent- was shipped to the Lower 48, and none was reported as exported.
It's difficult to compare the volume of wood used for these products with the total volume harvested and used in Alaska. Many small operators don't record their production in terms that can be converted to board feet. Cabin builders typically reported the number of cabins completed; house logs were often reported in linear feet, with no diameters specified, and those making flooring, furniture and molding often couldn't report any volume estimates.
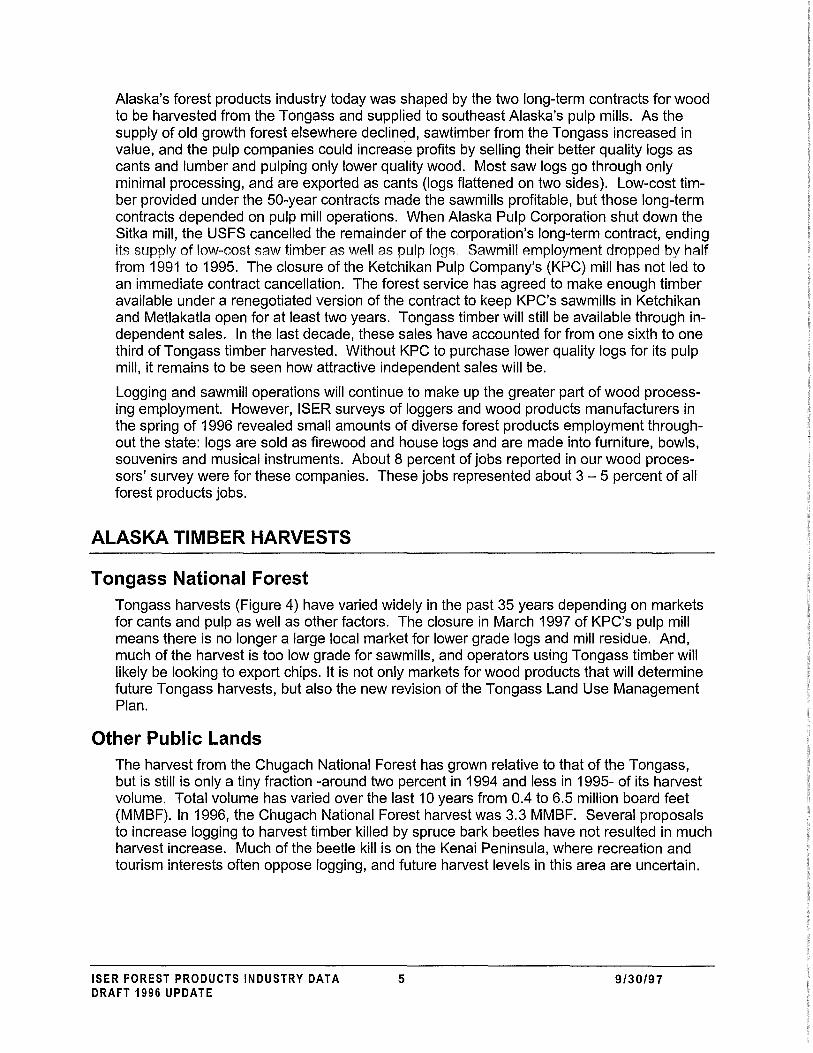
Employment data collected in our survey indicates that production of house logs and other wood products6 account for about 8 percent of total wood processing employment. Figure 7 shows how employment is distributed across different products.
5 Our survey found 1,029 jobs in all wood processing (including pulp), compared to 935 for Alaska Department of Labor. Our survey includes some proprietor jobs not counted by Dol.
6 "Other Wood Products" includes all the categories on the list above except house logs, log cabins and firewood
ISER FOREST PRODUCTS INDUSTRY DATA 8 9/30/97 DRAFT 1996 UPDATE
1,600,000
1,400,000
1,200,000
1,000,000
800,000
600,000
400,000 -.. --200,000
0
1986 1987
Total Harvest Chart 2
Figure 5. Estimates of Total Alaska Timber Harvest (Thousands of Board Feet, Scribner Scale)
Total based on USFS estimate of Private Harv~st
.----------,.
Total based on Other estimates of Private Harvest
- . . ... ---.. ....-... .. '
Harvest on Public Land·'·. ........ --..... ...... ·---- - ... - ~ ......... ---- -....
1988 1989 1990 1991 1992 1993 1994 1995
Page 1
.... ......
1996
Volume,MBF Figure 6. Average Value and Volume of Alaska Wood Exports,
Figure 7.1995 Wood Processing Employment by Type of Product
Other House Logs 2%
Chips 10%
Lumber 37%
6%
Source: ISER 1996 Wood Processors Survey
Pulp 45%
FUEL WOOD HARVESTS
Firewood is an important fuel in Alaska. Statewide, over 14,000 homes, or about one in about 13 households use wood as their primary heating fuel; ranging from fewer than one in 100 in Anchorage, to almost one in two in the Yukon-Koyukuk Census area.7
• Many more households use wood for secondary heat. And vacation cabins and second homes are often heated with wood as well. Total firewood demand is on the order of magnitude of tens of thousands of cords.
Firewood comes from private and public lands. Individuals are often able to cut for free, or for a modest permit fee, and do not have to report exactly how much they take. Commercial cutters have more restrictions, but harvest reporting requirements vary. Many individuals in urban areas (such as Fairbanks, Anchorage, Palmer and Wasilla) buy much of their wood from commercial providers. Those commercial fuel wood sellers may buy wood directly from land owners, or may purchase the 'left overs' of other commercial harvesters who are primarily interested in sawlogs. Thus a substantial amount of commercial fuel wood harvesting on public lands may appear as part of utility harvest, or may not appear at all.
Public Lands
Local Governments ISER called borough governments in areas where the Census indicated wood heat was relatively common: Fairbanks North Star Borough, Denali Borough, Matanuska-Susitna Borough, City and Borough of Yakutat, and Haines Borough. In general, borough land doesn't seem to be a significant source of fuel wood.
Estimated 1996 Fuel Wood Harvest on Borough Lands
Borough Number of Permits Estimated Harvest
Fairbanks 10 to 15 60 to 70 cords Denali No program None Matanuska- Susitna No private permits None
Commercial sales for saw logs Minimal amount and house logs
Yakutat None (no trees on borough land) None Haines 2 or 3 20 to 30 cords
State Land State land is a source of fuel wood for many Alaskan, especially in the Fairbanks area, near the Tanana State Forest. The state holds commercial use fuel wood sales as well as issuing personal use. Fees vary; in areas where the state wants to encourage the removal of dead beetle-killed spruce, harvest permits may be free; elsewhere, harvesters pay varying prices. The Tanana Valley area accounted for 4 70 of the state's 1996 total of 545 permits issued for personal fuel wood harvest, and 13 out of 17 commercial fuel wood sales.
7 Data from the 1990 Public Use Microdata Sample from the US Census; and from published tables
ISER FOREST PRODUCTS INDUSTRY DATA 12 9/30/97 DRAFT 1996 UPDATE
Fuel Wood Harvest Contracts Issued on State Lands, 1996
Personal use permits in the Fairbanks area allow the permitee to harvest up to 10 cords per year for $5 Regional Forester estimates an average harvest of about 5 cords per year. Commercial sales vary widely, and, as mentioned above, commercial harvesters interested in saw logs and house logs often sell fuel wood as well, either directly or through other businesses. For example, one interior harvester we talked to sold about 100 cords of firewood that came from the tops of trees that were primarily used for lumber and saw logs - his commercial permit was for saw logs, not fuel wood.
Federal Land In addition to personal use fuel wood permits in the Tongass, there is fuel wood harvest on some BLM lands and on federal military reservations. As with state land, saw log harvesters may also sell fuel wood.
Estimated 1996 Fuel Wood Harvest on Military Reservations Borough Number of Permits Estimated Harvest Ft Wainwriqht 10 to 20 Less than 20 cords Eielson AFB Na About 20 cords Ft Greely 13 (down/dead wood only) About 13 cords
1 commercial sale 75 cords Ft. Richardson About500 About 500 cords Elmendorf AFB N/a Up to 581 cords
Harvest on military reservations varies greatly. Ft. Richardson is currently clearing land for an expanded drop zone by allowing people to harvest for a minimal fee; when this clearing is complete, harvest will decline. A similar program on Eielson AFB several years ago boosted their annual harvest from around 20 to 100 cords. Finally, BLM, which leases much of the reservation lands to the military, occasionally holds timber sales on that land.
Private Lands ISER was unable to estimate fuel wood harvest on private lands. The multiplicity of owners and small size of these harvests make data collection time consuming and of uncertain accuracy
8 The regions defined in this report don't correspond with the regions reported by the State. We've re-grouped their reported areas as follows: Haines, Juneau and Ketchikan into Southeast; Anchorage/Mat-Su and Kenai/Kodiak into Southcentral Coast, and Southwest, Fairbanks, Delta, Tok, and Valdez/Copper River into Interior.
ISER FOREST PRODUCTS INDUSTRY DATA DRAFT 1996 UPDATE
13 9/30/97
Published Sources
Alaska's Commercial Forest Resource, State of Alaska, Department of Commerce and Economic Development, Economic Analysis Section, October 1986.
Berman, Matthew and Teresa Hull, Forest Products Sector Report, Institute of Social and Economic Research, University of Alaska Anchorage, Anchorage, Alaska, October 1989.
Timber Supply and Demand (annual), Alaska National Interest Lands Conservation Act Section 706(a) report to Congress; prepared by USDA Forest Service, Alaska Region, various issues.
Warren, Debra D. Production, Prices, Employment and Trade in Northwest Forest Industries (quarterly), USDA Forest Service, Pacific Northwest Research Station, Portland, OR, various issues.
Personal Contacts Chris Besdaul, Land Use Planning Technician, Denali Borough
Doug Braddock, Property Management, Fairbanks North Star Borough
Jill Parson, Land Management Officer, Matanuska Susitna Borough
Steve Reidsma, Natural Resources, Ft Wainwright
Jerry VonRueden, Natural Resources, Eielson AFB
Bill Smith, Natural Resources Branch, Public Works, Ft Richardson
Bob Morris, Natual Resources, Elmendorf AFB
Derrick Wilkerson, Environmental Office, Fort Greely
Pete Buneau, State of Alaska DNR, Regional Forester, Fairbanks
ISER FOREST PRODUCTS INDUSTRY DATA DRAFT 1996 UPDATE
14 9/30/97
APPENDIX A. DETAILED TABLES
A-1 . Timber Harvest on Public Lands, 1986 - 1996 ................................................................. 16
Total Federal State 4,795 4,184 6,177 12,541 10,565 11,000 11,135 4,435 5,958 18,384 8,855
Total Public 4,795 4,184 6,177 12,541 10,565 11,000 11,135 4,435 5,958 18,384 8,855
Sources: Federal Lands: Warren, "Production, Prices, Employment and Trade in Northwest Forest Industries, Fourth Quarter 1995". State Lands: Alaska Department of Natural Resources, Division of Forestry.
ISER FOREST PRODUCTS INDUSTRY DATA DRAFT 1996 UPDATE
16 9/30/97
Table A-2. Timber Harvest on Private Lands, 1986 -1996 Thousands of Board Feet
Sources: "Alaska DNR" estimates from Alaska Department of Natural Resources, Division of Forestry. ISER estimate from ISER loggers survey, 1996. "USFS" estimates from Timber Supply and Demand 1994, ANILCA section 706(a) report to Congress, USDA Forest Service, Alaska Region. Report No. 15, January 1996
ISER FOREST PRODUCTS INDUSTRY DATA DRAFT 1996 UPDATE
17 9/30/97
Table A-3. Estimates of Total Alaska Timber Harvest, 1986 - 1996 Thousands of Board Feet
1986 1987 1988
Total Alaska Public 291,389 378,300 434,236 Private (Ak DNR) Private (USFS) 327,000 448,200 480,700
Total (Ak DNR) Total (USFS) 618,389 826,500 914,936
Source: Warren, Debra D. Production, Prices, Employment and Trade in Northwest Forest Industries. First Quarter 1991 through Fourth Quarter 1993. Portland, Ore: US Department of Agriculture, USFS, Pacific Northwest Research Station.
ISER FOREST PRODUCTS INDUSTRY DATA 19 9/30/97 DRAFT 1996 UPDATE
Table A-5. Average Value of Wood Exports by Destination, 1987 -1996 Dollars per MBF for logs and lumber; Dollars per short ton for pulp and chips
Average Value, All Alaska Exports 1987 1988 1989 1990 1991 1992 1993 1994 1995 1996
Paper Pulp (st) $458.82 $571.22 $604.65 $434.16 $363.33 $401.38
Source: Warren, Debra D. Production, Prices, Employment and Trade in Northwest Forest Industries. First Quarter 1991 through Fourth Quarter 1995. Portland, Ore: US Department of Agriculture, USFS, Pacific Northwest Research Station.
ISER FOREST PRODUCTS INDUSTRY DATA 20 9/30/97 DRAFT 1996 UPDATE
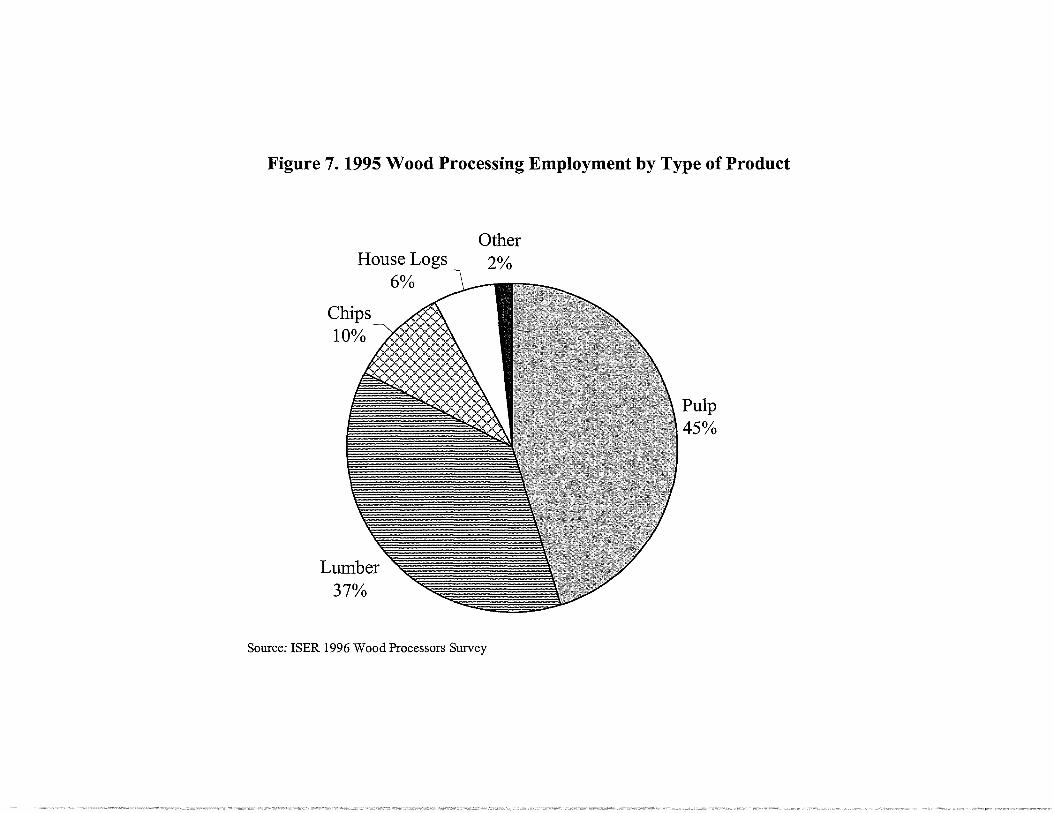
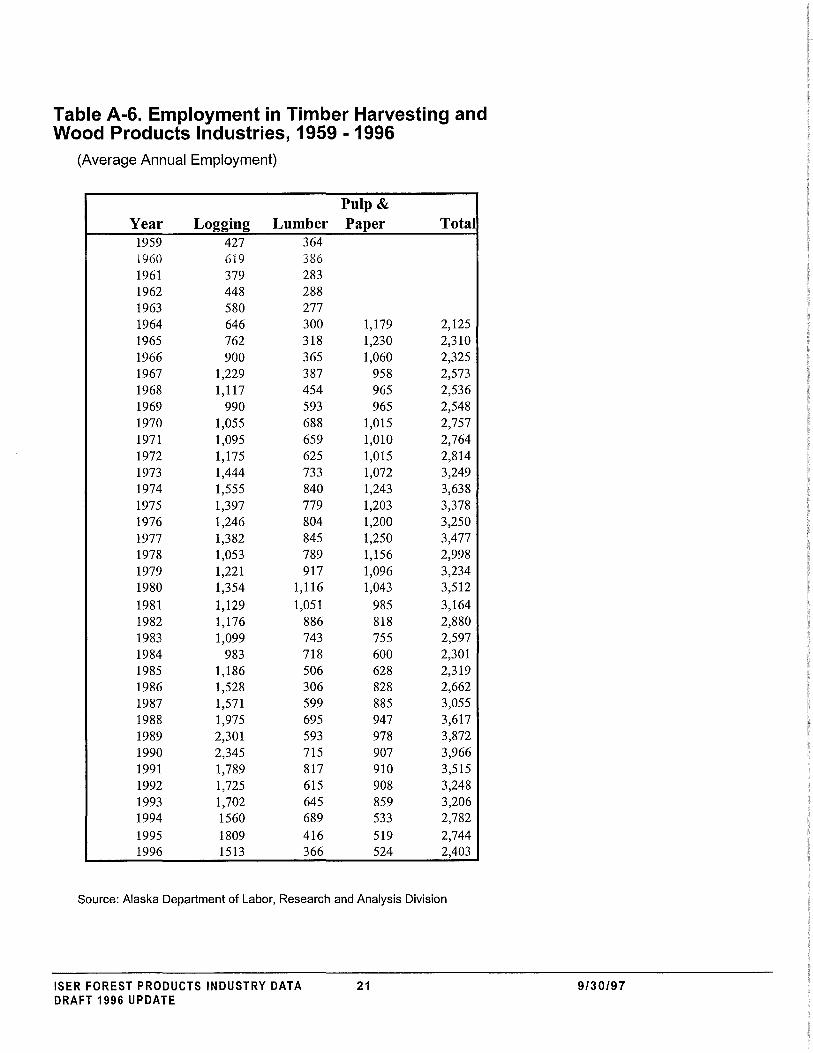
Table A-6. Employment in Timber Harvesting and Wood Products Industries, 1959 - 1996
Source: Alaska Department of Labor, Research and Analysis Division
!SER FOREST PRODUCTS INDUSTRY DATA DRAFT 1996 UPDATE
21 9/30/97
APPENDIX 8. LOGGERS SURVEY
Survey Instrument
Summary of Responses
Weighting Procedures
ISER FOREST PRODUCTS INDUSTRY DATA DRAFT 1996 UPDATE
22 9/30/97
1996 ALASKA TIMBER HARVEST AND WOOD PRODUCTS SURVEY
Part A. Logging
Introduction: Hello, this is with the University of Alaska Anchorage. We are conducting a short survey asking about timber harvests and
primary wood processing in Alaska. This is part of work we are doing to provide regular and timely information about the timber and wood products industries in Alaska for the Anchorage Forestry Sciences Laboratory. This survey takes 5 to 20 minutes. Your answers will not be published individually, but rather will be used in combination with other firms to estimate state and regional totals. (We are not asking about prices or costs or any items involving dollar amounts.)
I would like to know how much timber you harvested by species, in what region of the state you did the harvesting, who owns the lands harvested, and how many people you employ in your operation.
I would like this data for calendar year 1995. Call Record: Date Action
Company Name ______________________ _ I.
Address 2.
3.
4. Contact Person ------------------------
5. Phone ____________ Fax __________ _
Before we begin, I would like to know what log rule you will be using when you give me these quantities. (16 or 32 foot logs. And most will use Scribner scale.)
Region: Owner MMBF Species . Disposition
I. I. I. I.
2. 2. 2. 2.
3. 3. 3. 3.
4. 4. 4. 4.
TIMQUES.DOC 5/5/97
Region: Owner MMBF Species Disposition
1. 1. 1. 1.
2. 2. 2. 2.
3. 3. 3. 3.
4. 4. 4. 4.
Now I would like to ask you a few questions about employment.
1. Number of full-time, year-round employees: 1. ___ _
2. Number of full-time, seasonal employees: 2. ___ _ Months worked ________ _
3. Number of part-time, year-round employees: 3. ___ _ Hours/week-----------
4. Number of part-time, seasonal employees: 4. ___ _ Months worked ________ _
Thank you for giving us this information. Would you like a copy of the completed report? Yes No
(If yes): To whom should we send a copy of the final report:
TIMQUES.DOC 5/5/97 2
Below are the results of the telephone survey ISER conducted of loggers in the state of Alaska in May and June of 1996. These data are not weighted. We developed a list of 26 firms; 6 are out of business; 6 we could not contact; 4 declined the survey and we have 10 completed surveys. Our survey respondents harvested 627 MMBF of wood, broken down by species and region as follows:
Reported Harvest by Species and Region (MBF) Species Total Harvest Southeast Remainder
Full Time Year Round 437 379 58 Full Time Seasonal 626 577 49
Averaqe Duration of Seasonal Work 9.4 months 9.7 months 4.7 months
Part Time Seasonal 248 245 3 Averaoe Duration 9.4 months NA
Weighting There was no stratification in the selection of logging firms - we tried to contact everyone we could identify. However, we believe that we got better response rates from firms cutting on public land, since they report those logging activities as public information anyway. So, for harvests on public lands, we constructed a weight based on the total federal lands harvest reported by the USFS divided by our survey total of harvest from federal lands.
199,726 I 166,676 = 1.20
For private harvests, our survey may shed light on how much timber is sent to the lower 48 states or kept in Alaska; we don't want to use current assumptions about those proportions in developing the weight. So, we construct this weight using information about log exports. We divide USDoC export data by our survey reports of exported logs.
561,500 I 242,326 = 2.317
This approach assumes that the percentage exported was NOT correlated with response rate.
ISER FOREST PRODUCTS INDUSTRY DATA DRAFT 1996 UPDATE
26 9/30/97
APPENDIX C. WOOD PRODUCT MANUFACTURERS' SURVEY
Survey Instrument
Summary of Responses
ISER FOREST PRODUCTS INDUSTRY DATA DRAFT 1996 UPDATE
27 9/30/97
1996 ALASKA TIMBER HARVEST AND WOOD PRODUCTS SURVEY
Part B. Primary Wood Processing
Introduction: Hello, this is with the University of Alaska Anchorage. We are conducting a short survey asking about timber harvests and
primary wood processing in Alaska. This is part of work we are doing to provide regular and timely information about the timber and wood products industries in Alaska for the Anchorage Forestry Sciences Laboratory. This survey takes 5 to 20 minutes. Your answers will not be published individually, but rather will be used in combination with other firms to estimate state and regional totals. (We are not asking about prices or costs or any items involving dollar amounts.)
I would like to know what wood products you make. how much timber and what species you use, where the the timber was harvested, and who the landowner is. Also I would like to know how many people you employed in your operation.
I would like this data for calendar year 1995.
Company Name----------------------
Address
Contact Person ------------------------
Phone ____________ Fax~----------
Before we begin, I would like to know
Call Record: Date Action 1.
2.
3.
4.
5.
(a) if you buy logs or lumber for your operation. (If lumber proceed with questions except exclude where logs come from, ownership, quantity). (b) what log rule you will be using when you give me these quantities. (16 or 32 foot logs. And most will use Scribner scale.)
What products do you make? (How are the logs processed?) (List details on next page.)
Now I would like to ask you a few questions about employment.
1. Number of full-time, year-round employees: 1. ___ _
2. Number of full-time, seasonal employees: 2. ___ _ Months worked ________ _
3. Number of part-time, year-round employees: 3. ___ _ Hours/week _________ _
4. Number of part-time, seasonal employees: 4. ___ _ Months worked ________ _
Thank you for giving us this information. Would you like a copy of the completed report? Yes No
(If yes): To whom should we send a copy of the final report:
We would like to make our list of wood processors as complete as possible. Do you know of other wood processors in your area we should call?
Thank you.
TIMQUES.DOC 5/5/97 3
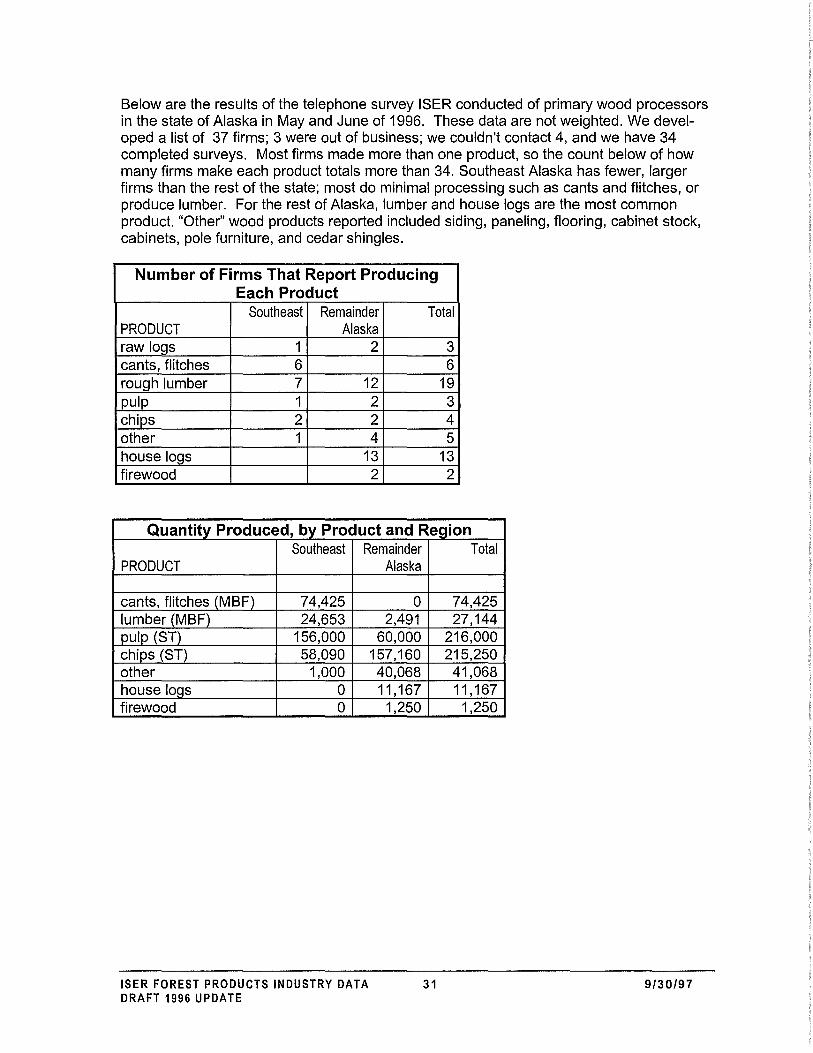
Below are the results of the telephone survey ISER conducted of primary wood processors in the state of Alaska in May and June of 1996. These data are not weighted. We developed a list of 37 firms; 3 were out of business; we couldn't contact 4, and we have 34 completed surveys. Most firms made more than one product, so the count below of how many firms make each product totals more than 34. Southeast Alaska has fewer, larger firms than the rest of the state; most do minimal processing such as cants and flitches, or produce lumber. For the rest of Alaska, lumber and house logs are the most common product. "Other" wood products reported included siding, paneling, flooring, cabinet stock, cabinets, pole furniture, and cedar shingles.
Number of Firms That Report Producing Each Product
Southeast Remainder Total PRODUCT Alaska raw logs 1 2 3 cants, flitches 6 6 rough lumber 7 12 19 pulp 1 2 3 chips 2 2 4 other 1 4 5 house logs 13 13 firewood 2 2
Quantity Produced, by Product and Region Southeast Remainder
PRODUCT
cants, flitches (MBF) 74,425 lumber (MBF) 24,653 pulp (ST) 156,000 chips (ST) 58,090 other 1,000 house logs 0 firewood 0
ISER FOREST PRODUCTS INDUSTRY DATA DRAFT 1996 UPDATE
Alaska
0 2,491
60,000 157,160 40,068 11,167
1,250
Total
74,425 27,144
216,000 215,250 41,068 11,167
1,250
31 9/30/97
The table below shows the disposition of wood products made in Alaska. As we expected, the forest products industry in southeast Alaska is dominated by exports; in the remainder of the state, a much higher percentage of production is for local use. This is partly true because southeast makes more export-specific products (such as cants), an the rest of the state produces more locally used products (such as firewood). But even for products such as lumber, southeast mills produce for export, and mills elsewhere in the state for local use. Chips are an exception. Although chips in southeast are ultimately destined for export, they are first processed into pulp. Because southcentral has no major pulp mills, and because there's been strong worldwide demand for chips in recent years, the majority of chips in southcentral are exported.
Disposition of Wood Products Manufactured in Alaska Southeast Remainder Alaska Total Alaska
PRODUCT Sold in Sold to Exported Sold in Sold to Exported Sold in Sold to Exported Alaska Lower48 Alaska Lower48 Alaska Lower48
cants, flitches 0% 27% 73% 0% 27% 73%
rough lumber 5% 68% 26% 100% 0% 0% 17% 60% 23%
pulp 0% 9% 91% 0% 0% 100% 0% 7% 94%
chips 100% 0% 0% 1% 0% 99% 28% 0% 72%
other 0% 100% 0% 100% 0% 0% 98% 2% 0%
house logs 100% 0% 0% 100% 0% 0%
firewood 100% 0% 0% 100% 0% 0%
Our respondents reported using a little over 300 MMBF of wood to manufacture their products.
Sources of Wood Processed by Alaska Manufacturers (MBF) Owner Southeast Remainder
Alaska Alaska Federal Gov't 177,511 89
State Gov't 9,792
Native 2,508 23,400
Other Private 50 17,351
Local Gov't 40,315
Total 180,069 90,927
ISER FOREST PRODUCTS INDUSTRY DATA DRAFT 1996 UPDATE