28
1D, 2D Integrated Flood Risk Mapping (Incheon-gyo Catchment) 2007. 8. 24 Team RED Seongjoon BYEON Myeongsoo HAM Michele ROMANO K. Shobha YADA V Masahiko TERAZONO ADVISER : Gyewoon CHOI
| Date post: | 03-Jan-2016 |
| Category: |
Documents |
| Upload: | leon-allen |
| View: | 213 times |
| Download: | 0 times |

1D, 2D Integrated Flood Risk Mapping (Incheon-gyo Catchment)
2007. 8. 24Team RED
Seongjoon BYEON Myeongsoo HAMMichele ROMANO K. Shobha YADAV
Masahiko TERAZONOADVISER : Gyewoon CHOI

HYDROASIA TEAM-RED
Michele, Joon, Shobha, Ham, Masahiko

Face-to-Face Week
•The first face-to-face meeting of the participants started on 20th August-2007
•Our team had preliminary presentation for the work progress on 20 August
•Started to work on our further plan for this week and comments from preliminary presentation
Making good experiences!!!!

CONTENTS
OBJECTIVES OF STUDY
RAINFALL ANALYSIS
URBAN DRAINAGE & MIKEFLOOD MODEL SETUP USING DIFFERENT RUNOFF COEFFICIENT
ANALYZING RESULTS
RISK ANALYSIS
CONCLUSION
OBJECTIVES OF STUDY
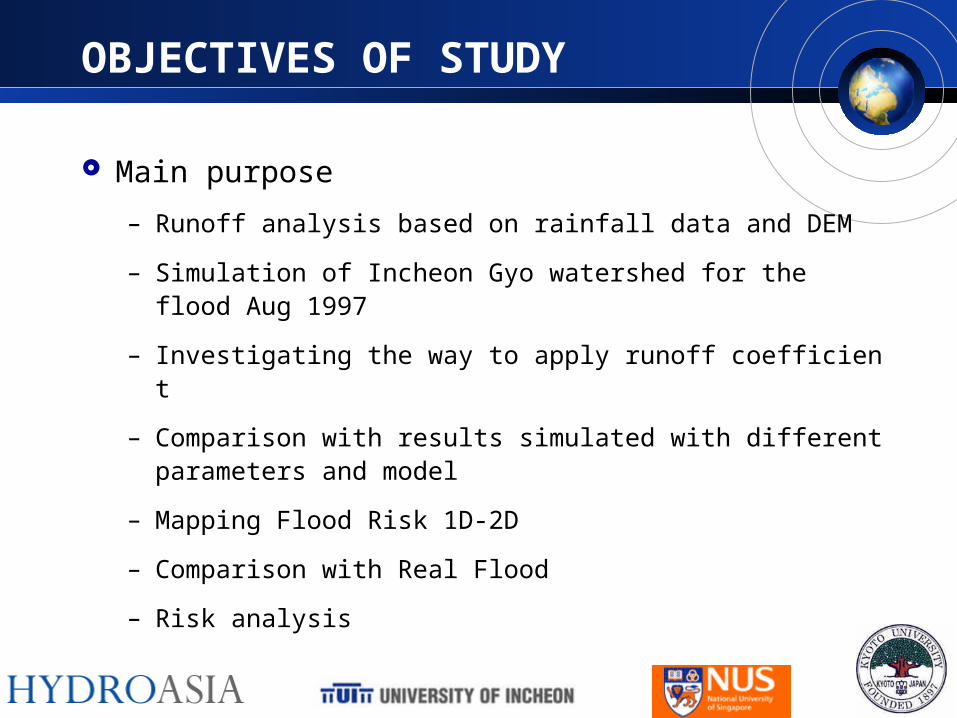
Main purpose
– Runoff analysis based on rainfall data and DEM
– Simulation of Incheon Gyo watershed for the flood Aug 1997
– Investigating the way to apply runoff coefficient
– Comparison with results simulated with different parameters and model
– Mapping Flood Risk 1D-2D
– Comparison with Real Flood
– Risk analysis

FLOW CHART OF OVERALL FRAMEWORK
MIKE FLOOD
Set up
Coupling
Preprocessing for MOUSE
Run Model
Check the result and evaluation
Set up
Validation
MIKE21 Model
MOUSE Model
Set up
ValidationPreparation
GIS
Rainfall Analysis
Evaluation of the Flood risk

INCHEON INTENSITY FORMULA VS GUMBELL
)]([
)(uh
eehP
nath
Gumbell Formula
Monomial Precipitation Formula
Incheon University Intensity Formula
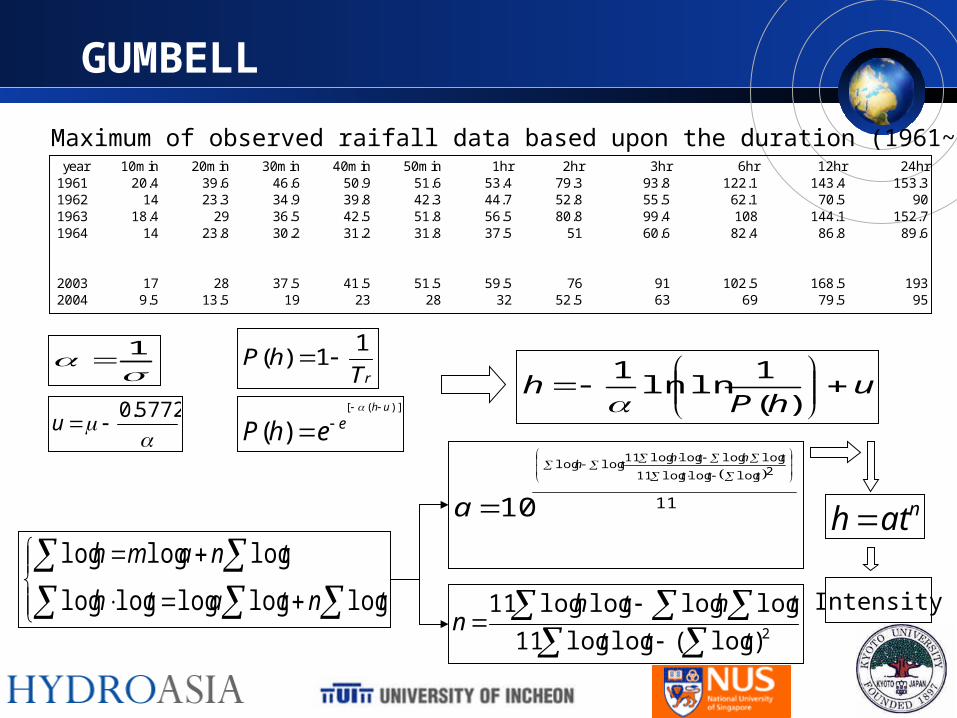
GUMBELL
)]([
)(uh
eehP
1
5772.0
u
rThP
11)(
uhP
h
)(
1lnln
1
tntath
tnamh
logloglogloglog
logloglog
11
2logloglog11
loglogloglog11loglog
10
ttt
ththth
a
2)log(loglog11
loglogloglog11
ttt
ththn
year 10min 20min 30min 40min 50min 1hr 2hr 3hr 6hr 12hr 24hr1961 20.4 39.6 46.6 50.9 51.6 53.4 79.3 93.8 122.1 143.4 153.31962 14 23.3 34.9 39.8 42.3 44.7 52.8 55.5 62.1 70.5 901963 18.4 29 36.5 42.5 51.8 56.5 80.8 99.4 108 144.1 152.71964 14 23.8 30.2 31.2 31.8 37.5 51 60.6 82.4 86.8 89.6
2003 17 28 37.5 41.5 51.5 59.5 76 91 102.5 168.5 1932004 9.5 13.5 19 23 28 32 52.5 63 69 79.5 95
Maximum of observed raifall data based upon the duration (1961~2004)
nath
Intensity
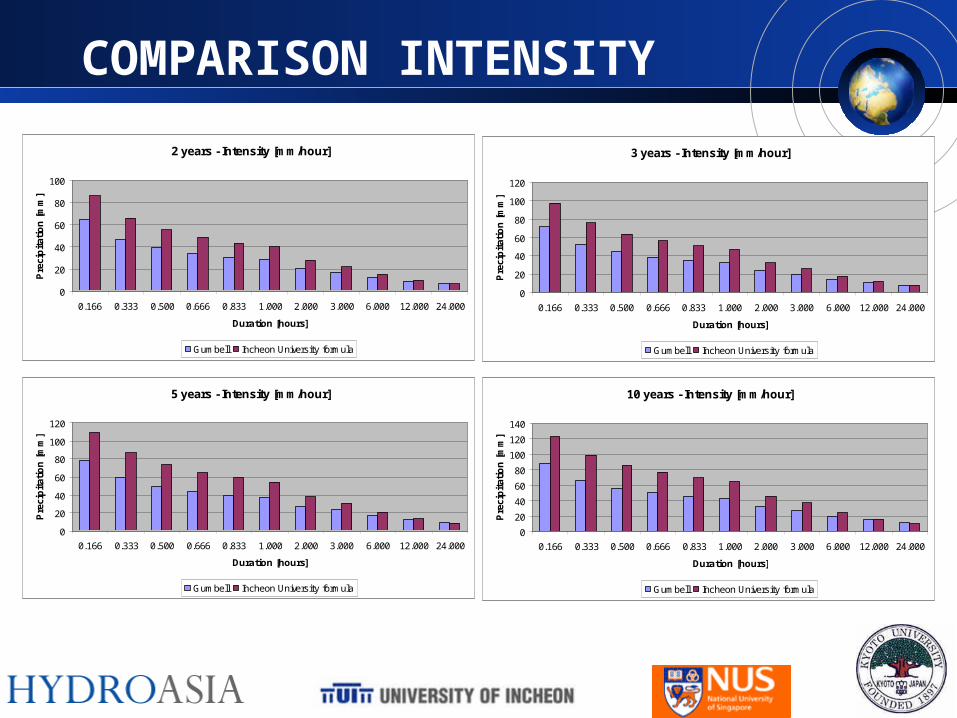
COMPARISON INTENSITY
3 years - Intensity [mm/hour]
0
20
40
60
80
100
120
0.166 0.333 0.500 0.666 0.833 1.000 2.000 3.000 6.000 12.000 24.000
Duration [hours]
Pre
cip
itat
ion
[m
m]
Gumbell Incheon University formula
2 years - Intensity [mm/hour]
0
20
40
60
80
100
0.166 0.333 0.500 0.666 0.833 1.000 2.000 3.000 6.000 12.000 24.000
Duration [hours]
Pre
cip
itat
ion
[m
m]
Gumbell Incheon University formula
5 years - Intensity [mm/hour]
0
20
40
60
80
100
120
0.166 0.333 0.500 0.666 0.833 1.000 2.000 3.000 6.000 12.000 24.000
Duration [hours]
Pre
cip
itat
ion
[m
m]
Gumbell Incheon University formula
10 years - Intensity [mm/hour]
0
20
40
60
80
100
120
140
0.166 0.333 0.500 0.666 0.833 1.000 2.000 3.000 6.000 12.000 24.000
Duration [hours]
Pre
cip
itat
ion
[m
m]
Gumbell Incheon University formula
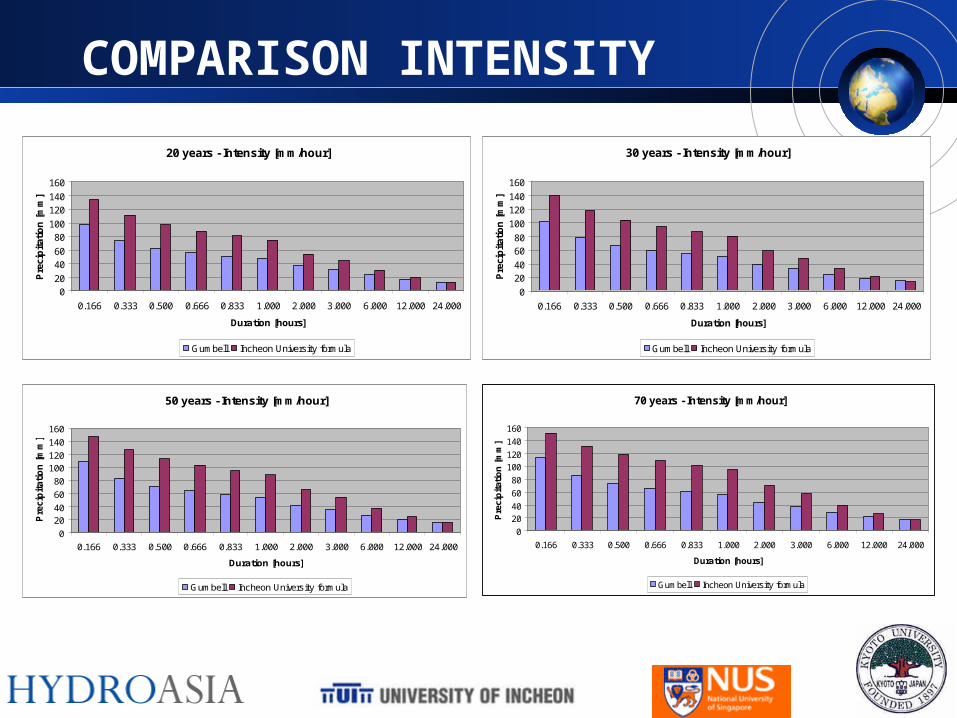
20 years - Intensity [mm/hour]
020
4060
80100
120140
160
0.166 0.333 0.500 0.666 0.833 1.000 2.000 3.000 6.000 12.000 24.000
Duration [hours]
Pre
cip
itat
ion
[m
m]
Gumbell Incheon University formula
30 years - Intensity [mm/hour]
0
2040
6080
100
120140
160
0.166 0.333 0.500 0.666 0.833 1.000 2.000 3.000 6.000 12.000 24.000
Duration [hours]
Pre
cip
itat
ion
[m
m]
Gumbell Incheon University formula
50 years - Intensity [mm/hour]
0
2040
60
80
100120
140
160
0.166 0.333 0.500 0.666 0.833 1.000 2.000 3.000 6.000 12.000 24.000
Duration [hours]
Pre
cip
itati
on
[m
m]
Gumbell Incheon University formula
70 years - Intensity [mm/hour]
0
2040
60
80
100120
140
160
0.166 0.333 0.500 0.666 0.833 1.000 2.000 3.000 6.000 12.000 24.000
Duration [hours]
Pre
cip
itat
ion
[m
m]
Gumbell Incheon University formula
COMPARISON INTENSITY

80 years - Intensity [mm/hour]
020406080
100120140160180
0.166 0.333 0.500 0.666 0.833 1.000 2.000 3.000 6.000 12.000 24.000
Duration [hours]
Pre
cip
itat
ion
[m
m]
Gumbell Incheon University formula
100 years - Intensity [mm/hour]
020406080
100120140160180
0.166 0.333 0.500 0.666 0.833 1.000 2.000 3.000 6.000 12.000 24.000
Duration [hours]
Pre
cip
itat
ion
[m
m]
Gumbell Incheon University formula
COMPARISON INTENSITY

1D FLOOD MAP
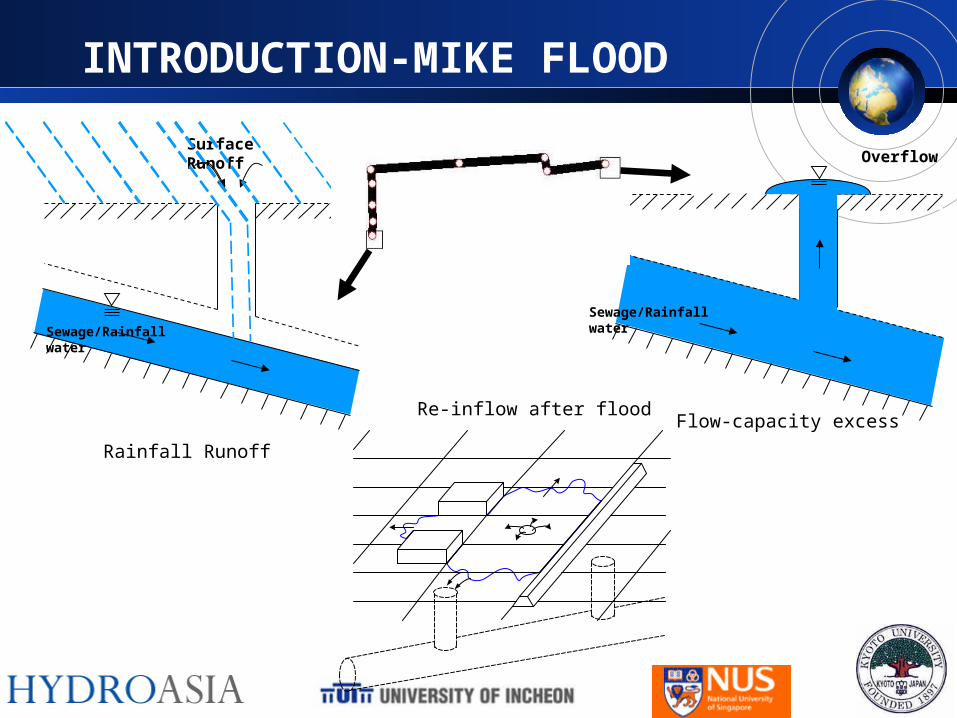
INTRODUCTION-MIKE FLOOD
Rainfall Runoff
Surface Runoff Overflo
w
Figure 1 Application of Standard Links
Re-inflow after floodFlow-capacity excess
Sewage/Rainfall water
Sewage/Rainfall water

INTRODUCTION-MIKE FLOOD
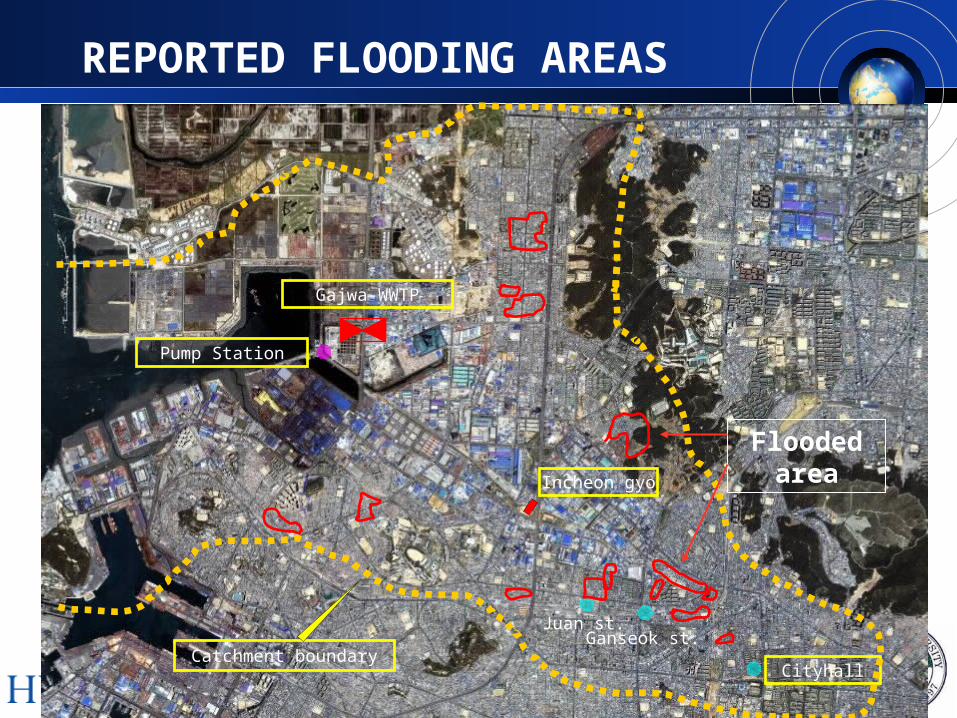
Catchment boundary
Gajwa-WWTP
Cityhall
Ganseok st.Juan st.
Incheon gyo
Pump Station
Flooded area
REPORTED FLOODING AREAS
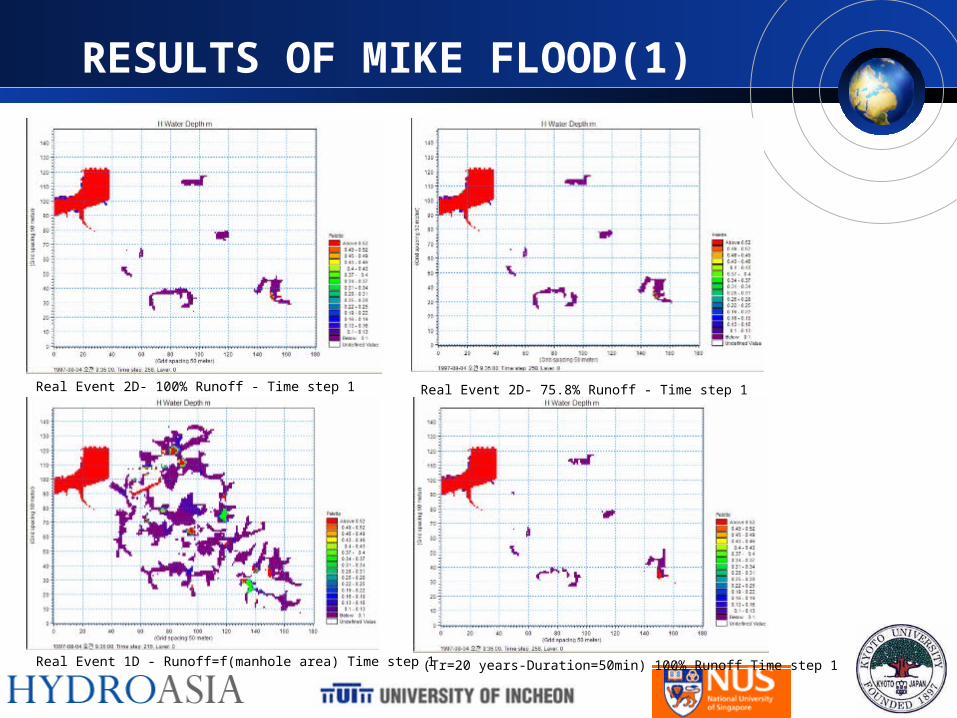
Real Event 2D- 100% Runoff - Time step 1 Real Event 2D- 75.8% Runoff - Time step 1
(Tr=20 years-Duration=50min) 100% Runoff Time step 1Real Event 1D - Runoff=f(manhole area) Time step 1
RESULTS OF MIKE FLOOD(1)
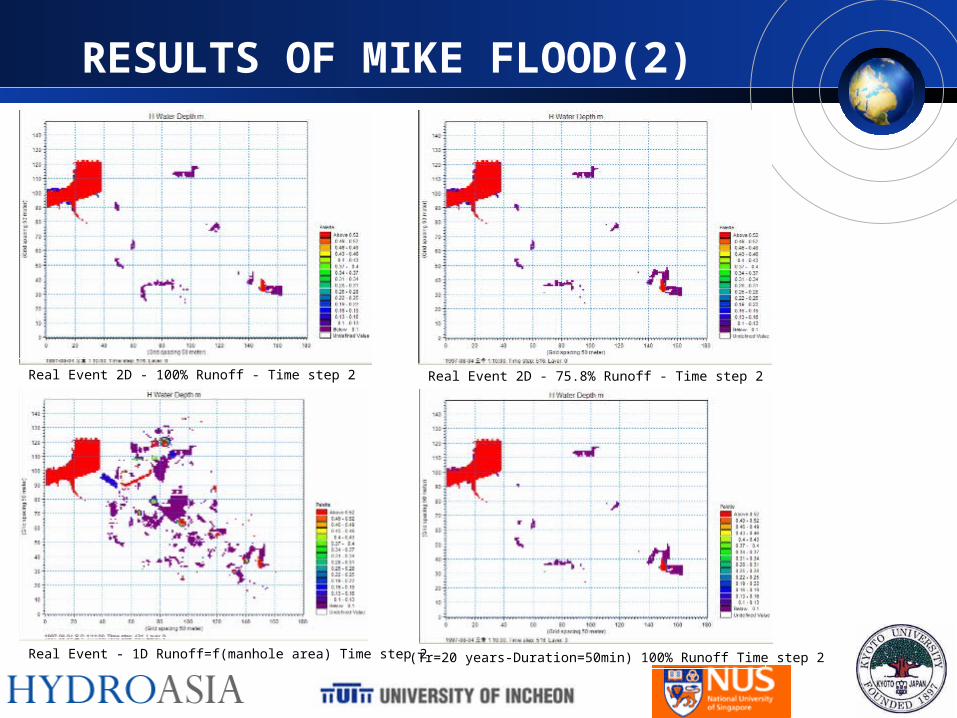
Real Event 2D - 100% Runoff - Time step 2 Real Event 2D - 75.8% Runoff - Time step 2
(Tr=20 years-Duration=50min) 100% Runoff Time step 2Real Event - 1D Runoff=f(manhole area) Time step 2
RESULTS OF MIKE FLOOD(2)

RISK ANALYSIS
)( iii LpLR
)( iiTOT LpLR
Risk=(Probability of an accident)*(Losses per accident)
Probability of an accident
Factors Considered
Losses per accident
Factors Considered
A1) Slope B1) Building
A2) Impervious areas B2) Density of Population
A3) Land use B3) Population Increase Forecast
A4) Velocity of the flow in the
Flooded Area

SLOPE MAP
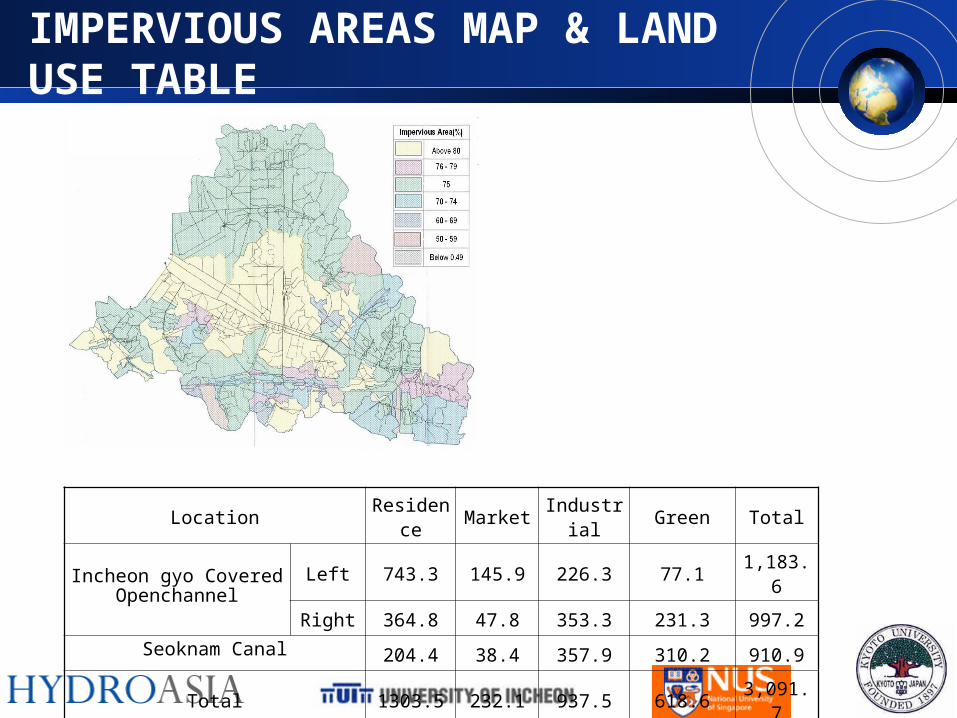
IMPERVIOUS AREAS MAP & LAND USE TABLE
Location Residence Market Industrial Green Total
Incheon gyo CoveredOpenchannel
Left 743.3 145.9 226.3 77.1 1,183.6
Right 364.8 47.8 353.3 231.3 997.2
Seoknam Canal 204.4 38.4 357.9 310.2 910.9
Total 1303.5 232.1 937.5 618.6 3,091.7
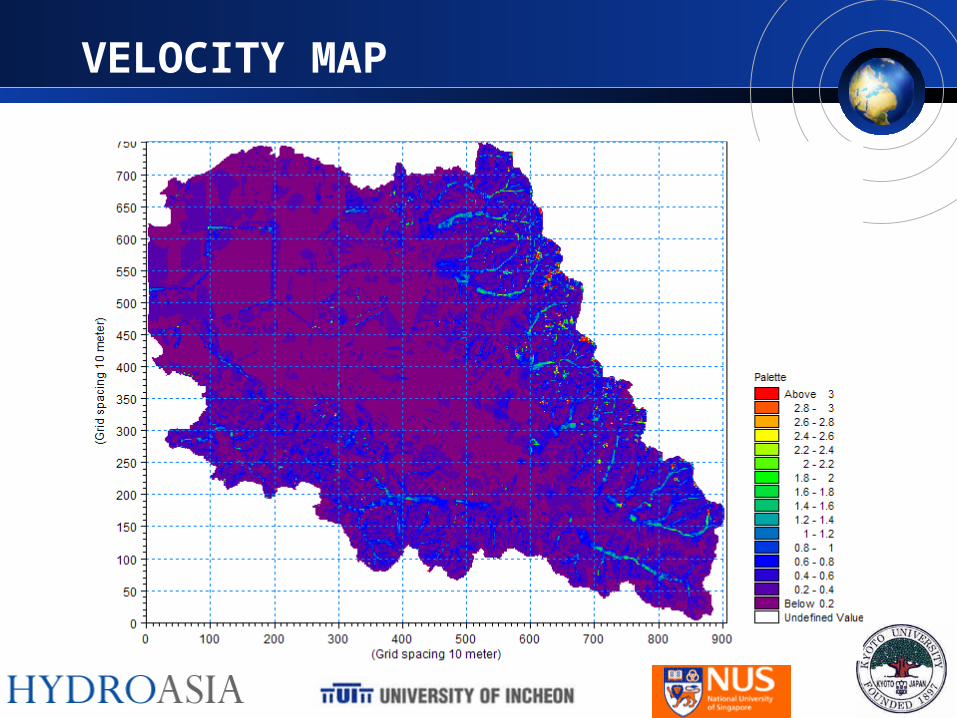
VELOCITY MAP
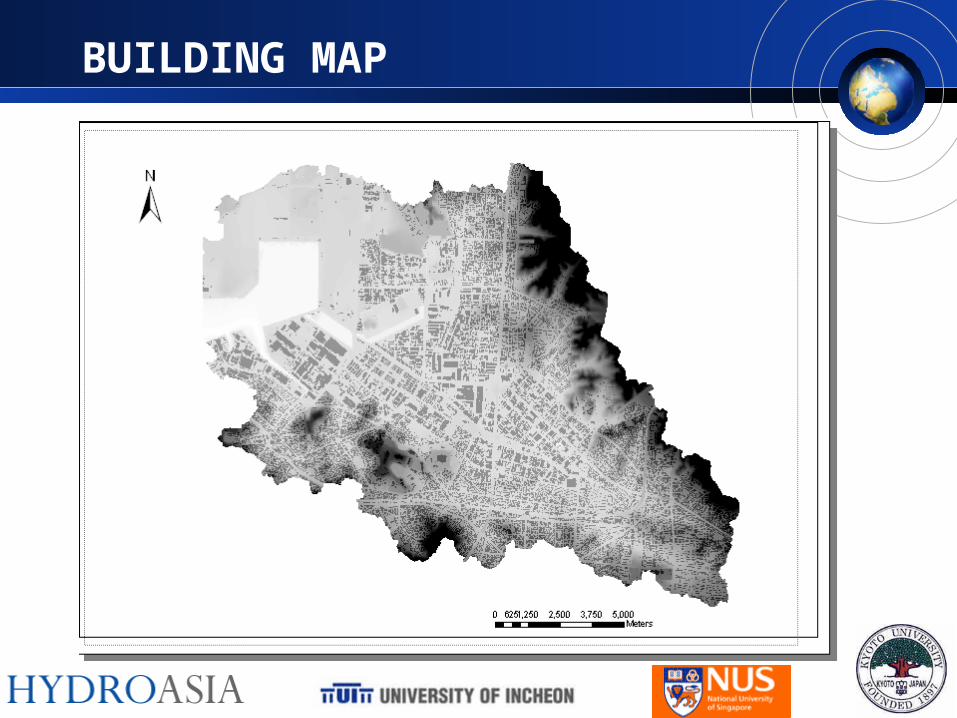
BUILDING MAP
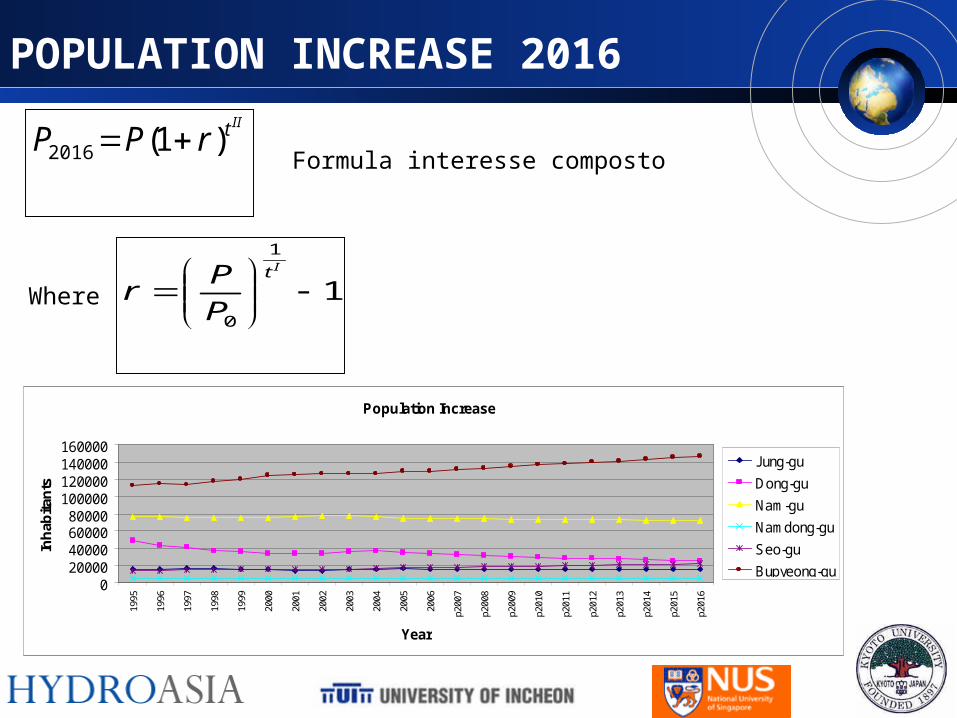
POPULATION INCREASE 2016
1
1
0
It
P
Pr
IItrPP )1(2016 Formula interesse composto
Population Increase
020000400006000080000
100000120000140000160000
1995
1996
1997
1998
1999
2000
2001
2002
2003
2004
2005
2006
p200
7
p200
8
p200
9
p201
0
p201
1
p201
2
p201
3
p201
4
p201
5
p201
6
Year
Inh
abita
nts
Jung-gu
Dong-gu
Nam-gu
Namdong-gu
Seo-gu
Bupyeong-gu
Where
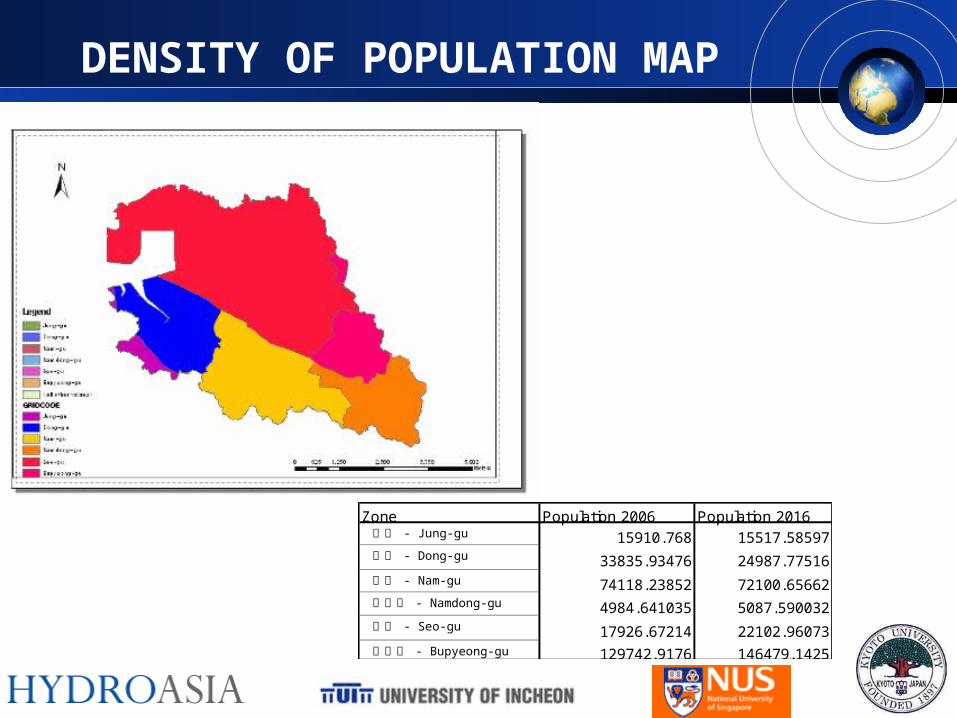
DENSITY OF POPULATION MAP
Zone Population 2006 Population 2016 중구 - J ung- gu 15910.768 15517.58597 동구 - Dong- gu 33835.93476 24987.77516 남구 - Nam- gu 74118.23852 72100.65662 남동구 - Namdong- gu 4984.641035 5087.590032 서구 - Seo- gu 17926.67214 22102.96073 부평구 - Bupyeong- gu 129742.9176 146479.1425
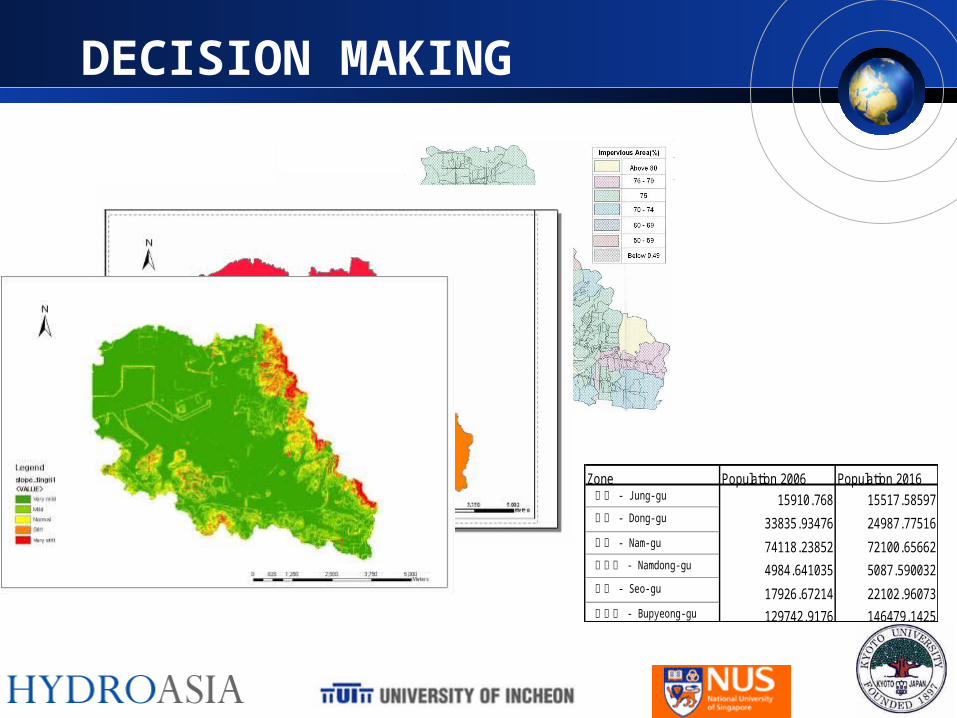
DECISION MAKING
Zone Population 2006 Population 2016 중구 - J ung- gu 15910.768 15517.58597 동구 - Dong- gu 33835.93476 24987.77516 남구 - Nam- gu 74118.23852 72100.65662 남동구 - Namdong- gu 4984.641035 5087.590032 서구 - Seo- gu 17926.67214 22102.96073 부평구 - Bupyeong- gu 129742.9176 146479.1425
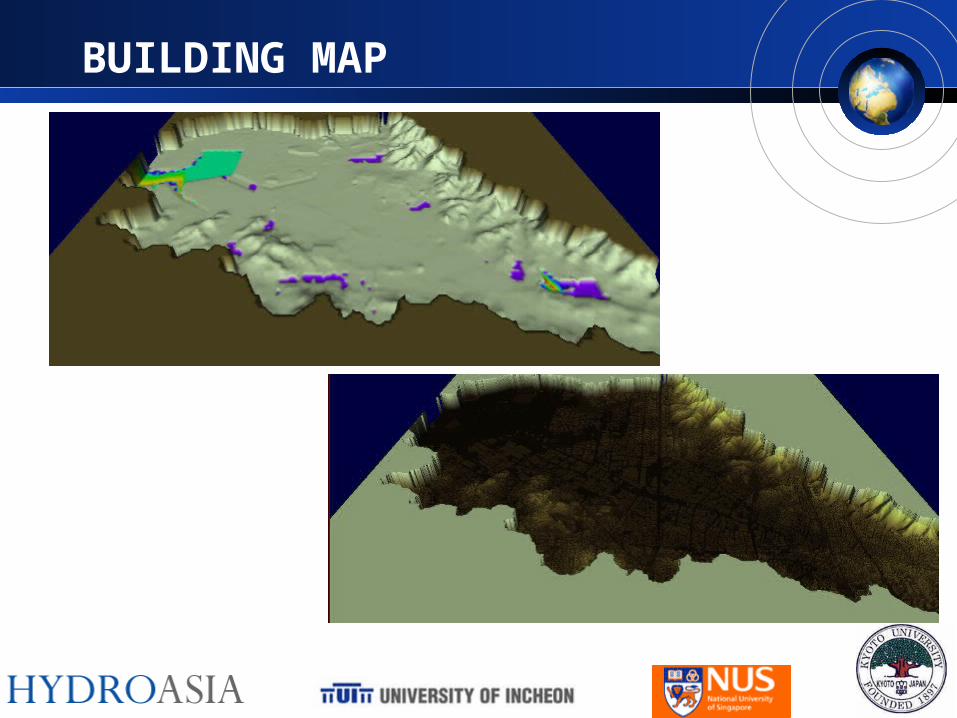
BUILDING MAP
CONCLUSIONS
Experience in Incheon was …an experience:)
The advantage mapping with 2D surface runoff modeling could be found as following with nicely matching of the reported area
– The terrain characteristic can be considered
– The lag due to the puddle, discontinuity can be considered
– The magnification of result can be prevented with distribution of flooded water to another manhole
A simple Risk analysis can be arranged

Lets take pride in being
TEAM RED !!!


