Wideband Signal Analysis Application Note Products: ı R&S ® FSW ı R&S ® RTO Verification of the spectrum allocation and in depth analysis of the transmitted signals is very important in many domains. For example, the IEEE 802.11ad standard makes use of approximately 2 GHz bandwidth in the 60 GHz frequency domain. Researchers and developers of Automotive radar discuss the 79 GHz frequency band with an available bandwidth of up to 4 GHz. Finally the upcoming 5G technology for cellular networks discusses the use of up to 2GHz signals in the cm and mm-wave frequency bands. This technical evolution already indicates the need of signal measurement and analysis in the mm-wave domain with high bandwidth. Therefore, this application note presents a method to measure and analyze signals with an instantaneous bandwidth of up to 2 GHz using new tools on the FSW Signal and Spectrum Analyzer platform in collaboration with an RTO Digital Oscilloscope. Note: Please find the most up-to-date document on our homepage http:\\www.rohde-schwarz.com/appnote/1EF92. Dr. St. Heuel, Dr. S. Michael, M. Kottkamp 6.2015 – 1EF92_1e Wideband Signal Analysis
Transcript
Wideband Signal Analysis Application Note
Products:
ı R&S®FSW
ı R&S®RTO
Verification of the spectrum allocation and in depth analysis of the transmitted signals is very important in many domains. For example, the IEEE 802.11ad standard makes use of approximately 2 GHz bandwidth in the 60 GHz frequency domain. Researchers and developers of Automotive radar discuss the 79 GHz frequency band with an available bandwidth of up to 4 GHz. Finally the upcoming 5G technology for cellular networks discusses the use of up to 2GHz signals in the cm and mm-wave frequency bands.
This technical evolution already indicates the need of signal measurement and analysis in the mm-wave domain with high bandwidth.
Therefore, this application note presents a method to measure and analyze signals with an instantaneous bandwidth of up to 2 GHz using new tools on the FSW Signal and Spectrum Analyzer platform in collaboration with an RTO Digital Oscilloscope.
Note:
Please find the most up-to-date document on our homepage http:\\www.rohde-schwarz.com/appnote/1EF92.
6 Literature ........................................ ................................................... 35
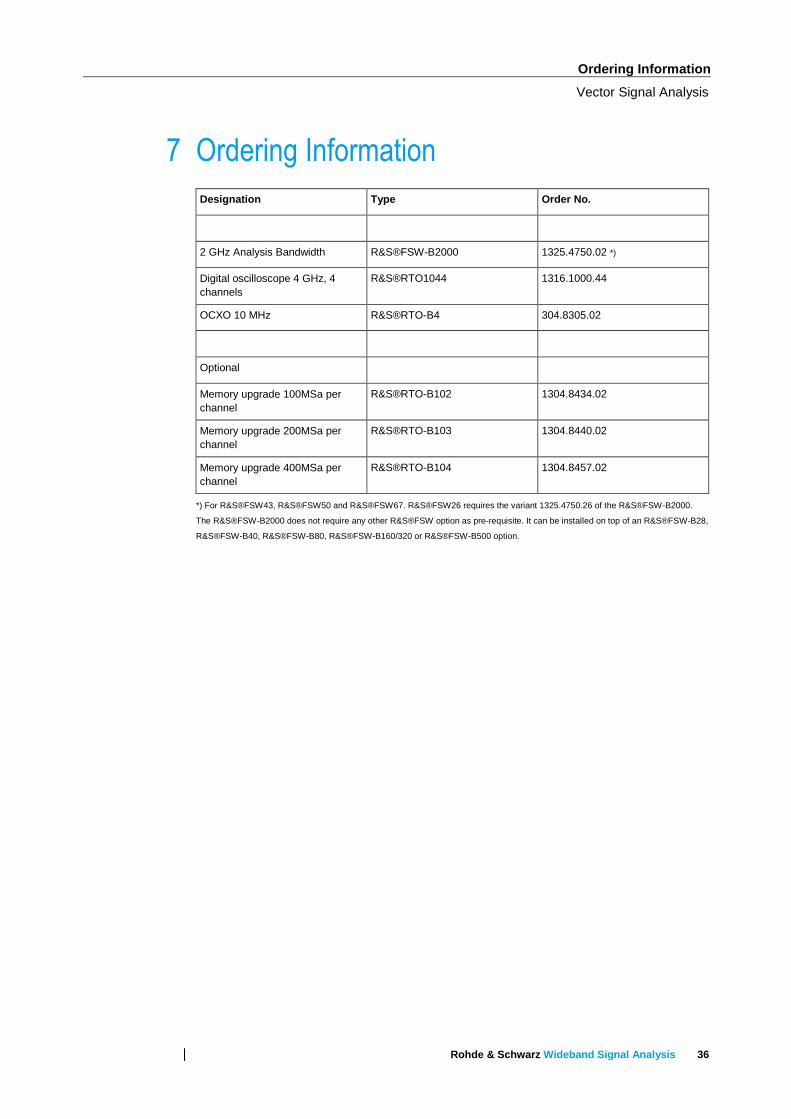
7 Ordering Information .............................. .......................................... 36
Introduction
Measurement Concept and Technical Features
Rohde & Schwarz Wideband Signal Analysis 3
1 Introduction
Wideband radiofrequency signals become more and more important and omnipresent. While GSM systems use 200 kHz bandwidth per channel, UMTS (3G) occupies 5 MHz and LTE (4G) makes use of up to 20 MHz. The carrier aggregation (CA) feature in LTE-Advanced already allows aggregating up to five LTE component carriers and 32 CA was proposed as further enhancement in 3GPP Release 13. IEEE Wifi networks had an evolution, where 802.11n makes use of up to 40 MHz and 802.11ad up to 1.76 GHz or even 2.16 GHz with guard bands. Last but not least the recently started research on 5G includes, among other technology components, the use of wideband signals (up to 2GHz) in the cm- and mm-wave frequency range. Propagation conditions and channel impulse response for cellular applications is largely unexplored at cm- and mm-wave frequencies. For channel sounding high bandwidth translates into high resolution of multipath components, which adds to the need for wideband signal analysis.
Next to mobile communication, which makes use of higher frequencies and increased bandwidth, commercial radar sensors already allocate the mm-wave domain. Automotive radars are a strong candidate for several different advanced driver assistance systems (ADAS) and support the way to automated driving. The accuracy, range, azimuth and radial velocity resolutions are key performance parameters of a radar. In order to distinguish between different targets and to measure the details of it (detailed pattern), the resolution of the radar sensor has to be very high compared to the target size or motion. To increase the range resolution of a radar, higher bandwidth is necessary. Where the 24 GHz band will be limited to 200 MHz of bandwidth in the future, the 79 GHz band is discussed to offer up to 4 GHz bandwidth for automotive radar sensors.
This evolution will not only cause higher technical demands to the signal transmission, reception and data processing of a mobile system or radar, but also to the measurement equipment, which supports research and development, proofs the performance and verifies the system according to standards.
For these processes, spectrum and signal analyzers are widely used. However, by today, most of these analyzers offer an analysis bandwidth of up to 500 MHz. Wideband signals of future systems will use more than 1 GHz of bandwidth, which makes higher analysis bandwidth necessary.
This application note therefore presents a method, to measure and analyze wideband signals of up to 2 GHz instantaneous bandwidth up to mm-wave frequencies by using a state-of-the art signal analyzer and an oscilloscope.
Wideband Signal Measurement and Analysis
Measurement Concept and Technical Features
Rohde & Schwarz Wideband Signal Analysis 4
2 Wideband Signal Measurement and
Analysis
The wideband signal measurement option B2000 for analysis bandwidth up to 2 GHz uses an oscilloscope additionally to the R&S®FSW Signal and spectrum analyzer. The R&S®FSW Signal and Spectrum Analyzer down converts the radio frequency (RF) to an intermediate frequency (IF). With a 2 GHz wide IF from 1 GHz to 3 GHz, the R&S®RTO1044 digital oscilloscope can be used to digitize the analog IF signal. The digitized data is then fed back to the FSW Signal and Spectrum Analyzer over Ethernet, where the analysis applications retrieve the data stream and enable different analysis possibilities.
This wideband analysis option is called R&S®FSW-B2000, is fully controlled by the R&S®FSW Signal and Spectrum Analyzer and resamples, equalizes and down converts the signal into digital baseband.
The FSW IF output is characterized at the factory. Amplitude and phase response from the RF input connector to the IF output is stored on an FPGA at production. This is used by B2000 to equalize the signal. An additional alignment source is built into the FSW for the alignment of the oscilloscope and IF cable. This alignment is done by the user and takes only some seconds.
Figure 1: Wideband Signal Measurement and Analysis Principle
For spectral measurements, spectrum emission mask or unwanted interferer, spectrum analyzers are the instrument of choice. Modern analyzers cover the frequency range up to 67 GHz. For measurements above 67 GHz external harmonic mixers offer the necessary frequency extension. These mixers use a higher harmonic of the local oscillator of the instrument and convert the signal to an IF frequency fIF, where the signal is digitized and the spectrum is displayed. In such a setup no preselection is used and the image and unwanted mixing products of higher harmonics are displayed
R&S FSW Oscilloscope
RF in IF 2 GHz A
D Analog IF filter
A/D converter
10 MHz reference
LAN
equalizer + downsampler Application
User sample rate
Wideband Signal Measurement and Analysis
Measurement Concept and Technical Features
Rohde & Schwarz Wideband Signal Analysis 5
as well. A shift of the LO frequency by 2 times the fIF gives the possibility to identify unwanted products and delete them. However, this works only, if the real signal and the image do not overlay, which is normally not the case for 2 GHz wide signals, see Figure 2.
Figure 2: Spectrum and Image
For optimum dynamic range the input level at the mixers has to be adjusted carefully and the setup becomes complex and inconvenient due to the fact, that external attenuation has to be changed, whenever the input level changes. The same applies, when it comes to analysis of the chirp parameters with an FM demodulator based on IQ data. Only if the signal bandwidth B is B < 2 fIF, the signal can be captured without deterioration resulting from the unwanted image.
For a high unambiguous range, spectrum analyzers with a high IF are therefore required.
2.1 Measurement Concept and Technical Features
For spectrum measurements of wide band signals in the 70 GHz range a concept with preselection at the input of the downconverter is needed to reject the image and other unwanted interferers. For signal analysis this preselection is normally bypassed and high intermediate frequency fIF is needed to avoid deterioration caused by the image.
Therefore for spectrum measurements on wideband radar chirp signals, an instrument is used, where the input frequency is extended to 85 GHz. An additional tuned filter stage is added for preselection up to this frequency range. Unwanted images or interferers are suppressed and the instrument shows an unambiguous spectrum even with wide band signals, where B > 2 fIF. Integrated attenuators offer an easy setting of optimum input levels. In addition, a resolution bandwidth (RBW) of 50 MHz can be set for measurement of maximum radiated peak power (EIRP) according to ETSI standard for Ultrawideband (UWB) [1].
Some of the most important capabilities of the FSW-B2000 wideband signal analysis include:
ı Instantaneous bandwidth: up to 2 GHz
ı Radio frequency: from 8 GHz to 67 GHz / 110 GHz (with external mixer)
ı Available in, IQ Analyzer, Pulse Measurements K6, Transient Analysis K60, Vector Signal Analysis K70
ı on FSW26, FSW43, FSW50, and FSW67 models
Wideband Signal Measurement and Analysis
Measurement Concept and Technical Features
Rohde & Schwarz Wideband Signal Analysis 6
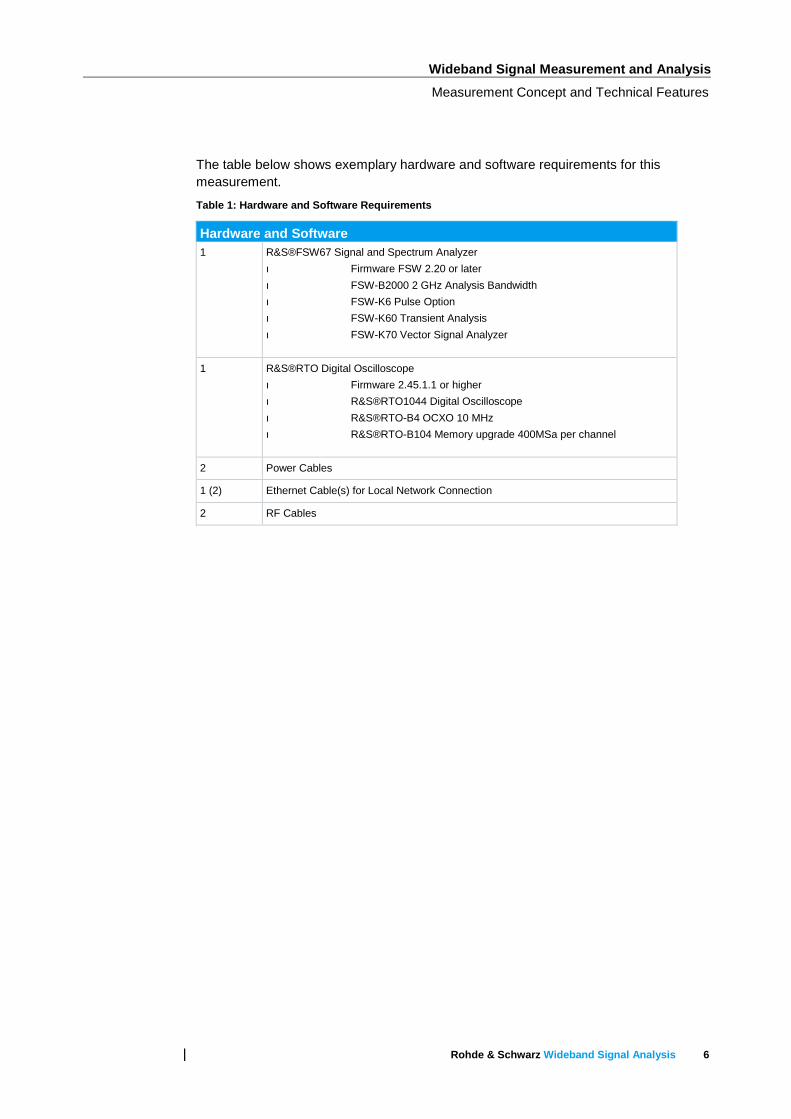
The table below shows exemplary hardware and software requirements for this measurement.
Table 1: Hardware and Software Requirements
Hardware and Software 1 R&S®FSW67 Signal and Spectrum Analyzer
Firmware FSW 2.20 or later ı
FSW-B2000 2 GHz Analysis Bandwidth ı
FSW-K6 Pulse Option ı
FSW-K60 Transient Analysis ı
FSW-K70 Vector Signal Analyzer ı
1 R&S®RTO Digital Oscilloscope
Firmware 2.45.1.1 or higher ı
R&S®RTO1044 Digital Oscilloscope ı
R&S®RTO-B4 OCXO 10 MHz ı
R&S®RTO-B104 Memory upgrade 400MSa per channel ı
2 Power Cables
1 (2) Ethernet Cable(s) for Local Network Connection
2 RF Cables
Measurement Setup
Measurement Concept and Technical Features
Rohde & Schwarz Wideband Signal Analysis 7
3 Measurement Setup The measurement principle is depicted in Figure 3 and Figure 4.
While the device under test (DUT) is connected to the RF (Radio Frequency) input of the R&S FSW Signal and Spectrum Analyzer (FSW), the R&S RTO Digital Oscilloscope is connected to the wideband IF output on the backside of the FSW.
Either all instruments are connected to the local network, or the oscilloscope is connected to the FSW.
The 10 MHz Reference is connected with the FSW as master.
Figure 3: Measurement Setup with RTO Rear Panel
Figure 4: Measurement Setup with FSW Rear Panel (op tional external Trigger in CH2)
LAN
REF IN REF OUT RF IN
IF CH1
REF IN REF OUT
LAN
IF CH1
Measurement Setup
Connection Setup
Rohde & Schwarz Wideband Signal Analysis 8
3.1 Connection Setup
This section will guide you through the B2000 setup and alignment.
► Connect both the RTO and the FSW to your local network or via direct Ethernet connection.
► Connect the FSW 10 MHz Reference OUT to the RTO 10 MHz Reference IN
NOTE: You do not need to connect the FSW IF OUT to RTO CH1 at this moment. You will connect it after the alignment.
Before connecting the IF output of the FSW to the RTO Channel 1 input as depicted above, the FSW-RTO has to be configured and aligned in the software.
Therefore, note the IP address of your RTO oscilloscope by pressing “Setup”. The IP address can be found in the defined field as shown in the figure below.
Setup: System
Note the RTO IP Address or Computer Name (here it is): 169.254.245.127
Figure 5: RTO Setup
Now change to the FSW Signal and Spectrum Analyzer.
The wideband analysis has to be activated and setup as INPUT/OUTPUT of the FSW and is available in the following options: IQ Analyzer, Pulse Measurements K6, Transient Analysis K60, and Vector Signal Analysis K70. The setup procedure outlined below applies to all options supporting B2000.
Initially, we set up the B2000 using the IQ Analyzer by pressing MODE and selecting the IQ Analyzer. Select the B2000 as an Input Source.
1
1
2
2
Measurement Setup
Alignment
Rohde & Schwarz Wideband Signal Analysis 9
INPUT/OUTPUT: Input Source Config: B2000
Insert the IP address or name of the RTO into the TCPIP address field as depicted below. For your convenience, please select “123” in case of an IP address and “ABC” in case of a name.
169.254.245.127 (in this case)
Enable the B2000.
On
Figure 6: B2000 Input
As shown in Figure 6, the connection status and the calibration status are indicated in the B2000 settings tab. If the connection status is green it indicates a successful connection to the RTO. The calibration status is actually drawn in red and shows an uncalibrated RTO-FSW setup.
It is therefore necessary to start the alignment and calibrate the RTO-FSW connection.
3.2 Alignment
The alignment is done only once per RTO and takes only some seconds to finish. A wizard will guide you through the entire process and stores calibration files automatically on the RTO hard disk. This enables different RTOs to be used with a single FSW.
Change to the “Alignment” tab.
Connect the RTO Channel 1 to the REF OUT 640 MHz connector at the rear side of the FSW as depicted in Fig.6.
1
2 3
2
1
3
Indicates the FSW-RTO connection status
Indicates the calibration status
1
Measurement Setup
Alignment
Rohde & Schwarz Wideband Signal Analysis 10
Press “Alignment”
Figure 7: Alignment Process (1)
The wizard will guide you through a second IF cable reconnection where you connect the RTO Channel 1 to the B2000 Alignment Signal Source.
Press “Continue Alignment”
Figure 8: Alignment Process (2)
1
2
2
3
3
4
4
Measurement Setup
Alignment
Rohde & Schwarz Wideband Signal Analysis 11
The alignment succeeded and you can reconnect the RTO Channel 1 back to the IF Output.
Press Continue to finish the wizard.
Figure 9: Alignment Process (3)
The B2000 status will show up in green color in the settings tab and display calibration information and calibration time.
Figure 10: Alignment completed
5
6
5
6
Indicates the FSW-RTO connection status
Indicates the calibration status
Wideband Radar Signal Measurements
Measurement Needs
Rohde & Schwarz Wideband Signal Analysis 12
4 Wideband Radar Signal Measurements
Radar systems are characterized in terms of resolution, accuracy and ambiguity for each domain measured.
Range resolution ∆R is described as the minimum difference in range for which two targets can be separated by the radar. In case of two targets which are closer to each other compared to range resolution these targets cannot be resolved as their radar echo signals overlap. Range resolution is determined by the speed of light c and the signal bandwidth B, where higher bandwidth results in a better range resolution.
∆� =�
��
For example:
B =150 MHz yields a range resolution of ∆R = 1m, B =1.5 GHz results in ∆R = 0.1m. These range resolution values already indicate, that automotive radar designers are interested in higher bandwidth, as a high resolution would enhance the performance and allow additional features in the radar sensor, such as classification.
Besides an increased range resolution due to greater bandwidth there is also the possibility for enhanced interference mitigation. Considering the availability of 4 GHz bandwidth in the 79 GHz domain, radar signals of 1 GHz bandwidth may hop to different carrier frequencies within the bandwidth in order to reduce interference with other radar sensors nearby. This is nearly impossible in the narrow-band 24 GHz band, as a single radar signal often already allocates 200 MHz of the spectrum. In order to allow hopping frequency radars it is necessary to implement a sense-and-avoid algorithm, which enables autonomous operation in a complex spectrum environment. The radar sensor would sense the spectrum and in case of a collision or an increased noise floor, jump to a different carrier frequency to continue operation.
In aerospace and defense radar, wideband signals allow for example high resolution images by Synthetic Aperture Radar (SAR). Also pulsed hopping signals over a wide frequency range are used since a long time, to undertake Electronic Counter- Counter Measures (ECCM). Besides this, increasing multi-purpose radar capabilities of state of the art radars, with search and track, SAR mapping, communication and weather radar functionalities need great bandwidth to accomplish all tasks.
While active electronically scanned arrays are one key parameter to achieve these functionalities, bandwidth is a second one.
4.1 Measurement Needs
In radar, one would distinguish between pulsed and continuous wave (e.g. frequency modulated continuous wave (FMCW)) radar signals.
For long range surveillance radars, pulsed signals are common. In the automotive radar or short range measurements (e.g. altimeters), continuous wave signals are the choice, as for example the minimum detectable range needs to be very close to the radar.
Wideband Radar Signal Measurements
Measurement Needs
Rohde & Schwarz Wideband Signal Analysis 13
Both signal types require certain measurement methods. This is the reason, why there are a Pulse Analysis Option (FSW-K6) and a Transient Analysis Option (FSW-K60) available.
The Pulse Analysis allows detecting and measuring pulsed signals as short as 2 ns with 2GHz bandwidth (FSW-B2000).
Some example measurement needs are depicted in
Figure 11. In Addition to the rise and fall time, on time, overshoot, ripple or droop are for the analysis of a single pulse of interest.
Figure 11: Pulse Analysis
Typically a radar engineer measures these parameters using marker functionality. This takes a long time, especially when multiple pulses have to be analyzed. Therefore, the pulse analysis option has been developed which allows a fully automated analysis within a short time.
Detailed measurements using the FSW-K6 option are described in the following chapter.
The transient option (FSW-K60) allows to measure continuous signals as short as 12 ns (Hop dwell time) or chirps with a minimum length of 130 ns when using the FSW-B2000 2GHz bandwidth.
Compared to a pulse, a continuous wave signal has many similar measurement needs. However, there is one parameter, which is very important for frequency modulated continuous wave signals: the deviation from the defined linear slope (frequency linearity).
The frequency linearity influences the accuracy and resolution of the radar sensor, as the measured frequency offset (beat frequency) of a radar echo signal (down-converted by the instantaneous transmit frequency) will become less accurate (see Application Note 1EF88 [2] for more details).
f(t)
t
Overshoot, Ripple, Droop
Rise Time
On Time
Fall Time
Wideband Radar Signal Measurements
Pulse Analysis
Rohde & Schwarz Wideband Signal Analysis 14
Figure 12: Transient Analysis
4.2 Pulse Analysis
The R&S FSW-K6 is a firmware application that adds functionality to perform measurements on pulsed signals, frequently used for example in radar applications. To mention some features:
Measurement of basic and advances pulse characteristics (inter- and intra-pulse) ı
Analysis of parameter trends over time, short and long term statistics ı
Display of amplitude, frequency and phase measurement traces for individual ıpulses
Remote control operation ı
A brief overview and some wideband signal measurements are addressed in this application note. However the entire functionality is not discussed, but can be reviewed in the R&S FSW User Manual. The latest version is available for download at the product homepage [4].
f(t)
t
Switching Time
Deviation from the defined slope
Bandwidth? Repeatability and Stability in different conditions?
Wideband Radar Signal Measurements
Pulse Analysis
Rohde & Schwarz Wideband Signal Analysis 15
Select the Pulse Option in the FSW.
MODE: Pulse
Figure 13
Set the radio frequency and bandwidth according to your needs. In this example, 2GHz wide pulses in X-band are measured.
FREQ: 10 GHz
BW: Bandwidth Config: Flat: 2 GHz
Figure 14 Acquisition / Detection dialogue
The measurement application will automatically detect the pulses inside the signal at the defined radio frequency. Each detected pulse within the measurement time is marked with a green bar below the pulse. The selected pulse is marked with a blue bar. The intra-pulse frequency, amplitude and phase (standard settings) of this selected pulse are displayed.
1
1
2
2
Wideband Radar Signal Measurements
Pulse Analysis
Rohde & Schwarz Wideband Signal Analysis 16
Figure 15: Typical measurement display of the K6 pu lse measurement application
As shown in Figure 15, the top left corner displays the magnitude capture with duration of 350µs measurement time. The display next to this on the right shows the pulse results. In this measurement a number of 111 pulses (see ID column in the table) have been captured and analyzed.
The pulse results table is widely configurable to display dozens of different pulse parameters.
The lower three displays show the intra-pulse characteristics of the first pulse as indicated in the headline of the display (1). Within the selected pulse there is a frequency modulation using 2 GHz bandwidth.
4.2.1 Measurement Time
The measurement time of 350 µs (standard value) is changed. To extend the measurement duration select “meas time” from the sweep menu.
SWEEP: Meas Time: 5 ms
In this example 5 ms measurement duration is chosen. The measurement is executed again. Figure 16 shows the result with extended measurement duration. The number of captured pulses increased.
To step through these different pulses for detailed intra-pulse analysis, select “Selected Pulse” from the meas menu.
MEAS: Selected Pulse – select the pulse number
3
Selected pulse
Measurement displays “Magnitude Capture“ and “Pulse Frequency”
Wideband Radar Signal Measurements
Pulse Analysis
Rohde & Schwarz Wideband Signal Analysis 17
NOTE: Although a different pulse may be selected, the measurement does not need to be executed again. The temporarily stored IQ data will be reused for analysis and update of all measurement displays.
Figure 16: Extended measurement duration
4.2.2 Pulse Detection
In Figure 15 and Figure 16 the pulse detection threshold is depicted in the “magnitude capture” display and was automatically set to -10 dB below the reference level. There may be different needs in your measurement. To set the pulse detection threshold, select “Detection” from the measurement menu.
MEAS: Pulse Detection
In Figure 17 the reference level is set to “peak” with a threshold of -10 dB. You can change the reference level (Reference, Peak, Noise, Absolute) and configure this to your needs.
4
3
Wideband Radar Signal Measurements
Pulse Analysis
Rohde & Schwarz Wideband Signal Analysis 18
Figure 17: Pulse Detection
4.2.3 Pulse Measurement Settings
The standard settings for the pulse parameters measurements are depicted in Figure 18. A pulse rise time may for example be defined by 10/90 (“low: rise = 10%” and “high: rise=90%”). Others may define this by 20/80. It is therefore possible to change the automatic measurement levels.
MEAS: Pulse Meas
Figure 18: Pulse Measurement Settings
In the second tab “Meas Point” it is possible to define the reference point or an averaging window in which the pulse measurement is performed.
4
5
5
Wideband Radar Signal Measurements
Pulse Analysis
Rohde & Schwarz Wideband Signal Analysis 19
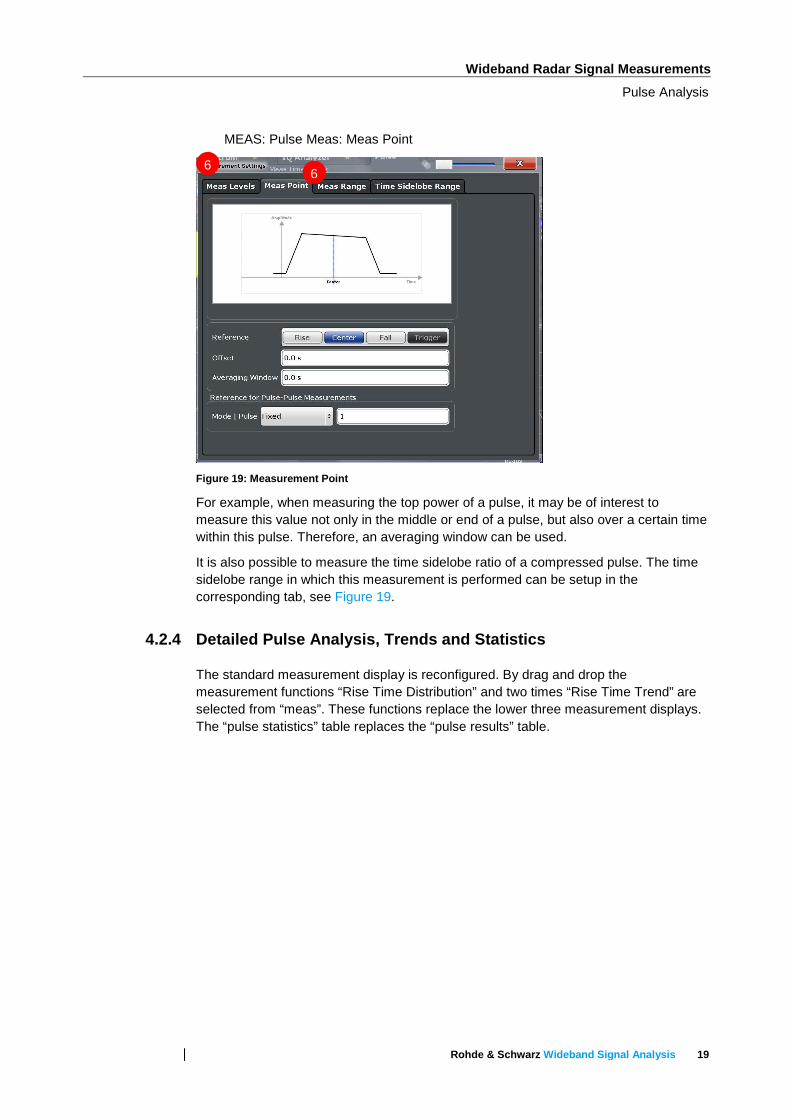
MEAS: Pulse Meas: Meas Point
Figure 19: Measurement Point
For example, when measuring the top power of a pulse, it may be of interest to measure this value not only in the middle or end of a pulse, but also over a certain time within this pulse. Therefore, an averaging window can be used.
It is also possible to measure the time sidelobe ratio of a compressed pulse. The time sidelobe range in which this measurement is performed can be setup in the corresponding tab, see Figure 19.
4.2.4 Detailed Pulse Analysis, Trends and Statistic s
The standard measurement display is reconfigured. By drag and drop the measurement functions “Rise Time Distribution” and two times “Rise Time Trend” are selected from “meas”. These functions replace the lower three measurement displays. The “pulse statistics” table replaces the “pulse results” table.
6 6
Wideband Radar Signal Measurements
Pulse Analysis
Rohde & Schwarz Wideband Signal Analysis 20
Figure 20: Reconfiguration of the measurement displ ay
With the buffered IQ data, the measurement results are calculated and depicted.
The pulse statistics are calculated for the captured pulses within the measurement time (green) and accumulated when the measurement runs continuously (black). In this example, the table is configured to show the statistics of “rise time”, “pulse width”, “PRI” and “Freq”. This table can be reconfigured to your needs by the “Table Config” menu.
MEAS: Result Config -> Table Config
The “rise time trend” displays show the rise time (y-axis) over the pulse (x-axis). As we selected this display twice, the second one will be selected and reconfigured to display a different parameter over time.
Select the result configuration from the measurement display. Then select the parameter tab and change the trend according to your needs.
MEAS: Result Config -> Parameter
Pulse statistics from all pulses within the meas time (5ms)
Accumulated statistics from all pulses ever captured (e.g. within hours or days timeframe)
7
Wideband Radar Signal Measurements
Pulse Analysis
Rohde & Schwarz Wideband Signal Analysis 21
Figure 21: Parameter Configuration
In this example, the “Top Power” is chosen from the “Power” parameter group to be represented on the y-axis. The x-axis will show the pulse number.
Top Power
Pulse Number
This measurement display will automatically refresh and display the results without the need of executing the measurement again.
Figure 22 displays the result which is not “Top Power Trend”.
Figure 22: Measurement display
7
8
9
8
9
Wideband Radar Signal Measurements
Continuous Wave Signal Analysis
Rohde & Schwarz Wideband Signal Analysis 22
4.3 Continuous Wave Signal Analysis
In the EU there is a narrow band 24 GHz frequency allocation and a wideband frequency allocation for ultra-low power radars available. The 24 GHz allocation is being phased out in Europe 2022 and all short range radar will migrate to the 77-81 GHz band (reference 79 GHz) by 2018, [3]. This will end the interim solution of 24 GHz radar sensors being used for early contribution of road safety.
The 79 GHz band will offer significant advantages. There will not be any frequency restriction in time or device quantity, it will offer up to 4 GHz of bandwidth and therefore enhance the technical capabilities of a radar. For example, a combined long range and short range operation could be utilized, the physical size of the radar will be reduced or interference mitigation can be addressed. All this will give significant design advantages and security features for automotive manufacturer.
4.3.1 Measurement Example
For analysis and verification of continuous wave radar signals, the FSW-K60 Transient Measurement Application has been developed. For a detailed description of this option, please see Application Note 1EF88 [4].
This option makes it possible to characterize chirp or hopping signals (with their linear frequency ramps and large bandwidths) according to important parameters such as chirp rate, chirp length and chirp rate deviation. Results are displayed in various charts and a straightforward table. Additional statistical evaluations make it easier to conduct extended period signal stability measurements and to detect outliers.
In this document, a chirp sequence signal with a duration of 100 µs per chirp and 1.8 GHz bandwidth is measured. The signal is present at a frequency of 10 GHz.
The transient analysis is started and configured to 10 GHz with a bandwidth of 2 GHz.
MODE: Transient Analysis
Figure 23: Transient Analysis
1
1
Wideband Radar Signal Measurements
Continuous Wave Signal Analysis
Rohde & Schwarz Wideband Signal Analysis 23
FREQ: 10 GHz
INPUT: B2000
BW: 2 GHz
The measurement duration is set to 500 µs to capture at least 4 chirp signals.
MEAS: Meas Time: 500 µs
The measurement result is depicted in Figure 24. Four chirp signals with linear decreasing frequency modulation are captured and measured. The blue bar indicates the selected chirp, which “frequency deviation” over time is analyzed.
The chirp results table of the entire capture is displayed at the bottom. It can be seen from the chirp rate (kHz/µs) and chirp length (ms), that this chirp has a bandwidth of 1.8 GHz and 100 µs duration. The frequency deviation of each chirp is the domain of several kHz.
Figure 24: Measurement result of a chirp signal wit h 1.8 GHz instantaneous bandwidth
The transient analysis application behaves similar to the pulse analysis option for your convenience.
A detailed description of the transient analysis including a measurement example can be found in the application note 1EF88 [2]. The application note 1EF88 describes the measurement of an FMCW radar signal in detail.
4.3.2 Wideband Transient Signal Analysis in mmWave
A signal at 77 GHz with a bandwidth of 960 MHz is measured using the transient analysis option.
2
3
4
5
The selected chirp is marked in blue.
Wideband Radar Signal Measurements
Continuous Wave Signal Analysis
Rohde & Schwarz Wideband Signal Analysis 24
Figure 25: Transient Analysis at 77GHz
Wideband Mobile Communication Signal Measurements
Measurement Needs
Rohde & Schwarz Wideband Signal Analysis 25
5 Wideband Mobile Communication Signal
Measurements
Increasing data rates required for wireless HD video streaming or other applications drive for example the WLAN standard to cover wider bandwidth. WLAN 802.11ad specified to cover very high throughput (6.75 Gbps) [4] and short-range transmissions of only a few meters uses a symbol rate of 1.76 GHz and works in the frequency range from 57 GHz to 66 GHz.
Also for beyond 4G cellular networks, referred to as fifth generation (5G), the frequency bandwidth of a single carrier will most likely be significantly wider than the 20 MHz that are used by a single LTE carrier as of today.
Spectral measurements, like adjacent channel leakage ratio (ACLR), spectrum emission masks (SEM) or spurious search can be done with classical spectrum analyzers, as they do not require a high analysis bandwidth. When it comes to measurements of the modulation quality, like error vector magnitude (EVM) an analysis bandwidth that covers the full signal bandwidth is required.
This section describes how single-carrier signals with up to 2 GHz bandwidth in the V-band can be analyzed and characterized in terms of their modulation quality. The example measurements are mainly done based on WLAN 802.11ad specifications. Alternative signals up to 2GHz bandwidth can equally be measured adapting the relevant parameters according to the applied signal (see section 5.2.3).
5.1 Measurement Needs
In order to fully characterize digitally modulated signals, a signal demodulation on the physical layer is required. Key parameters are the error vector magnitude (EVM) and the bit error rate, which however does not provide information on the cause of unexpected behavior.
Further parameters of interest are the carrier frequency error, IQ-offset, IQ-imbalance and quadrature error. An equalizer recovers the channel in terms frequency response and phase deviation, and can help to identify deficiencies in the DUT filter design.
5.2 Vector Signal Analysis
The Vector Signal Analysis option R&S®FSW-K70 enables users to flexibly analyze digitally modulated single carrier signals.
The option supports many different modulation formats from MSK to 4096QAM, an analysis length up to 64 000 symbols and a scalable analysis bandwidth up to 2 GHz. K70 further includes an automatic burst detection, a pattern search and a versatile equalizer.
Wideband Mobile Communication Signal Measurements
Vector Signal Analysis
Rohde & Schwarz Wideband Signal Analysis 26
5.2.1 K70 Setup
A zip-file can be downloaded from the 1EF92 application note webpage containing all relevant files to set up K70. The following files are contained:
ı 802_11ad_SCPHY_MCSxxx.xml:
▪ To simplify the setup of K70 for 802.11ad signals 3 configuration files are provided.
▪ Copy the files to C:\R_S\Instr\user\vsa\Standards
ı PI2_xxx.vam:
▪ 3 modulation format files that contain pi/2-rotated modulations as well as mixed BPSK/QPSK and BPSK/16QAM modulations.
▪ Copy the files to C:\R_S\Instr\user\vsa\Constellation
ı Pattern_CEF_SC_xxx.xml:
▪ Bit patterns of the Channel Estimation Field (CEF). Can be used for synchronization and equalization on the CEF only.
▪ Copy the files to C:\R_S\Instr\user\vsa\Pattern
The steps below describe the K70 setup.
MODE: VSA
Alike explained in Section 4, select the B2000 input as a source. Configure and align as described in Section 3.
INPUT/OUTPUT: Input Source Config: B2000
Set the frequency to your desired value. For example 802.11ad channel 2 at 60.48GHz can be used.
FREQ: 60.48 GHz
Load an 802.11ad preset depending on the modulation format.
MEAS: Digital Standards
There are 3 files, each covering a different modulation.
Figure 26: Loading 802.11ad configuration files fro m Digital Standards dialogue
Adjust the Reference Level so that it matches the input signal’s level. The Reference Level should be set as low as possible so that no IF overload appears. This guarantees that the dynamic range is at its maximum. For low input levels the preamplifier (B24) should be activated (see Figure 27).
Figure 27: Activating Preamplifier in Input/Fronten d dialogue
After successful burst detection the Result Range must be adapted so that it doesn’t extend beyond the burst end. Insert an appropriate offset value for not measuring the preamble (Figure 28).
5
6
Wideband Mobile Communication Signal Measurements
Vector Signal Analysis
Rohde & Schwarz Wideband Signal Analysis 28
Figure 28: Result range settings
For an analysis of the complete burst set the Result Range to the estimated burst length from the burst detection result. This can be found in the Burst/Pattern Detection dialogue (see Figure 29).
Figure 29: Burst/Pattern Detection dialogue
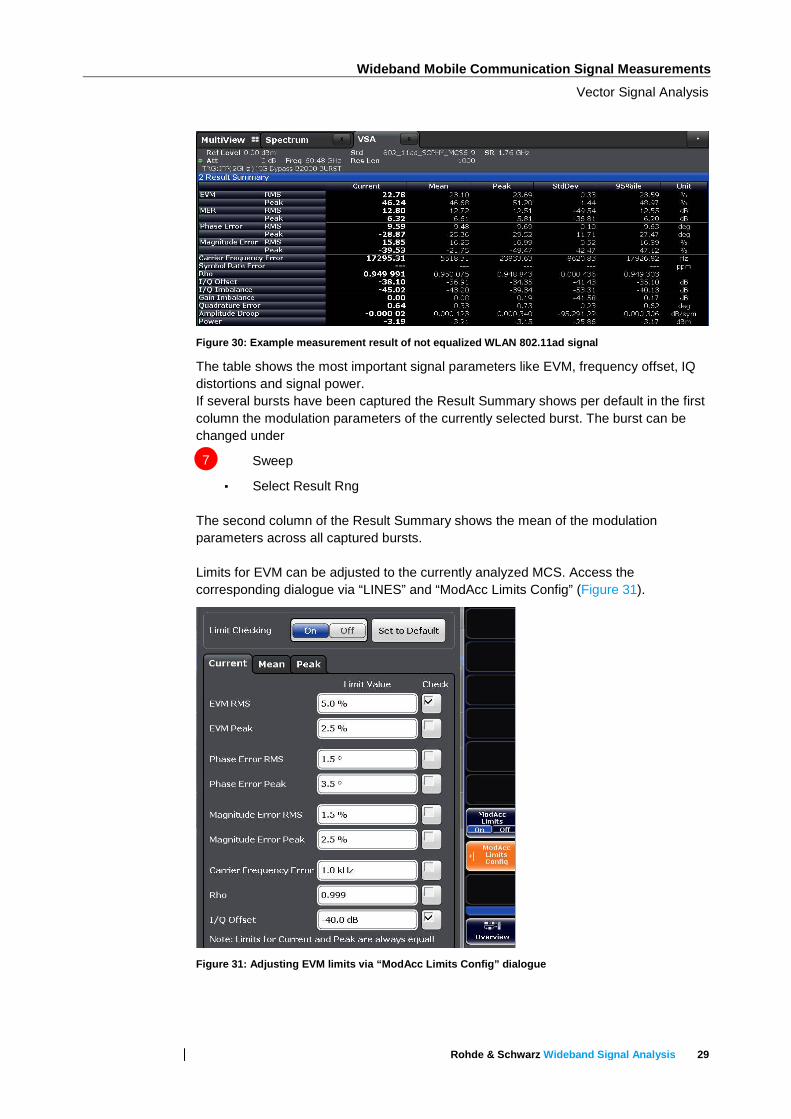
Analysis of the successfully demodulated signal is now possible. Figure 30 shows an example result of a not equalized signal at 60.48GHz.
Wideband Mobile Communication Signal Measurements
Vector Signal Analysis
Rohde & Schwarz Wideband Signal Analysis 29
Figure 30: Example measurement result of not equali zed WLAN 802.11ad signal
The table shows the most important signal parameters like EVM, frequency offset, IQ distortions and signal power. If several bursts have been captured the Result Summary shows per default in the first column the modulation parameters of the currently selected burst. The burst can be changed under
Sweep
▪ Select Result Rng The second column of the Result Summary shows the mean of the modulation parameters across all captured bursts. Limits for EVM can be adjusted to the currently analyzed MCS. Access the corresponding dialogue via “LINES” and “ModAcc Limits Config” (Figure 31).
Figure 31: Adjusting EVM limits via “ModAcc Limits Config” dialogue
7
Wideband Mobile Communication Signal Measurements
Vector Signal Analysis
Rohde & Schwarz Wideband Signal Analysis 30
5.2.2 Equalization
The IEEE 802.11ad specification [4] mandates the equalization of the payload data prior to EVM calculation. The equalizer is activated by (Figure 32):
Demod/Meas Filter ı
▪ Equalizer state ON
Figure 32: Equalizer configuration
To improve the adaptivity of the equalizer the Filter Length can be increased. Choose the display Equalizer to see the Frequency Response. In the tab Window Config the display can be changed to the Phase or Group Delay Response (Figure 33).
8
Wideband Mobile Communication Signal Measurements
Vector Signal Analysis
Rohde & Schwarz Wideband Signal Analysis 31
Figure 33: Equalizer configuration – Result Type
To estimate and compensate a Symbol Clock Offset active the checkbox Symbol Rate Error in the menu Demod/Meas Filter (Figure 32). The Result Summary table will give an indication of the measured offset. 802.11ad signals must not exceed a value of ± 20ppm. Figure 34 shows a WLAN 802.11ad measurement example of an equalized signal at 60.48GHz.
Figure 34: Example measurement result of equalized WLAN 802.11ad signal
Wideband Mobile Communication Signal Measurements
Vector Signal Analysis
Rohde & Schwarz Wideband Signal Analysis 32
5.2.3 Additional measurement on arbitrary wideband signals
As mentioned different than WLAN 802.11ad demodulation measurements are possible by adjusting measurement parameters to the applied signal (see example in Figure 35). The configuration parameters allow to adjust the settings in terms of different modulation types (PSK, MSK, QAM, FSK, ASK, APSK or user defined), Order (from 16QAM to 4096QAM), different mappings (e.g. gray or natural), symbol rate and transmit filter settings (standard like RC or RRC or user defined).
Figure 35: Signal description configuration
Figure 36 shows the demodulation of a 16QAM signal with 1.8 GHz symbol rate at a center frequency of 9 GHz. With the equalizer-function of the measurement application, an EVM value of 2 % is measured. The measurement application for vector signal analysis offers many functions for in-depth digital signal analysis. The result summary table displays EVM, phase error, magnitude error, carrier frequency error, symbol rate error and constellation distortion values. The display of the equalizer function helps to detect effects of a non-equalized frequency response or filter mismatches of the device under test.
Figure 36: EVM Measurement of exemplary 16QAM signa l
Wideband Mobile Communication Signal Measurements
Vector Signal Analysis
Rohde & Schwarz Wideband Signal Analysis 33
5.2.4 Limitations
The FSW-K70 currently supports bursts with a length up to 32000 symbols. The Capture Buffer is limited to 64000 symbols. If longer bursts need to be analyzed K70 Burst Search can be switched off. Instead an IF Power trigger can be used to align the burst start with the beginning of the capture buffer. The Result Range will then start at the 1st symbol of the Capture Buffer. The Result Range can then cover the complete Capture Buffer of 64000 symbols (Figure 37).
Figure 37: Result range settings to cover complete capture buffer
Phase noise can be quite high at 60GHz causing problems for the analysis. K70 will correct for an average phase offset within the Result Range. Deviations from this average within the evaluation range will cause symbols to rotate away from their ideal positions. Since phase noise is likely to vary in short time scales significant deviations from the average phase offset can be expected. To limit the effects of phase noise it is advisable to divide the captured burst into several shorter Result Ranges. Each sub-range can adapt better to the local phase offset. The mean EVM shown in the Result Summary table is then an average of all sub-ranges.
5.2.5 Spectrum Emission Mask Measurements
While digital modulation analysis is required to optimize the signal for better reception, the principal reason for spectral measurements is to reduce interference on neighboring channels or even on different radio frequency bands. Spectrum emission mask measurements (SEM) define the maximum level of spurious emissions in close
Wideband Mobile Communication Signal Measurements
Vector Signal Analysis
Rohde & Schwarz Wideband Signal Analysis 34
vicinity to the carrier frequency. National regulators or standardization bodies such as 3GPP usually define these limits.
As an example for a wideband communication signal in the E-Band, Figure 38 shows the spectrum emission mask of a wireless LAN signal according to IEEE 802.11ad. Even though IEEE 802.11ad works in the 60 GHz ISM band, IEEE has defined SEMs in order to reduce interference on neighboring 11ad carriers.
Figure 38: Spectrum Emission Mask measurement of an 802.11ad signal
Literature
Vector Signal Analysis
Rohde & Schwarz Wideband Signal Analysis 35
6 Literature
[1] Rohde & Schwarz Application Note Automated Measurements of 77 GHz FMCW Radar Signals. - www.rohde-schwarz.com/appnote/1EF88 : [s.n.], April, 2014.
[2] 79 GHz EU Project. – retrieved from www.79ghz.eu, March, 2015.
[3] Rohde & Schwarz, FSW Signal and Spectrum Analyzer Manual, www.rohde-schwarz.com/product/FSW.html
[4] IEEE Std 802.11TM-2012, "Wireless LAN MAC and PHY Specifications, Amendment 3: Enhancements for Very High Throughput in the 60 GHz Band" [Online]. Available: http://standards.ieee.org/getieee802/download/802.11ad-2012.pdf
*) For R&S®FSW43, R&S®FSW50 and R&S®FSW67. R&S®FSW26 requires the variant 1325.4750.26 of the R&S®FSW-B2000.
The R&S®FSW-B2000 does not require any other R&S®FSW option as pre-requisite. It can be installed on top of an R&S®FSW-B28,
R&S®FSW-B40, R&S®FSW-B80, R&S®FSW-B160/320 or R&S®FSW-B500 option.
About Rohde & Schwarz
The Rohde & Schwarz electronics group is a leading supplier of solutions in the fields of test and measurement, broadcasting, secure communications, and radiomonitoring and radiolocation. Founded more than 80 years ago, this independent global company has an extensive sales network and is present in more than 70 countries. The company is headquartered in Munich, Germany.
This application note and the supplied programs may only be used subject to the conditions of use set forth in the download area of the Rohde & Schwarz website.
Rohde & Schwarz GmbH & Co. KG Mühldorfstraße 15 | D - 81671 München Phone + 49 89 4129 - 0 | Fax + 49 89 4129 – 13777 www.rohde-schwarz.com