FINANCIAL STATEMENTS ANNOUNCEMENT FOR THE HALF YEAR ENDED 30 JUNE 2021 The Directors of ESR Funds Management (S) Limited (“ESR-FM”), as manager of ESR-REIT (the “Manager”), are pleased to announce the unaudited financial results of ESR-REIT and its subsidiaries (the “Group”) for the half year ended 30 June 2021 (“1H2021”). ESR-REIT (the “Trust”) is a Singapore-domiciled unit trust constituted pursuant to the trust deed dated 31 March 2006 (as amended) entered into between ESR-FM as the Manager and RBC Investor Services Trust Singapore Limited as the trustee (the “Trustee”), and is governed by the laws of the Republic of Singapore (“Trust Deed”). On 31 March 2006, ESR-REIT was declared as an authorised unit trust scheme under the Trustees Act, Chapter 337. The Trustee is under a duty to take into custody and hold the assets of the Group in trust for the holders (“Unitholders”) of units in the Trust (“Units”). On 25 July 2006, ESR-REIT was admitted to the Official List of Singapore Exchange Securities Trading Limited (“SGX-ST”). On 3 April 2006, ESR-REIT was included under the Central Provident Fund (“CPF”) Investment Scheme. The principal activity of ESR-REIT is to invest in a diversified portfolio of industrial properties with the primary objective of achieving an attractive level of return from rental income and long-term capital growth. ESR-REIT’s distribution policy is to distribute at least 90% of its annual distributable income comprising income from letting of its properties after deduction of allowable expenses. The actual level of distribution will be determined at the Manager’s discretion. On 6 May 2021, ESR-REIT launched an equity fund raising comprising a private placement and a non- renounceable preferential offering to raise gross proceeds of up to approximately S$150.0 million. On 18 May 2021, ESR-REIT completed the private placement of approximately 268.8 million new Units to raise gross proceeds of approximately S$100.0 million (the “Private Placement”). The Manager will announce details of the non-renounceable preferential offering to raise gross proceeds of up to approximately S$50.0 million (the “Preferential Offering”) at the appropriate time. On 14 May 2021, ESR-REIT completed the acquisition of 10.0% of the total issued units in ESR Australia Logistics Partnership (“EALP”). EALP is a private fund managed by ESR Asset Management (Australia) Pty Ltd, an indirect subsidiary of ESR Cayman Limited, and it owns 33 income-producing properties, two land parcels for future development and another two properties which are currently under development. Collectively, the 37 prime logistics assets are located in core industrial markets of New South Wales, Victoria, Queensland, South Australia and Western Australia. On 29 June 2021, ESR-REIT completed the acquisition of its sixth modern ramp-up logistics property, located at 46A Tanjong Penjuru, Singapore 609040, and has a total of 12 logistics properties. As at 30 June 2021, the Group holds interest in a diversified portfolio of 58 properties (including 48 Pandan Road held through a joint venture) located across Singapore with a diversified tenant base of 360 tenants across the following sub sectors: business park, high-specs industrial, logistics/warehouse and general industrial.
Transcript
FINANCIAL STATEMENTS ANNOUNCEMENT FOR THE HALF YEAR ENDED 30 JUNE 2021 The Directors of ESR Funds Management (S) Limited (“ESR-FM”), as manager of ESR-REIT (the “Manager”), are pleased to announce the unaudited financial results of ESR-REIT and its subsidiaries (the “Group”) for the half year ended 30 June 2021 (“1H2021”). ESR-REIT (the “Trust”) is a Singapore-domiciled unit trust constituted pursuant to the trust deed dated 31 March 2006 (as amended) entered into between ESR-FM as the Manager and RBC Investor Services Trust Singapore Limited as the trustee (the “Trustee”), and is governed by the laws of the Republic of Singapore (“Trust Deed”). On 31 March 2006, ESR-REIT was declared as an authorised unit trust scheme under the Trustees Act, Chapter 337. The Trustee is under a duty to take into custody and hold the assets of the Group in trust for the holders (“Unitholders”) of units in the Trust (“Units”). On 25 July 2006, ESR-REIT was admitted to the Official List of Singapore Exchange Securities Trading Limited (“SGX-ST”). On 3 April 2006, ESR-REIT was included under the Central Provident Fund (“CPF”) Investment Scheme. The principal activity of ESR-REIT is to invest in a diversified portfolio of industrial properties with the primary objective of achieving an attractive level of return from rental income and long-term capital growth. ESR-REIT’s distribution policy is to distribute at least 90% of its annual distributable income comprising income from letting of its properties after deduction of allowable expenses. The actual level of distribution will be determined at the Manager’s discretion. On 6 May 2021, ESR-REIT launched an equity fund raising comprising a private placement and a non-renounceable preferential offering to raise gross proceeds of up to approximately S$150.0 million. On 18 May 2021, ESR-REIT completed the private placement of approximately 268.8 million new Units to raise gross proceeds of approximately S$100.0 million (the “Private Placement”). The Manager will announce details of the non-renounceable preferential offering to raise gross proceeds of up to approximately S$50.0 million (the “Preferential Offering”) at the appropriate time. On 14 May 2021, ESR-REIT completed the acquisition of 10.0% of the total issued units in ESR Australia Logistics Partnership (“EALP”). EALP is a private fund managed by ESR Asset Management (Australia) Pty Ltd, an indirect subsidiary of ESR Cayman Limited, and it owns 33 income-producing properties, two land parcels for future development and another two properties which are currently under development. Collectively, the 37 prime logistics assets are located in core industrial markets of New South Wales, Victoria, Queensland, South Australia and Western Australia. On 29 June 2021, ESR-REIT completed the acquisition of its sixth modern ramp-up logistics property, located at 46A Tanjong Penjuru, Singapore 609040, and has a total of 12 logistics properties. As at 30 June 2021, the Group holds interest in a diversified portfolio of 58 properties (including 48 Pandan Road held through a joint venture) located across Singapore with a diversified tenant base of 360 tenants across the following sub sectors: business park, high-specs industrial, logistics/warehouse and general industrial.
ESR-REIT FINANCIAL STATEMENTS ANNOUNCEMENT FOR THE HALF YEAR ENDED 30 JUNE 2021
2
Summary of the Group’s Results
Breakdown of distributable amount available per unit by quarter
Breakdown of distribution per unit (“DPU”) paid / payable by quarter
Note: (1) The 1Q2020 DPU excluded 0.197 cents equivalent to about S$7.0 million of distributable income (the
“Retained Distribution”), which was retained for prudent cash flow management in view of COVID-19 uncertainties. The Retained Distribution was subsequently distributed to Unitholders as part of the 3Q2020 and 4Q2020 distributions.
1H2021 1H2020 Fav/(Unfav)S$'000 S$'000 %
Gross revenue 119,840 113,754 5.4Net property income 86,967 80,228 8.4
Amount available for distribution 56,778 47,829 18.7- Taxable income 56,778 47,829 18.7
Distributable amount available per unit (cents) 1.554 1.359 14.3- Taxable income 1.554 1.359 14.3
2021 2020 Fav/(Unfav)cents cents %
For the first quarter ended 31 March 0.800 0.697 14.8For the second quarter ended 30 June 0.754 0.662 13.9
For the half year ended 30 June 1.554 1.359 14.3
2021 2020 Fav/(Unfav)Note cents cents %
For the first quarter ended 31 March (1) 0.800 0.500 60.0For the second quarter ended 30 June 0.754 0.662 13.9
For the half year ended 30 June 1.554 1.162 33.7
ESR-REIT FINANCIAL STATEMENTS ANNOUNCEMENT FOR THE HALF YEAR ENDED 30 JUNE 2021
3
Total Distribution for 2Q2021
(1) An Advanced Distribution of 0.410 cents per unit for the period from 1 April 2021 to 17 May 2021 has been paid on 17 June 2021.
Details of the Remaining Distribution for 2Q2021
The Manager has determined that the distribution reinvestment plan (“DRP”) will not apply to the distribution for the period from 18 May 2021 to 30 June 2021.
Advanced
Distribution(1)
Remaining Distribution
Total Distribution
Distribution Period 1 April 2021 to
17 May 2021
18 May 2021to
30 June 2021
2Q2021
S$'000 S$'000 S$'000Net income available for distribution 14,723 13,334 28,057
Applicable number of units ('000) 3,591,126 3,877,237 3,721,322
DPU (cents) 0.410 0.344 0.754
Distribution period 18 May 2021 to 30 June 2021
Distribution rate 0.344 cents per unit
Record date To be announced at a later date
Payment date To be announced at a later date
ESR-REIT FINANCIAL STATEMENTS ANNOUNCEMENT FOR THE HALF YEAR ENDED 30 JUNE 2021
4
1(a) Statement of Total Return, together with comparative statement for the corresponding period of the immediately preceding financial year
n.m. – not meaningful
1H2021 1H2020 Fav/(Unfav)Note S$'000 S$'000 %
Gross revenue 6 119,840 113,754 5.4
Property expenses 7 (32,873) (33,526) 1.9
Net property income 86,967 80,228 8.4
Management fees 8 (7,208) (7,330) 1.7 Trust expenses 9 (1,366) (1,535) 11.0 Interest income 10 10 - Borrowing costs 10 (21,696) (23,441) 7.4 Finance costs on lease liabilities for leasehold land (5,817) (5,722) (1.7)
Net income 50,890 42,210 20.6
Unrealised foreign exchange gain 1 - n.m.Change in fair value of investment at fair value through profit or loss (2,360) - n.m.Change in fair value of financial derivatives 13,899 (22,739) 161.1 Change in fair value of investment properties 3 (2,481) (46,684) 94.7 Change in fair value of right-of-use of leasehold land 3 757 829 (8.7) Share of results of joint venture 3,222 835 285.9
Total return for the period before income tax 63,928 (25,549) 350.2
Income tax 52 (7) 842.9
Total return for the period after income tax 63,980 (25,556) 350.4
Attributable to:Unitholders of the Trust and perpetual securities holders 62,016 (26,642) 332.8 Non-controlling interest 1,964 1,086 80.8 Total return for the period 63,980 (25,556) 350.4
Earnings per Unit (cents)Basic and diluted 1.604 (0.859) 286.7
Distribution per Unit (cents) 1.554 1.359 14.3
Distribution Statement
Total return after income tax, before distribution for the period
62,016 (26,642) 332.8
Distribution adjustments (Note A) (1,816) 77,912 (102.3) 60,200 51,270 17.4
Amount reserved for distribution to perpetual securities holders (3,422) (3,441) 0.6
Net Income available for distribution to Unitholders for the period
56,778 47,829 18.7
Group
ESR-REIT FINANCIAL STATEMENTS ANNOUNCEMENT FOR THE HALF YEAR ENDED 30 JUNE 2021
5
Note A - Distribution adjustments
1H2021 1H2020 Fav/(Unfav)S$'000 S$'000 %
Non-tax deductible/(chargeable) items and other adjustments:Management fees paid/payable in Units 2,910 3,030 (4.0) Property Manager's fees paid/payable in Units 1,415 1,367 3.5 Trustee's fees 268 271 (1.1) Amortisation of transaction costs relating to debt facilities 3,254 2,970 9.6 Unrealised foreign exchange gain (1) - n.m.Change in fair value of investment at fair value through profit or loss 2,360 - n.m.Change in fair value of investment properties 2,481 46,684 (94.7) Change in fair value of financial derivatives (13,899) 22,739 (161.1) Legal and professional fees - 19 (100.0) Adjustment for straight line rent and lease incentives (388) (186) (108.6) Share of results of joint venture (3,222) (835) (285.9) Distributable income from joint venture 2,489 2,349 6.0 Miscellaneous expenses 605 322 87.9 Non-controlling interest share of non-tax deductible items - (818) 100.0 Rollover adjustment from prior years (2) - n.m.Tax exempt income from a subsidiary (86) - n.m.
Net effect of distribution adjustments (1,816) 77,912 (102.3)
Group
ESR-REIT FINANCIAL STATEMENTS ANNOUNCEMENT FOR THE HALF YEAR ENDED 30 JUNE 2021
6
Financial Review of the Statement of Total Return Gross revenue
The Group recorded gross revenue of S$119.8 million in 1H2021, 5.4% higher than 1H2020 mainly due to the absence of provision for COVID-19 rental rebates to tenants in 1H2021 (1H2020: S$4.6 million).
Net property income
Net property income increased by 8.4% to S$87.0 million in 1H2021 due to higher gross revenue, as well as lower property expenses. Lower property expenses in 1H2021 was mainly attributable to (a) lower electricity rates being re-contracted for certain properties, as well as lower consumption of electricity in the common areas; and (b) lower maintenance costs in 1H2021 as more costs were incurred in 1H2020 to implement temperature screening, heightened sanitisation and other safe management measures during the start of the COVID-19 pandemic. The extent of such measures had since been scaled back in accordance with the gradual relaxation of the requirements by the Government.
Trust expenses
Trust expenses comprised statutory expenses, professional fees, compliance costs, listing fees and other non-property related expenses. The lower trust expenses in 1H2021 was mainly due to the absence of certain non-claimable input Goods and Services Tax (“GST”) in 1H2021 as the De Minimis rule under the GST Act was not satisfied in 1H2020.
Borrowing costs
Borrowing costs comprised interest expenses on loans and interest rate swaps, as well as the amortisation of debt related transaction costs. Borrowing costs were 7.4% lower in 1H2021 mainly due to lower average cost of debt during the period. Please refer to Note 4 of the Notes to the Financial Statements Announcement for more details on borrowings.
Lease liabilities and right-of-use of leasehold land
Following the adoption of FRS 116 Leases, lease payments made for land rent are reflected as finance cost on lease liabilities for leasehold land and fair value change of the right-of-use of leasehold land on the Statement of Total Return and as payments for lease liabilities under financing cash flows on the Statement of Cash Flows. The amount of finance costs on lease liabilities for leasehold land net of the change in fair value of right-of-use of leasehold land for 1H2021 increased to S$5.1 million (1H2020: S$4.9 million) mainly due to upward revision in land rent following an annual review of land rent payable.
Change in fair value of investment at fair value through profit or loss
The change in fair value of investment at fair value through profit or loss relates to the fair value changes in the Group’s 10.0% interest in EALP, which was acquired on 14 May 2021. The fair value loss was mainly due to the write-off of the stamp duty and other transaction costs related to its acquisition. Such fair value changes are recognised on the Statement of Total Return but are not tax deductible and therefore, have no impact on distributable income.
ESR-REIT FINANCIAL STATEMENTS ANNOUNCEMENT FOR THE HALF YEAR ENDED 30 JUNE 2021
7
Change in fair value of financial derivatives
The change in fair value of financial derivatives represented the change in fair values of interest rate swaps entered into to hedge against interest rate fluctuations on the floating rate borrowings of the Group. Such fair value changes are recognised on the Statement of Total Return but are not taxable / tax deductible and therefore, have no impact on distributable income.
Change in fair value of investment properties
The change in fair value of investment properties of S$2.5 million in 1H2021 comprised the following:
fair value gains on 11 Serangoon North Avenue 5 and 3C Toh Guan Road East based on their respective selling prices pursuant to the put and call option agreements entered into on 28 April 2021 to divest the 2 properties for approximately S$53.0 million;
fair value loss on 46A Tanjong Penjuru, which was acquired on 29 June 2021, as the stamp duties and other transaction costs related to its acquisition were written off; and
adjustments for straight-line rent and marketing commission for 1H2021.
Such fair value changes are recognised on the Statement of Total Return but are not tax deductible and therefore, have no impact on distributable income.
Share of results of joint venture
Share of results of joint venture relates to the Group’s 49.0% share of the net income of PTC Logistics Hub LLP, which owns 48 Pandan Road.
ESR-REIT FINANCIAL STATEMENTS ANNOUNCEMENT FOR THE HALF YEAR ENDED 30 JUNE 2021
8
1(b) Statements of Financial Position, together with comparatives as at the end of the immediately preceding financial year
Non-current assetsInvestment properties 3 3,201,899 3,119,058 1,619,890 1,551,337 Investments in subsidiaries - - 792,896 792,896 Investment in joint venture 38,750 38,018 38,018 38,018 Investment at fair value through profit or loss 61,541 - 61,541 - Loans to subsidiaries - - 625,500 613,500
3,302,190 3,157,076 3,137,845 2,995,751 Current assetsInvestment properties held for divestment 3 61,025 - 61,025 - Trade and other receivables 15,402 12,216 32,851 23,492 Cash and cash equivalents 13,982 18,101 6,762 8,556
90,409 30,317 100,638 32,048
Total assets 3,392,599 3,187,393 3,238,483 3,027,799
Liabilities
Current liabilitiesTrade and other payables 56,442 62,347 33,513 34,124 Lease liabilities for leasehold land 2,771 2,770 2,771 2,770 Liabilities directly attributable to investment properties held for divestment
Units in issue ('000) 3,877,237 3,576,362 3,877,237 3,576,362
Net asset value per Unit (cents) 39.8 40.5 39.8 40.5
Group Trust
ESR-REIT FINANCIAL STATEMENTS ANNOUNCEMENT FOR THE HALF YEAR ENDED 30 JUNE 2021
9
Financial Review of the Statement of Financial Position
Investment properties
As at 30 June 2021, the total carrying value of investment properties was S$3.2 billion, an increase of S$82.8 million from 31 December 2020. The increase was mainly due to the acquisition of 46A Tanjong Penjuru, which was completed on 29 June 2021, as well as capital expenditure and asset enhancement costs incurred for certain properties. This was partially offset by the reclassification of 2 properties as investment properties held for divestment as further elaborated below.
Lease liabilities and right-of-use of leasehold land
The Group is required to pay land rent, whether annually or on an upfront land premium basis, for properties in its portfolio. Following the adoption of FRS 116 Leases, the Group recognised right-of-use assets and lease liabilities for these land leases previously classified as operating leases. The right-of-use assets were recognised based on the amount equal to the lease liabilities. Lease liabilities were recognised based on the present value of the remaining lease payments, discounted using the incremental borrowing rate at the date of initial application.
Investment in joint venture
Investment in joint venture relates to ESR-REIT’s 49.0% share of the net assets of PTC Logistics Hub LLP, which owns 48 Pandan Road. The Group applies the equity method to account for its interest in the joint venture.
Investment at fair value through profit or loss
Investment at fair value through profit or loss relates to ESR-REIT’s 10.0% interest in EALP, which was acquired on 14 May 2021.
Investment properties held for divestment
Investment properties held for divestment comprise 2 properties, namely 11 Serangoon North Avenue 5 and 3C Toh Guan Road East, for which put and call option agreements have been entered into on 28 April 2021 to divest them for approximately S$53.0 million.
Trade and other receivables
Trade and other receivables increased by S$3.2 million mainly due to deposits received for the on-going divestment of 2 properties, which are held in escrow by the legal counsel. This was partially offset by lower trade receivables as the Group has received payments from certain tenants who have been granted deferred payment plans as part of the Group’s measures to support tenants adversely affected by the COVID-19 outbreak.
Trade and other payables
Trade and other payables decreased by S$4.6 million mainly due to the disbursement of rental rebates to tenants as part of the Group’s measures to support tenants adversely affected by the COVID-19 outbreak, as well as under the Rental Relief Framework pursuant to the COVID-19 (Temporary Measures) Act 2020. Such rebates were provided for in FY2020 and formed part of the trade and other payables as at 31 December 2020.
Amount due to non-controlling interest
The amount due to non-controlling interest represents 20.0% interest in 7000 AMK LLP that is not owned by the Group.
ESR-REIT FINANCIAL STATEMENTS ANNOUNCEMENT FOR THE HALF YEAR ENDED 30 JUNE 2021
10
Derivative financial instruments
Derivative financial instruments represent the fair value of interest rate swaps entered into to hedge against interest rate fluctuations on the Group’s floating rate borrowings. The aggregate notional amount of interest rate swaps as at 30 June 2021 was S$930.0 million (31 December 2020: S$1,005.0 million).
Aggregate leverage and interest coverage ratios
(1) The aggregate leverage ratio includes ESR-REIT’s 49.0% share of the borrowings, lease liabilities and total assets of PTC Logistics Hub LLP, but excludes the effects arising from the adoption of FRS 116 Leases which became effective on 1 January 2019 where such effects relate to operating leases that were entered into in the ordinary course of ESR-REIT’s business and were in effect before 1 January 2019.
On a pro forma basis, assuming the Preferential Offering to raise gross proceeds of approximately S$50.0 million had been completed and the gross proceeds had been fully utilised to repay existing debt as at 30 June 2021, the Group’s pro forma aggregate leverage ratio as at 30 June 2021 would have been 41.3%.
(2) The interest coverage ratio is calculated by dividing the trailing 12 months earnings before interest, tax, depreciation and amortisation (excluding the effects of any fair value changes in financial instruments and investment properties, and foreign exchange translation), by the trailing 12 months interest expense (including finance costs on lease liabilities for leasehold land) and borrowing-related fees (including amortisation of debt-related transaction costs).
For details of the Group’s interest-bearing borrowings, please refer to Note 4 of the Notes to the Financial Statements Announcement.
Liabilities directly attributable to investment properties held for divestment
Liabilities directly attributable to investment properties held for divestment include the lease liabilities for the leasehold land of the properties, deposits received from tenants pursuant to the underlying leases of the properties, as well as the refundable deposits in relation to the on-going divestment of the properties.
Perpetual securities
ESR-REIT has issued S$150.0 million of subordinated perpetual securities (“Perps”) under Series 006 of its S$750 million Multicurrency Debt Issuance Programme (“Series 006 PS”). The Perps confer a right to receive distribution at a rate of 4.60% per annum, with the first distribution rate reset falling on 3 November 2022 and subsequent resets occurring every 5 years thereafter. The distribution will be payable semi-annually in arrears on a discretionary basis and will be non-cumulative in accordance with the terms and conditions of the Perps. Distribution to Unitholders can only be made if distribution to Perps holders has been made.
The Series 006 PS may be redeemed at the option of ESR-REIT in whole, but not in part, on 3 November 2022 or on any distribution payment date thereafter and otherwise upon the occurrence of certain redemption events specified in the conditions of the issuance. The Series 006 PS is classified as equity instruments and recorded as equity in the financial statements.
GroupNote 30-06-21 31-12-20
Aggregate leverage ratio (1) 42.9% 41.6%Interest coverage ratio (2) 2.5x 2.3x
ESR-REIT FINANCIAL STATEMENTS ANNOUNCEMENT FOR THE HALF YEAR ENDED 30 JUNE 2021
11
1(c) Statement of Cash Flows
1H2021 1H2020S$'000 S$'000
Cash flows from operating activitiesTotal return for the period before income tax and distribution 63,928 (25,549)
Adjustments for:Interest income (10) (10) Unrealised foreign exchange gain (1) - Borrowing costs 21,696 23,441Finance costs on lease liabilities for leasehold land 5,817 5,722 Management fees paid/payable in Units 2,910 3,030 Property Manager's fees paid/payable in Units 1,415 1,367 Share of results of joint venture (3,222) (835) Change in fair value of investment at fair value throught profit or loss 2,360 - Change in fair value of financial derivatives (13,899) 22,739 Change in fair value of investment properties 2,481 46,684 Change in fair value of right-of-use of leasehold land (757) (829) Operating income before working capital changes 82,718 75,760
Changes in working capitalTrade and other receivables (3,187) (4,918) Trade and other payables (2,046) 10,883 Cash generated from operating activities 77,485 81,725Income tax paid (349) - Net cash generated from operating activities 77,136 81,725
Cash flows from investing activitiesAcquisition of an investment property (122,492) - Capital expenditure on investment properties (17,541) (4,345) Dividend received from joint venture 2,489 2,349 Acquisition of investment at fair value through profit or loss (64,900) - Interest received 10 10 Net cash used in investing activities (202,434) (1,986)
Cash flows from financing activitiesProceeds from issuance of new Units 100,000 - Equity issue costs paid (2,464) (296) Borrowing costs paid (24,172) (24,709) Proceeds from borrowings 414,630 295,000 Repayment of borrowings (293,000) (300,000) Payment for lease liabilities for leasehold land (4,014) (3,932) Payment of principal portion of lease liabilities for leasehold land (1,046) (961) Distributions paid to Unitholders (Note A) (63,354) (33,982) Distributions paid to perpetual securities holders (3,422) (3,441) Distribution to non-controlling interest (1,979) (1,938)
Net cash generated from/(used in) financing activities 121,179 (74,259)
Net (decrease)/increase in cash and cash equivalents (4,119) 5,480Cash and cash equivalents at beginning of the period 18,101 15,662Cash and cash equivalents at end of the period 13,982 21,142
Group
ESR-REIT FINANCIAL STATEMENTS ANNOUNCEMENT FOR THE HALF YEAR ENDED 30 JUNE 2021
12
Note: (A) Distributions paid to Unitholders
Distributions for the half-year ended 30 June 2021 were partially paid by issuing an aggregate of 25.6 million Units (1H2020: 31.6 million Units) amounting to S$10.1 million (1H2020: S$13.4 million) pursuant to the Distribution Reinvestment Plan. Group 1H2021 1H2020 S$'000 S$'000 Distributions paid to Unitholders (73,494) (47,347) Distributions paid in Units pursuant to Distribution
Reinvestment Plan 10,140 13,365 Distributions paid to Unitholders in cash (63,354) (33,982)
ESR-REIT FINANCIAL STATEMENTS ANNOUNCEMENT FOR THE HALF YEAR ENDED 30 JUNE 2021
13
1(d)(i) Statements of Movements in Unitholders’ funds
Unitholders' FundsBalance at beginning of period 1,446,990 1,508,576 1,449,302 1,530,318
OperationsTotal return/(loss) for the period attributable to Unitholders and perpetual securities holders
62,016 (26,642) 61,076 (7,193)
Amount reserved for distribution to perpetual securities holders
(3,422) (3,441) (3,422) (3,441)
Net increase/(decrease) in net assets resulting from operations
58,594 (30,083) 57,654 (10,634)
Unitholders' transactionsIssuance of new Units pursuant to:- Management fees paid in Units 2,537 4,506 2,537 4,506 - Distribution Reinvestment Plan 10,140 13,365 10,140 13,365 - Private Placement 100,000 - 100,000 -
Distributions paid to Unitholders (73,494) (47,347) (73,494) (47,347)Net increase/(decrease) in net assets resulting from Unitholders' transactions
36,719 (29,772) 36,719 (29,772)
Balance at end of period 1,542,303 1,448,721 1,543,675 1,489,912
Perpetual Securities Holders' FundsBalance at beginning of period 151,115 151,115 151,115 151,115 Amount reserved for distribution to perpetual securities holders
3,422 3,441 3,422 3,441
Distribution to perpetual securities holders (3,422) (3,441) (3,422) (3,441)Balance at end of period 151,115 151,115 151,115 151,115
Total 1,693,418 1,599,836 1,694,790 1,641,027
Group Trust
ESR-REIT FINANCIAL STATEMENTS ANNOUNCEMENT FOR THE HALF YEAR ENDED 30 JUNE 2021
14
1(d)(ii) Details of any changes in the number of issued units
Note: (1) The new units were issued on 18 May 2021 at an issue price of S$0.372 per unit.
1(d)(iii) To show the total number of issued shares excluding treasury shares as at the end of the current
financial period, and as at the end of the immediately preceding year.
The total number of issued units, excluding treasury units, as at the end of the current and the comparative financial period are disclosed in Section 1(d)(ii). There were no treasury units acquired since the date of listing of ESR-REIT on 25 July 2006.
1(d)(iv) A statement showing all sales, transfers, disposal, cancellation and/or use of treasury shares
as at the end of the current financial period reported on.
Not applicable. 2 Whether the figures have been audited or reviewed, and in accordance with which auditing
standard or practice.
The figures have not been audited or reviewed by the auditors.
3 Where the figures have been audited or reviewed, the auditors' report (including any
qualifications or emphasis of matter).
Not applicable.
4 Whether the same accounting policies and methods of computation as in the issuer's most
recently audited annual financial statements have been applied.
The accounting policies and methods of computation applied by the Group in the preparation of these interim financial statements for the current financial period are the same as those applied by the Group in its audited annual financial statements for the financial year ended 31 December 2020, except that in the current financial period, the Group has adopted all the new and revised standards that are effective for annual period beginning on 1 January 2021. The adoption of these standards did not have any effect on the financial performance or position of the Group.
Note 1H2021 1H2020Units Units
Issued units at beginning of the period 3,576,362,126 3,487,315,971
Issuance of new Units pursuant to:- Management fees paid in units 6,485,995 12,016,430 - Distribution Reinvestment Plan 25,570,437 31,613,071 - Private Placement (1) 268,818,000 -
Issued units at end of the period 3,877,236,558 3,530,945,472
Trust
ESR-REIT FINANCIAL STATEMENTS ANNOUNCEMENT FOR THE HALF YEAR ENDED 30 JUNE 2021
15
5 If there are any changes in the accounting policies and methods of computation, including any required by an accounting standard, what has changed, as well as the reasons for, and the effect of, the change.
Please refer to item 4 above.
6 Earnings per unit (“EPU”) and distributable amount available per unit for the period
Notes: (a) The basic EPU was calculated using total return after income tax before distribution for the period
and the weighted average number of units in issue during the period. The basic and diluted EPU were the same as there were no dilutive instruments in issue during the period.
(b) Distributable amount available per unit was calculated using the total amount available for
distribution and the number of units entitled to such distributable amount for the period.
7 Net asset value (“NAV”) / Net tangible asset (“NTA”) per unit based on units issued at the end of the period
Note: (a) NAV / NTA per unit was calculated based on the number of units issued as at the end of the
respective periods.
8 Review of the performance
The review of the performance is set out in Section 1(a) – Statements of Total Return and Distribution Statements and Section 1(b)(i) – Statements of Financial Position.
Note 1H2021 1H2020
EPU
Total return/ (loss) after income tax before distribution for the period
(S$'000) 58,594 (30,083)
Weighted average number of units ('000) 3,653,542 3,502,505
Basic and diluted EPU (cents) (a) 1.604 (0.859)
Distributable amount available per unit
Total amount available for distribution for the period (S$'000) 56,778 47,829
Applicable number of units ('000) 3,653,717 3,519,645
Distributable amount available per unit (cents) (b) 1.554 1.359
Group
Group TrustNote 30-06-21 31-12-20 30-06-21 31-12-20
NAV / NTA per unit (cents) (a) 39.8 40.5 39.8 40.5
ESR-REIT FINANCIAL STATEMENTS ANNOUNCEMENT FOR THE HALF YEAR ENDED 30 JUNE 2021
16
9 Review of the performance against Forecast/Prospect Statement The Group has not disclosed any forecast to the market.
10 Commentary on the significant trends and competitive conditions of the industry in which the
group operates and any known factors or events that may affect the group in the next reporting period and the next 12 months.
(a) Market Outlook Based on advance estimates released by the Ministry of Trade and Industry (“MTI”) on 14 July 2021, Singapore’s economy grew by 14.3% on a year-on-year basis in 2Q2021, extending the 1.3% growth in 1Q2021. The strong growth was largely due to the low base in 2Q2020 when GDP fell by 13.3% due to Circuit Breaker (“CB”) measures implemented from 7 April to 1 June 2020. In complete terms, GDP in 2Q2021 remained 0.9% below its pre-pandemic level in 2Q2019. On a quarter-on-quarter seasonally-adjusted basis, the economy contracted by 2.0% in 2Q2021, a reversal from the 3.1% growth in 1Q2021. Notwithstanding the latest curbs, economists have said Singapore’s recovery remains on track, driven by manufacturing and exports and sectors are more immune to Covid-19 curbs. Singapore Purchasing Managers’ Index (“PMI”) for June 2021 posted an increase of 0.1 point from May 2021 to record an expansion at 50.8. This is the 12th consecutive month of expansion for the overall manufacturing sector. The Electronics Sector PMI posted an increase of 0.2 point from the previous month to record an expansion at 50.6 and marking the 11th month of consecutive expansion for the electronics sector. While Singapore’s economy may outperform its growth forecast for 2021, there are significant downside risks. Countries experiencing resurgences in infections and slowness in population vaccination rate could disrupt global economic growth and dampen Singapore’s outlook. Nevertheless, having considered these factors, Singapore’s stronger than expected manufacturing performance, its effective containment of local Covid-19 inflections and good vaccination progress, business sentiments are cautiously optimistic about their growth outlook for Singapore. According to JTC’s market report for 1Q2021, the occupancy rate of the overall industrial property market rose by 0.1% on a quarter-on-quarter basis and 0.8% on a year-on-year basis to 90%. As completions delays continue to persist, only about 131,000 sqm of industrial space were completed in 1Q2021 compared to the originally target completion of 1 million sqm. Price index of all industrial space rose by 0.9% from the previous quarter and fell 1.3% as compared to a year ago. The rental index of all industrial space rose by 0.6% from the previous quarter and fell by 0.9% as compared to a year ago. This is in line with the broad recovery of the economy as the prices and rentals have continued to rebound. As at 31 March 2021, approximately 2.4 million sqm of new industrial space could be completed over the next three quarters of 2021 and an additional 2.8 million sqm of new industrial space between 2022 and 2024. An average annual supply of about 1.4 million sqm is expected to complete from now to end 2024. This is twice the average annual supply of 0.6 million sqm and annual demand of 0.7 million sqm of industrial space over the last three years. MTI has launched 5.14 ha of industrial land supply across seven sites under the industrial government land sales for second half of 2021. During 2Q2021, the Manager secured new leases and renewed existing leases totalling approximately 0.8 million sqft across the various sub-sectors, bringing the total to approximately 1.1 million sqft of space secured in 1H2021, of which new leases accounted for approximately 46.1% or 0.5 million sqft. As businesses continue to transform during this new norm of COVID-19 becoming endemic, changes in the Industrial technical specifications continue to evolve. Logistics and warehouse space continues to be in demand with manufacturers and distributors still continuing the trend of maintaining buffers for their raw materials and products for their businesses in the event of disruptions to the supply chain. This is in addition to the rapidly increasing freight charges which compels businesses to weigh against the costs of additional storage space.
ESR-REIT FINANCIAL STATEMENTS ANNOUNCEMENT FOR THE HALF YEAR ENDED 30 JUNE 2021
17
The General Industrial and High-Specs sectors have seen more demand for tenants relocating to buildings with better specifications such as electrical provisions and accessibility as part of the business transformation. Expansion due to the digitalization of businesses, technology, research and development, pharmaceutical and advanced manufacturing activities have added on to the space requirements in new leases. Overall, business uncertainties remain as Singapore grapples to attract businesses and new investments. Industrial tenants continue to show preference to remain status quo on their leases whilst taking on a wait and see approach. The Manager expects the industrial market rents and prices to remain flat in the remainder of 2021. The Manager has embarked on asset enhancement initiatives to reposition selected properties to meet the new norm requirements of industrialists in line with our proposition to grow with our tenants. (b) Preferential Offering On 6 May 2021, the Manager launched an equity fund raising comprising a private placement and a non-renounceable preferential offering of new Units to raise gross proceeds of up to S$150.0 million to partially finance the acquisition of 46A Tanjong Penjuru; the proposed asset enhancement initiatives at 16 Tai Seng Street and 7000 Ang Mo Kio Avenue 5; and the repayment of existing debt. On 18 May 2021, the Manager completed the Private Placement of 268,818,000 new Units at an issue price of S$0.372 per Unit to raise gross proceeds of approximately S$100.0 million. As gross proceeds of approximately S$100.0 million have been raised from the Private Placement, the gross proceeds to be raised from the Preferential Offering will not exceed S$50.0 million. To demonstrate its continued support and commitment for ESR-REIT and the equity fund raising exercise, as well as alignment of interests with Unitholders, the sponsor, ESR Cayman Limited, has provided an undertaking to the Manager to subscribe for new Units under the Preferential Offering for up to S$50.0 million. An extraordinary general meeting will be held on 26 July 2021 to seek approval from the independent Unitholders for the proposed whitewash resolution as set out in the Unitholders’ circular dated 2 July 2021. Thereafter, the Manager will announce details of the Preferential Offering to raise gross proceeds of up to approximately S$50.0 million at the appropriate time.
(c) Proposed Asset Enhancement Initiatives (“AEI”) On 6 May 2021, the Manager announced the proposed AEI at 16 Tai Seng Street and 7000 Ang Mo Kio Avenue 5. 16 Tai Seng Street 16 Tai Seng Street is centrally located within the Paya Lebar iPark, an industrial hub for lifestyle related and light manufacturing industries. The Manager intends to conduct AEI on 16 Tai Seng Street which will include redesigning and repositioning works to the façade, drop-off point, lift lobbies, lifts, the external linkway to the Mass Rapid Transit station and to maximise the plot ratio by adding an additional floor to increase gross floor area (“GFA”) by approximately 29,000 sqft or 13.8%. The AEI in respect of 16 Tai Seng Street is expected to cost approximately S$25.9 million. 7000 Ang Mo Kio Avenue 5 (“7000 AMK”) On 17 June 2019, ESR-REIT issued a news release on plans to conduct AEI on, among others, 7000 AMK. The proposed AEI on 7000 AMK was to develop a new building for various prospective tenants and was expected to cost approximately S$35.7 million and it was intended to develop 7000 AMK such that it would be suitable for advanced manufacturing, info-communications and data centre tenants given its location and the availability of power. However, in view of the current demand for quality high-specifications spaces from the advance manufacturing and electronics sector, the Manager intends to proceed with the AEI on 7000 AMK on a multi-tenanted basis to create approximately 265,000 sqft of additional GFA. This requires changes to the design plans which the Manager expects will result in additional costs of approximately S$17.6 million. The new design has the flexibility and specifications
ESR-REIT FINANCIAL STATEMENTS ANNOUNCEMENT FOR THE HALF YEAR ENDED 30 JUNE 2021
18
that are suitable for potential data centre tenants. The revised total cost for the proposed AEI on 7000 AMK is expected to be S$53.3 million. After the AEI, there will be approximately 230,000 sqft of unutilised GFA remaining. ESR-REIT holds an economic interest of 80.0% in 7000 AMK, with the remaining 20.0% stake held by Ho Lee Properties Pte Ltd.
(d) Proposed Divestment On 28 April 2021, the Manager announced the divestment of 11 Serangoon North Avenue 5 and 3C Toh Guan Road East for approximately S$53.0 million. The sale price of S$53.0 million represents a 5.0% premium to the total fair value of the 2 properties at S$50.5 million as at 31 December 2020 and a 7.1% premium to their total acquisition price. The divestment is expected to be completed in 2H2021.
11 Distributions
(a) Current financial period
Any distributions declared for the current financial period: Yes
Name of distribution: 64th distribution for the period from 18 May 2021 to 30
June 2021 (Distribution for the period from 1 April 2021 to 17 May 2021
of 0.410 cents per unit has been paid on 17 June 2021.)
Distribution Type: Taxable income
Distribution Rate: 0.344 cents per unit
Par value of units: Not meaningful
Tax Rate: Taxable income distribution The distribution is made out of ESR-REIT’s taxable income. Unitholders receiving distributions will be subject to Singapore income tax on the distributions received except for individuals where the distribution is exempt from tax (unless they hold their units through partnership or as trading assets).
Record date: To be announced at a later date Date payable: To be announced at a later date The Manager has determined that the DRP will not apply to the distribution for the period from 18 May 2021 to 30 June 2021.
ESR-REIT FINANCIAL STATEMENTS ANNOUNCEMENT FOR THE HALF YEAR ENDED 30 JUNE 2021
19
(b) Corresponding period of the immediately preceding year
Any distributions declared for the previous corresponding financial period: Yes Name of distribution: 59th distribution for the period from 1 April 2020 to 30
June 2020 Distribution Type: Taxable income Distribution Rate: 0.662 cents per unit Par value of units: Not meaningful Tax Rate: Taxable income distribution
The distribution is made out of ESR-REIT’s taxable income. Unitholders receiving distributions will be subject to Singapore income tax on the distributions received except for individuals where the distribution is exempt from tax (unless they hold their units through partnership or as trading assets).
12 If no distribution has been declared/recommended, a statement to that effect
Not applicable. 13 If the Group has obtained a general mandate from unitholders for IPTs, the aggregate value of
each transaction as required under Rule 920(1)(a)(ii). If no IPT mandate has been obtained, a statement to that effect.
The Group has not obtained any IPT general mandate from the Unitholders. 14 Confirmation pursuant to Rule 705(5) of the Listing Manual
The Board of Directors of the Manager has confirmed that, to the best of their knowledge, nothing has come to their attention which may render these interim financial results to be false or misleading in any material respect.
15 Confirmation pursuant to Rule 720(1) of the Listing Manual
The Manager confirms that it has procured undertakings from all Directors and Executive Officers (in the format set out in Appendix 7.7) pursuant to Rule 720(1) of the Listing Manual.
ESR-REIT FINANCIAL STATEMENTS ANNOUNCEMENT FOR THE HALF YEAR ENDED 30 JUNE 2021
20
16 Use of proceeds raised from offerings pursuant to Chapter 8 of the Listing Manual
a) Gross proceeds of S$150.0 million raised pursuant to the private placement of 194,174,000 new units completed on 26 June 2019 and the pro rata and non-renounceable preferential offering of 98,117,183 new units completed on 14 October 2019 (together, the “2019 Equity Fund Raising”) has been used in the following manner:
Intended Use of Proceeds
Amount Allocated
(S$ million)
Aggregate Amount Utilised To Date
(S$ million)
Remaining Proceeds Pending
Utilisation (S$ million)
To fully finance the total acquisition costs for 48 Pandan Road
44.4 44.4 -
To fully finance the proposed asset enhancements at 7000 Ang Mo Kio Avenue 5 and ESR BizPark @ Changi (formerly known as UE BizHub East)
45.7 10.0 35.7
To repay existing indebtedness 56.8 56.8 -
To pay for the transaction related expenses including the underwriting and selling commission and expenses related to the 2019 Equity Fund Raising
3.1 3.1 -
Total 150.0 114.3 35.7
The use of proceeds from the 2019 Equity Fund Raising set out above is in accordance with the stated use and in accordance with the percentage of the gross proceeds of the 2019 Equity Fund Raising allocated to such use as set out in the announcement dated 17 June 2019 titled “Launch of Equity Fund Raising to raise Gross Proceeds of up to approximately S$150.0 million”.
ESR-REIT FINANCIAL STATEMENTS ANNOUNCEMENT FOR THE HALF YEAR ENDED 30 JUNE 2021
21
b) Gross proceeds of S$100.0 million raised pursuant to the Private Placement of 268,818,000 new units completed on 18 May 2021 has been used in the following manner:
Intended Use of Proceeds
Amount Allocated
(S$ million)
Aggregate Amount Utilised To Date
(S$ million)
Remaining Proceeds Pending
Utilisation (S$ million)
To partially finance the total acquisition costs for 46A Tanjong Penjuru
71.8 71.8 -
To partially finance the proposed asset enhancements at 16 Tai Seng Street and 7000 Ang Mo Kio Avenue 5
24.5 - 24.5
To pay for the transaction related expenses including the underwriting and selling commission and expenses related to the 2021 equity fund raising
3.7 2.2 1.5
Total 100.0 74.0 26.0
The use of proceeds from the Private Placement set out above is in accordance with the stated use and in accordance with the percentage of the gross proceeds of the Private Placement allocated to such use as set out in the announcement dated 6 May 2021 titled “Launch of Equity Fund Raising to raise Gross Proceeds of up to approximately S$150.0 million”.
ESR-REIT FINANCIAL STATEMENTS ANNOUNCEMENT FOR THE HALF YEAR ENDED 30 JUNE 2021
22
Investment Properties Portfolio Statement
ESR-REIT FINANCIAL STATEMENTS ANNOUNCEMENT FOR THE HALF YEAR ENDED 30 JUNE 2021
23
Investment Properties Portfolio Statement
Tenure Term of Remaining
term of Occupancy rate Fair value
Percentage of net assets attributable
to Unitholders of land lease lease Location 30-06-21 31-12-20 30-06-21 31-12-20 30-06-21 31-12-20 (years) (years) % % S$'000 S$'000 % % Properties held by the Trust
Logistics/Warehousing Properties (1) 1 THIRD LOK YANG ROAD AND
4 FOURTH LOK YANG ROAD Leasehold 30 10.5(5) 1 Third Lok Yang Road
Singapore 627996 and 4 Fourth Lok Yang Road Singapore 629701
100 100 10,440 10,400 0.68 0.72
25 CHANGI SOUTH AVENUE 2 Leasehold 30+30 33.3(6) 25 Changi South Ave 2
Singapore 486594 100 100 12,200 12,200 0.79 0.84
160 KALLANG WAY Leasehold 30+30 11.6(7) 160 Kallang Way
Singapore 349246 100 100 25,106 25,100 1.63 1.73
3C TOH GUAN ROAD EAST Leasehold 30+30 29.6(8) 3C Toh Guan Road East
ESR-REIT FINANCIAL STATEMENTS ANNOUNCEMENT FOR THE HALF YEAR ENDED 30 JUNE 2021
26
Investment Properties Portfolio Statement
Tenure Term of Remaining
term of Occupancy rate Fair value
Percentage of net assets attributable
to Unitholders of land lease lease Location 30-06-21 31-12-20 30-06-21 31-12-20 30-06-21 31-12-20 (years) (years) % % S$'000 S$'000 % %
Properties held by the Trust (cont’d) General Industrial Properties (cont’d) Balance brought forward 339,186 338,300 21.99 23.39 60 TUAS SOUTH STREET 1 Leasehold 30 13.7(30) 60 Tuas South Street 1
Singapore 639925 100 100 4,100 4,100 0.27 0.28
5/7 GUL STREET 1 Leasehold 29.5 16.3(31) 5/7 Gul Street 1
ESR-REIT FINANCIAL STATEMENTS ANNOUNCEMENT FOR THE HALF YEAR ENDED 30 JUNE 2021
27
Investment Properties Portfolio Statement
Tenure Term of Remaining
term of Occupancy rate Fair value
Percentage of net assets attributable
to Unitholders of land lease lease Location 30-06-21 31-12-20 30-06-21 31-12-20 30-06-21 31-12-20 (years) (years) % % S$'000 S$'000 % % Properties held by the Trust (cont’d)
General Industrial Properties (cont’d) Balance brought forward 648,276 646,700 42.03 44.70 45 CHANGI SOUTH AVENUE 2 Leasehold 30+30 34.2(41) 45 Changi South
Avenue 2 Singapore 486133
68 68 10,300 10,300 0.67 0.71
511/513 YISHUN INDUSTRIAL
PARK A Leasehold 29+30/30
+30 32.9/32.4(42) 511/513 Yishun
Industrial Park A Singapore 768768/768736
59 59 25,609 25,600 1.66 1.77
86/88 INTERNATIONAL ROAD Leasehold 30+30 33.5(43) 86/88 International Road 100 100 39,875 39,800 2.59 2.75 Singapore
629176/629177
Total General Industrial Properties held
by the Trust
724,060 722,400 46.95 49.93
ESR-REIT FINANCIAL STATEMENTS ANNOUNCEMENT FOR THE HALF YEAR ENDED 30 JUNE 2021
28
Investment Properties Portfolio Statement
Tenure Term of Remaining
term of Occupancy rate Fair value
Percentage of net assets attributable
to Unitholders of land lease lease Location 30-06-21 31-12-20 30-06-21 31-12-20 30-06-21 31-12-20 (years) (years) % % S$'000 S$'000 % % Properties held by the Trust (cont’d)
High-Specs Industrial Properties (3) 21/23 UBI ROAD 1 Leasehold 30+30 35.6(44) 21/23 Ubi Road 1
Singapore 408724/408725
79 83 36,416 36,400 2.36 2.52
2 JALAN KILANG BARAT Leasehold 99 41.0(45) 2 Jalan Kilang Barat
Total High-Specs Industrial Properties held by the Trust
236,308 236,000 15.33 16.31
Business Park Properties (4) 16 INTERNATIONAL BUSINESS PARK Leasehold 30+30 35.1(50) 16 International
Business Park Singapore 609929
100 100 32,004 32,000 2.08 2.21
Total Business Park Properties held by
the Trust 32,004 32,000 2.08 2.21
Total Properties held by the Trust 1,509,162 1,385,700 97.87 95.77
ESR-REIT FINANCIAL STATEMENTS ANNOUNCEMENT FOR THE HALF YEAR ENDED 30 JUNE 2021
29
Investment Properties Portfolio Statement
Tenure Term of Remaining
term of Occupancy rate Fair value
Percentage of net assets attributable
to Unitholders of land lease lease Location 30-06-21 31-12-20 30-06-21 31-12-20 30-06-21 31-12-20 (years) (years) % % S$'000 S$'000 % % Properties held by subsidiaries
PARK AVENUE 1 Leasehold 30+30 46.6(60) 6/8 Changi Business Park
Avenue 1 Singapore 486017
65 64 380,697 373,000 24.68 25.78
2/4 CHANGI BUSINESS
PARK AVENUE 1 Leasehold 30+30 46.6(60) 2/4 Changi Business Park
Avenue 1 Singapore 486015
100 100 165,000 165,000 10.70 11.40
Total Business Park Properties held
by subsidiaries
826,079 816,200 53.56 56.41 Total Properties held by subsidiaries 1,519,921 1,503,600 98.55 103.92 Total Properties held by the Group 3,029,083 2,889,300 196.42 199.69
ESR-REIT FINANCIAL STATEMENTS ANNOUNCEMENT FOR THE HALF YEAR ENDED 30 JUNE 2021
31
Investment Properties Portfolio Statement
Percentage of net assets attributable to
Unitholders 30-06-21 31-12-20 30-06-21 31-12-20 S$'000 S$'000 % % Trust Investment properties (Note 3) 1,509,162 1,385,700 97.76 95.61 Other assets and liabilities (net) 185,628 214,717 12.03 14.82 Net assets of the Trust 1,694,790 1,600,417 109.79 110.43 Perpetual securities holders’ funds (151,115) (151,115) (9.79) (10.43) Net assets attributable to Unitholders 1,543,675 1,449,302 100.00 100.00 Group Investment properties (Note 3) 3,029,083 2,889,300 196.40 199.68 Other assets and liabilities (net) (1,335,665) (1,291,195) (86.60) (89.23) Net assets of the Group 1,693,418 1,598,105 109.80 110.45 Perpetual securities holders’ funds (151,115) (151,115) (9.80) (10.45) Net assets attributable to Unitholders 1,542,303 1,446,990 100.00 100.00
Fair value 30-06-21 31-12-20 S$’000 S$’000 As disclosed in the Statement of Financial Position: Trust Investment properties – non-current 1,619,890 1,551,337 Investment properties held for divestment 61,025 – Less: Right-of-use assets (Note 3) (171,753) (165,637) Total investment properties 1,509,162 1,385,700
Group Investment properties – non-current 3,201,899 3,119,058 Investment properties held for divestment 61,025 – Less: Right-of-use assets (Note 3) (233,841) (229,758) Total investment properties 3,029,083 2,889,300
ESR-REIT FINANCIAL STATEMENTS ANNOUNCEMENT FOR THE HALF YEAR ENDED 30 JUNE 2021
32
Investment Properties Portfolio Statement Notes: (1) Logistics/Warehousing properties are typically equipped with high floor loading and also have a high floor-to-ceiling height. Such buildings can be either single-storey or multi-storey
properties with vehicular ramp access and/or heavy-duty cargo lift access.
(2) General Industrial properties can be single or multi-storey facilities dedicated to general industrial, manufacturing or factory activities. Such spaces also have a low percentage of the usable space which can be set aside for office use.
(3) High-Specs Industrial properties are mixed-use industrial buildings with a high proportion of space that can be allocated for office use. These buildings typically have facilities such
as air-conditioned units and sufficient floorboard, ceiling height and electrical power capacities to enable both office and manufacturing functions to be carried out concurrently. (4) Business Parks are clusters of buildings and offices typically dedicated to business activities relating to high-technology, research and development (R&D) value-added and
knowledge-intensive sectors. Companies that take up space in Business Parks can engage in a range of light and clean uses such as technical support, information-communications, healthcare devices, product design, development and testing, service centres and back-end office functions.
(5) ESR-REIT holds the remainder of a 30 year lease commencing from 16 December 2001. (6) ESR-REIT holds the remainder of a 30+30 year lease commencing from 16 October 1994. (7) ESR-REIT holds the remainder of a 30+30 year lease commencing from 16 February 1973. (8) ESR-REIT holds the remainder of a 30+30 year lease commencing from 16 February 1991. (9) ESR-REIT holds the remainder of a 30+30 year lease commencing from 1 October 1993. (10) ESR-REIT holds the remainder of a 30+12 year lease commencing from 1 March 1995. (11) ESR-REIT holds the remainder of a 30+30 year lease commencing from 16 December 1990. (12) ESR-REIT holds the remainder of a 30 year lease commencing from 16 December 2011. (13) ESR-REIT holds the remainder of a 30 year lease commencing from 16 October 2011. (14) ESR-REIT holds the remainder of a 10+22 year lease commencing from 1 June 2007. (15) ESR-REIT holds the remainder of a 30+30 year lease commencing from 4 July 2007. (16) ESR-REIT holds the remainder of a 30+30 year lease commencing from 16 August 1995. (17) ESR-REIT holds the remainder of a 30+30 year lease commencing from 1 May 1992. (18) ESR-REIT holds the remainder of a 30+30 year lease commencing from 1 December 1991. (19) ESR-REIT holds the remainder of a 30+30 year lease commencing from 1 October 1990. (20) ESR-REIT holds the remainder of a 30+30 year lease commencing from 16 April 1997. (21) ESR-REIT holds the remainder of a 30+30 year lease commencing from 1 February 2000. (22) ESR-REIT holds the remainder of a 30+30 year lease commencing from 1 April 1994. (23) ESR-REIT holds the remainder of a 30+30 year lease commencing from 1 March 2001 for 1 Changi North Street 2 and 30+30 year lease commencing from 23 November 2005
for 2 Changi North Street 2.
ESR-REIT FINANCIAL STATEMENTS ANNOUNCEMENT FOR THE HALF YEAR ENDED 30 JUNE 2021
33
Investment Properties Portfolio Statement Notes:
(24) ESR-REIT holds the remainder of a 30+30 year lease commencing from 16 July 1998. (25) ESR-REIT holds the remainder of a 30+30 year lease commencing from 16 December 1979. (26) ESR-REIT holds the remainder of a 30+30 year lease commencing from 1 March 1995. (27) ESR-REIT holds the remainder of a 30 year lease commencing from 16 September 2005. (28) ESR-REIT holds the remainder of a 60 year lease commencing from 4 January 1999. (29) ESR-REIT holds the remainder of a 30+30 year lease commencing from 1 February 1993. (30) ESR-REIT holds the remainder of a 30 year lease commencing from 16 March 2005. (31) ESR-REIT holds the remainder of a 29.5 year lease commencing from 1 April 2008. (32) ESR-REIT holds the remainder of a 30+30 year lease commencing from 16 October 1995. (33) ESR-REIT holds the remainder of a 30+28 year lease commencing from 1 February 2009. (34) ESR-REIT holds the remainder of a 30+30 year lease commencing from 16 October 1995. (35) ESR-REIT holds the remainder of a 30 year lease commencing from 1 February 2008. (36) ESR-REIT holds the remainder of a 28 year lease commencing from 25 March 2007. (37) ESR-REIT holds the remainder of a 27 year lease commencing from 30 September 2013. (38) ESR-REIT holds the remainder of a 30+30 year lease commencing from 1 May 1999. (39) ESR-REIT holds the remainder of a 30+16 year lease commencing from 1 April 2008. (40) ESR-REIT holds the remainder of a 30+28 year lease commencing from 16 February 1997. (41) ESR-REIT holds the remainder of a 30+30 year lease commencing from 1 September 1995. (42) ESR-REIT holds the remainder of a 29+30 year lease commencing from 1 June 1995 for 511 Yishun and 30+30 year lease commencing from 1 December 1993 for 513 Yishun. (43) ESR-REIT holds the remainder of a 30+30 year lease commencing from 16 December 1994. (44) ESR-REIT holds the remainder of a 30+30 year lease commencing from 1 February 1997. (45) ESR-REIT holds the remainder of a 99 year lease commencing from 1 July 1963. (46) ESR-REIT holds the remainder of a 99 year lease commencing from 1 January 1958. (47) ESR-REIT holds the remainder of a 30+30 year lease commencing from 16 June 1996. (48) ESR-REIT holds the remainder of a 30+30 year lease commencing from 16 October 1990. (49) ESR-REIT holds the remainder of a 30+30 year lease commencing from 1 December 1989. (50) ESR-REIT holds the remainder of a 30+30 year lease commencing from 1 August 1996. (51) Viva Trust holds the remainder of a 30 year lease commencing from 16 October 2013. (52) Viva Trust holds the remainder of a 30 year lease commencing from 16 February 2007.
ESR-REIT FINANCIAL STATEMENTS ANNOUNCEMENT FOR THE HALF YEAR ENDED 30 JUNE 2021
34
Investment Properties Portfolio Statement Notes:
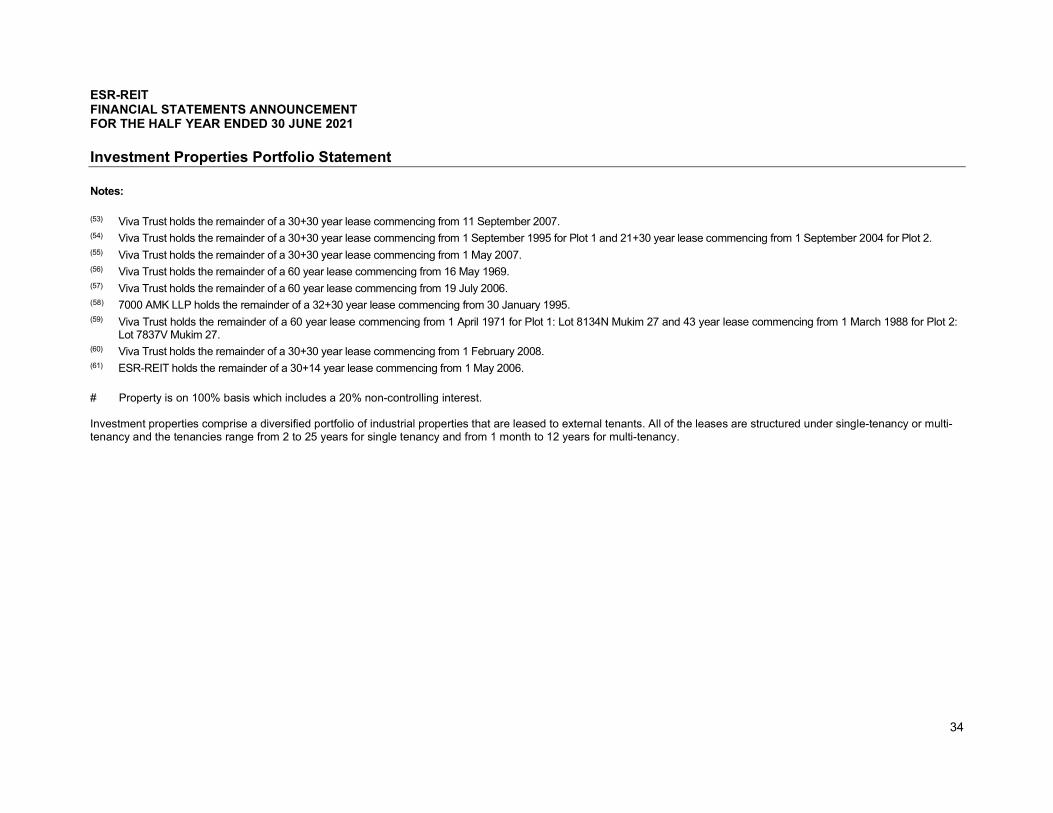
(53) Viva Trust holds the remainder of a 30+30 year lease commencing from 11 September 2007. (54) Viva Trust holds the remainder of a 30+30 year lease commencing from 1 September 1995 for Plot 1 and 21+30 year lease commencing from 1 September 2004 for Plot 2. (55) Viva Trust holds the remainder of a 30+30 year lease commencing from 1 May 2007. (56) Viva Trust holds the remainder of a 60 year lease commencing from 16 May 1969. (57) Viva Trust holds the remainder of a 60 year lease commencing from 19 July 2006. (58) 7000 AMK LLP holds the remainder of a 32+30 year lease commencing from 30 January 1995. (59) Viva Trust holds the remainder of a 60 year lease commencing from 1 April 1971 for Plot 1: Lot 8134N Mukim 27 and 43 year lease commencing from 1 March 1988 for Plot 2:
Lot 7837V Mukim 27. (60) Viva Trust holds the remainder of a 30+30 year lease commencing from 1 February 2008. (61) ESR-REIT holds the remainder of a 30+14 year lease commencing from 1 May 2006.
# Property is on 100% basis which includes a 20% non-controlling interest. Investment properties comprise a diversified portfolio of industrial properties that are leased to external tenants. All of the leases are structured under single-tenancy or multi-tenancy and the tenancies range from 2 to 25 years for single tenancy and from 1 month to 12 years for multi-tenancy.
ESR-REIT FINANCIAL STATEMENTS ANNOUNCEMENT FOR THE HALF YEAR ENDED 30 JUNE 2021
35
Notes to the Financial Statements Announcement
ESR-REIT FINANCIAL STATEMENTS ANNOUNCEMENT FOR THE HALF YEAR ENDED 30 JUNE 2021
36
1. Summary of significant accounting policies 1.1 Basis of preparation
The interim financial statements for the six months ended 30 June 2021 have been prepared in accordance with FRS 34 Interim Financial Reporting issued by the Accounting Standards Council Singapore, the recommendations of Statement of Recommended Accounting Practice (“RAP”) 7 Reporting Framework for Investment Funds applicable to interim financial statements issued by the Institute of Singapore Chartered Accountants, the applicable requirements of the Code on Collective Investment Schemes (the “CIS Code”) issued by the Monetary Authority of Singapore (“MAS”) and the provisions of the Trust Deed. RAP 7 requires that accounting policies adopted should generally comply with the recognition and measurement principles of Singapore Financial Reporting Standards (“FRS”). The interim financial statements do not include all the information required for a complete set of financial statements. However, selected explanatory notes are included to explain events and transactions that are significant to an understanding of the changes in the Group’s financial position and performance of the Group since its last annual financial statements for the financial year ended 31 December 2020.
1.2 Basis of measurement
The interim financial statements are prepared on the historical cost basis, except for investment properties, investment at fair value through profit or loss, and derivative financial instruments, which are measured at fair value. As at 30 June 2021, the current liabilities of the Group and the Trust exceeded their current assets by S$170.3 million and S$76.9 million, respectively. This is primarily due to the classification of a revolving credit facility of S$50.0 million and a term loan facility of S$75.0 million as current liabilities as they are maturing within the next 12 months from 30 June 2021. Notwithstanding the net current liabilities position, based on the Group’s available financial resources and sources of funding, the Manager is of the view that the Group will be able to refinance its borrowings and meet its current financial obligations as and when they fall due.
1.3 Functional and presentation currency
The interim financial statements are presented in Singapore dollars (“S$”), which is the Trust’s functional currency. All financial information presented in Singapore dollars has been rounded to the nearest thousand, unless otherwise stated.
1.4 Changes in accounting policies The accounting policies adopted are consistent with those of the previous financial year except that in the current financial period, the Group has adopted all the new and revised standards that are effective for annual financial periods beginning on or after 1 January 2021. The adoption of these standards did not have any significant effect on the financial performance or position of the Group and the Trust.
2. Significant accounting judgements and estimates
The preparation of interim financial statements in conformity with RAP 7 requires the Manager to make judgements, estimates and assumptions that affect the application of policies and reported amounts of assets, liabilities, revenue, expenses and the disclosure of contingent liabilities at the end of each reporting period. Uncertainty about these assumptions and estimates could result in outcomes that require a material adjustment to the carrying amount of the asset or liability affected in the future periods. The significant judgements made by the Manager in applying the Group’s accounting policies and the key sources of estimation uncertainty were the same as those applied to the Group’s annual financial statements for the financial year ended 31 December 2020.
ESR-REIT FINANCIAL STATEMENTS ANNOUNCEMENT FOR THE HALF YEAR ENDED 30 JUNE 2021
37
2. Significant accounting judgements and estimates (cont’d) The estimates and underlying assumptions are reviewed on an ongoing basis. Revisions to accounting estimates are recognised in the period in which the estimate is revised and in any future periods effected. Information about critical judgements, assumptions and estimation uncertainties that have the most significant effect on the amounts recognised in the interim financial statements are included in Note 12.
Investment propertiesAt beginning of the period/year 2,889,300 2,934,400 1,385,700 1,403,800 Acquisition of investment property 124,589 - 124,589 - Capital expenditure incurred 18,156 14,217 1,835 3,751 Change in fair value during the period/year* (2,962) (59,317) (2,962) (21,851)
At end of the period/year 3,029,083 2,889,300 1,509,162 1,385,700
Investment properties (non-current) 2,976,533 2,889,300 1,456,612 1,385,700 Investment properties held for divestment (current) 52,550 - 52,550 -
3,029,083 2,889,300 1,509,162 1,385,700
Right-of-use assetsAt beginning of the period/year 229,758 227,681 165,637 169,691 Re-measurement due to change in lease rates (373) 1,137 3,069 (2,161)Recognition due to acquisition of investment property
3,996 - 3,996 -
Change in fair value during the period/year** 460 940 (949) (1,893)
At end of the period/year 233,841 229,758 171,753 165,637
Right-of-use assets (non-current) 225,366 229,758 163,278 165,637 Right-of-use assets attributable to investment properties held for divestment (current)
Investment properties held for divestment (including right-of-use assets) (current)
61,025 - 61,025 -
3,262,924 3,119,058 1,680,915 1,551,337
Group Trust
ESR-REIT FINANCIAL STATEMENTS ANNOUNCEMENT FOR THE HALF YEAR ENDED 30 JUNE 2021
38
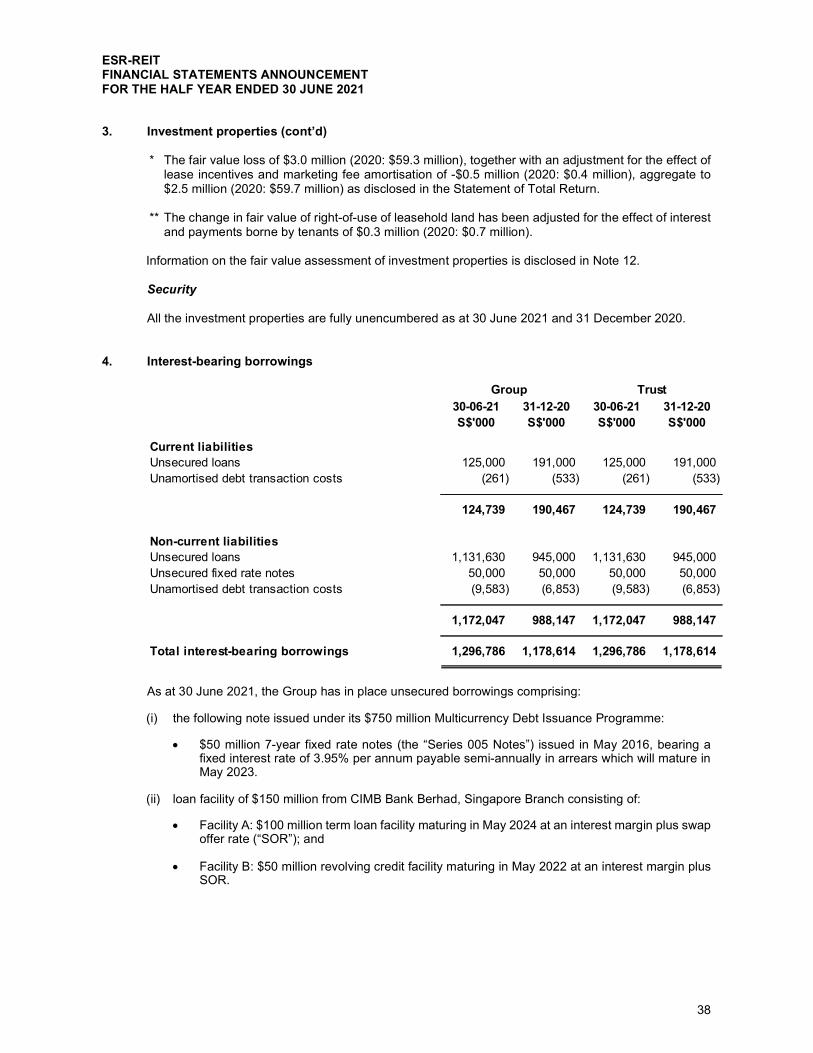
3. Investment properties (cont’d) * The fair value loss of $3.0 million (2020: $59.3 million), together with an adjustment for the effect of
lease incentives and marketing fee amortisation of -$0.5 million (2020: $0.4 million), aggregate to $2.5 million (2020: $59.7 million) as disclosed in the Statement of Total Return.
** The change in fair value of right-of-use of leasehold land has been adjusted for the effect of interest
and payments borne by tenants of $0.3 million (2020: $0.7 million).
Information on the fair value assessment of investment properties is disclosed in Note 12. Security All the investment properties are fully unencumbered as at 30 June 2021 and 31 December 2020.
4. Interest-bearing borrowings
As at 30 June 2021, the Group has in place unsecured borrowings comprising: (i) the following note issued under its $750 million Multicurrency Debt Issuance Programme:
$50 million 7-year fixed rate notes (the “Series 005 Notes”) issued in May 2016, bearing a fixed interest rate of 3.95% per annum payable semi-annually in arrears which will mature in May 2023.
(ii) loan facility of $150 million from CIMB Bank Berhad, Singapore Branch consisting of:
Facility A: $100 million term loan facility maturing in May 2024 at an interest margin plus swap offer rate (“SOR”); and
Facility B: $50 million revolving credit facility maturing in May 2022 at an interest margin plus SOR.
Total interest-bearing borrowings 1,296,786 1,178,614 1,296,786 1,178,614
Group Trust
ESR-REIT FINANCIAL STATEMENTS ANNOUNCEMENT FOR THE HALF YEAR ENDED 30 JUNE 2021
39
4. Interest-bearing borrowings (cont’d)
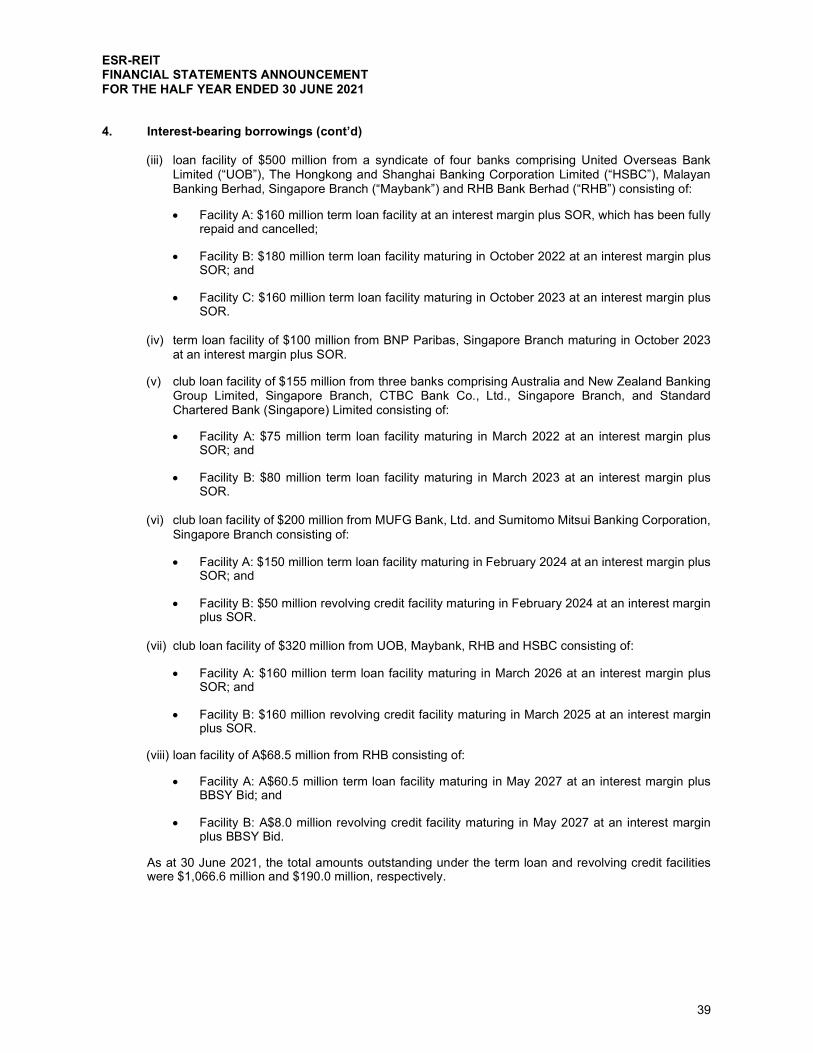
(iii) loan facility of $500 million from a syndicate of four banks comprising United Overseas Bank Limited (“UOB”), The Hongkong and Shanghai Banking Corporation Limited (“HSBC”), Malayan Banking Berhad, Singapore Branch (“Maybank”) and RHB Bank Berhad (“RHB”) consisting of:
Facility A: $160 million term loan facility at an interest margin plus SOR, which has been fully
repaid and cancelled;
Facility B: $180 million term loan facility maturing in October 2022 at an interest margin plus SOR; and
Facility C: $160 million term loan facility maturing in October 2023 at an interest margin plus SOR.
(iv) term loan facility of $100 million from BNP Paribas, Singapore Branch maturing in October 2023
at an interest margin plus SOR.
(v) club loan facility of $155 million from three banks comprising Australia and New Zealand Banking Group Limited, Singapore Branch, CTBC Bank Co., Ltd., Singapore Branch, and Standard Chartered Bank (Singapore) Limited consisting of:
Facility A: $75 million term loan facility maturing in March 2022 at an interest margin plus
SOR; and
Facility B: $80 million term loan facility maturing in March 2023 at an interest margin plus SOR.
(vi) club loan facility of $200 million from MUFG Bank, Ltd. and Sumitomo Mitsui Banking Corporation,
Singapore Branch consisting of:
Facility A: $150 million term loan facility maturing in February 2024 at an interest margin plus SOR; and
Facility B: $50 million revolving credit facility maturing in February 2024 at an interest margin plus SOR.
(vii) club loan facility of $320 million from UOB, Maybank, RHB and HSBC consisting of:
Facility A: $160 million term loan facility maturing in March 2026 at an interest margin plus
SOR; and
Facility B: $160 million revolving credit facility maturing in March 2025 at an interest margin plus SOR.
(viii) loan facility of A$68.5 million from RHB consisting of:
Facility A: A$60.5 million term loan facility maturing in May 2027 at an interest margin plus
BBSY Bid; and
Facility B: A$8.0 million revolving credit facility maturing in May 2027 at an interest margin plus BBSY Bid.
As at 30 June 2021, the total amounts outstanding under the term loan and revolving credit facilities were $1,066.6 million and $190.0 million, respectively.
ESR-REIT FINANCIAL STATEMENTS ANNOUNCEMENT FOR THE HALF YEAR ENDED 30 JUNE 2021
40
5. Liabilities directly attributable to investment properties held for divestment
(1) Deposits received pursuant to the put and call option agreements entered into for the divestment
of 11 Serangoon North Avenue 5 and 3C Toh Guan Road East. 6. Gross revenue
(1) Rental rebates to eligible tenants as part of the Group’s measures to support tenants adversely
affected by the COVID-19 outbreak, and under the Rental Relief Framework pursuant to the COVID-19 (Temporary Measures) Act 2020.
Borrowing costs paid and payable:- bank loans 9,172 13,131 - financial derivatives 9,280 5,084 - fixed rate notes 979 3,369 Amortisation of transaction costs relating to debt facilities 2,265 1,857
21,696 23,441
Group
ESR-REIT FINANCIAL STATEMENTS ANNOUNCEMENT FOR THE HALF YEAR ENDED 30 JUNE 2021
42
11. Related parties
For the purposes of these interim financial statements, parties are considered to be related to the Group if the Manager or the Group has the ability, directly or indirectly, to control the party or exercise significant influence over the party in making financial and operating decisions, or vice versa, or where the Manager and the party are subject to common significant influence. Related parties may be individuals or other entities. The Manager and the Property Manager are indirect subsidiaries of a substantial Unitholder of the Trust. Other than as disclosed elsewhere in the interim financial statements, there were the following significant related party transactions carried out in the normal course of business on terms agreed between the parties:
(1) Relates to the total rental receivable from ESR Property Management (S) Pte Ltd (“ESR-PM”)
pursuant to a 3-year tenancy agreement entered into between the Group and ESR-PM.
Group
1H2021 1H2020
$'000 $'000
ESR Funds Management (S) Limited
(the "Manager")
Management fees paid and payable
-in cash 4,298 4,300
-in units 2,910 3,030
Acquisition fees payable in cash 1,196 -
ESR Property Management (S) Pte Ltd
(Subsidiary of immediate holding company of the Manager)
Property and lease management fees paid and payable
-in cash 2,092 1,943
-in units 1,415 1,367
Lease marketing services commissions paid and payable 1,716 2,635
Project management fees paid and payable 248 25
Site staff cost recovery 331 416
Rental income receivable(1) 1,906 -
RBC Investor Services Trust Singapore
Limited (the "Trustee")
Trustee fees paid and payable 175 176
Perpetual (Asia) Limited
(the "Sub-trust Trustee")
Trustee fees paid and payable 93 95
ESR Cayman Group
Acquisition of a 10% interest in ESR Australia Logistics Partnership 62,630 -
ESR-REIT FINANCIAL STATEMENTS ANNOUNCEMENT FOR THE HALF YEAR ENDED 30 JUNE 2021
43
12. Fair value measurement Valuation processes applied by the Group The Group has an established control framework with respect to the measurement of fair values. This framework includes a real estate team that reports directly to the Chief Executive Officer of the Manager, and has an overall responsibility for all significant fair value measurements, including Level 3 fair values. The valuation team regularly reviews significant unobservable input and valuation adjustments. If third party information is used to measure fair value, then the valuation team assesses and documents the evidence obtained from the third parties to support the conclusion that such valuations meet the requirements of FRS, including the level in the fair value hierarchy the resulting fair value estimate should be classified. Significant valuation issues are reported to the Manager's Board. (a) Fair value hierarchy
The Group categorises fair value measurements using a fair value hierarchy that is dependent on the valuation input used as follows: Level 1: Quoted prices (unadjusted) in active markets for identical assets or liabilities that the
Group can access at the measurement date; Level 2: Input other than quoted prices included within Level 1 that are observable for the
asset or liability, either directly or indirectly; and Level 3: Unobservable input for the asset or liability. If the input used to measure the fair value of an asset or a liability are categorised in different levels of the fair value hierarchy, then the fair value measurement is categorised in its entirety in the same level of the fair value hierarchy as the lowest level input that is significant to entire measurement (with Level 3 being the lowest). The Group recognises any transfers between levels of the fair value hierarchy as of the end of the reporting period during which the transfer has occurred. There were no such transfers during the current and previous financial periods.
ESR-REIT FINANCIAL STATEMENTS ANNOUNCEMENT FOR THE HALF YEAR ENDED 30 JUNE 2021
44
12. Fair value measurement (cont’d)
(b) Assets and liabilities measured at fair value The table below shows an analysis of each class of assets and liabilities of the Group and the Trust measured at fair value as at the end of the reporting period: Level 1 Level 2 Level 3 Total $’000 $’000 $’000 $’000 Group As at 30.06.2021 Non financial assets Investment properties (including
right-of-use assets and investment properties held for divestment) – – 3,262,924 3,262,924
Financial assets Investment at fair value through
profit or loss – – 61,541 61,541
– – 3,324,465 3,324,465 Derivatives Derivative financial instruments – (24,679) – (24,679) As at 31.12.2020 Non financial assets Investment properties (including
ESR-REIT FINANCIAL STATEMENTS ANNOUNCEMENT FOR THE HALF YEAR ENDED 30 JUNE 2021
46
12. Fair value measurement (cont’d)
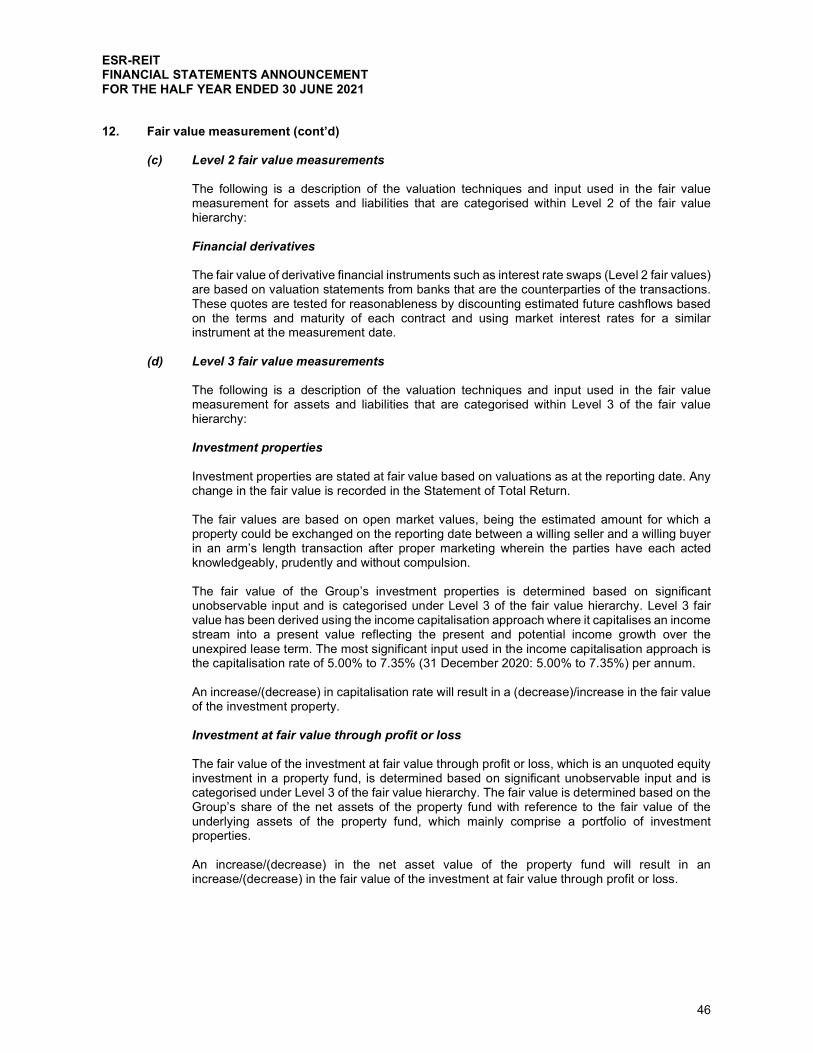
(c) Level 2 fair value measurements The following is a description of the valuation techniques and input used in the fair value measurement for assets and liabilities that are categorised within Level 2 of the fair value hierarchy: Financial derivatives The fair value of derivative financial instruments such as interest rate swaps (Level 2 fair values) are based on valuation statements from banks that are the counterparties of the transactions. These quotes are tested for reasonableness by discounting estimated future cashflows based on the terms and maturity of each contract and using market interest rates for a similar instrument at the measurement date.
(d) Level 3 fair value measurements
The following is a description of the valuation techniques and input used in the fair value measurement for assets and liabilities that are categorised within Level 3 of the fair value hierarchy: Investment properties Investment properties are stated at fair value based on valuations as at the reporting date. Any change in the fair value is recorded in the Statement of Total Return. The fair values are based on open market values, being the estimated amount for which a property could be exchanged on the reporting date between a willing seller and a willing buyer in an arm’s length transaction after proper marketing wherein the parties have each acted knowledgeably, prudently and without compulsion. The fair value of the Group’s investment properties is determined based on significant unobservable input and is categorised under Level 3 of the fair value hierarchy. Level 3 fair value has been derived using the income capitalisation approach where it capitalises an income stream into a present value reflecting the present and potential income growth over the unexpired lease term. The most significant input used in the income capitalisation approach is the capitalisation rate of 5.00% to 7.35% (31 December 2020: 5.00% to 7.35%) per annum. An increase/(decrease) in capitalisation rate will result in a (decrease)/increase in the fair value of the investment property. Investment at fair value through profit or loss The fair value of the investment at fair value through profit or loss, which is an unquoted equity investment in a property fund, is determined based on significant unobservable input and is categorised under Level 3 of the fair value hierarchy. The fair value is determined based on the Group’s share of the net assets of the property fund with reference to the fair value of the underlying assets of the property fund, which mainly comprise a portfolio of investment properties. An increase/(decrease) in the net asset value of the property fund will result in an increase/(decrease) in the fair value of the investment at fair value through profit or loss.
ESR-REIT FINANCIAL STATEMENTS ANNOUNCEMENT FOR THE HALF YEAR ENDED 30 JUNE 2021
47
12. Fair value measurement (cont’d) (e) Classification of financial instruments
The fair values of financial assets and liabilities, together with their carrying amounts shown in the Statement of Financial Position, are as follows:
Note
Financial assets at amortised
cost
Fair value through
profit or loss
Financial liabilities at amortised
cost
Total carrying amount Fair value
$’000 $’000 $’000 $’000 $’000 Group As at 30.06.2021 Investment at fair value
through profit or loss – 61,541 – 61,541 61,541 Trade and other
receivables* 15,033 – – 15,033 15,033 Cash and cash
equivalents 13,982 – – 13,982 13,982 Loans and borrowings 4 – – (1,296,786) (1,296,786) (1,298,312) Trade and other payables^ – – (74,509) (74,509) (74,509) Liabilities directly
attributable to investment properties held for divestment+ – – (6,118) (6,118) (6,118)
* Excludes prepayments. ^ Excludes rent received in advance and GST payable. + Excludes lease liabilities.
ESR-REIT FINANCIAL STATEMENTS ANNOUNCEMENT FOR THE HALF YEAR ENDED 30 JUNE 2021
49
13. Segment reporting
Segment information is presented based on the information reviewed by the Manager’s Chief Operating Decision Makers (“CODMs”) for performance assessment and resource allocation. As each investment property is mainly used for industrial (including warehousing) purposes, these investment properties are similar in terms of economic characteristics, nature of services and type of customers. The CODMs are of the view that the Group has only one reportable segment – Leasing of investment properties. This forms the basis of identifying the operating segments of ESR-REIT under FRS 108 Operating Segments. No geographical segment information has been presented as all of the Group’s investment properties are located in Singapore.
14. Seasonal operations
The Group’s business is not affected significantly by seasonal or cyclical factors during the financial period.
15. Financial ratios
30.06.2021 30.06.2020 % % Expenses to weighted average net assets (1) - including performance component of management fees 0.52 0.54 - excluding performance component of management fees 0.52 0.54 Portfolio turnover rate (2) 7.26 – (1) The annualised ratios are computed in accordance with the guidelines of Investment
Management Association of Singapore. The expenses used in the computation relate to expenses of the Group, excluding property related expenses, borrowing costs and income tax expense.
(2) The annualised ratio is computed based on the lesser of purchases or sales of underlying
investment properties of the Group expressed as a percentage of daily average net asset value. 16. Capital commitments
As at the reporting date, the Group had $3.4 million (31 December 2020: $18.1 million) of capital commitments in respect of asset enhancement initiatives and capital expenditure for investment properties that had been authorised and contracted for but not provided for in the financial statements. These projects are targeted to complete in 2021.
17. Subsequent events
There are no known subsequent events which have led to adjustments to the interim financial statements.
ESR-REIT FINANCIAL STATEMENTS ANNOUNCEMENT FOR THE HALF YEAR ENDED 30 JUNE 2021
50
This announcement may contain forward-looking statements that involve assumptions, risks and uncertainties. Actual future performance, outcomes and results may differ materially from those expressed in forward-looking statements as a result of a number of risks, uncertainties and assumptions. Representative examples of these factors include (without limitation) general industry and economic conditions, interest rate trends, cost of capital and capital availability, competition from similar developments, shifts in expected levels of occupancy or property rental income, changes in operating expenses, governmental and public policy changes and the continued availability of financing in amounts and on terms necessary to support ESR-REIT’s future business. You are cautioned not to place undue reliance on these forward-looking statements, which are based on the Manager’s current view of future events. Any discrepancies in the tables included in this announcement between the listed amounts and total thereof are due to rounding.
BY ORDER OF THE BOARD ESR Funds Management (S) Limited As Manager of ESR-REIT (Company Registration No. 200512804G, Capital Markets Services Licence No. 100132) Adrian Chui Chief Executive Officer and Executive Director 23 July 2021 For further enquiries, please contact: ESR Funds Management (S) Limited Gloria Low Lyn Ong Corporate Communications Manager Investor Relations Manager Tel: +65 6827 9332 Tel: +65 6827 9504 Email: [email protected] Email: [email protected]