60
1 Markus Neuhaus I Corporate Finance I [email protected] Corporate Finance Interpreting Financial Statements Dr. Markus R. Neuhaus Dr. Marc Schmidli, CFA Autumn Term 2013
| Date post: | 18-Dec-2015 |
| Category: |
Documents |
| Upload: | willis-richards |
| View: | 223 times |
| Download: | 4 times |
1Markus Neuhaus I Corporate Finance I [email protected]
Corporate FinanceInterpreting Financial StatementsDr. Markus R. NeuhausDr. Marc Schmidli, CFA
Autumn Term 2013
2Markus Neuhaus I Corporate Finance I [email protected] Term 2013
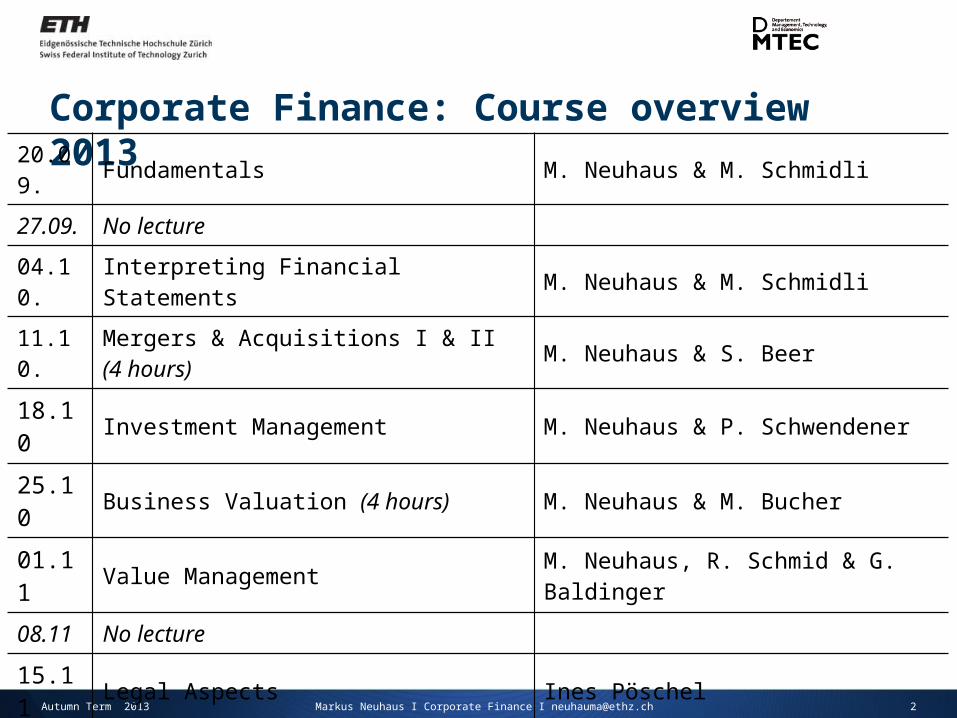
Corporate Finance: Course overview 201320.09. Fundamentals M. Neuhaus & M. Schmidli
27.09. No lecture
04.10. Interpreting Financial Statements M. Neuhaus & M. Schmidli
11.10. Mergers & Acquisitions I & II (4 hours) M. Neuhaus & S. Beer
18.10 Investment Management M. Neuhaus & P. Schwendener
25.10 Business Valuation (4 hours) M. Neuhaus & M. Bucher
01.11 Value Management M. Neuhaus, R. Schmid & G. Baldinger
08.11 No lecture
15.11 Legal Aspects Ines Pöschel
22.11 Turnaround Management M. Neuhaus & R. Brunner
29.11 No lecture
06.12 Financial Reporting M. Neuhaus & M. Jeger
13.12 Taxes (4 hours) M. Neuhaus & M. Marbach
20.12 Summary Repetition M. Neuhaus
3Markus Neuhaus I Corporate Finance I [email protected]
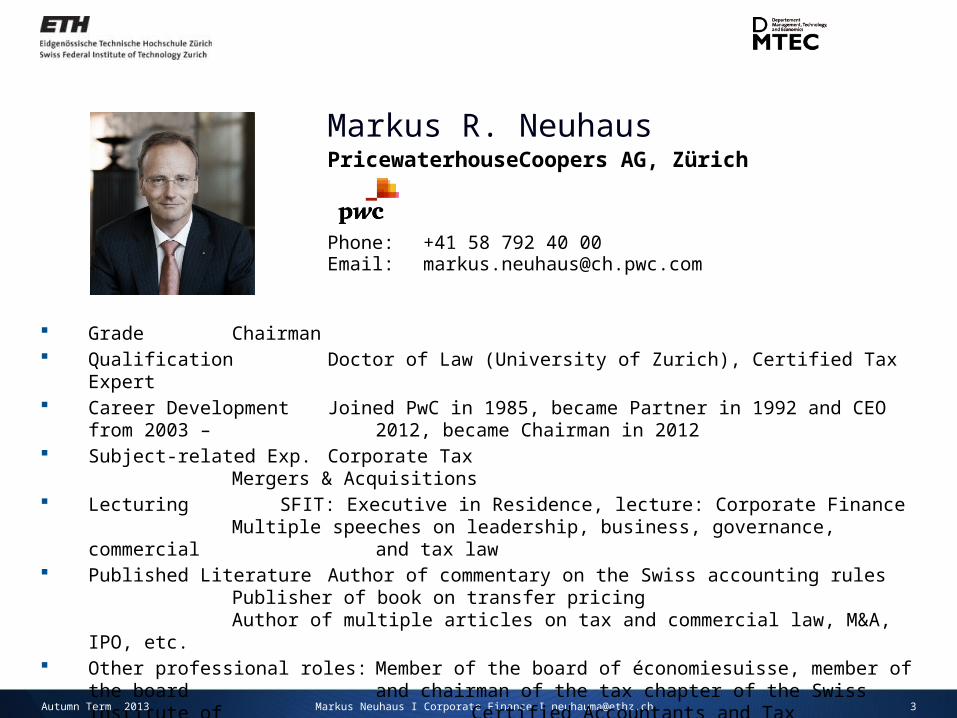
Grade Chairman Qualification Doctor of Law (University of Zurich), Certified Tax Expert Career Development Joined PwC in 1985, became Partner in 1992 and CEO from 2003 –
2012, became Chairman in 2012 Subject-related Exp. Corporate Tax
Mergers & Acquisitions Lecturing SFIT: Executive in Residence, lecture: Corporate Finance
Multiple speeches on leadership, business, governance, commercial and tax law
Published Literature Author of commentary on the Swiss accounting rulesPublisher of book on transfer pricingAuthor of multiple articles on tax and commercial law, M&A, IPO,
etc. Other professional roles: Member of the board of économiesuisse, member of the board
and chairman of the tax chapter of the Swiss Institute of Certified Accountants and Tax Consultants
Markus R. NeuhausPricewaterhouseCoopers AG, Zürich
Phone: +41 58 792 40 00Email: [email protected]
Autumn Term 2013

4Markus Neuhaus I Corporate Finance I [email protected]
Marc SchmidliPricewaterhouseCoopers AG, Zürich
Phone: +41 58 792 15 64Email: [email protected]
Grade Partner Qualification Dr. oec. HSG, CFA charterholder Career Development Corporate Finance PricewaterhouseCoopers since July 2000 Lecturing Euroforum – Valuation in M&A situations
Guest speaker at ZfU Seminars, Uni Zurich, ETH, etc. Published Literature Finanzielle Qualität in der schweizerischen Elektrizitätswirtschaft
Various articles in „Treuhänder“, HZ, etc.
Autumn Term 2013
5Markus Neuhaus I Corporate Finance I [email protected]
Contents
Learning targets Pre-course reading Lecture „Interpreting Financial Statements“ Pre-course reading case studies / questions Solutions to case studies
Autumn Term 2013
6Markus Neuhaus I Corporate Finance I [email protected]
Learning targets
Framework for financial statement analysis
Understanding the need for financial statement analysis
Understanding the financial reporting system
Refreshing principal elements of financial statements (Balance sheet, income and cash flow statements)
Analysis of financial statements
Understand the purpose and use of ratio analysis
Being able to apply the various ratio analyses
Being able to evaluate corporate performance by the integrated analysis of ratios
Autumn Term 2013
7Markus Neuhaus I Corporate Finance I [email protected]
Contents
Learning targets Pre-course reading Lecture „Interpreting Financial Statements“ Pre-course reading case studies / questions Solutions to case studies
Autumn Term 2013
8Markus Neuhaus I Corporate Finance I [email protected]
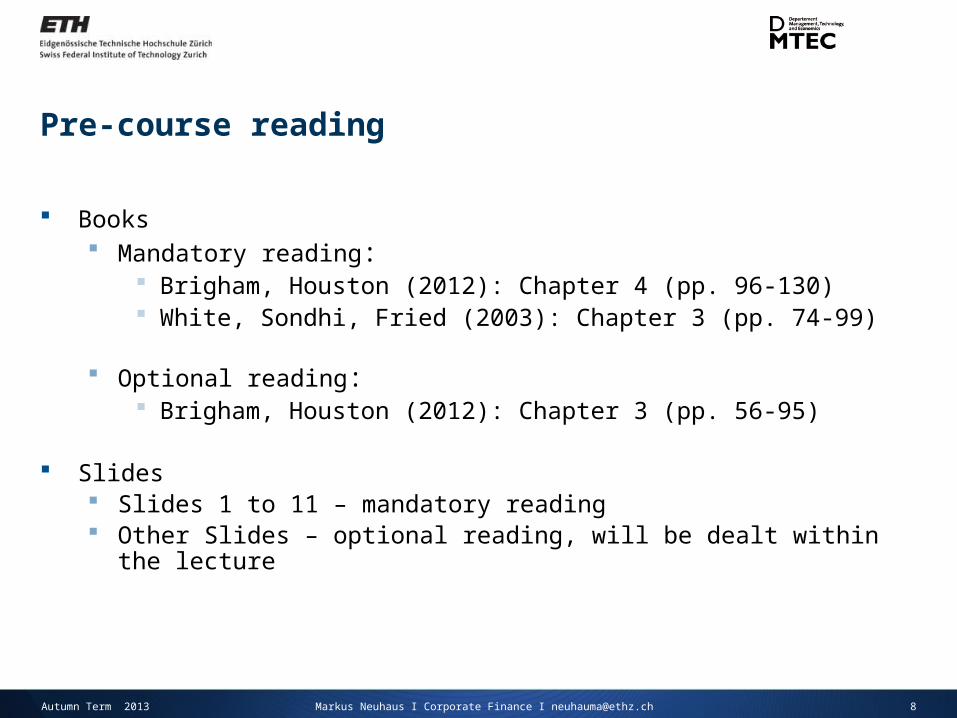
Pre-course reading
Books Mandatory reading:
Brigham, Houston (2012): Chapter 4 (pp. 96-130) White, Sondhi, Fried (2003): Chapter 3 (pp. 74-99)
Optional reading: Brigham, Houston (2012): Chapter 3 (pp. 56-95)
Slides Slides 1 to 11 – mandatory reading Other Slides – optional reading, will be dealt within the lecture
Autumn Term 2013
9Markus Neuhaus I Corporate Finance I [email protected]
Contents
Learning targets Pre-course reading Lecture „Interpreting Financial Statements“ Pre-course reading case studies / questions Solutions to case studies
Autumn Term 2013
10Markus Neuhaus I Corporate Finance I [email protected]
Agenda I
1. Introduction
Financial analysis
Classes of users
Need for financial statement analysis
2. Ratio analysis
Significance of ratio analysis
Sources
Financial reporting systems and standards
Important groups of ratio analysis
Autumn Term 2013
11Markus Neuhaus I Corporate Finance I [email protected]
Agenda II
3. Case study
Beans Incorporation vs. Garlic Incorporation
4. Q&A and discussion
Autumn Term 2013
12Markus Neuhaus I Corporate Finance I [email protected]
Agenda: Introduction
Financial analysis
Classes of users
Need for financial statement analysis
Autumn Term 2013
13Markus Neuhaus I Corporate Finance I [email protected]
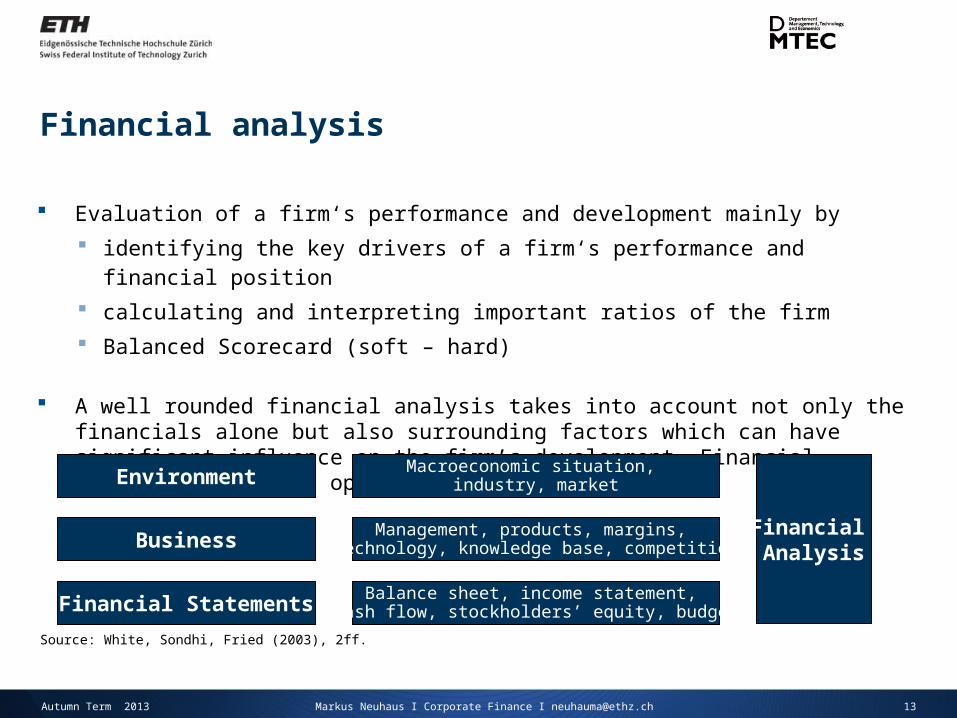
Evaluation of a firm‘s performance and development mainly by
identifying the key drivers of a firm‘s performance and financial position
calculating and interpreting important ratios of the firm
Balanced Scorecard (soft – hard)
A well rounded financial analysis takes into account not only the financials alone but also surrounding factors which can have significant influence on the firm’s development. Financial management does not operate in a vacuum.
Financial analysis
Source: White, Sondhi, Fried (2003), 2ff.
Environment
Financial Statements
Business
Macroeconomic situation, industry, market
Balance sheet, income statement, cash flow, stockholders’ equity, budget
Management, products, margins, technology, knowledge base, competition
Financial Analysis
Autumn Term 2013
14Markus Neuhaus I Corporate Finance I [email protected]
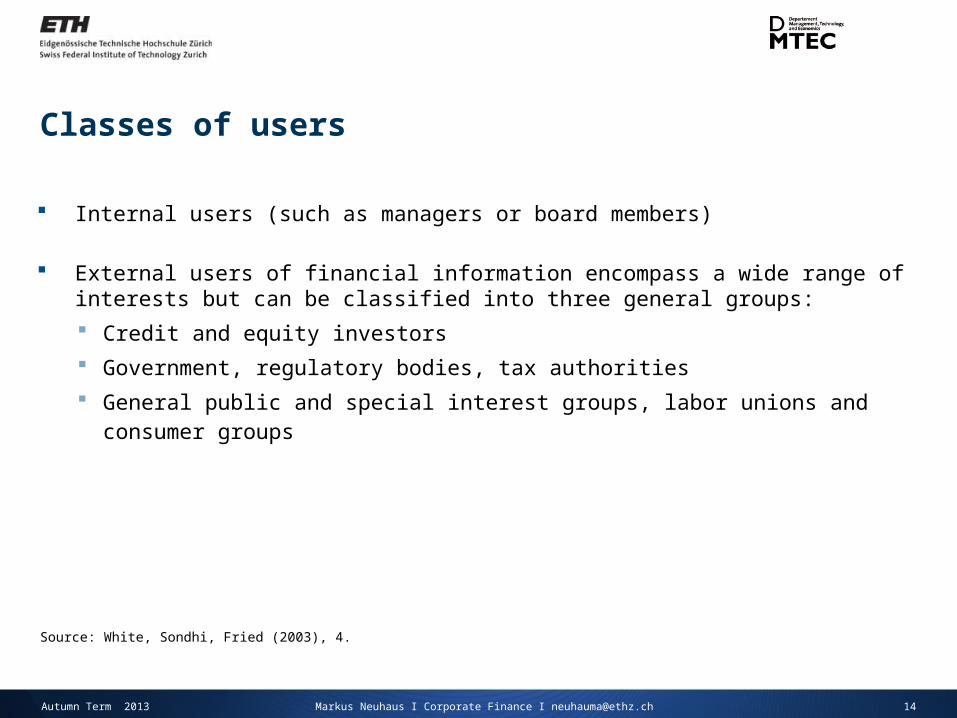
Internal users (such as managers or board members)
External users of financial information encompass a wide range of interests but can be classified into three general groups:
Credit and equity investors
Government, regulatory bodies, tax authorities
General public and special interest groups, labor unions and consumer groups
Classes of users
Source: White, Sondhi, Fried (2003), 4.
Autumn Term 2013
15Markus Neuhaus I Corporate Finance I [email protected]
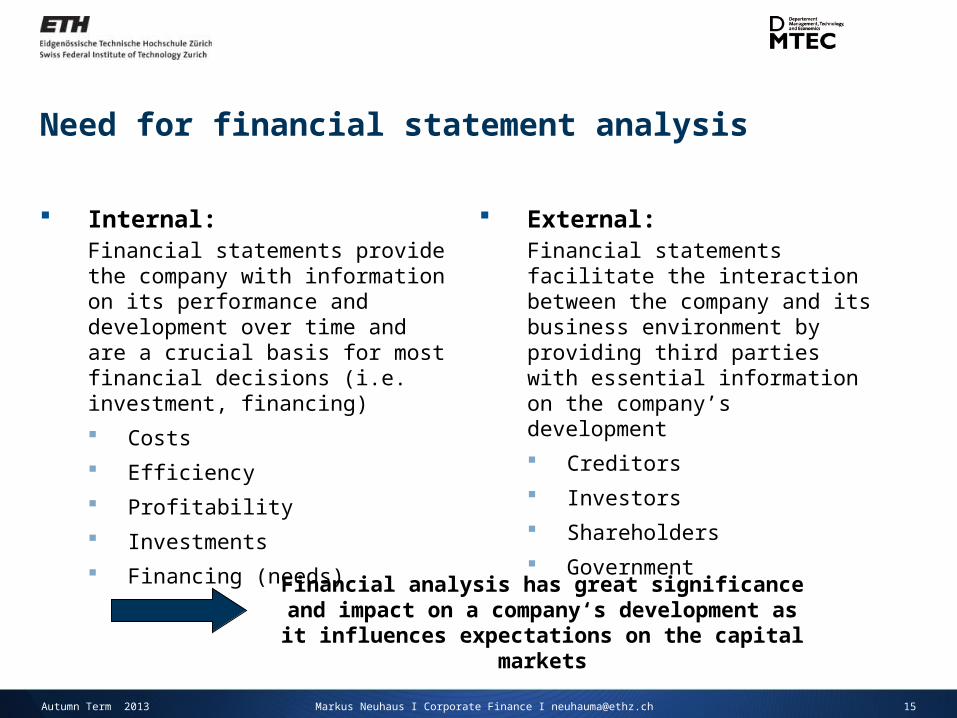
Need for financial statement analysis
Internal:Financial statements provide the company with information on its performance and development over time and are a crucial basis for most financial decisions (i.e. investment, financing)
Costs
Efficiency
Profitability
Investments
Financing (needs)
External:Financial statements facilitate the interaction between the company and its business environment by providing third parties with essential information on the company’s development
Creditors
Investors
Shareholders
Government
Financial analysis has great significance and impact on a company‘s development as it influences
expectations on the capital markets
Autumn Term 2013
16Markus Neuhaus I Corporate Finance I [email protected]
Agenda: Ratio analysis
Significance of ratio analysis
Sources
Financial reporting systems and standards
Important groups of ratio analysis
Autumn Term 2013
17Markus Neuhaus I Corporate Finance I [email protected]
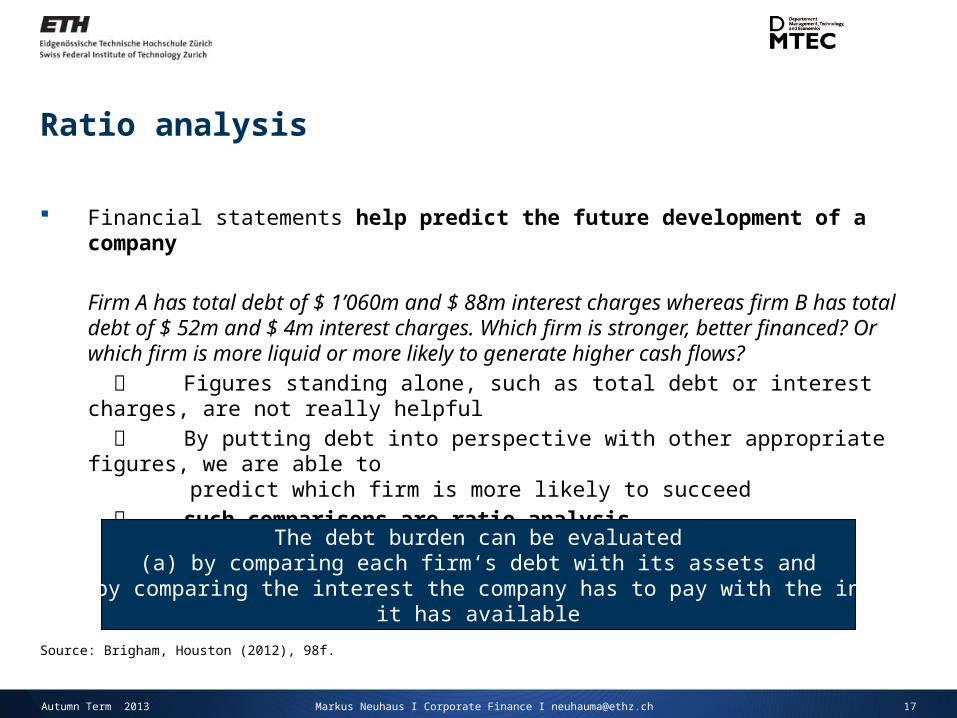
Ratio analysis
Financial statements help predict the future development of a company
Firm A has total debt of $ 1’060m and $ 88m interest charges whereas firm B has total debt of $ 52m and $ 4m interest charges. Which firm is stronger, better financed? Or which firm is more liquid or more likely to generate higher cash flows?
Figures standing alone, such as total debt or interest charges, are not really helpful
By putting debt into perspective with other appropriate figures, we are able to predict which firm is more likely to succeed
such comparisons are ratio analysis
The debt burden can be evaluated(a) by comparing each firm‘s debt with its assets and
(b) by comparing the interest the company has to pay with the incomeit has available
Source: Brigham, Houston (2012), 98f.
Autumn Term 2013
18Markus Neuhaus I Corporate Finance I [email protected]
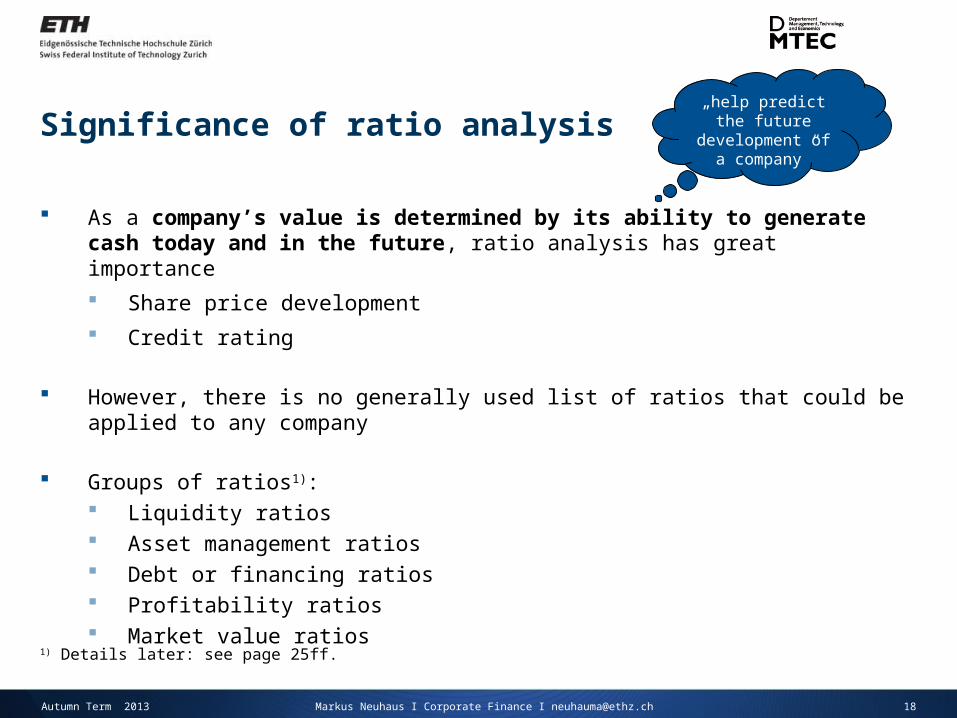
Significance of ratio analysis
As a company’s value is determined by its ability to generate cash today and in the future, ratio analysis has great importance
Share price development
Credit rating
However, there is no generally used list of ratios that could be applied to any company
Groups of ratios1): Liquidity ratios Asset management ratios Debt or financing ratios Profitability ratios Market value ratios
„help predict the future
development of a company”
1) Details later: see page 25ff.
Autumn Term 2013
19Markus Neuhaus I Corporate Finance I [email protected]
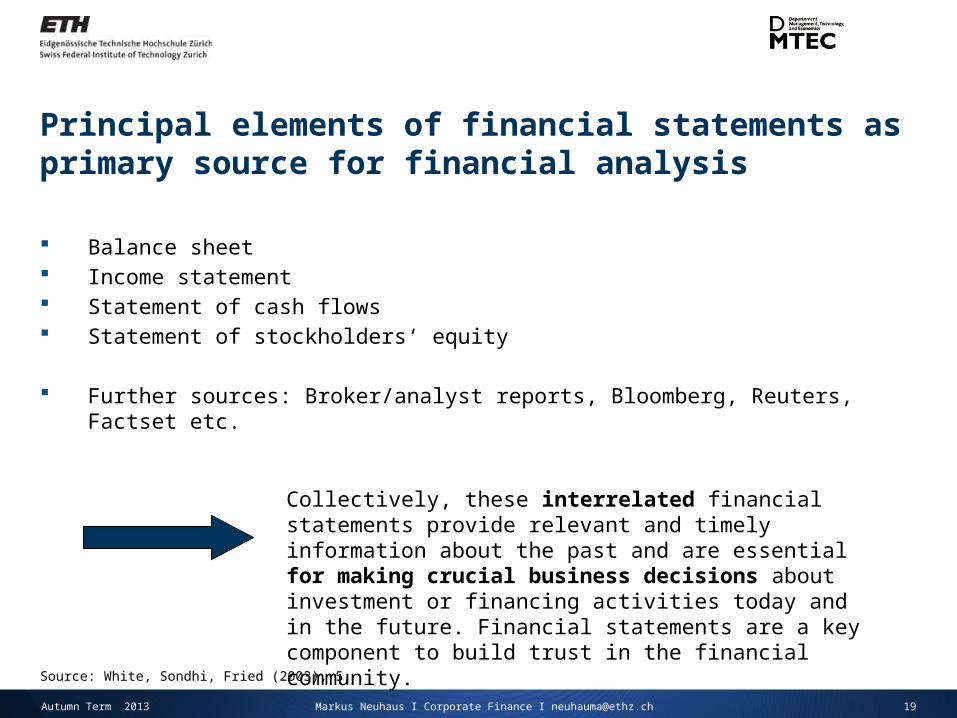
Principal elements of financial statements as primary source for financial analysis
Balance sheet Income statement Statement of cash flows Statement of stockholders‘ equity
Further sources: Broker/analyst reports, Bloomberg, Reuters, Factset etc.
Collectively, these interrelated financial statements provide relevant and timely information about the past and are essential for making crucial business decisions about investment or financing activities today and in the future. Financial statements are a key component to build trust in the financial community.
Source: White, Sondhi, Fried (2003), 5.
Autumn Term 2013
20Markus Neuhaus I Corporate Finance I [email protected]
Financial reporting systems and standards
Reporting systems and standards compel the company to meet a great number of requirements in order to ensure that the financial statements are, above all, transparent and comparable
The two most commonly used standards are:
IFRS (International Financial Reporting Standards)
US GAAP (United States Generally Accepted Accounting Principles)
Differences are found mainly in the classification of certain events (e.g. whether an interest payment is reported under operating costs or financing costs etc.) or with regard to financial instruments. Both aim to provide a “true and fair view”of the company’s performance.
In addition, there are local GAAPs (Generally Accepted Accounting Principles). In Switzerland we have rules in the Code of Obligation which permit hidden reserves and the FER (Fachempfehlung für Rechnungslegung) which is a light form of IFRS.
Source: White, Sondhi, Fried (2003), 5ff.
Autumn Term 2013
21Markus Neuhaus I Corporate Finance I [email protected]
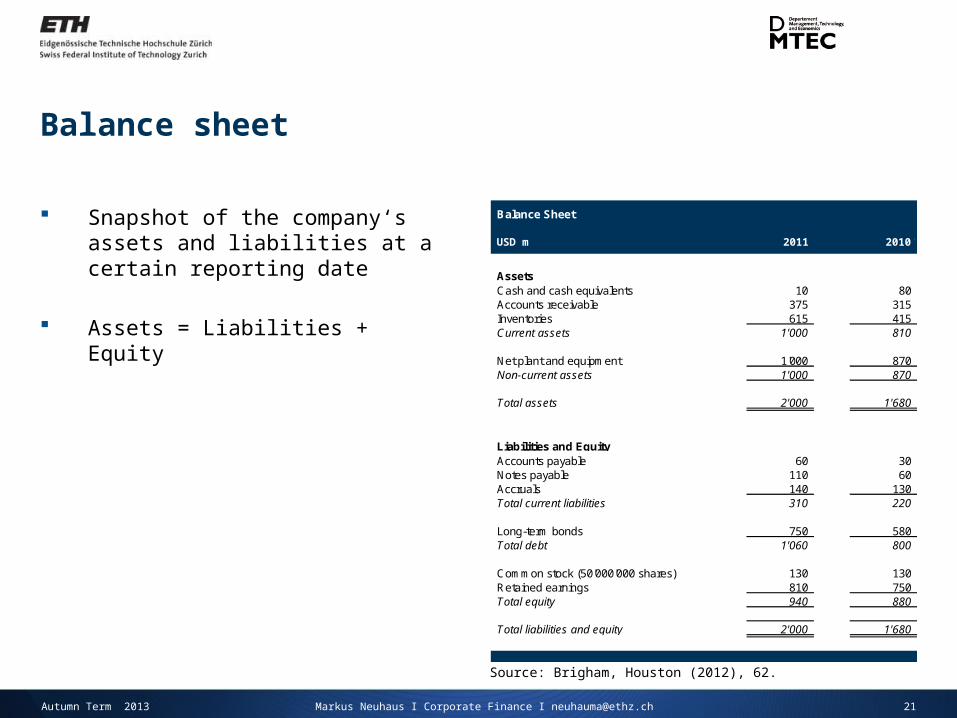
Balance sheet
Snapshot of the company‘s assets and liabilities at a certain reporting date
Assets = Liabilities + Equity
Source: Brigham, Houston (2012), 62.
Balance Sheet
(chf m) 2008 2007
AssetsCash and cash equivalents 10 80 Accounts receivable 375 315 Inventories 615 415 Current assets 1'000 810
Net plant and equipment 1'000 870 Non-current assets 1'000 870
Total assets 2'000 1'680
Liabilities and EquityAccounts payable 60 30 Notes payable 110 60 Accruals 140 130 Total current liabilities 310 220
Long-term bonds 750 580 Total debt 1'060 800
Common stock (50'000'000 shares) 130 130 Retained earnings 810 750 Total equity 940 880
Total liabilities and equity 2'000 1'680
USD m 2011 2010
Autumn Term 2013
22Markus Neuhaus I Corporate Finance I [email protected]
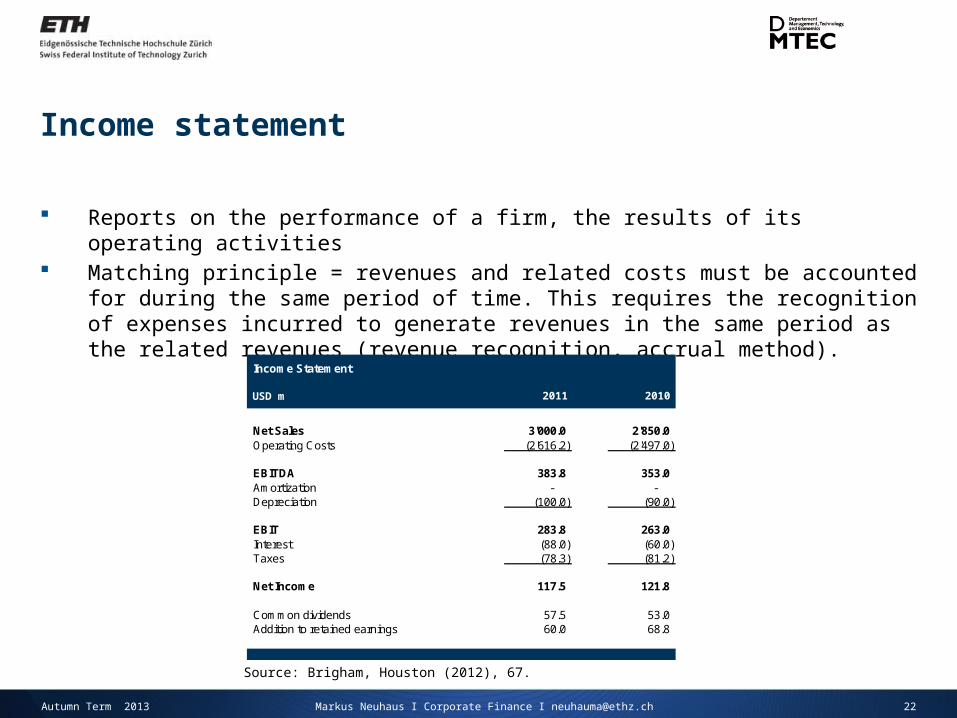
Income statement
Reports on the performance of a firm, the results of its operating activities Matching principle = revenues and related costs must be accounted for during the same
period of time. This requires the recognition of expenses incurred to generate revenues in the same period as the related revenues (revenue recognition, accrual method).
Source: Brigham, Houston (2012), 67.
Income Statement
(chf in millions) 2008 2007
Net Sales 3'000.0 2'850.0 Operating Costs (2'616.2) (2'497.0)
EBITDA 383.8 353.0 Amortization - - Depreciation (100.0) (90.0)
EBIT 283.8 263.0 Interest (88.0) (60.0) Taxes (78.3) (81.2)
Net Income 117.5 121.8
Common dividends 57.5 53.0 Addition to retained earnings 60.0 68.8
USD m 2011 2010
Autumn Term 2013
23Markus Neuhaus I Corporate Finance I [email protected]
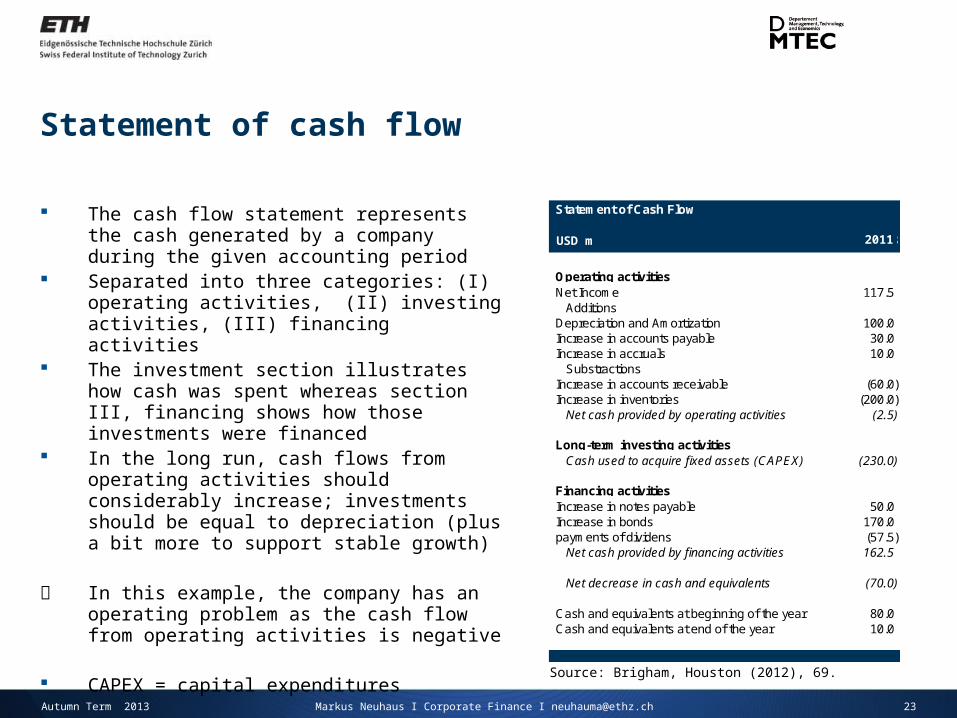
Statement of cash flow
The cash flow statement represents the cash generated by a company during the given accounting period
Separated into three categories: (I) operating activities, (II) investing activities, (III) financing activities
The investment section illustrates how cash was spent whereas section III, financing shows how those investments were financed
In the long run, cash flows from operating activities should considerably increase; investments should be equal to depreciation (plus a bit more to support stable growth)
In this example, the company has an operating problem as the cash flow from operating activities is negative
CAPEX = capital expenditures
Source: Brigham, Houston (2012), 69.
Statement of Cash Flow
(chf in millions) 2008
Operating activitiesNet Income 117.5
AdditionsDepreciation and Amortization 100.0 Increase in accounts payable 30.0 Increase in accruals 10.0
SubstractionsIncrease in accounts receivable (60.0) Increase in inventories (200.0)
Net cash provided by operating activities (2.5)
Long-term investing activitiesCash used to acquire fixed assets (CAPEX) (230.0)
Financing activitiesIncrease in notes payable 50.0 Increase in bonds 170.0 payments of dividens (57.5)
Net cash provided by financing activities 162.5
Net decrease in cash and equivalents (70.0)
Cash and equivalents at beginning of the year 80.0 Cash and equivalents at end of the year 10.0
USD m 2011
Autumn Term 2013
24Markus Neuhaus I Corporate Finance I [email protected]
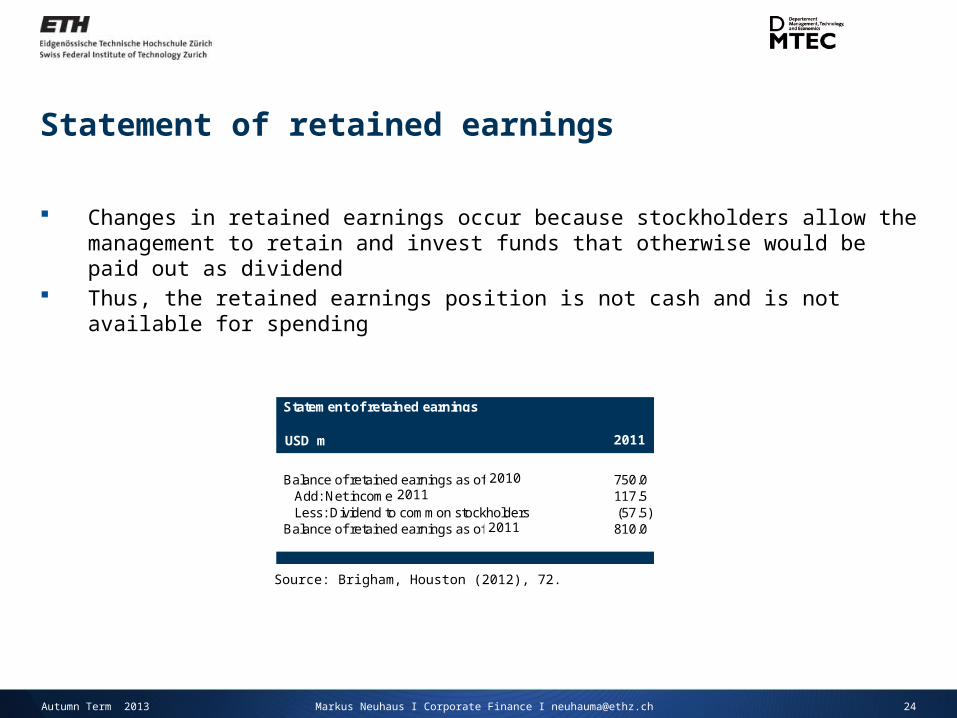
Statement of retained earnings
Changes in retained earnings occur because stockholders allow the management to retain and invest funds that otherwise would be paid out as dividend
Thus, the retained earnings position is not cash and is not available for spending
Source: Brigham, Houston (2012), 72.
Statement of retained earnings
(chf in millions) 2008
Balance of retained earnings as of 2007 750.0 Add: Net income 2008 117.5 Less: Dividend to common stockholders (57.5)
Balance of retained earnings as of 2008 810.0
USD m
20102011
2011
2011
Autumn Term 2013
25Markus Neuhaus I Corporate Finance I [email protected]
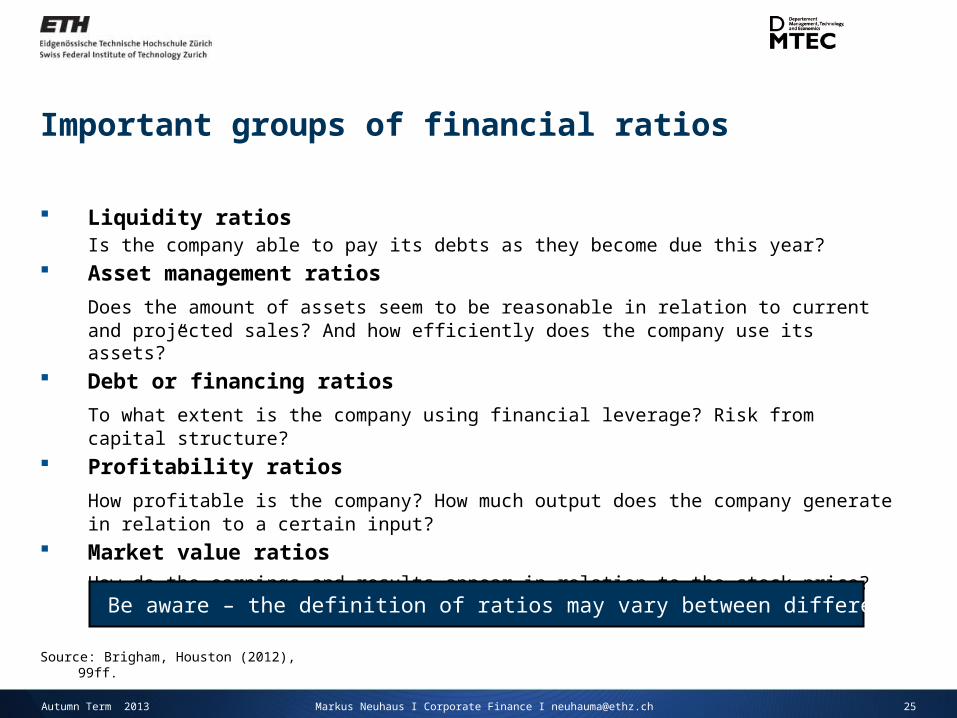
Important groups of financial ratios
Liquidity ratiosIs the company able to pay its debts as they become due this year?
Asset management ratios
Does the amount of assets seem to be reasonable in relation to current and projected sales? And how efficiently does the company use its assets?”
Debt or financing ratios
To what extent is the company using financial leverage? Risk from capital structure?
Profitability ratios
How profitable is the company? How much output does the company generate in relation to a certain input?
Market value ratios
How do the earnings and results appear in relation to the stock price?
Source: Brigham, Houston (2012), 99ff.
Be aware – the definition of ratios may vary between different authors or users!
Autumn Term 2013
26Markus Neuhaus I Corporate Finance I [email protected]
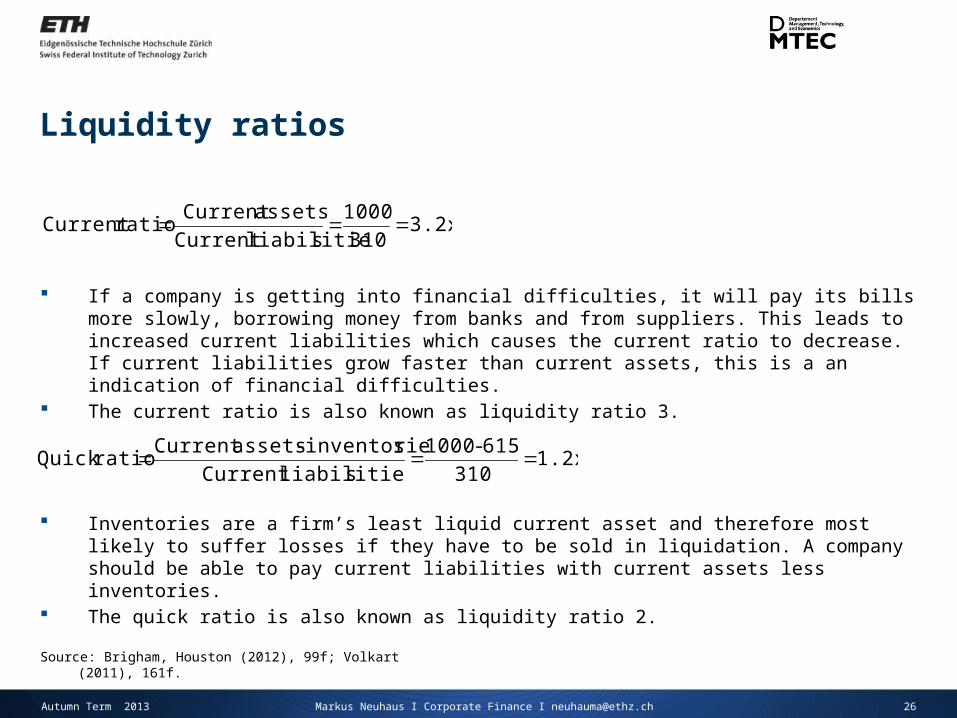
Liquidity ratios
3.2x 310
1000
sliabilitie Current
assets Current ratio Current
1.2x 310
615-1000sliabilitie Current
sinventorie - assets Current ratioQuick
Inventories are a firm’s least liquid current asset and therefore most likely to suffer losses if they have to be sold in liquidation. A company should be able to pay current liabilities with current assets less inventories.
The quick ratio is also known as liquidity ratio 2.
If a company is getting into financial difficulties, it will pay its bills more slowly, borrowing money from banks and from suppliers. This leads to increased current liabilities which causes the current ratio to decrease. If current liabilities grow faster than current assets, this is a an indication of financial difficulties.
The current ratio is also known as liquidity ratio 3.
Source: Brigham, Houston (2012), 99f; Volkart (2011), 161f.
Autumn Term 2013
27Markus Neuhaus I Corporate Finance I [email protected]
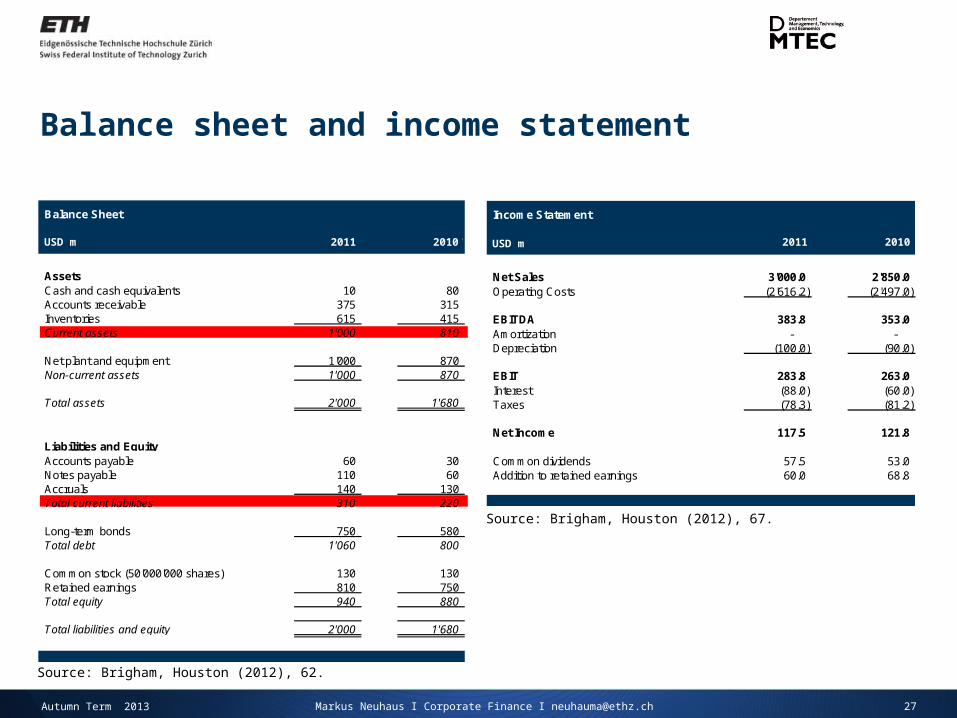
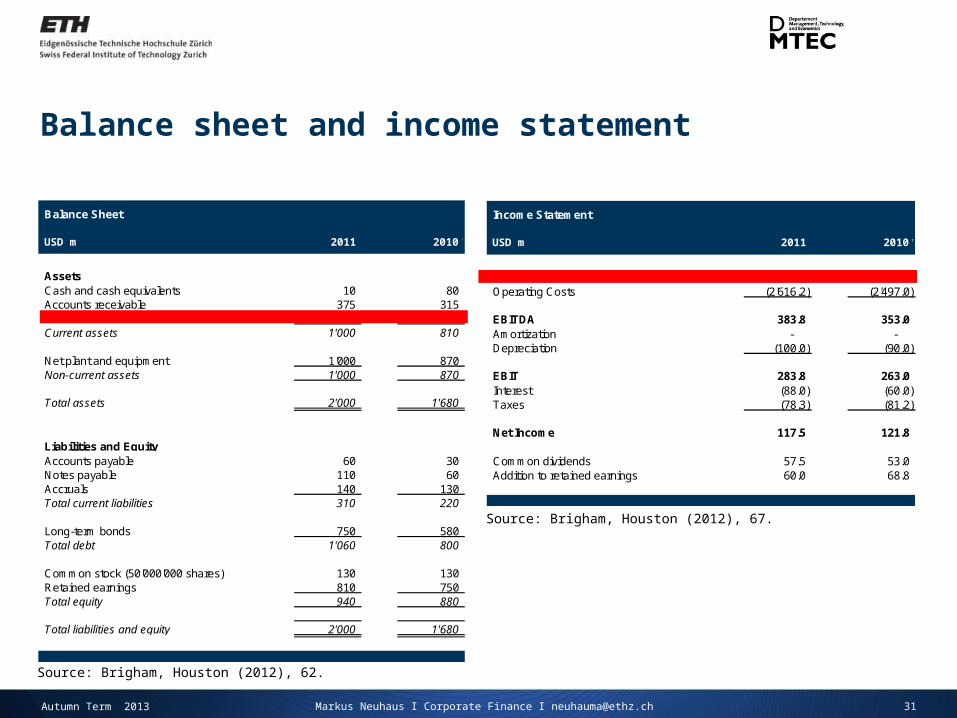
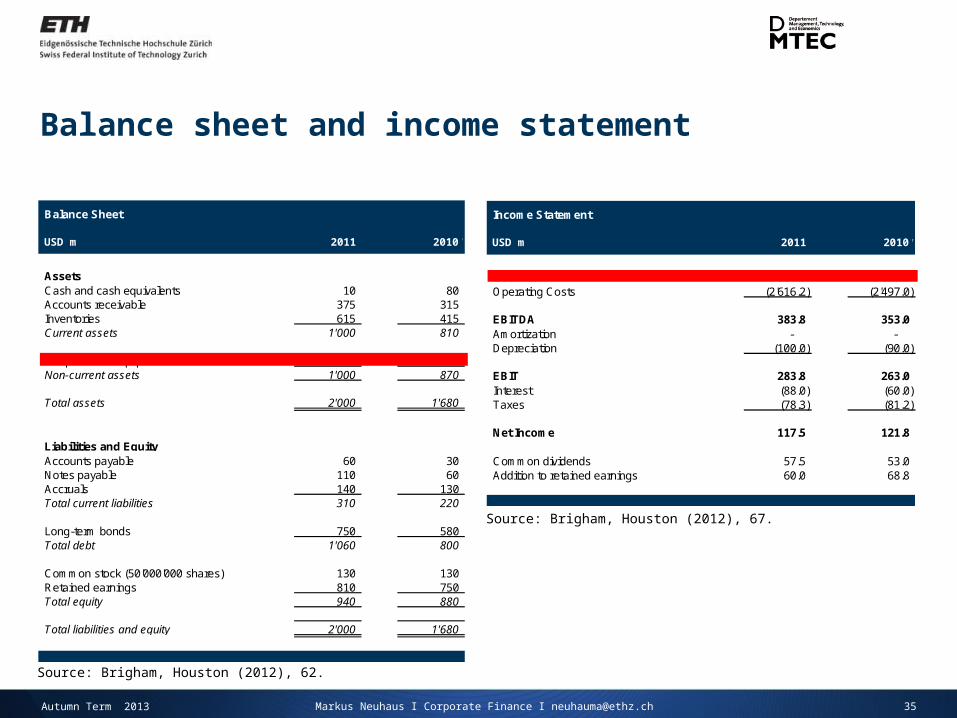
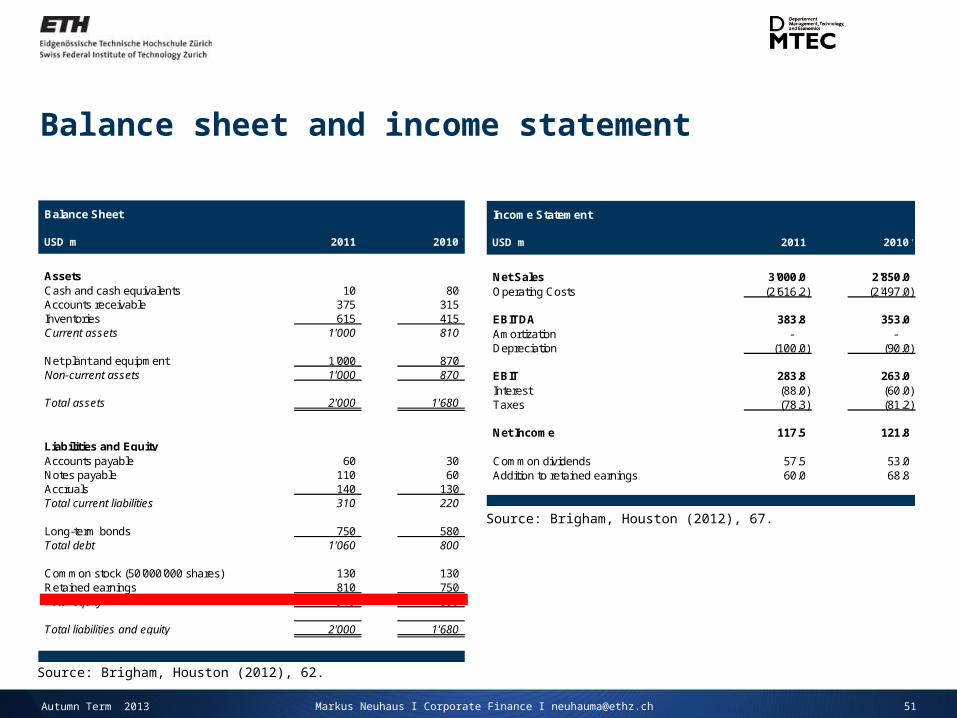
Balance sheet and income statement
Source: Brigham, Houston (2012), 62.
Balance Sheet
(chf m) 2008 2007
AssetsCash and cash equivalents 10 80 Accounts receivable 375 315 Inventories 615 415 Current assets 1'000 810
Net plant and equipment 1'000 870 Non-current assets 1'000 870
Total assets 2'000 1'680
Liabilities and EquityAccounts payable 60 30 Notes payable 110 60 Accruals 140 130 Total current liabilities 310 220
Long-term bonds 750 580 Total debt 1'060 800
Common stock (50'000'000 shares) 130 130 Retained earnings 810 750 Total equity 940 880
Total liabilities and equity 2'000 1'680
USD m 2011 2010
Source: Brigham, Houston (2012), 67.
Income Statement
(chf in millions) 2008 2007
Net Sales 3'000.0 2'850.0 Operating Costs (2'616.2) (2'497.0)
EBITDA 383.8 353.0 Amortization - - Depreciation (100.0) (90.0)
EBIT 283.8 263.0 Interest (88.0) (60.0) Taxes (78.3) (81.2)
Net Income 117.5 121.8
Common dividends 57.5 53.0 Addition to retained earnings 60.0 68.8
USD m 2011 2010
Autumn Term 2013
28Markus Neuhaus I Corporate Finance I [email protected]
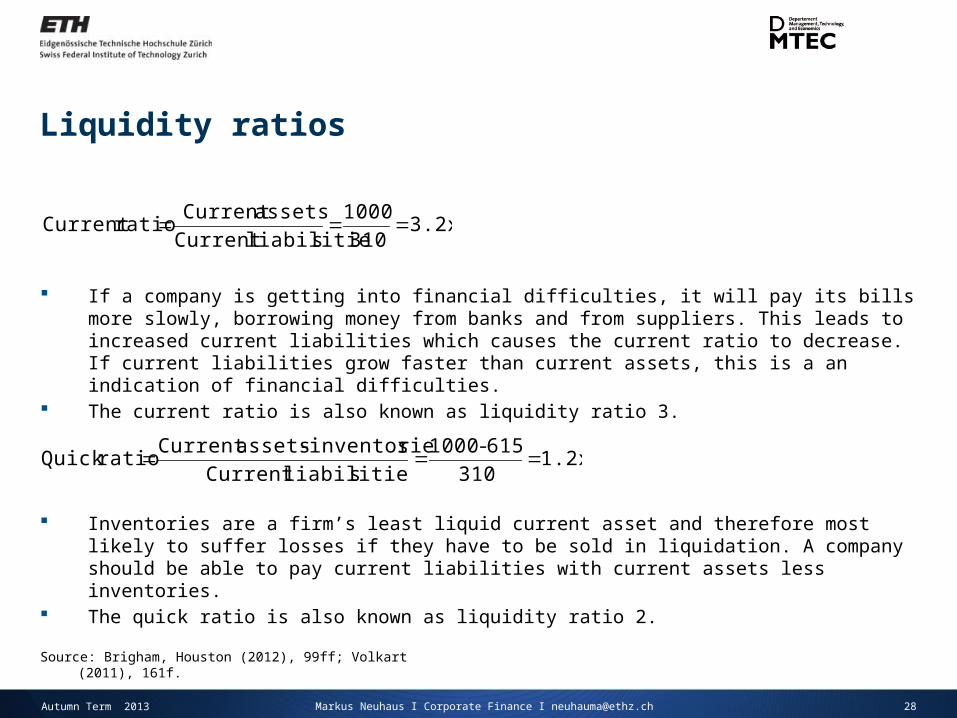
Liquidity ratios
3.2x 310
1000
sliabilitie Current
assets Current ratio Current
1.2x 310
615-1000sliabilitie Current
sinventorie - assets Current ratioQuick
Inventories are a firm’s least liquid current asset and therefore most likely to suffer losses if they have to be sold in liquidation. A company should be able to pay current liabilities with current assets less inventories.
The quick ratio is also known as liquidity ratio 2.
If a company is getting into financial difficulties, it will pay its bills more slowly, borrowing money from banks and from suppliers. This leads to increased current liabilities which causes the current ratio to decrease. If current liabilities grow faster than current assets, this is a an indication of financial difficulties.
The current ratio is also known as liquidity ratio 3.
Source: Brigham, Houston (2012), 99ff; Volkart (2011), 161f.
Autumn Term 2013
29Markus Neuhaus I Corporate Finance I [email protected]
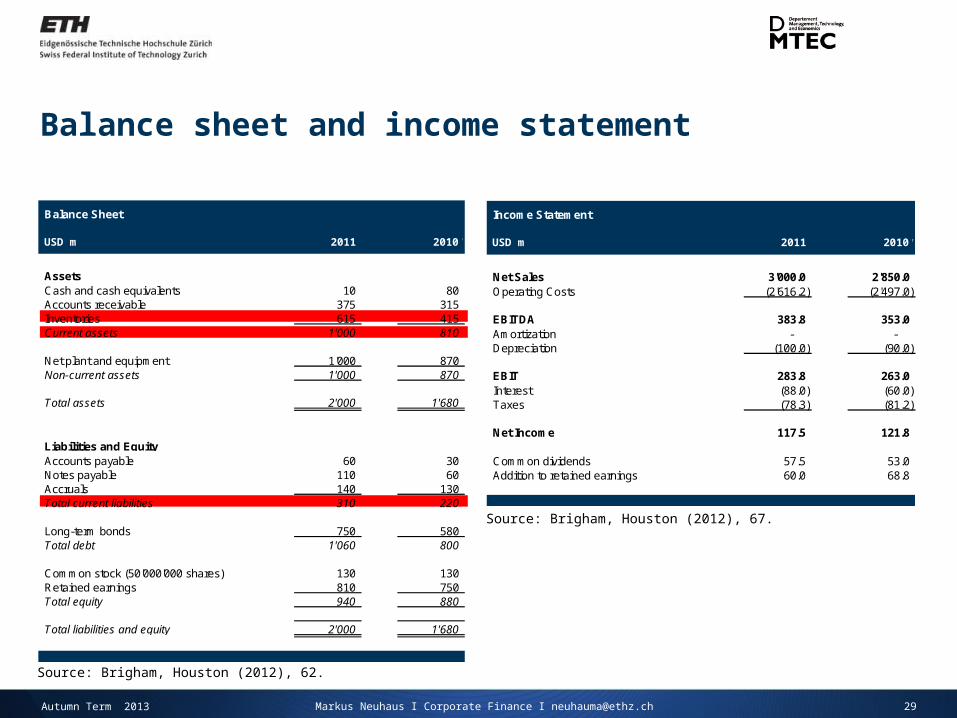
Balance sheet and income statement
Source: Brigham, Houston (2012), 62.
Balance Sheet
(chf m) 2008 2007
AssetsCash and cash equivalents 10 80 Accounts receivable 375 315 Inventories 615 415 Current assets 1'000 810
Net plant and equipment 1'000 870 Non-current assets 1'000 870
Total assets 2'000 1'680
Liabilities and EquityAccounts payable 60 30 Notes payable 110 60 Accruals 140 130 Total current liabilities 310 220
Long-term bonds 750 580 Total debt 1'060 800
Common stock (50'000'000 shares) 130 130 Retained earnings 810 750 Total equity 940 880
Total liabilities and equity 2'000 1'680
USD m 2011 2010
Source: Brigham, Houston (2012), 67.
Income Statement
(chf in millions) 2008 2007
Net Sales 3'000.0 2'850.0 Operating Costs (2'616.2) (2'497.0)
EBITDA 383.8 353.0 Amortization - - Depreciation (100.0) (90.0)
EBIT 283.8 263.0 Interest (88.0) (60.0) Taxes (78.3) (81.2)
Net Income 117.5 121.8
Common dividends 57.5 53.0 Addition to retained earnings 60.0 68.8
2011 2010USD m
Autumn Term 2013
30Markus Neuhaus I Corporate Finance I [email protected]
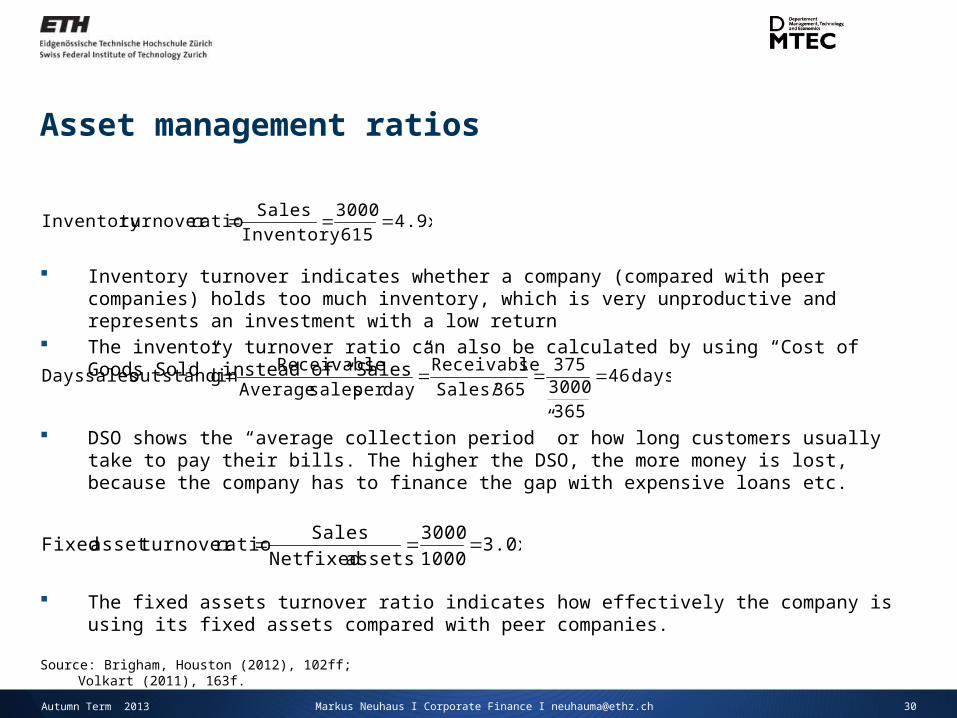
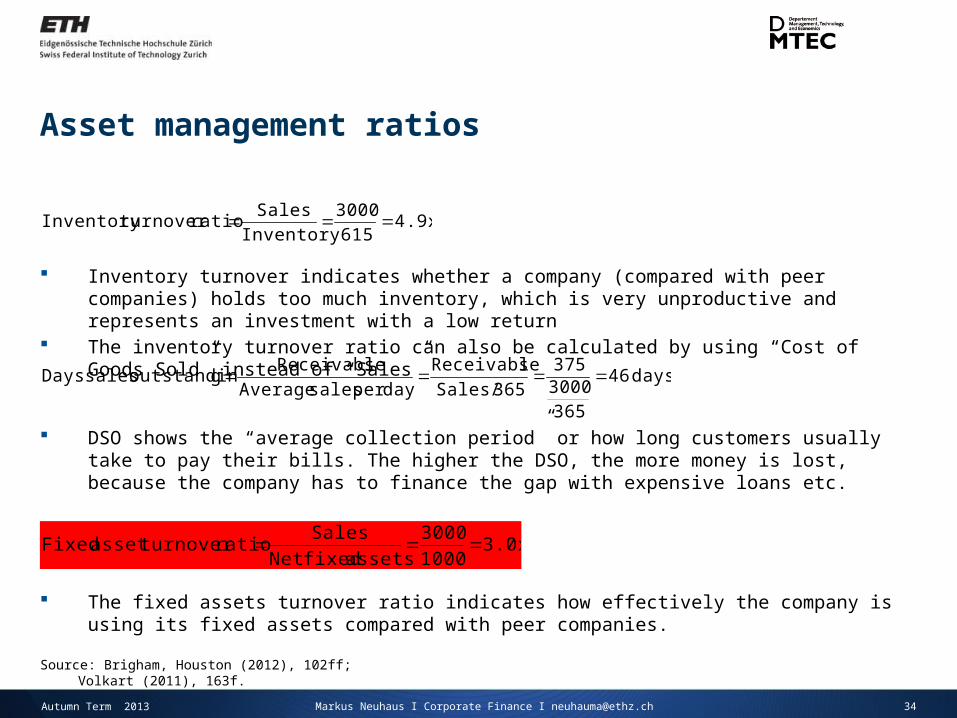
Asset management ratios
DSO shows the “average collection period” or how long customers usually take to pay their bills. The higher the DSO, the more money is lost, because the company has to finance the gap with expensive loans etc.
4.9x 615
3000
Inventory
Sales ratio turnoverInventory
days 46
3653000375
365 / Sales
sReceivable
day per sales Average
sReceivable goutstandin sales Days
3.0x 1000
3000
assets fixed Net
Sales ratio turnover asset Fixed
Inventory turnover indicates whether a company (compared with peer companies) holds too much inventory, which is very unproductive and represents an investment with a low return
The inventory turnover ratio can also be calculated by using “Cost of Goods Sold” instead of “Sales”
The fixed assets turnover ratio indicates how effectively the company is using its fixed assets compared with peer companies.
Source: Brigham, Houston (2012), 102ff; Volkart (2011), 163f.
Autumn Term 2013
Balance Sheet
(chf m) 2008 2007
AssetsCash and cash equivalents 10 80 Accounts receivable 375 315 Inventories 615 415 Current assets 1'000 810
Net plant and equipment 1'000 870 Non-current assets 1'000 870
Total assets 2'000 1'680
Liabilities and EquityAccounts payable 60 30 Notes payable 110 60 Accruals 140 130 Total current liabilities 310 220
Long-term bonds 750 580 Total debt 1'060 800
Common stock (50'000'000 shares) 130 130 Retained earnings 810 750 Total equity 940 880
Total liabilities and equity 2'000 1'680
USD m 2011 2010
Income Statement
(chf in millions) 2008 2007
Net Sales 3'000.0 2'850.0 Operating Costs (2'616.2) (2'497.0)
EBITDA 383.8 353.0 Amortization - - Depreciation (100.0) (90.0)
EBIT 283.8 263.0 Interest (88.0) (60.0) Taxes (78.3) (81.2)
Net Income 117.5 121.8
Common dividends 57.5 53.0 Addition to retained earnings 60.0 68.8
31Markus Neuhaus I Corporate Finance I [email protected]
Balance sheet and income statement
Source: Brigham, Houston (2012), 62.
Source: Brigham, Houston (2012), 67.
2011 2010USD m
Autumn Term 2013
32Markus Neuhaus I Corporate Finance I [email protected]
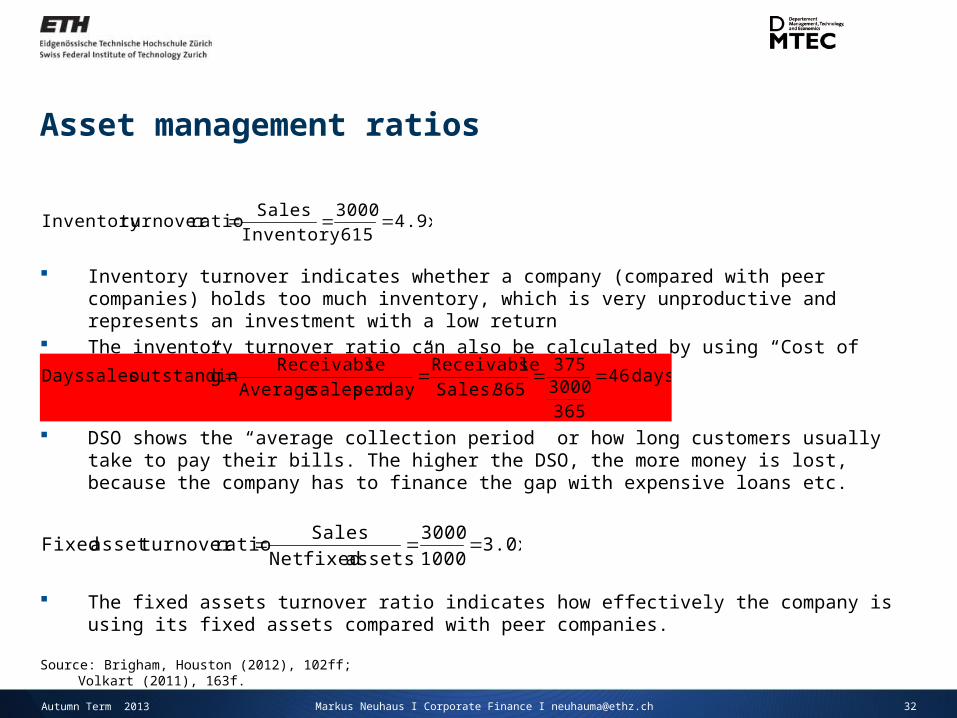
Asset management ratios
DSO shows the “average collection period” or how long customers usually take to pay their bills. The higher the DSO, the more money is lost, because the company has to finance the gap with expensive loans etc.
4.9x 615
3000
Inventory
Sales ratio turnoverInventory
days 46
3653000375
365 / Sales
sReceivable
day per sales Average
sReceivable goutstandin sales Days
3.0x 1000
3000
assets fixed Net
Sales ratio turnover asset Fixed
Inventory turnover indicates whether a company (compared with peer companies) holds too much inventory, which is very unproductive and represents an investment with a low return
The inventory turnover ratio can also be calculated by using “Cost of Goods Sold” instead of “Sales”
The fixed assets turnover ratio indicates how effectively the company is using its fixed assets compared with peer companies.
Source: Brigham, Houston (2012), 102ff; Volkart (2011), 163f.
Autumn Term 2013
Income Statement
(chf in millions) 2008 2007
Net Sales 3'000.0 2'850.0 Operating Costs (2'616.2) (2'497.0)
EBITDA 383.8 353.0 Amortization - - Depreciation (100.0) (90.0)
EBIT 283.8 263.0 Interest (88.0) (60.0) Taxes (78.3) (81.2)
Net Income 117.5 121.8
Common dividends 57.5 53.0 Addition to retained earnings 60.0 68.8
Balance Sheet
(chf m) 2008 2007
AssetsCash and cash equivalents 10 80 Accounts receivable 375 315 Inventories 615 415 Current assets 1'000 810
Net plant and equipment 1'000 870 Non-current assets 1'000 870
Total assets 2'000 1'680
Liabilities and EquityAccounts payable 60 30 Notes payable 110 60 Accruals 140 130 Total current liabilities 310 220
Long-term bonds 750 580 Total debt 1'060 800
Common stock (50'000'000 shares) 130 130 Retained earnings 810 750 Total equity 940 880
Total liabilities and equity 2'000 1'680
USD m 2011 2010
33Markus Neuhaus I Corporate Finance I [email protected]
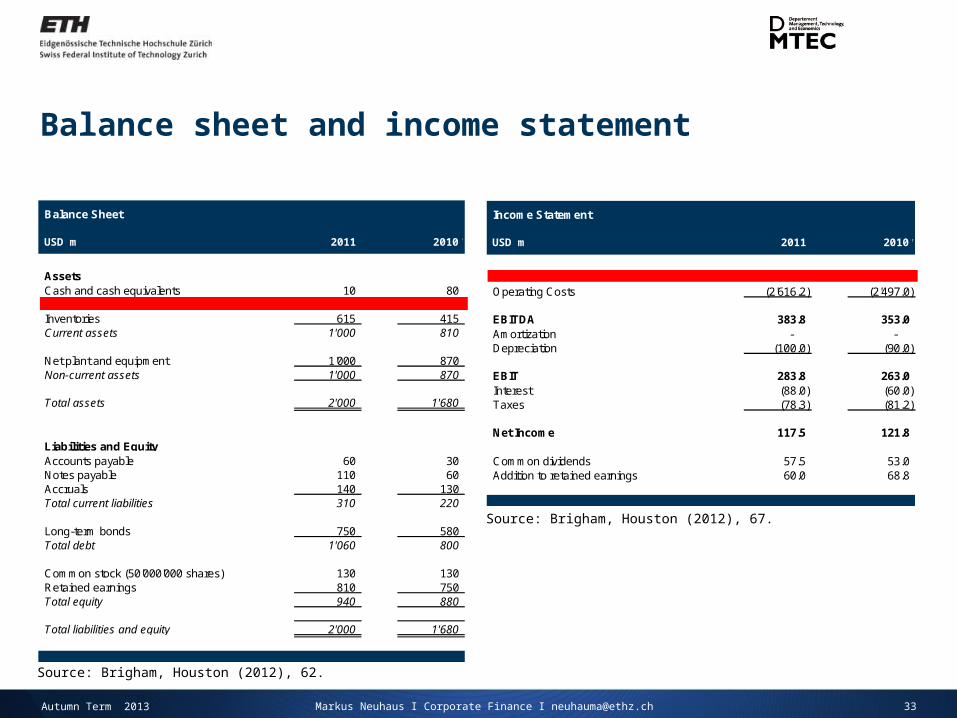
Balance sheet and income statement
Source: Brigham, Houston (2012), 62.
Source: Brigham, Houston (2012), 67.
2011 2010USD m
Autumn Term 2013
34Markus Neuhaus I Corporate Finance I [email protected]
Asset management ratios
DSO shows the “average collection period” or how long customers usually take to pay their bills. The higher the DSO, the more money is lost, because the company has to finance the gap with expensive loans etc.
4.9x 615
3000
Inventory
Sales ratio turnoverInventory
days 46
3653000375
365 / Sales
sReceivable
day per sales Average
sReceivable goutstandin sales Days
3.0x 1000
3000
assets fixed Net
Sales ratio turnover asset Fixed
Inventory turnover indicates whether a company (compared with peer companies) holds too much inventory, which is very unproductive and represents an investment with a low return
The inventory turnover ratio can also be calculated by using “Cost of Goods Sold” instead of “Sales”
The fixed assets turnover ratio indicates how effectively the company is using its fixed assets compared with peer companies.
Source: Brigham, Houston (2012), 102ff; Volkart (2011), 163f.
Autumn Term 2013
Income Statement
(chf in millions) 2008 2007
Net Sales 3'000.0 2'850.0 Operating Costs (2'616.2) (2'497.0)
EBITDA 383.8 353.0 Amortization - - Depreciation (100.0) (90.0)
EBIT 283.8 263.0 Interest (88.0) (60.0) Taxes (78.3) (81.2)
Net Income 117.5 121.8
Common dividends 57.5 53.0 Addition to retained earnings 60.0 68.8
Balance Sheet
(chf m) 2008 2007
AssetsCash and cash equivalents 10 80 Accounts receivable 375 315 Inventories 615 415 Current assets 1'000 810
Net plant and equipment 1'000 870 Non-current assets 1'000 870
Total assets 2'000 1'680
Liabilities and EquityAccounts payable 60 30 Notes payable 110 60 Accruals 140 130 Total current liabilities 310 220
Long-term bonds 750 580 Total debt 1'060 800
Common stock (50'000'000 shares) 130 130 Retained earnings 810 750 Total equity 940 880
Total liabilities and equity 2'000 1'680
USD m 2011 2010
35Markus Neuhaus I Corporate Finance I [email protected]
Balance sheet and income statement
Source: Brigham, Houston (2012), 62.
Source: Brigham, Houston (2012), 67.
2011 2010USD m
Autumn Term 2013
36Markus Neuhaus I Corporate Finance I [email protected]
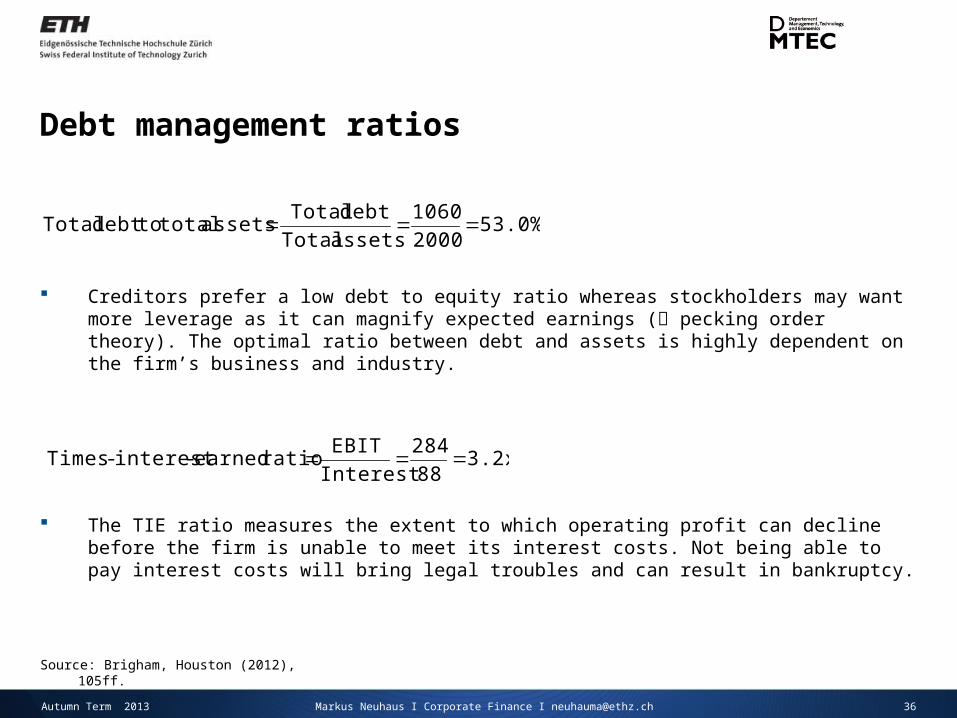
Debt management ratios
53.0% 2000
1060
assets Total
debt Total assets total to debt Total
3.2x 88
284
Interest
EBIT ratio earned-interest-Times
Creditors prefer a low debt to equity ratio whereas stockholders may want more leverage as it can magnify expected earnings ( pecking order theory). The optimal ratio between debt and assets is highly dependent on the firm’s business and industry.
The TIE ratio measures the extent to which operating profit can decline before the firm is unable to meet its interest costs. Not being able to pay interest costs will bring legal troubles and can result in bankruptcy.
Source: Brigham, Houston (2012), 105ff.
Autumn Term 2013
Balance Sheet
(chf m) 2008 2007
AssetsCash and cash equivalents 10 80 Accounts receivable 375 315 Inventories 615 415 Current assets 1'000 810
Net plant and equipment 1'000 870 Non-current assets 1'000 870
Total assets 2'000 1'680
Liabilities and EquityAccounts payable 60 30 Notes payable 110 60 Accruals 140 130 Total current liabilities 310 220
Long-term bonds 750 580 Total debt 1'060 800
Common stock (50'000'000 shares) 130 130 Retained earnings 810 750 Total equity 940 880
Total liabilities and equity 2'000 1'680
USD m 2011 2010
37Markus Neuhaus I Corporate Finance I [email protected]
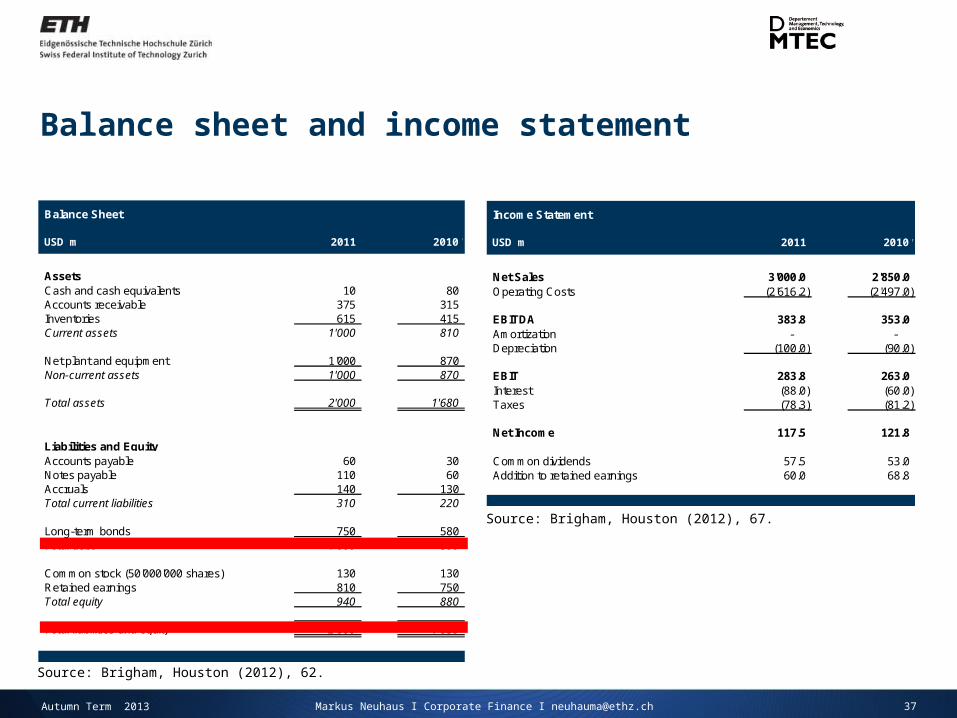
Balance sheet and income statement
Source: Brigham, Houston (2012), 62.
Source: Brigham, Houston (2012), 67.
Income Statement
(chf in millions) 2008 2007
Net Sales 3'000.0 2'850.0 Operating Costs (2'616.2) (2'497.0)
EBITDA 383.8 353.0 Amortization - - Depreciation (100.0) (90.0)
EBIT 283.8 263.0 Interest (88.0) (60.0) Taxes (78.3) (81.2)
Net Income 117.5 121.8
Common dividends 57.5 53.0 Addition to retained earnings 60.0 68.8
2011 2010USD m
Autumn Term 2013

38Markus Neuhaus I Corporate Finance I [email protected]
Debt management ratios
53.0% 2000
1060
assets Total
debt Total assets total to debt Total
3.2x 88
284
Interest
EBIT ratio earned-interest-Times
Creditors prefer a low debt to equity ratio whereas stockholders may want more leverage as it can magnify expected earnings ( pecking order theory). The optimal ratio between debt and assets is highly dependent on the firm’s business and industry.
The TIE ratio measures the extent to which operating profit can decline before the firm is unable to meet its interest costs. Not being able to pay interest costs will bring legal troubles and can result in bankruptcy.
Source: Brigham, Houston (2012), 105ff.
Autumn Term 2013
Income Statement
(chf in millions) 2008 2007
Net Sales 3'000.0 2'850.0 Operating Costs (2'616.2) (2'497.0)
EBITDA 383.8 353.0 Amortization - - Depreciation (100.0) (90.0)
EBIT 283.8 263.0 Interest (88.0) (60.0) Taxes (78.3) (81.2)
Net Income 117.5 121.8
Common dividends 57.5 53.0 Addition to retained earnings 60.0 68.8
39Markus Neuhaus I Corporate Finance I [email protected]
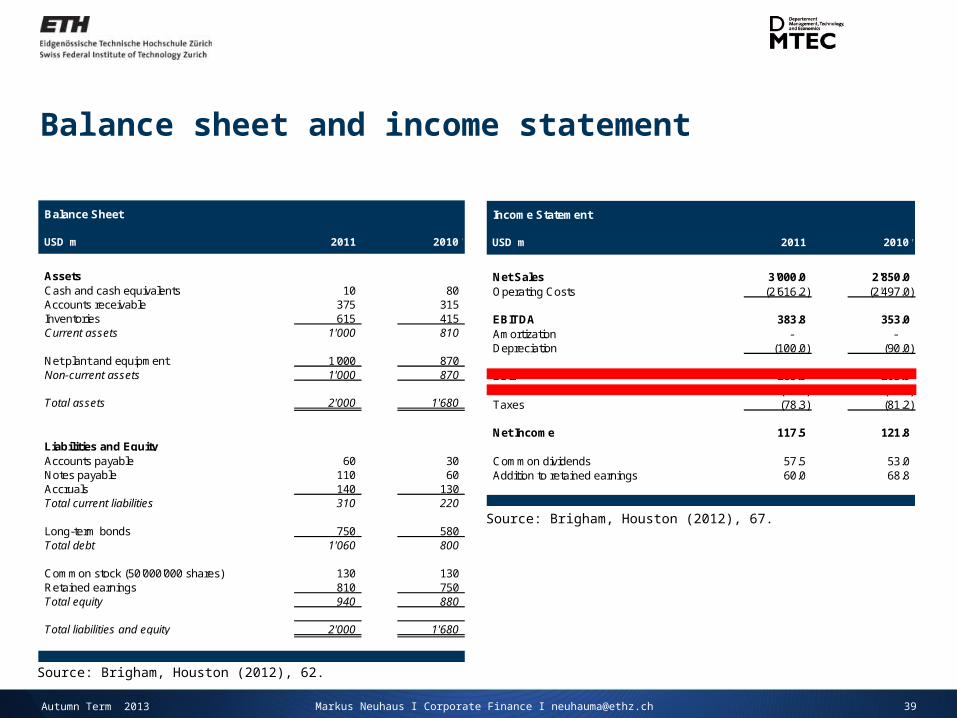
Balance sheet and income statement
Source: Brigham, Houston (2012), 62.
Balance Sheet
(chf m) 2008 2007
AssetsCash and cash equivalents 10 80 Accounts receivable 375 315 Inventories 615 415 Current assets 1'000 810
Net plant and equipment 1'000 870 Non-current assets 1'000 870
Total assets 2'000 1'680
Liabilities and EquityAccounts payable 60 30 Notes payable 110 60 Accruals 140 130 Total current liabilities 310 220
Long-term bonds 750 580 Total debt 1'060 800
Common stock (50'000'000 shares) 130 130 Retained earnings 810 750 Total equity 940 880
Total liabilities and equity 2'000 1'680
USD m 2011 2010
Source: Brigham, Houston (2012), 67.
2011 2010USD m
Autumn Term 2013
40Markus Neuhaus I Corporate Finance I [email protected]
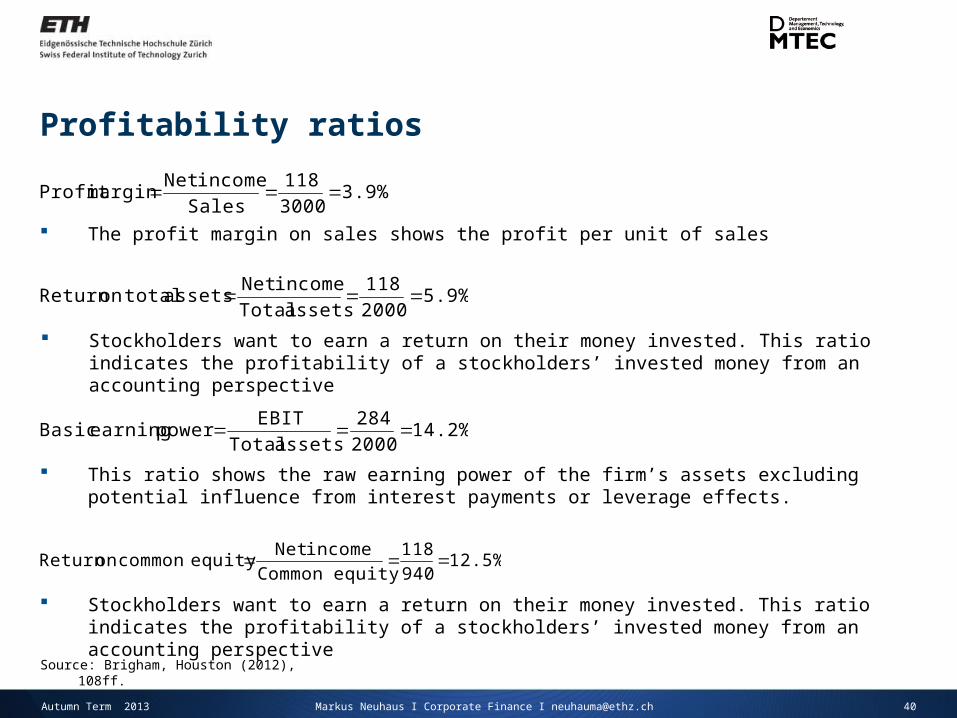
Profitability ratios
3.9% 3000118
Salesincome Net
margin Profit
14.2% 2000284
assets TotalEBIT
power earningBasic
The profit margin on sales shows the profit per unit of sales
12.5% 940
118
equity Common
income Netequity common on Return
Stockholders want to earn a return on their money invested. This ratio indicates the profitability of a stockholders’ invested money from an accounting perspective
This ratio shows the raw earning power of the firm’s assets excluding potential influence from interest payments or leverage effects.
Source: Brigham, Houston (2012), 108ff.
5.9% 2000118
assets Totalincome Net
assets total on Return
Stockholders want to earn a return on their money invested. This ratio indicates the profitability of a stockholders’ invested money from an accounting perspective
Autumn Term 2013
Income Statement
(chf in millions) 2008 2007
Net Sales 3'000.0 2'850.0 Operating Costs (2'616.2) (2'497.0)
EBITDA 383.8 353.0 Amortization - - Depreciation (100.0) (90.0)
EBIT 283.8 263.0 Interest (88.0) (60.0) Taxes (78.3) (81.2)
Net Income 117.5 121.8
Common dividends 57.5 53.0 Addition to retained earnings 60.0 68.8
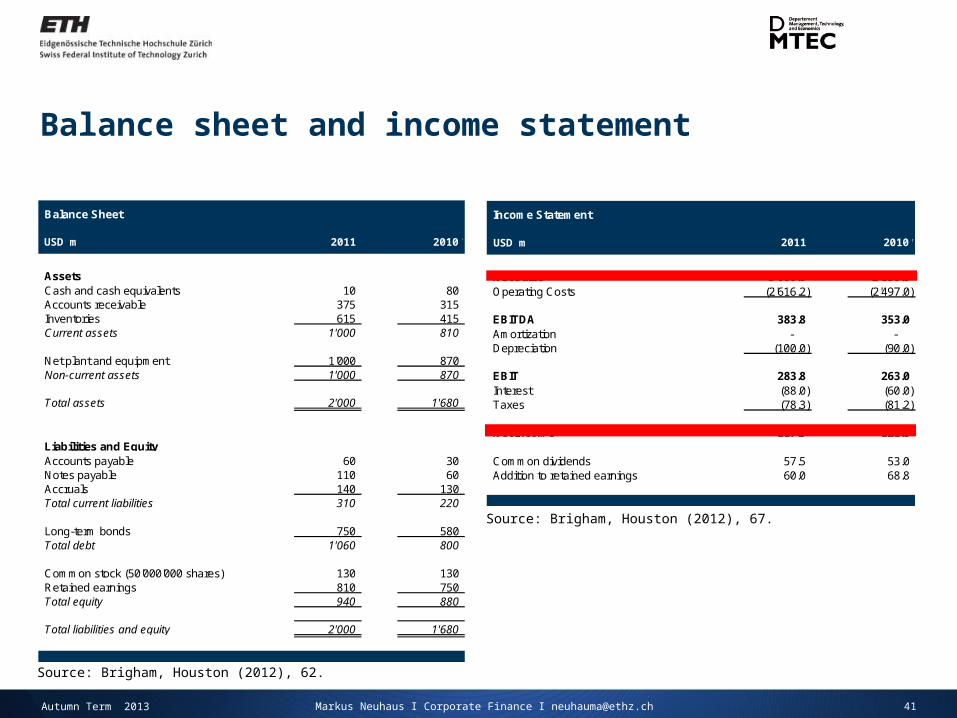
41Markus Neuhaus I Corporate Finance I [email protected]
Balance sheet and income statement
Source: Brigham, Houston (2012), 62.
Balance Sheet
(chf m) 2008 2007
AssetsCash and cash equivalents 10 80 Accounts receivable 375 315 Inventories 615 415 Current assets 1'000 810
Net plant and equipment 1'000 870 Non-current assets 1'000 870
Total assets 2'000 1'680
Liabilities and EquityAccounts payable 60 30 Notes payable 110 60 Accruals 140 130 Total current liabilities 310 220
Long-term bonds 750 580 Total debt 1'060 800
Common stock (50'000'000 shares) 130 130 Retained earnings 810 750 Total equity 940 880
Total liabilities and equity 2'000 1'680
USD m 2011 2010
Source: Brigham, Houston (2012), 67.
2011 2010USD m
Autumn Term 2013
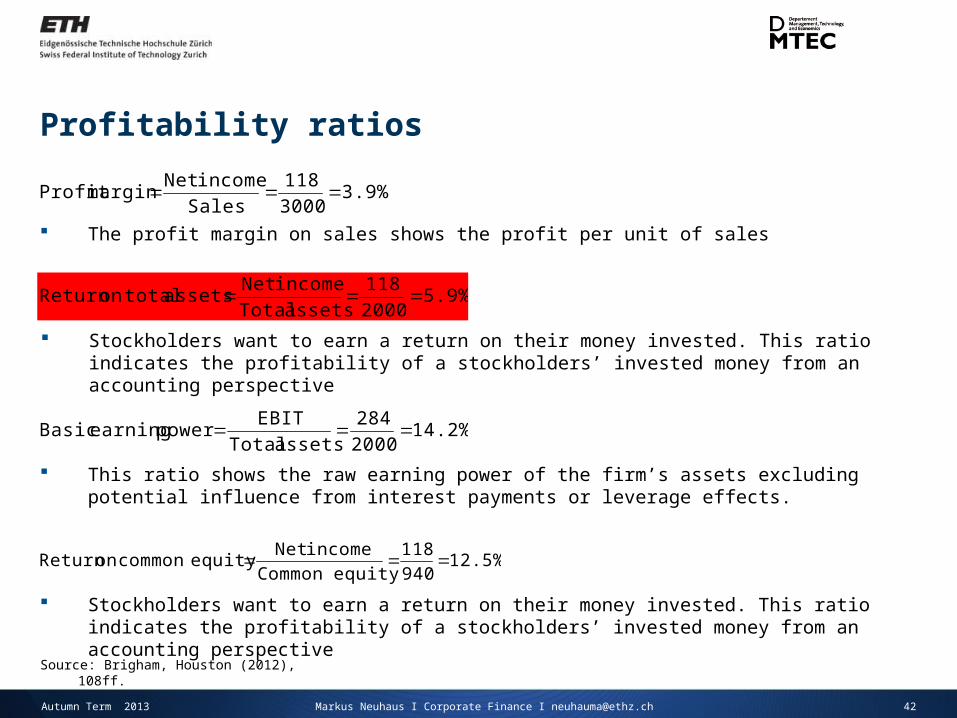
42Markus Neuhaus I Corporate Finance I [email protected]
Profitability ratios
3.9% 3000118
Salesincome Net
margin Profit
14.2% 2000284
assets TotalEBIT
power earningBasic
The profit margin on sales shows the profit per unit of sales
12.5% 940
118
equity Common
income Netequity common on Return
Stockholders want to earn a return on their money invested. This ratio indicates the profitability of a stockholders’ invested money from an accounting perspective
This ratio shows the raw earning power of the firm’s assets excluding potential influence from interest payments or leverage effects.
Source: Brigham, Houston (2012), 108ff.
5.9% 2000118
assets Totalincome Net
assets total on Return
Stockholders want to earn a return on their money invested. This ratio indicates the profitability of a stockholders’ invested money from an accounting perspective
Autumn Term 2013
Income Statement
(chf in millions) 2008 2007
Net Sales 3'000.0 2'850.0 Operating Costs (2'616.2) (2'497.0)
EBITDA 383.8 353.0 Amortization - - Depreciation (100.0) (90.0)
EBIT 283.8 263.0 Interest (88.0) (60.0) Taxes (78.3) (81.2)
Net Income 117.5 121.8
Common dividends 57.5 53.0 Addition to retained earnings 60.0 68.8
43Markus Neuhaus I Corporate Finance I [email protected]
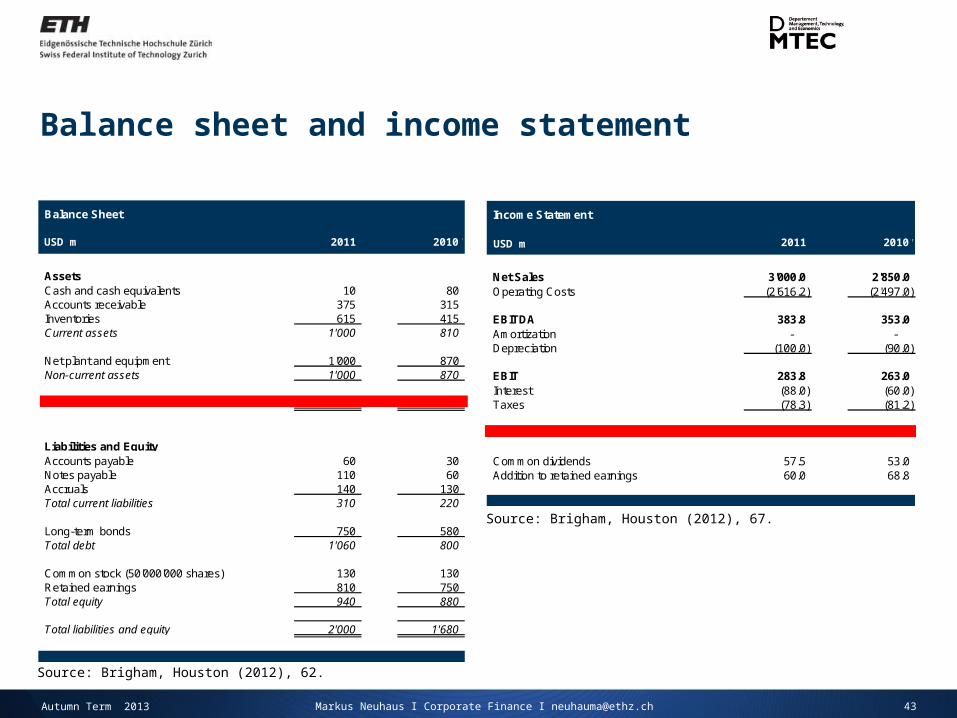
Balance sheet and income statement
Source: Brigham, Houston (2012), 62.
Balance Sheet
(chf m) 2008 2007
AssetsCash and cash equivalents 10 80 Accounts receivable 375 315 Inventories 615 415 Current assets 1'000 810
Net plant and equipment 1'000 870 Non-current assets 1'000 870
Total assets 2'000 1'680
Liabilities and EquityAccounts payable 60 30 Notes payable 110 60 Accruals 140 130 Total current liabilities 310 220
Long-term bonds 750 580 Total debt 1'060 800
Common stock (50'000'000 shares) 130 130 Retained earnings 810 750 Total equity 940 880
Total liabilities and equity 2'000 1'680
USD m 2011 2010
Source: Brigham, Houston (2012), 67.
2011 2010USD m
Autumn Term 2013
44Markus Neuhaus I Corporate Finance I [email protected]
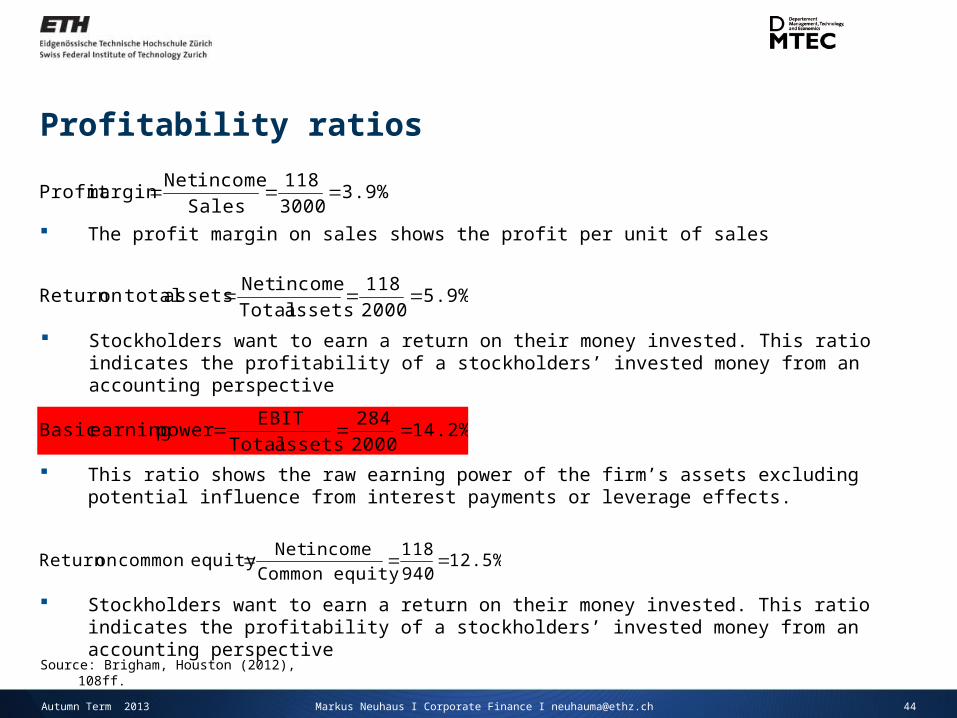
Profitability ratios
3.9% 3000118
Salesincome Net
margin Profit
14.2% 2000284
assets TotalEBIT
power earningBasic
The profit margin on sales shows the profit per unit of sales
12.5% 940
118
equity Common
income Netequity common on Return
Stockholders want to earn a return on their money invested. This ratio indicates the profitability of a stockholders’ invested money from an accounting perspective
This ratio shows the raw earning power of the firm’s assets excluding potential influence from interest payments or leverage effects.
Source: Brigham, Houston (2012), 108ff.
5.9% 2000118
assets Totalincome Net
assets total on Return
Stockholders want to earn a return on their money invested. This ratio indicates the profitability of a stockholders’ invested money from an accounting perspective
Autumn Term 2013
Balance Sheet
(chf m) 2008 2007
AssetsCash and cash equivalents 10 80 Accounts receivable 375 315 Inventories 615 415 Current assets 1'000 810
Net plant and equipment 1'000 870 Non-current assets 1'000 870
Total assets 2'000 1'680
Liabilities and EquityAccounts payable 60 30 Notes payable 110 60 Accruals 140 130 Total current liabilities 310 220
Long-term bonds 750 580 Total debt 1'060 800
Common stock (50'000'000 shares) 130 130 Retained earnings 810 750 Total equity 940 880
Total liabilities and equity 2'000 1'680
USD m 2011 2010
45Markus Neuhaus I Corporate Finance I [email protected]
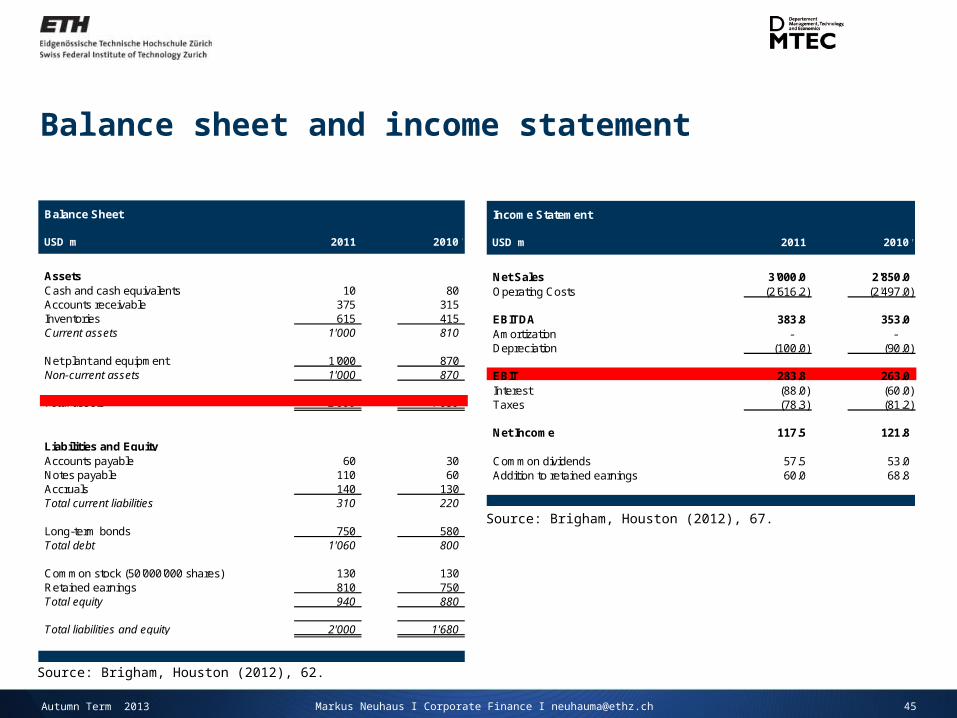
Balance sheet and income statement
Source: Brigham, Houston (2012), 62.
Source: Brigham, Houston (2012), 67.
Income Statement
(chf in millions) 2008 2007
Net Sales 3'000.0 2'850.0 Operating Costs (2'616.2) (2'497.0)
EBITDA 383.8 353.0 Amortization - - Depreciation (100.0) (90.0)
EBIT 283.8 263.0 Interest (88.0) (60.0) Taxes (78.3) (81.2)
Net Income 117.5 121.8
Common dividends 57.5 53.0 Addition to retained earnings 60.0 68.8
2011 2010USD m
Autumn Term 2013
46Markus Neuhaus I Corporate Finance I [email protected]
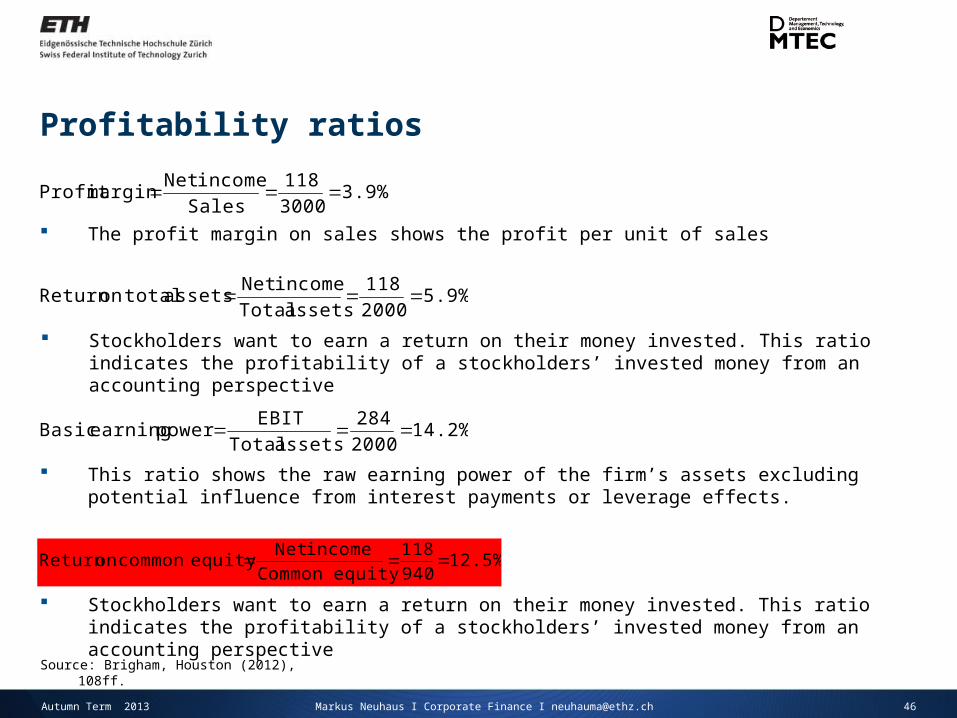
Profitability ratios
3.9% 3000118
Salesincome Net
margin Profit
14.2% 2000284
assets TotalEBIT
power earningBasic
The profit margin on sales shows the profit per unit of sales
12.5% 940
118
equity Common
income Netequity common on Return
Stockholders want to earn a return on their money invested. This ratio indicates the profitability of a stockholders’ invested money from an accounting perspective
This ratio shows the raw earning power of the firm’s assets excluding potential influence from interest payments or leverage effects.
Source: Brigham, Houston (2012), 108ff.
5.9% 2000118
assets Totalincome Net
assets total on Return
Stockholders want to earn a return on their money invested. This ratio indicates the profitability of a stockholders’ invested money from an accounting perspective
Autumn Term 2013
Balance Sheet
(chf m) 2008 2007
AssetsCash and cash equivalents 10 80 Accounts receivable 375 315 Inventories 615 415 Current assets 1'000 810
Net plant and equipment 1'000 870 Non-current assets 1'000 870
Total assets 2'000 1'680
Liabilities and EquityAccounts payable 60 30 Notes payable 110 60 Accruals 140 130 Total current liabilities 310 220
Long-term bonds 750 580 Total debt 1'060 800
Common stock (50'000'000 shares) 130 130 Retained earnings 810 750 Total equity 940 880
Total liabilities and equity 2'000 1'680
USD m 2011 2010
Income Statement
(chf in millions) 2008 2007
Net Sales 3'000.0 2'850.0 Operating Costs (2'616.2) (2'497.0)
EBITDA 383.8 353.0 Amortization - - Depreciation (100.0) (90.0)
EBIT 283.8 263.0 Interest (88.0) (60.0) Taxes (78.3) (81.2)
Net Income 117.5 121.8
Common dividends 57.5 53.0 Addition to retained earnings 60.0 68.8
47Markus Neuhaus I Corporate Finance I [email protected]
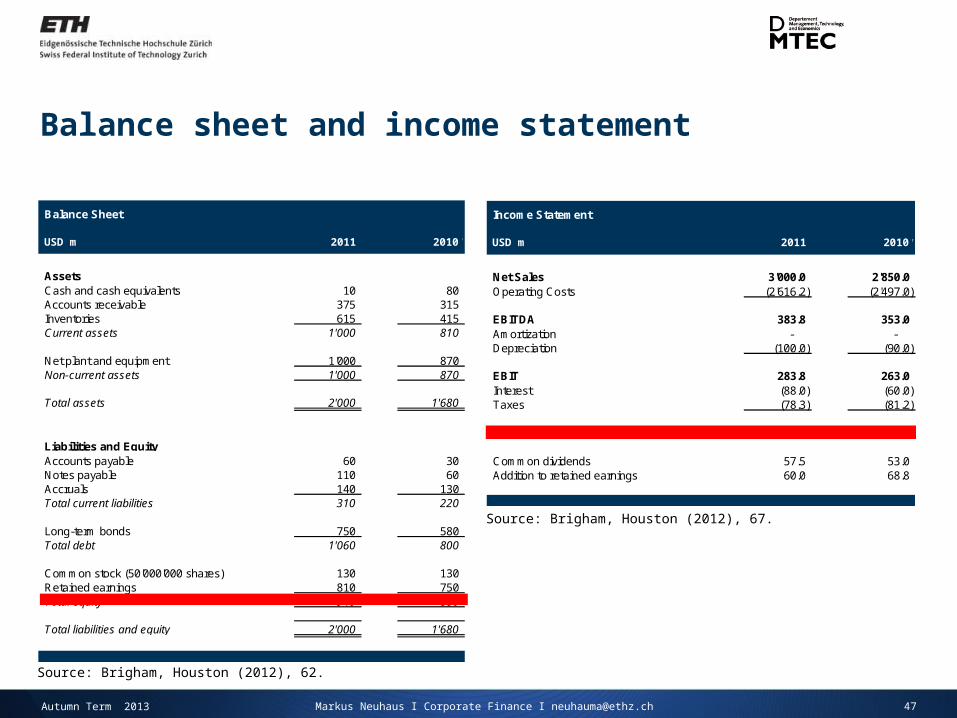
Balance sheet and income statement
Source: Brigham, Houston (2012), 62.
Source: Brigham, Houston (2012), 67.
2011 2010USD m
Autumn Term 2013
48Markus Neuhaus I Corporate Finance I [email protected]
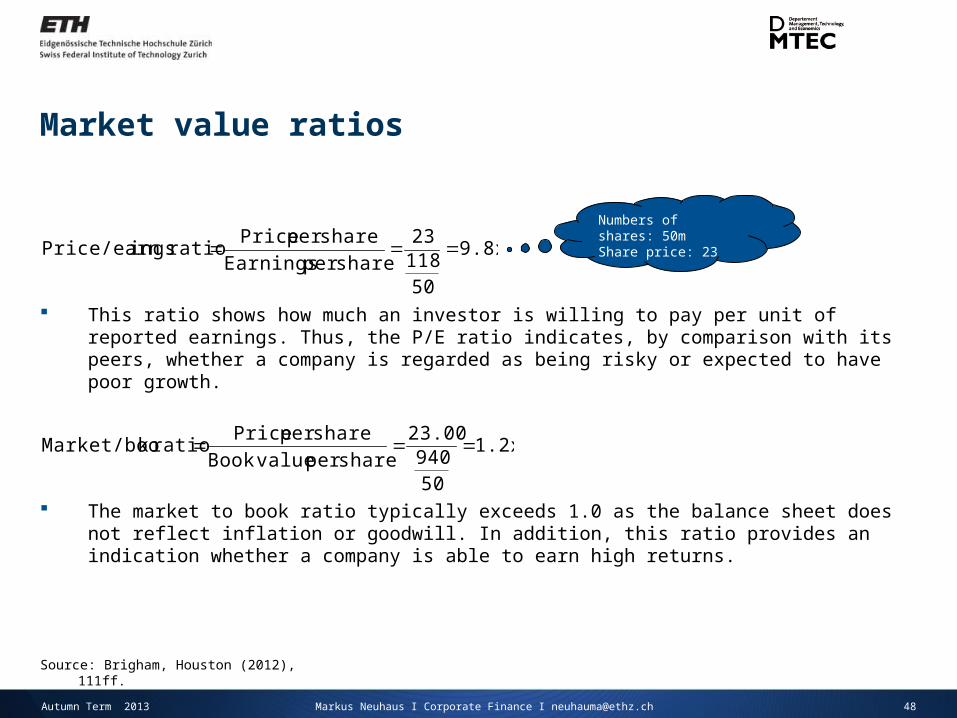
Market value ratios
9.8x
5011823
share per Earnings
share per Price ratio ingsPrice/earn
This ratio shows how much an investor is willing to pay per unit of reported earnings. Thus, the P/E ratio indicates, by comparison with its peers, whether a company is regarded as being risky or expected to have poor growth.
1.2x
50940
23.00
share per value Book
share per Price ratio kMarket/boo
The market to book ratio typically exceeds 1.0 as the balance sheet does not reflect inflation or goodwill. In addition, this ratio provides an indication whether a company is able to earn high returns.
Numbers of shares: 50mShare price: 23
Source: Brigham, Houston (2012), 111ff.
Autumn Term 2013
49Markus Neuhaus I Corporate Finance I [email protected]
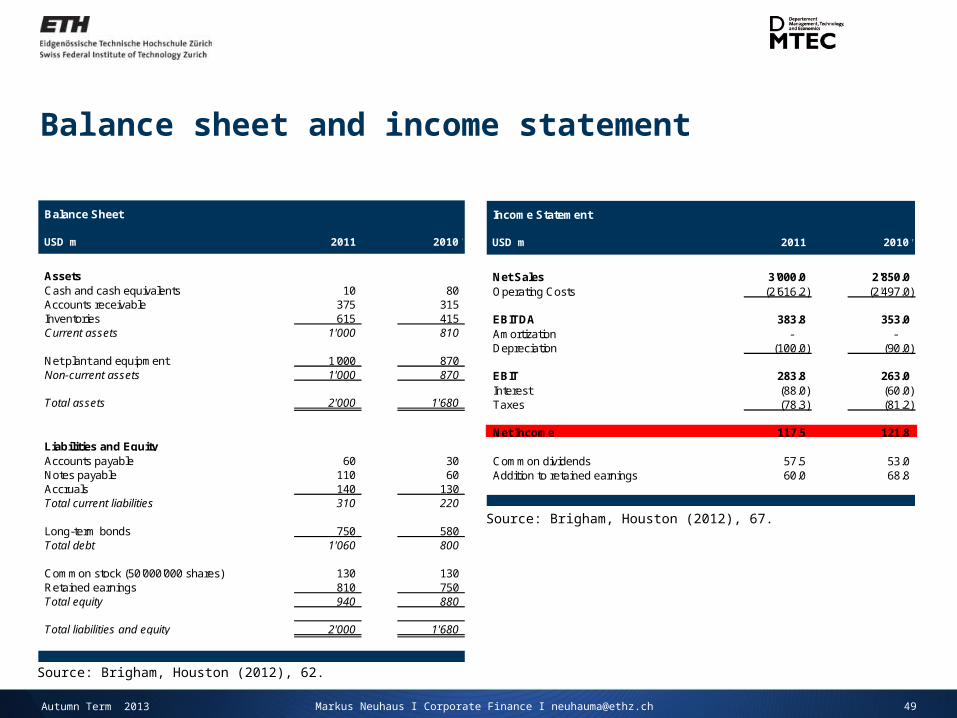
Balance sheet and income statement
Source: Brigham, Houston (2012), 62.
Balance Sheet
(chf m) 2008 2007
AssetsCash and cash equivalents 10 80 Accounts receivable 375 315 Inventories 615 415 Current assets 1'000 810
Net plant and equipment 1'000 870 Non-current assets 1'000 870
Total assets 2'000 1'680
Liabilities and EquityAccounts payable 60 30 Notes payable 110 60 Accruals 140 130 Total current liabilities 310 220
Long-term bonds 750 580 Total debt 1'060 800
Common stock (50'000'000 shares) 130 130 Retained earnings 810 750 Total equity 940 880
Total liabilities and equity 2'000 1'680
USD m 2011 2010
Source: Brigham, Houston (2012), 67.
Income Statement
(chf in millions) 2008 2007
Net Sales 3'000.0 2'850.0 Operating Costs (2'616.2) (2'497.0)
EBITDA 383.8 353.0 Amortization - - Depreciation (100.0) (90.0)
EBIT 283.8 263.0 Interest (88.0) (60.0) Taxes (78.3) (81.2)
Net Income 117.5 121.8
Common dividends 57.5 53.0 Addition to retained earnings 60.0 68.8
2011 2010USD m
Autumn Term 2013
50Markus Neuhaus I Corporate Finance I [email protected]
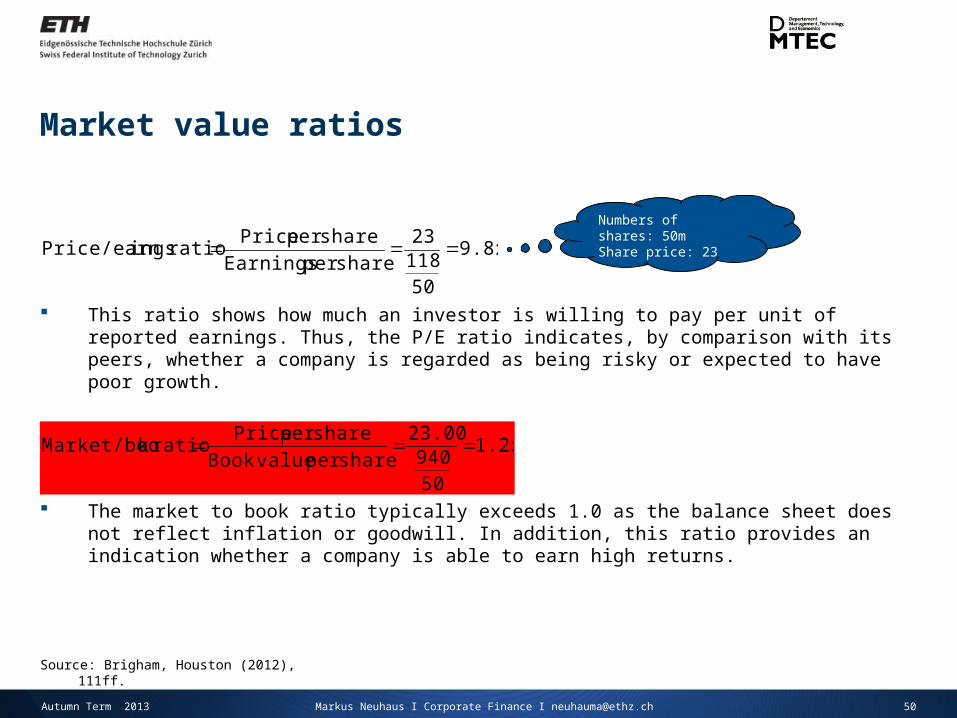
Market value ratios
9.8x
5011823
share per Earnings
share per Price ratio ingsPrice/earn
This ratio shows how much an investor is willing to pay per unit of reported earnings. Thus, the P/E ratio indicates, by comparison with its peers, whether a company is regarded as being risky or expected to have poor growth.
1.2x
50940
23.00
share per value Book
share per Price ratio kMarket/boo
The market to book ratio typically exceeds 1.0 as the balance sheet does not reflect inflation or goodwill. In addition, this ratio provides an indication whether a company is able to earn high returns.
Numbers of shares: 50mShare price: 23
Source: Brigham, Houston (2012), 111ff.
Autumn Term 2013
Balance Sheet
(chf m) 2008 2007
AssetsCash and cash equivalents 10 80 Accounts receivable 375 315 Inventories 615 415 Current assets 1'000 810
Net plant and equipment 1'000 870 Non-current assets 1'000 870
Total assets 2'000 1'680
Liabilities and EquityAccounts payable 60 30 Notes payable 110 60 Accruals 140 130 Total current liabilities 310 220
Long-term bonds 750 580 Total debt 1'060 800
Common stock (50'000'000 shares) 130 130 Retained earnings 810 750 Total equity 940 880
Total liabilities and equity 2'000 1'680
USD m 2011 2010
51Markus Neuhaus I Corporate Finance I [email protected]
Balance sheet and income statement
Source: Brigham, Houston (2012), 62.
Source: Brigham, Houston (2012), 67.
Income Statement
(chf in millions) 2008 2007
Net Sales 3'000.0 2'850.0 Operating Costs (2'616.2) (2'497.0)
EBITDA 383.8 353.0 Amortization - - Depreciation (100.0) (90.0)
EBIT 283.8 263.0 Interest (88.0) (60.0) Taxes (78.3) (81.2)
Net Income 117.5 121.8
Common dividends 57.5 53.0 Addition to retained earnings 60.0 68.8
2011 2010USD m
Autumn Term 2013
52Markus Neuhaus I Corporate Finance I [email protected]
Agenda: Case study
Beans Incorporation vs. Garlic Incorporation
Autumn Term 2013
53Markus Neuhaus I Corporate Finance I [email protected]
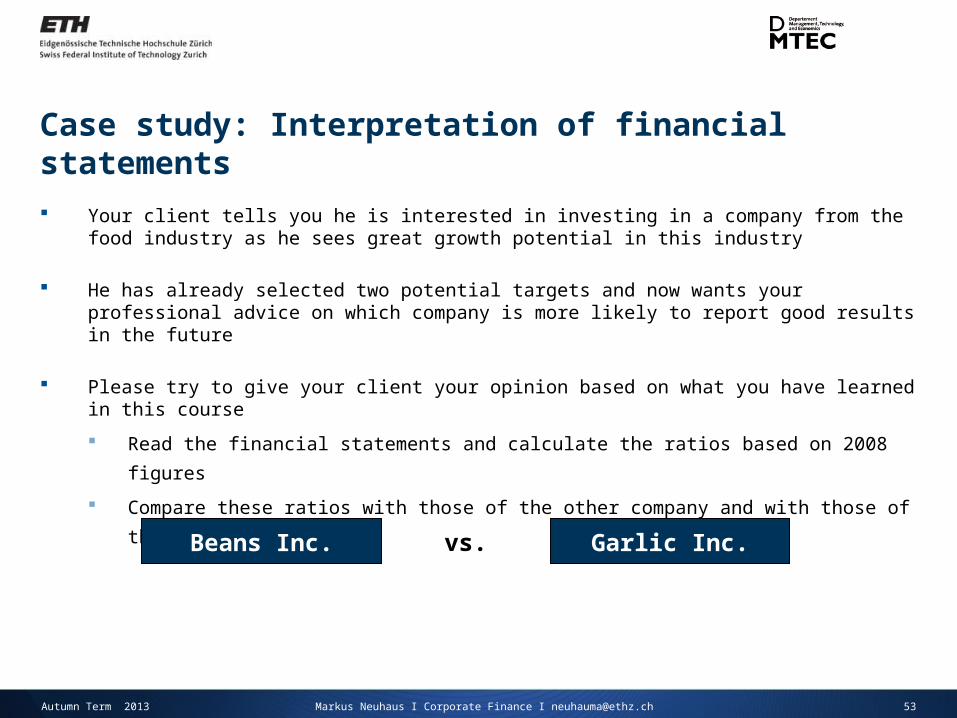
Case study: Interpretation of financial statements
Your client tells you he is interested in investing in a company from the food industry as he sees great growth potential in this industry
He has already selected two potential targets and now wants your professional advice on which company is more likely to report good results in the future
Please try to give your client your opinion based on what you have learned in this course
Read the financial statements and calculate the ratios based on 2008 figures
Compare these ratios with those of the other company and with those of the industry average
Beans Inc. Garlic Inc.vs.
Autumn Term 2013
54Markus Neuhaus I Corporate Finance I [email protected]
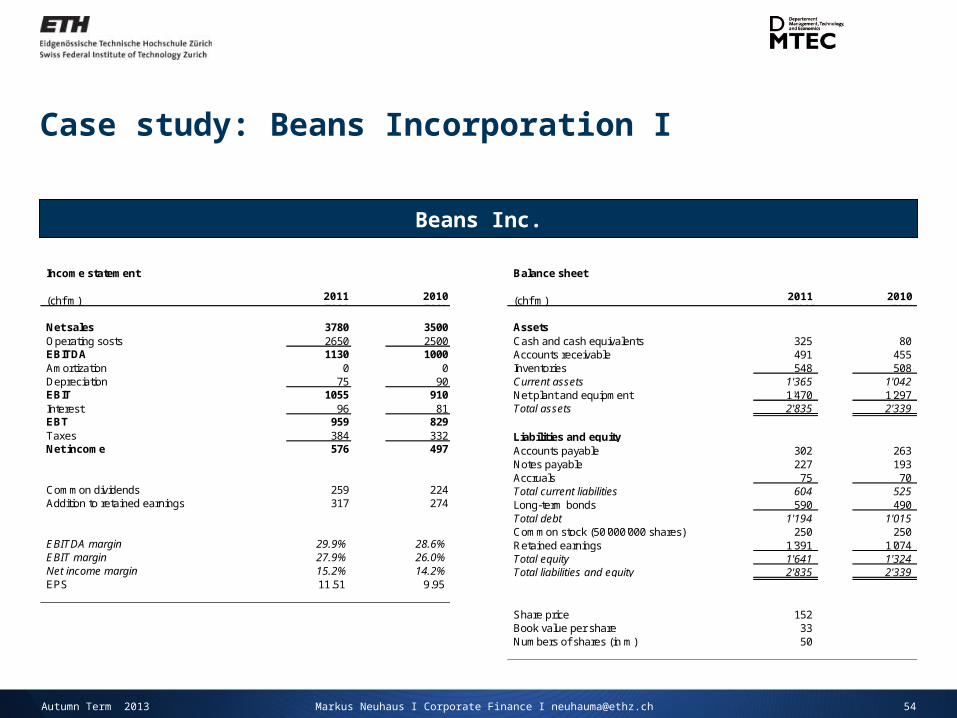
Case study: Beans Incorporation I
Beans Inc.
Balance sheet
(chf m) 2008 2007
AssetsCash and cash equivalents 325 80 Accounts receivable 491 455 Inventories 548 508 Current assets 1'365 1'042 Net plant and equipment 1'470 1'297 Total assets 2'835 2'339
Liabilities and equityAccounts payable 302 263 Notes payable 227 193 Accruals 75 70 Total current liabilities 604 525 Long-term bonds 590 490 Total debt 1'194 1'015 Common stock (50'000'000 shares) 250 250 Retained earnings 1'391 1'074 Total equity 1'641 1'324 Total liabilities and equity 2'835 2'339
Share price 152 Book value per share 33 Numbers of shares (in m) 50
Income statement
(chf m) 2008 2007
Net sales 3780 3500Operating sosts 2650 2500EBITDA 1130 1000Amortization 0 0Depreciation 75 90EBIT 1055 910Interest 96 81EBT 959 829Taxes 384 332Net income 576 497
Common dividends 259 224Addition to retained earnings 317 274
EBITDA margin 29.9% 28.6%EBIT margin 27.9% 26.0%Net income margin 15.2% 14.2%EPS 11.51 9.95
2011 2010 2011 2010
Autumn Term 2013
55Markus Neuhaus I Corporate Finance I [email protected]
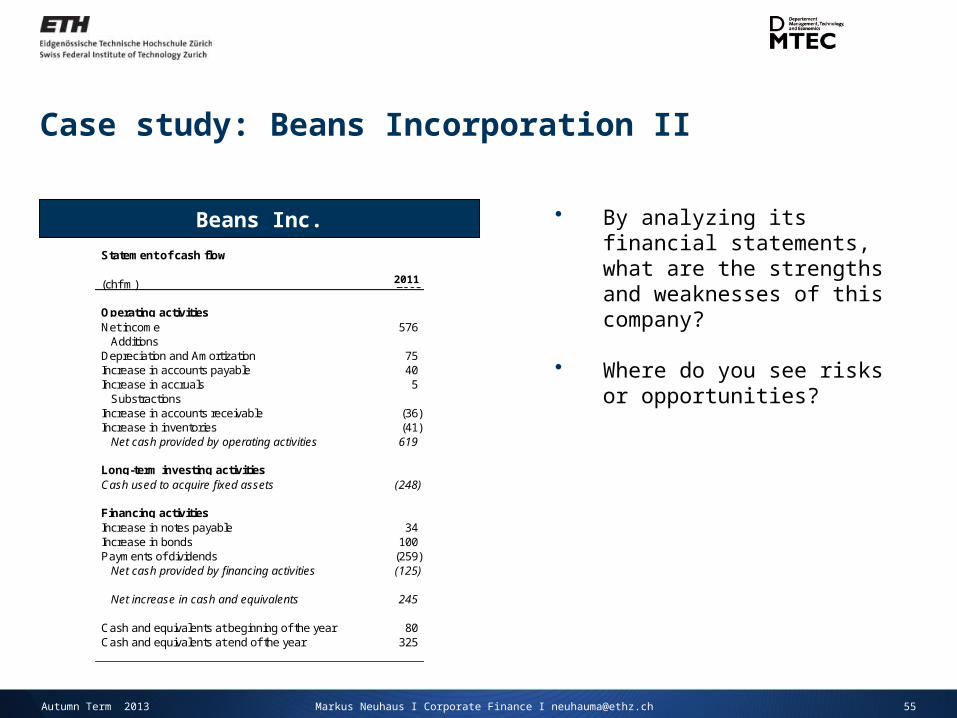
Case study: Beans Incorporation II
Beans Inc. • By analyzing its financial statements, what are the strengths and weaknesses of this company?
• Where do you see risks or opportunities?
Statement of cash flow
(chf m) 2008
Operating activitiesNet income 576
AdditionsDepreciation and Amortization 75 Increase in accounts payable 40 Increase in accruals 5
SubstractionsIncrease in accounts receivable (36) Increase in inventories (41)
Net cash provided by operating activities 619
Long-term investing activitiesCash used to acquire fixed assets (248)
Financing activitiesIncrease in notes payable 34 Increase in bonds 100 Payments of dividends (259)
Net cash provided by financing activities (125)
Net increase in cash and equivalents 245
Cash and equivalents at beginning of the year 80 Cash and equivalents at end of the year 325
2011
Autumn Term 2013
56Markus Neuhaus I Corporate Finance I [email protected]
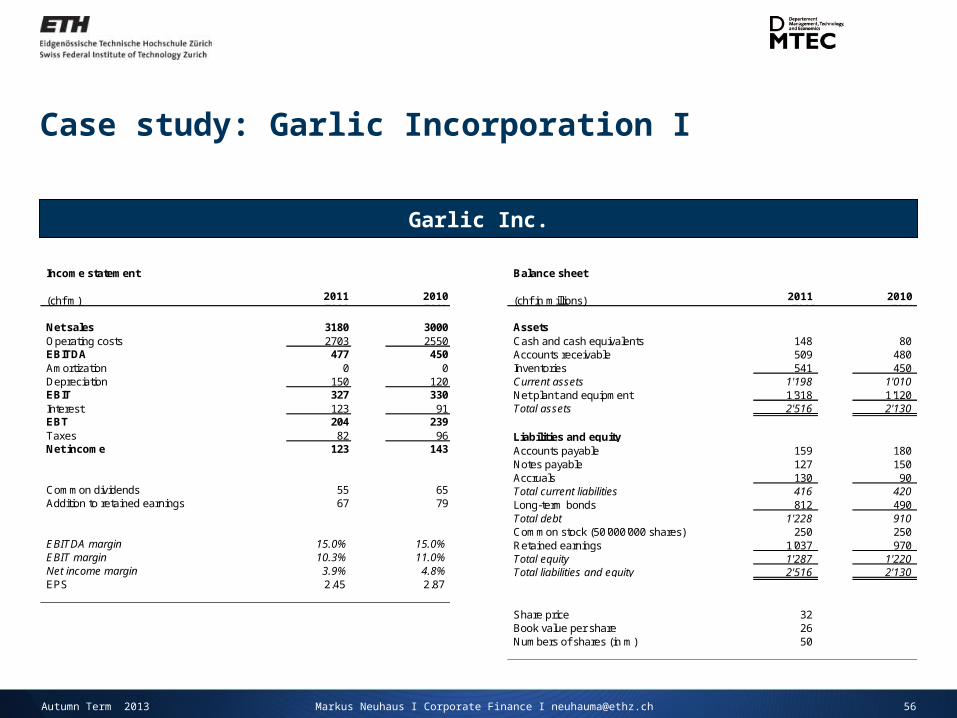
Case study: Garlic Incorporation I
Garlic Inc.
Balance sheet
(chf in millions) 2008 2007
AssetsCash and cash equivalents 148 80 Accounts receivable 509 480 Inventories 541 450 Current assets 1'198 1'010 Net plant and equipment 1'318 1'120 Total assets 2'516 2'130
Liabilities and equityAccounts payable 159 180 Notes payable 127 150 Accruals 130 90 Total current liabilities 416 420 Long-term bonds 812 490 Total debt 1'228 910 Common stock (50'000'000 shares) 250 250 Retained earnings 1'037 970 Total equity 1'287 1'220 Total liabilities and equity 2'516 2'130
Share price 32 Book value per share 26 Numbers of shares (in m) 50
Income statement
(chf m) 2008 2007
Net sales 3180 3000Operating costs 2703 2550EBITDA 477 450Amortization 0 0Depreciation 150 120EBIT 327 330Interest 123 91EBT 204 239Taxes 82 96Net income 123 143
Common dividends 55 65Addition to retained earnings 67 79
EBITDA margin 15.0% 15.0%EBIT margin 10.3% 11.0%Net income margin 3.9% 4.8%EPS 2.45 2.87
2011 2010 2011 2010
Autumn Term 2013
57Markus Neuhaus I Corporate Finance I [email protected]
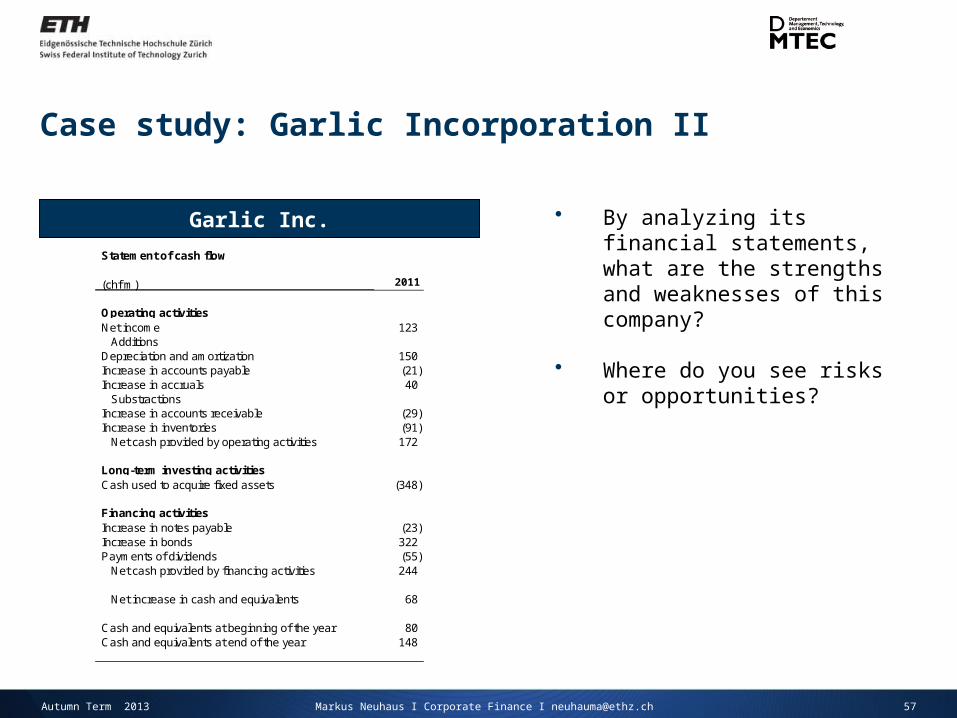
Case study: Garlic Incorporation II
Garlic Inc.
Statement of cash flow
(chf m) 2008
Operating activitiesNet income 123
AdditionsDepreciation and amortization 150 Increase in accounts payable (21) Increase in accruals 40
SubstractionsIncrease in accounts receivable (29) Increase in inventories (91)
Net cash provided by operating activities 172
Long-term investing activitiesCash used to acquire fixed assets (348)
Financing activitiesIncrease in notes payable (23) Increase in bonds 322 Payments of dividends (55)
Net cash provided by financing activities 244
Net increase in cash and equivalents 68
Cash and equivalents at beginning of the year 80 Cash and equivalents at end of the year 148
• By analyzing its financial statements, what are the strengths and weaknesses of this company?
• Where do you see risks or opportunities?
2011
Autumn Term 2013
58Markus Neuhaus I Corporate Finance I [email protected]
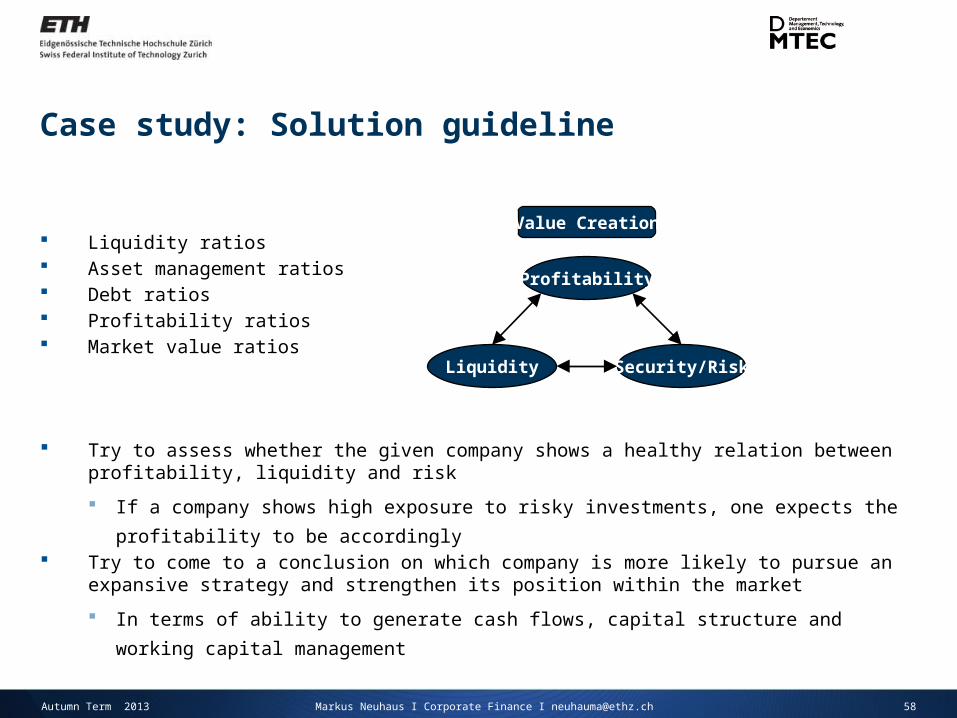
Case study: Solution guideline
Liquidity ratios Asset management ratios Debt ratios Profitability ratios Market value ratios
Value Creation
Liquidity Security/Risk
Profitability
Try to assess whether the given company shows a healthy relation between profitability, liquidity and risk
If a company shows high exposure to risky investments, one expects the profitability to be
accordingly Try to come to a conclusion on which company is more likely to pursue an expansive strategy and
strengthen its position within the market
In terms of ability to generate cash flows, capital structure and working capital management
Autumn Term 2013
59Markus Neuhaus I Corporate Finance I [email protected]
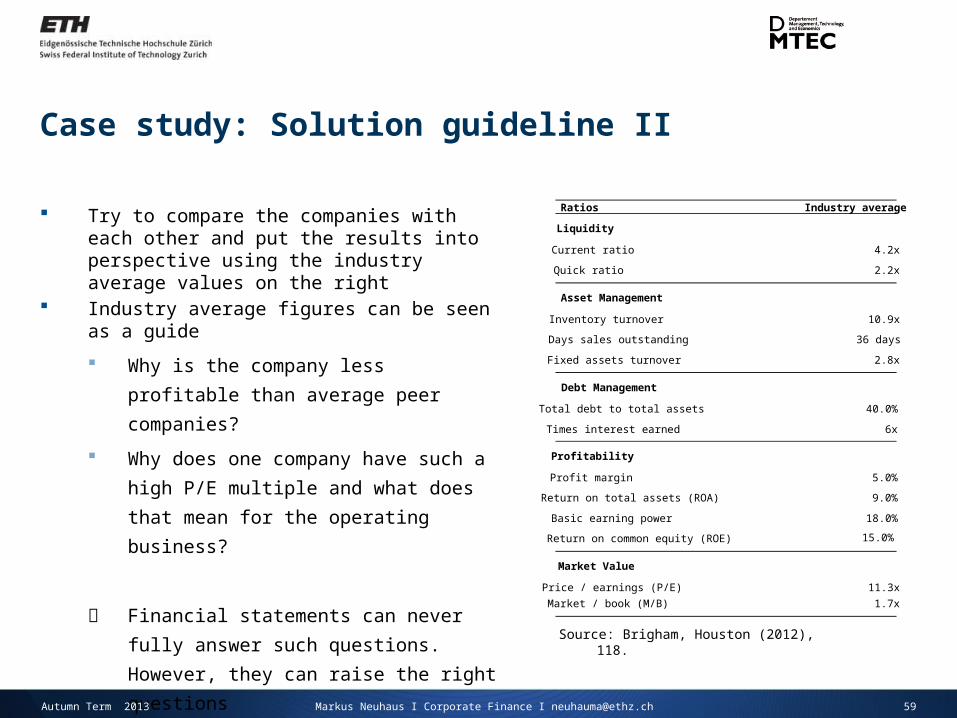
Case study: Solution guideline II
Try to compare the companies with each other and put the results into perspective using the industry average values on the right
Industry average figures can be seen as a guide
Why is the company less profitable than
average peer companies?
Why does one company have such a high
P/E multiple and what does that mean for the
operating business?
Financial statements can never fully answer
such questions. However, they can raise the
right questions
Source: Brigham, Houston (2012), 118.
Ratios Industry average
Liquidity
Current ratio 4.2x
Quick ratio 2.2x
Asset Management
Inventory turnover 10.9x
Days sales outstanding 36 days
Fixed assets turnover 2.8x
Debt Management
Total debt to total assets 40.0%
Times interest earned 6x
Profitability
Profit margin 5.0%
Return on total assets (ROA) 9.0%
Basic earning power 18.0%
Return on common equity (ROE)
Market Value
Price / earnings (P/E) 11.3x
Market / book (M/B) 1.7x
15.0%
Autumn Term 2013
60Markus Neuhaus I Corporate Finance I [email protected]
Contents
Learning targets Pre-course reading Lecture „Interpreting Financial Statements“ Pre-course reading case studies / questions Solutions to case studies
Autumn Term 2013


