27
April 29, 2009 1Q 2009 Operating Results
April 29, 2009
1Q 2009 Operating Results

© 2009 Chunghwa Telecom 1
DisclaimerNote Concerning Forward-looking StatementsThis press release contains forward-looking statements. These statements constitute “forward-looking” statements within the meaning of Section 27A of the Securities Act of 1933, as amended, and Section 21E of the Securities Exchange Act of 1934, as amended, and as defined in the U.S. Private Securities Litigation Reform Act of 1995. These forward-looking statements can be identified by terminology such as “will,” “expects,” “anticipates,” “future,” “intends,” “plans,” “believes,” “estimates” and similar statements. Chunghwa may also make written or oral forward-looking statements in its periodic reports to the U.S. Securities and Exchange Commission on forms 20-F and 6-K., in its annual report to shareholders, in press releases and other written materials and in oral statements made by its officers, directors or employees to third parties. Statements that are not historical facts, including statements about Chunghwa’s beliefs and expectations, are forward-looking statements. Forward-looking statements involve inherent risks and uncertainties that could cause actual results to differ materially from the forward-looking statements. A number of important factors could cause actual results to differ materially from those contained in any forward-looking statement. Investors are cautioned that actual events and results could differ materially from those statements as a result of a number of factors including, but not limited to: extensive regulation of telecom industry; the intensely competitive telecom industry; our relationship with our labor union; general economic and political conditions, including those related to the telecom industry; possible disruptions in commercial activities caused by natural and human induced events and disasters, including terrorist activity, armed conflict and highly contagious diseases, such as SARS; and those risks outlined in Chunghwa’s filings with the U.S. Securities and Exchange Commission, including its registration statements on Form F-1, F-3, F-6 and 20-F, in each case as amended. Chunghwa does not undertake any obligation to update any forward-looking statement, except as required under applicable law. This release is not an offer of securities for sale in the United States. Securities may not be offered or sold in the United States absent registration or an exemption from registration. Any public offering of securities to be made in the United States will be made by means of a prospectus that may be obtained from the issuer or selling security holder and that will contain detailed information about the company and management, as well as financial statements.
SPECIAL NOTE REGARDING NON-GAAP FINANCIAL MEASURESA body of generally accepted accounting principles is commonly referred to as "GAAP". A non-GAAP financial measure is generally defined by the SEC as one that purports to measure historical or future financial performance, financial position or cash flows but excludes or includes amounts that would not be so adjusted in the most comparable U.S. GAAP measure. We disclose in this report certain non-GAAP financial measures, including EBITDA. EBITDA for any period is defined as consolidated net income (loss) excluding (i) depreciation and amortization, (ii) total net comprehensive financing cost (which is comprised of net interest expense, exchange gain or loss, monetary position gain or loss and other financing costs and derivative transactions), (iii) other expenses, net, (iv) income tax, (v) cumulative effect of change in accounting principle, net of tax and (vi) (income) loss from discontinued operations.In managing our business we rely on EBITDA as a means of assessing our operating performance. We believe that EBITDA can be useful to facilitate comparisons of operating performance between periods and with other companies because it excludes the effect of (i) depreciation and amortization, which represents a non-cash charge to earnings, (ii) certain financing costs, which are significantly affected by external factors, including interest rates, foreign currency exchange rates and inflation rates, which have little or no bearing on our operating performance, (iii) income tax and tax on assets and statutory employee profit sharing, which is similar to a tax on income and (iv) other expenses or income not related to the operation of the business.EBITDA is not a measure of financial performance under ROC GAAP. EBITDA should not be considered as an alternate measure of net income or operating income, as determined on a consolidated basis using amounts derived from statements of operations prepared in accordance with ROC GAAP, as an indicator of operating performance or as cash flows from operating activity or as a measure of liquidity. EBITDA has material limitations that impair its value as a measure of a company's overall profitability since it does not address certain ongoing costs of our business that could significantly affect profitability such as financial expenses and income taxes, depreciation, pension plan reserves or capital expenditures and associated charges. These non-GAAP measures are not in accordance with or an alternative for GAAP financial data, the non-GAAP results should be reviewed together with the GAAP results and are not intended to serve as a substitute for results under GAAP, and may be different from non-GAAP measures used by other companies. For more information on these non-GAAP financial measures, please see the tables captioned set forth at the end of this release and which shall be read together with the accompanying financial statements prepared under ROC GAAP.
© 2009 Chunghwa Telecom 2
0
1
2
3
4
5
6
2005 2006 2007 2008 2009
Cas
h (N
T$)
Cash Return from Capital Reduction
Cash Payment
7.4%7.7%
7.4%
5.8%
0%
1%
2%
3%
4%
5%
6%
7%
8%
Yie
ld
Dividend Yield
Dividend Payout
Dividend Yield Capital Management
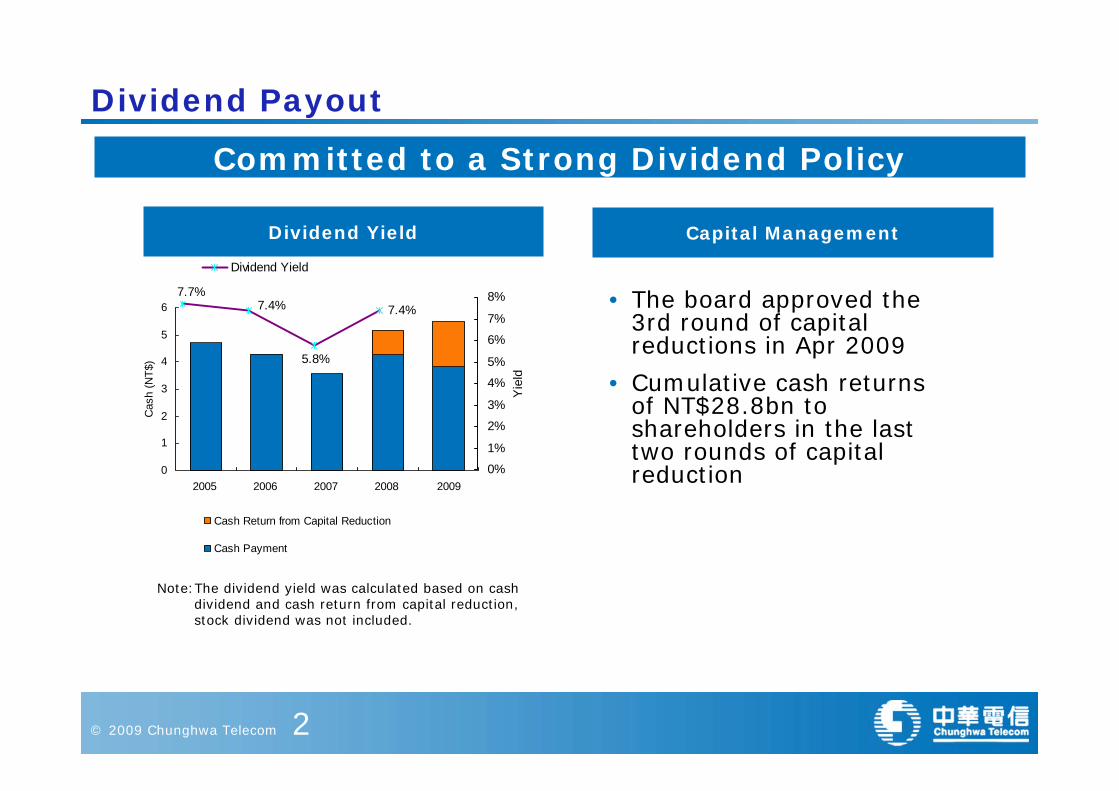
Committed to a Strong Dividend Policy
Note:The dividend yield was calculated based on cash dividend and cash return from capital reduction, stock dividend was not included.
• The board approved the 3rd round of capital reductions in Apr 2009
• Cumulative cash returns of NT$28.8bn to shareholders in the last two rounds of capital reduction

Financials Overview

© 2009 Chunghwa Telecom 4
Financials: Income Statement
ROC GAAP (Consolidated)
(NT$bn) 2007 2008 Growth Rate Q1 2008 Q1 2009 Growth Rate
Revenue 197.39 201.67 2.2% 50.96 49.12 (3.6 %)
EBITDA 100.16 96.74 (3.4%) 26.14 23.36 (10.7 %)
Operating Profit 60.35 58.57 (3.0%) 16.43 14.13 (14.0 %)
Net Income 48.25 45.01 (6.7%) 10.72 10.79 0.7%
EBITDA margin (%) 50.74 47.97 51.30 47.55
Net Income Margin (%) 24.44 22.32 21.03 21.96
Note:
1.The calculation of growth rate is based on NT$mn.
2.Some figures of 2007 and 2008 are reclassified according to ROC SFAS 10 “Inventories”.

© 2009 Chunghwa Telecom 5
Financials: Costs & Expenses
ROC GAAP (Consolidated)
(NT$bn) 2007 2008 Growth Rate Q1 2008 Q1 2009 Growth Rate
Operating Costs 106.65 113.55 6.5% 28.18 28.15 (0.1%)
Operating Expenses 30.39 29.55 (2.8%) 6.35 6.84 7.72%
Marketing 23.73 22.73 (4.2%) 4.73 5.13 8.4%
General and Administrative 3.42 3.68 7.5% 0.89 0.95 7.2%
R&D Expense 3.24 3.14 (2.8%) 0.73 0.76 3.7%
Total 137.04 143.10 4.4% 34.53 34.99 1.3%
Note:
1.The calculation of growth rate is based on NT$mn.
2.Some figures of 2007 and 2008 are reclassified according to ROC SFAS 10 “Inventories”.

© 2009 Chunghwa Telecom 6
Financials: Business Segment Revenues
ROC GAAP (Consolidated)
(NT$bn) 2007 2008 Growth Rate Q1 2008 Q1 2009 Growth Rate
Internet & Data 49.23 50.05 1.7% 12.53 12.47 (0.5%)
Mobile 73.67 72.30 (1.9%) 18.13 17.57 (3.1%)
Fixed line 59.10 57.08 (3.4%) 14.41 13.13 (8.9%)
Local 35.75 34.55 (3.3%) 8.64 8.11 (6.2%)
DLD 9.10 8.48 (6.8%) 2.12 1.90 (10.1%)
ILD 14.25 14.05 (1.4%) 3.65 3.12 (14.4%)
Other 15.39 22.24 44.4% 5.89 5.95 1.1%
Total 197.39 201.67 2.2% 50.96 49.12 (3.6%)
Note: 1) Other revenue includes revenues from handset sales of CHT & Senao, satellite, and billing handling services, etc.2) The calculation of growth rate is based on NT$mn.

© 2009 Chunghwa Telecom 7
Financials: Cash Flow
ROC GAAP (Consolidated)
(NT$bn)Jan-Dec
2007
Jan-Dec
2008Growth Rate Q1 2008 Q1 2009 Growth Rate
Net Cash Flow from Operating Activities 88.96 91.87 3.3% 18.59 16.05 (13.6%)
CAPEX (25.07) (30.12) 20.1% (5.46) (4.70) (13.8%)
Free Cash Flow 63.89 61.75 (3.4%) 13.13 11.35 (13.6%)
Cash and Cash Equivalent at the end of period
76.23 81.29 6.6% 75.88 69.15 (8.9%)
Note:The calculation of growth rate is based on NT$mn

© 2009 Chunghwa Telecom 8
Effective and Efficient Capital Expenditures
Note:Above figures are on consolidated basis. Some wirelineequipment is jointly used by fixed line and data and internet services.
Capital Expenditure (NT$bn)
0
5
10
15
20
25
30
35
2006 2007 2008 1Q08 1Q09
Wireline Wireless Others
Cap
ex
(NT
$b
n)
27.7
25.1
30.1
5.5 4.7
CapEx as %of Revenue 15.0% 12.7% 14.9% 10.8% 9.6%
• Capex spending will remain between NT$30bn and NT$32bn over the next 2 to 3 years
• Future investments continue to focus on core businesses and on migrating mobile and data customers to higher revenue platforms– 3G / 3.5G – IP-based NGN– FTTx– xDSL
© 2009 Chunghwa Telecom 9
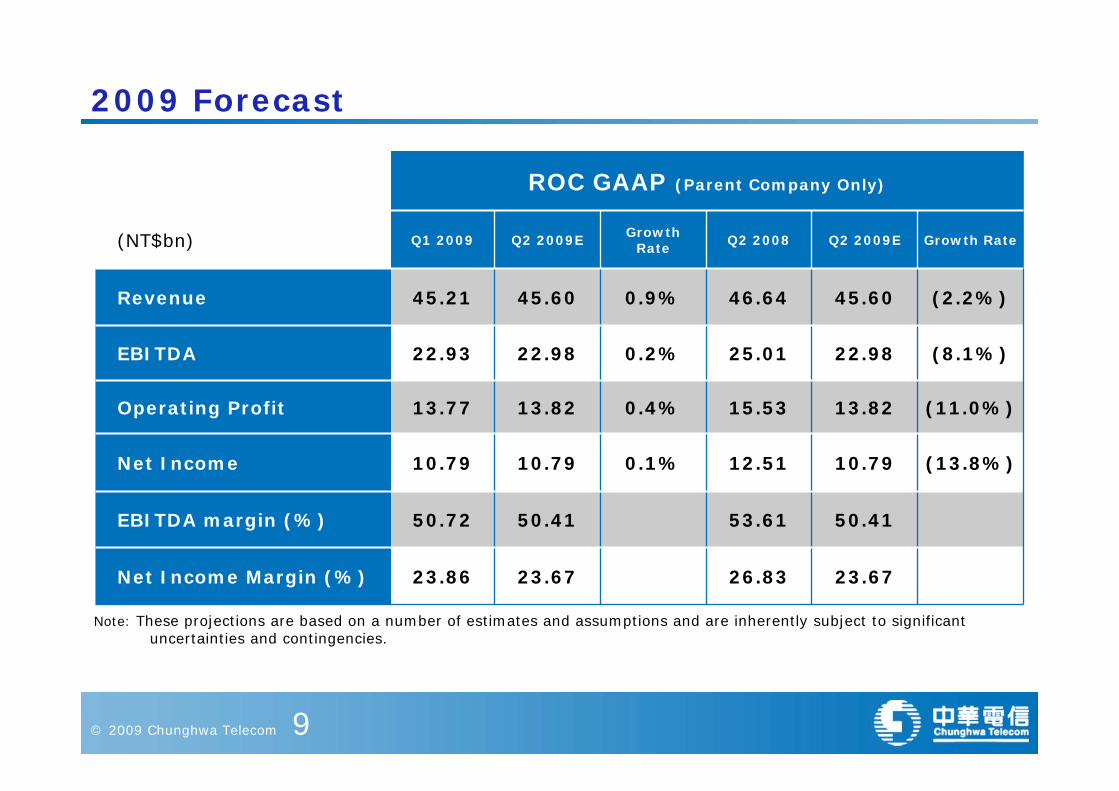
2009 Forecast
ROC GAAP (Parent Company Only)
(NT$bn) Q1 2009 Q2 2009E Growth Rate Q2 2008 Q2 2009E Growth Rate
Revenue 45.21 45.60 0.9% 46.64 45.60 (2.2%)
EBITDA 22.93 22.98 0.2% 25.01 22.98 (8.1%)
Operating Profit 13.77 13.82 0.4% 15.53 13.82 (11.0%)
Net Income 10.79 10.79 0.1% 12.51 10.79 (13.8%)
EBITDA margin (%) 50.72 50.41 53.61 50.41
Net Income Margin (%) 23.86 23.67 26.83 23.67
Note: These projections are based on a number of estimates and assumptions and are inherently subject to significant uncertainties and contingencies.

Business Overview

© 2009 Chunghwa Telecom 11
Chunghwa Telecom Overview
ILD6.4%
DLD3.9%
Mobile35.8%
Internet& Data25.4%
Local16.5%
Other12.1%
Source: Company data, MOTC, and NCC statisticsa) Other revenue includes revenues from handset
sales of CHT, satellite, and billing handling services, etc.
b) Includes 2G, 3G and PHSc) CHT access circuits were not included
(a)
Integrated Services Provider with Dominant Market Positions Revenue Breakdown
Total Revenue: NT$49.1bn
Market Leader in Mobile Communication, Internet & Data and Fixed-line Services
• Mobile– #1 Mobile subscribers
– 35.1% market share(b) (8.98 mm subs)
– #1 Mobile revenue – 34.0% market share(b)
• Internet and Data– #1 ISP subscribers
– 67.7% market share (4.1 mm subs)
– #1 Broadband access – 83.2% market share(c) (4.2 mm subs)
• Fixed-line– #1 Local subscribers
– 97.3% share (12.7 mm subs)– 89.1% share by minutes
– #1 DLD minutes– 85.6% share by minutes
– #1 ILD minutes– 58.3% share by minutes(Note) Market share numbers are as of Feb. 2009

© 2009 Chunghwa Telecom 12
Dec 07 Mar 08 Jun 08 Sep 08 Dec 08 Mar 09
Other 1Mbps 2Mbps 8Mbps FTTB
Broadband Subscribers
Taiwan’s Leading Internet and Data Provider
Thousand
Note: 1) Others include 256k, 768k, 4M & 6M services2) 8M include 8M,12M
4,284
15.1%
14.1%
39.3%
16.7%
12.6%
39.9%
15.9%
16.5%
4,252
16.2% 14.8%
4,322
21.9%
12.0%
36.1%
17.0%
12.9%
4,305
18.2%
13.2%
37.8%
16.9%
14.0%
4,311
24.8%
11.2%
34.6%
17.3%
12.1%
Strategies
4,310
27.7%
10.4%
33.1%
17.4%
11.3%
• Migrate ADSL subs to FTTx to offer quality network service and increase revenue
• Retain lower speed subs through competitive price and high-quality service
• Continue promoting Internet VAS– Fast growing VAS
– Internet pornography gatekeeper: 150.4% YoY growth for 2009Q1
– HiNet Games: 77.7% YoYgrowth for 2009Q1*
– Enterprise Security Services
* Note: Service started from Feb. 08
© 2009 Chunghwa Telecom 13
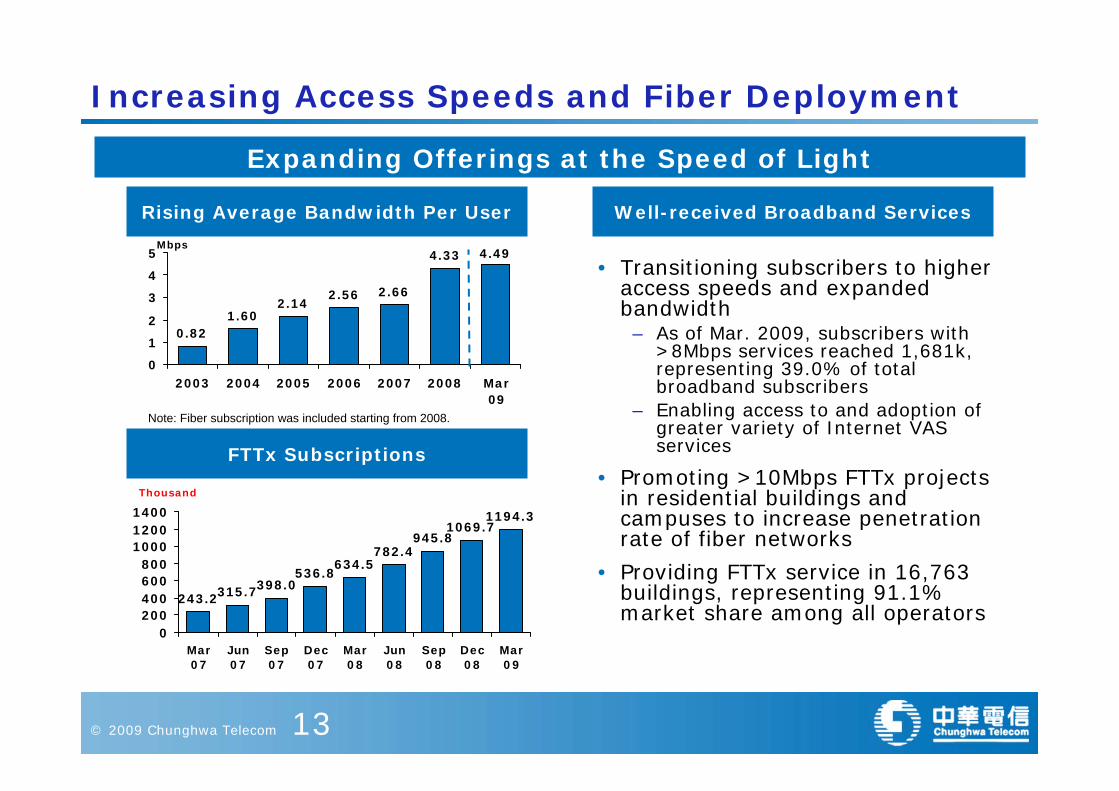
Increasing Access Speeds and Fiber Deployment
0.82
2.142.56 2.66
4.33 4.49
1.60
0
1
2
3
4
5
2003 2004 2005 2006 2007 2008 Mar09
• Transitioning subscribers to higher access speeds and expandedbandwidth– As of Mar. 2009, subscribers with
>8Mbps services reached 1,681k, representing 39.0% of total broadband subscribers
– Enabling access to and adoption of greater variety of Internet VAS services
• Promoting >10Mbps FTTx projects in residential buildings and campuses to increase penetration rate of fiber networks
• Providing FTTx service in 16,763 buildings, representing 91.1% market share among all operators
Mbps
FTTxFTTx Fiber SubscriptionsFiber Subscriptions
Well-received Broadband Services Rising Average Bandwidth Per User
Expanding Offerings at the Speed of Light
FTTx Subscriptions
Note: Fiber subscription was included starting from 2008.
243.2315.7398.0536.8
634.5782.4
945.81069.7
1194.3
0200400600800
100012001400
Mar07
Jun07
Sep07
Dec07
Mar08
Jun08
Sep08
Dec08
Mar09
Thousand
© 2009 Chunghwa Telecom 14
Number One Mobile Provider
Mobile Subscribers
Thousand
Strategies
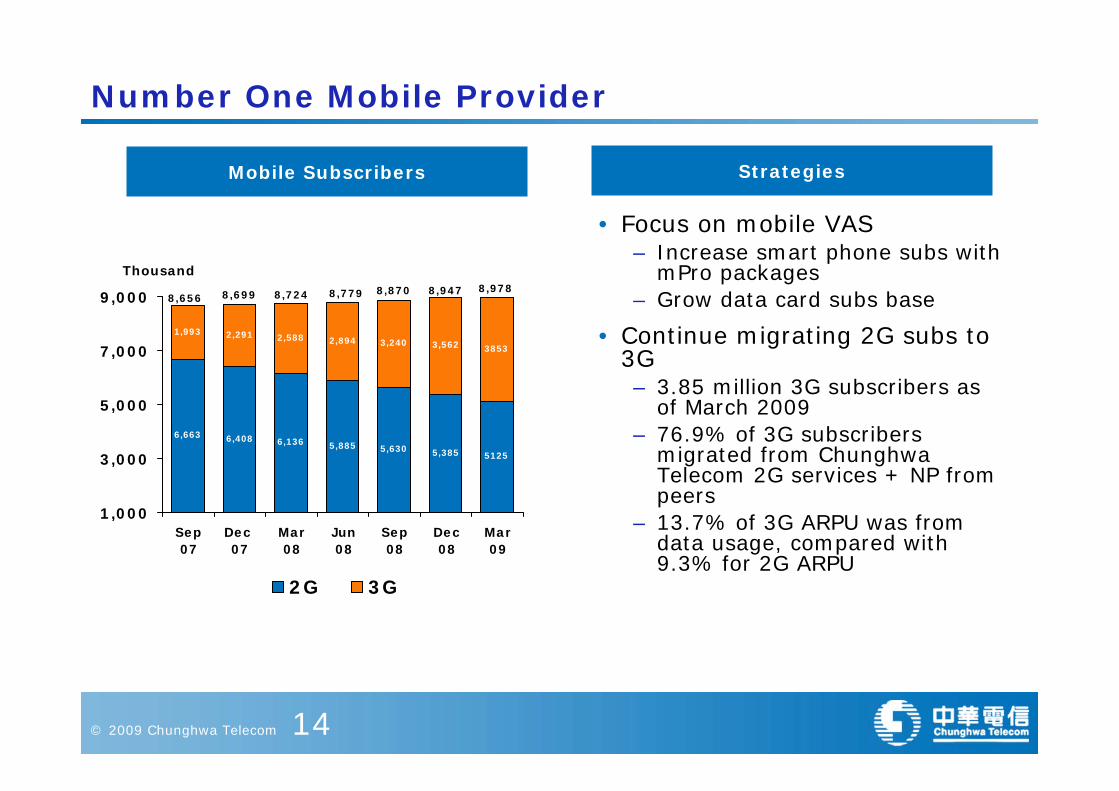
6,663 6,408 6,136 5,885 5,6305125
1,993 2,291 2,588 2,894 3,2403853
5,385
3,562
1,000
3,000
5,000
7,000
9,000
Sep07
Dec 07
Mar08
Jun08
Sep08
Dec08
Mar09
2G 3G
8,7248,6998,656 8,779 8,870 8,947 8,978
• Focus on mobile VAS– Increase smart phone subs with
mPro packages– Grow data card subs base
• Continue migrating 2G subs to 3G– 3.85 million 3G subscribers as
of March 2009– 76.9% of 3G subscribers
migrated from Chunghwa Telecom 2G services + NP from peers
– 13.7% of 3G ARPU was from data usage, compared with 9.3% for 2G ARPU

© 2009 Chunghwa Telecom 15
Mobile VAS Promotional Initiatives
Successful Mobile VAS Rollout
1Q09 Data Revenue: 11.7% of Mobile Revenue
Mobile Internet Subscriptions
Mobile Internet Subscriptions
Thousand
82.0
169.3
100.1
208.9
0
50
100
150
200
250
2007 2008 Mar-08 Mar-09
• Successful “emome” VAS platform continuing to generate growth
– Total VAS grew by 18.5% YoY as of 1Q’09
– Mobile Internet exhibited 49.6% YoY growth
– SMS exhibited 12.95% YoYgrowth
– Data Card
– ARPU:NT$787 (including voice)
– mPro: Economic packages generate growth
– Subs:+33K in Q1’09, total mProsubs reached about 94K
– VAS:37% of mPro revenue
108.7%
• Mobile internet service subs: 108.7% YoY growth
• Expect to net add 160k in ‘09
© 2009 Chunghwa Telecom 16
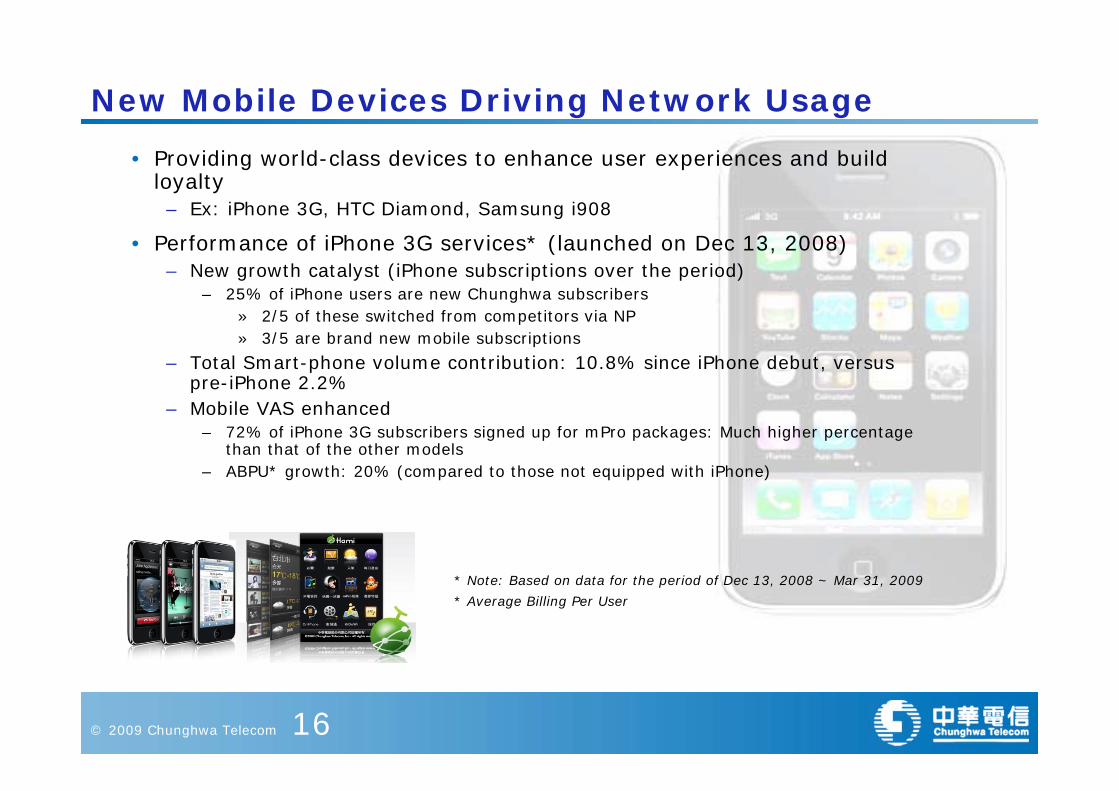
New Mobile Devices Driving Network Usage
* Note: Based on data for the period of Dec 13, 2008 ~ Mar 31, 2009
* Average Billing Per User
• Providing world-class devices to enhance user experiences and build loyalty– Ex: iPhone 3G, HTC Diamond, Samsung i908
• Performance of iPhone 3G services* (launched on Dec 13, 2008)– New growth catalyst (iPhone subscriptions over the period)
– 25% of iPhone users are new Chunghwa subscribers» 2/5 of these switched from competitors via NP» 3/5 are brand new mobile subscriptions
– Total Smart-phone volume contribution: 10.8% since iPhone debut, versus pre-iPhone 2.2%
– Mobile VAS enhanced– 72% of iPhone 3G subscribers signed up for mPro packages: Much higher percentage
than that of the other models– ABPU* growth: 20% (compared to those not equipped with iPhone)
© 2009 Chunghwa Telecom 17
100
249
394435
508
591
676 686
0
100
200
300
400
500
600
700
800
Dec05
Dec06
Dec07
Mar08
Jun08
Sep08
Dec08
Mar09
Thousand
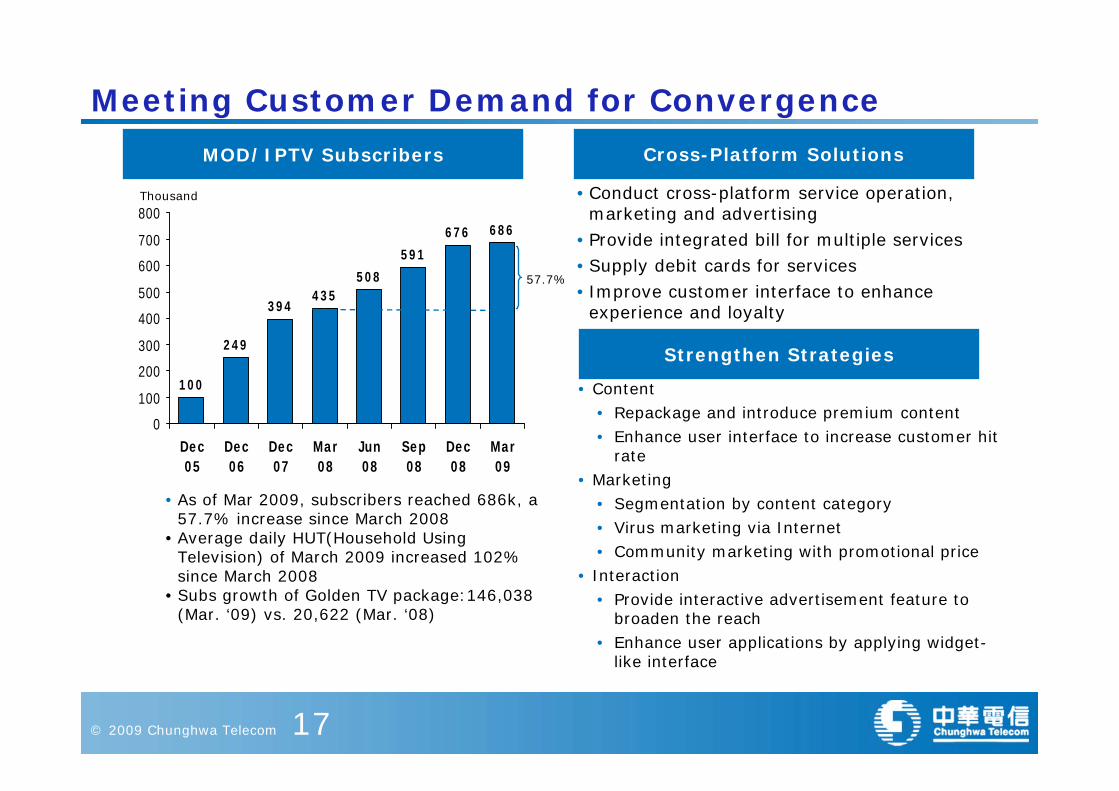
MOD/IPTV Subscribers
Meeting Customer Demand for Convergence
•Conduct cross-platform service operation, marketing and advertising
•Provide integrated bill for multiple services•Supply debit cards for services• Improve customer interface to enhance experience and loyalty
Cross-Platform Solutions
Strengthen Strategies
• As of Mar 2009, subscribers reached 686k, a 57.7% increase since March 2008
• Average daily HUT(Household Using Television) of March 2009 increased 102% since March 2008
• Subs growth of Golden TV package:146,038 (Mar. ‘09) vs. 20,622 (Mar. ‘08)
57.7%
• Content• Repackage and introduce premium content• Enhance user interface to increase customer hit
rate• Marketing
• Segmentation by content category• Virus marketing via Internet• Community marketing with promotional price
• Interaction• Provide interactive advertisement feature to
broaden the reach• Enhance user applications by applying widget-
like interface

Regulation

© 2009 Chunghwa Telecom 19
Regulatory Update
Tariff Regulations
• The 3rd year tariff reduction of a three-year plan Mobile(2G)
Fixed to Mobile Calls: 4.886%Prepaid: 4.958%Package with highest rate: 4.887%
ADSLADSL access: 5.35%
Copyrights Law
• The ISPs avoid the risk of legal problems over the questionable content by following the amendments “notice and take down” procedure
• Amended the definition and the safe harbor of ISP
IP Peering
• TFN requested price cut, the company would make its best effort to negotiate with players under supervision of NCC
• TFN has alternative of linking CHT HiNet via other ISPs

Outlook

Green Initiatives
© 2009 Chunghwa Telecom 21
• CHT’s carbon footprint calculation:– CHT represented 0.3% of total carbon emission in the country in
‘07– Awarded the ISO14064-1 certification by SGS in Dec ‘08– Emission of greenhouse gases in 2013 is expected to fall back to
the level in 2008 due to the company’s energy saving efforts relating to office buildings, switches and vehicles.
• Focusing on promoting energy saving solution (ex:iEN, Intelligent Energy Network;ITS, Intelligent Telematics Service ) for corporate customers – Potential customers: governments, schools, hospitals, SMEs,
malls, hotels etc.– Case indicated a 23%+ of energy saving via iEN service;Case of
ITS based taxi carrier reduced a 50%+ of Vacancy Rate

Q&A

Appendix

© 2009 Chunghwa Telecom 24
Network Convergence
Seamless RoamingSeamless Roaming
PSTN
PLMN
INTERNET
Control Plane and Data Plane(IMS)
IP Network Layer /Transport Layer /Access Layer
Application Layer
Traditional Networks
Next Generation Network (NGN)
AP
3rd partyOSP
(Open Service Platform)AP

© 2009 Chunghwa Telecom 25
Continuing Broadband Network Construction
Fiber Deployment Plan
• FTTx access expected to exceed ADSL access by year 2011
• FTTx coverage expected to reach 83% by year 2013
• Broadband access + ISP revenue slightly growing in upcoming years
• Wireline* VAS revenues expected to have higher growth
Note:
(1) The Coverage rate(>30M) is based on the household number (7.655mn) as of Dec. 08 by Ministry of Interior.
(2) Wireline = Fixed + Internet & Data
52004300 4000 3500
1,012 1,8553,430 3,830 4,200 4,570
171531 831 1131 1431
4960 48004600
2,965118
83%78.2% 81.7%
77%71%
58.3%
29.8%
0
1,000
2,000
3,000
4,000
5,000
6,000
7,000
8,000
9,000
10,000
2007 2008 2009 2010 2011 2012 20130%
10%
20%
30%
40%
50%
60%
70%
80%
90%FTTHFTTN/FTTBADSLCoverage
CoverageThousands
Port

© 2009 Chunghwa Telecom 26
New Opportunities via NGN
New Service Opportunities
Enterprise MarketEnterprise Market
• M-Office• FMC• IP-VPN• IP Centrex/IP PBX• Collaboration • Managed ICT Services• IP Call Center• Energy Saving
Home MarketHome Market
• Entertainment• Surveillance• Health Care• Information • Education
Personal MarketPersonal Market
• Video Phone• M-commerce• Location Based
Services• Social Networking • Instant Message• M-Entertainment
NGN InfrastructureNGN Infrastructure


![34.0 OCAT [Read-Only]](https://static.documents.pub/doc/80x56/61eccb1020ca0132b60fd5a5/340-ocat-read-only.jpg)


