32
1Q FY2011 (Fiscal Year Ending March 31, 2012) Financial Results Presentation August 2, 2011 Eisai Co., Ltd.
1Q FY2011(Fiscal Year Ending March 31, 2012)
Financial Results Presentation
August 2, 2011
Eisai Co., Ltd.
1
Safe Harbor Statement
• Materials and information provided during this presentation may contain so-called “forward-looking statements.” These statements are based on current expectations, forecasts and assumptions that are subject to risks and uncertainties which could cause actual outcomes and results to differ materially from these statements.
• Risks and uncertainties include general industry and market conditions, and general domestic and international economic conditions such as interest rate and currency exchange fluctuations. Risks and uncertainties particularly apply with respect to product-related forward-looking statements. Product risks and uncertainties include, but are not limited to, technological advances and patents attained by competitors; challenges inherent in new product development, including completion of clinical trials; claims and concerns about product safety and efficacy; regulatory agency’s examination period, obtaining regulatory approvals; domestic and foreign healthcare reforms; trends toward managed care and healthcare cost containment; and governmental laws and regulations affecting domestic and foreign operations.
• Also, for products that are approved, there are manufacturing and marketing risks and uncertainties, which include, but are not limited to, inability to build production capacity to meet demand, unavailability of raw materials, and failure to gain market acceptance.
• The Company disclaims any intention or obligation to update or revise any forward-looking statements whether as a result of new information, future events or otherwise.
• This English presentation was translated from the original Japanese version. In the event of any inconsistency between the statements in the two versions, the statements in the Japanese version shall prevail.
2
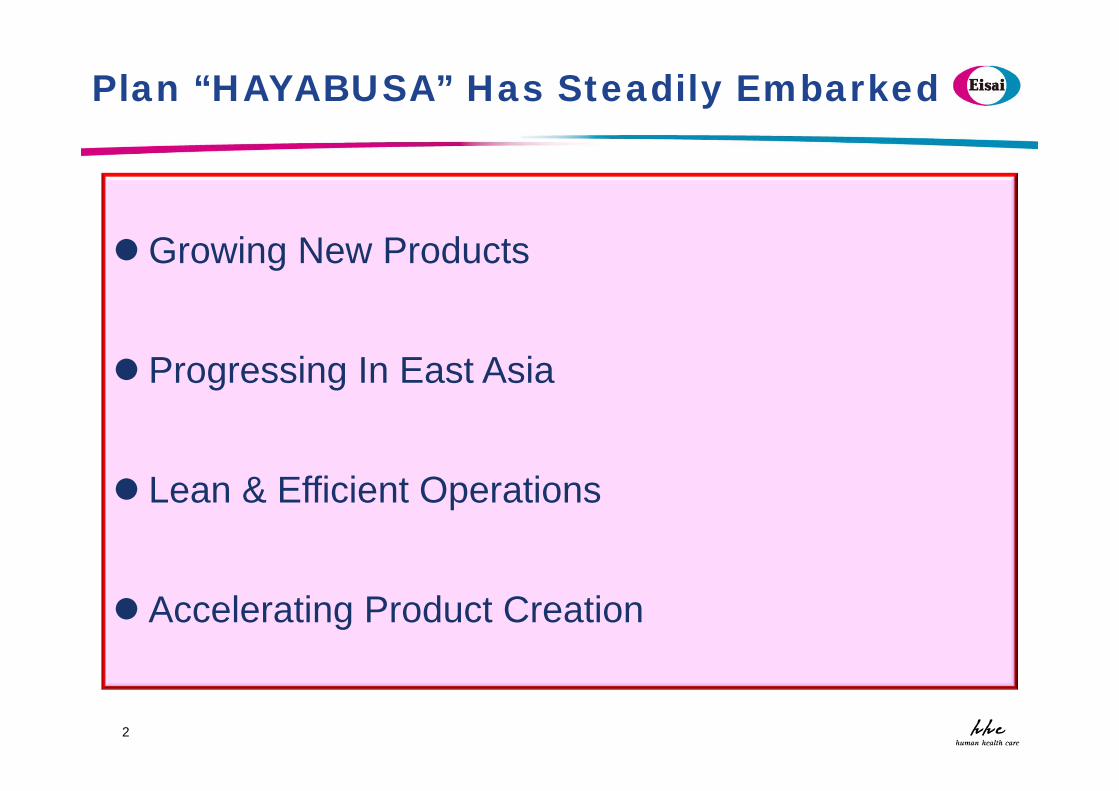
Growing New Products
Progressing In East Asia
Lean & Efficient Operations
Accelerating Product Creation
Plan “HAYABUSA” Has Steadily Embarked
33
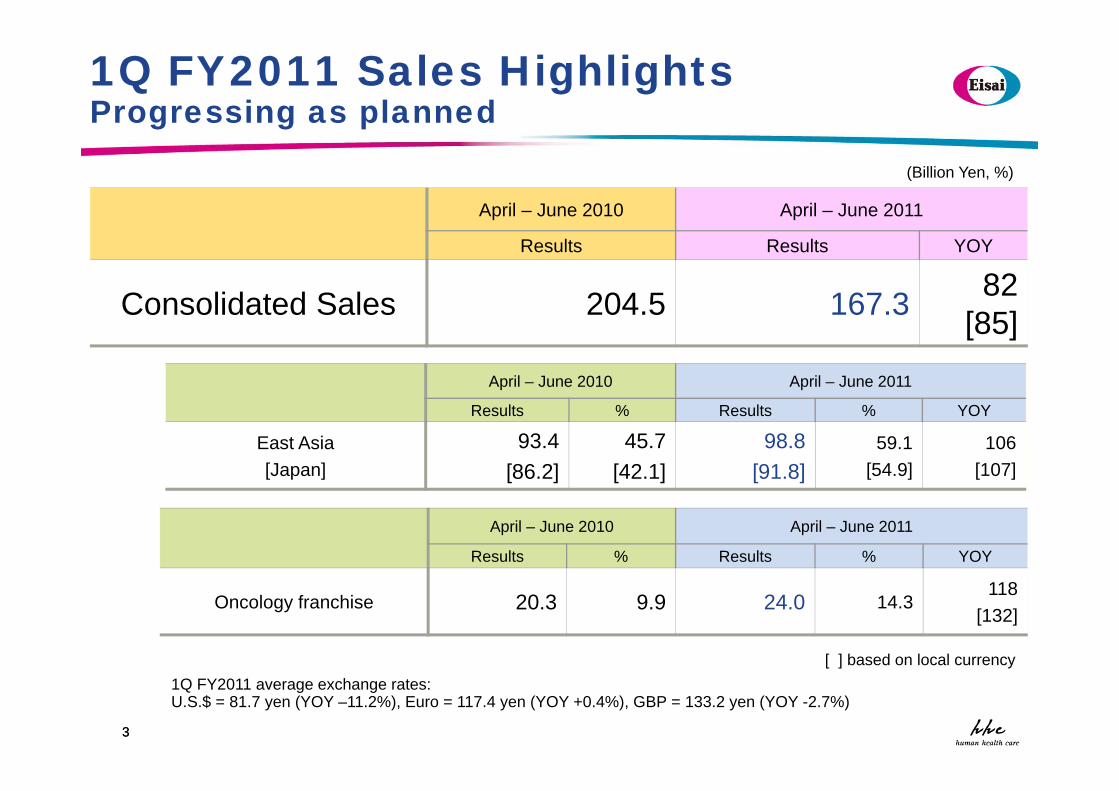
April – June 2010 April – June 2011
Results Results YOY
Consolidated Sales 204.5 167.3 82 [85]
(Billion Yen, %)
1Q FY2011 Sales HighlightsProgressing as planned
[ ] based on local currency
April – June 2010 April – June 2011
Results % Results % YOY
East Asia[Japan]
93.4[86.2]
45.7[42.1]
98.8[91.8]
59.1[54.9]
106[107]
April – June 2010 April – June 2011
Results % Results % YOY
Oncology franchise 20.3 9.9 24.0 14.3118
[132]
1Q FY2011 average exchange rates: U.S.$ = 81.7 yen (YOY –11.2%), Euro = 117.4 yen (YOY +0.4%), GBP = 133.2 yen (YOY -2.7%)
4
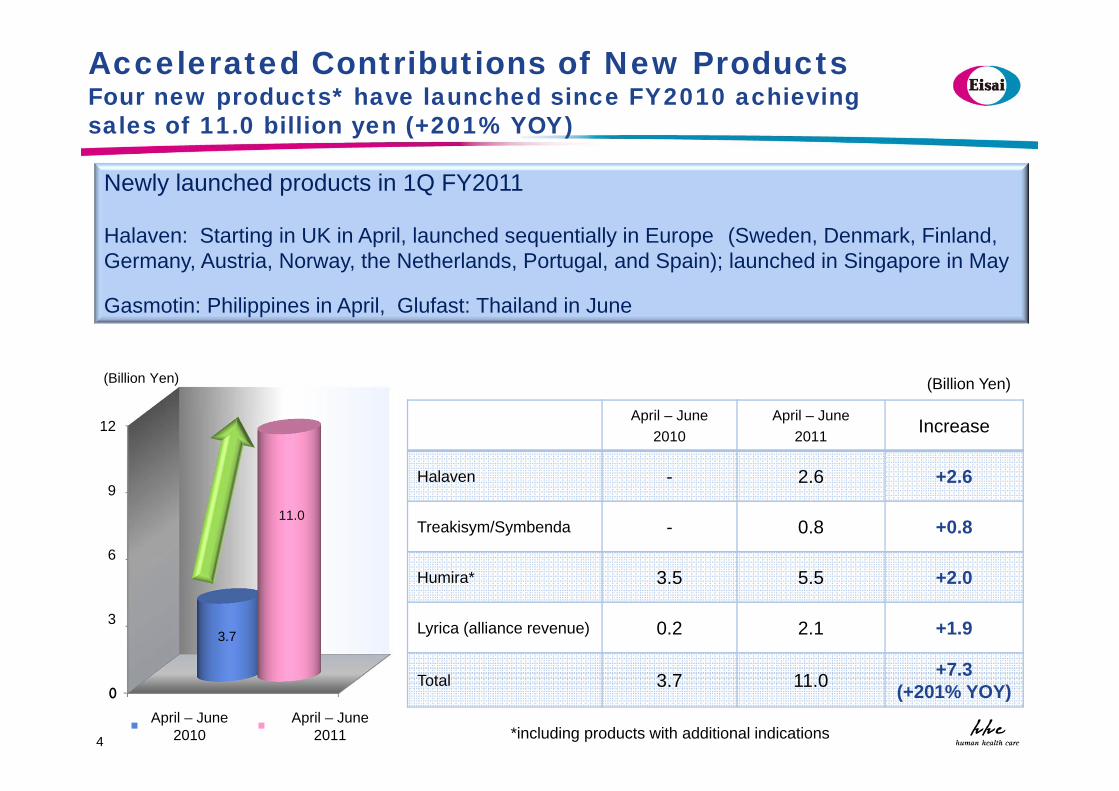
(Billion Yen)
April – June2010
April – June2011 Increase
Halaven - 2.6 +2.6
Treakisym/Symbenda - 0.8 +0.8
Humira* 3.5 5.5 +2.0
Lyrica (alliance revenue) 0.2 2.1 +1.9
Total 3.7 11.0 +7.3 (+201% YOY)0
30
60
90
120
3.7
11.0
2010年4月-6月 2011年4月-6月
(Billion Yen)
Newly launched products in 1Q FY2011
Halaven: Starting in UK in April, launched sequentially in Europe (Sweden, Denmark, Finland, Germany, Austria, Norway, the Netherlands, Portugal, and Spain); launched in Singapore in May
Gasmotin: Philippines in April, Glufast: Thailand in June
*including products with additional indications
Accelerated Contributions of New Products Four new products* have launched since FY2010 achievingsales of 11.0 billion yen (+201% YOY)
April – June 2010
April – June 2011
12
9
6
3
5
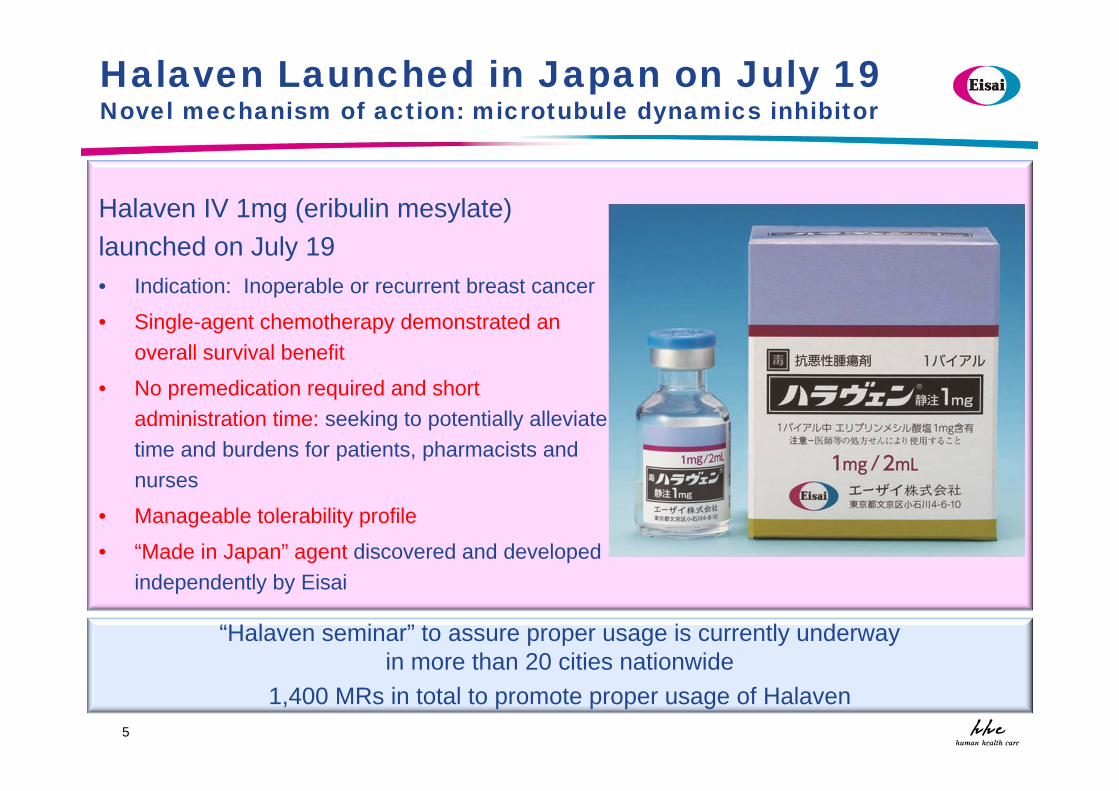
Halaven Launched in Japan on July 19 Novel mechanism of action: microtubule dynamics inhibitor
Halaven IV 1mg (eribulin mesylate) launched on July 19• Indication: Inoperable or recurrent breast cancer
• Single-agent chemotherapy demonstrated an overall survival benefit
• No premedication required and short administration time: seeking to potentially alleviate time and burdens for patients, pharmacists and nurses
• Manageable tolerability profile
• “Made in Japan” agent discovered and developed independently by Eisai
“Halaven seminar” to assure proper usage is currently underway in more than 20 cities nationwide
1,400 MRs in total to promote proper usage of Halaven
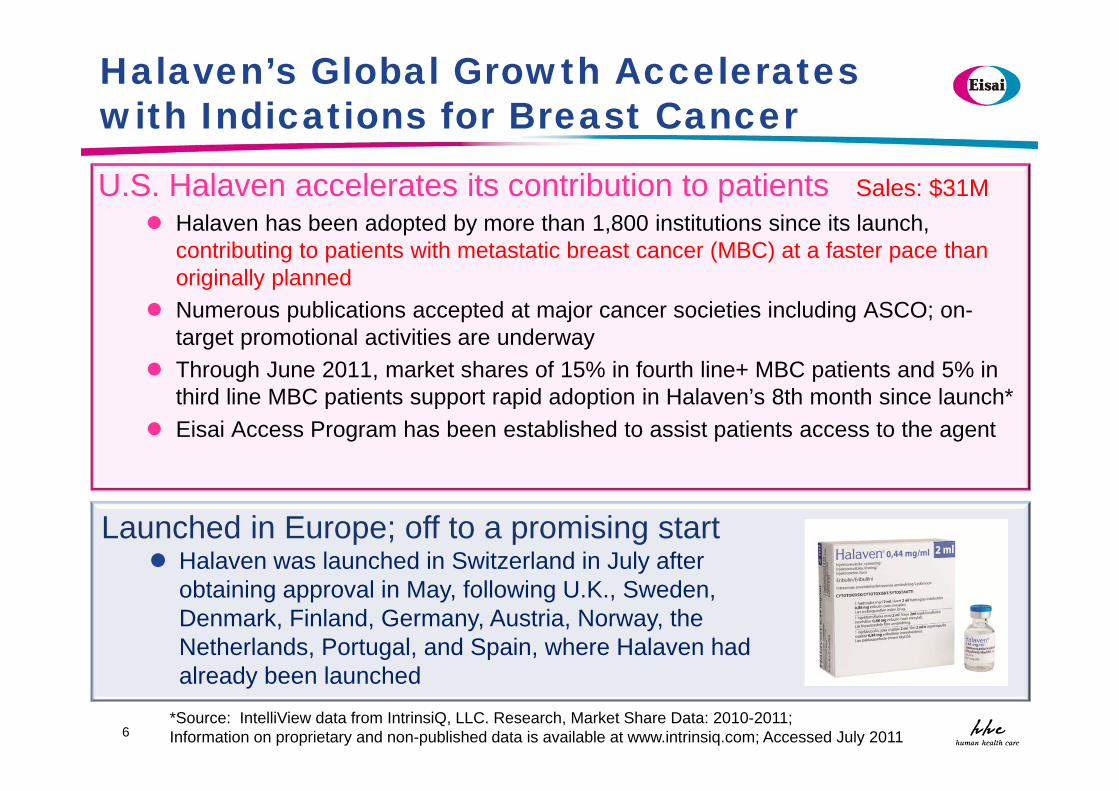
Halaven’s Global Growth Accelerates with Indications for Breast Cancer
6
U.S. Halaven accelerates its contribution to patients Sales: $31M Halaven has been adopted by more than 1,800 institutions since its launch,
contributing to patients with metastatic breast cancer (MBC) at a faster pace than originally planned
Numerous publications accepted at major cancer societies including ASCO; on-target promotional activities are underway
Through June 2011, market shares of 15% in fourth line+ MBC patients and 5% in third line MBC patients support rapid adoption in Halaven’s 8th month since launch*
Eisai Access Program has been established to assist patients access to the agent
Launched in Europe; off to a promising start Halaven was launched in Switzerland in July after
obtaining approval in May, following U.K., Sweden, Denmark, Finland, Germany, Austria, Norway, the Netherlands, Portugal, and Spain, where Halaven had already been launched
*Source: IntelliView data from IntrinsiQ, LLC. Research, Market Share Data: 2010-2011; Information on proprietary and non-published data is available at www.intrinsiq.com; Accessed July 2011
0.0
0.5
1.0
2011年度見通し 2012年度目標 2013年度目標 2014年度目標 2015年度目標
米国 欧州 イーストアジア ニューマーケット アセアン 合計
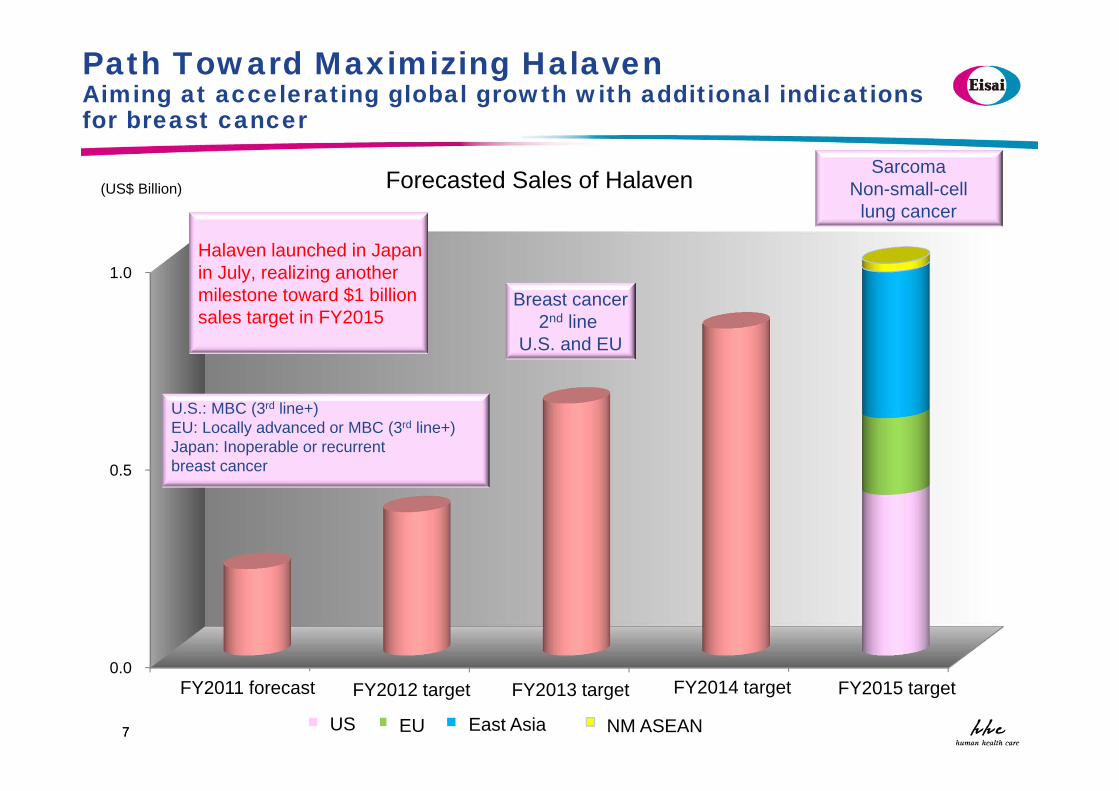
Halaven launched in Japan in July, realizing another milestone toward $1 billionsales target in FY2015
U.S.: MBC (3rd line+)EU: Locally advanced or MBC (3rd line+)Japan: Inoperable or recurrent breast cancer
Path Toward Maximizing HalavenAiming at accelerating global growth with additional indications for breast cancer
77
(US$ Billion) Forecasted Sales of Halaven
Breast cancer2nd line
U.S. and EU
SarcomaNon-small-cell
lung cancer
FY2011 forecast FY2012 target FY2013 target FY2014 target FY2015 target
US EU East Asia NM ASEAN
8
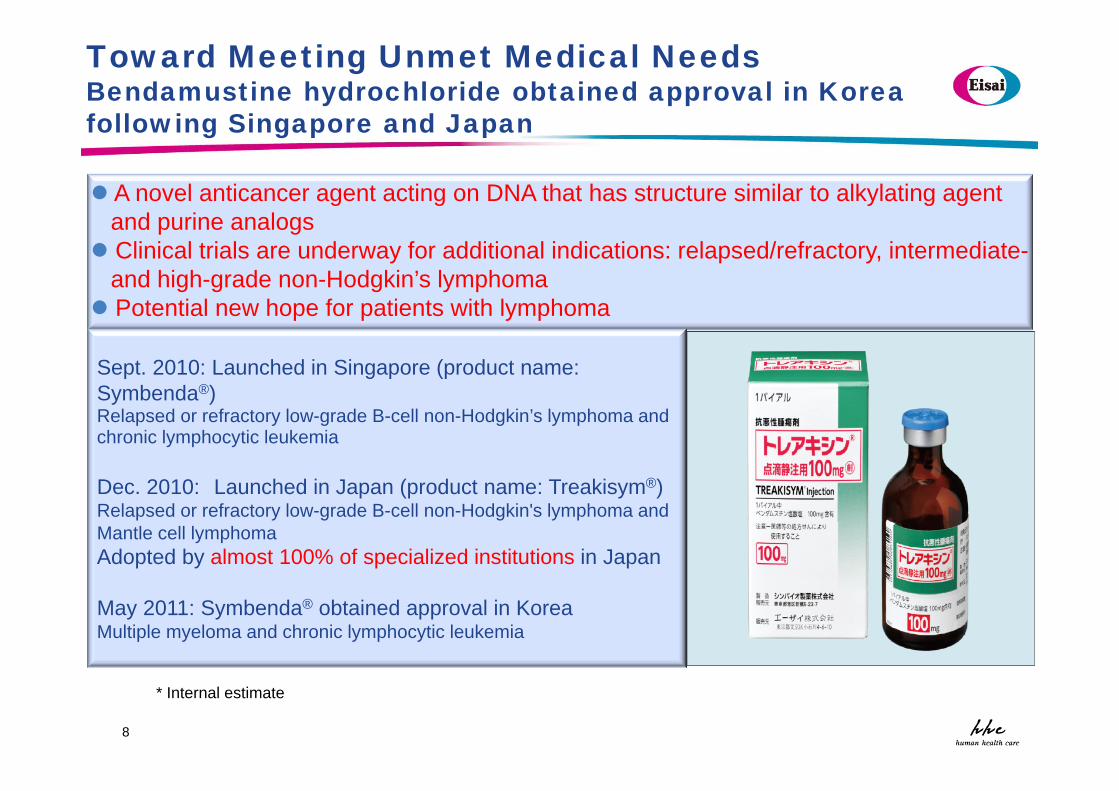
Toward Meeting Unmet Medical NeedsBendamustine hydrochloride obtained approval in Korea following Singapore and Japan
Sept. 2010: Launched in Singapore (product name: Symbenda®)Relapsed or refractory low-grade B-cell non-Hodgkin’s lymphoma and chronic lymphocytic leukemia
Dec. 2010: Launched in Japan (product name: Treakisym®)Relapsed or refractory low-grade B-cell non-Hodgkin's lymphoma and Mantle cell lymphomaAdopted by almost 100% of specialized institutions in Japan
May 2011: Symbenda® obtained approval in KoreaMultiple myeloma and chronic lymphocytic leukemia
A novel anticancer agent acting on DNA that has structure similar to alkylating agent and purine analogs Clinical trials are underway for additional indications: relapsed/refractory, intermediate-
and high-grade non-Hodgkin’s lymphoma Potential new hope for patients with lymphoma
* Internal estimate
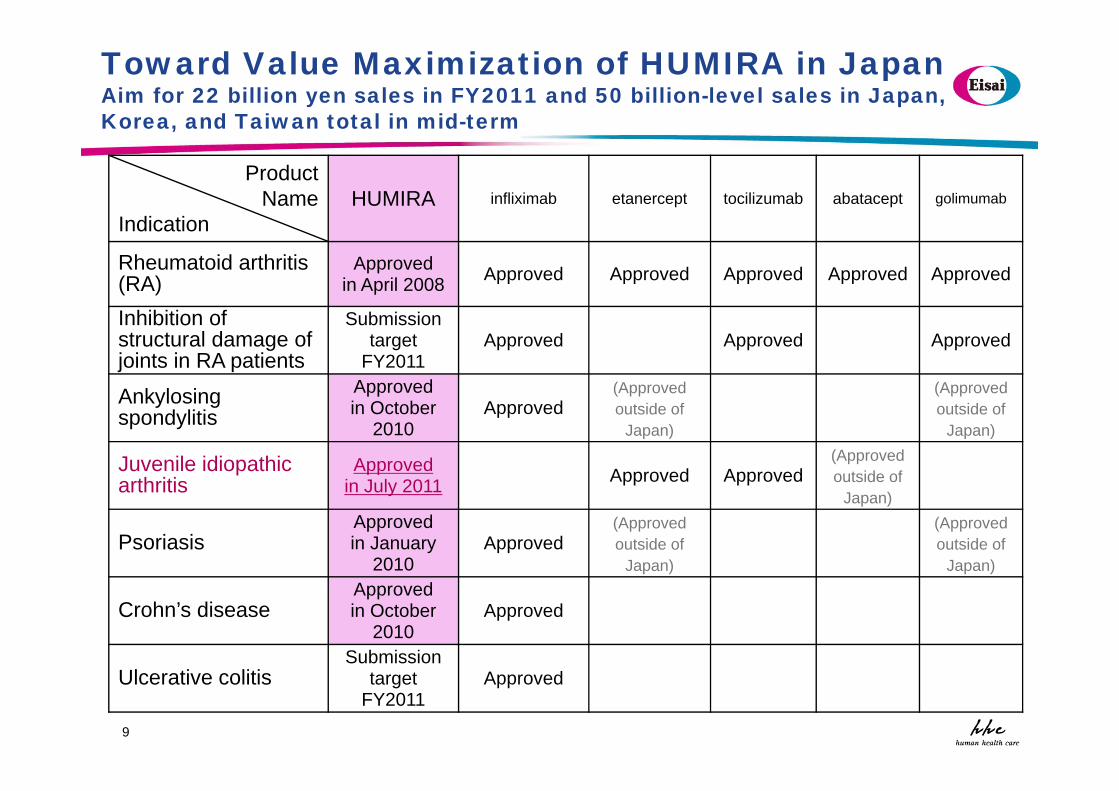
Toward Value Maximization of HUMIRA in JapanAim for 22 billion yen sales in FY2011 and 50 billion-level sales in Japan, Korea, and Taiwan total in mid-term
ProductName
IndicationHUMIRA infliximab etanercept tocilizumab abatacept golimumab
Rheumatoid arthritis(RA)
Approved in April 2008 Approved Approved Approved Approved Approved
Inhibition of structural damage of joints in RA patients
Submission target
FY2011Approved Approved Approved
Ankylosing spondylitis
Approvedin October
2010Approved
(Approved outside of
Japan)
(Approved outside of
Japan)
Juvenile idiopathic arthritis
Approvedin July 2011 Approved Approved
(Approved outside of
Japan)
PsoriasisApprovedin January
2010Approved
(Approved outside of
Japan)
(Approved outside of
Japan)
Crohn’s diseaseApprovedin October
2010Approved
Ulcerative colitisSubmission
target FY2011
Approved
9
10
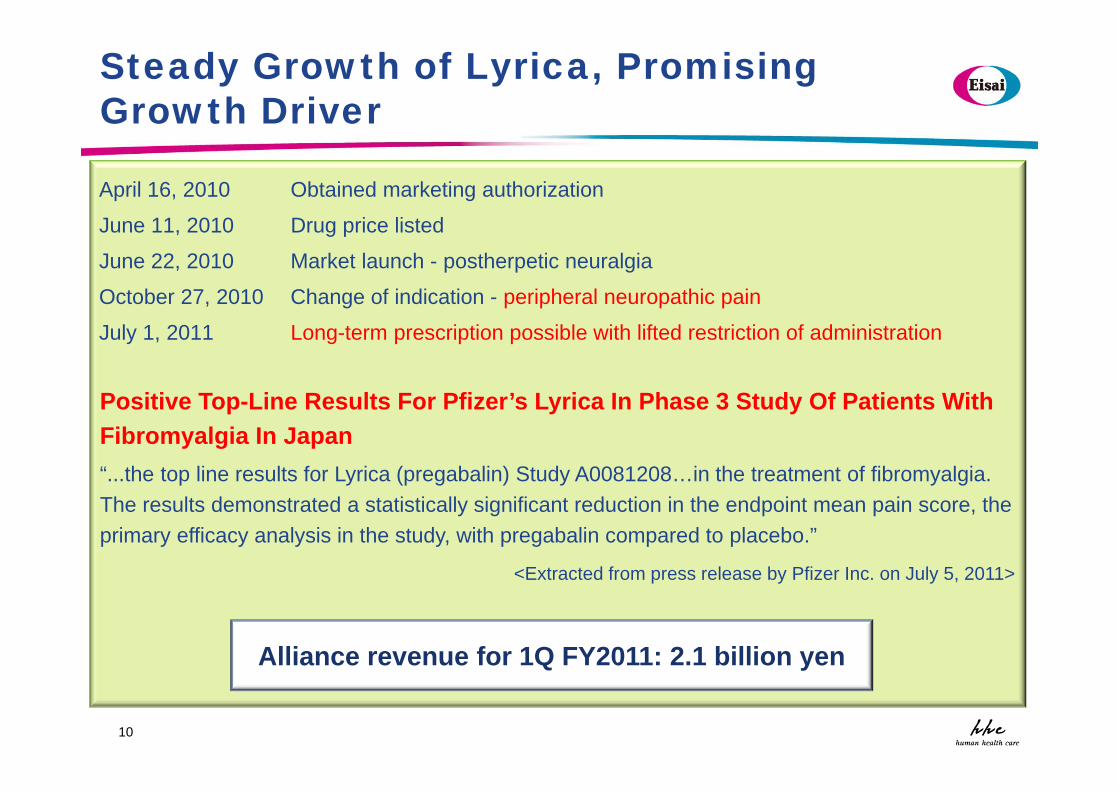
Steady Growth of Lyrica, Promising Growth Driver
Alliance revenue for 1Q FY2011: 2.1 billion yen
April 16, 2010 Obtained marketing authorization
June 11, 2010 Drug price listed
June 22, 2010 Market launch - postherpetic neuralgia
October 27, 2010 Change of indication - peripheral neuropathic pain
July 1, 2011 Long-term prescription possible with lifted restriction of administration
Positive Top-Line Results For Pfizer’s Lyrica In Phase 3 Study Of Patients With Fibromyalgia In Japan“...the top line results for Lyrica (pregabalin) Study A0081208…in the treatment of fibromyalgia.The results demonstrated a statistically significant reduction in the endpoint mean pain score, the primary efficacy analysis in the study, with pregabalin compared to placebo.”
<Extracted from press release by Pfizer Inc. on July 5, 2011>
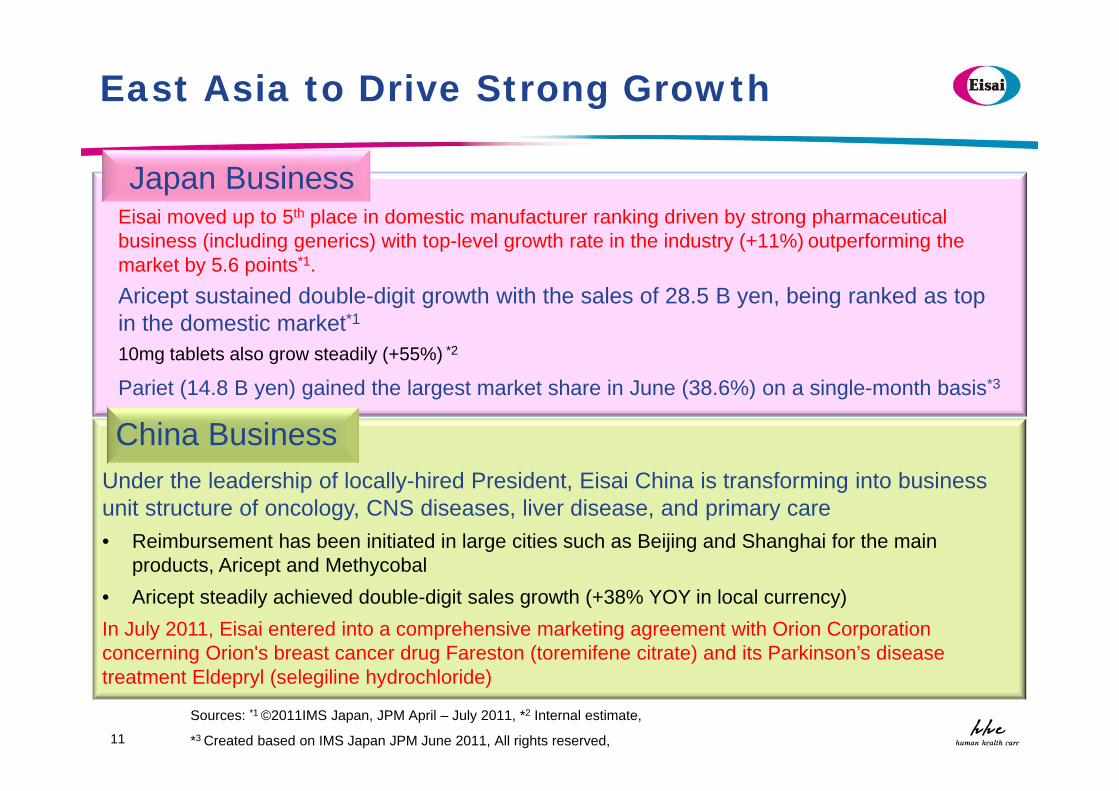
Under the leadership of locally-hired President, Eisai China is transforming into business unit structure of oncology, CNS diseases, liver disease, and primary care• Reimbursement has been initiated in large cities such as Beijing and Shanghai for the main
products, Aricept and Methycobal• Aricept steadily achieved double-digit sales growth (+38% YOY in local currency)In July 2011, Eisai entered into a comprehensive marketing agreement with Orion Corporation concerning Orion's breast cancer drug Fareston (toremifene citrate) and its Parkinson’s disease treatment Eldepryl (selegiline hydrochloride)
11
East Asia to Drive Strong Growth
Sources: *1 ©2011IMS Japan, JPM April – July 2011, *2 Internal estimate,
*3 Created based on IMS Japan JPM June 2011, All rights reserved,
Eisai moved up to 5th place in domestic manufacturer ranking driven by strong pharmaceutical business (including generics) with top-level growth rate in the industry (+11%) outperforming the market by 5.6 points*1. Aricept sustained double-digit growth with the sales of 28.5 B yen, being ranked as top in the domestic market*110mg tablets also grow steadily (+55%) *2
Pariet (14.8 B yen) gained the largest market share in June (38.6%) on a single-month basis*3
Japan Business
China Business
Lean and Efficient Operations
12
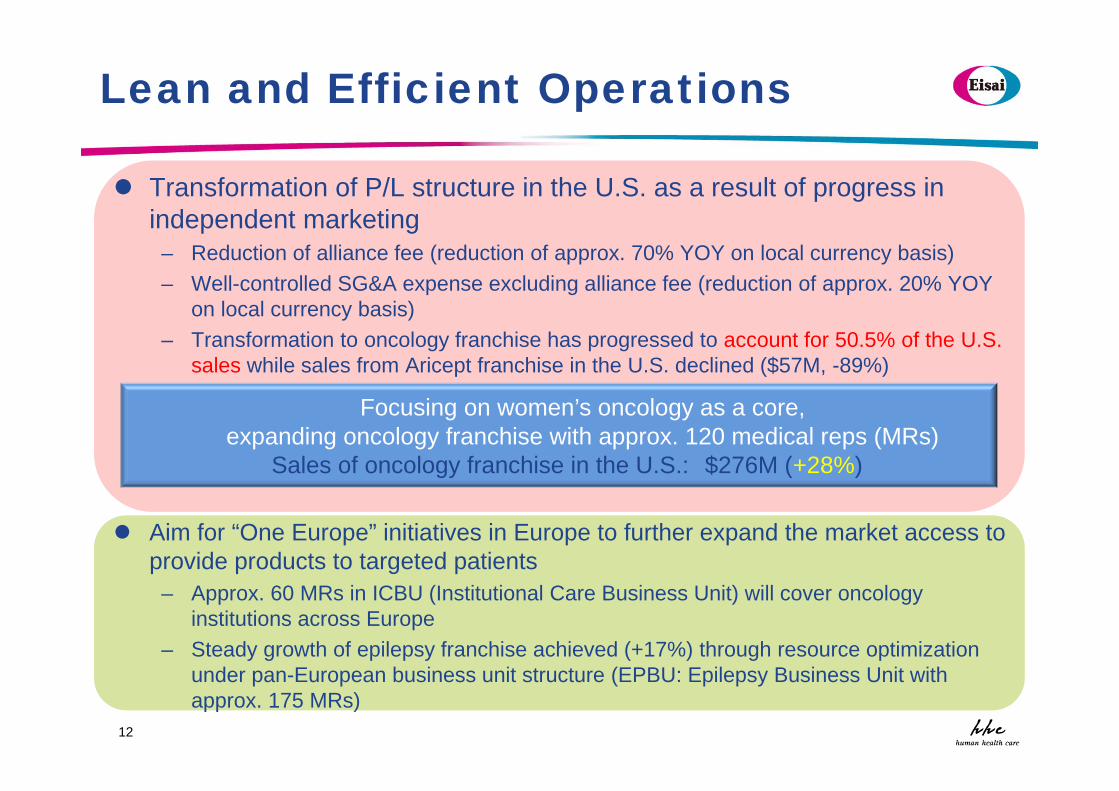
Transformation of P/L structure in the U.S. as a result of progress in independent marketing
– Reduction of alliance fee (reduction of approx. 70% YOY on local currency basis)– Well-controlled SG&A expense excluding alliance fee (reduction of approx. 20% YOY
on local currency basis)– Transformation to oncology franchise has progressed to account for 50.5% of the U.S.
sales while sales from Aricept franchise in the U.S. declined ($57M, -89%)
Aim for “One Europe” initiatives in Europe to further expand the market access to provide products to targeted patients
– Approx. 60 MRs in ICBU (Institutional Care Business Unit) will cover oncology institutions across Europe
– Steady growth of epilepsy franchise achieved (+17%) through resource optimization under pan-European business unit structure (EPBU: Epilepsy Business Unit with approx. 175 MRs)
Focusing on women’s oncology as a core, expanding oncology franchise with approx. 120 medical reps (MRs)
Sales of oncology franchise in the U.S.: $276M (+28%)
13
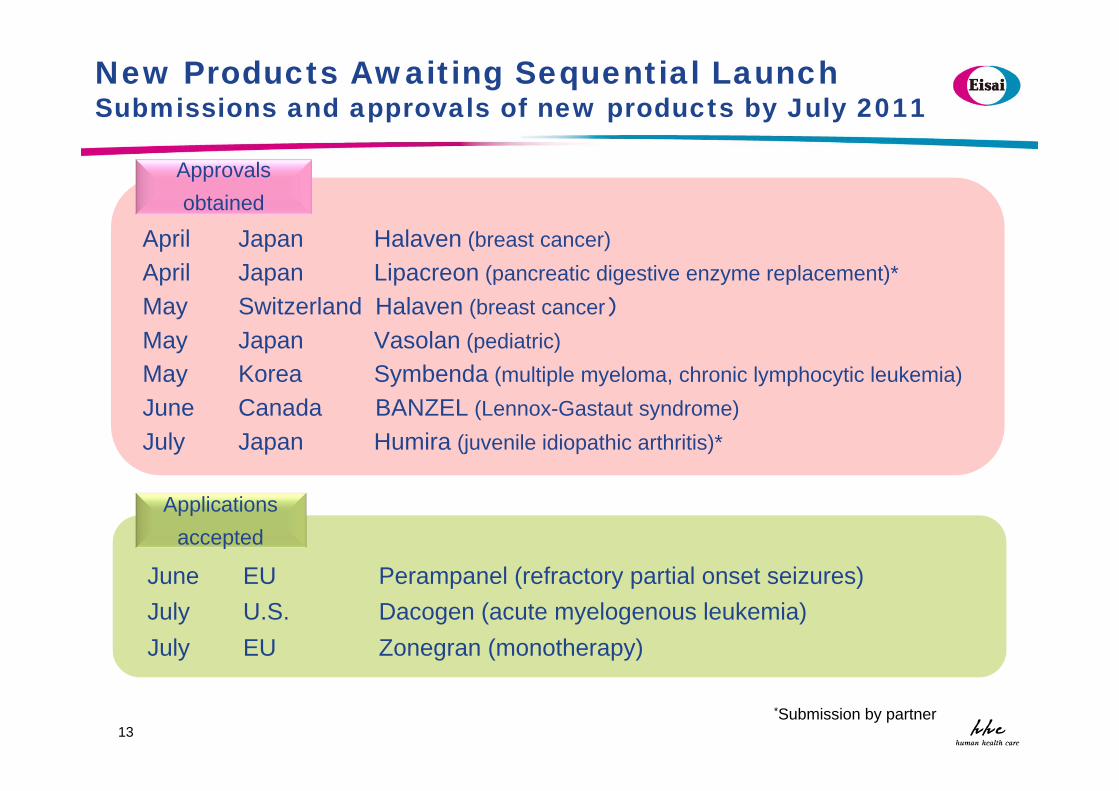
New Products Awaiting Sequential LaunchSubmissions and approvals of new products by July 2011
*Submission by partner
April Japan Halaven (breast cancer)April Japan Lipacreon (pancreatic digestive enzyme replacement)*May Switzerland Halaven (breast cancer)May Japan Vasolan (pediatric)May Korea Symbenda (multiple myeloma, chronic lymphocytic leukemia)June Canada BANZEL (Lennox-Gastaut syndrome)July Japan Humira (juvenile idiopathic arthritis)*
Applicationsaccepted
Approvalsobtained
June EU Perampanel (refractory partial onset seizures)July U.S. Dacogen (acute myelogenous leukemia)July EU Zonegran (monotherapy)
14
Partial onset seizuresPrimary generalized tonic-clonic seizures(adjunctive therapy)
Partial onset seizures(monotherapy)
Lennox-Gastautsyndrome
Partial onset seizures(pediatric, adjunctive
therapy)
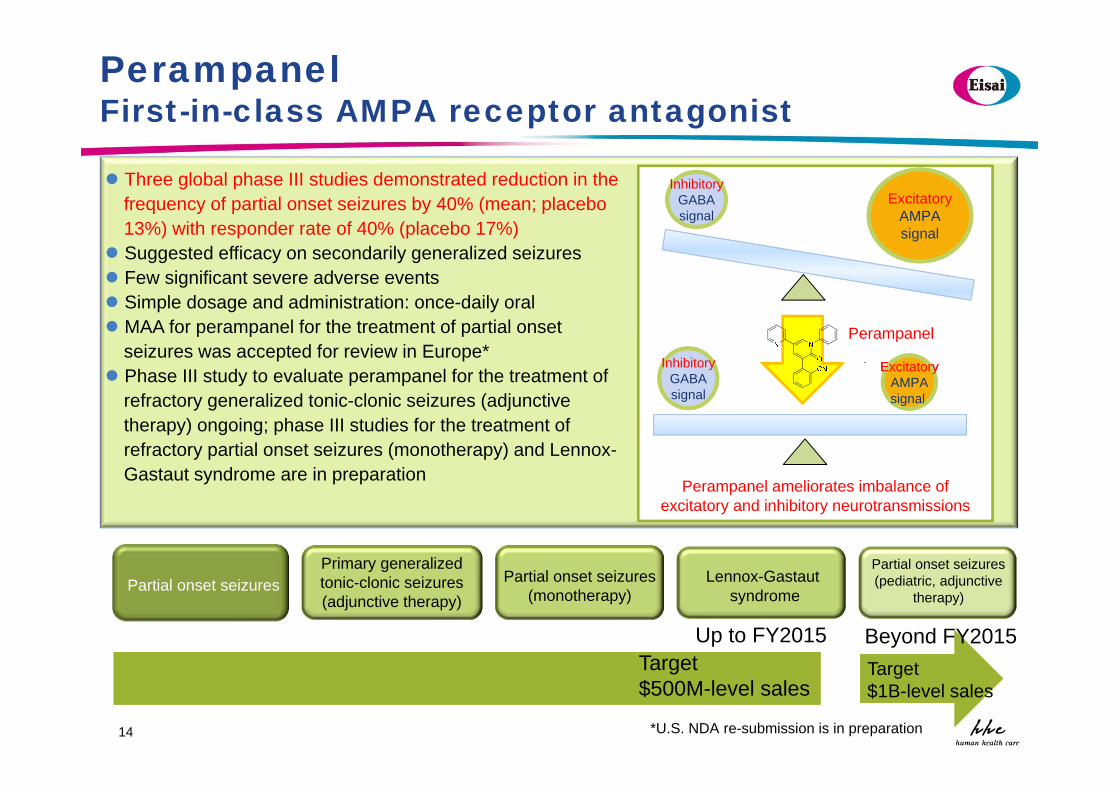
Target $1B-level sales
Up to FY2015Target $500M-level sales
Inhibitory
signal
InhibitoryGABAsignal
ExcitatoryAMPAsignal
Excitatory
signal
ExcitatoryAMPAsignal
InhibitoryInhibitoryGABAsignal
Perampanel ameliorates imbalance of excitatory and inhibitory neurotransmissions
Perampanel
PerampanelFirst-in-class AMPA receptor antagonist
Three global phase III studies demonstrated reduction in the frequency of partial onset seizures by 40% (mean; placebo 13%) with responder rate of 40% (placebo 17%)
Suggested efficacy on secondarily generalized seizures Few significant severe adverse events Simple dosage and administration: once-daily oral MAA for perampanel for the treatment of partial onset
seizures was accepted for review in Europe* Phase III study to evaluate perampanel for the treatment of
refractory generalized tonic-clonic seizures (adjunctive therapy) ongoing; phase III studies for the treatment of refractory partial onset seizures (monotherapy) and Lennox-Gastaut syndrome are in preparation
*U.S. NDA re-submission is in preparation
Beyond FY2015
15
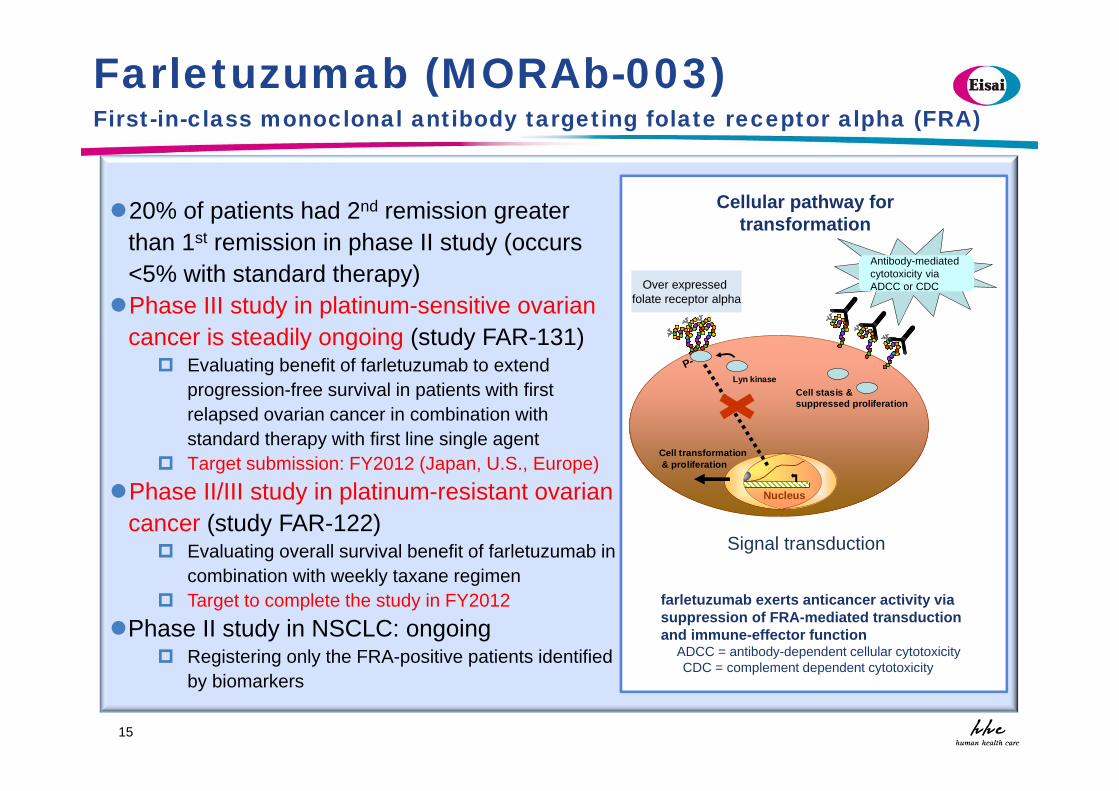
Farletuzumab (MORAb-003)First-in-class monoclonal antibody targeting folate receptor alpha (FRA)
20% of patients had 2nd remission greater than 1st remission in phase II study (occurs <5% with standard therapy)Phase III study in platinum-sensitive ovarian
cancer is steadily ongoing (study FAR-131) Evaluating benefit of farletuzumab to extend
progression-free survival in patients with first relapsed ovarian cancer in combination with standard therapy with first line single agent
Target submission: FY2012 (Japan, U.S., Europe)Phase II/III study in platinum-resistant ovarian
cancer (study FAR-122) Evaluating overall survival benefit of farletuzumab in
combination with weekly taxane regimen Target to complete the study in FY2012
Phase II study in NSCLC: ongoing Registering only the FRA-positive patients identified
by biomarkers
Signal transduction
Cellular pathway for transformation
Nucleus
P-
Cell transformation& proliferation
Cell stasis &suppressed proliferation
antibody mediated cytoxicity via
ADCC and CDC
Lyn kinase
over-expressed folate receptor alpha
Over expressed folate receptor alpha
Antibody-mediated cytotoxicity viaADCC or CDC
farletuzumab exerts anticancer activity via suppression of FRA-mediated transduction and immune-effector function
ADCC = antibody-dependent cellular cytotoxicityCDC = complement dependent cytotoxicity
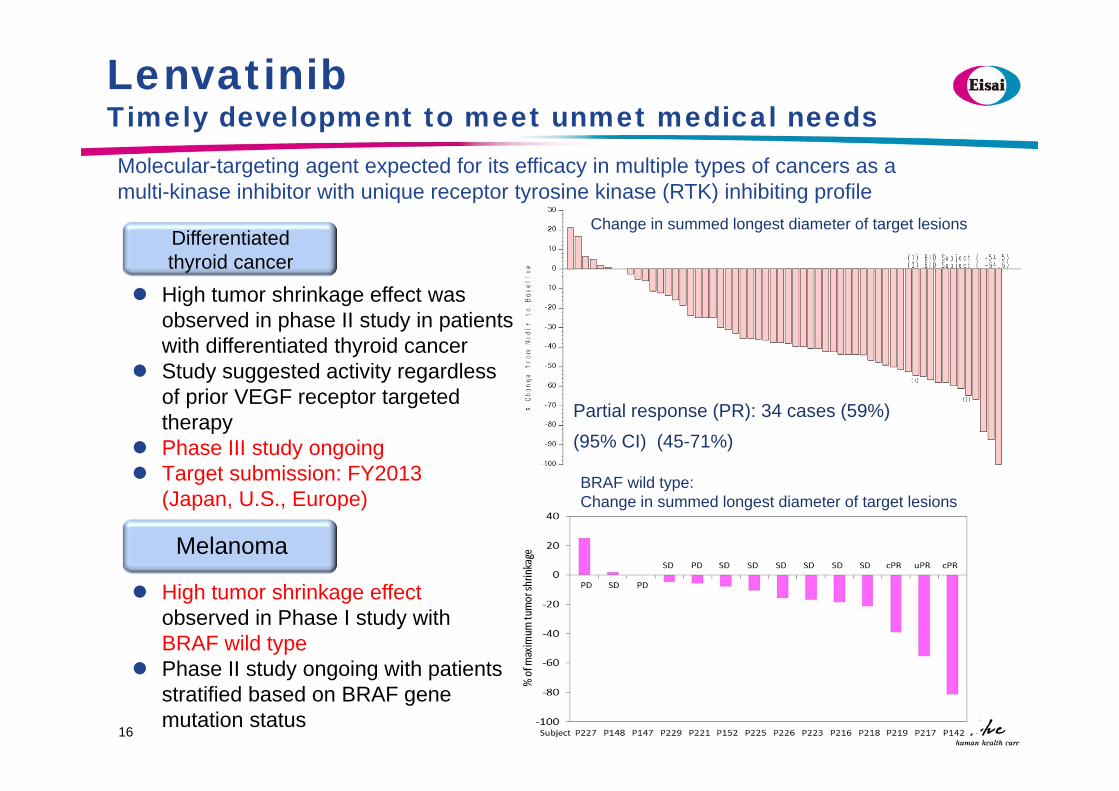
Change in summed longest diameter of target lesions
LenvatinibTimely development to meet unmet medical needs
16
Partial response (PR): 34 cases (59%)(95% CI) (45-71%)
High tumor shrinkage effect was observed in phase II study in patients with differentiated thyroid cancer
Study suggested activity regardless of prior VEGF receptor targeted therapy
Phase III study ongoing Target submission: FY2013
(Japan, U.S., Europe)
High tumor shrinkage effectobserved in Phase I study with BRAF wild type
Phase II study ongoing with patients stratified based on BRAF gene mutation status
Molecular-targeting agent expected for its efficacy in multiple types of cancers as a multi-kinase inhibitor with unique receptor tyrosine kinase (RTK) inhibiting profile
BRAF wild type:Change in summed longest diameter of target lesions
Differentiated thyroid cancer
Melanoma
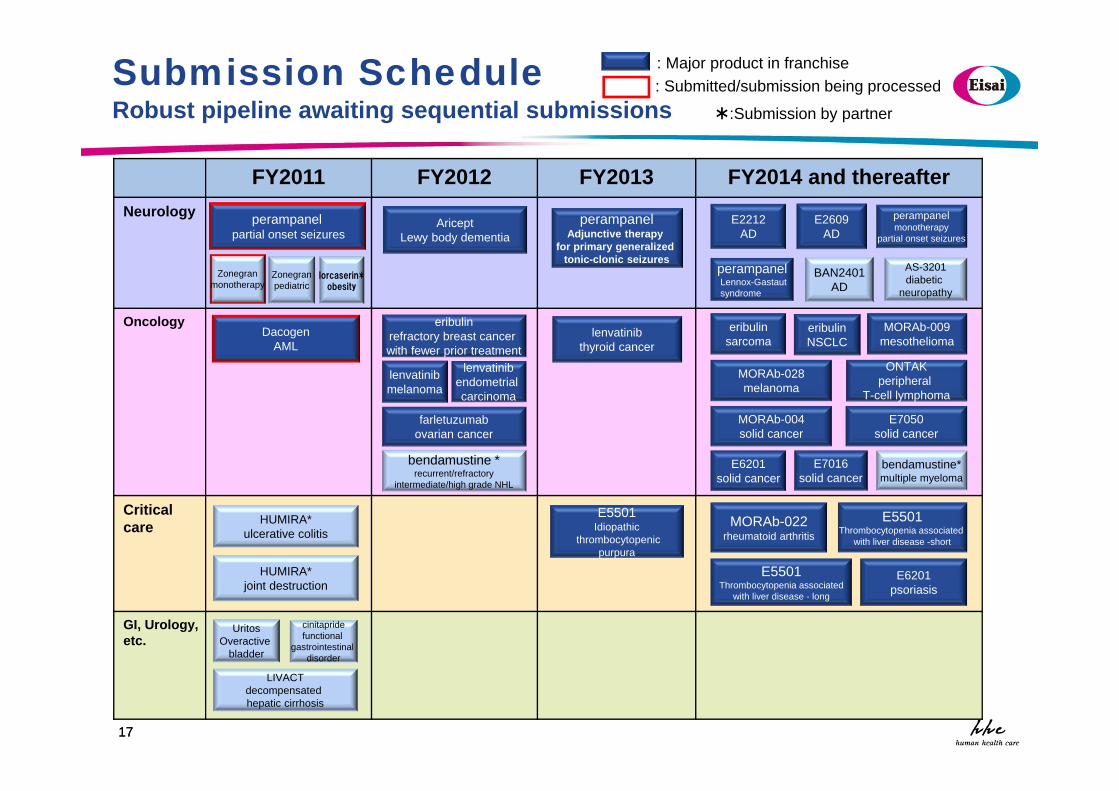
FY2011 FY2012 FY2013 FY2014 and thereafterNeurology
Oncology
Critical care
GI, Urology, etc.
1717
HUMIRA*ulcerative colitis
HUMIRA*joint destruction
UritosOveractive
bladder
eribulinrefractory breast cancer with fewer prior treatment
lenvatinibmelanoma
lenvatinibendometrial carcinoma
E5501Idiopathic
thrombocytopenicpurpura
E2212AD
BAN2401AD
perampanelmonotherapy
partial onset seizures
E2609AD
AS-3201diabetic
neuropathy
bendamustine*multiple myeloma
MORAb-009mesothelioma
E6201solid cancer
MORAb-004solid cancer
E7050solid cancer
MORAb-028melanoma
ONTAKperipheral
T-cell lymphoma
MORAb-022rheumatoid arthritis
E5501Thrombocytopenia associated
with liver disease -short
E5501Thrombocytopenia associated
with liver disease - long
E6201psoriasis
Submission ScheduleRobust pipeline awaiting sequential submissions
LIVACTdecompensated hepatic cirrhosis
lenvatinibthyroid cancer
perampanelAdjunctive therapy
for primary generalized tonic-clonic seizures
bendamustine *recurrent/refractory
intermediate/high grade NHL
perampanelLennox-Gastaut syndrome
farletuzumabovarian cancer
cinitapridefunctional
gastrointestinal disorder
: Major product in franchise
*:Submission by partner
: Submitted/submission being processed
E7016solid cancer
DacogenAML
eribulinsarcoma
perampanelpartial onset seizures
Zonegranmonotherapy
lorcaserin*obesity
Zonegranpediatric
AriceptLewy body dementia
eribulinNSCLC
18
Overview of 1Q FY2011 Consolidated Financial Results
and Outlook for FY2011
1919
April – June 2010 April – June 2011
Results % Results % YOY
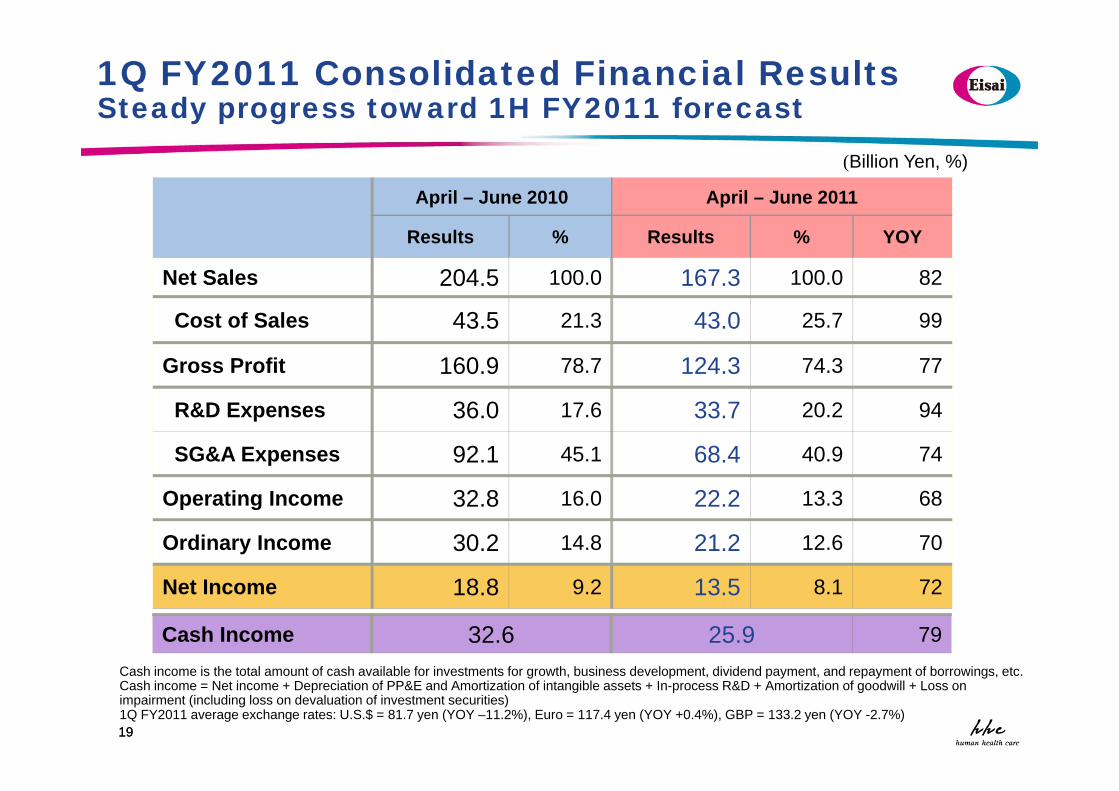
Net Sales 204.5 100.0 167.3 100.0 82
Cost of Sales 43.5 21.3 43.0 25.7 99
Gross Profit 160.9 78.7 124.3 74.3 77
R&D Expenses 36.0 17.6 33.7 20.2 94
SG&A Expenses 92.1 45.1 68.4 40.9 74
Operating Income 32.8 16.0 22.2 13.3 68
Ordinary Income 30.2 14.8 21.2 12.6 70
Net Income 18.8 9.2 13.5 8.1 72
(Billion Yen, %)
1Q FY2011 Consolidated Financial ResultsSteady progress toward 1H FY2011 forecast
Cash income is the total amount of cash available for investments for growth, business development, dividend payment, and repayment of borrowings, etc.Cash income = Net income + Depreciation of PP&E and Amortization of intangible assets + In-process R&D + Amortization of goodwill + Loss on impairment (including loss on devaluation of investment securities)1Q FY2011 average exchange rates: U.S.$ = 81.7 yen (YOY –11.2%), Euro = 117.4 yen (YOY +0.4%), GBP = 133.2 yen (YOY -2.7%)
Cash Income 32.6 25.9 79
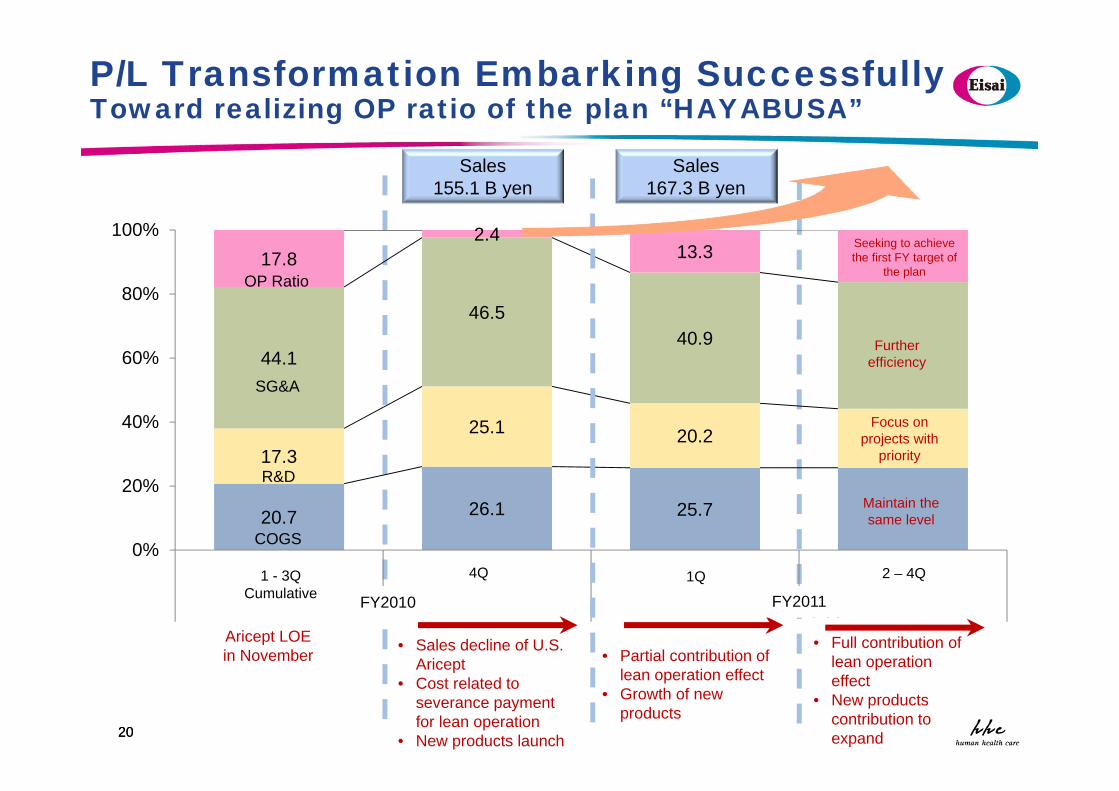
20.7 26.1 25.7
17.325.1 20.2
44.1
46.540.9
17.82.4
13.3
0%
20%
40%
60%
80%
100%
第3四半期累計 第4四半期 第1四半期 第2~4四半期
2010年度 2011年度
1 - 3QCumulative
4Q 1Q 2 – 4Q
2020
P/L Transformation Embarking SuccessfullyToward realizing OP ratio of the plan “HAYABUSA”
Focus on projects with
priority
Further efficiency
Seeking to achieve the first FY target of
the plan
Maintain the same level
Aricept LOEin November • Sales decline of U.S.
Aricept• Cost related to
severance payment for lean operation
• New products launch
Sales 155.1 B yen
• Partial contribution of lean operation effect
• Growth of new products
• Full contribution of lean operation effect
• New products contribution to expand
Sales 167.3 B yen
FY2010 FY2011
OP Ratio
SG&A
R&D
COGS
21
Achieving the Planned Operating ProfitDrivers for Improving Operating Profit Ratio
Rapid expansion of high-profitability, independently-marketed products mainly in oncology franchise
Continuous growth in East Asia Region
Further efficiency of SG&A through lean operation
Toward Operating Profit of 109B yen (OP ratio 15.6%) in FY2011
0
50
100
150
200
250
2010年度1Q 2011年度1Q
Halaven シンベンダ/トレアキシン
Aloxi DacogenFragmin その他
2222
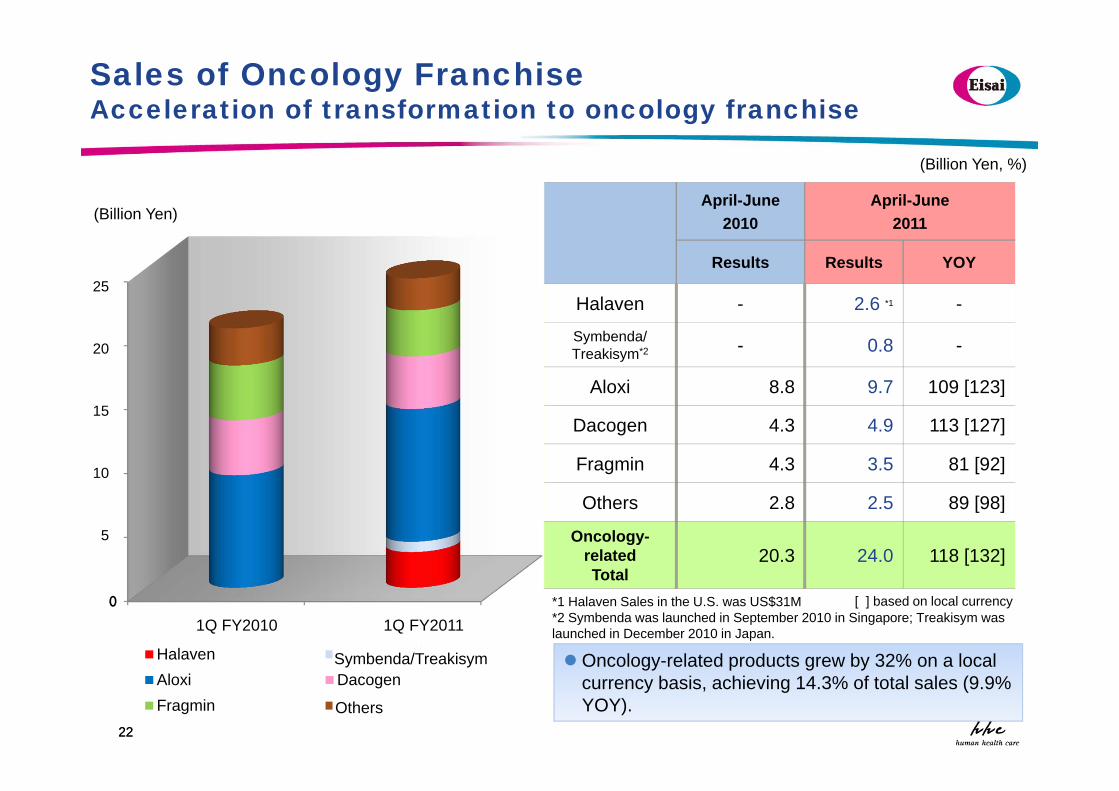
Sales of Oncology Franchise Acceleration of transformation to oncology franchise
(Billion Yen, %)
(Billion Yen)
Oncology-related products grew by 32% on a local currency basis, achieving 14.3% of total sales (9.9% YOY).
April-June2010
April-June2011
Results Results YOY
Halaven - 2.6 *1 -
Symbenda/Treakisym*2 - 0.8 -
Aloxi 8.8 9.7 109 [123]
Dacogen 4.3 4.9 113 [127]
Fragmin 4.3 3.5 81 [92]
Others 2.8 2.5 89 [98]
Oncology-related Total
20.3 24.0 118 [132]
[ ] based on local currency*1 Halaven Sales in the U.S. was US$31M*2 Symbenda was launched in September 2010 in Singapore; Treakisym was launched in December 2010 in Japan.
Symbenda/Treakisym
Others
1Q FY2010 1Q FY2011
25
20
15
10
5
2323
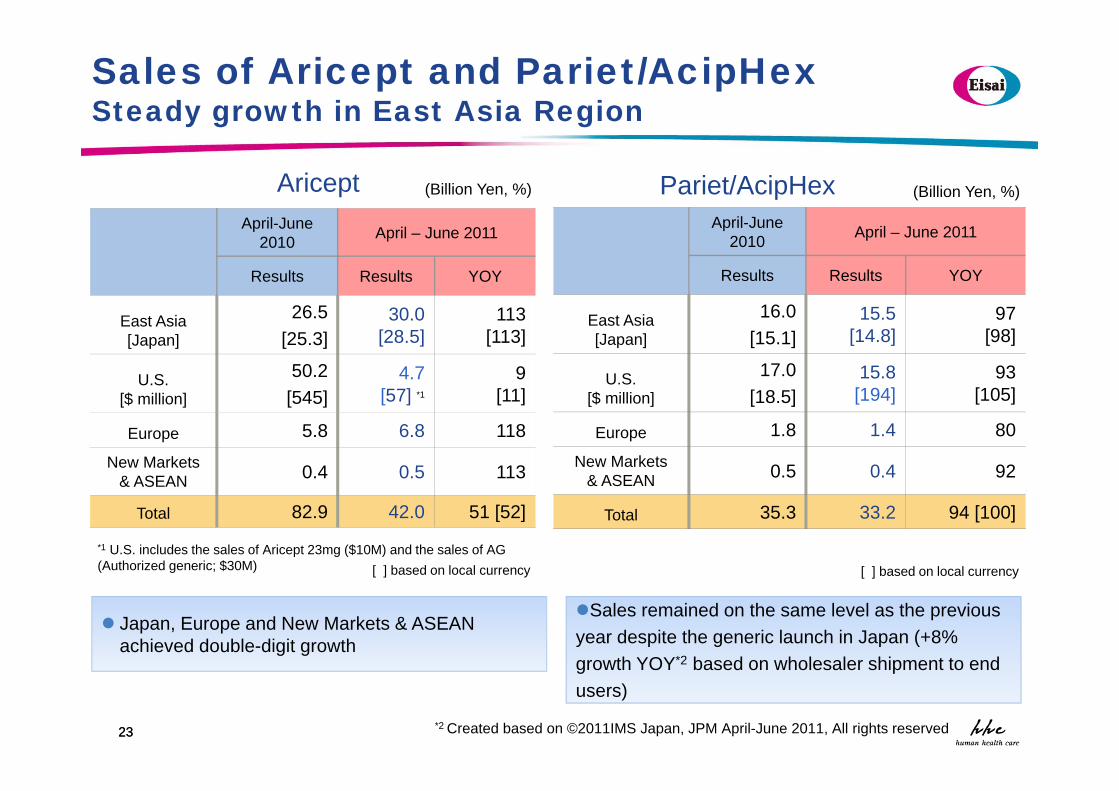
Sales of Aricept and Pariet/AcipHexSteady growth in East Asia Region
(Billion Yen, %)
April-June 2010 April – June 2011
Results Results YOY
East Asia[Japan]
26.5[25.3]
30.0[28.5]
113[113]
U.S.[$ million]
50.2[545]
4.7[57] *1
9[11]
Europe 5.8 6.8 118New Markets
& ASEAN 0.4 0.5 113
Total 82.9 42.0 51 [52]
Japan, Europe and New Markets & ASEAN achieved double-digit growth
[ ] based on local currency
*1 U.S. includes the sales of Aricept 23mg ($10M) and the sales of AG (Authorized generic; $30M)
Aricept (Billion Yen, %)
April-June 2010 April – June 2011
Results Results YOY
East Asia[Japan]
16.0[15.1]
15.5[14.8]
97[98]
U.S.[$ million]
17.0[18.5]
15.8[194]
93[105]
Europe 1.8 1.4 80New Markets
& ASEAN 0.5 0.4 92
Total 35.3 33.2 94 [100]
Sales remained on the same level as the previous year despite the generic launch in Japan (+8%growth YOY*2 based on wholesaler shipment to end users)
[ ] based on local currency
Pariet/AcipHex
*2 Created based on ©2011IMS Japan, JPM April-June 2011, All rights reserved
2424
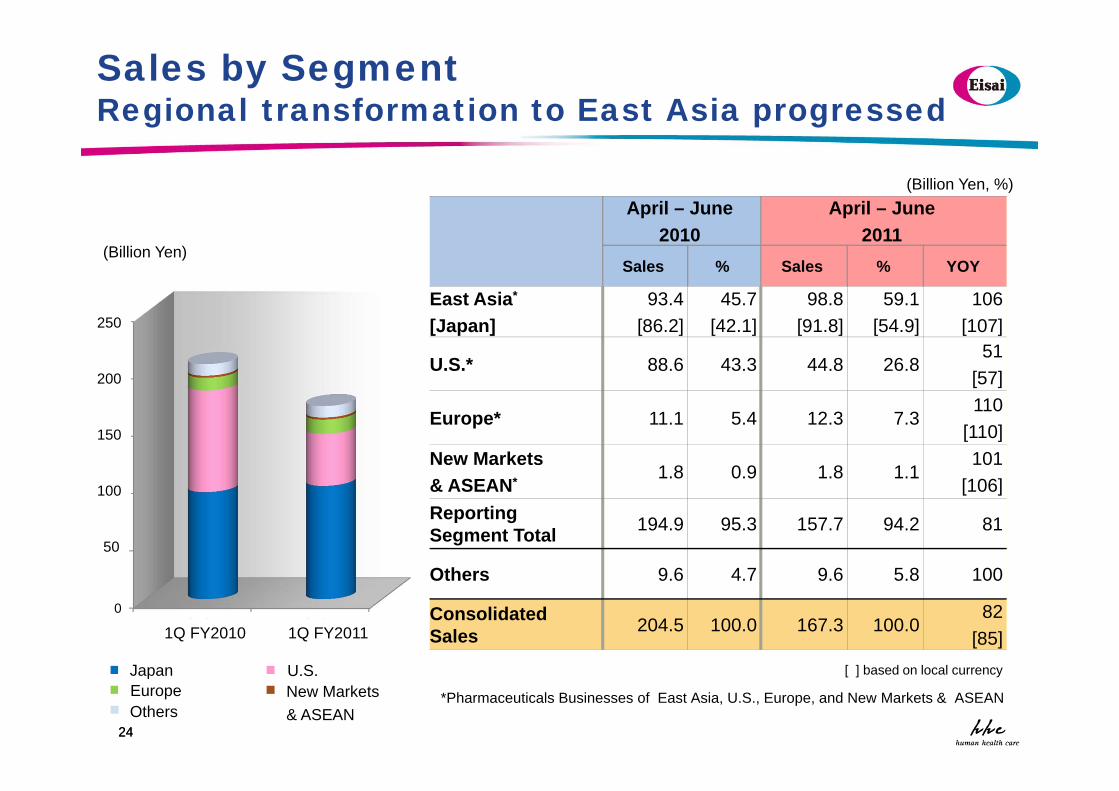
Sales by Segment Regional transformation to East Asia progressed
April – June2010
April – June2011
Sales % Sales % YOY
East Asia*
[Japan]93.4
[86.2]45.7
[42.1]98.8
[91.8]59.1
[54.9]106
[107]
U.S.* 88.6 43.3 44.8 26.851
[57]
Europe* 11.1 5.4 12.3 7.3110
[110]New Markets& ASEAN* 1.8 0.9 1.8 1.1
101[106]
Reporting Segment Total 194.9 95.3 157.7 94.2 81
Others 9.6 4.7 9.6 5.8 100
Consolidated Sales 204.5 100.0 167.3 100.0
82[85]
(Billion Yen, %)
(Billion Yen)
[ ] based on local currency
0
500
1000
1500
2000
2500
2010年度1Q 2011年度1Q
日本 米国欧州 ニューマーケット アセアン
その他
JapanEurope
U.S.New Markets& ASEAN
1Q FY2010 1Q FY2011
250
200
150
100
50
Others*Pharmaceuticals Businesses of East Asia, U.S., Europe, and New Markets & ASEAN
2525
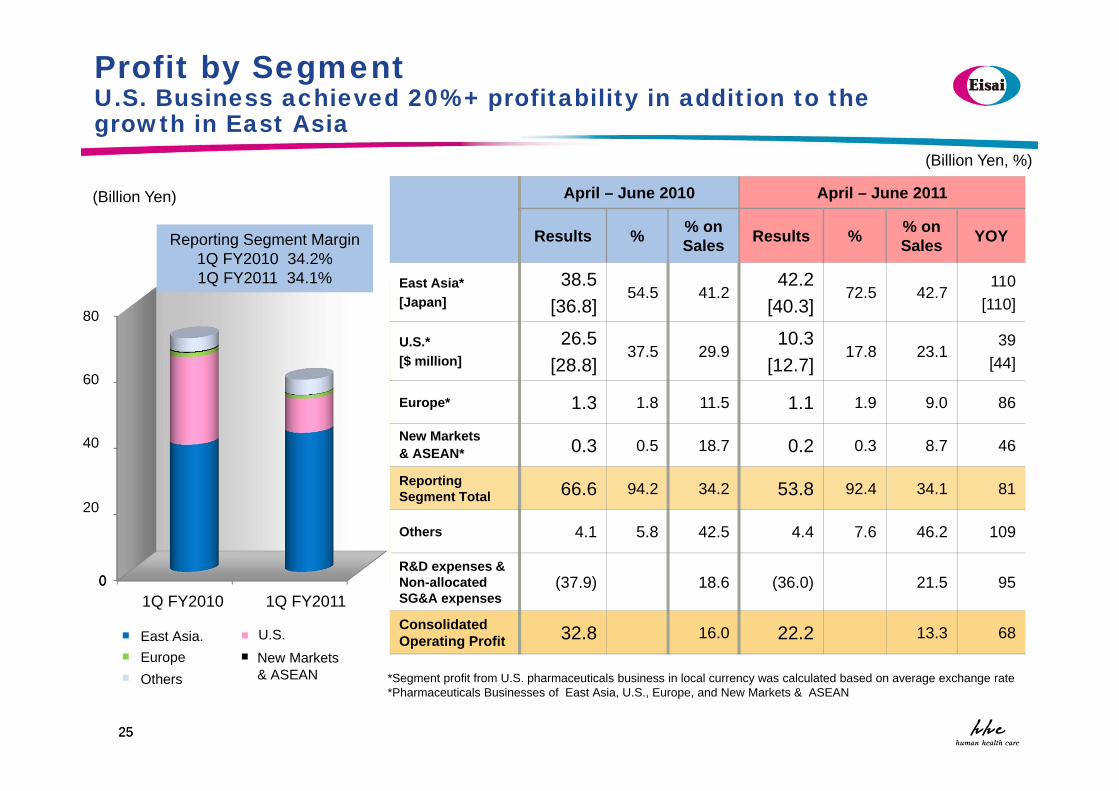
Profit by SegmentU.S. Business achieved 20%+ profitability in addition to the growth in East Asia
April – June 2010 April – June 2011
Results % % on Sales Results % % on
Sales YOY
East Asia*[Japan]
38.5[36.8]
54.5 41.242.2
[40.3]72.5 42.7
110[110]
U.S.* [$ million]
26.5[28.8]
37.5 29.910.3
[12.7]17.8 23.1
39[44]
Europe* 1.3 1.8 11.5 1.1 1.9 9.0 86
New Markets& ASEAN* 0.3 0.5 18.7 0.2 0.3 8.7 46
Reporting Segment Total 66.6 94.2 34.2 53.8 92.4 34.1 81
Others 4.1 5.8 42.5 4.4 7.6 46.2 109
R&D expenses & Non-allocated SG&A expenses
(37.9) 18.6 (36.0) 21.5 95
Consolidated Operating Profit 32.8 16.0 22.2 13.3 68
(Billion Yen, %)
*Segment profit from U.S. pharmaceuticals business in local currency was calculated based on average exchange rate*Pharmaceuticals Businesses of East Asia, U.S., Europe, and New Markets & ASEAN
(Billion Yen)
0
200
400
600
800
2010年度1Q 2011年度1Q
イースト アジア 米国
欧州 ニューマーケット アセアン
その他
U.S.New Markets & ASEAN
East Asia.EuropeOthers
1Q FY2010 1Q FY2011
80
60
40
20
Reporting Segment Margin1Q FY2010 34.2%1Q FY2011 34.1%
26
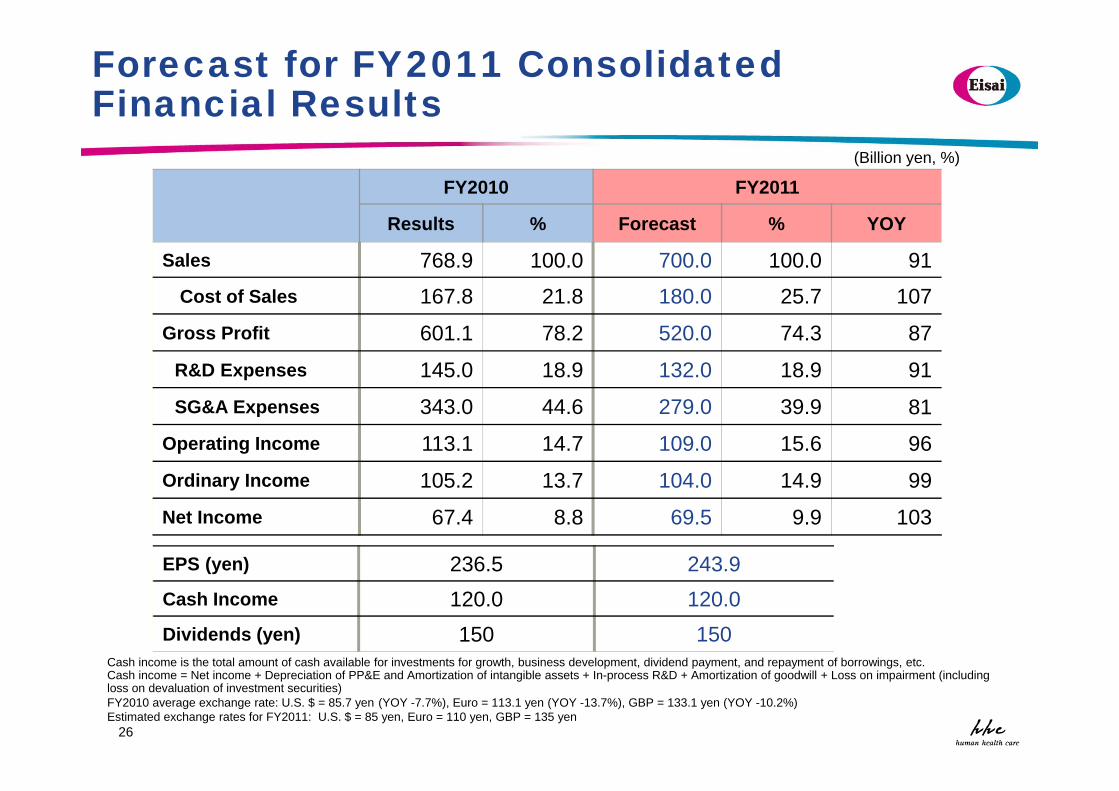
FY2010 FY2011
Results % Forecast % YOY
Sales 768.9 100.0 700.0 100.0 91Cost of Sales 167.8 21.8 180.0 25.7 107
Gross Profit 601.1 78.2 520.0 74.3 87
R&D Expenses 145.0 18.9 132.0 18.9 91
SG&A Expenses 343.0 44.6 279.0 39.9 81
Operating Income 113.1 14.7 109.0 15.6 96
Ordinary Income 105.2 13.7 104.0 14.9 99
Net Income 67.4 8.8 69.5 9.9 103
(Billion yen, %)
EPS (yen) 236.5 243.9Cash Income 120.0 120.0Dividends (yen) 150 150
Forecast for FY2011 Consolidated Financial Results
Cash income is the total amount of cash available for investments for growth, business development, dividend payment, and repayment of borrowings, etc.Cash income = Net income + Depreciation of PP&E and Amortization of intangible assets + In-process R&D + Amortization of goodwill + Loss on impairment (including loss on devaluation of investment securities)FY2010 average exchange rate: U.S. $ = 85.7 yen (YOY -7.7%), Euro = 113.1 yen (YOY -13.7%), GBP = 133.1 yen (YOY -10.2%)Estimated exchange rates for FY2011: U.S. $ = 85 yen, Euro = 110 yen, GBP = 135 yen
27
Reference Data
27
2828
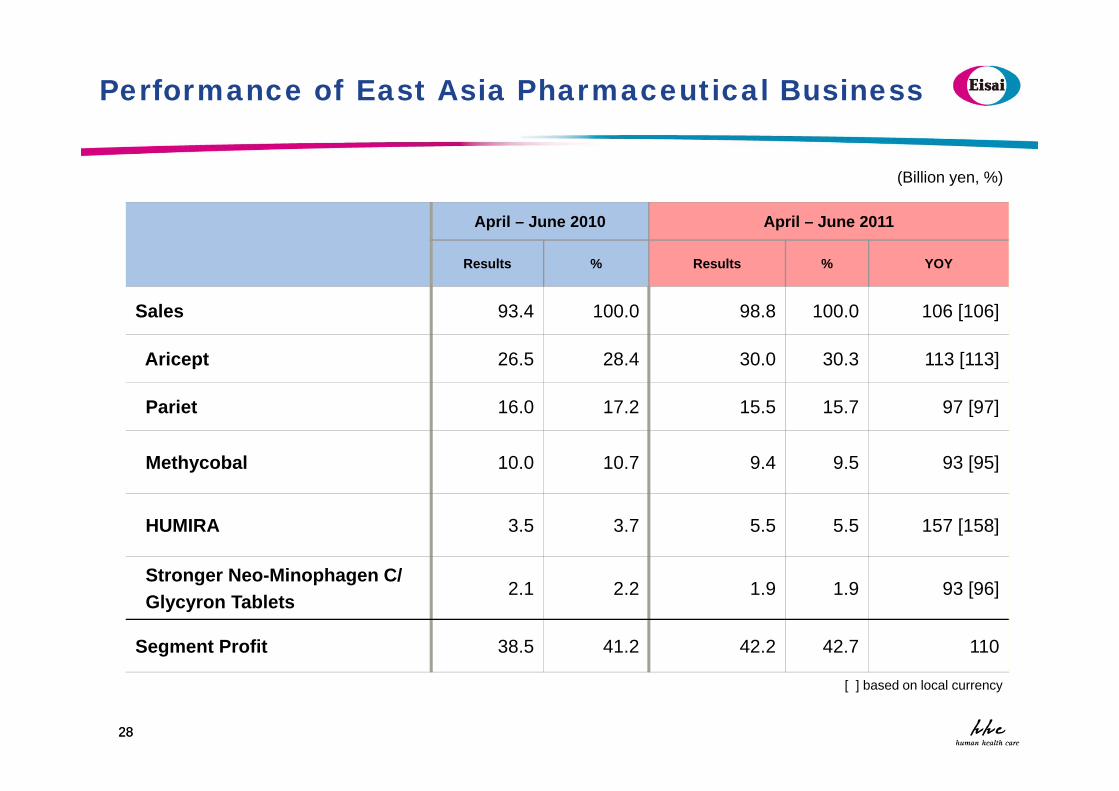
Performance of East Asia Pharmaceutical Business
April – June 2010 April – June 2011
Results % Results % YOY
Sales 93.4 100.0 98.8 100.0 106 [106]
Aricept 26.5 28.4 30.0 30.3 113 [113]
Pariet 16.0 17.2 15.5 15.7 97 [97]
Methycobal 10.0 10.7 9.4 9.5 93 [95]
HUMIRA 3.5 3.7 5.5 5.5 157 [158]
Stronger Neo-Minophagen C/Glycyron Tablets
2.1 2.2 1.9 1.9 93 [96]
Segment Profit 38.5 41.2 42.2 42.7 110
(Billion yen, %)
[ ] based on local currency
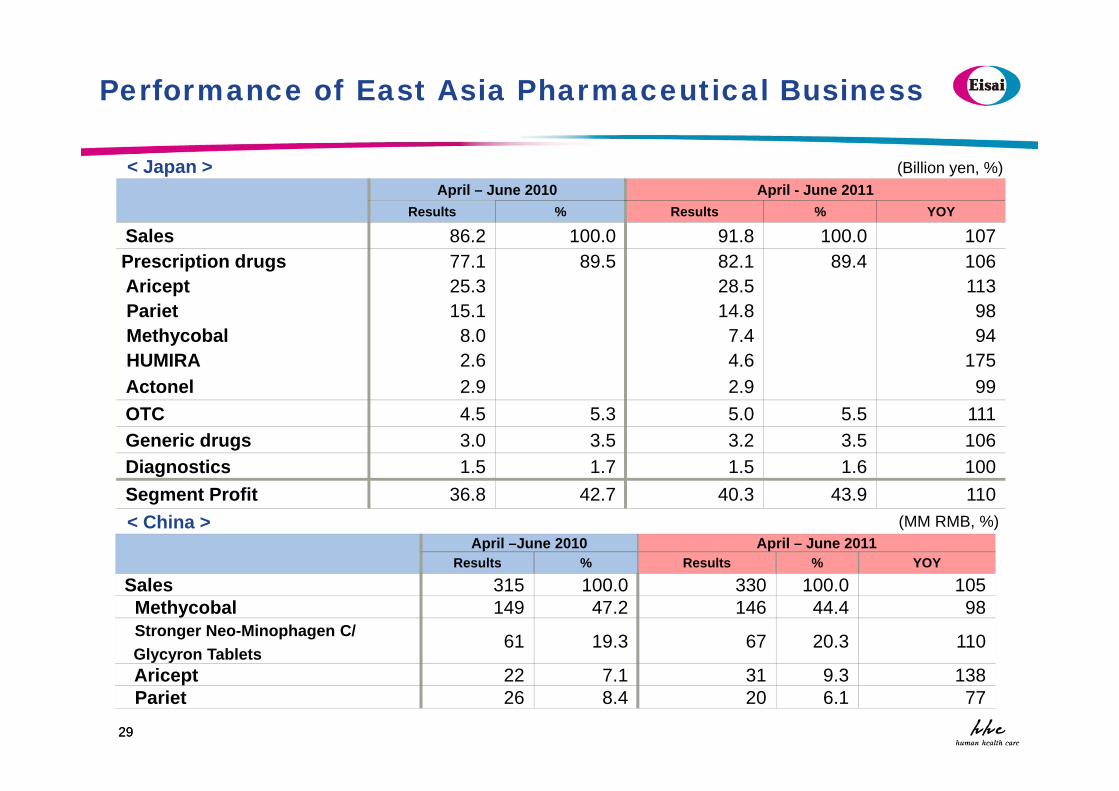
2929
April –June 2010 April – June 2011Results % Results % YOY
Sales 315 100.0 330 100.0 105Methycobal 149 47.2 146 44.4 98Stronger Neo-Minophagen C/Glycyron Tablets
61 19.3 67 20.3 110
Aricept 22 7.1 31 9.3 138Pariet 26 8.4 20 6.1 77
April – June 2010 April - June 2011Results % Results % YOY
Sales 86.2 100.0 91.8 100.0 107Prescription drugs 77.1 89.5 82.1 89.4 106Aricept 25.3 28.5 113Pariet 15.1 14.8 98Methycobal 8.0 7.4 94HUMIRA 2.6 4.6 175Actonel 2.9 2.9 99OTC 4.5 5.3 5.0 5.5 111Generic drugs 3.0 3.5 3.2 3.5 106Diagnostics 1.5 1.7 1.5 1.6 100Segment Profit 36.8 42.7 40.3 43.9 110
Performance of East Asia Pharmaceutical Business
< China >
(Billion yen, %)
(MM RMB, %)
< Japan >
3030
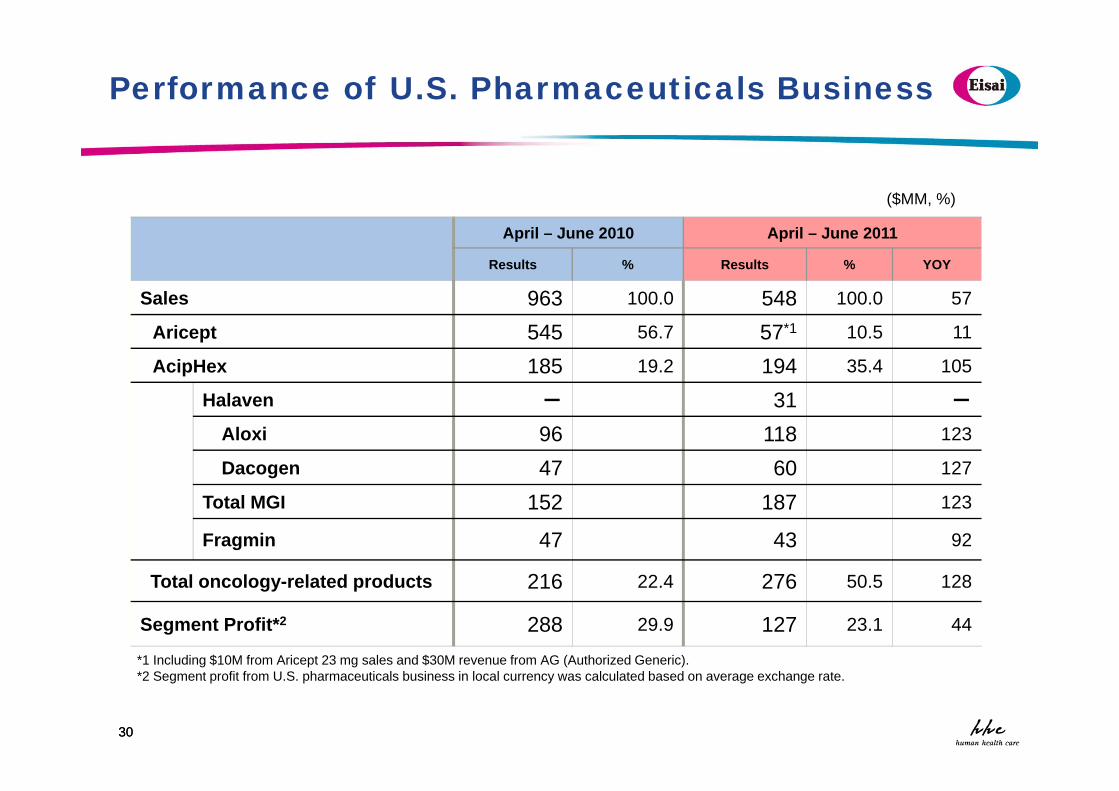
($MM, %)
Performance of U.S. Pharmaceuticals Business
April – June 2010 April – June 2011
Results % Results % YOY
Sales 963 100.0 548 100.0 57
Aricept 545 56.7 57*1 10.5 11
AcipHex 185 19.2 194 35.4 105
Halaven - 31 -
Aloxi 96 118 123
Dacogen 47 60 127
Total MGI 152 187 123
Fragmin 47 43 92
Total oncology-related products 216 22.4 276 50.5 128
Segment Profit*2 288 29.9 127 23.1 44
*1 Including $10M from Aricept 23 mg sales and $30M revenue from AG (Authorized Generic).*2 Segment profit from U.S. pharmaceuticals business in local currency was calculated based on average exchange rate.
31
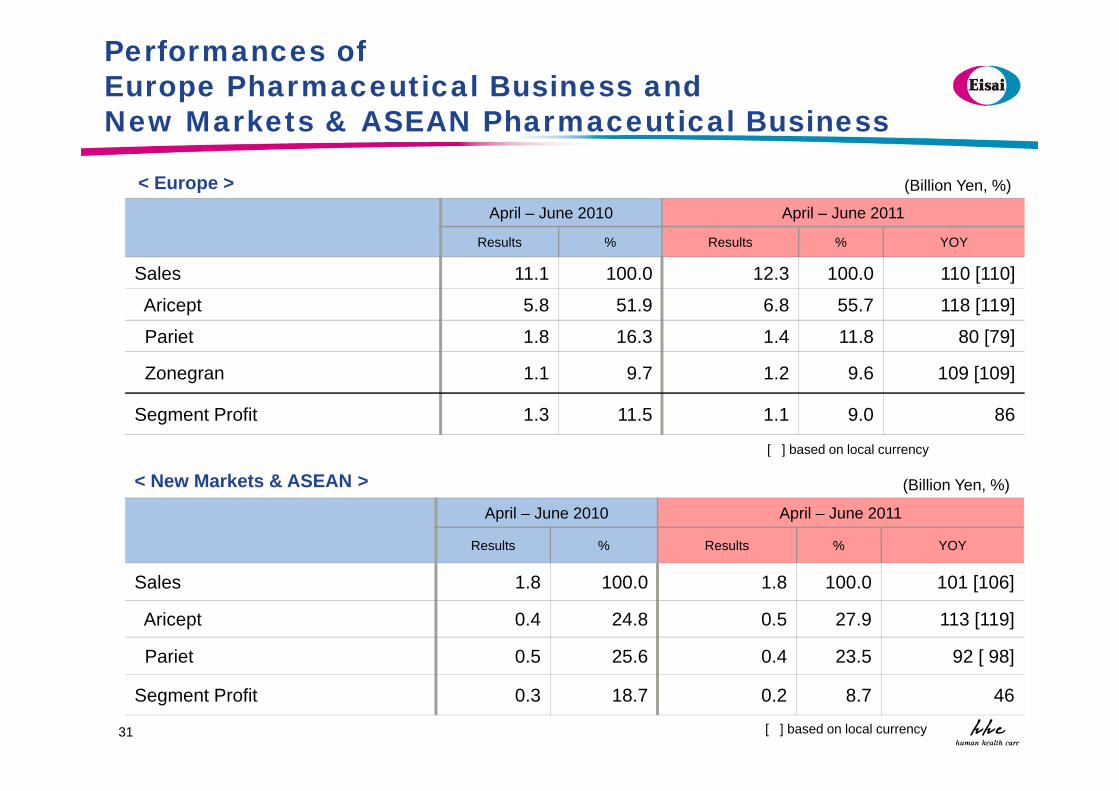
(Billion Yen, %)
Performances ofEurope Pharmaceutical Business andNew Markets & ASEAN Pharmaceutical Business
April – June 2010 April – June 2011
Results % Results % YOY
Sales 11.1 100.0 12.3 100.0 110 [110]
Aricept 5.8 51.9 6.8 55.7 118 [119]
Pariet 1.8 16.3 1.4 11.8 80 [79]
Zonegran 1.1 9.7 1.2 9.6 109 [109]
Segment Profit 1.3 11.5 1.1 9.0 86
April – June 2010 April – June 2011
Results % Results % YOY
Sales 1.8 100.0 1.8 100.0 101 [106]
Aricept 0.4 24.8 0.5 27.9 113 [119]
Pariet 0.5 25.6 0.4 23.5 92 [ 98]
Segment Profit 0.3 18.7 0.2 8.7 46
< New Markets & ASEAN >
< Europe >
[ ] based on local currency
[ ] based on local currency
(Billion Yen, %)


