14
First Quarter 2015 Earnings Conference Call April 28, 2015
| Date post: | 06-Aug-2015 |
| Category: |
Investor Relations |
| Upload: | internap |
| View: | 1,168 times |
| Download: | 0 times |

First Quarter 2015 Earnings Conference Call
April 28, 2015

This presentation contains forward-looking statements. These forward-looking statements include statements related to our expectations for 2015 revenue, adjusted EBITDA and capital expenditures and our ability to accelerate profitable growth through an integrated product offering sold through multiple routes to market, anticipated growth in total revenue and core data services in the second quarter of 2015, favorable product mix shift, increased utilization in company-controlled data center capacity and driving tight operational controls. Our ability to accelerate profitable growth and our expectations for full-year 2015 revenue, adjusted EBITDA and capital expenditures are based on certain assumptions, including anticipated new product launches, leveraging of multiple routes to market, expanded brand awareness for high-performance Internet infrastructure services and customer churn levels. These assumptions may prove to be inaccurate in the future. Because such forward-looking statements are not guarantees of future performance and involve risks and uncertainties, there are important factors that could cause Internap’s actual results to differ materially from those in the forward-looking statements. These factors include our ability to execute on our business strategy; the robustness of the IT infrastructure services market; our ability to achieve or sustain profitability; our ability to expand margins and drive higher returns on investment; our ability to complete expansion of company-controlled data centers within the expected timeframe; our ability to sell into new data center space; the actual performance of our IT infrastructure services; our ability to maintain current customers and obtain new ones, whether in a cost-effective manner or at all; our ability to correctly forecast capital needs, demand planning and space utilization; our ability to respond successfully to technological change and the resulting competition; the availability of services from Internet network service providers or network service providers providing network access loops and local loops on favorable terms, or at all; failure of third party suppliers to deliver their products and services on favorable terms, or at all; failures in our network operations centers, data centers, network access points or computer systems; our ability to provide or improve Internet infrastructure services to our customers; and our ability to protect our intellectual property, as well as other factors discussed in our filings with the Securities and Exchange Commission. Given these risks and uncertainties, investors should not place undue reliance on forward-looking statements as a prediction of actual results. We undertake no obligation to update, amend or clarify any forward-looking statement for any reason.
2
Forward-looking Statements
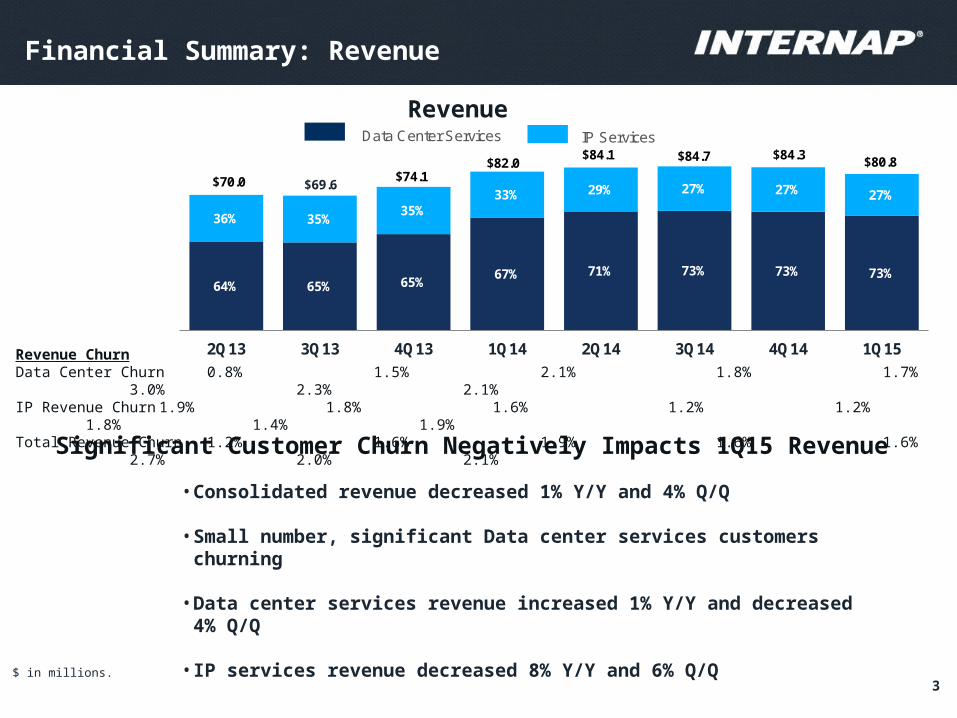
• Consolidated revenue decreased 1% Y/Y and 4% Q/Q
• Small number, significant Data center services customers churning
• Data center services revenue increased 1% Y/Y and decreased 4% Q/Q
• IP services revenue decreased 8% Y/Y and 6% Q/Q
Financial Summary: Revenue
Revenue
3$ in millions.
Revenue ChurnData Center Churn 0.8% 1.5% 2.1% 1.8% 1.7% 3.0% 2.3% 2.1%IP Revenue Churn 1.9% 1.8% 1.6% 1.2% 1.2% 1.8% 1.4% 1.9%Total Revenue Churn 1.2% 1.6% 1.9% 1.6% 1.6% 2.7% 2.0% 2.1%
64% 65% 65%67% 71% 73% 73% 73%
36% 35%35%
33% 29% 27% 27% 27%
2Q13 3Q13 4Q13 1Q14 2Q14 3Q14 4Q14 1Q15
IP ServicesData Center Services
$69.6$74.1
$82.0$84.1 $84.7 $84.3 $80.8
$70.0
Significant Customer Churn Negatively Impacts 1Q15 Revenue

4
Strategic Product Mix Shift
• 14% 3-year adj. EBITDA CAGR
• Adjusted EBITDA margin expanded 390 basis points over the same time-frame
Soft Adj. EBITDA and Margin in Quarter
• Core revenue increased 3% Y/Y and decreased 4% Q/Q
• Core revenue represents 81% of data center services revenue and 59% of consolidated revenue
• 22% 3-year revenue CAGR
Core Data Center Services Favorable Revenue Mix
Profitable Growth
$ in millions. Core data center services defined as company-controlled colocation, hosting and cloud services. Legacy revenue defined as IP services and partner colocation data center services. CAGR is compound annual growth rate. Adjusted EBITDA and Adjusted EBITDA margin are non-GAAP measures. Adjusted EBITDA is loss from operations plus depreciation and amortization, (loss) gain on disposals of property and equipment, exit activities, restructuring and impairments, stock-based compensation and acquisition costs. Adjusted EBITDA margin is Adjusted EBITDA as a percentage of revenues. A reconciliation of Adjusted EBITDA to GAAP loss from operations can be found in the attachment to our first quarter 2015 earnings press release, which is available on our website and furnished to the Securities and Exchange Commission.
$40.5
$32.8 $26.5
$47.9
1Q1
2
2Q1
2
3Q1
2
4Q1
2
1Q1
3
2Q1
3
3Q1
3
4Q1
3
1Q1
4
2Q1
4
3Q1
4
4Q1
4
1Q1
5
Core Legacy
$12.2
$17.9
18.3%
22.2%
1Q1
2
2Q1
2
3Q1
2
4Q1
2
1Q1
3
2Q1
3
3Q1
3
4Q1
3
1Q1
4
2Q1
4
3Q1
4
4Q1
4
1Q1
5
Adj. EBITDA Margin

Q/Q Revenue Change (in millions)
5
Financial Summary: Q/Q Revenue Change
• Core Data Center services impacted by churn from a small number of significant customers, installation delays and FX rates
• Strategic shift away from low margin partner colocation
• Non-recurring revenue in 4Q14 impacted IP services comparison
2Q13Numbers may not equal due to rounding.
4Q14 1Q15
IP servicesCoreData Center
services
$80.8$84.3
PartnerColocation
$(1.7) $(0.5) $(1.3)
Legacy
Financial Summary: Segment Profit and Segment Margin
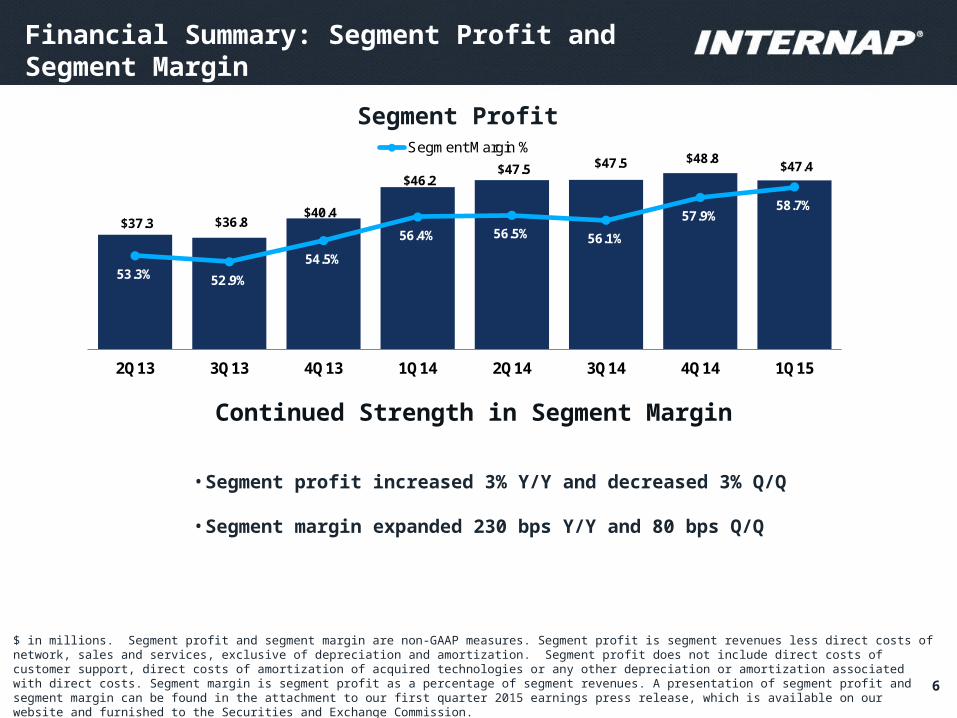
Segment Profit
6
$ in millions. Segment profit and segment margin are non-GAAP measures. Segment profit is segment revenues less direct costs of network, sales and services, exclusive of depreciation and amortization. Segment profit does not include direct costs of customer support, direct costs of amortization of acquired technologies or any other depreciation or amortization associated with direct costs. Segment margin is segment profit as a percentage of segment revenues. A presentation of segment profit and segment margin can be found in the attachment to our first quarter 2015 earnings press release, which is available on our website and furnished to the Securities and Exchange Commission.
Continued Strength in Segment Margin
• Segment profit increased 3% Y/Y and decreased 3% Q/Q
• Segment margin expanded 230 bps Y/Y and 80 bps Q/Q
$37.3 $36.8 $40.4
$46.2 $47.5 $47.5 $48.8
$47.4
53.3% 52.9%
54.5%
56.4% 56.5% 56.1%
57.9%58.7%
2Q13 3Q13 4Q13 1Q14 2Q14 3Q14 4Q14 1Q15
Segment Margin %

Data Center Services Segment Profit and Segment Margin
7
Data Center Services Segment Profit
• Data center segment profit increased 8% Y/Y and decreased 1% Q/Q
• Data center segment margin expanded 330 basis points Y/Y and 130 basis points Q/Q
• Core segment profit increased 7% Y/Y and decreased 1% Q/Q
• Core segment margin expanded 220 basis points Y/Y and 140 basis points Q/Q
Continued Strength In Core Data Center Segment Margin
$ in millions.
$22.9 $22.3 $25.6
$32.4 $34.8 $33.9 $35.3 $34.9
50.3%49.1%
51.5%
55.6%56.7%
55.0%
57.6%58.9%
58.9%58.1%
59.2%
63.4%64.8%
62.3%
64.2% 65.6%
2Q13 3Q13 4Q13 1Q14 2Q14 3Q14 4Q14 1Q15
Partner Colo Segment Profit Core Segment Profit
DC Segment Margin % Core Segment Margin %

IP Services Segment Profit and Segment Margin
8
IP Services Segment Profit
Solid Profitability and Cash Generation
$ in millions.
• IP segment profit decreased 9% Y/Y and 6% Q/Q
• Component of competitive differentiation for high-performance, hybrid Internet infrastructure service offerings
$14.4 $14.5 $14.8 $13.8 $12.7 $13.6 $13.5 $12.6
59.0%
60.0%60.7%
58.3%
55.9%
59.0% 58.7%58.1%
2Q13 3Q13 4Q13 1Q14 2Q14 3Q14 4Q14 1Q15
Segment Margin %

9
Financial Summary: Adjusted EBITDA and Adjusted EBITDA Margin
Adjusted EBITDA
$ in millions.
• Adjusted EBITDA negatively impacted by revenue shortfall and seasonal costs
• Adjusted EBITDA increased 1% Y/Y and decreased 21% Q/Q
• Adjusted EBITDA margin expanded 50 bps Y/Y and contracted 480 bps Q/Q
Soft Adjusted EBITDA For 1Q15
$14.1 $14.2 $15.7 $17.8
$18.5 $19.7
$22.7
$17.9
20.1% 20.4%21.1%
21.7% 22.0%23.3%
27.0%
22.2%
2Q13 3Q13 4Q13 1Q14 2Q14 3Q14 4Q14 1Q15
Adj. EBITDA Margin

One Brand Initiative
10
• Final phase of our iWeb integration process
• Accelerate growth through an integrated product offering sold through multiple routes to market
• Create a uniform customer experience
• Increase our brand presence and strength
• Support profitable growth and gain operational efficiencies
Combine Brands To Support Our Long-Term Strategy

$ in millions. *Cash Operating Expense and Normalized Net Loss are non-GAAP measures. Cash Operating Expense is GAAP operating expense less direct cost of network and sales, depreciation and amortization, restructuring and impairments, stock-based compensation and acquisition costs. Normalized Net Loss is net loss plus exit activities, restructuring and impairments, stock-based compensation and acquisition costs. A reconciliation to GAAP total operating costs and expenses can be found in the attachment to our first quarter 2015 earnings press release, which is available on our website and furnished to the Securities and Exchange Commission.
Financial Review: Income Statement
11
Income Statement Summary
1Q15 4Q14 1Q14
Total Revenue $80.8 $84.3 $82.0
Total Segment Profit $47.4 $48.8 $46.2
Total Segment Margin % 58.7% 57.9% 56.4%
Cash Operating Expense $29.5 $26.1 $28.4
Cash Opex % 36.5% 30.9% 34.7%
Adj. EBITDA $17.9 $22.7 $17.8
Adj. EBITDA % 22.2% 27.0% 21.7%
GAAP Net Loss $(10.4) $(8.3) $(10.7)
Loss per fully-diluted share $(0.20) $(0.16) $(0.21)
Normalized Net Loss $(8.6) $(5.2) $(7.3)
Loss per fully-diluted share $(0.17) $(0.10) $(0.14)

1Q15 4Q14 1Q14
Adj. EBITDA $17.9 $22.7 $17.8
Less: Capital ExpendituresLess: Capital Lease Payments
15.71.8
25.11.7
25.51.4
Adj. Cash Flow $0.4 $(4.1) $(9.1)
Financial Review: Cash Flow and Balance Sheet
12
Cash Flow Summary
Balance Sheet Summary
$ in millions. * LQA = Last Quarter Annualized.
1Q15 4Q14 1Q14
Cash & Cash Equivalents $16.2 $20.1 $25.2
Less: Debt (net of discount) 311.6 299.0 290.2
Less: Capital Leases 58.7 60.1 61.4
Equals: Net Debt $(354.1) $(339.0) $(326.4)
Net Debt to Adj. EBITDA (LQA)* 4.9x 3.7x 4.6x

2015 Financial Guidance
13
Revenue
Adjusted EBITDA
$331 - $337
$89 - $95
Range(in millions)
2015 financial guidance constitutes forward-looking statements which involve risks and uncertainties. Please refer to slide 2 for more information regarding forward-looking statements.
Capital Expenditures Growth Maintenance
$70 - $80$55 - $60$15 - $20
Results:• Soft 1Q15 but rapid recovery
– Higher than anticipated churn negatively impacts full-year 2015 revenue guidance
– Core data center services strategy execution and operating leverage maintain full-year 2015 Adjusted EBITDA guidance
Looking forward:• Accelerate profitable growth through:
– Total revenue and core data center services revenue resume growth from 2Q15
– Favorable product mix shift of core data center services
– Increase utilization in company-controlled data center capacity
– Drive tight operational controls to minimize costs
Solid Foundation for Profitable Growth
1Q15 Summary
14


