202
2019 ANNUAL REPORT

2019 AN
NU
AL R
EPO
RT
2 0 1 9 A N N U A L R E P O R T
Corporate Information 2
Results Highlights 4
Chairman’s Statement 5
Biographies of Directors and Senior Management 8
Business Review 16
Financial Review 26
Corporate Governance Report 35
Directors’ Report 47
Independent Auditor’s Report 59
Consolidated Statement of Profit or Loss and
Other Comprehensive Income
63
Consolidated Statement of Financial Position 65
Consolidated Statement of Changes in Equity 67
Consolidated Statement of Cash Flows 68
Notes to the Consolidated Financial Statements 70
Five Year Summary 194
Glossary 196
CONTENTS

CORPORATE INFORMATION
2 WH GROUP LIMITED ANNUAL REPORT 2019
Legal Name of the CompanyWH Group Limited
Place of Listing and Stock CodeThe Shares of the Company were listed on the Main Board of the Stock Exchange on August 5, 2014
Stock Code: 288
Company Websitewww.wh-group.com
DirectorsExecutive DirectorsMr. WAN Long (Chairman and Chief Executive Officer)Mr. WAN Hongjian (Deputy Chairman and
Vice President)Mr. GUO Lijun (Executive Vice President and
Chief Financial Officer)Mr. SULLIVAN Kenneth Marc (President and
Chief Executive Officer of Smithfield)Mr. MA Xiangjie (President of Shuanghui Development)
Non-executive DirectorMr. JIAO Shuge
Independent Non-executive DirectorsMr. HUANG MingMr. LEE Conway Kong WaiMr. LAU, Jin Tin Don
Company SecretaryMr. CHAU Ho
Audit CommitteeMr. LEE Conway Kong Wai (Chairman)Mr. HUANG MingMr. LAU, Jin Tin Don
Remuneration CommitteeMr. HUANG Ming (Chairman)Mr. LEE Conway Kong WaiMr. JIAO Shuge
Nomination CommitteeMr. WAN Long (Chairman)Mr. HUANG MingMr. LAU, Jin Tin Don
Environmental, Social and Governance CommitteeMr. GUO Lijun (Chairman)Mr. WAN HongjianMr. SULLIVAN Kenneth MarcMr. LAU, Jin Tin Don
Food Safety CommitteeMr. WAN Long (Chairman)Mr. WAN HongjianMr. SULLIVAN Kenneth MarcMr. LEE Conway Kong Wai

3ANNUAL REPORT 2019 WH GROUP LIMITED
Corporate Information (Continued)
Risk Management CommitteeMr. WAN Long (Chairman)Mr. GUO LijunMr. SULLIVAN Kenneth MarcMr. MA XiangjieMr. LEE Conway Kong Wai
AuditorErnst & Young
Legal AdvisorPaul Hastings
Principal BankersAgricultural Bank of ChinaBank of America N.A.Bank of ChinaDBS BankING Bank N.V.The Hongkong and Shanghai Banking Corporation
Authorised RepresentativesMr. WAN LongMr. CHAU Ho
Share Registrar and Transfer OfficePrincipalMaples Fund Services (Cayman) LimitedPO Box 1093, Boundary Hall, Cricket SquareGrand Cayman, KY1-1102Cayman Islands
Hong Kong BranchComputershare Hong Kong Investor Services LimitedShops 1712–1716, 17F, Hopewell Centre183 Queen’s Road EastWanchaiHong Kong
Registered OfficeMaples Corporate Services LimitedPO Box 309, Ugland HouseGrand CaymanKY1-1104Cayman Islands
Principal Place of Business and Corporate Headquarters in Hong KongUnit 7602B-7604ALevel 76, International Commerce Centre1 Austin Road WestKowloonHong Kong

RESULTS HIGHLIGHTS
4 WH GROUP LIMITED ANNUAL REPORT 2019
2019 2018
Key operating data
Hogs produced (thousand heads) 21,805 20,953Hogs processed (thousand heads) 53,797 56,068Packaged meats sold (thousand metric tons) 3,345 3,361
2019 2018Results before
biological fair value
adjustments
Results after biological fair value
adjustments
Results before biological fair value
adjustments
Results after biological fair value
adjustmentsUS$ million US$ million
(unless otherwise stated) (unless otherwise stated)
Key financial data
Revenue 24,103 24,103 22,605 22,605EBITDA 2,671 2,777 2,106 1,967Operating profit 2,031 2,031 1,650 1,650Profit attributable to owners of the Company 1,378 1,465 1,046 943Basic earnings per share (US cents) 9.37 9.96 7.13 6.43Dividend per share (HK$)
Interim 0.05 0.05 0.05 0.05Final 0.265 0.265 0.15 0.15
0.315 0.315 0.20 0.20
• Revenue increased by 6.6%
• Operating profit increased by 23.1%
• Profit attributable to owners of the Company, before biological fair value adjustments, increased by 31.7%
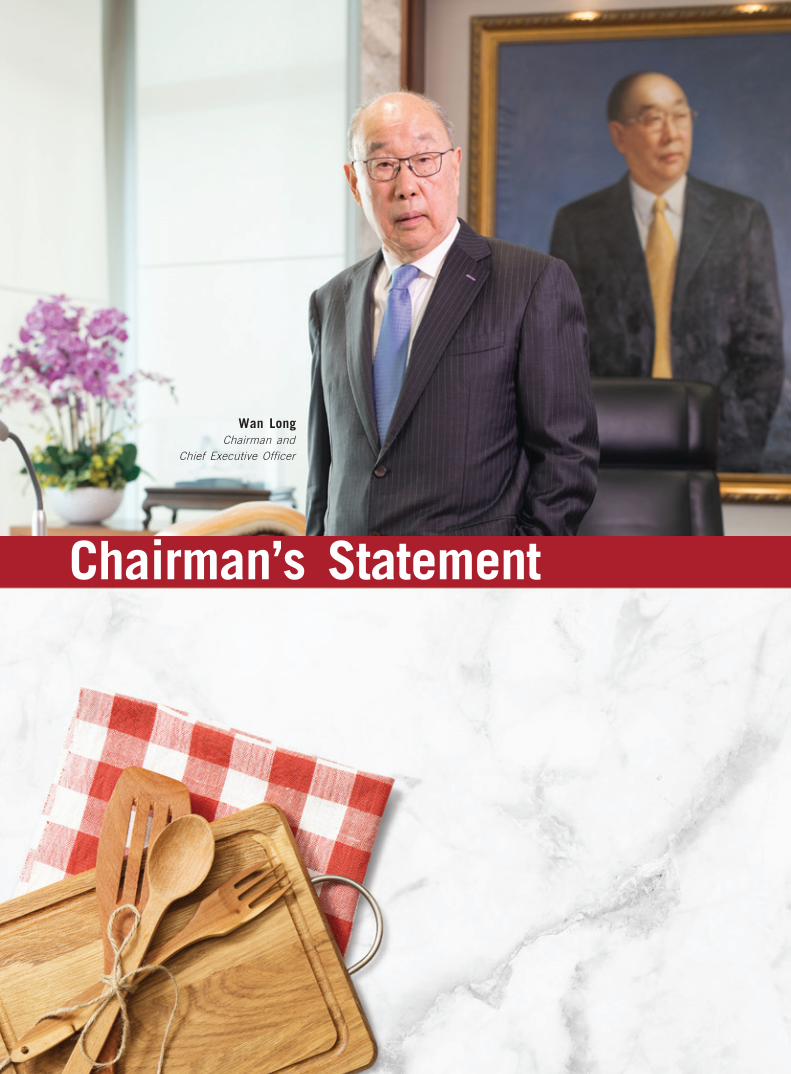
Wan LongChairman and
Chief Executive Officer
Chairman’s Statement
6 WH GROUP LIMITED ANNUAL REPORT 2019
Chairman’s Statement (Continued)
Dear Shareholders,
On behalf of the Board of Directors of the Company, I am pleased to report the annual report of WH Group Limited for the year ended December 31, 2019.
In 2019, in the midst of intensifying international trade frictions, sluggish global economic growth and spread of African Swine Fever (“ASF”) in various regions leading to substantial increase in costs, WH Group still managed to attain robust results in 2019 as our management team exemplified their expertise under such challenge.
WH Group recorded operating revenue of US$24.10 billion in 2019, a year-on-year growth of 6.6%. Net profit attributable to shareholders of the Company (before biological fair value adjustments) was US$1.38 billion, a year-on-year growth of 31.7%.
As the global leader in the pork industry, WH Group produced 21.81 million hogs, processed 53.80 million hogs and sold 3.35 million tons of packaged meat products in 2019. Supported by our strong balance sheet and adequate l iquidity, the Board has recommended a final dividend of HK$0.265 per share in addition to the paid interim dividend. This will bring our total dividend for 2019 to HK$0.315 per share.
Looking back at 2019, high tariff imposed by trade friction raised the barrier of imports and exports in the first half of the year, while operation environment was unfavourable amidst the growing downward pressure on global economy. The continuous spread of ASF also resulted in volatility in global meat prices, and significantly affected the supplies of live hog in China. As disclosed by MOA, the annual production of hogs in 2019 reduced by 22% or 150 million heads as compared to the previous year.
Given the fact that pork is indispensable in Chinese diet, hog and pork prices soared to new records. Driven by the high hog prices, prices of other meats also went up and therefore boosted our costs.
In response to such operating landscape, we upheld stringent preventive measures against the epidemic and adopted different management strategies for our two major businesses in China. For fresh pork business, we produced both fresh and frozen products; we sold and stocked up simultaneously; and we expanded our import operation so as to lower cost and enhance profitability. As a result, our fresh pork business was able to achieve the optimal synergy and the expected operating results under adverse production situation.
For packaged meats business, we persisted in adjusting our product structure and selling prices to absorb inflation pressure, thereby realised stable operation.
“Overcome the challenges, Embrace a bright future”

7ANNUAL REPORT 2019 WH GROUP LIMITED
Chairman’s Statement (Continued)
In 2019, hog supplies continued to increase in the U.S. However, the prolonged trade negotiation between China and the U.S. and the escalating tariffs being imposed on U.S. pork negatively affected the U.S. exports and contained its prices. Our hog production and fresh pork businesses underperformed in the first half of the year. Notwithstanding the negative macro environment, we put our industry chain advantage into play, adjusted export channels and expanded export product categories to strive for the utmost synergy. In the second half of the year, we swiftly achieved a turnaround and realised a significant surge in annual results. Our packaged meat business in the U.S. remained stable and recorded outstanding results.
Entering 2020, global economic growth continues to be slow. Risk associated with geopolitical uncertainty persists. The industry outlook has not shown any notable improvement. The overlay effects of these factors, plus the global outbreak of Coronavirus Disease 2019 (“COVID-19”), will bring unprecedented challenges and opportunities to our operation.
As the first imperative in this year, we must implement effectively preventive measures to prevent and control COVID-19 epidemic such that we can overcome this difficult moment by protecting the safety of our staff and safeguarding the interest of the Company.
We will also combat the pressure from global economic downturn, maintain stability of our operation, and well-manage the wide range of risks.
As the largest pork processing enterprise in the globe, WH Group has established a complete value chain of upstream and downstream businesses covering the production and sale of hogs, fresh pork, packaged meats and ancillaries such as production of packaging materials and flavoring ingredients as well as provision of logistics services. Such set up provided us with the distinguishable competitive advantage. We will continue to realize benefits and maximize returns from this competitive advantage. Our U.S. operation, which has the most comprehensive industry chain, good integration and well management of hog production, slaughtering and further processing is particularly crucial.
With the significant pork price differential between China, the U.S. and Europe, year 2020 is regarded to be favorable for imports and exports. We will seize the opportunity to expand exports from the U.S. and Europe to China and foster the accelerating growth of global trades. We will also take the chance to drive the industrial development of all members of the Group so as to attain the optimal synergy results.
In China, we will continue to stress on the adjustment of product structure for our fresh pork business by expanding the processing of imported meat and lower the costs of production by enlarging our scale. We also aim at stabilizing the price and enhancing the profitability for packaged meats in order to ensure steady operation in 2020 under the overlay effects of various adverse factors.
On the U.S. side, we have sufficient resources to optimize our industry chain and expand exports, so as to achieve the best result for the Group.
Given meat products are consumer staples, we will use our best endeavour to prevent food safety and environmental problems as well as to enhance corporate governance. With concerted efforts, we are set to overcome the challenges brought by the epidemic and embrace a bright future.
Wan LongChairman and Chief Executive Officer

BIOGRAPHIES OF DIRECTORS AND SENIOR MANAGEMENT
8 WH GROUP LIMITED ANNUAL REPORT 2019
Board of DirectorsThe Board consists of nine Directors, of whom five are executive Directors, one is a non-executive Director and the remaining three are independent non-executive Directors.
WAN Long (萬隆)Executive Director, Chairman and Chief Executive Officer
WAN Long (萬隆), age 79, was appointed as a Director on October 16, 2007 and has been the Chairman of our Board since November 26, 2010. He also holds directorships in various subsidiaries of the Group. He was designated as our executive Director on December 31, 2013 and has been the Company’s chief executive officer since October 2013. Mr. Wan Long has been the chairman of the board of Shuanghui Development (a company listed on the Shenzhen Stock Exchange with stock code 000895 and our subsidiary) since August 20, 2012. Mr. Wan Long joined Henan Luohe Meat Products Processing United Factory (河南省漯河市肉類聯合加工廠) in May 1968 and became the general manager of the factory in 1984. Under Mr. Wan Long’s direction, our business has grown from a local state-owned enterprise in Henan Province into an international company with operations spanning various continents. Mr. Wan Long has over 50 years of experience in the meat processing industry. He was a representative of the Ninth to Twelfth China’s National People’s Congress (中華人民共和國全國人民代表大會) in 1998, 2003, 2008 and 2013 and was appointed as an executive director of the China Meat Association (中國肉類協會) from December 2006 to December 2011 and a senior consultant of the China Meat Association (中國肉類協會) in 2001. Mr. Wan Long received his professional certificate in business management from the Henan University of Animal Husbandry and Economy (河南牧業經濟學院, previously The Henan Business College (河南商業專科學校)) in May 1991 and was awarded the senior economist professional qualification issued by the Henan Province Advanced Professional Titles Adjudication Committee (Economic Disciplines) (河南省經濟系列高級評審委員會) in July 1999. Mr. Wan Long is the father of Mr. Wan Hongjian.
WAN Hongjian (萬洪建)Executive Director, Deputy Chairman and Vice President
WAN Hongjian (萬洪建), age 51, was appointed as an executive Director on March 26, 2018 with effect from June 4, 2018 and as the deputy chairman of our Board on August 14, 2018. He has also served as a vice president of the Company since April 2016. He is responsible for the international trading business of the Group. Previously, Mr. Wan Hongjian served as a cooked food workshop worker at Henan Luohe Meat Products Processing United Factory (河南省漯河市肉類聯合加工廠) from October 1990 to December 1991, as a sales officer in the Beijing sales office of Shuanghui Group from January 1992 to October 1993, as a deputy director of the foreign trading department of Shuanghui Group from November 1993 to September 2010, as deputy general manager of Rotary Vortex in charge of international trading business from February 2012 to October 2013 and as a director of international trading department of the Company from November 2015 to March 2016. Mr. Wan Hongjian graduated from Henan Radio and Television University (河南廣播電視大學) with an associate degree in commercial business management in July 1990. He is the son of Mr. Wan Long.
9ANNUAL REPORT 2019 WH GROUP LIMITED
Biographies of Directors and Senior Management (Continued)
GUO Lijun (郭麗軍)Executive Director, Executive Vice President and Chief Financial Officer
GUO Lijun (郭麗軍), age 49, was appointed as an executive Director on December 31, 2013. He has also served as an executive vice president and the chief financial officer of the Company since April 2016. He also holds directorships in various subsidiaries of the Group. Prior to this, Mr. Guo was our deputy chief executive officer from October 2013 to January 2014, and a vice president and the chief financial officer of the Company from January 2014 to March 2016. Mr. Guo has over 20 years of experience overseeing the financial operations of various companies. Mr. Guo worked as an accountant in the finance department of the Henan Luohe Meat Products Processing United Factory (河南省漯河市肉類聯合加工廠) from June 1993 to March 1996. Mr. Guo was also the financial controller of Luohe Chinachem Shuanghui Packaging Industry Co., Ltd. (漯河華懋雙匯化工包裝有限公司) and Luohe Chinachem Shuanghui Plastic Processing Co., Ltd. (漯河華懋雙匯塑料工程有限公司) from April 1996 to February 2001. Mr. Guo held various positions in Shuanghui Group from March 2001 to August 2012, including serving as its deputy director, its director of the finance department and its chief financial officer. In addition, Mr. Guo was also the executive vice president of Shuanghui Development (a company listed on the Shenzhen Stock Exchange with stock code 000895 and our subsidiary) from August 2012 to October 2013.
Mr. Guo obtained his adult higher education diploma in financial accounting from Henan Radio and Television University (河南廣播電視大學) in July 1994 and obtained the completion certificate for the master of business administration program of the Graduate School of Renmin University (中國人民大學研究生院) in December 2004. Mr. Guo received his assistant accountant certificate awarded by the PRC Ministry of Personnel (中華人民共和國人事部) in October 1994.
SULLIVAN Kenneth MarcExecutive Director, President and Chief Executive Officer of Smithfield
SULLIVAN Kenneth Marc, age 56, was appointed as an executive Director on January 22, 2016. He has served as president and chief executive officer of Smithfield (our indirect wholly-owned subsidiary) since December 2015 and as a director of Smithfield since January 2016. He also holds directorships in various subsidiaries of the Group. He has served in various other positions with Smithfield since joining Smithfield in 2003, including vice president of internal audit from 2003 to 2007, vice president and chief accounting officer from 2007 to 2010, senior vice president of finance and chief accounting officer from 2012 to 2013, executive vice president and chief financial officer from October 2013 to October 2015 and chief operating officer from October 2015 to December 2015. Mr. Sullivan has expertise in corporate strategy and finance, capital markets, operations analysis and organizational leadership, and possesses in-depth knowledge of the Group’s U.S. and international business segments. Prior to joining Smithfield, Mr. Sullivan spent 12 years at various large accounting and consulting firms.
Mr. Sullivan became a certified public accountant in the Commonwealth of Virginia, U.S. in April 1993. Mr. Sullivan obtained his bachelor of science degree from the School of Business of Virginia Commonwealth University in August 1988.
10 WH GROUP LIMITED ANNUAL REPORT 2019
Biographies of Directors and Senior Management (Continued)
MA Xiangjie (馬相傑)Executive Director and President of Shuanghui Development
MA Xiangjie (馬相傑), age 48, was appointed as an executive Director on March 26, 2018 with effect from June 4, 2018. He has also served as a director and the president of Shuanghui Development (a company listed on the Shenzhen Stock Exchange with stock code 000895 and our subsidiary) since August 22, 2018 and December 26, 2017, respectively. Previously, he served as the vice president of Shuanghui Development and the general manager of its fresh food division from August 25, 2012 to December 25, 2017. He also holds directorships in various subsidiaries of the Group. Mr. Ma has over 24 years of work experience with the Group. Mr. Ma was the deputy director of Shuanghui Development in charge of the production of fresh meat products department from September 2008 to September 2010. He also served as the general manager of the integrated business department of Shuanghui Group from September 2010 to April 2012. In addition, he has worked as the director of Shuanghui Development Ingredients Factory (雙匯發展香輔料分廠) since May 2001; as a general manager of Luohe Shineway Haiying Seasoning Food Co., Ltd. (漯河雙匯海櫻調味料食品有限公司) since August 2003; as a general manager of Luohe Tianrui Biochemicals Co., Ltd. (漯河天瑞生化有限公司) since April 2004; as a managing director of Luohe Shuanghui Food Sales Co., Ltd. (漯河雙匯食品銷售有限公司) since October 26, 2012; as a director of Fuxin Shuanghui Meat Processing Co., Ltd. (阜新雙匯肉類加工有限公司) since February 22, 2013; as a director of Heilongjiang Baoquanling Shuanghui Beidahuang Food Co., Ltd. (黑龍江寶泉嶺雙匯北大荒食品有限公司) since February 22, 2013 and as a director of Shaanxi Shuanghui Food Co., Ltd. (陝西雙匯食品有限公司) since November 19, 2013.
Mr. Ma graduated from the faculty of storage and processing of agricultural products from the Henan Agricultural University (河南農業大學) in July 1996, obtained the completion certificate for the master of business administration program of the Graduate School of Renmin University (中國人民大學研究生院) in March 2005 and received his master’s degree in food engineering from the Northwest A&F University (西北農林科技大學) in June 2010. In addition, Mr. Ma obtained his qualification as an engineer of light industries issued by the People’s Government of Luohe City in June 2003 and his qualification as a senior economist issued by the People’s Government of Henan Province in March 2019.
JIAO Shuge (焦樹閣)Non-executive Director
JIAO Shuge (焦樹閣), age 54, was appointed as our Director on April 28, 2006. He served as the deputy chairman of our Board from November 26, 2010 to August 14, 2018. He also holds directorships in various subsidiaries of the Group. He was designated as a non-executive Director on December 31, 2013. Mr. Jiao has been a director of Shuanghui Development (a company listed on the Shenzhen Stock Exchange with stock code 000895 and our subsidiary) since August 20, 2012. Mr. Jiao is also currently a director and managing partner of CDH China Management Company Limited.
11ANNUAL REPORT 2019 WH GROUP LIMITED
Biographies of Directors and Senior Management (Continued)
Mr. Jiao was a researcher in the China Aerospace Service and Technology Corporation (中國航天科技集團公司第710研究所) from August 1989 to January 1995. He served as the vice general manager of the direct investment department of China International Capital Corporation Ltd. (中國國際金融有限公司) from December 1995 to August 2002. Mr. Jiao has a broad range of experience serving as directors of various listed companies, including as a non-executive director from February 18, 2004 to April 12, 2012 and as an independent non-executive director since April 12, 2012 of China Mengniu Dairy Co., Ltd. (a company listed on the Stock Exchange with stock code 02319). He also served as a non-executive director of China Yurun Food Group Limited (a company listed on the Stock Exchange with stock code 01068) from April 13, 2005 to September 22, 2012, a non-executive director of China Shanshui Cement Group Co., Ltd. (a company listed on the Stock Exchange with stock code 00691) from November 30, 2005 to May 16, 2014, a director of Joyoung Company Limited (a company listed on the Shenzhen Stock Exchange with stock code 002242) since September 12, 2007 and an independent non-executive director of China Southern Airlines Company Limited (a company listed on the Stock Exchange with stock code 1055) since June 2015.
Mr. Jiao graduated from Shandong University (山東大學) with a bachelor of mathematics in July 1986, and obtained his master’s degree in engineering from the No. 2 Research Institute of Ministry of Aeronautics and Astronautics of China in October 1989.
HUANG Ming (黃明)Independent Non-executive Director
HUANG Ming (黃明), age 56, was appointed as one of our independent non-executive Directors on July 16, 2014 with effect from the Listing Date. Mr. Huang served as an assistant professor of finance at the Graduate School of Business, University of Chicago from April 1996 to June 1998; as an assistant professor of finance from July 1998 to August 2001 and as an associate professor from September 2001 to June 2005 at the Graduate School of Business, Stanford University; and as an associate dean and professor of finance from July 2004 to June 2005, a professor of finance from July 2008 to June 2010 at the Cheung Kong Graduate School of Business (長江商學院) and as a professor of finance at China Europe International Business School (中歐國際工商學院) from July 2010 to June 2019. Mr. Huang was also appointed as the Dean of School of Finance of Shanghai University of Finance and Economics (上海財經大學) from April 2006 to April 2009. He has been a professor of finance with tenure at Cornell University since July 2005.

12 WH GROUP LIMITED ANNUAL REPORT 2019
Biographies of Directors and Senior Management (Continued)
Mr. Huang has served as an independent director of JD.com, Inc. (a company listed on the US NASDAQ Stock Exchange with stock code NASDAQ: JD) since March 2014 and 360 Security Technology Inc. (a company listed on the Shanghai Stock Exchange with stock code 601360) ((formerly known as SJEC Corporation) (a company listed on the Shanghai Stock Exchange with stock code 601313)) since February 2018. Mr. Huang served as a non-executive director of Tebon Securities Co., Ltd. (德邦證券股份有限公司) from June 2011 to July 2014, Qihoo 360 Technology Co. Ltd. (a company listed on New York Stock Exchange with stock code QIHU and delisted with effect from July 18, 2016) from March 2011 to July 2016 and of Guosen Securities Co. Ltd. (國信證券股份有限公司) from June 2011 to December 2017. He served as an independent non-executive director of China Medical System Holdings Limited (a company listed on the Stock Exchange with stock code 00867) from October 2013 to December 2017, of Fantasia Holdings Group Co., Ltd. (a company listed on the Stock Exchange with stock code 01777) from October 2009 to May 2019, of China Shenhua Energy Company Limited (a joint stock limited company incorporated in the PRC, the H shares of which are listed on the Stock Exchange (stock code: 1088) and the A shares of which are listed on the Shanghai Stock Exchange (stock code: 601088) from April 2018 to August 2019, and of Yingli Green Energy Holding Company Limited (a company listed on the New York Stock Exchange with stock code YGE and delisted with effect from July 17, 2018) from August 2008 to February 2020.
Mr. Huang obtained his bachelor’s degree in physics from Peking University in July 1985, his doctor’s degree in physics from Cornell University in July 1991 and his doctor’s degree in finance from Stanford University in August 1996.
LEE Conway Kong Wai (李港衛)Independent Non-executive Director
LEE Conway Kong Wai (李港衛) age 65, was appointed as one of our independent non-executive Directors on July 16, 2014 with effect from the Listing Date. In addition, Mr. Lee has extensive experience as an independent non-executive director of listed companies and currently serves as an independent non-executive director in the following companies listed on the Main Board of the Stock Exchange: Chaowei Power Holdings Limited (with stock code 00951) since July 2010, West China Cement Limited (with stock code 02233) since July 2010, China Modern Dairy Holdings Ltd. (with stock code 01117) since December 2010, Gome Electrical Appliances Holding Limited (with stock code 00493) since March 2011, NVC Lighting Holding Limited (with stock code 02222) since November 2012, Yashili International Holdings Ltd. (with stock code 01230) since November 2013, GCL New Energy Holdings Limited (with stock code 0451) since May 2014, China Rundong Auto Group Limited (with stock code 1365) since August 2014 and Guotai Junan Securities Co., Ltd. (“GTJA”) (with stock code 02611) since April 2017. Mr. Lee also serves as an independent director of GTJA (a company listed on the Shanghai Stock Exchange with stock code: 601211) since April 2017. Formerly, Mr. Lee also served as a non-executive director and the deputy chairman of Merry Garden Holdings Limited (a company listed on the Stock Exchange with stock code 01237) from July 2014 to September 2015, an independent non-executive director of China Taiping Insurance Holdings Company Limited (a company listed on the Stock Exchange with stock code 00966) from October 2009 to August 2013, of Sino Vanadium Inc. (a company listed on the Toronto Stock Exchange with stock code SVX) from October 2009 to December 2011, of CITIC Securities Company Limited (with stock code 06030) from November 2011 to May 2016, and of Tibet 5100 Water Resources Holdings Ltd. (with stock code 01115) from March 2011 to February 2020. Mr. Lee had been a partner of Ernst & Young (HK) from September 1980 to September 2009.
13ANNUAL REPORT 2019 WH GROUP LIMITED
Biographies of Directors and Senior Management (Continued)
Mr. Lee was a member of the Chinese People’s Political Consultative Conference of Hunan Province in China between 2008 and 2017. He received a bachelor’s degree in arts from Kingston University (formerly known as Kingston Polytechnic) in London in July 1980 and subsequently obtained his postgraduate diploma in business from Curtin University of Technology in Australia in February 1988. He is a member of the Institute of Chartered Accountants in England and Wales, the Chartered Accountants, Australia and New Zealand (formerly known as the Institute of Chartered Accountants in Australia), the Association of Chartered Certified Accountants, the Hong Kong Institute of Certified Public Accountants and the Macau Society of Registered Accountants.
LAU, Jin Tin Don (劉展天)Independent Non-executive Director
LAU, Jin Tin Don (劉展天), age 63, was appointed as one of our independent non-executive Directors on July 16, 2014 with effect from the Listing Date. Mr. Lau served as an executive director and one of the responsible officers of Spring Asset Management Limited, a company incorporated in Hong Kong for the sole purpose of managing Spring Real Estate Investment Trust (a Hong Kong collective investment scheme listed on the Stock Exchange with stock code 01426) from April 2013 to May 2017. Prior to joining Spring Asset Management Limited in 2013, he was the deputy group financial controller of Yuexiu Property Company Limited (a company listed on the Stock Exchange with stock code 00123). From 2005 to 2010, he was also the deputy chief executive officer, compliance manager and one of the responsible officers of Yuexiu REIT Asset Management Limited which is responsible for managing the assets of Yuexiu Real Estate Investment Trust (a Hong Kong collective investment scheme listed on the Stock Exchange with stock code of 00405).
Mr. Lau obtained a master’s degree in applied finance from Macquarie University.
Senior ManagementOur senior management is responsible for the day-to-day management of our business.
QIAO Haili (喬海莉)QIAO Haili (喬海莉), age 55, has served in various positions within the Group. She has been the vice president of the quality control management of Shuanghui Development (a company listed on the Shenzhen Stock Exchange with stock code 000895 and our subsidiary) since February 2019, responsible for the quality control management of Shuanghui Development. She also holds directorships in various subsidiaries of the Group. Ms. Qiao served as the vice president of the production and operations division of Shuanghui Development from November 2014 to February 2019, where she was responsible for the production and operations work stream of Shuanghui Development, and since November 2016 she was also responsible for the quality control management of Shuanghui Development, as the vice president and general manager of Shuanghui Development’s meat processing division from September 2012 to October 2014 and a deputy general manager of its meat product department from August 2009 to August 2012, where she has been primarily responsible for the general operation of meat products production. Ms. Qiao served as a deputy director of the hygiene inspection department and as a workshop manager of Shuanghui Group from August 1986 to September 1995. Ms. Qiao also served as a director of the hygiene inspection department and the third business division of Shuanghui Group from September 1995 to February 1998. In addition, Ms. Qiao served as the general manager in Luohe Shuanghui Canned Foods Company Limited (漯河雙匯罐頭食品股份有限公司) from February 1998 to October 2004; as a director in Shuanghui Development from November 2001 to October 2004; and as the general manager in Shuanghui Development Meat Processing Division Factory (雙匯發展肉製品分廠) from November 2004 to August 2009.

14 WH GROUP LIMITED ANNUAL REPORT 2019
Biographies of Directors and Senior Management (Continued)
Ms. Qiao obtained her associate veterinarian degree from the Zhengzhou Junior College of Animal Husbandry and Veterinary Medicine (鄭州畜牧獸醫專科學校) in July 1986. She also obtained the completion certificate for the master of business administration program from the Graduate School of Renmin University (中國人民大學研究生院) in March 2005. Ms. Qiao received her qualified veterinarian certificate issued by the People’s Government of Luohe City in December 1998.
WANG Yufen (王玉芬)WANG Yufen (王玉芬), age 52, has served as the vice president of Shuanghui Development (a company listed on the Shenzhen Stock Exchange with stock code 000895 and our subsidiary), being in charge of technology research, since September 2012, and as the chief engineer of Shuanghui Development for over 21 years since March 1998. She also holds directorships in various subsidiaries of the Group. Ms. Wang has worked with the Group for over 28 years. Ms. Wang served in Henan Luohe Meat Products Processing United Factory Meat Product Branch (河南省漯河肉聯廠肉製品分廠) from October 1987 to August 1991 as a technician, from August 1991 to September 1992 as a director, and from September 1992 to March 1993 as the deputy head. She was the institute director of Henan Luohe Meat Products Processing United Factory Food Institute (河南省漯河肉聯廠食品研究所) from March 1993 to March 1998. Ms. Wang was a director of the technology center of Shuanghui Group from March 1998 to November 2001.
Ms. Wang completed her correspondence studies in food engineering in Zhengzhou University of Light Industry (鄭州輕工業學院) in June 1997, obtained her senior engineer of food research certificate issued by the People’s Government of Henan Province in May 2002 and also obtained the completion certificate for the master of business administration program from the Graduate School of Renmin University (中國人民大學研究生院) in March 2005.
LIU Songtao (劉松濤)LIU Songtao (劉松濤), age 43, has served as the executive vice president and chief financial officer of Shuanghui Development (a company listed on the Shenzhen Stock Exchange with stock code 000895 and our subsidiary) since December 26, 2017 and is in charge of finance, information technology and finance company. He also holds directorships in various subsidiaries of the Group. Previously, Mr. Liu served as the vice president of Shuanghui Development and was in change of finance from August 25, 2012 to December 25, 2017, as a director of the finance department of Shuanghui Group from May 2003 to August 2012, as a director of the finance department of Shuanghui Development Luohe Slaughter Factory (雙匯發展漯河屠宰分廠) from March 2003 to May 2003, and as a director of the finance department of Luohe Huayi Food Co., Ltd. (漯河華意食品有限公司) from March 2002 to March 2003. Mr. Liu was awarded the bachelor’s degree of chrematistics by Henan University (河南大學) in July 2000.
THAMODARAN Dhamu R.THAMODARAN Dhamu R., age 64, joined Smithfield in August 1995, and has served as Smithfield’s executive vice president and chief commodity hedging officer since July 2011. Since February 2016, he has held an additional title of chief strategy officer of Smithfield. He is responsible for hedging and mitigating commodity volatilities in the business, and heads the group for research and analysis in global economy and commodities of Smithfield. In addition, he is responsible for developing strategies to optimize Smithfield’s vertically integrated model. Dr. Thamodaran joined John Morrell & Co. in August 1990 as director of price risk management. He joined Smithfield as director of price risk management in August 1995, and was promoted to vice president of price risk management in May 1996 and to senior vice president and chief commodity hedging officer in June 2008. Prior to joining John Morrell & Co., he worked for five years at Farmland Industries.

15ANNUAL REPORT 2019 WH GROUP LIMITED
Biographies of Directors and Senior Management (Continued)
Dr. Thamodaran obtained his bachelor of science degree in agriculture from the Tamil Nadu Agricultural University in India in 1978, his master of science degree in agricultural economics from the Indian Agricultural Research Institute in India in 1980, and his Ph.D in economics from Iowa State University in U.S. in 1983.
NUNZIATA GlennNUNZIATA Glenn, age 46, has served as Smithfield’s executive vice president and chief financial officer since October 2015. As chief financial officer, Mr. Nunziata leads Smithfield’s finance, accounting treasury, risk management, human resources and IT functions and serves as Smithfield’s principal accounting officer. Prior to joining Smithfield, Mr. Nunziata served as a partner in assurance services at the multinational professional services firm of Ernst & Young LLP, having been with Ernst & Young for 19 years. He has extensive experience in finance, capital markets and operations analysis as well as in matters pertaining to internal controls and corporate governance.
Mr. Nunziata became a certified public accountant in the State of New York, U.S., in March, 2000 and in the Commonwealth of Virginia, U.S., in June 2005. He obtained his bachelor of science degree in business administration from James Madison University in May 1995 and his master of science degree in accounting from James Madison University in May 1996.
CHAU Ho (周豪)CHAU Ho (周豪), age 54, has served as our chief legal officer and as the company secretary since February 2014. He also holds directorships in various subsidiaries of the Group. Mr. Chau was an assistant to the chairman in China Rongsheng Heavy Industries Group Holdings Limited (now renamed China Huarong Energy Company Limited, listed on the Stock Exchange with stock code 01101) from April 2011 to January 2014 and as assistant to the chairman in Glorious Property Holdings Limited (listed on the Stock Exchange with stock code 00845) from March 2010 to March 2011. Mr. Chau has over 20 years of legal experience. He was an associate and subsequently a partner at the law firm Koo and Partners, which merged with the law firm Paul Hastings Janofsky & Walker (now renamed Paul Hastings), from October 1994 to February 2010. Mr. Chau received his bachelor of laws degree in November 1991 and the postgraduate certificate in laws in November 1992 from the City University of Hong Kong (formerly known as City Polytechnic of Hong Kong). In January 2003, he obtained his bachelor of laws degree from Tsinghua University. Mr. Chau has been qualified to practice as a solicitor in Hong Kong since August 1994 and has been a China-Appointed Attesting Officer since April 2006. He has also been qualified to practice as a solicitor in England and Wales since September 2008.

Business Review
17ANNUAL REPORT 2019 WH GROUP LIMITED
Business Review (Continued)
Overcoming Challenges, Optimizing Opportunities
I. Industry OverviewThe Group operates in China, the U.S. and certain selected markets in Europe. Each geographic region is characterised distinctively.
ChinaChina is the largest pork producer and consumption market in the world. Such market is expected to expand further. Generally, the development of the pork industry in China is largely dependent on its regulatory environment, as well as the pace of economic growth and improvement of people’s living standard. Nevertheless, the short-term trend is impacted by the industry cycle and animal epidemic.
In 2019, China’s pork industry experienced unprecedented volatility due to the spread of ASF, a severe viral disease communicable amongst domestic and wild hogs. According to the MOA, 63 cases of ASF were reported and 390 thousand heads of hogs were culled nationwide throughout the year.
Due to the ease of transmission and lack of approved vaccine, ASF became the key factor that brought down the volumes of hog production and pork supply. With reference to the data published by the National Bureau of Statistics of China, the total production of hogs in 2019 was 544 million heads, 21.6% lower than 2018. The total production of pork was 42.6 million tons, a decrease of 21.3% as compared to the previous year. For the number of hog inventory and breeding sows, as disclosed by MOA, their levels of year-on-year reduction continued to enlarge from the beginning to about the end of the third quarter of 2019. By October, such decreases were at 41.4% and 37.8% respectively.
As a result, hog prices had been breaking records in 2019 and reached a peak of over RMB40.0 per kg about the end of October. According to the data of MOA, the average hog price for the entire year was RMB21.2 (approximately US$3.1) per kg, a substantial increase of 63.3% over that of 2018. The surge of hog prices resulted in a sharp increase in pork prices, which weakened the demand for pork and promoted the consumption of other meats.
However, given the importance of pork in Chinese diet, the supply shortage remained huge. Coupled with the high prices, importation of pork became very conducive. According to the statistics of the General Administration of Customs of the People’s Republic of China, the total volume of imported pork during the year was 2.11 million tons, 1.8 times higher than that of 2018. Key importing regions to China in 2019 were European Union, the U.S. and Brazil in descending order of volume.
To contain the epidemic, rationalise the industry, restore production and curb retail pork prices, the Chinese government adopted a series of bold measures, such as restricting the transportation of live hogs, tightening the inspections in the slaughtering process, establishing the “Green Channel System” for chilled pork, incentivizing the standardisation of large scaled hog farming and supporting the enhancement of industrial supply chain. These measures provided both near and long terms policy guidance to the practitioners.
Benefiting from the different measures being taken by the government and the practitioners, the forward indicator of production started to show positive signs in the last quarter of 2019. Based on the statistics reported by MOA, the number of breeding sows in December 2019 grew 2.2% month over month and was 7.0% higher than that in September 2019.

18 WH GROUP LIMITED ANNUAL REPORT 2019
Business Review (Continued)
U.S.The U.S. is the second largest producer of pork worldwide. In contrast to the pork industry in China, the pork industry in the U.S. is relatively mature and concentrated. As the U.S. is also the largest pork exporter globally, hog prices and pork values in the U.S. are driven by the supply and demand of its domestic and export markets.
With reference to the statistics of the USDA, overall animal protein production in the U.S. was up by 3.1% in 2019, in which pork rose 5.0%, beef rose 0.8% and chicken rose 3.6%. With respect to the increase in pork, the major driver was the expansion of hog production volume as the breeding herd grew and productivity improved.
With the continuous increase in production, more pork was expected to be marketed internationally to temper the local supply-demand imbalance. The supply shortage in China, along with the spread of ASF, boosted pork prices in China and other countries, and increased exports opportunities in the U.S.. In spite of the upside limitation imposed by trade barriers, the export volume of U.S. pork and offals in 2019 was up by 9.5% according to the USDA. The increase in total exports was mainly due to the discernible expansion of exports to China. In 2019, U.S. exports to China was 2.9 times that of 2018 as the China-U.S. price spread enlarged. U.S. exports to other major countries such as Mexico and Korea, on the other hand, recorded a double-digit decrease primarily caused by more trades being shifted to China.
Driven by the fact that epidemic dragged global supplies, the average hog price, as published by Chicago Mercantile Exchange, Inc. (“CME”), was US$1.12 per kg in 2019, an increase of 3.7% over that of 2018. Supported by the favourable export environment, the average pork cutout value for 2019, as published by the USDA, also increased by 2.6%.
Hog prices in China and the U.S. during 2018 and 2019
0.5
1.5
2.5
3.5
4.5
5.5
0.5
1.5
2.5
3.5
4.5
5.5
0.5
1.5
2.5
3.5
4.5
5.5
Jan Feb Mar Apr May Jun2018 2019
Jul Aug Sep Oct Nov Dec Jan Feb Mar Apr May Jun Jul Aug Sep Oct Nov Dec
China
US$/kg
U.S.
Sources:MOA and CME
19ANNUAL REPORT 2019 WH GROUP LIMITED
Business Review (Continued)
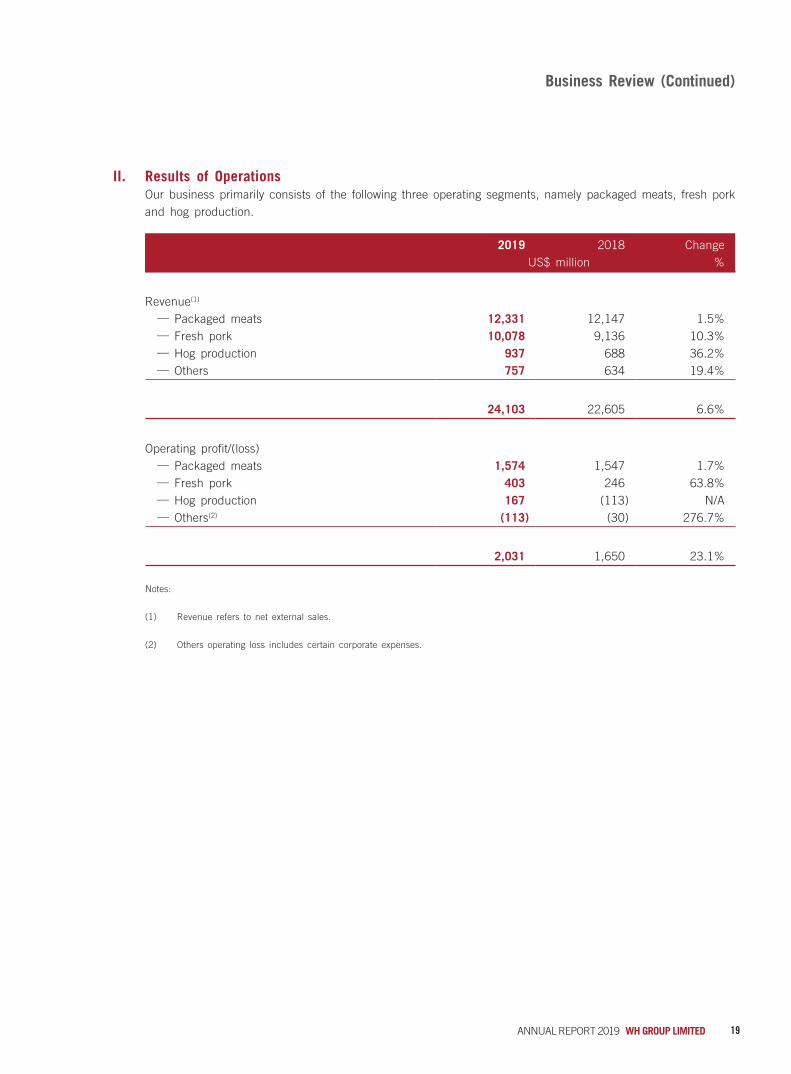
II. Results of OperationsOur business primarily consists of the following three operating segments, namely packaged meats, fresh pork and hog production.
2019 2018 ChangeUS$ million %
Revenue(1)
— Packaged meats 12,331 12,147 1.5%— Fresh pork 10,078 9,136 10.3%— Hog production 937 688 36.2%— Others 757 634 19.4%
24,103 22,605 6.6%
Operating profit/(loss)— Packaged meats 1,574 1,547 1.7%— Fresh pork 403 246 63.8%— Hog production 167 (113) N/A— Others(2) (113) (30) 276.7%
2,031 1,650 23.1%
Notes:
(1) Revenue refers to net external sales.
(2) Others operating loss includes certain corporate expenses.

20 WH GROUP LIMITED ANNUAL REPORT 2019
Business Review (Continued)
Revenue by Operating Segment
Packaged meats
Fresh pork
Hog production
Others
3.9% 3.1%
41.8%
51.2%
2019 2018
3.1% 2.8%
40.4%
53.7%
Operating Profit by Operating Segment
Packaged meats
Fresh pork
Hog production
Others
8.2%-5.5%
19.8%
77.5%
2019
-6.8% -1.9%
14.9%
93.8%
2018
The packaged meats segment has always been our core business. It accounted for 51.2% of the Group’s revenue in 2019 (2018: 53.7%). Its contribution to the Group’s operating profit was 77.5% in 2019 (2018: 93.8%).

21ANNUAL REPORT 2019 WH GROUP LIMITED
Business Review (Continued)
Revenue by Location
China
U.S.
Europe
9.1%
54.6%
36.3%
2019
9.3%
58.3%
32.4%
2018
Operating Profit by Location
China
U.S.
Europe
7.0%
45.9%
47.1%2019
6.8%
37.3%
55.9%
2018
Geographically, our operations in China contributed 36.3% and 47.1% of the revenue and operating profit of the Group in 2019 (2018: 32.4% and 55.9%) respectively. Contribution of our operations in the U.S. to the revenue and operating profit of the Group in 2019 were 54.6% and 45.9% (2018: 58.3% and 37.3%) respectively. The rest of the revenue and operating profit of the Group came from our operations in Europe.

22 WH GROUP LIMITED ANNUAL REPORT 2019
Business Review (Continued)
Packaged Meats
2019 2018 ChangeUS$ million %
RevenueChina 3,615 3,458 4.5%U.S. 7,814 7,773 0.5%Europe 902 916 (1.5%)
12,331 12,147 1.5%
Operating profitChina 673 712 (5.5%)U.S. 847 785 7.9%Europe 54 50 8.0%
1,574 1,547 1.7%
In 2019, packaged meats sales volume of the Group slightly decreased by 0.5% to 3,345 thousand metric tons. In China, sales volume during the year was similar to the level of 2018 as consumer market slowed down. Meanwhile, we continued to transform our product portfolio by introducing new products and expanding new sales channels. Driven by the growth of ingredient-type and Chinese-style products, our product mix was improving. Sales volume in the U.S. was mildly down by 0.8% in 2019 as we consciously reduced the products with lower profitability. In Europe, sales volume was lowered by 1.7% due to a cut-off adjustment in the previous year. The underlying volume increased benefiting from organic growth and recent acquisitions.
Revenue in 2019 grew by 1.5% to US$12,331 million. The growth was characterised by the increase in average selling prices (“ASP”), on a currency neutral basis, in all markets that we are operating. Against the backdrop of growing raw material meat prices in the globe led by ASF, we raised prices proactively in China and Europe. We also benefited from part of the products that applied formula pricing in the U.S..
Operating profit was US$1,574 million in 2019, an increase of 1.7% as compared to 2018. However, operating profit in China decreased by 5.5%. Apart from the negative impact of foreign exchange translation, the decrease was due to the fact that the drawback of costs hike outpaced the benefit of price adjustments. During the year, the costs of raw material such as pork and chicken meat soared. To support our price and product mix adjustments, expenditures in marketing and promotions were also higher. In the U.S., the increase in operating profit of 7.9% was driven by product mix improvement as we were expanding our capacity in value-added categories such as dry sausages and cooked meats, along with the savings being brought by our initiatives to optimise sales and distribution processes. Although higher raw material prices, wages and logistics costs countervailed part of the increase in our operating profit in the U.S., we achieved a new record in 2019. In Europe, operating profit increased by 8.0% as compared to 2018 due to lower administrative expenses despite higher meat costs.

23ANNUAL REPORT 2019 WH GROUP LIMITED
Business Review (Continued)
Fresh Pork
2019 2018 ChangeUS$ million %
RevenueChina 4,725 3,584 31.8%U.S. 4,467 4,790 (6.7%)Europe 886 762 16.3%
10,078 9,136 10.3%
Operating profit/(loss)China 262 179 46.4%U.S. 150 48 212.5%Europe (9) 19 N/A
403 246 63.8%
In response to the shifts in demand and supply and the resulting movements in hog prices, we regulate our levels of slaughtering activity and adjust our meat prices in each respective market from time to time in order to maximise the profits.
Total number of hogs processed in 2019 was 53,797 thousand heads, a decrease of 4.1% over that of 2018. The decrease was contributed by our slaughtering business in China as the number of hogs processed there declined by 19.0% to 13,202 thousand heads. Earlier this year, we took advantage of our widely established production and logistics facilities to seize the opportunity of the relatively low hog prices to expand our production scale and distribution channels. However, as the impact of ASF manifested gradually, our volume was severely constrained by the reduction in market supplies of live hog and softening in demand as pork prices escalated. On the other hand, our processing volume in the U.S. increased by 1.7% to 34,513 thousand heads in 2019 as the hog industry expanded. Our processing volume in Europe also increased by 4.3% as we completed the acquisition of Pini Polonia.
External sales volume of fresh pork was 4,224 thousand metric tons, 6.1% less than the level in the previous year as we adjusted our operating strategies in light of the changing market dynamics.
Fresh pork revenue increased by 10.3% to US$10,078 million in 2019 as the growth in China and Europe outweighed the decline in the U.S.. Revenue in China increased significantly by 31.8% from that of the 2018 because the impact of the record-breaking pork prices surpassed the decrease in sales volume. In the U.S., revenue was down by 6.7% mainly as a result of the decrease in sales volume as more pork was sold internally for further processing and exports. In Europe, revenue rose 16.3% in conjunction with the ASP as prices were heartened by ASF. Integration of Pini Polonia was also an add-on factor of growth.
24 WH GROUP LIMITED ANNUAL REPORT 2019
Business Review (Continued)
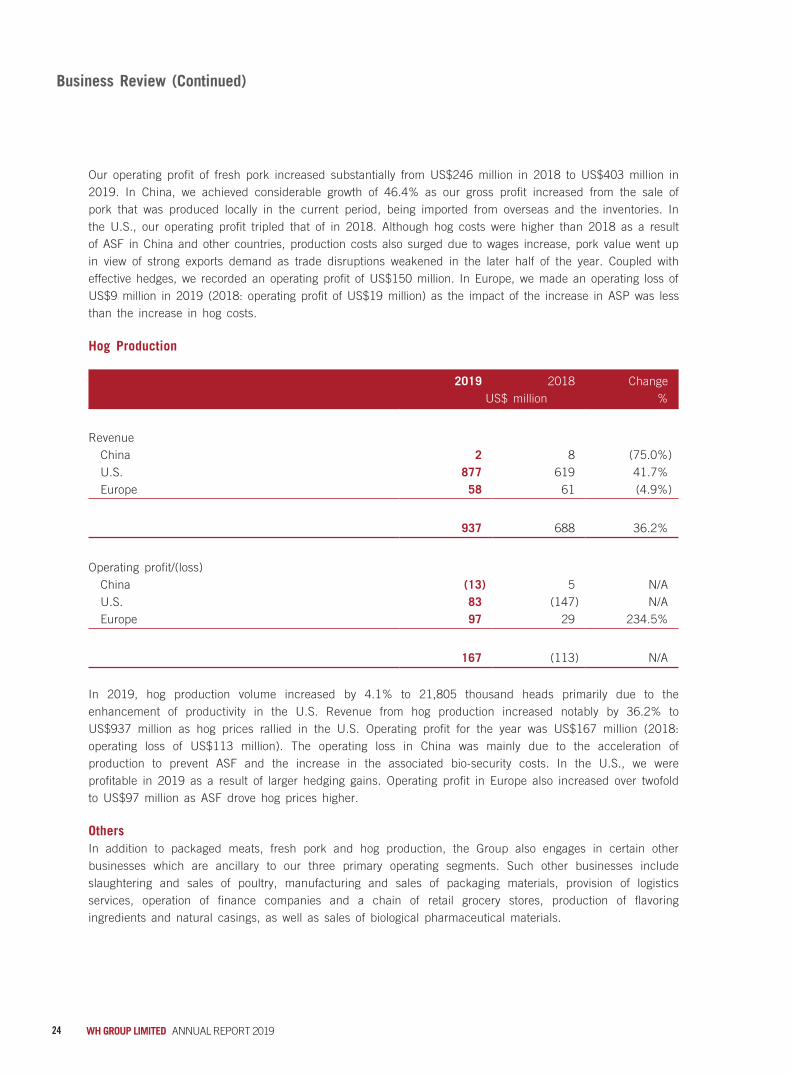
Our operating profit of fresh pork increased substantially from US$246 million in 2018 to US$403 million in 2019. In China, we achieved considerable growth of 46.4% as our gross profit increased from the sale of pork that was produced locally in the current period, being imported from overseas and the inventories. In the U.S., our operating profit tripled that of in 2018. Although hog costs were higher than 2018 as a result of ASF in China and other countries, production costs also surged due to wages increase, pork value went up in view of strong exports demand as trade disruptions weakened in the later half of the year. Coupled with effective hedges, we recorded an operating profit of US$150 million. In Europe, we made an operating loss of US$9 million in 2019 (2018: operating profit of US$19 million) as the impact of the increase in ASP was less than the increase in hog costs.
Hog Production
2019 2018 ChangeUS$ million %
RevenueChina 2 8 (75.0%)U.S. 877 619 41.7%Europe 58 61 (4.9%)
937 688 36.2%
Operating profit/(loss)China (13) 5 N/AU.S. 83 (147) N/AEurope 97 29 234.5%
167 (113) N/A
In 2019, hog production volume increased by 4.1% to 21,805 thousand heads primarily due to the enhancement of productivity in the U.S. Revenue from hog production increased notably by 36.2% to US$937 million as hog prices rallied in the U.S. Operating profit for the year was US$167 million (2018: operating loss of US$113 million). The operating loss in China was mainly due to the acceleration of production to prevent ASF and the increase in the associated bio-security costs. In the U.S., we were profitable in 2019 as a result of larger hedging gains. Operating profit in Europe also increased over twofold to US$97 million as ASF drove hog prices higher.
OthersIn addition to packaged meats, fresh pork and hog production, the Group also engages in certain other businesses which are ancillary to our three primary operating segments. Such other businesses include slaughtering and sales of poultry, manufacturing and sales of packaging materials, provision of logistics services, operation of finance companies and a chain of retail grocery stores, production of flavoring ingredients and natural casings, as well as sales of biological pharmaceutical materials.
25ANNUAL REPORT 2019 WH GROUP LIMITED
Business Review (Continued)
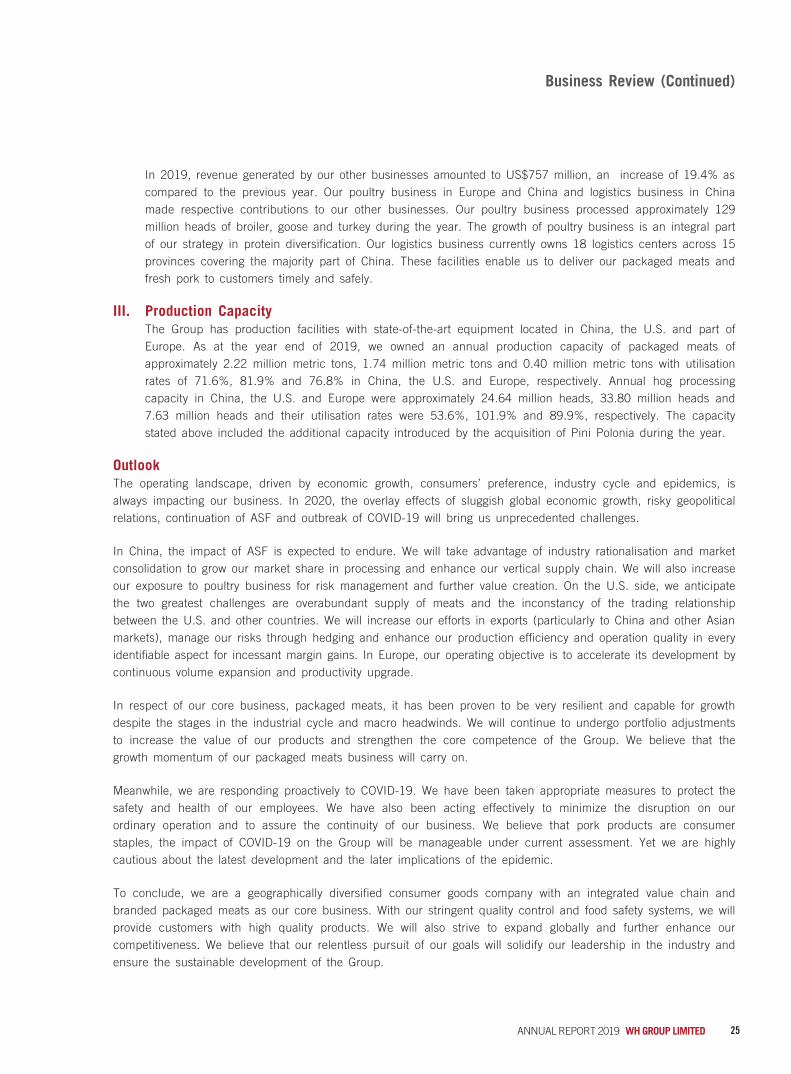
In 2019, revenue generated by our other businesses amounted to US$757 million, an increase of 19.4% as compared to the previous year. Our poultry business in Europe and China and logistics business in China made respective contributions to our other businesses. Our poultry business processed approximately 129 million heads of broiler, goose and turkey during the year. The growth of poultry business is an integral part of our strategy in protein diversification. Our logistics business currently owns 18 logistics centers across 15 provinces covering the majority part of China. These facilities enable us to deliver our packaged meats and fresh pork to customers timely and safely.
III. Production CapacityThe Group has production facilities with state-of-the-art equipment located in China, the U.S. and part of Europe. As at the year end of 2019, we owned an annual production capacity of packaged meats of approximately 2.22 million metric tons, 1.74 million metric tons and 0.40 million metric tons with utilisation rates of 71.6%, 81.9% and 76.8% in China, the U.S. and Europe, respectively. Annual hog processing capacity in China, the U.S. and Europe were approximately 24.64 million heads, 33.80 million heads and 7.63 million heads and their utilisation rates were 53.6%, 101.9% and 89.9%, respectively. The capacity stated above included the additional capacity introduced by the acquisition of Pini Polonia during the year.
OutlookThe operating landscape, driven by economic growth, consumers’ preference, industry cycle and epidemics, is always impacting our business. In 2020, the overlay effects of sluggish global economic growth, risky geopolitical relations, continuation of ASF and outbreak of COVID-19 will bring us unprecedented challenges.
In China, the impact of ASF is expected to endure. We will take advantage of industry rationalisation and market consolidation to grow our market share in processing and enhance our vertical supply chain. We will also increase our exposure to poultry business for risk management and further value creation. On the U.S. side, we anticipate the two greatest challenges are overabundant supply of meats and the inconstancy of the trading relationship between the U.S. and other countries. We will increase our efforts in exports (particularly to China and other Asian markets), manage our risks through hedging and enhance our production efficiency and operation quality in every identifiable aspect for incessant margin gains. In Europe, our operating objective is to accelerate its development by continuous volume expansion and productivity upgrade.
In respect of our core business, packaged meats, it has been proven to be very resilient and capable for growth despite the stages in the industrial cycle and macro headwinds. We will continue to undergo portfolio adjustments to increase the value of our products and strengthen the core competence of the Group. We believe that the growth momentum of our packaged meats business will carry on.
Meanwhile, we are responding proactively to COVID-19. We have been taken appropriate measures to protect the safety and health of our employees. We have also been acting effectively to minimize the disruption on our ordinary operation and to assure the continuity of our business. We believe that pork products are consumer staples, the impact of COVID-19 on the Group will be manageable under current assessment. Yet we are highly cautious about the latest development and the later implications of the epidemic.
To conclude, we are a geographically diversified consumer goods company with an integrated value chain and branded packaged meats as our core business. With our stringent quality control and food safety systems, we will provide customers with high quality products. We will also strive to expand globally and further enhance our competitiveness. We believe that our relentless pursuit of our goals will solidify our leadership in the industry and ensure the sustainable development of the Group.

Financial Review
27ANNUAL REPORT 2019 WH GROUP LIMITED
Financial Review (Continued)
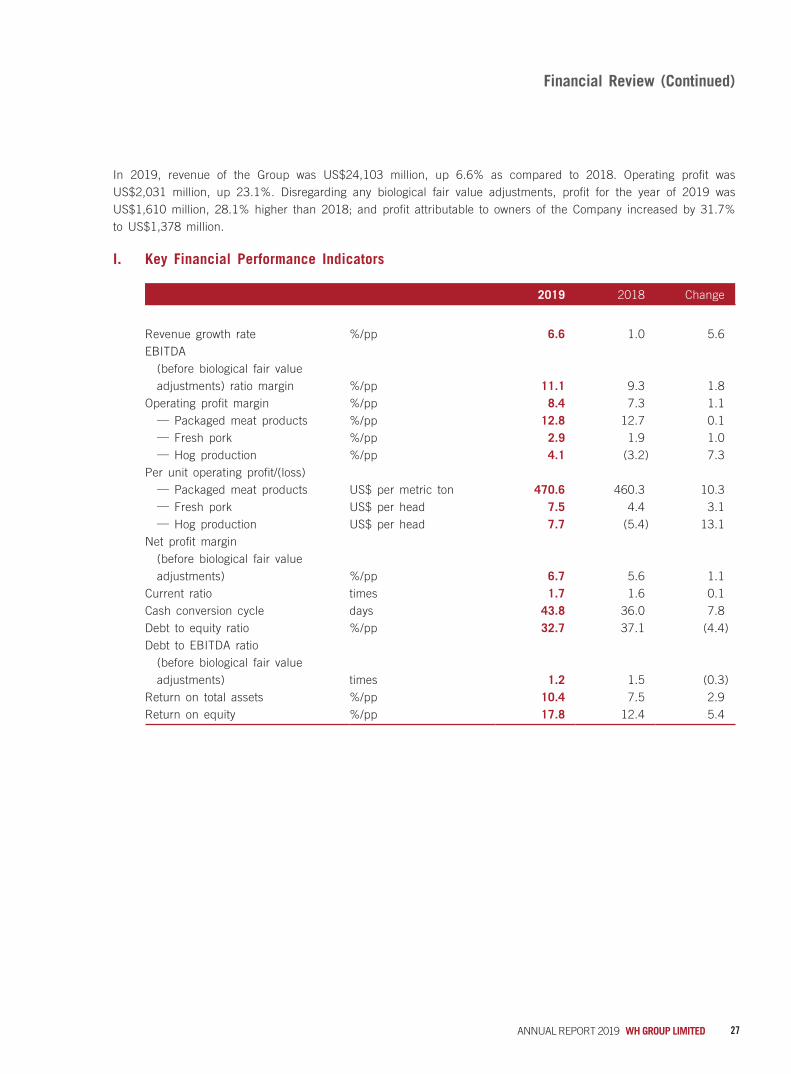
In 2019, revenue of the Group was US$24,103 million, up 6.6% as compared to 2018. Operating profit was US$2,031 million, up 23.1%. Disregarding any biological fair value adjustments, profit for the year of 2019 was US$1,610 million, 28.1% higher than 2018; and profit attributable to owners of the Company increased by 31.7% to US$1,378 million.
I. Key Financial Performance Indicators
2019 2018 Change
Revenue growth rate %/pp 6.6 1.0 5.6EBITDA
(before biological fair value adjustments) ratio margin %/pp 11.1 9.3 1.8
Operating profit margin %/pp 8.4 7.3 1.1— Packaged meat products %/pp 12.8 12.7 0.1— Fresh pork %/pp 2.9 1.9 1.0— Hog production %/pp 4.1 (3.2) 7.3
Per unit operating profit/(loss)— Packaged meat products US$ per metric ton 470.6 460.3 10.3— Fresh pork US$ per head 7.5 4.4 3.1— Hog production US$ per head 7.7 (5.4) 13.1
Net profit margin (before biological fair value adjustments) %/pp 6.7 5.6 1.1
Current ratio times 1.7 1.6 0.1Cash conversion cycle days 43.8 36.0 7.8Debt to equity ratio %/pp 32.7 37.1 (4.4)Debt to EBITDA ratio
(before biological fair value adjustments) times 1.2 1.5 (0.3)
Return on total assets %/pp 10.4 7.5 2.9Return on equity %/pp 17.8 12.4 5.4

28 WH GROUP LIMITED ANNUAL REPORT 2019
Financial Review (Continued)
II. Analysis of Capital Resources Treasury Management
Our treasury function undertakes the responsibility of cash management, liquidity planning and control, procurement of financing which is cost-efficient to the Group, liaison with banks and rating agencies, investment in financial products, corporate finance, as well as mitigation of financial risks such as interest and foreign exchange. The design of our treasury function aims at aligning with the long-term and short-term needs of the Group and conforming with good governance standard.
LiquidityThe Group continues to maintain a strong level of liquidity. We had bank balances and cash of US$552 million as at December 31, 2019 (2018: US$525 million), which were held primarily in RMB, US$, PLN and RON. From time to time, we also hold certain financial products for yield enhancement purpose. Such financial products are classified as current financial assets at fair value through profit or loss. As at December 31, 2019, the balance was US$447 million (2018: US$317 million).
Our current ratio (ratio of consolidated current assets to consolidated current liabilities) was 1.7 times as at December 31, 2019 (2018: 1.6 times). The aggregate amount of unutilised banking facilities as at December 31, 2019 was US$2,874 million (2018: US$2,893 million).
Cash FlowsWe fund our operations principally from cash generated by our operations, bank loans and other debt instruments, as well as equity financing from investors. Our cash requirements relate primarily to production and operating activities, business and asset acquisitions, repayment of liabilities as they become due, capital expenditures, interest and dividend payments and any unexpected cash requirements.
In 2019, our net cash from operating activities amounted to US$1,463 million (2018: US$1,255 million). The increase was mainly driven by stronger operating results but was partly offset by the increase in inventories. Our net cash used in investing activities in 2019 amounted to US$796 million (2018: US$1,217 million). The change was mainly attributable to the decrease in capital expenditures and net increment in financial assets during the year. Our net cash used in financing activities in 2019 amounted to US$593 million (2018: US$790 million). This was the net result of the decrease in the payments of dividends and the increase in the payments of lease liabilities in the year. As such, our net increase in cash and cash equivalents was US$74 million in 2019 (2018: net decrease of US$752 million).
Major Financing ActivitiesOn April 1, 2019, the Group completed the issuance of 5.200% senior unsecured notes with an aggregate principal amount of US$400 million due 2029 to refinance part of its existing debts and replenish working capital.
In 2018, our Group established a commercial paper program of up to US$1,750 million for short-term liquidity needs. As at December 31, 2019, our outstanding balance of commercial papers was US$125 million in aggregate (2018: US$236 million).
29ANNUAL REPORT 2019 WH GROUP LIMITED
Financial Review (Continued)
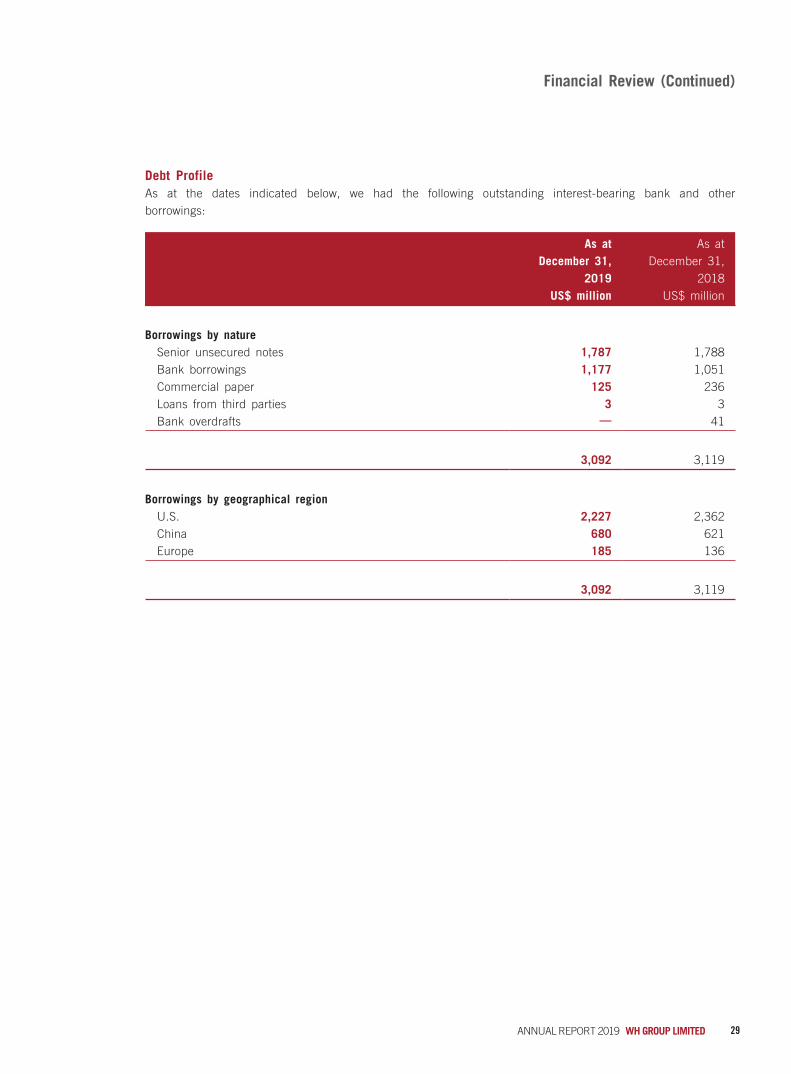
Debt ProfileAs at the dates indicated below, we had the following outstanding interest-bearing bank and other borrowings:
As at December 31,
2019
As at December 31,
2018 US$ million US$ million
Borrowings by natureSenior unsecured notes 1,787 1,788Bank borrowings 1,177 1,051Commercial paper 125 236Loans from third parties 3 3Bank overdrafts — 41
3,092 3,119
Borrowings by geographical regionU.S. 2,227 2,362China 680 621Europe 185 136
3,092 3,119

30 WH GROUP LIMITED ANNUAL REPORT 2019
Financial Review (Continued)
The Group’s total principal amount of outstanding borrowings as at December 31, 2019 was US$3,110 million (2018: US$3,134 million). The maturity profile is analysed as follows:
Total
In 2020 29%In 2021 14%In 2022 15%In 2023 10%In 2027 19%In 2029 13%
100%
Our borrowings are principally denominated in currencies of the countries of the Group’s business, or balanced by assets in the same currency. 73.5% of our borrowings was denominated in US$ as at December 31, 2019 (2018: 78.8%). The rest of our borrowings was denominated in RMB, HK$, RON, PLN and Euro.
As at December 31, 2019, 98.7% of our borrowings were unsecured (2018: 88.0%). Certain borrowings were secured by pledged bank deposits and other assets. Certain borrowings contained affirmative and negative covenants that are subject to certain qualifications and exceptions. The Group had no default in repayment of bank borrowings, nor did it breach any relevant finance covenants during the year.
Leverage RatiosAs at December 31, 2019, our debt to equity ratio (ratio of consolidated borrowings to consolidated total equity) and net debt to equity ratio (ratio of consolidated borrowings less bank balances and cash to consolidated total equity) were 32.7% and 26.9%, respectively (2018: 37.1% and 30.8%, respectively). Our debt to EBITDA ratio (ratio of consolidated borrowings to EBITDA before biological fair value adjustments) and net debt to EBITDA ratio (ratio of consolidated borrowings less bank balances and cash to EBITDA before biological fair value adjustments) as at December 31, 2019 were 1.2 times and 1.0 times, respectively (2018: 1.5 times and 1.2 times, respectively).
Finance CostsOur finance costs increased from US$115 million in 2018 to US$144 million in 2019. The increase was mainly due to the inclusion of interest on lease liabilities following the adoption of IFRS 16.
As at December 31, 2019, the average interest rate of our total borrowings was 3.7% (2018: 3.5%).

31ANNUAL REPORT 2019 WH GROUP LIMITED
Financial Review (Continued)
Credit ProfileThe Group aims at maintaining a good credit profile that is beneficial to its long-term growth and development. Our Long-Term Foreign-Currency Issuer Default Rating (“IDR”) and senior unsecured rating are BBB+ according to Fitch. Our long-term corporate credit rating is BBB according to Standard & Poor’s. Our issuer rating is Baa2 according to Moody’s. The outlook of these ratings is stable.
For our wholly-owned subsidiary, Smithfield, Fitch assigned to it an IDR of BBB with a stable outlook. According to Standard & Poor’s, the corporate credit rating of Smithfield is BBB-. The outlook is stable. The corporate family rating of Smithfield assigned by Moody’s was Ba1. The outlook is also stable.
III. Capital ExpendituresOur capital expenditures are primarily for the construction, renovation and transformation of production plants and ancillary facilities. We fund these capital expenditures with internally generated cash, bank loans and shareholders’ capital.
In 2019, capital expenditures amounted to US$703 million (2018: US$811 million). The following table sets out our capital expenditures by geographical region for the years indicated:
2019 2018US$ million US$ million
China 99 84U.S. 478 596Europe 126 131
703 811
In China, our capital expenditures for the year were mainly for the alteration of our packaged meats and poultry production facilities as well as the investment in certain environmental protection projects. Our capital expenditures in the U.S. were primarily related to the modernisation of our processing plants, expansion of our value-added packaged meats production capacity and building of a distribution centre. Our capital expenditures in Europe were mainly for the building of a new poultry plant.
IV. Human ResourcesAs at December 31, 2019, the Group had approximately 101 thousand employees in total, in which approximately 46 thousand employees were with our China operation, approximately 40 thousand and 15 thousand employees were with our U.S. and European operations, respectively. We value talent management and employee engagement. Therefore, with a view to constantly improving the skills and knowledge of our employees, we provide adequate training programs. It is also our policy to ensure that remuneration for employees is appropriate and aligns with the goals, objectives and performances of the Group. Total remuneration expenses in 2019 amounted to US$3,650 million (2018: US$3,518 million), which comprised fixed compensation such as basic salaries and allowances; variable incentives such as performance bonus; and long term incentives such as share-based payments as well as retirement benefits scheme.

32 WH GROUP LIMITED ANNUAL REPORT 2019
Financial Review (Continued)
V. Biological AssetsAs at December 31, 2019, we had a total of 13,342 thousand hogs, consisting of 12,258 thousand market hogs and 1,084 thousand breeding stock, an increase of 2.6% from 13,009 thousand hogs as at December 31, 2018. We also had a total of 5,485 thousand poultry, consisting of 4,860 thousand broilers and 625 thousand breeding stock (2018: 4,515 thousand poultry). The fair value of our biological assets was US$1,244 million as at December 31, 2019, as compared to US$1,094 million as at December 31, 2018.
Our results have been, and we expect they will continue to be, affected by changes in the fair value of our biological assets. Fair value of our biological assets is determined with reference to the market prices, species, growing conditions, cost incurred and the professional valuation. We engaged an independent valuer, Jones Lang LaSalle Corporate Appraisal and Advisory Limited, to measure such fair value for the Group on an annual basis.
In 2019, the net impact of biological fair value adjustments on our profit was a gain in the amount of US$85 million, as compared to a loss in the amount of US$104 million of last year.
VI. Key Investment Interests Internal Restructuring
On January 25, 2019, three major subsidiaries of the Company, namely Rotary Vortex, Shuanghui Group and Shuanghui Development, entered into a merger agreement for the purpose of enhancing our governance by simplifying the holding structure and reducing the amount of connected transactions of the Group. The restructuring process was completed by the end of September, 2019. As a result, Shuanghui Group ceased operation and was deregistered. Its assets, liabilities, employees, contracts and any other rights and obligations were succeeded by Shuanghui Development. The Company, through Rotary Vortex, holds approximately 73.41% equity interest in Shuanghui Development (prior to completion of such restructuring: effectively held approximately 73.25% through Rotary Vortex and Shuanghui Group).
Acquisition of SubsidiariesOn May 28, 2019, the Group completed the purchase of the remaining interest of 66.5% in Pini Polonia and converted it into an indirect wholly-owned subsidiary of the Company. Pini Polonia operates a hog slaughterhouse in Poland with an annual production capacity of approximately 4 million hogs. The completion of the acquisition of Pini Polonia enabled us to expand our scale and improve our efficiency in the fresh pork market in Poland.
Mexican Joint VenturesThe Group has joint venture interests in two pork companies located in Mexico, GCM and Norson. GCM sells live hogs into the Mexico City market, one of the largest pork consumption markets in the world. In March 2019, a new processing facility of GCM commenced operation. Norson primarily produces hogs for use in its fresh pork operations. In 2019, the Group’s share of profit from the Mexican joint ventures was US$11 million (2018: US$26 million). At the end of 2019, GCM and Norson had in aggregate approximately 153 thousand sows and owned processing facilities with an annual product capacity of 2.6 million hogs. It is expected that GCM and Norson will continue to be our important investments in Mexico and bring in profit to the Group.
33ANNUAL REPORT 2019 WH GROUP LIMITED
Financial Review (Continued)
Joint Ventures in Renewable GasThe Group has two joint ventures engaged in renewable gas operation in the U.S. Align RNG, LLC (“Align”) was formed with Dominion Energy RNG Holdings, Inc. and Monarch Bio Energy, LCC (“Monarch”) was formed with Roeslein Alternative Energy, LLC. Align and Monarch convert waste from our hog farms in Utah and Missouri to natural gas. As the two major projects in renewable resources of our Group, they will generate economic benefits and contribute to our environmental, social and governance goals.
VII. Key Risks and their Management Risk Management
The risk management system of the Group is designed to assist the Group in implementing a sound and consistent risk management and reporting process across the Group. The Risk Management Committee is mainly responsible to oversee the development and implementation of the Group’s risk management system. The Group’s risk management department assisted the Risk Management Committee to review the effectiveness of risk management process and risk management report submitted by management, in which key risks and mitigation measures were reported to the Risk Management Committee. In 2019, the Group conducted enterprise risk assessments to analyze and report key risks, followed by the establishment of respective mitigation controls. An opinion on the effectiveness of the enterprise risk management (“ERM”) system of the Company was submitted to the Risk Management Committee, which considers that the ERM system of the Group are effectively in place.
Commodities Price RisksCommodities comprise a significant part of the Group’s inputs (costs) and outputs (sales). The Group uses various raw materials, primarily live hogs, meat, corn, and soybean meal in our packaged meats, fresh pork, and hog production operations. The Group’s revenue is primarily driven by the sale of packaged meats and fresh pork, and, to a lesser degree, sales of hogs to third parties. Significant price fluctuations in these commodities affect our results.
In China, we mitigate the effects of price fluctuations through strategic inventory management, effective transfer of raw material prices to end customers and overseas imports, when appropriate. In the U.S., our vertically integrated supply chain helps the natural hedge of commodities price changes. These commodities are also actively traded on the exchanges. We hedge when we determine conditions are suitable to mitigate price risk. The main objectives of hedges are to reduce hog production margin volatility and mitigate commodity price risk associated with forward sales in our packaged meats and fresh pork businesses. While these hedging activities may limit our ability to participate in gains from favorable commodity fluctuations, it also reduces the risk of loss from adverse changes in raw material prices. The Group has robust monitoring procedures in the management of all its derivative activities under the leadership and execution of a dedicated and professional team.
34 WH GROUP LIMITED ANNUAL REPORT 2019
Financial Review (Continued)
Currency and Interest Rate RisksThe Group generally matches income and expenses, assets and liabilities with the same currency, in each geographical location which it operates, to reduce currency risks. Only certain entities of the Group have certain sales, purchases, bank balances and cash and borrowings denominated in currencies other than their functional currencies. We monitor our foreign exchange exposure at any time and hedge significant exposure should the need arise.
Our borrowings carry fixed or floating interest rates. At December 31, 2019, approximately 77.1% of our borrowings (other than bank overdrafts) were at fixed interest rates (2018: 77.0%). To manage our interest rate exposure, we optimise our debt portfolio and enter into hedging activities from time to time.
VIII. Contingent LiabilitiesOur operations are subject to various laws and regulations administered by various specific local authorities. We receive notices and inquiries from them in relation to compliance from time to time. In some instances, litigation ensues or individuals may initiate litigation against the Group. Details and updates on the North Carolina nuisance litigation case are set out in Note 43 to Consolidated Financial Statements of the annual report. Our management assesses and monitors these contingent liabilities. We believe that their financial and operational impact would not be material to the Group.
IX. SustainabilityThe Group is proud to be an engaged and active member of the communities in which we operate and which we help feed. We believe that it is our responsibility to give back to individuals and communities that have supported us over the years and contributed to our success to date. We conducted our materiality analysis this year by developing a process to identify key sustainability issues of our key stakeholders and prioritise the key concerns in a systematic approach, so as to guide our sustainability strategy and manage concerns which are deemed as most material to our stakeholders. The analysis results layout the foundation for material selection and preparation of our Sustainability Report.
More details regarding the Group’s performance by reference to environmental and social-related key performance indicators and policies, as well as compliance with relevant laws and regulations which have a significant impact on the Group will be provided in our Sustainability Report to be published on the websites of the Stock Exchange (www.hkexnews.hk) and the Company (www.wh-group.com) no later than three months after the publication of the Company’s annual report.

CORPORATE GOVERNANCE REPORT
35ANNUAL REPORT 2019 WH GROUP LIMITED
The Board is pleased to present the Corporate Governance Report of the Company for the year ended December 31, 2019.
Commitment to Corporate GovernanceThe Board and the management of the Group are committed to achieving and maintaining high standards of corporate governance, which they consider to be essential to safeguard the integrity of the Group’s operations and maintaining investors’ trust in the Company. The Group’s management also actively observes the latest corporate governance developments in the PRC, Hong Kong and abroad. This Corporate Governance Report explains the Company’s corporate governance principles and practices, including how the Board manages the business to deliver long-term shareholder value and to promote the development of the Group.
Corporate Governance PracticesThe corporate governance practices are based on the principles and code provisions set out in the CG Code. In the opinion of the Board, the Company has complied with the provisions of the CG Code as set out in Appendix 14 to the Listing Rules throughout the Review Period, except for the deviation as disclosed in the section headed “The Board — Board composition — (i) Chairman and chief executive officer” of this report.
Directors’ Securities TransactionsThe Company has adopted a Code of Conduct regarding securities transactions by the Directors on terms no less exacting than the required standards set out in the Model Code in Appendix 10 to the Listing Rules. The Company has made specific enquiries with each Director and save for Mr. Guo Lijun, each of them confirmed that he had complied with all required standards set out in the Model Code and the Code of Conduct during the Review Period.
On May 31, 2019, Mr. Guo Lijun made a gift of 100% of the equity interests in Luohe Jiaxin Investment Co., Ltd.* (漯河嘉昕投資有限公司), which indirectly held 1,899,000 Shares, to his son, Mr. Guo Jiaxing, without first notifying in writing the Chairman and receiving a dated written acknowledgement as required by the Model Code and the Code of Conduct. Mr. Guo Lijun promptly notified the Chairman and obtained a dated written acknowledgement as soon as he became aware of the non-compliance out of an inadvertent mistake. In order to avoid similar non-compliance by the Directors in the future, the Company reminded all the Directors of the required standards set out in the Model Code and the Code of Conduct. In addition to periodic reminders, the Company will also provide the Directors with updates on any changes to the Model Code and the Code of Conduct in order to ensure compliance and enhance their awareness of good corporate governance practices.
THE BOARDRoles and ResponsibilitiesThe Board, led by the chairman, Mr. WAN Long, determines and monitors Group-wide strategies and policies, annual budgets and business plans, evaluates the performance of the Company, and supervises the management of the Company.
* For identification purpose only

36 WH GROUP LIMITED ANNUAL REPORT 2019
Corporate Governance Report (Continued)
The Board, which is accountable to the Shareholders for the long-term performance of the Company, is responsible for directing the strategic objectives of the Company and overseeing the management of the business. The Directors are charged with the task of promoting the success of the Company and making decisions in the best interests of the Company. It meets these obligations by ensuring the maintenance of high standards of governance in all aspects of the Company’s business, setting the strategic direction for the Group and maintaining appropriate levels of review, challenge and guidance in its relationship with the Group’s management. It is also the ultimate decision-making body for all matters considered material to the Group and is responsible for ensuring that, as a collective body, it has the appropriate skills, knowledge and experience to perform its role effectively. Matters relating to the daily operations of the Group are delegated to the management. The delegated functions, power and work tasks are periodically reviewed to ensure that they remain appropriate.
Board CompositionThe Board members during the year ended December 31, 2019 and up to the date of this report are as follows:
Executive Directors:Mr. WAN Long (Chairman, Chief Executive Officer and Chairman of the Nomination
Committee, the Food Safety Committee and the Risk Management Committee)
Mr. WAN Hongjian (Deputy Chairman, Vice President and member of the Environmental, Social and Governance Committee and the Food Safety Committee)
Mr. GUO Lijun (Executive Vice President, Chief Financial Officer, Chairman of the Environmental, Social and Governance Committee and member of the Risk Management Committee)
Mr. SULLIVAN Kenneth Marc (President and Chief Executive Officer of Smithfield, and member of the Environmental, Social and Governance Committee, the Food Safety Committee and the Risk Management Committee)
Mr. MA Xiangjie (President of Shuanghui Development and member of the Risk Management Committee)
Non-executive Director:Mr. JIAO Shuge (Member of the Remuneration Committee)
Independent non-executive Directors:Mr. HUANG Ming (Chairman of the Remuneration Committee, and member of the Audit
Committee and the Nomination Committee)Mr. LEE Conway Kong Wai (Chairman of the Audit Committee, and member of the Remuneration
Committee, the Food Safety Committee and the Risk Management Committee)
Mr. LAU, Jin Tin Don (Member of the Audit Committee, the Nomination Committee and the Environmental, Social and Governance Committee)
The members of the Board represent a wide background and rich industry experience with appropriate professional qualifications. Please refer to the section headed “Biographies of Directors and Senior Management” for the profiles of the Directors.
Save as disclosed in the section headed “Biographies of Directors and Senior Management”, the Directors have no other financial, business, family or other material/relevant relationships with one another.

37ANNUAL REPORT 2019 WH GROUP LIMITED
Corporate Governance Report (Continued)
(i) Chairman and Chief Executive OfficerThe roles of the chairman and the chief executive officer of the Company are served by Mr. WAN Long and have not been segregated as required under code A.2.1 of the CG Code. The Company considers that having Mr. WAN Long acting as both the Chairman and Chief Executive Officer of the Company will provide a strong and consistent leadership to the Company and allow for more effective planning and management of the Company. Further, in view of Mr. WAN Long’s extensive experience in the industry, personal profile and role in the Group and the historical development of the Group, the Board considers it is beneficial to the business prospects of the Group that Mr. WAN Long continues to act as both the Chairman and Chief Executive Officer of the Company.
(ii) Non-executive Director and independent non-executive DirectorsDuring the Review Period, the Board had three independent non-executive Directors, being one-third of the Board and at all times met the requirements of the Listing Rules relating to the appointment of at least three independent non-executive Directors with one of them possessing appropriate professional qualifications or accounting or related financial management expertise.
The Company has received annual confirmations from each of the three independent non-executive Directors in respect of their independence pursuant to Rule 3.13 of the Listing Rules. The Company considers that all the independent non-executive Directors are independent in accordance with Rule 3.13 of the Listing Rules.
Appointment, re-election and removal of DirectorsThe Company uses a formal and transparent procedure for the appointment of new Directors. Recommendations for the appointment of new Directors are received by the Board from the Nomination Committee. The Board then deliberates over such recommendations prior to approval.
The non-executive Director and independent non-executive Directors have been appointed for a specific term of three years, subject to re-nomination and re-election as required by the Articles of Association or pursuant to the Listing Rules at the general meetings of the Company.
MeetingsThe Board meets on a regular basis, and on an ad hoc basis, as required by business needs. During the Review Period, the Board convened five (5) meetings to approve interim and annual results announcements and financial reports, to recommend or declare dividends and to discuss the overall strategy and monitor financial and operation performance of the Company.
Apart from regular Board meetings, the Chairman of the Board also held a meeting with all independent non-executive Directors and non-executive Director, without presence of the other executive Directors.

38 WH GROUP LIMITED ANNUAL REPORT 2019
Corporate Governance Report (Continued)
The attendance of each individual Director at the Board meetings, Board Committees meetings, annual general meeting and extraordinary general meeting during the Review Period is set out in the following table:
Number of meetings attend/held
DirectorsBoard
Meeting
Audit Committee
Meeting
Remuneration Committee
Meeting
Nomination Committee
Meeting
Environmental, Social and
Governance Committee
Meeting
Food Safety Committee
Meeting
Risk Management
Committee Meeting
Annual General Meeting
Extraordinary General Meeting
WAN Long 5/5 N/A N/A 1/1 N/A 2/2 1/1 1/1 N/AWAN Hongjian 5/5 N/A N/A N/A 2/2 2/2 N/A 1/1 N/AGUO Lijun 5/5 N/A N/A N/A 2/2 N/A 1/1 1/1 N/ASULLIVAN Kenneth Marc 5/5 N/A N/A N/A 2/2 2/2 1/1 0/1 N/AMA Xiangjie 5/5 N/A N/A N/A N/A N/A 1/1 0/1 N/AJIAO Shuge 5/5 N/A 1/1 N/A N/A N/A N/A 0/1 N/AHUANG Ming 5/5 3/3 1/1 1/1 N/A N/A N/A 0/1 N/ALEE Conway Kong Wai 5/5 3/3 1/1 N/A N/A 1/2 0/1 1/1 N/ALAU, Jin Tin Don 5/5 3/3 N/A 1/1 2/2 N/A N/A 1/1 N/A
Training for DirectorsUpon appointment to the Board, Directors receive a package of orientation materials on the Group and are provided with a comprehensive induction to the Group’s businesses by senior executives.
All newly appointed Directors have received the induction programme and briefing on director’s duties and obligations on corporate governance and regulating requirements prepared and delivered by our external legal advisor immediately prior to or on their respective date of appointment.
The Company arranges and provides continuous professional development (“CPD”) training and relevant reading materials to Directors to help ensure that they are apprised of the latest changes in the commercial, legal and regulatory environment in which the Group conducts its businesses and to refresh their knowledge and skills on the roles, functions and duties of a listed company director. In addition, attendance at external forums or briefing sessions (including delivery of speeches) on the relevant topics also counts toward CPD training.
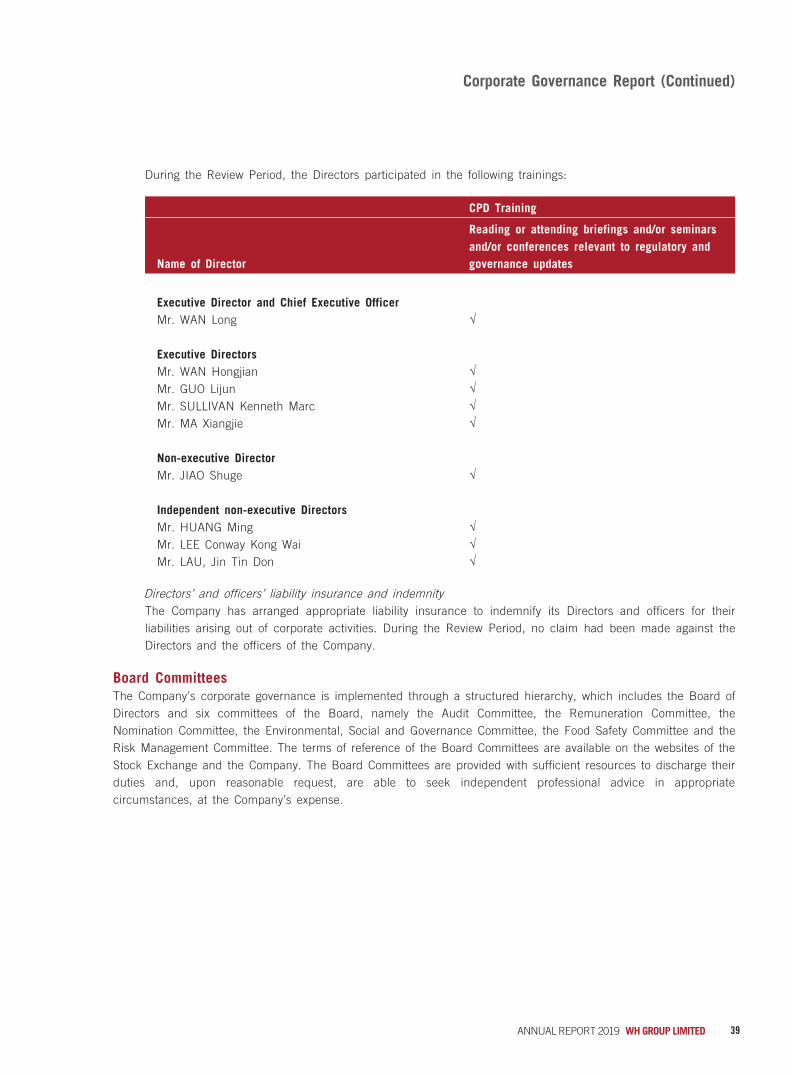
39ANNUAL REPORT 2019 WH GROUP LIMITED
Corporate Governance Report (Continued)
During the Review Period, the Directors participated in the following trainings:
CPD Training
Name of Director
Reading or attending briefings and/or seminars and/or conferences relevant to regulatory and governance updates
Executive Director and Chief Executive OfficerMr. WAN Long √
Executive DirectorsMr. WAN Hongjian √Mr. GUO Lijun √Mr. SULLIVAN Kenneth Marc √Mr. MA Xiangjie √
Non-executive DirectorMr. JIAO Shuge √
Independent non-executive DirectorsMr. HUANG Ming √Mr. LEE Conway Kong Wai √Mr. LAU, Jin Tin Don √
Directors’ and officers’ liability insurance and indemnityThe Company has arranged appropriate liability insurance to indemnify its Directors and officers for their liabilities arising out of corporate activities. During the Review Period, no claim had been made against the Directors and the officers of the Company.
Board CommitteesThe Company’s corporate governance is implemented through a structured hierarchy, which includes the Board of Directors and six committees of the Board, namely the Audit Committee, the Remuneration Committee, the Nomination Committee, the Environmental, Social and Governance Committee, the Food Safety Committee and the Risk Management Committee. The terms of reference of the Board Committees are available on the websites of the Stock Exchange and the Company. The Board Committees are provided with sufficient resources to discharge their duties and, upon reasonable request, are able to seek independent professional advice in appropriate circumstances, at the Company’s expense.

40 WH GROUP LIMITED ANNUAL REPORT 2019
Corporate Governance Report (Continued)
The Board is collectively responsible for performing corporate governance duties including:
(a) to develop, review and implement the Company’s policy and practices on corporate governance;
(b) to review and monitor the training and continuous professional development of directors and senior management;
(c) to review and monitor the Company’s policies and practices on compliance with legal and regulatory requirements;
(d) to develop, review and monitor the Code of Conduct applicable to employees and directors; and
(e) to review the Company’s compliance with the CG Code which is amended from time to time, and its disclosure in the corporate governance report.
Further details of the roles and functions of the Board Committees are set out below.
Audit CommitteeThroughout the Review Period, the Audit Committee comprised three independent non-executive Directors, namely Mr. LEE Conway Kong Wai, Mr. HUANG Ming and Mr. LAU, Jin Tin Don. Mr. LEE Conway Kong Wai, who has professional qualifications in accountancy, is the chairman of the Audit Committee. The Audit Committee held three (3) meetings during the Review Period. Executive Directors, senior management and the external auditor of the Company were invited to join the discussions at the meetings.
The primary duties performed by the Audit Committee during the Review Period were the oversight of the Group’s financial reporting system and internal control procedures, monitoring the integrity of the preparation of the Company’s financial information including quarterly, interim and annual results of the Group, reviewing the Group’s financial and accounting policies and practices and monitoring the effectiveness of the internal audit function. The Audit Committee also provided oversight for and management of the relationship with the Group’s external auditor, including reviewing and monitoring the external auditor’s independence and objectivity and the effectiveness of the audit process in accordance with applicable standards.
Remuneration CommitteeThroughout the Review Period, the Remuneration Committee comprised three members, being two independent non-executive Directors, namely Mr. HUANG Ming (the chairman of the committee) and Mr. LEE Conway Kong Wai, and one non-executive Director, namely Mr. JIAO Shuge. The Remuneration Committee held one (1) meeting during the Review Period to review the remuneration packages and overall benefits for the Directors and senior management of the Company.
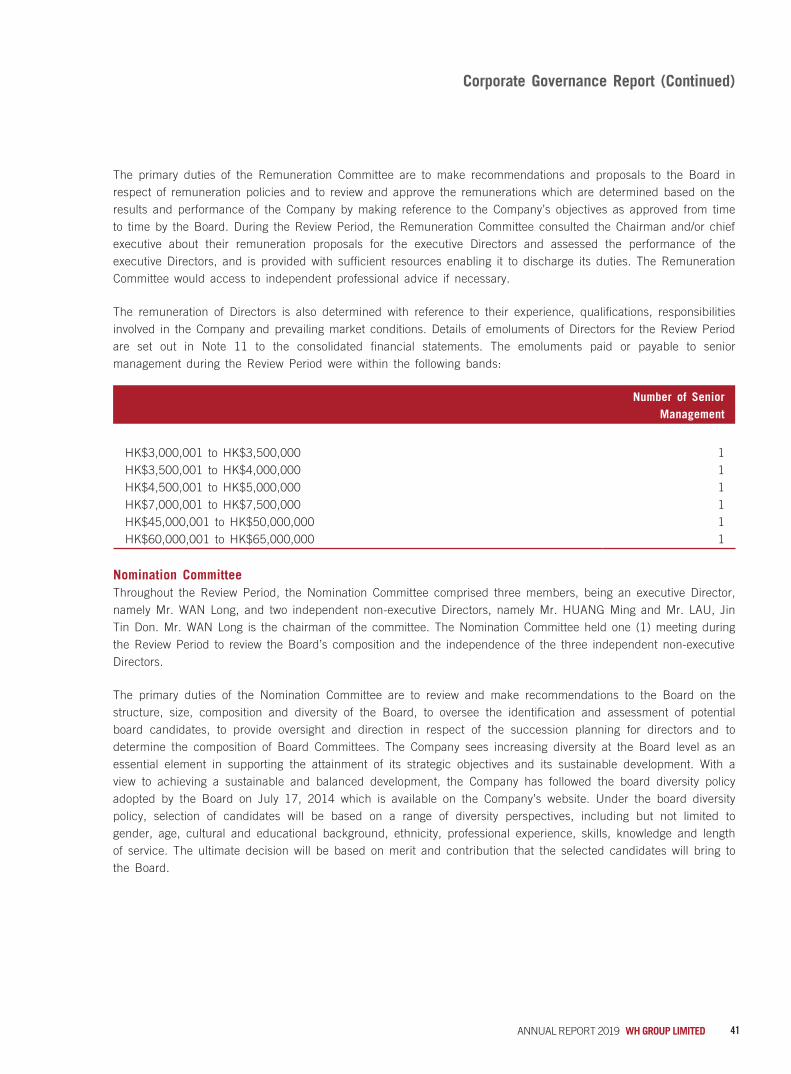
41ANNUAL REPORT 2019 WH GROUP LIMITED
Corporate Governance Report (Continued)
The primary duties of the Remuneration Committee are to make recommendations and proposals to the Board in respect of remuneration policies and to review and approve the remunerations which are determined based on the results and performance of the Company by making reference to the Company’s objectives as approved from time to time by the Board. During the Review Period, the Remuneration Committee consulted the Chairman and/or chief executive about their remuneration proposals for the executive Directors and assessed the performance of the executive Directors, and is provided with sufficient resources enabling it to discharge its duties. The Remuneration Committee would access to independent professional advice if necessary.
The remuneration of Directors is also determined with reference to their experience, qualifications, responsibilities involved in the Company and prevailing market conditions. Details of emoluments of Directors for the Review Period are set out in Note 11 to the consolidated financial statements. The emoluments paid or payable to senior management during the Review Period were within the following bands:
Number of Senior Management
HK$3,000,001 to HK$3,500,000 1HK$3,500,001 to HK$4,000,000 1HK$4,500,001 to HK$5,000,000 1HK$7,000,001 to HK$7,500,000 1HK$45,000,001 to HK$50,000,000 1HK$60,000,001 to HK$65,000,000 1
Nomination CommitteeThroughout the Review Period, the Nomination Committee comprised three members, being an executive Director, namely Mr. WAN Long, and two independent non-executive Directors, namely Mr. HUANG Ming and Mr. LAU, Jin Tin Don. Mr. WAN Long is the chairman of the committee. The Nomination Committee held one (1) meeting during the Review Period to review the Board’s composition and the independence of the three independent non-executive Directors.
The primary duties of the Nomination Committee are to review and make recommendations to the Board on the structure, size, composition and diversity of the Board, to oversee the identification and assessment of potential board candidates, to provide oversight and direction in respect of the succession planning for directors and to determine the composition of Board Committees. The Company sees increasing diversity at the Board level as an essential element in supporting the attainment of its strategic objectives and its sustainable development. With a view to achieving a sustainable and balanced development, the Company has followed the board diversity policy adopted by the Board on July 17, 2014 which is available on the Company’s website. Under the board diversity policy, selection of candidates will be based on a range of diversity perspectives, including but not limited to gender, age, cultural and educational background, ethnicity, professional experience, skills, knowledge and length of service. The ultimate decision will be based on merit and contribution that the selected candidates will bring to the Board.

42 WH GROUP LIMITED ANNUAL REPORT 2019
Corporate Governance Report (Continued)
The Nomination Committee’s procedures and criteria for selecting and making recommendations for appointment of Board members are designed to satisfy high standards of corporate governance. In identifying suitable candidates, the Nomination Committee shall consider candidates on merit and against the objective criteria, with due regard for the benefits of diversity on the Board. The factors considered by the Nomination Committee in assessing the suitability of a proposed candidate include: (i) reputation for integrity; (ii) accomplishment and professional knowledge and industry experience which may be relevant to the Group; (iii) commitment in respect of available time, interest and attention to the businesses of the Group; (iv) perspectives, skills and experience that the individual can bring to the Board; (v) diversity in all its aspects, including but not limited to gender, age, cultural and educational background, ethnicity, professional experience, skills, knowledge and length of service; (vi) Board succession planning considerations and long term objectives of the Group; and (vii) in case of a candidate for independent non-executive Director, the independence of such candidate with reference to, among other things, the requirements as set out in Rule 3.13 of the Listing Rules. These processes meet or exceed the Stock Exchange’s requirements to ensure that every Director has the requisite character, experience and integrity and is able to demonstrate a standard of competence, commensurate with his position as a director of a listed issuer, and that where nomination of independent non-executive Directors is under consideration, the requirements of Rule 3.13 of the Listing Rules are satisfied.
Environmental, Social and Governance CommitteeThroughout the Review Period, the Environmental, Social and Governance Committee comprised four members, being three executive Directors, namely Mr. GUO Lijun (the chairman of the committee), Mr. WAN Hongjian and Mr. SULLIVAN Kenneth Marc and one independent non-executive Director, namely Mr. LAU, Jin Tin Don. The Environmental, Social and Governance Committee held two (2) meetings during the Review Period to review the environmental, social and governance matters which are relevant and material to the operations of the Group.
The primary duties of the Environmental, Social and Governance Committee include, but are not limited to, the following:
(i) identifying the environmental, social and governance matters that are relevant and material to the operations of our Group and/or that affect shareholders and other key stakeholders (the “Key ESG Matters”), which shall include workplace quality, environmental protection, operating practices, community involvement and animal welfare;
(ii) reviewing and making recommendations to the Board on the effectiveness of the Key ESG Matters;
(iii) monitoring the standards set and performance achieved on the Key ESG Matters by our Group; and
(iv) identifying and engaging stakeholders to understand and responding to their views by appropriate means.
The Group has a heritage of commitment to the local communities in which it conducts business and is committed to the long-term sustainability of the business. The Environmental, Social and Governance Committee will continue to formulate guidelines and initiatives that can be implemented on a Group-wide level.

43ANNUAL REPORT 2019 WH GROUP LIMITED
Corporate Governance Report (Continued)
Food Safety CommitteeThroughout the Review Period, the Food Safety Committee comprised four members, being three executive Directors, namely Mr. WAN Long (the chairman of the committee), Mr. WAN Hongjian and Mr. SULLIVAN Kenneth Marc and one independent non-executive Director, namely Mr. LEE Conway Kong Wai. The Food Safety Committee held two (2) meetings to consider the effective control over food quality and safety matters during the Review Period.
The primary duties of the Food Safety Committee include, but are not limited to, the following:
(i) making recommendations to the Board on our policies, practices and performance in relation to food quality and safety to comply with the relevant laws and regulations; and
(ii) assessing, reviewing, monitoring and making recommendations to the Board on the food safety internal control standards and our Group’s products traceability capabilities.
Risk Management CommitteeThroughout the Review Period, the Risk Management Committee comprised five members, being four executive Directors, namely Mr. WAN Long (the chairman of the committee), Mr. GUO Lijun, Mr. SULLIVAN Kenneth Marc and Mr. MA Xiangjie, and one independent non-executive Director, namely Mr. LEE Conway Kong Wai. The Risk Management Committee held one (1) meeting during the Review Period.
The primary duties of the Risk Management Committee include, but are not limited to, the following:
(i) establishing and overseeing the risk management system, through which the Risk Management Committee considers and formulates risk management framework and to provide guidelines to the management on risk management by setting up procedures to identify, assess and manage material risks faced by our Group, including but not limited to strategic, financial, operational, legal and regulatory risks;
(ii) reviewing and assessing regularly the adequacy and effectiveness of our Group’s risk management framework, internal control systems relating to risk management and risk management policies and procedures in order to identify, assess and manage risks, as well as to oversee and ensure their effective operation, implementation and maintenance;
(iii) considering major investigation findings on risk management and internal control matters as delegated by the Board or on its own initiative and management’s response to these findings; and
(iv) reporting any significant risk management issues to the Board and make recommendations and solutions on improvement of the Company’s compliance and risk management.
44 WH GROUP LIMITED ANNUAL REPORT 2019
Corporate Governance Report (Continued)
Company SecretaryThe company secretary of the Company (the “Company Secretary”) is accountable to the Board for ensuring that board procedures comply with all applicable laws, rules and regulations and advising the Board on corporate governance matters. The Company Secretary is responsible for keeping all Directors updated on the Listing Rules, regulatory requirements, as well as internal codes of conduct of the Company.
The Company Secretary is also directly responsible for the Groups’ compliance with all obligations of the Listing Rules and Codes on Takeovers and Mergers and Share Buy-backs, including the preparation, publication and despatch of annual reports and interim reports within the time limits laid down in the Listing Rules, and the timely dissemination to Shareholders and the market of information relating to the Group.
During the Review Period, the Company Secretary has taken not less than 15 hours of relevant professional training.
Accountability and AuditThe Directors acknowledged their responsibility to prepare the accounts and to present a balanced, clear and understandable assessment in the consolidated financial statements of the annual and interim reports, other inside information announcements and other financial disclosures required under the Listing Rules, and to report to regulators as well as to disclose information required pursuant to statutory requirements. When the Directors were aware of material uncertainties relating to events or conditions that might cast significant doubt upon the Company’s ability to continue as a going concern, such uncertainties would be clearly and prominently set out and discussed in detail in this Corporate Governance Report.
The statement of the independent auditor of the Company about their reporting responsibilities and opinion on the financial statements of the Company for the year ended December 31, 2019 is set out in the independent auditor’s report on pages 59 to 62 of this report.
Risk Management and Internal ControlThe Board has the ultimate responsibility for oversight of the risk management and internal control systems of the Group. The Board has delegated oversight to the Risk Management Committee and Audit Committee to oversee the Group’s risk management and internal control systems respectively on an ongoing basis, and conduct reviews of the effectiveness of the Group’s risk management and internal control systems, as well as to resolve material internal control defects. The aforementioned systems are designed to manage rather than eliminate the risk of failure to achieve business objectives, and can only provide reasonable and not absolute assurance against material misstatement or loss.
The risk management system of the Group is designed to assist the Group in implementing a sound and consistent risk management and reporting process across the Group. The Group’s risk management department reviewed the effectiveness of risk management process and risk management report submitted by management. Key risks and mitigation measures were reported to the Risk Management Committee, in which it oversaw the development and implementation of the Group’s risk management system.

45ANNUAL REPORT 2019 WH GROUP LIMITED
Corporate Governance Report (Continued)
The internal controls of the Group are designed to assist the Group in protecting its assets and information. The presence of internal controls empowers the Group to implement best business practices in challenging business environments. The Group’s internal controls cover a number of in-house procedures and policies comprising, among others, the relevant financial, operational and compliance controls and risk management functions. The Group’s risk management department carried out risk-based audits and reported key findings and management action plans to the Audit Committee, in which it would review the Group’s risk management and internal control system and reported twice a year to the Board. Such review had been conducted during the Review Period. In addition, the Group conducted enterprise risk assessments to analyze and report key risks, followed by the establishment of respective mitigation controls during 2019. An opinion on the effectiveness of the enterprise risk management (the “ERM”) system of the Company was submitted to the Risk Management Committee, which considers that the ERM system of the Group is effectively in place.
The Board considered the Group’s risk management and internal control systems are effective and adequate.
Independent AuditorThe Group’s independent auditor for the Review Period is Ernst & Young. It was responsible for auditing and forming an independent opinion on the Group’s annual consolidated financial statements.
The Audit Committee reviews and monitors the external auditor’s independence and objectivity and effectiveness of the audit process. It receives each year a report from the external auditor confirming its independence and objectivity and holds meetings with representatives of the external auditor to consider the scope of its audit, approve its fees, and the scope and appropriateness of non-audit services, if any, to be provided by it. The Audit Committee also makes recommendations to the Board on the appointment and retention of the external auditor.
Auditors’ RemunerationDuring the Review Period, the total fees paid/payable in respect of services provided by the Group’s external auditors are set out below:
Services rendered Fees paid/payable(US$ million)
Audit services 4Non-audit services (Note) 1
Note: Non-audit services mainly represent taxation and other advisory services.
Shareholders’ Rights and CommunicationAs one of the measures to safeguard Shareholders’ interests and rights, separate resolutions are proposed at Shareholders’ meetings on every substantial matter, including the election of individual Directors, for Shareholders’ consideration and voting. Furthermore, the Company regards the annual general meeting and extraordinary general meetings as important events and Directors, chairman of each Board Committee, senior management and external auditors make an effort to attend the annual general meeting and extraordinary general meetings of the Company to address Shareholders’ queries. All resolutions proposed at Shareholders’ meetings will be voted on by poll. The poll voting results will be posted on the websites of the Stock Exchange (www.hkexnews.hk) and the Company (www.wh-group.com) on the same day of the relevant general meetings.

46 WH GROUP LIMITED ANNUAL REPORT 2019
Corporate Governance Report (Continued)
Extraordinary general meeting may be convened by the Board on requisition of Shareholders holding not less than one-tenth of the paid up capital of the Company pursuant to Article 12.3 of the Articles of Association. Such requisition must specify the objects of the meeting and signed by requisitionists and deposited at the principal office of the Company or the Company’s registered office in Hong Kong. Shareholders should follow the requirements and procedures as set out in such Article for convening an extraordinary general meeting.
Shareholders have the right to put enquiries to the Board. All enquiries shall be in writing and sent by post to the principal office of the Company in Hong Kong for the attention of the Company Secretary.
The Company adheres to high standards with respect to the disclosure of its financial statements. The Company is committed to maximizing the use of its website as a channel to provide updated information in a timely manner and strengthen the communication with both the Shareholders and the public.
Investors RelationsThe Company has maintained a continuing dialogue with the Company’s Shareholders and investors through various channels, including, among others, the Company’s interim and annual reports, notices, announcements, corporate governance practice and the Company’s website at www.wh-group.com. The Company also holds press conferences from time to time at which the executive Directors and senior management of the Group are available to answer questions regarding the Group’s business and performance.
Constitutional DocumentsThere was no change to the Company’s memorandum and Articles of Association during the Review Period. A copy of the Company’s memorandum and Articles of Association is available on the websites of the Company and the Stock Exchange.

DIRECTORS’ REPORT
47ANNUAL REPORT 2019 WH GROUP LIMITED
The Board is pleased to present its report and the audited financial statements of the Group for the year ended December 31, 2019.
Principal Activities and Analysis of OperationsThe principal activity of the Company is investment holding. The Group is the world’s largest pork company, with global leadership across key segments of the industry value chain, including packaged meats, fresh pork and hog production.
Principal Risks and UncertaintiesThe principal risks and uncertainties facing the Company are set out in the sections headed “Business Review” and “Financial Review” of this report.
Business ReviewA business review of the Group is set out on pages 16 to 25 of this report.
ResultsResults of the Group for the year ended December 31, 2019 are set out in the consolidated statement of profit or loss and other comprehensive income on pages 63 to 64 of this report.
DividendsThe Board has proposed to recommend the payment of a final dividend of HK$0.265 per Share (2018: HK$0.15 per Share) in cash to the Shareholders for the year ended December 31, 2019. Taking into account of the interim dividend of HK$0.05 per Share paid on October 4, 2019, total dividend for the year ended December 31, 2019 will be HK$0.315 per Share (2018: HK$0.20 per Share), representing a total payment of approximately HK$4,638 million, or an equivalent to US$595 million (2018: approximately HK$2,940 million, or an equivalent to US$375 million). The final dividend is subject to approval of the Shareholders at the forthcoming AGM to be held on Tuesday, June 2, 2020 (the “2020 AGM”).
Upon the Shareholders’ approval being obtained at the 2020 AGM, the final dividend will be payable on or around July 6, 2020 to the Shareholders whose names appear on the register of members of the Company on Monday, June 8, 2020.
Book Closure of Register of MembersFor the purpose of ascertaining the Shareholders’ entitlement to the proposed final dividend, the register of members of the Company will be closed from Tuesday, June 9, 2020 to Thursday, June 11, 2020, both days inclusive, during which period no transfer of Shares of the Company will be registered. In order to qualify for the proposed final dividend, all transfers of Shares of the Company accompanied by the relevant share certificates and appropriate transfer forms must be lodged for registration with the Company’s branch share registrar in Hong Kong, Computershare Hong Kong Investor Services Limited at Shops 1712–1716, 17th Floor, Hopewell Centre, 183 Queen’s Road East, Wan Chai, Hong Kong not later than 4:30 p.m. on Monday, June 8, 2020.
48 WH GROUP LIMITED ANNUAL REPORT 2019
Directors’ Report (Continued)
Dividend PolicyThe declaration, payment and amount of dividends we pay are subject to the discretion of our Directors and depend on our financial condition, earnings and capital requirements as well as contractual and legal restrictions and our ability to receive dividend payments from our subsidiaries in addition to other factors. Subject to the factors described above, our Directors expect that, in the future, interim and final dividends will be paid from time to time in an aggregate amount of no less than 30% of profits attributable to the equity holders of the parent (i.e., net profit). Cash dividends on the Shares, if any, will be paid in Hong Kong dollars. Other distributions, if any, will be paid to the Shareholders by any means our Directors deem legal, fair and practical.
Share Premium and ReservesMovements in the share premium and reserves of the Group during the Review Period are set out on page 67 to the consolidated statement of changes in equity.
Distributable ReservesThe Company’s total distributable reserves as at December 31, 2019 amounted to US$4,703 million.
DonationsThe Group attaches great importance to the establishment of a friendly and harmonious relationship between the Group and the community and actively communicates with the community and gives back to it through donations and volunteer service. During the Review Period, charitable donations made by the Group amounted to US$31 million.
Property, Plant and EquipmentDetails of the movements in property, plant and equipment of the Group are set out in Note 15 to the consolidated financial statements.
Share CapitalMovements in the share capital of the Company during the Review Period and as at December 31, 2019 are set out in Note 38 to the consolidated financial statements.
Borrowings and Capitalisation of InterestsDetails of borrowings are set out in Note 32 to the consolidated financial statements. Details of the Group’s capitalised interest expenses and other borrowing costs during the Review Period are set out in Note 9 to the consolidated financial statements.
Compliance with Relevant Laws and RegulationsAs far as the Board and the management are aware, the Group has complied in material respects with the relevant laws and regulations that have a significant impact on the business and operation of the Group. During the Review Period, there was no material breach of or non-compliance with the applicable laws and regulations by the Group.
Relationship with Employees, Customers and SuppliersThe Group understands the importance of maintaining a good relationship with its employees, customers and suppliers to meet its immediate and long-term business goals. During the Review Period, there was no material and significant dispute between the Group and its employees, customers and suppliers.

49ANNUAL REPORT 2019 WH GROUP LIMITED
Directors’ Report (Continued)
Remuneration Policy and Retirement Benefits of the GroupFor remuneration policy of the Group, please see the section headed “Human Resources” of the section headed “Financial Review”.
The Group entities which operate in U.S. provide pension benefits for all their qualified employees, through defined benefit pension plans. The most recent actuarial valuations of plan assets and the present value of the defined benefit obligation were carried out as of December 31, 2019 by credentialed actuaries, Mercer (US), Inc., who meet the Qualification Standards of the American Academy of Actuaries. As of December 31, 2019, the fair value of plan assets was approximately 76.2% of our pension benefits obligations under such defined benefits plans. Given the foregoing, we have met or exceeded our funding requirements for our obligations under such defined benefits plans as required by the relevant U.S. regulations for the year ended December 31, 2019.
Please see Note 35 to the consolidated financial statements contained herein for further details relating to such defined benefits plans and the Group’s other retirement benefits plans.
Basis of Determining Remuneration to DirectorsApart from benchmarking against the market, the Company looks at individual competence and contributions and the affordability of the Company in determining the exact level of remuneration for each Director. Appropriate benefits schemes are in place for the executive Directors, including the share option scheme, same as those offered to other employees of the Group.
Financial ReviewThe results highlights of the Group is set out on page 4 of this report, while a financial review of the Group is set out on pages 16 to 25 of this report.
Purchase, Sale or Redemption of the Company’s Listed SecuritiesNeither the Company nor any of its subsidiaries had purchased, sold or redeemed any of the Company’s listed securities during the Review Period.
DirectorsCertain information on the members of the Board during the Review Period and up to the date of this report is set out on page 36 of this report.
In accordance with Article 16.18 of the Articles of Association, Mr. JIAO Shuge, Mr. HUANG Ming and Mr. LAU, Jin Tin Don shall retire by rotation and, being eligible, offer themselves for re-election at the 2020 AGM.
Brief biographical details of the Directors and senior management are set out on pages 8 to 15 of this report.
Directors’ Service ContractsNone of the Directors who is proposed for re-election at the 2020 AGM has a service contract with any member of the Group which is not determinable by the Group within one year without the payment of compensation (other than statutory compensation).
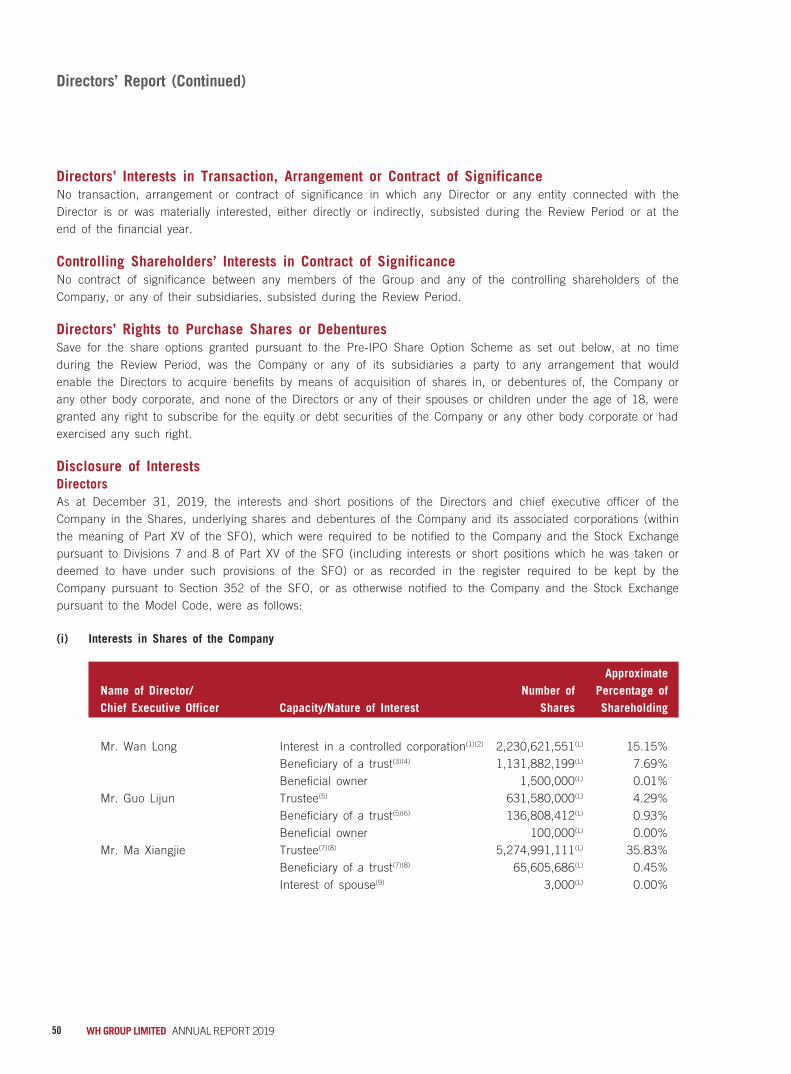
50 WH GROUP LIMITED ANNUAL REPORT 2019
Directors’ Report (Continued)
Directors’ Interests in Transaction, Arrangement or Contract of SignificanceNo transaction, arrangement or contract of significance in which any Director or any entity connected with the Director is or was materially interested, either directly or indirectly, subsisted during the Review Period or at the end of the financial year.
Controlling Shareholders’ Interests in Contract of SignificanceNo contract of significance between any members of the Group and any of the controlling shareholders of the Company, or any of their subsidiaries, subsisted during the Review Period.
Directors’ Rights to Purchase Shares or DebenturesSave for the share options granted pursuant to the Pre-IPO Share Option Scheme as set out below, at no time during the Review Period, was the Company or any of its subsidiaries a party to any arrangement that would enable the Directors to acquire benefits by means of acquisition of shares in, or debentures of, the Company or any other body corporate, and none of the Directors or any of their spouses or children under the age of 18, were granted any right to subscribe for the equity or debt securities of the Company or any other body corporate or had exercised any such right.
Disclosure of InterestsDirectorsAs at December 31, 2019, the interests and short positions of the Directors and chief executive officer of the Company in the Shares, underlying shares and debentures of the Company and its associated corporations (within the meaning of Part XV of the SFO), which were required to be notified to the Company and the Stock Exchange pursuant to Divisions 7 and 8 of Part XV of the SFO (including interests or short positions which he was taken or deemed to have under such provisions of the SFO) or as recorded in the register required to be kept by the Company pursuant to Section 352 of the SFO, or as otherwise notified to the Company and the Stock Exchange pursuant to the Model Code, were as follows:
(i) Interests in Shares of the Company
Name of Director/ Chief Executive Officer Capacity/Nature of Interest
Number of Shares
Approximate Percentage of Shareholding
Mr. Wan Long Interest in a controlled corporation(1)(2) 2,230,621,551(L) 15.15%Beneficiary of a trust(3)(4) 1,131,882,199(L) 7.69%Beneficial owner 1,500,000(L) 0.01%
Mr. Guo Lijun Trustee(5) 631,580,000(L) 4.29%Beneficiary of a trust(5)(6) 136,808,412(L) 0.93%Beneficial owner 100,000(L) 0.00%
Mr. Ma Xiangjie Trustee(7)(8) 5,274,991,111(L) 35.83%Beneficiary of a trust(7)(8) 65,605,686(L) 0.45%Interest of spouse(9) 3,000(L) 0.00%

51ANNUAL REPORT 2019 WH GROUP LIMITED
Directors’ Report (Continued)
Notes:(1) Mr. Wan Long owned Sure Pass as to 100%, which in turn owned 573,099,645 Shares. Accordingly, Mr. Wan Long was deemed to
be interested in the 573,099,645 Shares held by Sure Pass. Mr. Wan Long owned Xing Tong Limited as to 100%. Xing Tong Limited was one of the participants of the Heroic Zone Share Plan, through which it owned approximately 24.77% of the beneficial interest in Rise Grand, which in turn owned 100% of the equity interest of Heroic Zone.
(2) Mr. Wan Long was provisionally awarded 350,877,333 Shares under the 2013 Share Award Plan on April 28, 2017. The vesting of the aforementioned 350,877,333 Shares pursuant to the terms and conditions set out in the relevant award notice and under the rules of the 2013 Share Award Plan was completed on June 28, 2019.
(3) Mr. Wan Long was one of the participants of the Heroic Zone Share Plan, through which he held approximately 20.78% of the beneficial interest in Rise Grand, which in turn owned 100% of the equity interest of Heroic Zone. Accordingly, Mr. Wan Long was deemed to be interested in the 1,096,216,052 Shares which Heroic Zone was interested in.
(4) On December 23, 2019, the award and vesting of all the awarded shares, being 631,580,000 Shares, under the 2010 Share Award Plan was completed by way of the adoption of the Chang Yun Share Plan. Mr. Wan Long was awarded 35,666,147 Shares under the 2010 Share Award Plan and became a participant of the Chang Yun Share Plan, through which he held approximately 5.65% of the beneficial interest in Auspicious Joy, which in turn owned 100% of the equity interest of Chang Yun. Accordingly, Mr. Wan Long was deemed to be interested in the 35,666,147 Shares which Chang Yun was interested in.
(5) On December 23, 2019, the award and vesting of all the awarded shares, being 631,580,000 Shares, under the 2010 Share Award Plan was completed by way of the adoption of the Chang Yun Share Plan. Mr. Guo Lijun was awarded 47,484,457 Shares under the 2010 Share Award Plan and became a participant of the Chang Yun Share Plan, through which he held approximately 7.52% of the beneficial interest in Auspicious Joy, which in turn owned 100% of the equity interest of Chang Yun. Accordingly, Mr. Guo Lijun was deemed to be interested in the 47,484,457 Shares which Chang Yun was interested in. Messrs. Guo Lijun, Ma Xiangjie and Liu Songtao, were entrusted to act as the trustees of the Chang Yun Share Plan.
(6) Mr. Guo Lijun was one of the participants of the Heroic Zone Share Plan, through which he held approximately 1.69% of the beneficial interest in Rise Grand, which in turn owned 100% of the equity interest of Heroic Zone. Accordingly, Mr. Guo Lijun was deemed to be interested in the 89,323,955 Shares which Heroic Zone was interested in.
(7) Pursuant to an entrustment agreement dated November 5, 2019, the employee share committee, on behalf of all participants of the Heroic Zone Share Plan, entrusted three individual trustees, namely Messrs. Zhang Liwen, Ma Xiangjie and Liu Songtao, to hold the legal title of, and to exercise the voting rights attached to, 100% equity interest in Rise Grand in joint tenancy. Mr. Ma Xiangjie was also one of the participants of the Heroic Zone Share Plan, through which he held approximately 0.34% of the beneficial interest in Rise Grand, which in turn owned 100% of the equity interest of Heroic Zone. Accordingly, Mr. Ma Xiangjie was deemed to be interested in the 18,121,229 Shares which Heroic Zone was interested in.
(8) On December 23, 2019, the award and vesting of all the awarded shares, being 631,580,000 Shares, under the 2010 Share Award Plan was completed by way of the adoption of the Chang Yun Share Plan. Mr. Ma Xiangjie was awarded 47,484,457 Shares under the 2010 Share Award Plan and became a participant of the Chang Yun Share Plan, through which he held approximately 7.52% of the beneficial interest in Auspicious Joy, which in turn owned 100% of the equity interest of Chang Yun. Accordingly, Mr. MA Xiangjie was deemed to be interested in the 47,484,457 Shares which Chang Yun was interested in. Messrs. Guo Lijun, Ma Xiangjie and Liu Songtao, were entrusted to act as the trustees of the Chang Yun Share Plan.
(9) Ms. Shi Hui Ying is the spouse of Mr. Ma Xiangjie and was the beneficial owner of 3,000 Shares. Mr. Ma Xiangjie was deemed to be interested in such 3,000 Shares within the meaning of Part XV of the SFO.
(L) The letter (L) indicates long position.
(ii) Interests in underlying shares of the Company
Name of Director/ Chief Executive Officer Capacity/Nature of Interest
Number of Underlying
Shares subject to the Pre-IPO Share Options
Approximate Percentage of
Shareholding(1)
Mr. Wan Long Beneficial owner 146,198,889(L) 0.96%Mr. Guo Lijun Beneficial owner 40,000,000(L) 0.26%Mr. Sullivan Kenneth Marc Beneficial owner 12,000,000(L) 0.08%Mr. Ma Xiangjie Beneficial owner 9,922,417(L) 0.07%
Notes:(1) The percentage is for illustrative purpose only and is calculated based on the number of Shares in issue and assuming that all the
Pre-IPO Share Options have been exercised in full.(L) The letter (L) indicates long position.

52 WH GROUP LIMITED ANNUAL REPORT 2019
Directors’ Report (Continued)
(iii) Interests in associated corporations
Name of Director/ Chief Executive Officer
Name of Associated Corporation
Capacity/Nature of Interest
Number of Shares
Interested
Approximate Percentage of Shareholding
Mr. Wan Long Shuanghui Development
Beneficial owner 301,736(L) 0.01%
Mr. Ma Xiangjie Shuanghui Development
Interest of spouse(1) 16,350(L) 0.00%
Notes:(1) Ms. Shi Hui Ying is the spouse of Mr. Ma Xiangjie and was the beneficial owner of 16,350 shares of Shuanghui Development. Mr.
Ma Xiangjie was deemed to be interested in such 16,350 shares of Shuanghui Development within the meaning of Part XV of the SFO.
(L) The letter (L) indicates long position.
Save as disclosed above, as at December 31, 2019, so far as was known to any Director or chief executive officer of the Company, neither the Directors nor the chief executive officer had any interests or short positions in any Shares, underlying shares or debentures of the Company or any of its associated corporations (within the meaning of Part XV of SFO) which would fall to be disclosed to the Company under the provisions of Divisions 7 and 8 of Part XV of the SFO or as recorded in the register required to be kept by the Company pursuant to Section 352 of the SFO, or as otherwise notified to the Company and the Stock Exchange pursuant to the Model Code.

53ANNUAL REPORT 2019 WH GROUP LIMITED
Directors’ Report (Continued)
Substantial ShareholdersAs at December 31, 2019, so far as was known to any Director or chief executive officer of the Company, shareholders (other than the Director or chief executive of the Company whose interests were disclosed above) who had interests or short positions in the Shares or underlying shares of the Company which shall be disclosed to the Company pursuant to Divisions 2 and 3 of Part XV of the SFO or recorded in the register required to be kept by the Company pursuant to Section 336 of the SFO were as follows:
Interest in the Shares of the Company
Name Capacity/Nature of InterestNumber of
Shares
Approximate Percentage of Shareholding
Rise Grand(1) Interest in controlled corporation 5,274,991,111(L) 35.83%Mr. Zhang Liwen(1) Trustee 5,274,991,111(L) 35.83%Mr. Liu Songtao(1) Trustee 5,274,991,111(L) 35.83%Heroic Zone(2) Beneficial owner 3,473,820,000(L) 23.60%
Interest in controlled corporation 1,801,171,111(L) 12.24%Xing Tong Limited(3) Beneficiary of a trust 1,306,644,573(L) 8.88%Ms. Wang Meixiang (王梅香)(4) Interest of spouse 3,510,202,639(L) 23.85%
Notes:(1) Rise Grand, as the sole shareholder of Heroic Zone, was deemed to be interested in the 5,274,991,111 Shares held by Heroic Zone. As of
December 31, 2019, the beneficial interest of Rise Grand was owned by 218 participants (the “HSP Participants”) of the Heroic Zone Share Plan. Pursuant to an entrustment agreement dated November 5, 2019, the employee share committee (the “ESC”), on behalf of all HSP Participants, entrusted three individual trustees, namely Messrs. Zhang Liwen, Ma Xiangjie and Liu Songtao, to hold the legal title of, and to exercise the voting rights attached to, 100% equity interest in Rise Grand in joint tenancy (the “HSP Trustees”). Under the Heroic Zone Share Plan, the ESC, on behalf of all HSP Participants, is entitled to instruct the HSP Trustees as to how to exercise their rights as the registered shareholders of Rise Grand, which in turn will instruct Heroic Zone, a wholly owned subsidiary of Rise Grand, as to how to exercise its rights, including the voting rights attached to the Shares it holds in the Company. The members of the ESC are selected by the general meeting of the HSP participants. The ESC has been composed of five members since its establishment. For further details of the Heroic Zone Share Plan, please see the section headed “History, Development and Corporate Structure — Shareholding Changes — Shareholding Structure at Beginning of Track Record Period” of the Prospectus.
(2) Chang Yun, High Zenith, Sure Pass and Rich Matrix should exercise the voting rights attached to their Shares respectively held by them in accordance with the direction of Heroic Zone in its absolute discretion. Therefore, Heroic Zone was deemed to be interested in the 1,801,171,111 Shares in aggregate held by Chang Yun, High Zenith, Sure Pass and Rich Matrix. For further details of the voting rights of Chang Yun, High Zenith, Sure Pass and Rich Matrix, please see the sections headed “History, Development and Corporate Structure — Our History — History of Our PRC Business — Share issuance and Transfer to Chang Yun” and “History, Development and Corporate Structure — Shareholding Changes — Shareholding Changes During Track Record Period — High Zenith” of the Prospectus and the sections headed “Directors’ Report — 2010 Share Award Plan” and “Directors’ Report — 2013 Share Award Plan” of this report.
(3) Xing Tong Limited was one of the participants of the Heroic Zone Share Plan, through which it owned approximately 24.77% of the beneficial interest in Rise Grand, which in turn owned 100% of the equity interest of Heroic Zone. Accordingly, Xing Tong Limited was deemed to be interested in the 1,306,644,573 Shares which Heroic Zone was interested in.
(4) Ms. Wang Meixiang is the spouse of Mr. Wan Long. Therefore, Ms. Wang Meixiang was deemed to have interest in the 3,510,202,639 Shares which Mr. Wan Long was interested in.
(L) The letter (L) indicates long position.
Save as disclosed above, as at December 31, 2019, the Company has not been notified by any person who had any interests or short positions in the Shares or underlying shares of the Company which would fall to be disclosed to the Company under the provisions of Divisions 2 and 3 of Part XV of the SFO or which were recorded in the register required to be kept by the Company under section 336 of the SFO.
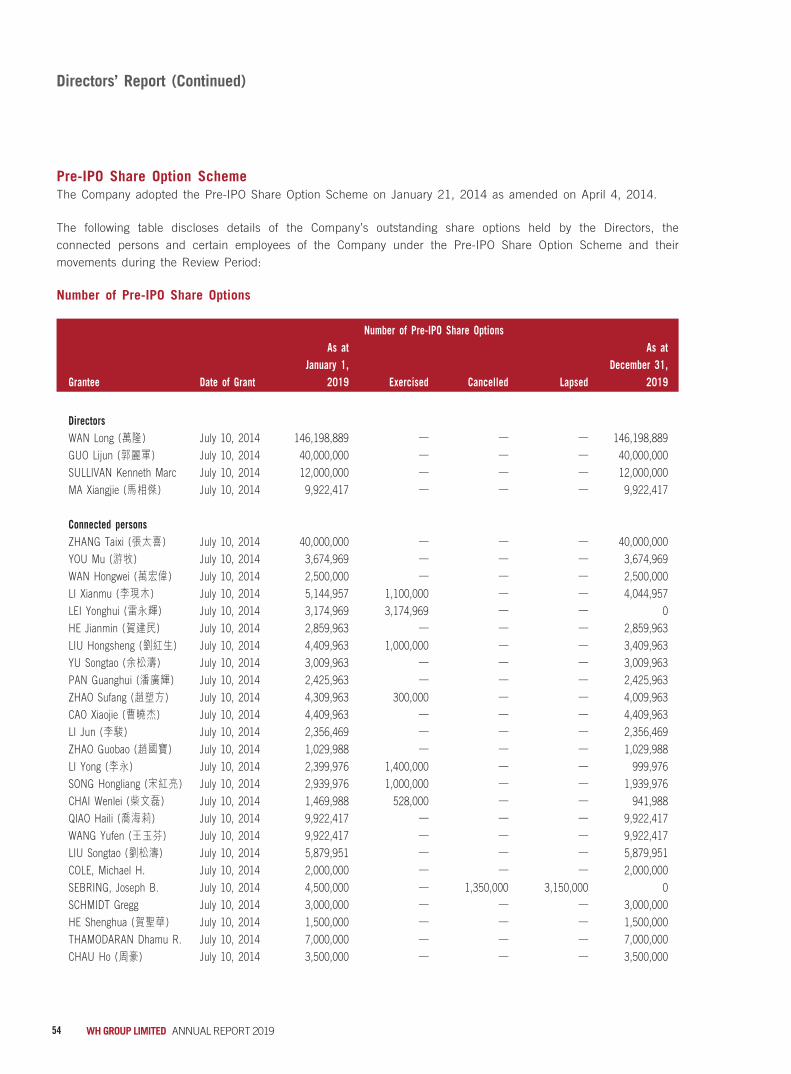
54 WH GROUP LIMITED ANNUAL REPORT 2019
Directors’ Report (Continued)
Pre-IPO Share Option SchemeThe Company adopted the Pre-IPO Share Option Scheme on January 21, 2014 as amended on April 4, 2014.
The following table discloses details of the Company’s outstanding share options held by the Directors, the connected persons and certain employees of the Company under the Pre-IPO Share Option Scheme and their movements during the Review Period:
Number of Pre-IPO Share Options
Number of Pre-IPO Share Options
Grantee Date of Grant
As at January 1,
2019 Exercised Cancelled Lapsed
As at December 31,
2019
DirectorsWAN Long (萬隆) July 10, 2014 146,198,889 — — — 146,198,889GUO Lijun (郭麗軍) July 10, 2014 40,000,000 — — — 40,000,000SULLIVAN Kenneth Marc July 10, 2014 12,000,000 — — — 12,000,000MA Xiangjie (馬相傑) July 10, 2014 9,922,417 — — — 9,922,417
Connected personsZHANG Taixi (張太喜) July 10, 2014 40,000,000 — — — 40,000,000YOU Mu (游牧) July 10, 2014 3,674,969 — — — 3,674,969WAN Hongwei (萬宏偉) July 10, 2014 2,500,000 — — — 2,500,000LI Xianmu (李現木) July 10, 2014 5,144,957 1,100,000 — — 4,044,957LEI Yonghui (雷永輝) July 10, 2014 3,174,969 3,174,969 — — 0HE Jianmin (賀建民) July 10, 2014 2,859,963 — — — 2,859,963LIU Hongsheng (劉紅生) July 10, 2014 4,409,963 1,000,000 — — 3,409,963YU Songtao (余松濤) July 10, 2014 3,009,963 — — — 3,009,963PAN Guanghui (潘廣輝) July 10, 2014 2,425,963 — — — 2,425,963ZHAO Sufang (趙塑方) July 10, 2014 4,309,963 300,000 — — 4,009,963CAO Xiaojie (曹曉杰) July 10, 2014 4,409,963 — — — 4,409,963LI Jun (李駿) July 10, 2014 2,356,469 — — — 2,356,469ZHAO Guobao (趙國寶) July 10, 2014 1,029,988 — — — 1,029,988LI Yong (李永) July 10, 2014 2,399,976 1,400,000 — — 999,976SONG Hongliang (宋紅亮) July 10, 2014 2,939,976 1,000,000 — — 1,939,976CHAI Wenlei (柴文磊) July 10, 2014 1,469,988 528,000 — — 941,988QIAO Haili (喬海莉) July 10, 2014 9,922,417 — — — 9,922,417WANG Yufen (王玉芬) July 10, 2014 9,922,417 — — — 9,922,417LIU Songtao (劉松濤) July 10, 2014 5,879,951 — — — 5,879,951COLE, Michael H. July 10, 2014 2,000,000 — — — 2,000,000SEBRING, Joseph B. July 10, 2014 4,500,000 — 1,350,000 3,150,000 0SCHMIDT Gregg July 10, 2014 3,000,000 — — — 3,000,000HE Shenghua (賀聖華) July 10, 2014 1,500,000 — — — 1,500,000THAMODARAN Dhamu R. July 10, 2014 7,000,000 — — — 7,000,000CHAU Ho (周豪) July 10, 2014 3,500,000 — — — 3,500,000

55ANNUAL REPORT 2019 WH GROUP LIMITED
Directors’ Report (Continued)
Number of Pre-IPO Share Options
Grantee Date of Grant
As at January 1,
2019 Exercised Cancelled Lapsed
As at December 31,
2019
Other grantees who have been granted the Pre-IPO Share Options to subscribe for 4,500,000 Shares or morePOPE C. Larry July 10, 2014 39,990,000 12,740,000 — — 27,250,000WEN Guoshan (溫國山) July 10, 2014 3,234,451 1,470,000 — — 1,764,451LI Hongwei (李紅偉) July 10, 2014 3,234,451 3,230,451 — — 4,000WANG Yonglin (王永林) July 10, 2014 5,149,951 900,000 — — 4,249,951FU Zhiyong (付志勇) July 10, 2014 5,879,951 — — — 5,879,951GUO Xinwen (郭新聞) July 10, 2014 5,879,951 990,000 — — 4,889,951LIU Qingde (劉清德) July 10, 2014 2,864,957 2,864,957 — — 0
Senior management and other employees (in aggregate) July 10, 2014 110,980,013 14,567,270 3,517,646 2,488,324 90,406,773
Total 518,676,886 45,265,647 4,867,646 5,638,324 462,905,269
Notes:Each grantee to whom a Pre-IPO Share Option has been granted shall be entitled to exercise his/her Pre-IPO Share Option in such manner as set out below:(1) to subscribe up to ten (10)% of the Shares that are subject to the Pre-IPO Share Option so granted to him/her (round down to the nearest
whole number), exercisable at any time during the period commencing on the first (1st) anniversary of the Listing Date;(2) to subscribe up to twenty-five (25)% of the Shares that are subject to the Pre-IPO Share Option so granted to him/her less the number of
Shares in respect of which the Pre-IPO Share Option has been exercised (rounded down to the nearest whole number), exercisable at any time during the period commencing on the second (2nd) anniversary of the Listing Date;
(3) to subscribe up to forty-five (45)% of the Shares that are subject to the Pre-IPO Share Option so granted to him/her less the number of Shares in respect of which the Pre-IPO Share Option has been exercised (rounded down to the nearest whole number), exercisable at any time during the period commencing on the third (3rd) anniversary of the Listing Date;
(4) to subscribe up to seventy (70)% of the Shares that are subject to the Pre-IPO Share Option so granted to him/her less the number of Shares in respect of which the Pre-IPO Share Option has been exercised (rounded down to the nearest whole number), exercisable at any time during the period commencing on the fourth (4th) anniversary of the Listing Date; and
(5) to subscribe such number of Shares subject to the Pre-IPO Share Option so granted to him/her less the number of Shares in respect of which the Pre-IPO Share Option has been exercised (rounded to the nearest whole number), exercisable at any time commencing on the fifth (5th) anniversary of the Listing Date.
2010 Share Award PlanTo recognize and reward the contribution of certain employees to the Group, provide incentives to retain them to support the continued growth of the Group, and attract suitable personnel for further development, the Company adopted the 2010 Share Award Plan on November 26, 2010.
Teeroy Limited, a company incorporated under the laws of Hong Kong, was designated as the trustee administering the 2010 Share Award Plan. Pursuant to a shareholders’ resolution of the Company passed on November 26, 2010 and relevant procedures, Chang Yun, a wholly-owned subsidiary of the trustee incorporated in the BVI, obtained 631,580,000 Shares, representing 6.00% of the Company’s then enlarged issued share capital. The pool of Shares held by Chang Yun comprised (i) 10,526 Shares of a par value of US$1.00 per share that were transferred indirectly from Shine B to the trustee, which were then subdivided into 105,260,000 Shares and (ii) 526,320,000 Shares allotted and issued by the Company in consideration of US$52,632 paid by the trustee.

56 WH GROUP LIMITED ANNUAL REPORT 2019
Directors’ Report (Continued)
Under the 2010 Share Award Plan, the Chairman is entitled to select, as the recipient of a share award, any employee of the Company (excluding any non-executive Director), its subsidiaries and entities in which any member of the Group holds any equity interest. The Chairman is also entitled to decide the number of Shares awarded, proposed vesting date, performance target for vesting, lock-up period and other terms and conditions.
All the 631,580,000 Shares (the “2010 Awarded Shares”) under the 2010 Share Award Plan were awarded to 87 selected employees of the Group, among which, 35,666,147 Shares, 47,484,457 Shares and 47,484,457 Shares were awarded to three of our Directors, Messrs. Wan Long, Guo Lijun and Ma Xiangjie, respectively. The award and vesting of all the 2010 Awarded Shares was completed on December 23, 2019 by way of transfer of the entire interest in Chang Yun to Auspicious Joy and the adoption of the Chang Yun Share Plan, of which each of the 87 selected employees is a participant.
Chang Yun was obligated to exercise the voting rights in respect of the relevant Shares in accordance with the direction given by the Company from time to time. On November 26, 2010, the Company instructed Chang Yun to exercise such voting rights in accordance with the direction of Heroic Zone, a wholly-owned subsidiary of Rise Grand, as given in its absolute discretion. Following completion of the aforementioned vesting, Chang Yun has undertaken to continue to exercise the voting rights in respect of the 2010 Awarded Shares in accordance with the direction given by the Company from time to time. On December 23, 2019, the Company directed Chang Yun to exercise such voting rights in accordance with the direction of Heroic Zone as given in its absolute discretion.
The 2010 Share Award Plan was terminated on December 23, 2019 upon determination by the Board.
2013 Share Award PlanTo incentivize and attract talent for the further development of the Group following the acquisition of Smithfield, the Board adopted the 2013 Share Award Plan on October 23, 2013. Teeroy Limited was designated as the trustee for administering the 2013 Share Award Plan. The pool of 350,877,333 Shares subject to the 2013 Share Award Plan, representing approximately 3% of the Company’s then issued share capital on a fully diluted basis, were allotted and issued to High Zenith, the trustee’s wholly owned special purpose vehicle incorporated in the BVI, on October 23, 2013 for a consideration of approximately US$35,088.
Under the 2013 Share Award Plan, Mr. Wan Long and Mr. Jiao Shuge, both Directors, are entitled to jointly select the recipients of share awards, who may include (i) any full-time or part-time employee or officer (including but not limited to any executive or non-executive director) of the Company, its subsidiaries and entities in which any member of the Group holds any equity interest, and (ii) any consultants, agents and advisors of the Company, its subsidiaries and entities in which any member of the Group holds any equity interest. Mr. Wan Long and Mr. Jiao Shuge are also entitled to jointly decide the number of Shares awarded, proposed vesting date, performance target for vesting, lock-up period and other terms and conditions.
Mr. Wan Long was provisionally awarded 350,877,333 Shares (the “2013 Awarded Shares”) under the 2013 Share Award Plan on April 28, 2017. The vesting of the 2013 Awarded Shares pursuant to the terms and conditions set out in the relevant award notice and under the rules of the 2013 Share Award Plan was completed on June 28, 2019 by way of transfer of the entire interest in High Zenith.
High Zenith was contractually obligated to exercise the voting rights in respect of any Shares held under trust for the 2013 Share Award Plan in accordance with the direction given by the Company from time to time. On October 23, 2013, the Company directed High Zenith to exercise such voting rights in accordance with the direction of Heroic Zone as given in its absolute discretion. Following completion of the aforementioned vesting, High Zenith

57ANNUAL REPORT 2019 WH GROUP LIMITED
Directors’ Report (Continued)
has undertaken to continue to exercise the voting rights in respect of the 2013 Awarded Shares in accordance with the direction given by the Company from time to time. On June 28, 2019, the Company directed High Zenith to exercise such voting rights in accordance with the direction of Heroic Zone as given in its absolute discretion.
The 2013 Share Award Plan was terminated on June 28, 2019 upon determination by the Board.
Pre-Emptive RightsThere is no provision for pre-emptive rights under the Articles of Association or the laws of Cayman Islands, the jurisdiction in which the Company was incorporated, and there is no restriction against such rights which would oblige the Company to offer new shares on a pro-rata basis to existing Shareholders.
Tax ReliefThe Company is not aware of any relief from taxation available to the Shareholders by reason of their holdings in the Shares.
Competing InterestsDuring the Review Period, none of the Directors is considered to have an interest in any business which competes or is likely to compete, either directly or indirectly, with the businesses of the Group.
Corporate Governance Measures in Relation to Non-Competition UndertakingsRise Grand, Heroic Zone, Chang Yun, High Zenith, Sure Pass and Rich Matrix (collectively, the “Covenantors”) have entered into a deed of non-competition in favour of the Company on July 18, 2014 (the “Deed of Non-competition”). Details of the Deed of Non-competition have been set out in the Prospectus. There has been no change to the terms of the Deed of Non-competition during the Review Period.
The Company has received confirmations on compliance with the undertakings under the Deed of Non-Competition from the Covenantors for the Review Period (the “Confirmations”). Upon receiving the Confirmations, the independent non-executive Directors have reviewed the same as part of the annual review process. In view of the above, the independent non-executive Directors have confirmed that, as far as they can ascertain, there is no breach by any of the Covenantors of the non-competition undertakings in the Deed of Non-competition.
Management ContractsNo contracts concerning the management and administration of the whole or any substantial part of the business of the Company were entered into OR existed during the Review Period.
Major Suppliers and CustomersThe purchases and revenue attributable to the Group’s five largest suppliers and five largest customers combined, respectively, was each less than 30% for the year ended December 31, 2019.
None of the Directors, their close associates, nor any Shareholders (which to the knowledge of the Directors own more than 5% of the number of issued Shares) had any interest in the five largest customers or suppliers of the Group.

58 WH GROUP LIMITED ANNUAL REPORT 2019
Directors’ Report (Continued)
Corporate Governance PracticesThe Company is committed to the principles of corporate governance and corporate responsibility consistent with prudent management. The Board has adopted the CG Code as set out in Appendix 14 to the Listing Rules and the Model Code as the guidelines for the Directors’ dealings in the securities of the Company since the Listing Date.
Sufficient Public FloatBased on the information that is publicly available to the Company and within the knowledge of the Directors, as at the date of this report, the Company has maintained a sufficient public float of not less than 25% of the Company’s issued shares as required under the Listing Rules.
Connected TransactionsDuring the Review Period, there was no connected transaction of the Group that need to be disclosed pursuant to Chapter 14A of the Listing Rules. The related party transactions disclosed under Note 44 to the consolidated financial statements do not constitute connected transactions of the Company.
Events After the End of the Reporting PeriodDetails of significant events occurring after the end of the reporting period are set out in Note 48 to the consolidated financial statements.
Future DevelopmentPlease refer to page 25 and the section headed “Chairman’s Statement” of this report for the prospects of the Company’s business.
AuditorsThe consolidated financial statements for the year ended December 31, 2019 have been audited by Ernst & Young.
On behalf of the BoardWan LongChairman of the Board and Chief Executive Officer
Hong Kong, March 24, 2020
59ANNUAL REPORT 2019 WH GROUP LIMITED
INDEPENDENT AUDITOR’S REPORT
To the shareholders of WH Group Limited(Incorporated in the Cayman Islands with limited liability)
OpinionWe have audited the consolidated financial statements of WH Group Limited (the “Company”) and its subsidiaries (collectively referred to as the “Group”) set out on pages 63 to 193, which comprise the consolidated statement of financial position as at 31 December 2019, and the consolidated statement of profit or loss and other comprehensive income, the consolidated statement of changes in equity and the consolidated statement of cash flows for the year then ended, and notes to the consolidated financial statements, including a summary of significant accounting policies.
In our opinion, the consolidated financial statements give a true and fair view of the consolidated financial position of the Group as at 31 December 2019, and of its consolidated financial performance and consolidated cash flows for the year then ended in accordance with International Financial Reporting Standards (“IFRSs”) and have been properly prepared in compliance with the disclosure requirements of the Hong Kong Companies Ordinance.
Basis for opinionWe conducted our audit in accordance with Hong Kong Standards on Auditing (“HKSAs”) issued by the Hong Kong Institute of Certified Public Accountants (“HKICPA”). Our responsibilities under those standards are further described in the Auditor’s responsibilities for the audit of the consolidated financial statements section of our report. We are independent of the Group in accordance with the HKICPA’s Code of Ethics for Professional Accountants (the “Code”), and we have fulfilled our other ethical responsibilities in accordance with the Code. We believe that the audit evidence we have obtained is sufficient and appropriate to provide a basis for our opinion.
Key audit mattersKey audit matters are those matters that, in our professional judgement, were of most significance in our audit of the consolidated financial statements of the current period. These matters were addressed in the context of our audit of the consolidated financial statements as a whole, and in forming our opinion thereon, and we do not provide a separate opinion on these matters. For each matter below, our description of how our audit addressed the matter is provided in that context.
We have fulfilled the responsibilities described in the Auditor’s responsibilities for the audit of the consolidated financial statements section of our report, including in relation to these matters. Accordingly, our audit included the performance of procedures designed to respond to our assessment of the risks of material misstatement of the consolidated financial statements. The results of our audit procedures, including the procedures performed to address the matters below, provide the basis for our audit opinion on the accompanying consolidated financial statements.

60 WH GROUP LIMITED ANNUAL REPORT 2019
Independent Auditor’s Report (Continued)
To the shareholders of WH Group Limited(Incorporated in the Cayman Islands with limited liability)
Key audit matters (Continued)
Key audit matter How our audit addressed the key audit matter
Fair value measurement of live hogs included in biological assets
The carrying value of the Group’s live hogs included in biological assets amounted to US$1,101 million, representing 6.4% of the Group’s total assets as at 31 December 2019. The carrying value of live hogs was measured at fair value less costs to sell, which was determined based on the price of hogs in the actively traded market, reduced by the breeding costs required to raise the hogs to be slaughtered, the estimated margins that would be required by a raiser, and costs to sell with reference to the latest budgets approved by the management. The Group engaged an independent qualified valuer to perform the live hog valuations. We identified the fair value measurement of these live hogs as a key audit matter because of the significant degree of judgement involved in the valuations to determine the fair value less costs to sell of live hogs.
Disclosures of determination of the fair value less costs to sell and the key assumptions involved are included in notes 4 and 18 to the consolidated financial statements.
Our procedures in relation to assessing the fair value measurement of live hogs included in biological assets included:
• Understanding how the management determined the fair value measurement of live hogs included in biological assets, including the involvement of the independent valuer;
• Eva lua t ing the competence , capab i l i t i es , independence and objectivity of the independent valuer;
• Reviewing the valuation model prepared by the independent valuer in determining the fair value less costs to sell of live hogs;
• Evaluating the market price of live hogs to the available market data, on a sample basis; and
• Evaluating the estimates of breeding costs required to raise the live hogs and estimated margins that would be required by a raiser and costs to sell against the historical performance and budgets approved by the management.
Other information included in the Annual ReportThe directors of the Company are responsible for the other information. The other information comprises the information included in the Annual Report, other than the consolidated financial statements and our auditor’s report thereon.
Our opinion on the consolidated financial statements does not cover the other information and we do not express any form of assurance conclusion thereon.
In connection with our audit of the consolidated financial statements, our responsibility is to read the other information and, in doing so, consider whether the other information is materially inconsistent with the consolidated financial statements or our knowledge obtained in the audit or otherwise appears to be materially misstated. If, based on the work we have performed, we conclude that there is a material misstatement of this other information, we are required to report that fact. We have nothing to report in this regard.
61ANNUAL REPORT 2019 WH GROUP LIMITED
Independent Auditor’s Report (Continued)
To the shareholders of WH Group Limited(Incorporated in the Cayman Islands with limited liability)
Responsibilities of the directors for the consolidated financial statementsThe directors of the Company are responsible for the preparation of the consolidated financial statements that give a true and fair view in accordance with IFRSs and the disclosure requirements of the Hong Kong Companies Ordinance, and for such internal control as the directors determine is necessary to enable the preparation of consolidated financial statements that are free from material misstatement, whether due to fraud or error.
In preparing the consolidated financial statements, the directors of the Company are responsible for assessing the Group’s ability to continue as a going concern, disclosing, as applicable, matters related to going concern and using the going concern basis of accounting unless the directors of the Company either intend to liquidate the Group or to cease operations or have no realistic alternative but to do so.
The directors of the Company are assisted by the Audit Committee in discharging their responsibilities for overseeing the Group’s financial reporting process.
Auditor’s responsibilities for the audit of the consolidated financial statementsOur objectives are to obtain reasonable assurance about whether the consolidated financial statements as a whole are free from material misstatement, whether due to fraud or error, and to issue an auditor’s report that includes our opinion. Our report is made solely to you, as a body, and for no other purpose. We do not assume responsibility towards or accept liability to any other person for the contents of this report.
Reasonable assurance is a high level of assurance, but is not a guarantee that an audit conducted in accordance with HKSAs will always detect a material misstatement when it exists. Misstatements can arise from fraud or error and are considered material if, individually or in the aggregate, they could reasonably be expected to influence the economic decisions of users taken on the basis of these consolidated financial statements.
As part of an audit in accordance with HKSAs, we exercise professional judgement and maintain professional scepticism throughout the audit. We also:
• Identify and assess the risks of material misstatement of the consolidated financial statements, whether due to fraud or error, design and perform audit procedures responsive to those risks, and obtain audit evidence that is sufficient and appropriate to provide a basis for our opinion. The risk of not detecting a material misstatement resulting from fraud is higher than for one resulting from error, as fraud may involve collusion, forgery, intentional omissions, misrepresentations, or the override of internal control.
• Obtain an understanding of internal control relevant to the audit in order to design audit procedures that are appropriate in the circumstances, but not for the purpose of expressing an opinion on the effectiveness of the Group’s internal control.
• Evaluate the appropriateness of accounting policies used and the reasonableness of accounting estimates and related disclosures made by the directors.

62 WH GROUP LIMITED ANNUAL REPORT 2019
Independent Auditor’s Report (Continued)
To the shareholders of WH Group Limited(Incorporated in the Cayman Islands with limited liability)
Auditor’s responsibilities for the audit of the consolidated financial statements (Continued)• Conclude on the appropriateness of the directors’ use of the going concern basis of accounting and, based
on the audit evidence obtained, whether a material uncertainty exists related to events or conditions that may cast significant doubt on the Group’s ability to continue as a going concern. If we conclude that a material uncertainty exists, we are required to draw attention in our auditor’s report to the related disclosures in the consolidated financial statements or, if such disclosures are inadequate, to modify our opinion. Our conclusions are based on the audit evidence obtained up to the date of our auditor’s report. However, future events or conditions may cause the Group to cease to continue as a going concern.
• Evaluate the overall presentation, structure and content of the consolidated financial statements, including the disclosures, and whether the consolidated financial statements represent the underlying transactions and events in a manner that achieves fair presentation.
• Obtain sufficient appropriate audit evidence regarding the financial information of the entities or business activities within the Group to express an opinion on the consolidated financial statements. We are responsible for the direction, supervision and performance of the group audit. We remain solely responsible for our audit opinion.
We communicate with the Audit Committee regarding, among other matters, the planned scope and timing of the audit and significant audit findings, including any significant deficiencies in internal control that we identify during our audit.
We also provide the Audit Committee with a statement that we have complied with relevant ethical requirements regarding independence and to communicate with them all relationships and other matters that may reasonably be thought to bear on our independence, and where applicable, related safeguards.
From the matters communicated with the Audit Committee, we determine those matters that were of most significance in the audit of the consolidated financial statements of the current period and are therefore the key audit matters. We describe these matters in our auditor’s report unless law or regulation precludes public disclosure about the matter or when, in extremely rare circumstances, we determine that a matter should not be communicated in our report because the adverse consequences of doing so would reasonably be expected to outweigh the public interest benefits of such communication.
The engagement partner on the audit resulting in the independent auditor’s report is Ms. CHIU, Caroline Su Yuen.
Ernst & Young Certified Public Accountants 22/F, CITIC Tower 1 Tim Mei Avenue Central, Hong Kong 24 March 2020

63ANNUAL REPORT 2019 WH GROUP LIMITED
For the year ended December 31, 2019
CONSOLIDATED STATEMENT OF PROFIT OR LOSS AND OTHER COMPREHENSIVE INCOME
2019 2018 Results before
biological fair value
adjustments
Biological fair value
adjustments Total
Results before
biological fair value
adjustments
Biological fair value
adjustments TotalNotes US$’million US$’million US$’million US$’million US$’million US$’million
Revenue 5 24,103 — 24,103 22,605 — 22,605Cost of sales (19,209) 338 (18,871) (18,103) 196 (17,907)
Gross profit 4,894 338 5,232 4,502 196 4,698Distribution and selling expenses (2,059) — (2,059) (2,139) — (2,139)Administrative expenses (811) — (811) (732) — (732)Loss arising from agricultural
produce at fair value less costs to sell at the point of harvest — (208) (208) — (209) (209)
Loss arising from changes in fair value less costs to sell of biological assets — (22) (22) — (130) (130)
Other income 6 59 — 59 98 — 98Other gains and (losses) 7 53 — 53 (21) — (21)Other expenses 8 (63) — (63) (74) — (74)Finance costs 9 (144) — (144) (115) — (115)Share of profits of associates 4 — 4 8 — 8Share of profits of joint ventures 13 (2) 11 23 4 27
PROFIT BEFORE TAX 10 1,946 106 2,052 1,550 (139) 1,411Taxation 12 (336) (21) (357) (293) 35 (258)
PROFIT FOR THE YEAR 1,610 85 1,695 1,257 (104) 1,153
Other comprehensive expense for the year: 47
Items that will not be reclassified subsequently to profit or loss:— remeasurement on defined
benefit pension plans (143) (6)
(143) (6)
Items that may be reclassified subsequently to profit or loss:— exchange differences arising
on translation of foreign operations (51) (198)
— fair value change in cash flow hedge, net of tax 15 6
(36) (192)

64 WH GROUP LIMITED ANNUAL REPORT 2019
For the year ended December 31, 2019
Consolidated Statement of Profit or Loss and Other Comprehensive Income (Continued)
2019 2018 Results before
biological fair value
adjustments
Biological fair value
adjustments Total
Results before
biological fair value
adjustments
Biological fair value
adjustments TotalNote US$’million US$’million US$’million US$’million US$’million US$’million
Other comprehensive expense for the year, net of tax (179) (198)
TOTAL COMPREHENSIVE INCOME FOR THE YEAR 1,516 955
Profit for the year attributable to
— owners of the Company 1,465 943
— non-controlling interests 230 210
1,695 1,153
Total comprehensive income for the year attributable to
— owners of the Company 1,305 783
— non-controlling interests 211 172
1,516 955
EARNINGS PER SHARE 14
— Basic (US cents) 9.96 6.43
— Diluted (US cents) 9.90 6.40

65ANNUAL REPORT 2019 WH GROUP LIMITED
At December 31, 2019
CONSOLIDATED STATEMENT OF FINANCIAL POSITION
2019 2018Notes US$’million US$’million
NON-CURRENT ASSETSProperty, plant and equipment 15 5,406 5,300Right-of-use assets 17(b) 646 —
Prepaid lease payments 17(a) — 175Biological assets 18 137 147Goodwill 19 1,955 1,847Intangible assets 20 1,712 1,734Interests in associates 21 42 150Interests in joint ventures 22 305 202Other receivables 25 54 40Financial assets at fair value through profit or loss 26 10 7Pledged bank deposits 28 4 4Deferred tax assets 33 66 57Other non-current assets 238 175
Total non-current assets 10,575 9,838
CURRENT ASSETSProperties under development 16 102 30Prepaid lease payments 17(a) — 5Biological assets 18 1,107 947Inventories 23 2,903 2,022Trade and bills receivables 24 1,047 1,135Prepayments, other receivables and other assets 25 508 358Taxation recoverable — 67Financial assets at fair value through profit or loss 26 447 317Pledged/restricted bank deposits 28 41 54Bank balances and cash 28 552 525
Total current assets 6,707 5,460
CURRENT LIABILITIESTrade payables 29 1,074 977Accrued expenses and other payables 30 1,686 1,428Lease liabilities/obligations under finance leases 17(c)/31 108 2Taxation payable 96 61Borrowings 32 905 819Bank overdrafts 32 — 41
Total current liabilities 3,869 3,328
NET CURRENT ASSETS 2,838 2,132
TOTAL ASSETS LESS CURRENT LIABILITIES 13,413 11,970

66 WH GROUP LIMITED ANNUAL REPORT 2019
At December 31, 2019
Consolidated Statement of Financial Position (Continued)
2019 2018Notes US$’million US$’million
NON-CURRENT LIABILITIESOther payables 30 189 214Lease liabilities/obligations under finance leases 17(c)/31 357 23Borrowings 32 2,187 2,259Deferred tax liabilities 33 660 598Deferred revenue 34 10 10Pension liability and other retirement benefits 35 558 448
Total non-current liabilities 3,961 3,552
NET ASSETS 9,452 8,418
CAPITAL AND RESERVESShare capital 38 1 1Reserves 8,683 7,745
Equity attributable to owners of the Company 8,684 7,746
Non-controlling interests 768 672
TOTAL EQUITY 9,452 8,418
The consolidated financial statements on pages 63 to 193 were approved and authorised for issue by the Board of Directors on March 24, 2020 and are signed on its behalf by:
Mr. Wan Long Mr. Guo LijunDirector Director
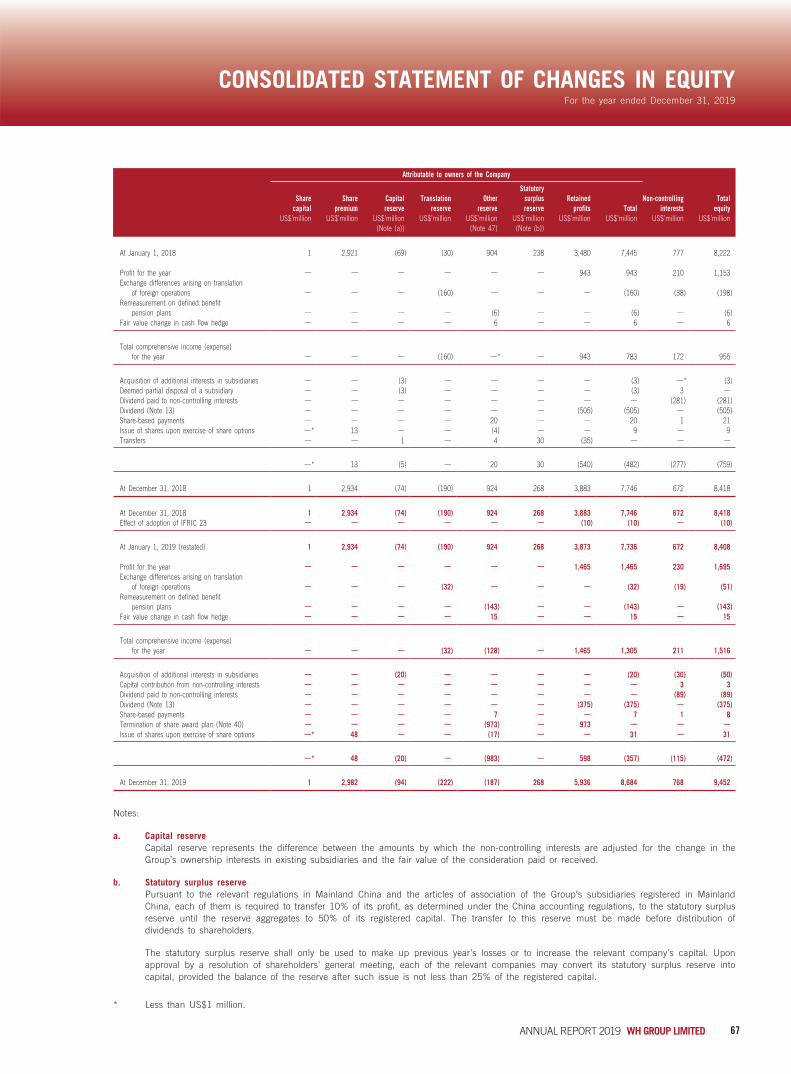
67ANNUAL REPORT 2019 WH GROUP LIMITED
For the year ended December 31, 2019
CONSOLIDATED STATEMENT OF CHANGES IN EQUITY
Attributable to owners of the Company
Share capital
Share premium
Capital reserve
Translation reserve
Other reserve
Statutory surplus reserve
Retained profits Total
Non-controlling interests
Total equity
US$’million US$’million US$’million US$’million US$’million US$’million US$’million US$’million US$’million US$’million(Note (a)) (Note 47) (Note (b))
At January 1, 2018 1 2,921 (69) (30) 904 238 3,480 7,445 777 8,222
Profit for the year — — — — — — 943 943 210 1,153Exchange differences arising on translation
of foreign operations — — — (160) — — — (160) (38) (198)Remeasurement on defined benefit
pension plans — — — — (6) — — (6) — (6)Fair value change in cash flow hedge — — — — 6 — — 6 — 6
Total comprehensive income (expense) for the year — — — (160) —* — 943 783 172 955
Acquisition of additional interests in subsidiaries — — (3) — — — — (3) —* (3)Deemed partial disposal of a subsidiary — — (3) — — — — (3) 3 —Dividend paid to non-controlling interests — — — — — — — — (281) (281)Dividend (Note 13) — — — — — — (505) (505) — (505)Share-based payments — — — — 20 — — 20 1 21Issue of shares upon exercise of share options —* 13 — — (4) — — 9 — 9Transfers — — 1 — 4 30 (35) — — —
—* 13 (5) — 20 30 (540) (482) (277) (759)
At December 31, 2018 1 2,934 (74) (190) 924 268 3,883 7,746 672 8,418
At December 31, 2018 1 2,934 (74) (190) 924 268 3,883 7,746 672 8,418Effect of adoption of IFRIC 23 — — — — — — (10) (10) — (10)
At January 1, 2019 (restated) 1 2,934 (74) (190) 924 268 3,873 7,736 672 8,408
Profit for the year — — — — — — 1,465 1,465 230 1,695Exchange differences arising on translation
of foreign operations — — — (32) — — — (32) (19) (51)Remeasurement on defined benefit
pension plans — — — — (143) — — (143) — (143)Fair value change in cash flow hedge — — — — 15 — — 15 — 15
Total comprehensive income (expense) for the year — — — (32) (128) — 1,465 1,305 211 1,516
Acquisition of additional interests in subsidiaries — — (20) — — — — (20) (30) (50)Capital contribution from non-controlling interests — — — — — — — — 3 3Dividend paid to non-controlling interests — — — — — — — — (89) (89)Dividend (Note 13) — — — — — — (375) (375) — (375)Share-based payments — — — — 7 — — 7 1 8Termination of share award plan (Note 40) — — — — (973) — 973 — — —Issue of shares upon exercise of share options —* 48 — — (17) — — 31 — 31
—* 48 (20) — (983) — 598 (357) (115) (472)
At December 31, 2019 1 2,982 (94) (222) (187) 268 5,936 8,684 768 9,452
Notes:
a. Capital reserveCapital reserve represents the difference between the amounts by which the non-controlling interests are adjusted for the change in the Group’s ownership interests in existing subsidiaries and the fair value of the consideration paid or received.
b. Statutory surplus reservePursuant to the relevant regulations in Mainland China and the articles of association of the Group’s subsidiaries registered in Mainland China, each of them is required to transfer 10% of its profit, as determined under the China accounting regulations, to the statutory surplus reserve until the reserve aggregates to 50% of its registered capital. The transfer to this reserve must be made before distribution of dividends to shareholders.
The statutory surplus reserve shall only be used to make up previous year’s losses or to increase the relevant company’s capital. Upon approval by a resolution of shareholders’ general meeting, each of the relevant companies may convert its statutory surplus reserve into capital, provided the balance of the reserve after such issue is not less than 25% of the registered capital.
* Less than US$1 million.

68 WH GROUP LIMITED ANNUAL REPORT 2019
For the year ended December 31, 2019
CONSOLIDATED STATEMENT OF CASH FLOWS
2019 2018US$’million US$’million
OPERATING ACTIVITIESProfit before tax 2,052 1,411Adjustments for:
Interest income (14) (12)Finance costs 144 115Share of profits of associates (4) (8)Share of profits of joint ventures (11) (27)Depreciation of property, plant and equipment 442 428(Gain) loss on disposal of property, plant and equipment (1) 2Amortisation of intangible assets 9 9Fair value gain on financial assets at fair value
through profit or loss (24) (15)Depreciation of right-of-use assets/release of
prepaid lease payments 130 4Write-down of inventories 53 106Loss arising from changes in fair value less costs
to sell of biological assets 22 130Impairment loss on property, plant and equipment 18 4Impairment loss on intangible assets 8 —Impairment loss on right-of-use assets 5 —(Reversal of) allowances on trade receivables (1) 2Impairment loss on other non-current assets — 12Share-based payments 8 21Gain on contribution of assets to a joint venture (42) —Gain on disposal of an associate (15) —Gain on insurance recovery (10) (4)
2,769 2,178Increase in biological assets (177) (66)Increase in inventories (941) (258)Increase in trade, bills and other receivables (3) (247)Increase in properties under development (72) (25)Increase in trade and other payables 263 26
CASH GENERATED FROM OPERATIONS 1,839 1,608Taxation paid (233) (234)Interest paid (143) (119)
Net cash flows from operating activities 1,463 1,255

69ANNUAL REPORT 2019 WH GROUP LIMITED
For the year ended December 31, 2019
Consolidated Statement of Cash Flows (Continued)
2019 2018US$’million US$’million
INVESTING ACTIVITIESPurchase of property, plant and equipment (680) (811)Additions of right-of-use assets (23) —Proceeds from disposal of financial assets at fair value through
profit or loss 810 626Purchase of financial assets at fair value through profit or loss (920) (951)Placement of pledged/restricted bank deposits (38) (56)Withdrawal of pledged/restricted bank deposits 49 70Proceeds from disposal of property, plant and equipment 113 20Interest received 6 6Dividends received from associates —* 4Dividends received from joint ventures — 1Net cash outflow on acquisition of subsidiaries (115) (59)Acquisition of equity interests in joint ventures (25) (15)Proceeds from disposal of an associate 38 —Settlement of contingent consideration in respect of acquisition of
a subsidiary (2) (7)Insurance claims on property, plant and equipment 7 3Purchase of other non-current assets (33) (21)Proceeds from sales and leaseback of assets 47 —Construction of assets to be sold (30) (27)
Net cash flows used in investing activities (796) (1,217)
FINANCING ACTIVITIESProceeds from borrowings, net of transaction costs 2,457 8,658Repayment of borrowings (2,454) (8,654)Dividend paid to non-controlling interests (89) (290)Dividend paid (375) (505)Net cash outflow on acquisition of additional interests in subsidiaries (50) (3)Proceeds from issue of shares 31 9Capital contributed by non-controlling interests 3 —Lease payments/repayment of obligation under finance leases (116) (5)
Net cash flows used in financing activities (593) (790)
Net increase (decrease) in cash and cash equivalents 74 (752)Effect of foreign exchange rate changes (6) (43)Cash and cash equivalents at beginning of year 484 1,279
CASH AND CASH EQUIVALENTS AT END OF YEAR 552 484
ANALYSIS OF THE BALANCES OF CASH AND CASH EQUIVALENTSBank balances and cash 552 525Bank overdrafts — (41)
552 484
* Less than US$1 million.

70 WH GROUP LIMITED ANNUAL REPORT 2019
For the year ended December 31, 2019
NOTES TO THE CONSOLIDATED FINANCIAL STATEMENTS
1. CORPORATE AND GROUP INFORMATIONWH Group Limited (the “Company”) was incorporated and registered as an exempted company with limited liability in the Cayman Islands under the Companies Law of the Cayman Islands. The Company’s shares were listed on the Main Board of The Stock Exchange of Hong Kong Limited (the “Stock Exchange”) on August 5, 2014.
The address of the registered office of the Company and the address of its principal place of business are disclosed in the section headed “Corporate Information” in the annual report.
The Company acts as an investment holding company. The consolidated financial statements of the Company for the year ended December 31, 2019 comprise the Company and its entities (including structured entities, controlled by the Group) (collectively referred to as the “Group”) and the Group’s interests in associates and interests in joint ventures. The Group is primarily involved in the production and sales of packaged meats and fresh pork as well as hog production. The principal activities of its principal subsidiaries are set out in note 49 to the financial statements.
The functional currency of the Company is the United States Dollar (“US$”).
2.1 BASIS OF PREPARATIONThe consolidated financial statements have been prepared in accordance with International Financial Reporting Standards (“IFRSs”) issued by the International Accounting Standards Board (the “IASB”) and the disclosure requirements of the Hong Kong Companies Ordinance.
The consolidated financial statements have been prepared under the historical cost convention, except for biological assets, financial assets at fair value through profit or loss, certain non-current assets and derivative financial assets and liabilities which have been measured at fair value. These financial statements are presented in US$, and all values are rounded to the nearest million (“US$’million”) except when otherwise indicated.
2.2 BASIS OF CONSOLIDATIONThe consolidated financial statements comprise the financial statements of the Company and its entities (including structured entities, controlled by the Group) during the year ended December 31, 2019. Control is achieved when the Group is exposed, or has rights, to variable returns from its involvement with the investee and has the ability to affect those returns through its power over the investee. Specifically, the Group controls an investee if, and only if, the Group has:
(a) power over the investee (i.e., existing rights that give it the current ability to direct the relevant activities of the investee);
(b) exposure, or rights, to variable returns from its involvement with the investee; and
(c) the ability to use its power over the investee to affect its returns.

71ANNUAL REPORT 2019 WH GROUP LIMITED
For the year ended December 31, 2019
Notes to the Consolidated Financial Statements (Continued)
2.2 BASIS OF CONSOLIDATION (Continued)Generally, there is a presumption that a majority of voting rights results in control. To support this presumption and when the Group has less than a majority of the voting or similar rights of an investee, the Group considers all relevant facts and circumstances in assessing whether it has power over an investee, including:
(a) the contractual arrangement(s) with the other vote holders of the investee;
(b) rights arising from other contractual arrangements; and
(c) the Group’s voting rights and potential voting rights.
The Group re-assesses whether or not it controls an investee if facts and circumstances indicate that there are changes to one or more of the three elements of control. Consolidation of a subsidiary begins when the Group obtains control over the subsidiary and ceases when the Group loses control of the subsidiary. Assets, liabilities, income and expenses of a subsidiary acquired or disposed of during the year are included in the consolidated financial statements from the date that the Group gains control until the date the Group ceases to control the subsidiary.
Profit or loss and each component of other comprehensive income (“OCI”) are attributed to the owners of the Company and to the non-controlling interests, even if this results in the non-controlling interests having a deficit balance. When necessary, adjustments are made to the financial statements of subsidiaries to bring their accounting policies into line with the Group’s accounting policies. All intra-group assets and liabilities, equity, income, expenses and cash flows relating to transactions between members of the Group are eliminated in full on consolidation.
Changes in the Group’s ownership interests in existing subsidiaries that do not result in the Group losing control over the subsidiaries are accounted for as equity transactions. The carrying amounts of the Group’s relevant components of equity including reserves and the non-controlling interests are adjusted to reflect the changes in their relative interests in the subsidiaries. Any difference between the amount by which the non-controlling interests are adjusted after re-attribution of the relevant equity component, and the fair value of the consideration paid or received is recognised directly in equity and attributed to owners of the Company.
When the Group loses control of a subsidiary, a gain or loss is recognised in profit or loss and is calculated as the difference between (i) the aggregate of the fair value of the consideration received and the fair value of any retained interest and (ii) the carrying amounts of the assets (including goodwill) and liabilities of the subsidiary attributable to the owners of the Company. All amounts previously recognised in other comprehensive income in relation to that subsidiary are accounted for as if the Group had directly disposed of the related assets or liabilities of the subsidiary (i.e., reclassified to profit or loss or transferred directly to retained earnings). The fair value of any investment retained in the former subsidiary at the date when control is lost is regarded as the fair value on initial recognition for subsequent accounting under IFRS 9 Financial Instruments or, when applicable, the cost on initial recognition of an investment in an associate or a joint venture.
72 WH GROUP LIMITED ANNUAL REPORT 2019
For the year ended December 31, 2019
Notes to the Consolidated Financial Statements (Continued)
2.3 CHANGES IN ACCOUNTING POLICIES AND DISCLOSURESThe Group has applied the following new and revised IFRSs for the first time for the current year’s financial statements.
Amendments to IFRS 9 Prepayment Features with Negative CompensationIFRS 16 LeasesAmendments to IAS 19 Plan Amendment, Curtailment or SettlementAmendments to IAS 28 Long-term Interests in Associates and Joint VenturesIFRIC 23 Uncertainty over Income Tax TreatmentsAnnual Improvements to
IFRSs 2015–2017 CycleAmendments to IFRS 3, IFRS 11, IAS 12 and IAS 23
Other than as explained below regarding the impact of IFRS 16 and IFRIC 23, the adoption of the above amendments has had no significant financial effect on these financial statements.
IFRS 16 LeasesIFRS 16 replaces IAS 17 Leases , IFRIC 4 Determining whether an Arrangement contains a Lease, SIC-15 Operating Leases-Incentives and SIC-27 Evaluating the Substance of Transactions Involving the Legal Form of a Lease . The standard sets out the principles for the recognition, measurement, presentation and disclosure of leases and requires lessees to account for all leases under a single on-balance sheet model to recognise and measure right-of-use assets and lease liabilities, except for certain recognition exemptions. Lessor accounting under IFRS 16 is substantially unchanged under IAS 17. Lessors will continue to classify leases as either operating or finance leases using similar principles as in IAS 17.
The Group adopted IFRS 16 using the modified retrospective method of adoption with the date of initial application of January 1, 2019. Under this method, the standard is applied retrospectively with the cumulative effect of initial adoption recognised as an adjustment to the opening balances at January 1, 2019, and the comparative information for 2018 was not restated and continued to be reported under IAS 17 and related interpretations.
New definition of a leaseUnder IFRS 16, a contract is, or contains, a lease if the contract conveys a right to control the use of an identified asset for a period of time in exchange for consideration. Control is conveyed where the customer has both the right to obtain substantially all of the economic benefits from use of the identified asset and the right to direct the use of the identified asset. The Group elected to use the transition practical expedient allowing the standard to be applied only to contracts that were previously identified as leases applying IAS 17 and IFRIC 4 at the date of initial application. Contracts that were not identified as leases under IAS 17 and IFRIC 4 were not reassessed. Therefore, the definition of a lease under IFRS 16 has been applied only to contracts entered into or changed on or after January 1, 2019.

73ANNUAL REPORT 2019 WH GROUP LIMITED
For the year ended December 31, 2019
Notes to the Consolidated Financial Statements (Continued)
2.3 CHANGES IN ACCOUNTING POLICIES AND DISCLOSURES (Continued) IFRS 16 Leases (Continued) As a lessee — Leases previously classified as operating leases Nature of the effect of adoption of IFRS 16
The Group has lease contracts for various items of land, buildings, machinery, motor vehicles and contract farms. As a lessee, the Group previously classified leases as either finance leases or operating leases based on the assessment of whether the lease transferred substantially all the rewards and risks of ownership of assets to the Group. Under IFRS 16, the Group applies a single approach to recognise and measure right-of-use assets and lease liabilities for all leases, except for exemption for leases with a lease term of 12 months or less (“short-term leases”) (elected by class of underlying asset). Instead of recognising rental expenses under operating leases on a straight-line basis over the lease term commencing from January 1, 2019, the Group recognises depreciation (and impairment, if any) of the right-of-use assets and interest accrued on the outstanding lease liabilities (as finance costs).
Impacts on transitionLease liabilities at January 1, 2019 were recognised based on the present value of the remaining lease payments, discounted using the incremental borrowing rate at January 1, 2019 and were separately disclosed in the consolidated statement of financial position.
The right-of-use assets amounting to US$344 million were recognised on January 1, 2019 based on the carrying amount as if the standard had always been applied, except for the incremental borrowing rate where the Group applied the incremental borrowing rate at January 1, 2019.
The remaining right-of-use assets amounting to US$19 million were recognised and measured at the amount of the lease liability, adjusted by the amount of any prepaid or accrued lease payments relating to the lease recognised in the statement of financial position immediately before January 1, 2019.
Prepaid lease payments of US$180 million previously identified as operating leases and certain property, plant and equipment of US$25 million recognised previously under finance leases were reclassified to right-of-use assets at January 1, 2019. All these assets were assessed for any impairment based on IAS 36 on that date and presented under “Right-of-use assets” in the consolidated statement of financial position.
The Group has used the following elective practical expedients when applying IFRS 16 at January 1, 2019:
• Used a single discount rate to a portfolio of leases with reasonably similar characteristics
• Applied the short-term leases exemptions to leases with lease term that ends within 12 months at the date of initial application
• Excluded the initial direct costs from the measurement of the right-of-use asset at the date of initial application
• Used hindsight in determining the lease term where the contract contains options to extend or terminate the lease
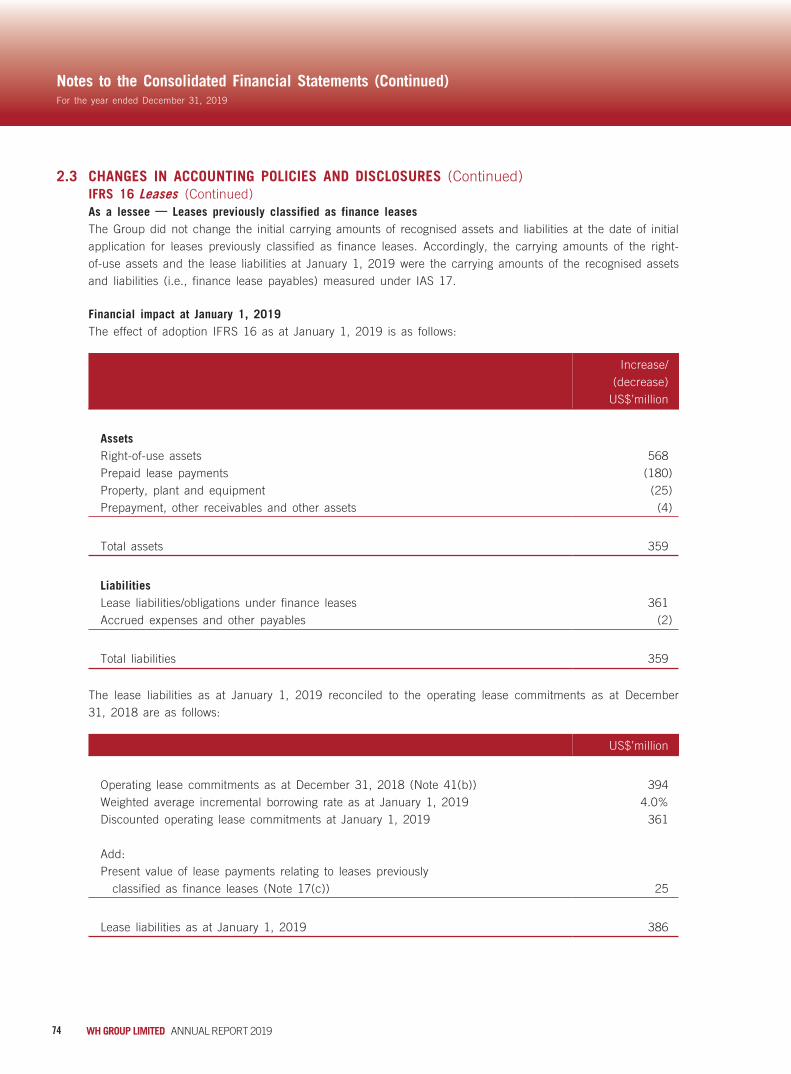
74 WH GROUP LIMITED ANNUAL REPORT 2019
For the year ended December 31, 2019
Notes to the Consolidated Financial Statements (Continued)
2.3 CHANGES IN ACCOUNTING POLICIES AND DISCLOSURES (Continued) IFRS 16 Leases (Continued) As a lessee — Leases previously classified as finance leases
The Group did not change the initial carrying amounts of recognised assets and liabilities at the date of initial application for leases previously classified as finance leases. Accordingly, the carrying amounts of the right-of-use assets and the lease liabilities at January 1, 2019 were the carrying amounts of the recognised assets and liabilities (i.e., finance lease payables) measured under IAS 17.
Financial impact at January 1, 2019The effect of adoption IFRS 16 as at January 1, 2019 is as follows:
Increase/(decrease)
US$’million
AssetsRight-of-use assets 568Prepaid lease payments (180)Property, plant and equipment (25)Prepayment, other receivables and other assets (4)
Total assets 359
LiabilitiesLease liabilities/obligations under finance leases 361Accrued expenses and other payables (2)
Total liabilities 359
The lease liabilities as at January 1, 2019 reconciled to the operating lease commitments as at December 31, 2018 are as follows:
US$’million
Operating lease commitments as at December 31, 2018 (Note 41(b)) 394Weighted average incremental borrowing rate as at January 1, 2019 4.0%Discounted operating lease commitments at January 1, 2019 361
Add:Present value of lease payments relating to leases previously
classified as finance leases (Note 17(c)) 25
Lease liabilities as at January 1, 2019 386

75ANNUAL REPORT 2019 WH GROUP LIMITED
For the year ended December 31, 2019
Notes to the Consolidated Financial Statements (Continued)
2.3 CHANGES IN ACCOUNTING POLICIES AND DISCLOSURES (Continued) IFRIC 23 Uncertainty over Income Tax Treatments
IFRIC 23 addresses the accounting for income taxes (current and deferred) when tax treatments involve uncertainty that affects the application of IAS 12 (often referred to as “uncertain tax positions”). The interpretation does not apply to taxes or levies outside the scope of IAS 12, nor does it specifically include requirements relating to interest and penalties associated with uncertain tax treatments. The interpretation specifically addresses (i) whether an entity considers uncertain tax treatments separately; (ii) the assumptions an entity makes about the examination of tax treatments by taxation authorities; (iii) how an entity determines taxable profits or tax losses, tax bases, unused tax losses, unused tax credits and tax rates; and (iv) how an entity considers changes in facts and circumstances. The Group adopted the interpretation from January 1, 2019 retrospectively. Upon adoption of IFRIC 23, the Group has recognised tax payables of US$10 million with a corresponding decrease in retained profits as at January 1, 2019.
2.4 ISSUED BUT NOT YET EFFECTIVE INTERNATIONAL FINANCIAL REPORTING STANDARDSThe Group has not applied the following new and revised IFRSs, that have been issued but are not yet effective, in these financial statements.
Amendments to IFRS 3 Definition of a Business 1
Amendments to IFRS 9, IAS 39 and IFRS 7
Interest Rate Benchmark Reform 1
Amendments to IFRS 10 and IAS 28
Sale or Contribution of Assets between an Investor and its Associate or Joint Venture 3
IFRS 17 Insurance Contracts 2
Amendments to IAS 1 and IAS 8 Definition of Material 1
1 Effective for annual periods beginning on or after January 1, 20202 Effective for annual periods beginning on or after January 1, 20213 No mandatory effective date determined but available for early adoption
Further information about those IFRSs that are expected to have an impact on the Group upon adoption is described below. Whilst management has performed an assessment of the estimated impacts of these standards, that assessment is based on the information currently available to the Group. The actual impacts upon adoption could be different to those below, depending on additional reasonable and supportable information being made available to the Group at the time of applying the standards.

76 WH GROUP LIMITED ANNUAL REPORT 2019
For the year ended December 31, 2019
Notes to the Consolidated Financial Statements (Continued)
2.4 ISSUED BUT NOT YET EFFECTIVE INTERNATIONAL FINANCIAL REPORTING STANDARDS (Continued)
Amendments to IFRS 3 Definition of a BusinessAmendments to IFRS 3 clarify and provide additional guidance on the definition of a business. The amendments clarify that for an integrated set of activities and assets to be considered a business, it must include, at a minimum, an input and a substantive process that together significantly contribute to the ability to create output. A business can exist without including all of the inputs and processes needed to create outputs. The amendments remove the assessment of whether market participants are capable of acquiring the business and continue to produce outputs. Instead, the focus is on whether acquired inputs and acquired substantive processes together significantly contribute to the ability to create outputs. The amendments have also narrowed the definition of outputs to focus on goods or services provided to customers, investment income or other income from ordinary activities. Furthermore, the amendments provide guidance to assess whether an acquired process is substantive and introduce an optional fair value concentration test to permit a simplified assessment of whether an acquired set of activities and assets is not a business. The Group expects to adopt the amendments prospectively from January 1, 2020. Since the amendments apply prospectively to transactions or other events that occur on or after the date of first application, the Group will not be affected by these amendments on the date of transition.
Amendments to IFRS 9, IAS 39 and IFRS 7 Interest Rate Benchmark ReformAmendments to IFRS 9, IAS 39 and IFRS 7 address the effects of interbank offered rate reform on financial reporting. The amendments provide temporary reliefs which enable hedge accounting to continue during the period of uncertainty before the replacement of an existing interest rate benchmark. In addition, the amendments require companies to provide additional information to investors about their hedging relationships which are directly affected by these uncertainties. The amendments are effective for annual periods beginning on or after January 1, 2020. Early application is permitted. The amendments are not expected to have any significant impact on the Group’s financial statements.
Amendments to IFRS 10 and IAS 28 Sale or Contribution of Assets between an Investor and its AssociateAmendments to IFRS 10 and IAS 28 address an inconsistency between the requirements in IFRS 10 and in IAS 28 in dealing with the sale or contribution of assets between an investor and its associate or joint venture. The amendments require a full recognition of a gain or loss when the sale or contribution of assets between an investor and its associate or joint venture constitutes a business. For a transaction involving assets that do not constitute a business, a gain or loss resulting from the transaction is recognised in the investor’s profit or loss only to the extent of the unrelated investor’s interest in that associate or joint venture. The amendments are to be applied prospectively.
Amendments to IAS 1 and IAS 8 Definition of MaterialAmendments to IAS 1 and IAS 8 provide a new definition of material. The new definition states that information is material if omitting, misstating or obscuring it could reasonably be expected to influence decisions that the primary users of general purpose financial statements make on the basis of those financial statements. The amendments clarify that materiality will depend on the nature or magnitude of information. A misstatement of information is material if it could reasonably be expected to influence decisions made by the primary users. The Group expects to adopt the amendments prospectively from January 1, 2020. The amendments are not expected to have any significant impact on the Group’s financial statements.

77ANNUAL REPORT 2019 WH GROUP LIMITED
For the year ended December 31, 2019
Notes to the Consolidated Financial Statements (Continued)
3. SUMMARY OF SIGNIFICANT ACCOUNTING POLICIES Business combinations and goodwill
Acquisitions of businesses are accounted for using the acquisition method. The consideration transferred in business combination is measured at fair value, which is calculated as the sum of the acquisition date fair values of the assets transferred by the Group, liabilities incurred by the Group to the former owners of the acquiree and the equity interests issued by the Group in exchange for control of the acquiree. Acquisition-related costs are recognised in profit or loss as incurred.
At the acquisition date, the identifiable assets acquired and the liabilities assumed are recognised at their fair value, except that:
• deferred tax assets or liabilities, and assets or liabilities related to employee benefit arrangements are recognised and measured in accordance with IAS 12 Income Taxes and IAS 19 Employee Benefits respectively;
• liabilities or equity instruments related to share-based payment arrangements of the acquiree or share-based payment arrangements of the Group entered into to replace share-based payment arrangements of the acquiree are measured in accordance with IFRS 2 Share-based Payment at the acquisition date (see the accounting policy below); and
• assets (or disposal groups) that are classified as held for sale in accordance with IFRS 5 Non-current Assets Held for Sale and Discontinued Operations are measured in accordance with that standard.
Goodwill is measured as the excess of the sum of the consideration transferred, the amount of any non-controlling interests in the acquiree, and the fair value of the acquirer’s previously held equity interest in the acquiree (if any) over the net amount of the identifiable assets acquired and the liabilities assumed as at acquisition date. If, after re-assessment, the net amount of the identifiable assets acquired and liabilities assumed exceeds the sum of the consideration transferred, the amount of any non-controlling interests in the acquiree and the fair value of the acquirer’s previously held interest in the acquiree (if any), the excess is recognised immediately in profit or loss as a bargain purchase gain.
Non-controlling interests that are present ownership interests and entitle their holders to a proportionate share of the relevant subsidiary’s net assets in the event of liquidation are initially measured either at fair value or at the non-controlling interests’ proportionate share of the recognised amounts of the acquiree’s identifiable net assets. The choice of measurement basis is made on a transaction-by-transaction basis.
Goodwill arising on an acquisition of a business is carried at cost as established at the date of acquisition of the business (see the accounting policy above) less any accumulated impairment losses, if any.
For the purposes of impairment testing, goodwill is allocated to each of the Group’s cash-generating units (“CGUs”) (or group of CGUs), that is expected to benefit from the synergies of the combination, which represent the lowest level at which the goodwill is monitored for internal management purposes and not larger than an operating segment.

78 WH GROUP LIMITED ANNUAL REPORT 2019
For the year ended December 31, 2019
Notes to the Consolidated Financial Statements (Continued)
3. SUMMARY OF SIGNIFICANT ACCOUNTING POLICIES (Continued) Business combinations and goodwill (Continued)
A CGU (or group of CGUs) to which goodwill has been allocated is tested for impairment annually, or more frequently when there is indication that the unit may be impaired. For goodwill arising on an acquisition in a reporting period, the CGU (or group of CGUs) to which goodwill has been allocated is tested for impairment before the end of that reporting period. If the recoverable amount is less than its carrying amount, the impairment loss is allocated first to reduce the carrying amount of any goodwill and then to the other assets on a pro-rata basis based on the carrying amount of each asset in the unit (or group of CGUs).
On disposal of the relevant CGU, the attributable amount of goodwill is included in the determination of the amount of profit or loss on disposal.
Fair value measurementFair value is the price that would be received to sell an asset or paid to transfer a liability in an orderly transaction between market participants at the measurement date. The fair value measurement is based on the presumption that the transaction to sell the asset or transfer the liability takes place either in the principal market for the asset or liability, or in the absence of a principal market, in the most advantageous market for the asset or liability. The principal or the most advantageous market must be accessible by the Group. The fair value of an asset or a liability is measured using the assumptions that market participants would use when pricing the asset or liability, assuming that market participants act in their economic best interest.
A fair value measurement of a non-financial asset takes into account a market participant’s ability to generate economic benefits by using the asset in its highest and best use or by selling it to another market participant that would use the asset in its highest and best use.
The Group uses valuation techniques that are appropriate in the circumstances and for which sufficient data are available to measure fair value, maximising the use of relevant observable inputs and minimising the use of unobservable inputs.
All assets and liabilities for which fair value is measured or disclosed in the financial statements are categorised within the fair value hierarchy, described as follows, based on the lowest level input that is significant to the fair value measurement as a whole:
Level 1 — based on quoted prices (unadjusted) in active markets for identical assets or liabilities;Level 2 — based on valuation techniques for which the lowest level input that is significant to the fair
value measurement is observable, either directly or indirectly; andLevel 3 — based on valuation techniques for which the lowest level input that is significant to the fair
value measurement is unobservable.
For assets and liabilities that are recognised in the financial statements on a recurring basis, the Group determines whether transfers have occurred between levels in the hierarchy by reassessing categorisation (based on the lowest level input that is significant to the fair value measurement as a whole) at the end of each reporting period.

79ANNUAL REPORT 2019 WH GROUP LIMITED
For the year ended December 31, 2019
Notes to the Consolidated Financial Statements (Continued)
3. SUMMARY OF SIGNIFICANT ACCOUNTING POLICIES (Continued) Related parties
A party is considered to be related to the Group if:
(a) the party is a person or a close member of that person’s family and that person
(i) has control or joint control over the Group;
(ii) has significant influence over the Group; or
(iii) is a member of the key management personnel of the Group or of a parent of the Group;
or
(b) the party is an entity where any of the following conditions applies:
(i) the entity and the Group are members of the same group;
(ii) one entity is an associate or joint venture of the other entity (or of a parent, subsidiary or fellow subsidiary of the other entity);
(iii) the entity and the Group are joint ventures of the same third party;
(iv) one entity is a joint venture of a third entity and the other entity is an associate of the third entity;
(v) the entity is a post-employment benefit plan for the benefit of employees of either the Group or an entity related to the Group;
(vi) the entity is controlled or jointly controlled by a person identified in (a);
(vii) a person identified in (a)(i) has significant influence over the entity or is a member of the key management personnel of the entity (or of a parent of the entity); and
(viii) the entity, or any member of a group of which it is a part, provides key management personnel services to the Group or to the parent of the Group.

80 WH GROUP LIMITED ANNUAL REPORT 2019
For the year ended December 31, 2019
Notes to the Consolidated Financial Statements (Continued)
3. SUMMARY OF SIGNIFICANT ACCOUNTING POLICIES (Continued) Interests in associates and joint ventures
An associate is an entity over which the Group has significant influence. Significant influence is the power to participate in the financial and operating policy decisions of the investee but is not control or joint control over those policies.
A joint venture is a joint arrangement whereby the parties that have joint control of the arrangement have rights to the net assets of the joint arrangement. Joint control is the contractually agreed sharing of control of an arrangement, which exists only when decisions about the relevant activities require the unanimous consent of the parties sharing control.
The results and assets and liabilities of associates and joint ventures are incorporated in the consolidated financial statements using the equity method of accounting. Adjustments are made to bring into line any dissimilar accounting policies that may exist. The financial statements of associates or joint ventures used for equity method accounting purposes are prepared using uniform accounting policies as those of the Group for like transactions and events in similar circumstances. Under the equity method, an investment in an associate or a joint venture is initially recognised in the consolidated statement of financial position at cost and adjusted thereafter to recognise the Group’s share of the profit or loss and other comprehensive income of the associate or joint venture. When the Group’s share of losses of an associate or joint venture exceeds the Group’s interest in that associate or joint venture (which includes any long-term interests that, in substance, form part of the Group’s net investment in the associate or joint venture), the Group discontinues recognising its share of further losses. Additional losses are recognised only to the extent that the Group has incurred legal or constructive obligations or made payments on behalf of that associate or joint venture.
An investment in an associate or a joint venture is accounted for using the equity method from the date on which the investee becomes an associate or a joint venture. On acquisition of the investment in an associate or a joint venture, any excess of the cost of the investment over the Group’s share of the net fair value of the identifiable assets and liabilities of the investee is recognised as goodwill, which is included within the carrying amount of the investment.
Any excess of the Group’s share of the net fair value of the identifiable assets and liabilities and contingent liabilities over the cost of acquisition, after reassessment, is recognised immediately in profit or loss in the period in which the investment is acquired.
The Group assesses whether there is an objective evidence that the interest in an associate or a joint venture may be impaired. When any objective evidence exists, the entire carrying amount of the investment (including goodwill) is tested for impairment in accordance with IAS 36 Impairment of Assets as a single asset by comparing its recoverable amount (higher of value in use and fair value less costs of disposal) with its carrying amount. Any impairment loss recognised forms part of the carrying amount of the investment. Any reversal of that impairment loss is recognised in accordance with IAS 36 to the extent that the recoverable amount of the investment subsequently increases.
81ANNUAL REPORT 2019 WH GROUP LIMITED
For the year ended December 31, 2019
Notes to the Consolidated Financial Statements (Continued)
3. SUMMARY OF SIGNIFICANT ACCOUNTING POLICIES (Continued) Interests in associates and joint ventures (Continued)
When the Group ceases to have significant influence over an associate or joint control over a joint venture, it is accounted for as a disposal of the entire interest in the investee with a resulting gain or loss being recognised in profit or loss. If an investment in an associate becomes an investment in a joint venture or vice versa, the retained interest is not remeasured. In other cases, the Group measures and recognises any retained investment at its fair value. The difference between the carrying amount of the associate or joint venture and the fair value of any retained interest and any proceeds from disposing the relevant interest in the associate or joint venture is included in the determination of the gain or loss on disposal of the associate or joint venture. In addition, the Group accounts for all amounts previously recognised in other comprehensive income in relation to that associate or joint venture on the same basis as would be required if that associate or joint venture had directly disposed of the related assets or liabilities. Therefore, if a gain or loss previously recognised in other comprehensive income by that associate or joint venture would be reclassified to profit or loss on the disposal of the related assets or liabilities, the Group reclassifies the gain or loss from equity to profit or loss (as a reclassification adjustment) when the equity method is discontinued.
When a group entity transacts with an associate or joint venture of the Group, profits and losses resulting from the transactions with the associate or joint venture are recognised in the consolidated financial statements only to the extent of interests in the associate that are not related to the Group.
Revenue recognition Revenue from contracts with customers
Revenue from contracts with customers is recognised when control of goods or services is transferred to the customers at an amount that reflects the consideration to which the Group expects to be entitled in exchange for those goods or services.
Control of the goods or services is transferred over time if the Group’s performance:
• provides all of the benefits received and consumed simultaneously by the customer;
• creates or enhances an asset that the customer controls as the Group performs; or
• does not create an asset with an alternative use to the Group and the Group has an enforceable right to payment for performance completed to date.
If control of the asset transfers over time, revenue is recognised over the period of the contract by reference to the progress towards complete satisfaction of that performance obligation. Otherwise, revenue is recognised at a point in time when the customer obtains control of the asset.
The progress towards complete satisfaction of the performance obligation is measured based on the Group’s efforts or inputs to the satisfaction of the performance obligation relative to the total expected efforts or inputs.
Depending on the terms of the contract and the laws that apply to the contract, the control of the goods or services may be transferred over time or at a point in time.

82 WH GROUP LIMITED ANNUAL REPORT 2019
For the year ended December 31, 2019
Notes to the Consolidated Financial Statements (Continued)
3. SUMMARY OF SIGNIFICANT ACCOUNTING POLICIES (Continued) Revenue recognition (Continued) Revenue from contracts with customers (Continued)
When the consideration in a contract includes a variable amount, the amount of consideration is estimated to which the Group will be entitled in exchange for transferring the goods or services to the customer. The variable consideration is estimated at contract inception and constrained until it is highly probable that a significant revenue reversal in the amount of cumulative revenue recognised will not occur when the associated uncertainty with the variable consideration is subsequently resolved.
When the contract contains a financing component which provides the customer with a significant benefit of financing the transfer of goods or services to the customer for more than one year, revenue is measured at the present value of the amount receivable, discounted using the discount rate that would be reflected in a separate financing transaction between the Group and the customer at contract inception. When the contract contains a financing component which provides the Group a significant financial benefit for more than one year, revenue recognised under the contract includes the interest expense accreted on the contract liability under the effective interest method. For a contract where the period between the payment by the customer and the transfer of the promised goods or services is one year or less, the transaction price is not adjusted for the effects of a significant financing component, using the practical expedient in IFRS 15.
Revenue from the sale of meat and related products is recognised at the point in time when control of the asset is transferred to the customer, generally on delivery of the meat and related products.
Payment is generally due within 30 to 90 days from delivery, except for new customers, where payment in advance is normally required. Some contracts for the sales of meat and related products provide customers with a right of return and rebates which give rise to variable consideration subject to constraint.
Service income is recognised over time when services are rendered because the customer simultaneously receives and consumes the benefit provided by the Group.
Revenue from other sourcesInterest income is recognised on an accrual basis using the effective interest method by applying the rate that exactly discounts the estimated future cash receipts over the expected life of the financial instrument or a shorter period, when appropriate, to the net carrying amount of the financial asset.
Dividend income is recognised when the shareholders’ right to receive payment has been established, it is probable that the economic benefits associated with the dividend will flow to the Group and the amount of the dividend can be measured reliably.

83ANNUAL REPORT 2019 WH GROUP LIMITED
For the year ended December 31, 2019
Notes to the Consolidated Financial Statements (Continued)
3. SUMMARY OF SIGNIFICANT ACCOUNTING POLICIES (Continued) Contract assets
A contract asset is the right to consideration in exchange for goods or services transferred to the customer. If the Group performs by transferring goods or services to a customer before the customer pays consideration or before payment is due, a contract asset is recognised for the earned consideration that is conditional. Contract assets are subject to impairment assessment, details of which are included in the accounting policies for impairment of financial assets.
Contract liabilitiesA contract liability is recognised when a payment is received or a payment is due (whichever is earlier) from a customer before the Group transfers the related goods or services. Contract liabilities are recognised as revenue when the Group performs under the contract (i.e., transfers control of the related goods or services to the customer).
Contract costsOther than the costs which are capitalised as inventories, properties under development, property, plant and equipment and intangible assets, costs incurred to fulfil a contract with a customer are capitalised as an asset if all of the following criteria are met:
(a) the costs relate directly to a contract or to an anticipated contract that the entity can specifically identify;
(b) the costs generate or enhance resources of the entity that will be used in satisfying (or in continuing to satisfy) performance obligations in the future; and
(c) the costs are expected to be recovered.
The capitalised contract costs are amortised and charged to profit or loss on a systematic basis that is consistent with the pattern of the revenue to which the asset related is recognised. Other contract costs are expensed as incurred.
Right-of-return assetsA right-of-return asset is recognised for the right to recover the goods expected to be returned by customers. The asset is measured at the former carrying amount of the goods to be returned, less any expected costs to recover the goods and any potential decreases in the value of the returned goods. The Group updates the measurement of the asset for any revisions to the expected level of returns and any additional decreases in the value of the returned goods.
Refund liabilitiesA refund liability is recognised for the obligation to refund some or all of the consideration received (or receivable) from a customer and is measured at the amount the Group ultimately expects it will have to return to the customer. The Group updates its estimates of refund liabilities (and the corresponding change in the transaction price) at the end of each reporting period.

84 WH GROUP LIMITED ANNUAL REPORT 2019
For the year ended December 31, 2019
Notes to the Consolidated Financial Statements (Continued)
3. SUMMARY OF SIGNIFICANT ACCOUNTING POLICIES (Continued) Leases (applicable from January 1, 2019)
The Group assesses at contract inception whether a contract is, or contains, a lease. A contract is, or contains, a lease if the contract conveys the right to control the use of an identified asset for a period of time in exchange for consideration.
Group as a lesseeThe Group applies a single recognition and measurement approach for all leases, except for short-term leases. The Group recognises lease liabilities to make lease payments and right-of-use assets representing the right to use the underlying assets.
(a) Right-of-use assetsRight-of-use assets are recognised at the commencement date of the lease (that is the date the underlying asset is available for use). Right-of-use assets are measured at cost, less any accumulated depreciation and any impairment losses, and adjusted for any remeasurement of lease liabilities. The cost of right-of-use assets includes the amount of lease liabilities recognised, initial direct costs incurred, and lease payments made at or before the commencement date less any lease incentives received. Right-of-use assets are depreciated on a straight-line basis over the shorter of the lease terms and the estimated useful lives of the assets as follows:
Leasehold land more than 1 year to 47 yearsBuildings more than 1 year to 24 yearsMotor vehicles more than 1 year to 6 yearsPlant, machinery and equipment more than 1 year to 15 yearsContract farms more than 1 year to 15 years
If ownership of the leased asset transfers to the Group by the end of the lease term or the cost reflects the exercise of a purchase option, depreciation is calculated using the estimated useful life of the asset.
When the right-of-use assets relates to interests in leasehold land held as properties under development, they are subsequently measured at the lower of cost and net realisable value in accordance with the Group’s policy for “Properties under development”.

85ANNUAL REPORT 2019 WH GROUP LIMITED
For the year ended December 31, 2019
Notes to the Consolidated Financial Statements (Continued)
3. SUMMARY OF SIGNIFICANT ACCOUNTING POLICIES (Continued) Leases (applicable from January 1, 2019) (Continued) Group as a lessee (Continued) (b) Lease liabilities
Lease liabilities are recognised at the commencement date of the lease at the present value of lease payments to be made over the lease term. The lease payments include fixed payments (including in-substance fixed payments) less any lease incentives receivable, variable lease payments that depend on an index or a rate, and amounts expected to be paid under residual value guarantees. The lease payments also include the exercise price of a purchase option reasonably certain to be exercised by the Group and payments of penalties for termination of a lease, if the lease term reflects the Group exercising the option to terminate. The variable lease payments that do not depend on an index or a rate are recognised as an expense in the period in which the event or condition that triggers the payment occurs.
In calculating the present value of lease payments, the Group uses its incremental borrowing rate at the lease commencement date because the interest rate implicit in the lease is not readily determinable. After the commencement date, the amount of lease liabilities is increased to reflect the accretion of interest and reduced for the lease payments made. In addition, the carrying amount of lease liabilities is remeasured if there is a modification, a change in the lease term, a change in lease payments (e.g., a change to future lease payments resulting from a change in an index or rate) or a change in assessment of an option to purchase the underlying asset.
The Group’s lease liabilities are separately disclosed in the consolidated statement of financial position.
(c) Short-term leasesThe Group applies the short-term lease recognition exemption to its short-term leases of buildings, plant, machinery and equipment and motor vehicles, (that is those leases that have a lease term of 12 months or less from the commencement date and do not contain a purchase option). Lease payments on short-term leases are recognised as an expense on a straight-line basis over the lease term.
Group as a lessorWhen the Group acts as a lessor, it classifies at lease inception (or when there is a lease modification) each of its leases as either an operating lease or a finance lease.
Leases in which the Group does not transfer substantially all the risks and rewards incidental to ownership of an asset are classified as operating leases. When a contract contains lease and non-lease components, the Group allocates the consideration in the contract to each component on a relative stand-alone selling price basis. Rental income is accounted for on a straight-line basis over the lease terms and is recognised in “Other income” in profit or loss. Initial direct costs incurred in negotiating and arranging an operating lease are added to the carrying amount of the leased asset and recognised over the lease term on the same basis as rental income. Contingent rents are recognised as revenue in the period in which they are earned.
Leases that transfer substantially all the risks and rewards incidental to ownership of an underlying asset to the lessee are accounted for as finance leases.

86 WH GROUP LIMITED ANNUAL REPORT 2019
For the year ended December 31, 2019
Notes to the Consolidated Financial Statements (Continued)
3. SUMMARY OF SIGNIFICANT ACCOUNTING POLICIES (Continued) Leases (applicable before January 1, 2019)
Leases are classified as finance leases whenever the terms of the lease transfer substantially all the risks and rewards of ownership to the lessee. All other leases are classified as operating leases.
Group as a lesseeAssets held under finance leases are recognised as assets of the Group at their fair value at the inception of the lease or, if lower, at the present value of the minimum lease payments. The corresponding liability to the lessor is included in the consolidated statement of financial position as a finance lease obligation.
Lease payments are apportioned between finance expenses and reduction of the lease obligation so as to achieve a constant rate of interest on the remaining balance of the liability. Finance charges are recognised immediately in profit or loss as finance costs, unless they are directly attributable to qualifying assets, in which case they are capitalised in accordance with the Group’s general policy on borrowing costs (see the accounting policy below).
Operating lease payments are recognised as an operating expense on a straight-line basis over the lease term, except where another systematic basis is more representative of the time pattern in which economic benefits from the leased asset are consumed.
Group as a lessorRental income from operating leases is recognised in profit or loss on a straight-line basis over the term of the relevant lease. Initial direct costs incurred in negotiating and arranging an operating lease are added to the carrying amount of the leased asset and recognised over the lease term on the same basis as rental income. Contingent rents are recognised as revenue in the period in which they are earned.
87ANNUAL REPORT 2019 WH GROUP LIMITED
For the year ended December 31, 2019
Notes to the Consolidated Financial Statements (Continued)
3. SUMMARY OF SIGNIFICANT ACCOUNTING POLICIES (Continued) Property, plant and equipment
Property, plant and equipment, including buildings held for use in the production or supply of goods or services, or for administrative purposes other than properties under construction, as described below, are stated in the consolidated statement of financial position at cost less subsequent accumulated depreciation and subsequent accumulated impairment losses, if any.
Freehold land is not depreciated.
Depreciation is recognised so as to write off the cost of items of property, plant and equipment other than freehold land and properties under construction less their residual values over their estimated useful lives, using the straight-line method. The estimated useful lives, residual values and depreciation method are reviewed at the end of each reporting period, with the effect of any changes in estimate accounted for on the following basis:
Buildings 10 to 40 yearsMotor vehicles 3 to 10 yearsPlant, machinery and equipment 5 to 25 years
Construction in progress for production, supply or administrative purposes are carried at cost, less any recognised impairment loss. Costs include professional fees and, for qualifying assets, borrowing costs capitalised in accordance with the Group’s accounting policy. Such assets are classified to the appropriate categories of property, plant and equipment when completed and ready for intended use. Depreciation of these assets commences when the assets are ready for their intended use.
Assets held under finance leases (before January 1, 2019) are depreciated over their expected useful lives on the same basis as the Group’s own assets. However, when there is no reasonable certainty that ownership will be obtained by the end of the lease term, assets are depreciated over the shorter of the lease term and their useful lives.
An item of property, plant and equipment is derecognised upon disposal or when no future economic benefits are expected to arise from the continued use of the asset. Any gain or loss arising on the derecognition of an item of property, plant and equipment determined as the difference between the sales proceeds and the carrying amount of the asset is recognised in profit or loss.

88 WH GROUP LIMITED ANNUAL REPORT 2019
For the year ended December 31, 2019
Notes to the Consolidated Financial Statements (Continued)
3. SUMMARY OF SIGNIFICANT ACCOUNTING POLICIES (Continued) Properties under development
Properties under development are stated at the lower of cost and net realisable value and comprise land costs, construction costs, borrowing costs, professional fees and other costs directly attributable to such properties incurred during the development period.
Properties under development are classified as current assets unless the construction period of the relevant property development project is expected to complete beyond the normal operating cycle. On completion, the properties are transferred to completed properties held for sale.
Borrowing costsBorrowing costs directly attributable to the acquisition, construction or production of qualifying assets, which are assets that necessarily take a substantial period of time to get ready for their intended use or sale, are added to the cost of those assets until such time as the assets are substantially ready for their intended use or sale.
All other borrowing costs are recognised in profit or loss in the period in which they are incurred.
Biological assetsBiological assets represent live hogs and poultry, which fall into five categories: suckling hogs, nursery hogs, finisher hogs, broilers and breeding stock (hogs and poultry). They are measured on initial recognition and at the end of each reporting period at their fair value less costs to sell. A gain or loss arising on initial recognition of biological asset at fair value less costs to sell and from a change in fair value less costs to sell of a biological asset is included in profit or loss for the period in which it arises.
The agricultural produce (i.e. carcass) harvested from the biological assets is measured at its fair value less costs to sell at the point of harvest. Such measurement is the cost at that date when applying IAS 2 Inventories upon initial recognition. A gain or loss arising from agricultural produce at the point of harvest at fair value less costs to sell is included in profit or loss for the period in which it arises.
Intangible assets Intangible assets acquired in a business combination
Intangible assets acquired in a business combination and recognised separately from goodwill are initially recognised at their fair value at the acquisition date (which is regarded as their cost).
Subsequent to initial recognition, intangible assets acquired in a business combination with finite useful lives are reported at cost less accumulated amortisation and any accumulated impairment losses, on the same basis as intangible assets that are acquired separately. Alternatively, intangible assets acquired in a business combination with indefinite useful lives are carried at cost less accumulated impairment losses (see the accounting policy in respect of impairment losses on tangible and intangible assets below).
Intangible assets acquired separatelyIntangible assets with finite useful lives that are acquired separately are carried at cost less accumulated amortisation and any accumulated impairment losses. Amortisation for intangible assets with finite useful lives is recognised on a straight-line basis over their estimated useful lives. The estimated useful life and amortisation method are reviewed at the end of each reporting period, with the effect of any changes in estimate being accounted for on a prospective basis.

89ANNUAL REPORT 2019 WH GROUP LIMITED
For the year ended December 31, 2019
Notes to the Consolidated Financial Statements (Continued)
3. SUMMARY OF SIGNIFICANT ACCOUNTING POLICIES (Continued) Intangible assets (Continued) Internally-generated intangible assets — Research and development expenditure
Expenditure on research activities is recognised as an expense in the period in which it is incurred.
An internally-generated intangible asset arising from development activities (or from the development phase of an internal project) is recognised if, and only if, all of the following have been demonstrated:
• the technical feasibility of completing the intangible asset so that it will be available for use or sale;
• the intention to complete and its ability and intention to use or sell the asset;
• how the intangible asset will generate probable future economic benefits;
• the availability of adequate technical, financial and other resources to complete the development and to use or sell the intangible asset; and
• the ability to measure reliably the expenditure attributable to the intangible asset during its development.
The amount initially recognised for internally-generated intangible assets is the sum of the expenditure incurred from the date when the intangible asset first meets the recognition criteria listed above. Where no internally-generated intangible asset can be recognised, development expenditure is recognised in profit or loss in the period in which it is incurred.
Derecognition of intangible assetsAn intangible asset is derecognised on disposal, or when no future economic benefits are expected from use or disposal. Gains and losses arising from derecognition of an intangible asset, measured as the difference between the net disposal proceeds and the carrying amount of the asset, are recognised in profit or loss when the asset is derecognised.
InventoriesInventories are stated at the lower of cost or the deemed cost for agriculture produce harvested from biological assets and net realisable value. Cost is calculated using the weighted-average method.

90 WH GROUP LIMITED ANNUAL REPORT 2019
For the year ended December 31, 2019
Notes to the Consolidated Financial Statements (Continued)
3. SUMMARY OF SIGNIFICANT ACCOUNTING POLICIES (Continued) Impairment on tangible and intangible assets other than goodwill (see the accounting policy in respect
of goodwill above)At the end of each reporting period, the Group reviews the carrying amounts of its tangible and intangible assets with finite useful lives to determine whether there is any indication that those assets have suffered an impairment loss. If any such indication exists, the recoverable amount of the asset is estimated in order to determine the extent of the impairment loss, if any. When it is not possible to estimate the recoverable amount of an individual asset, the Group estimates the recoverable amount of the CGU to which the asset belongs. When a reasonable and consistent basis of allocation can be identified, corporate assets are also allocated to individual CGUs, or otherwise they are allocated to the smallest group of CGUs for which a reasonable and consistent allocation basis can be identified.
Intangible assets with indefinite useful lives and intangible assets not yet available for use are tested for impairment at least annually, and whenever there is an indication that they may be impaired.
Recoverable amount is the higher of fair value less costs of disposal and value in use. In assessing value in use, the estimated future cash flows are discounted to their present value using a pre-tax discount rate that reflects current market assessments of the time value of money and the risks specific to the asset for which the estimates of future cash flows have not been adjusted.
If the recoverable amount of an asset (or a CGU) is estimated to be less than its carrying amount, the carrying amount of the asset (or a CGU) is reduced to its recoverable amount. In allocating the impairment loss, the impairment loss is allocated first to reduce the carrying amount of any goodwill (if applicable) and then to the other assets on a pro-rata basis based on the carrying amount of each asset in the unit. The carrying amount of an asset is not reduced below the highest of its fair value less costs of disposal (if measurable), its value in use (if determinable) and zero. The amount of the impairment loss that would otherwise have been allocated to the asset is allocated pro rata to the other assets of the unit. An impairment loss is recognised immediately in profit or loss.
Where an impairment loss subsequently reverses, the carrying amount of the asset (or CGU) is increased to the revised estimate of its recoverable amount, so that the increased carrying amount does not exceed the carrying amount that would have been determined had no impairment loss been recognised for the asset (or a CGU) in prior years. A reversal of an impairment loss is recognised immediately in profit or loss.

91ANNUAL REPORT 2019 WH GROUP LIMITED
For the year ended December 31, 2019
Notes to the Consolidated Financial Statements (Continued)
3. SUMMARY OF SIGNIFICANT ACCOUNTING POLICIES (Continued) Financial instruments
Financial assets and financial liabilities are recognised when a group entity becomes a party to the contractual provisions of the instrument.
Transaction costs that are directly attributable to the acquisition or issue of financial assets and financial liabilities (other than financial assets or financial liabilities at fair value through profit or loss (“FVPL”)) are added to or deducted from the fair value of the financial assets or financial liabilities, as appropriate, on initial recognition. Transaction costs directly attributable to the acquisition of financial assets or financial liabilities at FVPL are recognised immediately in profit or loss.
Financial assets Initial recognition and measurement
Financial assets are classified, at initial recognition, as subsequently measured at amortised cost, fair value through other comprehensive income (“FVOCI”), and FVPL.
The classification of financial assets at initial recognition depends on the financial asset’s contractual cash flow characteristics and the Group’s business model for managing them. With the exception of trade receivables that do not contain a significant financing component or for which the Group has applied the practical expedient of not adjusting the effect of a significant financing component, the Group initially measures a financial asset at its fair value, plus in the case of a financial asset not at fair value through profit or loss, transaction costs. Trade receivables that do not contain a significant financing component or for which the Group has applied the practical expedient are measured at the transaction price determined under IFRS 15 in accordance with the policies set out for “Revenue recognition” above.
In order for a financial asset to be classified and measured at amortised cost or fair value through other comprehensive income, it needs to give rise to cash flows that are solely payments of principal and interest (“SPPI”) on the principal amount outstanding. Financial assets with cash flows that are not SPPI are classified and measured at fair value through profit or loss, irrespective of the business model.
The Group’s business model for managing financial assets refers to how it manages its financial assets in order to generate cash flows. The business model determines whether cash flows will result from collecting contractual cash flows, selling the financial assets, or both. Financial assets classified and measured at amortised cost are held within a business model with the objective to hold financial assets in order to collect contractual cash flows, while financial assets classified and measured at fair value through other comprehensive income are held within a business model with the objective of both holding to collect contractual cash flows and selling. Financial assets which are not held within the aforementioned business models are classified and measured at fair value through profit or loss.
All regular way purchases and sales of financial assets are recognised on the trade date, that is, the date that the Group commits to purchase or sell the asset. Regular way purchases or sales are purchases or sales of financial assets that require delivery of assets within the period generally established by regulation or convention in the marketplace.

92 WH GROUP LIMITED ANNUAL REPORT 2019
For the year ended December 31, 2019
Notes to the Consolidated Financial Statements (Continued)
3. SUMMARY OF SIGNIFICANT ACCOUNTING POLICIES (Continued) Financial instruments (Continued) Financial assets (Continued) Subsequent measurement
The subsequent measurement of financial assets depends on their classification as follows:
Financial assets at amortised cost (debt instruments)The Group’s financial assets at amortised cost includes trade, bills and other receivables, pledged/restricted bank deposits and bank balances and cash are subsequently measured using the effective interest method and are subject to impairment. Gains and losses are recognised in profit or loss when the asset is derecognised, modified or impaired.
Financial assets at FVPLFinancial assets at FVPL are carried in the statement of financial position at fair value with net changes in fair value recognised in profit or loss.
This category includes derivative and unquoted equity instruments which the Group had not irrevocably elected to classify at FVOCI. Dividends on equity investments classified as financial assets at FVPL are also recognised as other income in profit or loss when the right of payment has been established, it is probable that the economic benefits associated with the dividend will flow to the Group and the amount of the dividend can be measured reliably.

93ANNUAL REPORT 2019 WH GROUP LIMITED
For the year ended December 31, 2019
Notes to the Consolidated Financial Statements (Continued)
3. SUMMARY OF SIGNIFICANT ACCOUNTING POLICIES (Continued) Financial instruments (Continued) Financial assets (Continued) Subsequent measurement (Continued) Impairment of financial assets
The Group recognises an allowance for expected credit losses (“ECLs”) for all debt instruments not held at FVPL. ECLs are based on the difference between the contractual cash flows due in accordance with the contract and all the cash flows that the Group expects to receive, discounted at an approximation of the original effective interest rate. The expected cash flows will include cash flows from the sale of collateral held or other credit enhancements that are integral to the contractual terms.
General approachECLs are recognised in two stages. For credit exposures for which there has not been a significant increase in credit risk since initial recognition, ECLs are provided for credit losses that result from default events that are possible within the next 12 months (a 12-month ECL). For those credit exposures for which there has been a significant increase in credit risk since initial recognition, a loss allowance is required for credit losses expected over the remaining life of the exposure, irrespective of the timing of the default (a lifetime ECL).
At each reporting date, the Group assesses whether the credit risk on a financial instrument has increased significantly since initial recognition. When making the assessment, the Group compares the risk of a default occurring on the financial instrument as at the reporting date with the risk of a default occurring on the financial instrument as at the date of initial recognition and considers reasonable and supportable information that is available without undue cost or effort, including historical and forward-looking information.
Financial assets at amortised cost are subject to impairment under the general approach and they are classified within the following stages for measurement of ECLs except for trade receivables which apply the simplified approach as detailed below.
Stage 1 — Financial instruments for which credit risk has not increased significantly since initial recognition and for which the loss allowance is measured at an amount equal to 12-month ECLs
Stage 2 — Financial instruments for which credit risk has increased significantly since initial recognition but that are not credit-impaired financial assets and for which the loss allowance is measured at an amount equal to lifetime ECLs
Stage 3 — Financial assets that are credit-impaired at the reporting date (but that are not purchased or originated credit-impaired) and for which the loss allowance is measured at an amount equal to lifetime ECLs
94 WH GROUP LIMITED ANNUAL REPORT 2019
For the year ended December 31, 2019
Notes to the Consolidated Financial Statements (Continued)
3. SUMMARY OF SIGNIFICANT ACCOUNTING POLICIES (Continued) Financial instruments (Continued) Financial assets (Continued) Subsequent measurement (Continued) Impairment of financial assets (Continued)
Simplified approachFor trade receivables that do not contain a significant financing component or when the Group applies the practical expedient of not adjusting the effect of a significant financing component, the Group applies the simplified approach in calculating ECLs. Under the simplified approach, the Group does not track changes in credit risk, but instead recognises a loss allowance based on lifetime ECLs at each reporting date. The Group has established a provision matrix that is based on its historical credit loss experience, adjusted for forward-looking factors specific to the debtors and the economic environment.
For trade receivables that contain a significant financing component, the Group chooses as its accounting policy to adopt the simplified approach in calculating ECLs with policies as described above.
Financial liabilities and equity instrumentsDebt and equity instruments issued by a group entity are classified as either financial liabilities or as equity in accordance with the substance of the contractual arrangements and the definitions of a financial liability and an equity instrument.
Equity instrumentsAn equity instrument is any contract that evidences a residual interest in the assets of an entity after deducting all of its liabilities. Equity instruments issued by the Company are recorded at the proceeds received, net of direct issue costs.
Financial liabilities at amortised costFinancial liabilities, including borrowings, bank overdrafts, and trade and other payables, are subsequently measured at amortised cost, using the effective interest method.
Effective interest methodThe effective interest method is a method of calculating the amortised cost of a financial liability and of allocating interest expense during the year. The effective interest rate is the rate that exactly discounts estimated future cash payments (including all fees and points paid or received that form an integral part of the effective interest rate, transaction costs and other premiums or discounts) through the expected life of the financial liability, or, where appropriate, a shorter period to the net carrying amount on initial recognition. Interest expense is recognised on an effective interest basis.
95ANNUAL REPORT 2019 WH GROUP LIMITED
For the year ended December 31, 2019
Notes to the Consolidated Financial Statements (Continued)
3. SUMMARY OF SIGNIFICANT ACCOUNTING POLICIES (Continued) Financial instruments (Continued) Offsetting of financial instruments
Financial assets and financial liabilities are offset and the net amount is reported in the consolidated statement of financial position if there is a currently enforceable legal right to offset the recognised amounts and there is an intention to settle on a net basis, or to realise the assets and settle the liabilities simultaneously.
Derivative financial instrumentsDerivatives are initially recognised at fair value at the date when derivative contracts are entered into and are subsequently remeasured to their fair value at the end of the reporting period. The resulting gain or loss is recognised in profit or loss immediately unless the derivative is designated and effective as a hedging instrument, in which event the timing of the recognition in profit or loss depends on the nature of the hedge relationship.
Hedge accountingThe Group designates certain derivatives as hedging instruments for fair value hedges and cash flow hedges.
At the inception of a hedging relationship, the Group documents the relationship between the hedging instrument and the hedged item, along with its risk management objectives and its strategy for undertaking various hedge transactions. Furthermore, at the inception of the hedge and on an ongoing basis, the Group documents whether the hedging instrument is highly effective in offsetting changes in fair values or cash flows of the hedged item attributable to the hedge risk.
Fair value hedgesChanges in the fair value of derivatives that are designated and qualify as fair value hedges are recognised in profit or loss immediately, together with any changes in the fair value of the hedged asset or liability that are attributable to the hedged risk. The change in the fair value of the hedging instrument and the change in the hedged item attributable to the hedged risk are recognised in profit or loss in the line item relating to the hedged item.
Hedge accounting is discontinued when the Group revokes the hedging relationship, when the hedging instrument expires or is sold, terminated, or exercised, or when it no longer qualifies for hedge accounting. The fair value adjustment to the carrying amount of the hedged item arising from the hedged risk is recognised to profit or loss from that date.
96 WH GROUP LIMITED ANNUAL REPORT 2019
For the year ended December 31, 2019
Notes to the Consolidated Financial Statements (Continued)
3. SUMMARY OF SIGNIFICANT ACCOUNTING POLICIES (Continued) Financial instruments (Continued) Derivative financial instruments (Continued) Cash flow hedges
The effective portion of changes in the fair value of derivatives that are designated and qualify as cash flow hedges are recognised in other comprehensive income and accumulated in other reserve. The gain or loss relating to the ineffective portion is recognised immediately in profit or loss and is included in the ”Other gains and (losses)” line item.
Amounts previously recognised in other comprehensive income and accumulated in equity (other reserve) are reclassified to profit or loss in the periods when the hedged item affects profit or loss, in the same line of the consolidated statement of profit or loss and other comprehensive income as the recognised hedged item.
Hedge accounting is discontinued when the Group revokes the hedging relationship, when the hedging instrument expires or is sold, terminated, or exercised, or when it no longer qualifies for hedge accounting. Any gain or loss recognised in other comprehensive income and accumulated in equity at that time remains in equity and is recognised when the forecast transaction is ultimately recognised in profit or loss. When a forecast transaction is no longer expected to occur, the gain or loss accumulated in equity is recognised immediately in profit or loss.
DerecognitionThe Group derecognises a financial asset only when the contractual rights to the cash flows from the asset expire, or when it transfers the financial asset and substantially all the risks and rewards of ownership of the asset to another entity. On derecognition of a financial asset in its entirety, the difference between the asset’s carrying amount and the sum of the consideration received and receivable is recognised in profit or loss.
The Group derecognises financial liabilities when, and only when, the Group’s obligations are discharged or cancelled, or expire. The difference between the carrying amount of the financial liability derecognised and the consideration paid and payable is recognised in profit or loss.
ProvisionsProvisions are recognised when the Group has a present obligation (legal or constructive) as a result of a past event, it is probable that the Group will be required to settle that obligation, and a reliable estimate can be made of the amount of the obligation. The amount recognised as a provision is the best estimate of the consideration required to settle the present obligation at the end of the reporting period, taking into account the risks and uncertainties surrounding the obligation. When a provision is measured using the cash flows estimated to settle the present obligation, its carrying amount is the present value of those cash flows (where the effect of the time value of money is material).
When some or all of the economic benefits required to settle a provision are expected to be recovered from a third party, a receivable is recognised as an asset if it is virtually certain that reimbursement will be received and the amount of the receivable can be measured reliably.
97ANNUAL REPORT 2019 WH GROUP LIMITED
For the year ended December 31, 2019
Notes to the Consolidated Financial Statements (Continued)
3. SUMMARY OF SIGNIFICANT ACCOUNTING POLICIES (Continued) Share-based payment arrangements Awarded shares/share options granted to employees
For grants of shares/share options that are conditional upon satisfying specified vesting conditions, the fair value of services received is determined by reference to the fair value of shares/share options granted at the date of grant and is expensed on a straight-line basis over the vesting period, with a corresponding increase in equity (other reserve). For grants of shares/share options that vest immediately at the date of grant, the fair value of the awarded shares is recognised immediately in profit or loss.
At the end of the reporting period, the Group revises its estimates of the number of share options that are expected to ultimately vest. The impact of the revision of the original estimates, if any, is recognised in profit or loss such that the cumulative expense reflects the revised estimate, with a corresponding adjustment to other reserve.
When share options are exercised, the amount previously recognised in other reserve will be transferred to share premium. When the share options are forfeited after the vesting date or are still not exercised at the expiry date, the amount previously recognised in other reserve will be transferred to retained profits.
DividendsFinal dividends are recognised as a liability when they are approved by the shareholders in a general meeting. Proposed final dividends are disclosed in the notes to the financial statements.
Interim dividends are simultaneously proposed and declared, because the Company’s memorandum and articles of association grant the directors the authority to declare interim dividends. Consequently, interim dividends are recognised immediately as a liability when they are proposed and declared.

98 WH GROUP LIMITED ANNUAL REPORT 2019
For the year ended December 31, 2019
Notes to the Consolidated Financial Statements (Continued)
3. SUMMARY OF SIGNIFICANT ACCOUNTING POLICIES (Continued) Taxation
Income tax expense represents the sum of the tax currently payable and deferred tax.
The tax currently payable is based on taxable profit for the year. Taxable profit differs from “profit before tax” as reported in profit or loss because of income or expense that is taxable or deductible in other years and items that are never taxable or deductible. The Group’s liability for current tax is calculated using tax rates that have been enacted or substantively enacted by the end of the reporting period.
Deferred tax is recognised on temporary differences between the carrying amounts of assets and liabilities in the consolidated financial statements and the corresponding tax base used in the computation of taxable profit. Deferred tax liabilities are generally recognised for all taxable temporary differences. Deferred tax assets are generally recognised for all deductible temporary differences that can be utilised. Such deferred tax assets and liabilities are not recognised if the temporary difference arises from the initial recognition (other than in a business combination) of other assets and liabilities in a transaction that affects neither the taxable profit nor the accounting profit.
Deferred tax liabilities are recognised for taxable temporary differences associated with investments in subsidiaries, associates and joint ventures, except where the Group is able to control the reversal of the temporary difference and it is probable that the temporary difference will not reverse in the foreseeable future. Deferred tax assets arising from deductible temporary differences associated with such investments and interests are only recognised to the extent that it is probable that there will be sufficient taxable profits against which to utilise the benefits of the temporary differences and they are expected to reverse in the foreseeable future.
The carrying amount of deferred tax assets is reviewed at the end of each reporting period and reduced to the extent that it is no longer probable that sufficient taxable profits will be available to allow all or part of the asset to be recovered. Unrecognised deferred tax assets are re-assessed at each reporting date and are recognised to the extent that it has become probable that future taxable profits will allow the deferred tax asset to be recovered.
Deferred tax assets and liabilities are measured at the tax rates that are expected to apply in the period in which the liability is settled or the asset is realised, based on tax rates (and tax laws) that have been enacted or substantively enacted by the end of the reporting period.
The measurement of deferred tax liabilities and assets reflects the tax consequences that would follow from the manner in which the Group expects, at the end of the reporting period, to recover or settle the carrying amount of its assets and liabilities.
Current or deferred tax is recognised in profit or loss, except when it relates to items that are recognised in other comprehensive income or directly in equity, in which case the current and deferred tax is also recognised in other comprehensive income or directly in equity respectively.

99ANNUAL REPORT 2019 WH GROUP LIMITED
For the year ended December 31, 2019
Notes to the Consolidated Financial Statements (Continued)
3. SUMMARY OF SIGNIFICANT ACCOUNTING POLICIES (Continued) Foreign currencies
In preparing the financial statements of each individual group entity, transactions in currencies other than the functional currency of that entity (foreign currencies) are recorded at the rates of exchanges prevailing on the dates of the transactions. At the end of the reporting period, monetary items denominated in foreign currencies are retranslated at the rates prevailing at that date. Non-monetary items that are measured in terms of historical cost in a foreign currency are not retranslated.
Exchange differences arising on the settlement of monetary items, and on the retranslation of monetary items are recognised in profit or loss in the period in which they arise.
For the purposes of presenting these consolidated financial statements, the foreign currencies denominated assets and liabilities of the Group are translated into the presentation currency of the Group (US$) using exchange rates prevailing at the end of each reporting period. Income and expense items are translated at the average exchange rates for the year. Exchange differences arising, if any, are recognised in other comprehensive income and accumulated in equity in the translation reserve (attributed to non-controlling interest as appropriate).
In determining the exchange rate on initial recognition of the related asset, expense or income on the derecognition of a non-monetary asset or non-monetary liability relating to an advance consideration, the date of initial transaction is the date on which the Group initially recognises the non-monetary asset or non-monetary liability arising from the advance consideration. If there are multiple payments or receipts in advance, the Group determines the transaction date for each payment or receipt of the advance consideration.
On the disposal of a foreign operation, all of the exchange differences accumulated in equity in respect of that operation attributable to the owners of the Company are reclassified to profit or loss.
Government grantsGovernment grants are recognised where there is reasonable assurance that the Group will comply with the conditions attaching to them and that the grants will be received.
Government grants are recognised in profit or loss on a systematic basis over the periods in which the Group recognises as expenses the related costs for which the grants are intended to compensate. Specifically, government grants whose primary condition is that the Group should purchase, construct or otherwise acquire non-current assets are recognised as deferred revenue in the consolidated statement of financial position and transferred to profit or loss on a systematic and rational basis over the useful lives of the related assets.
Government grants that are receivable as compensation for expenses or losses already incurred or for the purpose of giving immediate financial support to the Group with no future related costs are recognised in profit or loss in the period in which they become receivable.

100 WH GROUP LIMITED ANNUAL REPORT 2019
For the year ended December 31, 2019
Notes to the Consolidated Financial Statements (Continued)
3. SUMMARY OF SIGNIFICANT ACCOUNTING POLICIES (Continued) Cash and cash equivalents
For the purpose of the consolidated statement of cash flows, cash and cash equivalents comprise cash on hand and demand deposits, and short term highly liquid investments that are readily convertible into known amounts of cash, are subject to an insignificant risk of changes in value, and have a short maturity of generally within three months when acquired, less bank overdrafts which are repayable on demand and form an integral part of the Group’s cash management.
For the purpose of the consolidated statement of financial position, cash and cash equivalents comprise cash on hand and at banks, including term deposits and assets similar in nature to cash, which are not restricted as to use.
Retirement benefit costs and termination benefitsFor defined benefit retirement benefit plans, the cost of providing benefits is determined using the projected unit credit method, with actuarial valuations being carried out at the end of the reporting period.
Defined benefit costs are categorised as follows:
• service cost (including current service cost, past service cost, as well as gains and losses on curtailments and settlements);
• net interest expense or income; and
• remeasurement.
The Group presents the first two components of defined benefit costs in profit or loss as employee benefit expense. Curtailment gains and losses are accounted for as past service costs. Past service cost is recognised in profit or loss in the period of a plan amendment. Net interest is calculated by applying the discount rate at the beginning of the period to the net defined benefit liability or asset.
Remeasurement, comprising actuarial gains and losses, the effect of the changes to the asset ceiling (if applicable) and the return on plan assets (excluding interest), is reflected immediately in the consolidated statement of financial position with a charge or credit recognised in other comprehensive income in the period in which they occur. Remeasurement recognised in other comprehensive income is reflected immediately in retained profits and will not be reclassified to profit or loss.

101ANNUAL REPORT 2019 WH GROUP LIMITED
For the year ended December 31, 2019
Notes to the Consolidated Financial Statements (Continued)
3. SUMMARY OF SIGNIFICANT ACCOUNTING POLICIES (Continued) Retirement benefit costs and termination benefits (Continued)
The retirement benefit obligation recognised in the consolidated statement of financial position represents the deficit or surplus in the Group’s defined benefit plans. Any surplus resulting from this calculation is limited to the present value of any economic benefits available in the form of refunds and reductions in future contributions to the plans.
The employees of the Group in China and Hong Kong are members of state-managed retirement benefit schemes and members of the Mandatory Provident Fund Scheme (“MPF”) respectively, the obligations of the Group under which are equivalent to those arising in a defined contribution retirement benefit plan. Contributions to state-managed retirement benefit schemes and MPF are recognised as an expense when employees have rendered services entitling them to the contributions.
Payments to defined contribution retirement benefit plans are recognised as an expense when employees have rendered services entitling them to the contributions.
A liability for a termination benefit is recognised at the earlier of when the Group entity can no longer withdraw the offer of the termination benefit and when it recognises any related restructuring costs.
4. KEY SOURCES OF ESTIMATION UNCERTAINTYThe following are the key assumptions concerning the future and other key sources of estimation uncertainty at the end of the reporting period, that have a significant risk of causing a material adjustment to the carrying amounts of assets and liabilities within the next financial year.
Fair value measurement of live hogs included in biological assetsThe Group engaged an independent qualified valuer to perform the live hog valuations at the end of each reporting period, the fair values less costs to sell are determined based on the price of hogs in the actively traded market, subtracting the breeding costs required to raise the hogs to be slaughtered and the margins that would be required by a raiser and less costs to sell, with reference to the latest budgets approved by management. This determination involved the use of significant judgements and estimates. If the actual results differ to the original estimates made by management, such differences from the original estimates will impact the fair value change recognised in profit or loss in the reporting period. The carrying amount of live hogs was US$1,101 million as at December 31, 2019 (2018: US$942 million) (see note 18).
GoodwillDetermining whether goodwill is impaired requires an estimation of the recoverable amount of the CGUs to which goodwill has been allocated, which is the higher of the value in use or fair value less costs of disposal. The value-in-use calculation requires the management of the Group to estimate the future cash flows expected to arise from the CGUs and a suitable discount rate in order to calculate the present value. Where the actual future cash flows are less than expected, a material impairment loss may arise.
The carrying amount of goodwill was US$1,955 million as at December 31, 2019 (2018: US$1,847 million). Details of the recoverable amount calculation are disclosed in note 19.

102 WH GROUP LIMITED ANNUAL REPORT 2019
For the year ended December 31, 2019
Notes to the Consolidated Financial Statements (Continued)
4. KEY SOURCES OF ESTIMATION UNCERTAINTY (Continued) Intangible assets
In accounting for intangible assets, management of the Group considers the potential impairment based on the recoverable amount. Intangible assets with finite useful lives are reviewed for impairment when events or circumstances indicate the carrying value may not be recoverable; intangible assets with indefinite useful lives are reviewed for impairment annually, irrespective of whether there is any indication that it may be impaired. Factors that would indicate potential impairment may include, but are not limited to, the significant change in technology and operating losses associated with the intangible assets.
Determining whether intangible assets are impaired requires an estimation of the recoverable amount of the CGUs to which intangible assets has been allocated. The recoverable amount of CGUs at the end of each reporting period is based on the higher of the fair value less cost of disposal and value in use. The value-in-use calculation requires the management of the Group to estimate the future cash flows expected to arise from the CGUs and a suitable discount rate in order to calculate the present value. Where the actual future cash flows are less than expected, a material impairment loss may arise.
The carrying amount of intangible assets was US$1,712 million as at December 31, 2019 (2018: US$1,734 million) (see note 20).
InventoriesInventories are stated at the lower of cost or the deemed cost for agriculture produce harvested from biological assets and net realisable value. Net realisable value is the estimated selling price in the ordinary course of business, less the estimated costs of completion and selling expenses.
Management of the Group periodically reviews inventories for slow-moving inventories, obsolescence or declines in market value. This review requires them to estimate the net realisable value based upon assumptions about future demand and market conditions. If the estimate of net realisable value is below the cost of inventories, the Group will record a write-down of inventories for the difference between cost and net realisable value, which will result in a corresponding increase in cost of sales. If the net realisable value is less than the carrying amount, write-down on inventories may be required. The carrying amount of inventories was US$2,903 million as at December 31, 2019 (2018: US$2,022 million) (see note 23).
Valuation of the obligation in respect of defined benefit plansIn determining the obligation in respect of defined benefit plans, the Group has engaged an actuarial expert to perform the actuarial valuation of plan assets and the present value of the defined benefit obligations, and the key assumptions used including discount rates, expected salary increases and mortality rates. The discount rates assumptions are determined by reference to yields on high-quality corporate bonds and government bonds yields of appropriate duration and currency at the end of the reporting period. The expected returns on plan assets are determined on the historical returns and asset allocations by considering the future market and economic conditions. The expected rate of salary increase is referenced by the salary scale projected by management and the mortality rates are referenced by demographic market data.
During the year ended December 31, 2019, remeasurement losses after tax effect amounting to US$143 million were recognised directly in equity in the period in which they occurred (2018: US$6 million). The Group’s obligation in respect of net pension liability as at December 31, 2019 amounted to US$566 million (2018: US$446 million) (see note 35).

103ANNUAL REPORT 2019 WH GROUP LIMITED
For the year ended December 31, 2019
Notes to the Consolidated Financial Statements (Continued)
5. REVENUE AND SEGMENT INFORMATIONAn analysis of revenue is as follows:
2019 2018US$’million US$’million
Packaged meats 12,331 12,147Fresh pork 10,078 9,136Hog production 937 688Others 757 634
24,103 22,605
More than 99% (2018: more than 99%) of the Group’s revenue was recognised at a point in time.
Set out below is the amount of revenue recognised from:
2019 2018US$’million US$’million
Amounts included in contract liabilities at the beginning of the year 148 98
The remaining performance obligations (unsatisfied or partially unsatisfied) as at December 31, 2019 and December 31, 2018 regarding the sale of meat and related products and service income are expected to be recognised as revenue within one year.

104 WH GROUP LIMITED ANNUAL REPORT 2019
For the year ended December 31, 2019
Notes to the Consolidated Financial Statements (Continued)
5. REVENUE AND SEGMENT INFORMATION (Continued) Segment information
The Group determines its operating segments based on the reports reviewed by the executive directors of the Company who are also the chief operating decision makers that are used to make strategic decisions. The Group’s reportable segments, which are also the operating segments, are classified based on their locations including China, U.S. and Europe and the nature of operations as (i) packaged meats, (ii) fresh pork, (iii) hog production and (iv) others.
The details of the Group’s business activities are as follows:
(i) Packaged meats — represents production, wholesale and retail sales of low temperature and high temperature meat products.
(ii) Fresh pork — represents slaughtering, wholesale and retail sales of fresh and frozen meat.
(iii) Hog production — represents hog farming.(iv) Others — represents slaughtering and sales of poultry, sales of ancillary products and
services such as provision of logistics, sales of flavouring ingredients and internally-produced packaging materials, as well as operating finance companies, retail business and biopharmaceuticals, retail of meat related products, and corporate expenses incurred by the Group.
Each reportable segment derives its revenue from the sales of products and provision of services based on the location of operations. They are managed separately because each segment requires different production and marketing strategies.
Segment results represent the profit earned by each segment before biological fair value adjustments without allocation of other income not attributed to the respective segment, other gains and losses, finance costs and share of profits of associates and joint ventures. This is the measure reported to the chief operating decision makers for the purposes of resource allocation and assessment of segment performance.
Inter-segment revenue were charged at cost plus margin basis.

105ANNUAL REPORT 2019 WH GROUP LIMITED
For the year ended December 31, 2019
Notes to the Consolidated Financial Statements (Continued)
5. REVENUE AND SEGMENT INFORMATION (Continued) Segment information (Continued)
The following is an analysis of the Group’s revenue and results by reportable segments:
For the year ended December 31, 2019Packaged
meatsFresh pork
Hog production Others Total
US$’million US$’million US$’million US$’million US$’million
ChinaGross segment revenue 3,615 5,671 20 756 10,062Less: Inter-segment revenue — (946) (18) (342) (1,306)
Revenue 3,615 4,725 2 414 8,756
Reportable segment profit (loss) 673 262 (13) 35 957
United StatesGross segment revenue 7,817 7,567 3,282 1 18,667Less: Inter-segment revenue (3) (3,100) (2,405) — (5,508)
Revenue 7,814 4,467 877 1 13,159
Reportable segment profit (loss) 847 150 83 (148) 932
EuropeGross segment revenue 943 1,339 723 415 3,420Less: Inter-segment revenue (41) (453) (665) (73) (1,232)
Revenue 902 886 58 342 2,188
Reportable segment profit (loss) 54 (9) 97 — 142
TotalGross segment revenue 12,375 14,577 4,025 1,172 32,149Less: Inter-segment revenue (44) (4,499) (3,088) (415) (8,046)
Revenue 12,331 10,078 937 757 24,103
Reportable segment profit (loss) 1,574 403 167 (113) 2,031
Net unallocated income 42Biological fair value
adjustments 106Finance costs (144)Share of profits of associates 4Share of profits of joint
ventures 13
Profit before tax 2,052
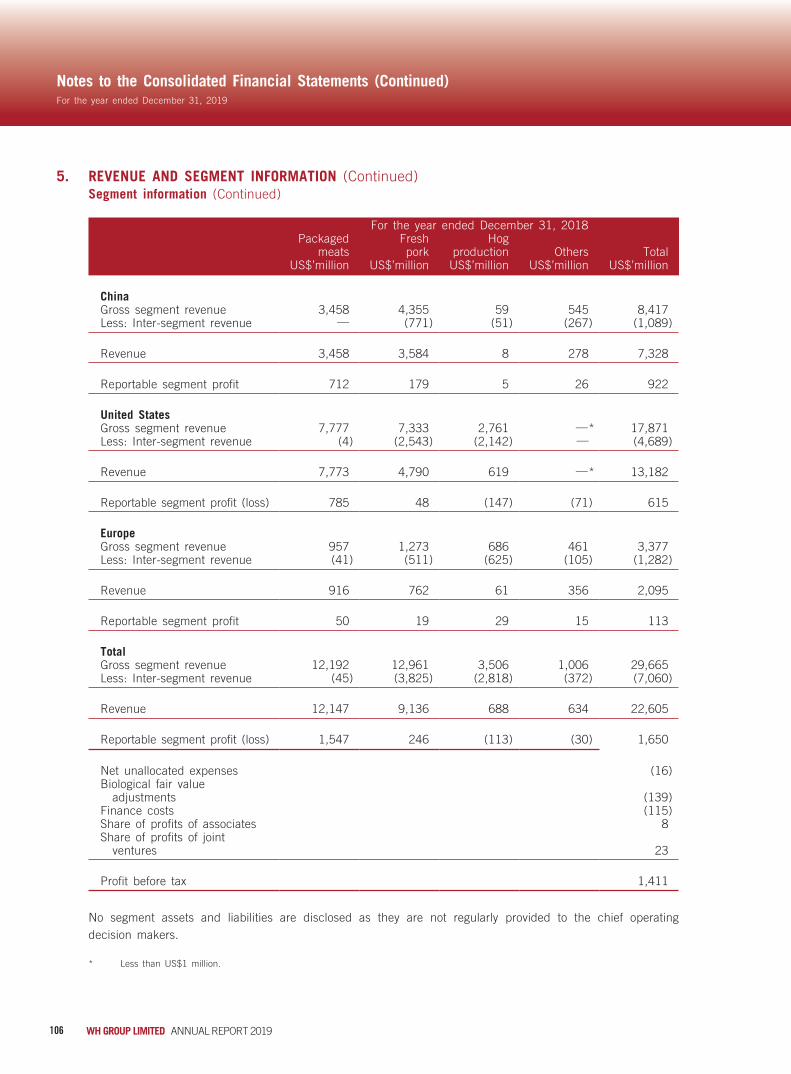
106 WH GROUP LIMITED ANNUAL REPORT 2019
For the year ended December 31, 2019
Notes to the Consolidated Financial Statements (Continued)
5. REVENUE AND SEGMENT INFORMATION (Continued) Segment information (Continued)
For the year ended December 31, 2018Packaged
meatsFresh pork
Hog production Others Total
US$’million US$’million US$’million US$’million US$’million
ChinaGross segment revenue 3,458 4,355 59 545 8,417Less: Inter-segment revenue — (771) (51) (267) (1,089)
Revenue 3,458 3,584 8 278 7,328
Reportable segment profit 712 179 5 26 922
United StatesGross segment revenue 7,777 7,333 2,761 —* 17,871Less: Inter-segment revenue (4) (2,543) (2,142) — (4,689)
Revenue 7,773 4,790 619 —* 13,182
Reportable segment profit (loss) 785 48 (147) (71) 615
EuropeGross segment revenue 957 1,273 686 461 3,377Less: Inter-segment revenue (41) (511) (625) (105) (1,282)
Revenue 916 762 61 356 2,095
Reportable segment profit 50 19 29 15 113
TotalGross segment revenue 12,192 12,961 3,506 1,006 29,665Less: Inter-segment revenue (45) (3,825) (2,818) (372) (7,060)
Revenue 12,147 9,136 688 634 22,605
Reportable segment profit (loss) 1,547 246 (113) (30) 1,650
Net unallocated expenses (16)Biological fair value
adjustments (139)Finance costs (115)Share of profits of associates 8Share of profits of joint
ventures 23
Profit before tax 1,411
No segment assets and liabilities are disclosed as they are not regularly provided to the chief operating decision makers.
* Less than US$1 million.

107ANNUAL REPORT 2019 WH GROUP LIMITED
For the year ended December 31, 2019
Notes to the Consolidated Financial Statements (Continued)
5. REVENUE AND SEGMENT INFORMATION (Continued) Geographical information
Information about the Group’s revenue presented above is based on the geographical locations of operation.
Information about the Group’s non-current assets is presented below based on the geographical locations of operation.
2019 2018US$’million US$’million
Non-current assetsChina 2,347 2,421U.S. 6,110 5,649Europe 1,843 1,539
10,300 9,609
6. OTHER INCOME
2019 2018US$’million US$’million
Government subsidy 28 43Bank interest income 14 12Income on sales of raw materials 10 8Others 7 35
59 98

108 WH GROUP LIMITED ANNUAL REPORT 2019
For the year ended December 31, 2019
Notes to the Consolidated Financial Statements (Continued)
7. OTHER GAINS AND (LOSSES)
2019 2018US$’million US$’million
Gain (loss) on non-qualified retirement plan assets 14 (6)Fair value gain on financial assets at fair value
through profit or loss 24 15Gain (loss) on disposal of property, plant and equipment 1 (2)Gain on contribution of assets to a joint venture 42 —
Gain on disposal of an associate 15 —
Impairment loss on other non-current assets — (12)Impairment loss recognised in respect of property,
plant and equipment (18) (4)Impairment loss recognised in respect of intangible assets (9) —
Impairment loss recognised in respect of right-of-use assets (5) —
Net exchange losses (9) (15)Gain on insurance recovery 10 4Others (12) (1)
53 (21)
8. OTHER EXPENSES
2019 2018US$’million US$’million
Share-based payments (8) (21)Others (55) (53)
(63) (74)
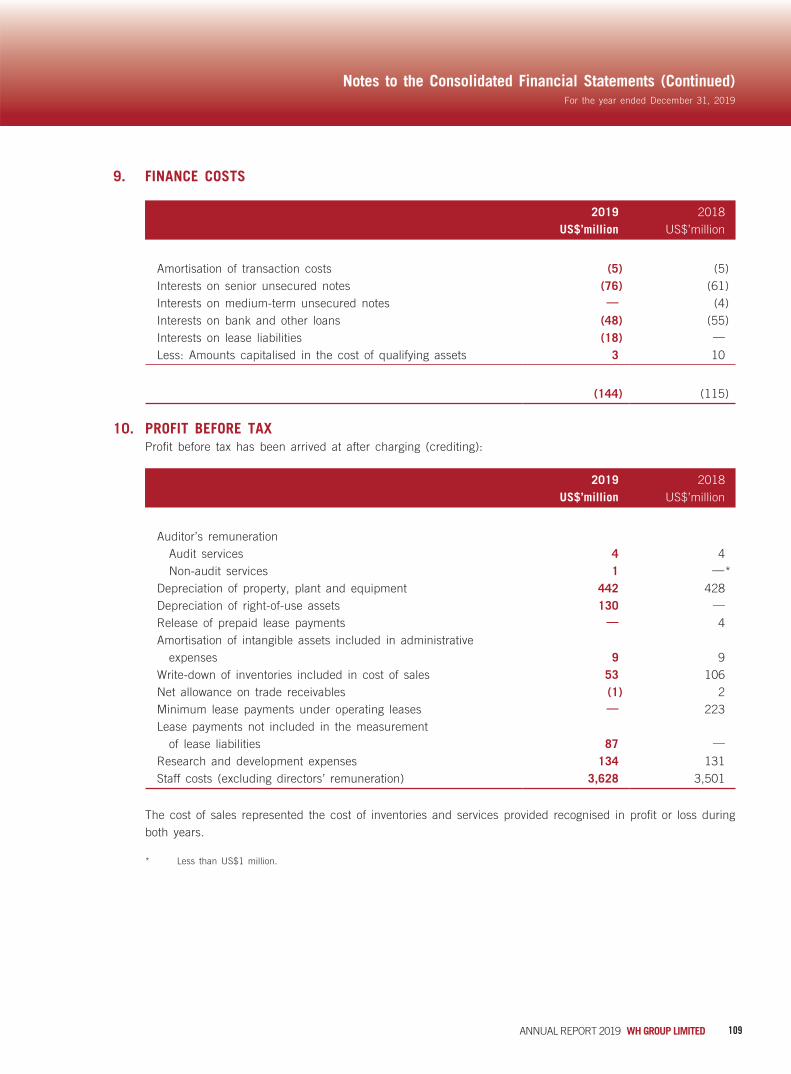
109ANNUAL REPORT 2019 WH GROUP LIMITED
For the year ended December 31, 2019
Notes to the Consolidated Financial Statements (Continued)
9. FINANCE COSTS
2019 2018US$’million US$’million
Amortisation of transaction costs (5) (5)Interests on senior unsecured notes (76) (61)Interests on medium-term unsecured notes — (4)Interests on bank and other loans (48) (55)Interests on lease liabilities (18) —
Less: Amounts capitalised in the cost of qualifying assets 3 10
(144) (115)
10. PROFIT BEFORE TAXProfit before tax has been arrived at after charging (crediting):
2019 2018US$’million US$’million
Auditor’s remunerationAudit services 4 4Non-audit services 1 —*
Depreciation of property, plant and equipment 442 428Depreciation of right-of-use assets 130 —
Release of prepaid lease payments — 4Amortisation of intangible assets included in administrative
expenses 9 9Write-down of inventories included in cost of sales 53 106Net allowance on trade receivables (1) 2Minimum lease payments under operating leases — 223Lease payments not included in the measurement
of lease liabilities 87 —
Research and development expenses 134 131Staff costs (excluding directors’ remuneration) 3,628 3,501
The cost of sales represented the cost of inventories and services provided recognised in profit or loss during both years.
* Less than US$1 million.

110 WH GROUP LIMITED ANNUAL REPORT 2019
For the year ended December 31, 2019
Notes to the Consolidated Financial Statements (Continued)
11. DIRECTORS’ AND EMPLOYEES’ EMOLUMENTSDirectors’ and chief executive’s remuneration for the year, disclosed pursuant to the applicable Rules Governing the Listing of Securities on the Hong Kong Stock Exchange and the Hong Kong Companies Ordinance, is as follows:
Name of director Fees
Basic salaries and allowances
Performance bonus
Share-based payments
Retirement benefit
scheme contributions
2019 Total
US$’million US$’million US$’million US$’million US$’million US$’million(Note (i))
A) EXECUTIVE DIRECTORSMr. Wan Long — 2 —* 2 —* 4Mr. Wan Hongjian — —* —* — —* 1Mr. Guo Lijun — 1 —* 1 —* 2Mr. Sullivan Kenneth
Marc — 1 13 —* —* 14Mr. Ma Xiangjie — 1 —* —* —* 1
Sub-total — 5 14 3 —* 22
The executive directors’ emoluments shown above were paid for their services in connection with the management of the affairs of the Company and the Group.
B) NON-EXECUTIVE DIRECTORMr. Jiao Shuge — — — — — —
Sub-total — — — — — —
No emoluments was paid to the non-executive director shown above for his service as director of the Company or its subsidiaries.
C) INDEPENDENT NON-EXECUTIVE DIRECTORSMr. Huang Ming —* — — — — —*Mr. Lee Conway
Kong Wai —* — — — — —*Mr. Lau, Jin Tin Don —* — — — — —*
Sub-total —* — — — — —*
The independent non-executive directors’ emoluments shown above were paid for their services as directors of the Company.
Total for the year ended December 31, 2019 22
* Less than US$1 million.
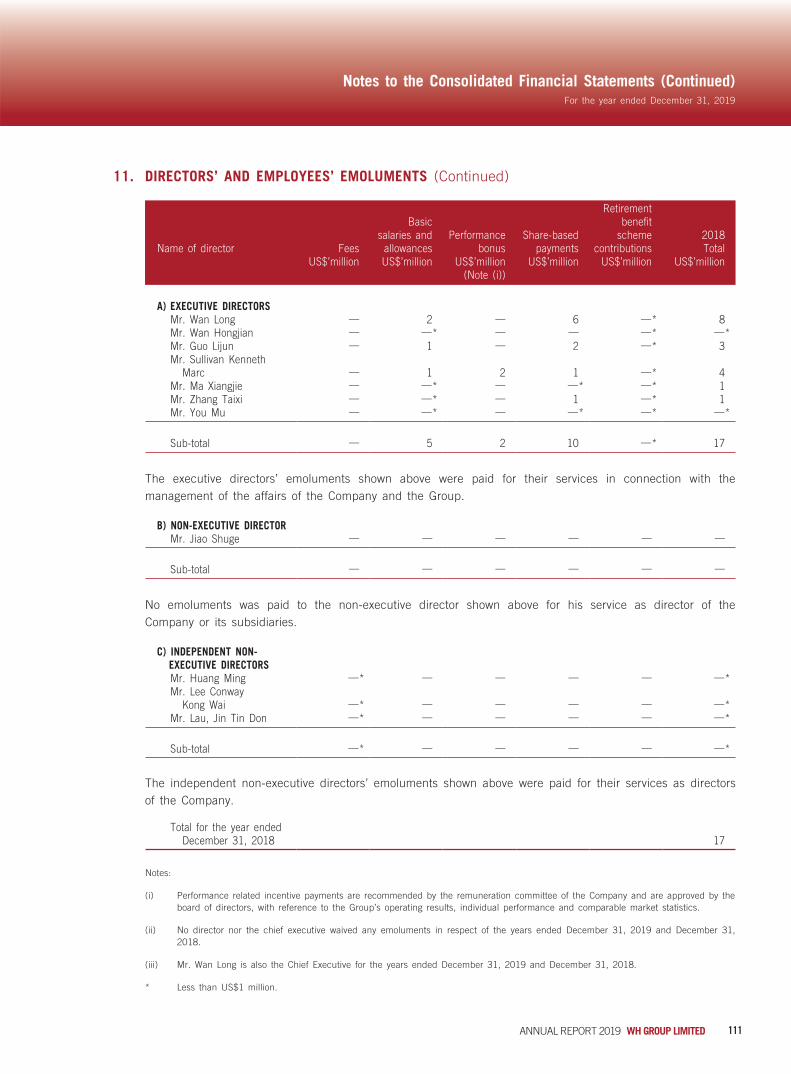
111ANNUAL REPORT 2019 WH GROUP LIMITED
For the year ended December 31, 2019
Notes to the Consolidated Financial Statements (Continued)
11. DIRECTORS’ AND EMPLOYEES’ EMOLUMENTS (Continued)
Name of director Fees
Basic salaries and
allowancesPerformance
bonusShare-based
payments
Retirement benefit
scheme contributions
2018 Total
US$’million US$’million US$’million US$’million US$’million US$’million(Note (i))
A) EXECUTIVE DIRECTORSMr. Wan Long — 2 — 6 —* 8Mr. Wan Hongjian — —* — — —* —*Mr. Guo Lijun — 1 — 2 —* 3Mr. Sullivan Kenneth
Marc — 1 2 1 —* 4Mr. Ma Xiangjie — —* — —* —* 1Mr. Zhang Taixi — —* — 1 —* 1Mr. You Mu — —* — —* —* —*
Sub-total — 5 2 10 —* 17
The executive directors’ emoluments shown above were paid for their services in connection with the management of the affairs of the Company and the Group.
B) NON-EXECUTIVE DIRECTORMr. Jiao Shuge — — — — — —
Sub-total — — — — — —
No emoluments was paid to the non-executive director shown above for his service as director of the Company or its subsidiaries.
C) INDEPENDENT NON-EXECUTIVE DIRECTORSMr. Huang Ming —* — — — — —*Mr. Lee Conway
Kong Wai —* — — — — —*Mr. Lau, Jin Tin Don —* — — — — —*
Sub-total —* — — — — —*
The independent non-executive directors’ emoluments shown above were paid for their services as directors of the Company.
Total for the year ended December 31, 2018 17
Notes:
(i) Performance related incentive payments are recommended by the remuneration committee of the Company and are approved by the board of directors, with reference to the Group’s operating results, individual performance and comparable market statistics.
(ii) No director nor the chief executive waived any emoluments in respect of the years ended December 31, 2019 and December 31, 2018.
(iii) Mr. Wan Long is also the Chief Executive for the years ended December 31, 2019 and December 31, 2018.
* Less than US$1 million.

112 WH GROUP LIMITED ANNUAL REPORT 2019
For the year ended December 31, 2019
Notes to the Consolidated Financial Statements (Continued)
11. DIRECTORS’ AND EMPLOYEES’ EMOLUMENTS (Continued)The five highest paid individuals for the year ended December 31, 2019 included two directors of the Company (2018: three), details of whose emoluments are set out above. The emoluments of the remaining three (2018: two) non-director highest paid individuals during the year were as follows:
2019 2018US$’million US$’million
EmployeesBasic salaries and allowances 3 2Performance bonus 15 4Share-based payments —* —*Retirement benefit scheme contributions —* —*
18 7
The emoluments of the remaining non-director highest paid individuals were within the following bands:
Number of employees
2019 2018
HK$21,500,001 to HK$22,000,000 — 1HK$28,500,001 to HK$29,000,000 1 —
HK$32,500,001 to HK$33,000,000 — 1HK$49,500,001 to HK$50,000,000 1 —
HK$63,500,001 to HK$64,000,000 1 —
During the year, no emoluments were paid by the Group to any of the directors or the five highest paid individuals (including directors and employees) as an inducement to join or upon joining the Group or as compensation for loss of office (2018: Nil).
* Less than US$1 million.

113ANNUAL REPORT 2019 WH GROUP LIMITED
For the year ended December 31, 2019
Notes to the Consolidated Financial Statements (Continued)
12. TAXATION
2019 2018US$’million US$’million
China income tax (176) (196)U.S. income tax (56) (51)Other income taxes (35) (16)Withholding tax (13) (33)Deferred taxation (77) 38
(357) (258)
Under the China law on Enterprise Income Tax (the “EIT Law”) and the Implementation Regulation of the EIT Law, the tax rate of the China subsidiaries is 25% except for the following:
(i) According to the Implementation Regulation of the EIT Law and the EIT exemptions regulation set out in the Circular of the Ministry of Finance and the State Administration on Releasing the Primary Processing Ranges of Agricultural Products Entitled to Preferential Policies on Enterprise Income Tax (Trial Implementation) (Cai Shui [2008] No. 149) and the requirements of Article 86 of the Implementation Regulation of the EIT Law, the income from various China subsidiaries of the Company engaging in primary processing for agricultural products are exempted from EIT.
(ii) Pursuant to the related regulations in respect of the Implementation Regulation of the EIT Law, the income from various China subsidiaries of the Company engaging in projects of animal-husbandry and poultry feeding are entitled to exemption from EIT during both years.
(iii) Pursuant to the related regulations in respect of the Notice of Certain Tax Policies for Implementation of Exploration and Development of Western Region (Cai Shui [2012] No. 58) jointly issued by the Ministry of Finance, the General Administration of Customs and the State Administration of Taxation, various China subsidiaries of the Company are entitled to a preferential income tax rate of 15% during both years.
(iv) According to the Implementation Regulation of the EIT Law and Circular of State Administration of Taxation on Issues Concerning Implementation of Preferential Income Tax Enjoyed by High-and-new-tech Enterprises (Guo Shui Han [2009] No. 203), high-and-new-tech enterprises are levied enterprise income tax at 15%. Various China subsidiaries of the Company are classified as high-and-new-tech enterprises and are entitled to enjoy a preferential income tax rate at 15% during both years.

114 WH GROUP LIMITED ANNUAL REPORT 2019
For the year ended December 31, 2019
Notes to the Consolidated Financial Statements (Continued)
12. TAXATION (Continued)According to Articles 3 and 27 of the EIT Law and Article 91 of its Implementation Rules, dividends distributed to foreign investors out of the profit generated by China subsidiaries are subject to EIT at 10% or reduced tax rate if a tax treaty or arrangement applies. Under the relevant tax arrangement, the withholding tax rate on dividend distribution to the qualifying Hong Kong resident companies is 5%. Deferred tax liabilities on the undistributed profits earned by the China subsidiaries have been accrued at the tax rate of 5% and 10% for the year ended December 31, 2018 and at the tax rate of 5% for the year ended December 31, 2019.
The U.S. corporate tax rate is 21% for the year ended December 31, 2018 and December 31, 2019.
Other overseas taxation is calculated at the rates prevailing in the respective jurisdictions.
The taxation charge for both years is reconciled to the profit before tax as follows:
2019 2018US$’million % US$’million %
Profit before tax 2,052 1,411
Tax at the applicable rates (Note) (494) (24.1) (353) (25.0)Tax effect of share of profits of associates
and joint ventures 3 0.1 7 0.5Tax effect of income that is not taxable in
determining current year taxable profit 23 1.1 9 0.6Tax effect of expenses that are not deductible
in determining current year taxable profit (21) (1.0) (14) (1.0)Tax effect of tax losses not recognised (4) (0.2) (—*) —Utilisation of tax losses previously not
recognised —* — 1 0.1Effect of tax exemptions and preferential tax
rates granted to China subsidiaries 82 4.0 54 3.8Effect of tax exemptions and preferential tax
rates granted to U.S. subsidiaries 39 1.9 12 0.9U.S. Tax Reform — transition tax — — (13) (0.9)Withholding tax on undistributed earnings
of subsidiaries (35) (1.7) (10) (0.7)Recognition of deferred tax arising
from tax loss previously not recognised 9 0.4 — —Overprovision in prior years 6 0.3 15 1.1Tax effect of tax losses recognised
on intra-group transactions 35 1.7 34 2.4
Tax charge and effective tax rate for the year (357) (17.4) (258) (18.3)
Note: As the Group’s revenue is generated in several jurisdictions, the directors of the Company consider that it is more meaningful to aggregate the separate reconciliations prepared using the domestic rate in each individual jurisdiction.
Details of recognised and unprovided deferred taxation are set out in note 33.
* Less than US$1 million.

115ANNUAL REPORT 2019 WH GROUP LIMITED
For the year ended December 31, 2019
Notes to the Consolidated Financial Statements (Continued)
13. DIVIDENDS
2019 2018US$’million US$’million
Dividend recognised as distribution during the year:2018 final dividend of HK 15 cents per share
(2017: HK 22 cents) 282 4112019 interim dividend of HK 5 cents per share
(2018: HK 5 cents) 93 94
375 505
The final dividend of HK 26.5 cents per share in respect of the year ended December 31, 2019 has been proposed by the directors and is subject to approval at the forthcoming annual general meeting.
14. EARNINGS PER SHAREThe calculation of the basic and diluted earnings per share attributable to owners of the Company is based on the following data:
2019 2018US$’million US$’million
EarningsProfit for the year attributable to owners of the Company for the
purpose of basic and diluted earnings per share 1,465 943
million million
Number of sharesWeighted average number of ordinary shares for the purpose
of basic earnings per share 14,702.71 14,674.83Effect of dilutive potential ordinary shares: share options 88.51 65.06
Weighted average number of ordinary shares for the purpose of diluted earnings per share 14,791.22 14,739.89
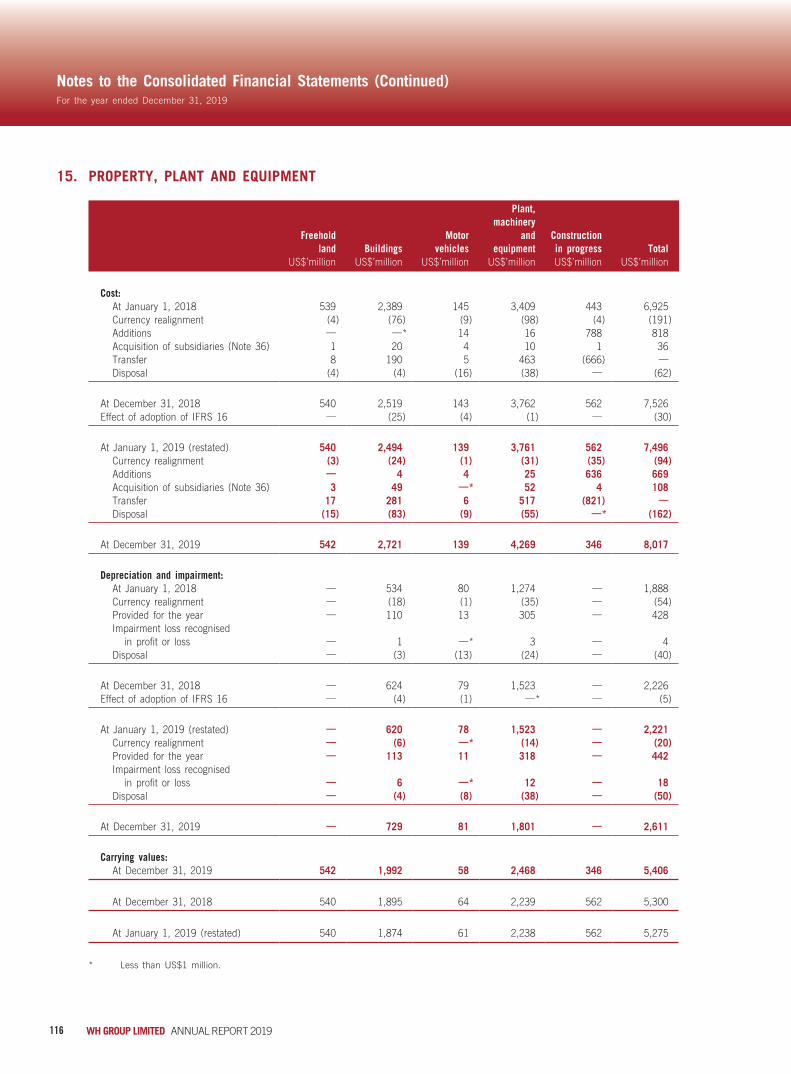
116 WH GROUP LIMITED ANNUAL REPORT 2019
For the year ended December 31, 2019
Notes to the Consolidated Financial Statements (Continued)
15. PROPERTY, PLANT AND EQUIPMENT
Freehold land Buildings
Motor vehicles
Plant, machinery
and equipment
Construction in progress Total
US$’million US$’million US$’million US$’million US$’million US$’million
Cost:At January 1, 2018 539 2,389 145 3,409 443 6,925Currency realignment (4) (76) (9) (98) (4) (191)Additions — —* 14 16 788 818Acquisition of subsidiaries (Note 36) 1 20 4 10 1 36Transfer 8 190 5 463 (666) —Disposal (4) (4) (16) (38) — (62)
At December 31, 2018 540 2,519 143 3,762 562 7,526Effect of adoption of IFRS 16 — (25) (4) (1) — (30)
At January 1, 2019 (restated) 540 2,494 139 3,761 562 7,496Currency realignment (3) (24) (1) (31) (35) (94)Additions — 4 4 25 636 669Acquisition of subsidiaries (Note 36) 3 49 —* 52 4 108Transfer 17 281 6 517 (821) —Disposal (15) (83) (9) (55) —* (162)
At December 31, 2019 542 2,721 139 4,269 346 8,017
Depreciation and impairment:At January 1, 2018 — 534 80 1,274 — 1,888Currency realignment — (18) (1) (35) — (54)Provided for the year — 110 13 305 — 428Impairment loss recognised
in profit or loss — 1 —* 3 — 4Disposal — (3) (13) (24) — (40)
At December 31, 2018 — 624 79 1,523 — 2,226Effect of adoption of IFRS 16 — (4) (1) —* — (5)
At January 1, 2019 (restated) — 620 78 1,523 — 2,221Currency realignment — (6) —* (14) — (20)Provided for the year — 113 11 318 — 442Impairment loss recognised
in profit or loss — 6 —* 12 — 18Disposal — (4) (8) (38) — (50)
At December 31, 2019 — 729 81 1,801 — 2,611
Carrying values:At December 31, 2019 542 1,992 58 2,468 346 5,406
At December 31, 2018 540 1,895 64 2,239 562 5,300
At January 1, 2019 (restated) 540 1,874 61 2,238 562 5,275
* Less than US$1 million.
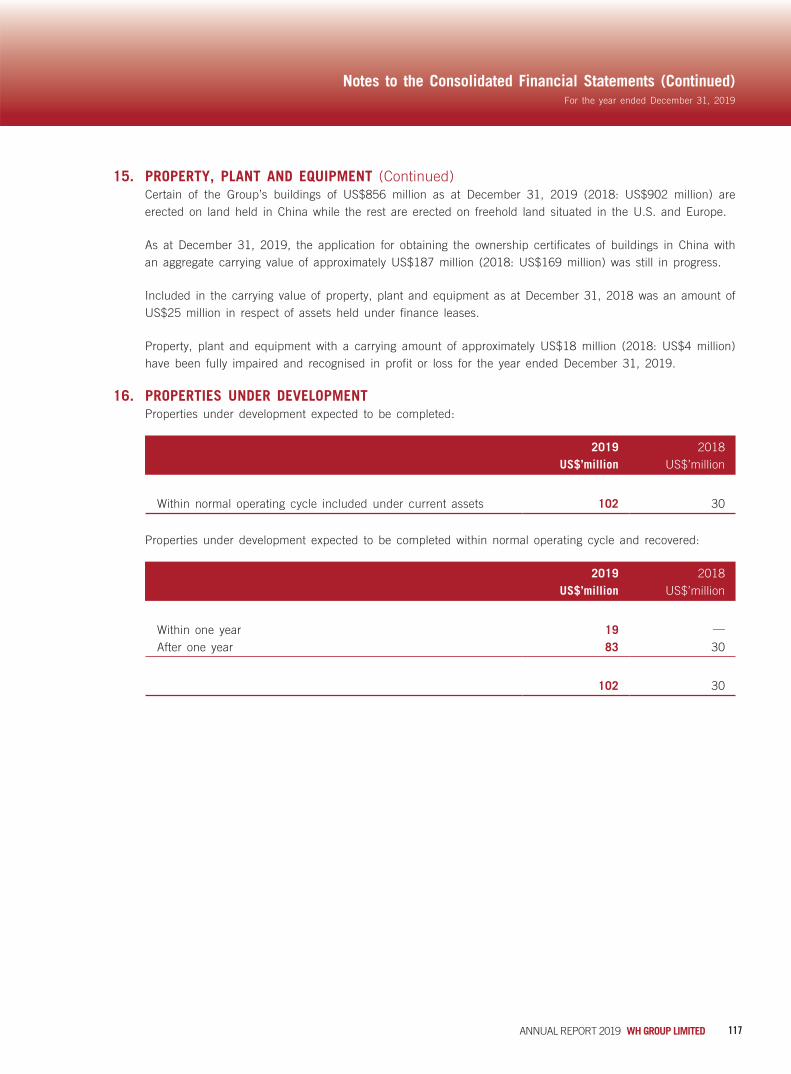
117ANNUAL REPORT 2019 WH GROUP LIMITED
For the year ended December 31, 2019
Notes to the Consolidated Financial Statements (Continued)
15. PROPERTY, PLANT AND EQUIPMENT (Continued)Certain of the Group’s buildings of US$856 million as at December 31, 2019 (2018: US$902 million) are erected on land held in China while the rest are erected on freehold land situated in the U.S. and Europe.
As at December 31, 2019, the application for obtaining the ownership certificates of buildings in China with an aggregate carrying value of approximately US$187 million (2018: US$169 million) was still in progress.
Included in the carrying value of property, plant and equipment as at December 31, 2018 was an amount of US$25 million in respect of assets held under finance leases.
Property, plant and equipment with a carrying amount of approximately US$18 million (2018: US$4 million) have been fully impaired and recognised in profit or loss for the year ended December 31, 2019.
16. PROPERTIES UNDER DEVELOPMENTProperties under development expected to be completed:
2019 2018US$’million US$’million
Within normal operating cycle included under current assets 102 30
Properties under development expected to be completed within normal operating cycle and recovered:
2019 2018US$’million US$’million
Within one year 19 —
After one year 83 30
102 30

118 WH GROUP LIMITED ANNUAL REPORT 2019
For the year ended December 31, 2019
Notes to the Consolidated Financial Statements (Continued)
17. LEASES (a) Prepaid lease payments (before January 1, 2019)
2018US$’million
Cost:At January 1 248Currency realignment (12)Additions —
Transfer to properties under development (5)Disposal (3)
At December 31 228
Amortisation:At January 1 46Currency realignment (2)Charge for the year 4Disposal —
At December 31 48
Carrying value:At December 31 180
Analysed for reporting purposes as:Current 5Non-current 175
180
The amount as at December 31, 2018 mainly represented the prepayment of rentals for land use rights situated in China with unexpired lease periods of 10 to 48 years.

119ANNUAL REPORT 2019 WH GROUP LIMITED
For the year ended December 31, 2019
Notes to the Consolidated Financial Statements (Continued)
17. LEASES (Continued) (b) Right-of-use assets
The carrying amounts of the Group’s right-of-use assets and the movements during the year are as follows:
Buildings Land
Plant, machinery
and equipment
Motor vehicles
Contract farms Total
US$’million US$’million US$’million US$’million US$’million US$’million
At January 1, 2019 170 198 16 52 132 568Currency realignment (—*) (—*) (—*) (—*) (—*) (—*)Additions 81 23 21 23 65 213Depreciation (36) (10) (9) (23) (52) (130)Impairment loss recognised
in profit or loss (5) — — — — (5)
At December 31, 2019 210 211 28 52 145 646
(c) Lease liabilitiesThe carrying amount of lease liabilities and the movements during the year are as follows:
2019 2018Lease
liabilitiesObligations under
finance leasesUS$’million US$’million
As at January 1 386 28New leases 180 —
Interest expenses 18 —
Acquisition of subsidiaries (Note 36) 3 —
Payments (116) (5)Exchange realignment (6) 2
As at December 31 465 25
Analysed for reporting purposes as:Current liabilities 108 2Non-current liabilities 357 23
465 25
The maturity analysis of lease liabilities (2018: obligations under finance leases) is disclosed in note 39 to the financial statements.
* Less than US$1 million.

120 WH GROUP LIMITED ANNUAL REPORT 2019
For the year ended December 31, 2019
Notes to the Consolidated Financial Statements (Continued)
17. LEASES (Continued)(d) The amounts recognised in profit or loss in relation to leases are as follows:
2019US$’million
Interest on lease liabilities 18Depreciation charge of right-of-use assets 130Expenses relating to short-term leases with remaining lease terms
ended on or before December 31, 2019 75Variable lease payments not included in the measurement of lease liabilities 12Gain (loss) on sale and leaseback transactions (—*)Impairment of right-of-use assets 5
240
(e) Extension and termination optionsThe Group has leases with remaining lease terms ranging from more than 1 year to 37 years. The leases containing extension and termination options are managed locally and vary in terms. The Group has included extension or termination options in the measurement of the lease obligations when it is reasonably certain to exercise the options.
(f) Variable lease paymentsThe Group has leases containing variable lease payment terms not depending on an index of rate for hog raising facilities, buildings, motor vehicles, machinery and equipment. Management are responsible for negotiating the lease terms and each term may vary depending on the underlying asset and reportable segment. Variable lease payments terms are based on a multiple of factors including the overall usage of the underlying asset, maintenance and repair services, property taxes and insurance.
The Group expects the overall financial impact for future years to be consistent with the variable lease payments that were incurred during 2019.
(g) Sales and leaseback transactionsOn August 27, 2019, the Group sold a cold storage facility located in Maryland, the U.S. for US$81 million, net of transaction costs. In September 2019, the Group executed a 20-year lease agreement, in which the buyer agreed to lease the cold storage facility back to the Group. In addition to the 20-year term, the lease contains two 10-year renewal periods that would begin at the sole discretion of the Group with no penalty for a failure to renew the lease.
In addition, in 2019, the Group sold 23 contract farms for an aggregate price of US$47 million while retaining ownership of the underlying land. Subsequent to each sale, the Group leased the farms back for a non-cancellable term of approximately 15 years with renewal options.
(h) The total cash outflow for leases and future cash outflows relating to leases that have not yet commenced are disclosed in notes 37, 39 and 41, respectively, to the financial statements.
* Less than US$1 million.
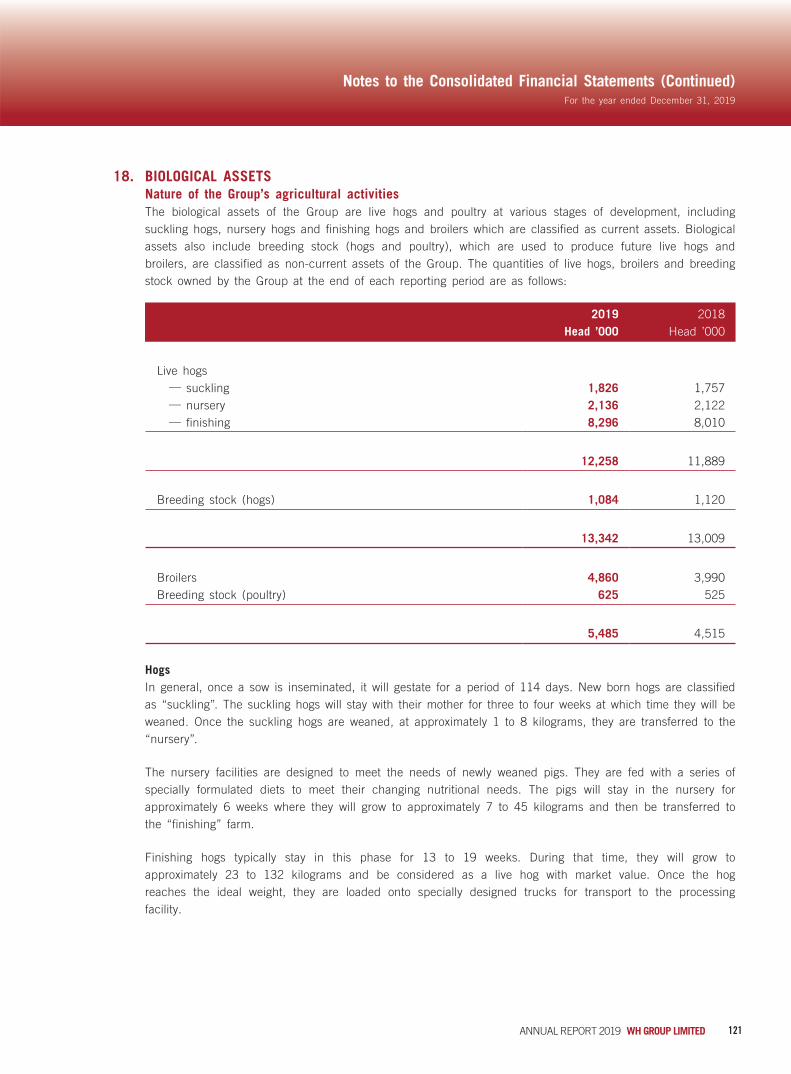
121ANNUAL REPORT 2019 WH GROUP LIMITED
For the year ended December 31, 2019
Notes to the Consolidated Financial Statements (Continued)
18. BIOLOGICAL ASSETS Nature of the Group’s agricultural activities
The biological assets of the Group are live hogs and poultry at various stages of development, including suckling hogs, nursery hogs and finishing hogs and broilers which are classified as current assets. Biological assets also include breeding stock (hogs and poultry), which are used to produce future live hogs and broilers, are classified as non-current assets of the Group. The quantities of live hogs, broilers and breeding stock owned by the Group at the end of each reporting period are as follows:
2019 2018Head ’000 Head ’000
Live hogs— suckling 1,826 1,757— nursery 2,136 2,122— finishing 8,296 8,010
12,258 11,889
Breeding stock (hogs) 1,084 1,120
13,342 13,009
Broilers 4,860 3,990Breeding stock (poultry) 625 525
5,485 4,515
HogsIn general, once a sow is inseminated, it will gestate for a period of 114 days. New born hogs are classified as “suckling”. The suckling hogs will stay with their mother for three to four weeks at which time they will be weaned. Once the suckling hogs are weaned, at approximately 1 to 8 kilograms, they are transferred to the “nursery”.
The nursery facilities are designed to meet the needs of newly weaned pigs. They are fed with a series of specially formulated diets to meet their changing nutritional needs. The pigs will stay in the nursery for approximately 6 weeks where they will grow to approximately 7 to 45 kilograms and then be transferred to the “finishing” farm.
Finishing hogs typically stay in this phase for 13 to 19 weeks. During that time, they will grow to approximately 23 to 132 kilograms and be considered as a live hog with market value. Once the hog reaches the ideal weight, they are loaded onto specially designed trucks for transport to the processing facility.
122 WH GROUP LIMITED ANNUAL REPORT 2019
For the year ended December 31, 2019
Notes to the Consolidated Financial Statements (Continued)
18. BIOLOGICAL ASSETS (Continued) Nature of the Group’s agricultural activities (Continued) Poultry
In general, once a pullet lays eggs, the eggs will be sent to the hatchery and it will take approximately 21 days to be hatched. The hatched chicks are then sent to the broiler farm.
The chicks are fed with a series of specially formulated diets to meet their nutrition needs. The chicks will stay in the broiler farm for approximately 38 to 42 days where they will grow to approximately 2.1 kilograms and then be considered as a broiler with market value.
Once the broiler reaches the market weight, they are loaded onto specially designed trucks for transport to the processing facility.
The Group is exposed to a number of risks related to its biological assets. The Group is exposed to the following operating risks:
(i) Regulatory and environmental risksThe Group is subject to laws and regulations in the location in which it operates breeding of hogs and poultry. The Group has established environmental policies and procedures aiming at complying with local environmental and other laws. Management performs regular reviews to identify environmental risks and to ensure that the systems in place are adequate to manage these risks.
(ii) Climate, disease and other natural risksThe Group’s biological assets are exposed to the risk of damage from climatic changes, diseases and other natural forces. The Group has extensive processes in place aiming at monitoring and mitigating those risks, including regular inspections, disease controls and insurance.

123ANNUAL REPORT 2019 WH GROUP LIMITED
For the year ended December 31, 2019
Notes to the Consolidated Financial Statements (Continued)
18. BIOLOGICAL ASSETS (Continued) Carrying value of the Group’s biological assets
Live hogs
Breeding stock
(hogs) Broilers
Breeding stock
(poultry) Total
2019 2018 2019 2018 2019 2018 2019 2018 2019 2018
US$’million US$’million US$’million US$’million US$’million US$’million US$’million US$’million US$’million US$’million
Carrying value at January 1 942 985 145 177 5 5 2 4 1,094 1,171
Currency realignment (6) (11) (2) (3) (—*) —* (—*) —* (8) (14)
Add: Breeding costs 7,662 7,141 179 124 144 140 9 9 7,994 7,414
Gain (loss) arising from
changes in fair value less
costs to sell of biological
assets 40 (71) (57) (55) (1) (1) (4) (3) (22) (130)
Transfer to inventories at the
point of harvest (7,346) (6,912) (93) (64) (119) (116) (4) (6) (7,562) (7,098)
Decrease due to culling (191) (190) (37) (34) (23) (23) (1) (2) (252) (249)
Carrying value at
December 31 1,101 942 135 145 6 5 2 2 1,244 1,094
Analysed for reporting purposes as:
2019 2018US$’million US$’million
Current 1,107 947Non-current 137 147
1,244 1,094
* Less than US$1 million.

124 WH GROUP LIMITED ANNUAL REPORT 2019
For the year ended December 31, 2019
Notes to the Consolidated Financial Statements (Continued)
18. BIOLOGICAL ASSETS (Continued) Fair value measurement — Level 3
2019 2018US$’million US$’million
Biological assetsLive hogs 1,101 942Breeding stock (hogs) 135 145Broilers 6 5Breeding stock (poultry) 2 2
1,244 1,094
The fair values of breeding stock (hogs and poultry) are determined based on the average of the historical selling price of hog and poultry of similar breed and genetic merit less costs to sell (Level 3). The estimated fair value will significantly increase when there is a slight increase in the average historical selling price, and vice versa.
The fair values of live hogs and broilers are mainly determined based on the price of hogs and broilers in the actively traded market, subtracting the breeding costs required to raise the live hogs and broilers to be slaughtered and the margins that would be required by a raiser and less costs to sell (Level 3). The estimated fair value will increase when there is an increase in the market price of hogs and broilers or decrease in the breeding cost required to raise the live hogs and broilers, and vice versa.
Changes in fair value less costs to sell of biological assets include changes in the fair value of the hogs and poultry at the end of both years. The Group’s biological assets were valued by the independent qualified valuer, Jones Lang LaSalle Corporate Appraisal and Advisory Limited (“JLL”) situated at 7/F, One Taikoo Place, 979 King’s Road, Hong Kong.

125ANNUAL REPORT 2019 WH GROUP LIMITED
For the year ended December 31, 2019
Notes to the Consolidated Financial Statements (Continued)
18. BIOLOGICAL ASSETS (Continued) Fair value measurement — Level 3 (Continued)
Set forth below are the key assumptions and inputs adopted in the valuation process of biological assets:
2019 2018RMB RMB
ChinaBreeding stock (hogs)
Per head market price(1) 1,901 2,127
Suckling hogsPer head cost(2) 139 86
Finishing hogsPer head market price(3) 3,332 1,260
Per head weekly average breeding costs required to raise to finishing hogs(4) 85 68
Breeding stock (poultry)Per head market price(1) 25 25
BroilersPer head market price(3) 19 19Per head average breeding costs required to raise to broilers(4) 18 16

126 WH GROUP LIMITED ANNUAL REPORT 2019
For the year ended December 31, 2019
Notes to the Consolidated Financial Statements (Continued)
18. BIOLOGICAL ASSETS (Continued) Fair value measurement — Level 3 (Continued)
2019 2018US$ US$
U.S.Breeding stock — Sow (hogs)
Per head market price(1) 125 127
Breeding stock — Boar (hogs)Per head market price(1) 46 56
Suckling hogsPer head cost(2) 32 32
Finishing hogsPer head market price(3) 153 131Per head weekly average breeding costs required to
raise to finishing hogs(4) 5.7 5.7
Notes:
1. Market prices of breeding stock
Breeding stock is assumed to be sellable to the market as at the corresponding stock valuation date. The prices adopted refer to the average historical selling prices transacted to local slaughter house. As the Group never sells its breeding stock before the end of its useful life, no historical actual sales figures are available.
2. Costs of suckling hogs As there is insignificant biological transformation that takes place between the birth of these animals until they become finishing hogs, the cost approach was adopted. As the suckling hogs are only 4 weeks’ old at most, the recent cost incurred approximates the replacement cost.
3. Market prices of finishing hogs/broilers
The adopted selling prices of finishing hogs/broilers (which are finishing hogs/broilers that are old enough to be sold to the market) are determined using their market price at the actively traded local spot and/or future market as reference. The prices used in the valuation are in line with the actual prices recorded.
4. Costs required The costs to complete used as an assumption in valuation are based to complete on the historical average feeding cost, medication and vaccination, grower payment, production housing, production overhead, the freight-to-slaughter and selling costs that would be incurred for sales. The estimated profits that would be required by a raiser are also applied in the valuation.

127ANNUAL REPORT 2019 WH GROUP LIMITED
For the year ended December 31, 2019
Notes to the Consolidated Financial Statements (Continued)
19. GOODWILL
2019 2018US$’million US$’million
Cost:At January 1 1,847 1,838Acquisition of subsidiaries (Note 36) 111 28Currency realignment (3) (19)
At December 31 1,955 1,847
Accumulated impairment losses:At January 1 and December 31 — —
Carrying value:At December 31 1,955 1,847
Impairment testing on goodwillBased on the Group’s business units, goodwill has been allocated for impairment testing purpose to the following CGUs:
• Fresh pork
• Packaged meats
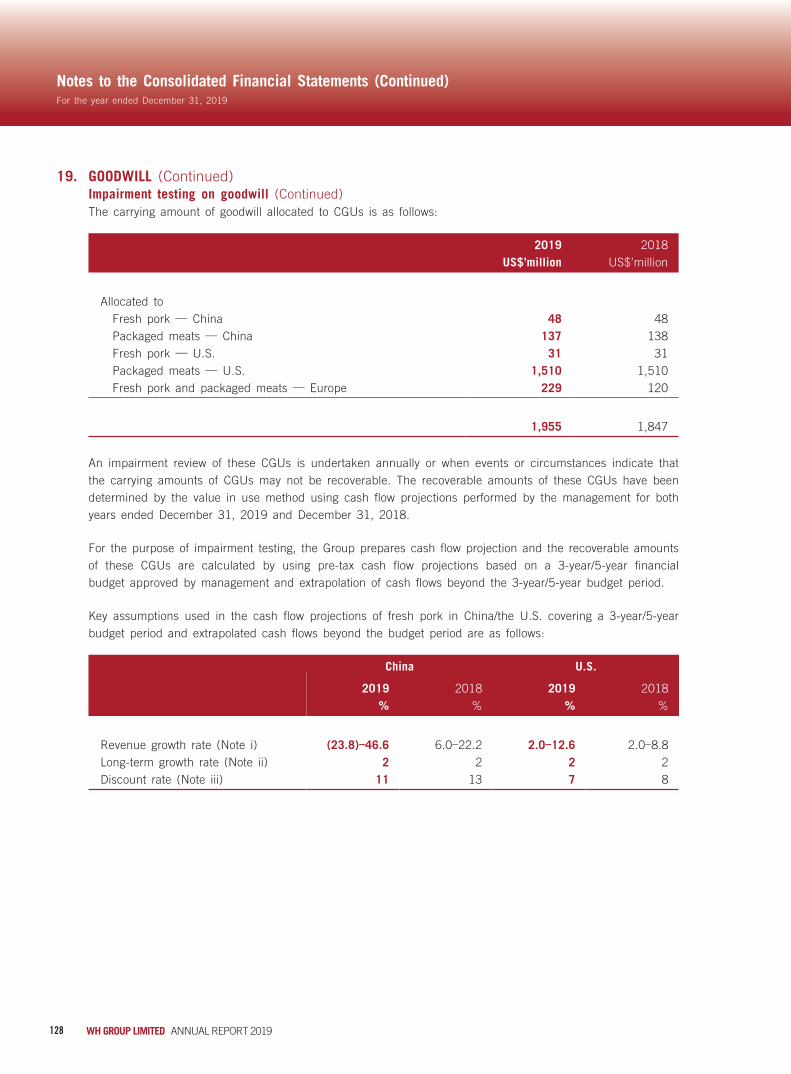
128 WH GROUP LIMITED ANNUAL REPORT 2019
For the year ended December 31, 2019
Notes to the Consolidated Financial Statements (Continued)
19. GOODWILL (Continued) Impairment testing on goodwill (Continued)
The carrying amount of goodwill allocated to CGUs is as follows:
2019 2018US$’million US$’million
Allocated toFresh pork — China 48 48Packaged meats — China 137 138Fresh pork — U.S. 31 31Packaged meats — U.S. 1,510 1,510Fresh pork and packaged meats — Europe 229 120
1,955 1,847
An impairment review of these CGUs is undertaken annually or when events or circumstances indicate that the carrying amounts of CGUs may not be recoverable. The recoverable amounts of these CGUs have been determined by the value in use method using cash flow projections performed by the management for both years ended December 31, 2019 and December 31, 2018.
For the purpose of impairment testing, the Group prepares cash flow projection and the recoverable amounts of these CGUs are calculated by using pre-tax cash flow projections based on a 3-year/5-year financial budget approved by management and extrapolation of cash flows beyond the 3-year/5-year budget period.
Key assumptions used in the cash flow projections of fresh pork in China/the U.S. covering a 3-year/5-year budget period and extrapolated cash flows beyond the budget period are as follows:
China U.S.
2019 2018 2019 2018% % % %
Revenue growth rate (Note i) (23.8)–46.6 6.0–22.2 2.0–12.6 2.0–8.8Long-term growth rate (Note ii) 2 2 2 2Discount rate (Note iii) 11 13 7 8

129ANNUAL REPORT 2019 WH GROUP LIMITED
For the year ended December 31, 2019
Notes to the Consolidated Financial Statements (Continued)
19. GOODWILL (Continued) Impairment testing on goodwill (Continued)
Key assumptions used in the cash flow projections of packaged meats in China/the U.S. covering a 3-year/5-year budget period and extrapolated cash flows beyond the budget period are as follows:
China U.S.
2019 2018 2019 2018% % % %
Revenue growth rate (Note i) 7.2–14.1 10.9–15.4 2.1–4.7 2.1–3.1Long-term growth rate (Note ii) 2 2 2 2Discount rate (Note iii) 11 13 7 8
Key assumptions used in the cash flow projection of fresh pork and packaged meats in other locations outside China and the U.S. covering a 5-year budget period and extrapolated cash flows beyond the budget period are as follows:
2019 2018% %
Revenue growth rate (Note i) 3.0–7.4 2.0–3.0Long-term growth rate (Note ii) 3 3Discount rate (Note iii) 8 9
Notes:
i. The management determined the revenue growth rate over a 3-year/5-year budget period with reference to the past performance and its expectations for the market development.
ii. The long-term growth rate used does not exceed the long-term growth rate for the meat production business in which it operates.
iii. The discount rate used is the pre-tax discount rate applied to the cash flow projections which reflects specific risks relating to the CGUs.
No impairment loss is recognised at the end of both years based on the impairment assessment performed. The management believes that any reasonably possible change in any of these assumptions would not cause the aggregate carrying amount of the CGUs to exceed the aggregate recoverable amount of the CGUs.

130 WH GROUP LIMITED ANNUAL REPORT 2019
For the year ended December 31, 2019
Notes to the Consolidated Financial Statements (Continued)
20. INTANGIBLE ASSETS
Trademarks
Distribution
network Patents
Customer
relations
Contract farm
relations
Rights and
permits Total
US$’million US$’million US$’million US$’million US$’million US$’million US$’million
Cost:
At January 1, 2018 1,666 5 1 55 40 6 1,773
Acquisition of subsidiaries (Note 36) 25 — — 1 — — 26
Currency realignment (24) — — (1) — — (25)
At December 31, 2018 and
January 1, 2019 1,667 5 1 55 40 6 1,774
Currency realignment (5) — — (—*) — — (5)
At December 31, 2019 1,662 5 1 55 40 6 1,769
Amortisation and impairment:
At January 1, 2018 — — 1 22 8 —* 31
Currency realignment — — — —* — —* —*
Provided for the year — — — 6 2 1 9
At December 31, 2018 and
January 1, 2019 — — 1 28 10 1 40
Currency realignment — — — —* — — —*
Provided for the year 9 — — 6 2 —* 17
At December 31, 2019 9 — 1 34 12 1 57
Carrying values:
At December 31, 2019 1,653 5 —* 21 28 5 1,712
At December 31, 2018 1,667 5 —* 27 30 5 1,734
Patents, customer relations, contract farm relations and rights and permits are amortised over their estimated useful lives of 5 to 25 years.
Trademarks and distribution network acquired in the business combinations are identified and recognised as intangible assets with indefinite useful lives and carried at historical cost without amortisation for the following reasons:
— they are capable of being renewed indefinitely at insignificant cost;
— there is no foreseeable limit to the period over which the asset is expected to generate net cash flows, based on an analysis of all of the relevant factors.
* Less than US$1 million.

131ANNUAL REPORT 2019 WH GROUP LIMITED
For the year ended December 31, 2019
Notes to the Consolidated Financial Statements (Continued)
20. INTANGIBLE ASSETS (Continued) Impairment testing on intangible assets
Based on the Group’s business units, trademarks and distribution network have been allocated for impairment testing purpose to the following CGUs:
• Fresh pork
• Packaged meats
The carrying amount of trademarks and distribution network was allocated to CGUs as follows:
2019 2018US$’million US$’million
Allocated toFresh pork — China 47 48Packaged meats — China 282 286Fresh pork — U.S. 234 243Packaged meats — U.S. 983 983Fresh pork and packaged meats — Europe 112 112
1,658 1,672
An impairment review of these CGUs is undertaken annually or when events or circumstances indicate that the carrying amounts of CGUs may not be recoverable. The recoverable amounts of these CGUs have been determined by the value in use method using cash flow projections by management for the years ended December 31, 2019 and December 31, 2018.
For the purpose of impairment testing, the Group prepares cash flow projections based on a 3-year/5-year financial budgets approved by management and extrapolation of cash flows beyond the 3-year/5-year budget period.
Key assumptions used in the cash flow projections of trademarks and distribution network of fresh pork covering a 3-year/5-year budget period and extrapolated cash flows beyond the budget period are as follows:
China U.S.
2019 2018 2019 2018% % % %
Revenue growth rate (Note i) (23.8)–46.6 6.0–22.2 2.0–12.6 2.0–8.8Long-term growth rate (Note ii) 2 2 2 2Discount rate (Note iii) 14 16 7 8

132 WH GROUP LIMITED ANNUAL REPORT 2019
For the year ended December 31, 2019
Notes to the Consolidated Financial Statements (Continued)
20. INTANGIBLE ASSETS (Continued) Impairment testing on intangible assets (Continued)
Key assumptions used in the cash flow projections of trademarks and distribution network of packaged meats covering a 3-year/5-year budget period and extrapolated cash flow beyond the budget period are as follows:
China U.S.
2019 2018 2019 2018% % % %
Revenue growth rate (Note i) 7.2–14.1 10.9–15.4 2.1–4.7 2.1–3.1Long-term growth rate (Note ii) 2 2 2 2Discount rate (Note iii) 14 16 7 8
Key assumptions used in the cash flow projection of trademarks and distribution network of fresh pork and packaged meats in other locations outside China and U.S. covering a 5-year budget period and extrapolated cash flow beyond the budget period are as follows:
2019 2018% %
Revenue growth rate (Note i) 3.0–7.4 2.0–3.0Long-term growth rate (Note ii) 3 3Discount rate (Note iii) 8 9
Notes:
i. The management determined the revenue growth rate over a 3-year/5-year budget period with reference to the past performance and its expectations for the market development.
ii. The long-term growth rate used does not exceed the long-term growth rate for the meat production business in which it operates.
iii. The discount rate used is the pre-tax discount rate applied to the cash flow projections which reflects specific risks relating to the trademarks and distribution network.
The Group has recognised an impairment loss of US$9 million for the year ended December 31, 2019 (2018: nil) based on the impairment assessment performed. The management believes that any reasonably possible change in any of these assumptions would not cause the aggregate carrying amount of the trademarks and distribution network to exceed the aggregate recoverable amount of these assets.
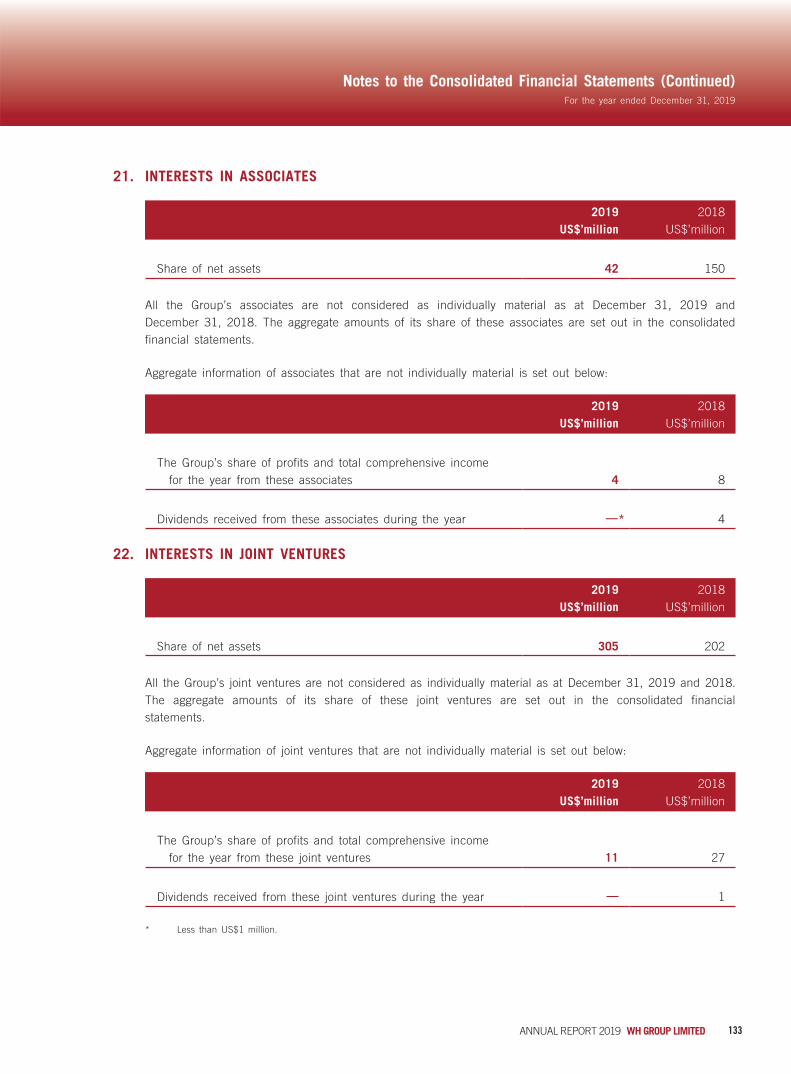
133ANNUAL REPORT 2019 WH GROUP LIMITED
For the year ended December 31, 2019
Notes to the Consolidated Financial Statements (Continued)
21. INTERESTS IN ASSOCIATES
2019 2018US$’million US$’million
Share of net assets 42 150
All the Group’s associates are not considered as individually material as at December 31, 2019 and December 31, 2018. The aggregate amounts of its share of these associates are set out in the consolidated financial statements.
Aggregate information of associates that are not individually material is set out below:
2019 2018US$’million US$’million
The Group’s share of profits and total comprehensive income for the year from these associates 4 8
Dividends received from these associates during the year —* 4
22. INTERESTS IN JOINT VENTURES
2019 2018US$’million US$’million
Share of net assets 305 202
All the Group’s joint ventures are not considered as individually material as at December 31, 2019 and 2018. The aggregate amounts of its share of these joint ventures are set out in the consolidated financial statements.
Aggregate information of joint ventures that are not individually material is set out below:
2019 2018US$’million US$’million
The Group’s share of profits and total comprehensive income for the year from these joint ventures 11 27
Dividends received from these joint ventures during the year — 1
* Less than US$1 million.
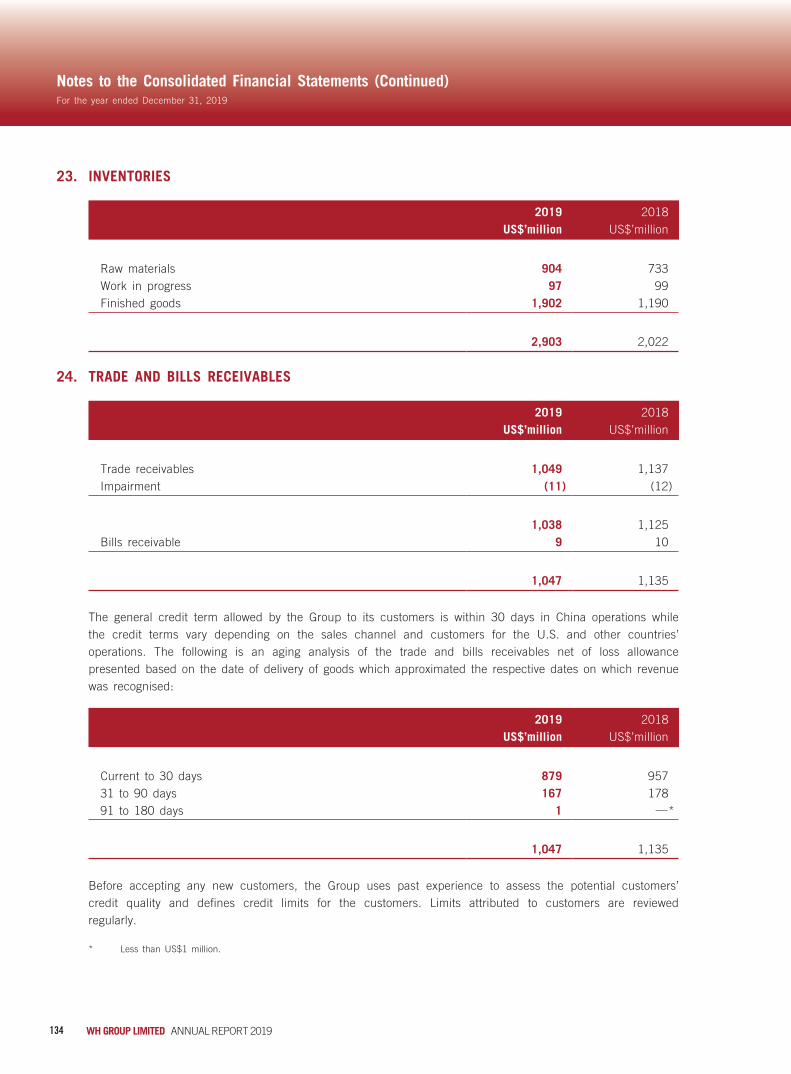
134 WH GROUP LIMITED ANNUAL REPORT 2019
For the year ended December 31, 2019
Notes to the Consolidated Financial Statements (Continued)
23. INVENTORIES
2019 2018US$’million US$’million
Raw materials 904 733Work in progress 97 99Finished goods 1,902 1,190
2,903 2,022
24. TRADE AND BILLS RECEIVABLES
2019 2018US$’million US$’million
Trade receivables 1,049 1,137Impairment (11) (12)
1,038 1,125Bills receivable 9 10
1,047 1,135
The general credit term allowed by the Group to its customers is within 30 days in China operations while the credit terms vary depending on the sales channel and customers for the U.S. and other countries’ operations. The following is an aging analysis of the trade and bills receivables net of loss allowance presented based on the date of delivery of goods which approximated the respective dates on which revenue was recognised:
2019 2018US$’million US$’million
Current to 30 days 879 95731 to 90 days 167 17891 to 180 days 1 —*
1,047 1,135
Before accepting any new customers, the Group uses past experience to assess the potential customers’ credit quality and defines credit limits for the customers. Limits attributed to customers are reviewed regularly.
* Less than US$1 million.

135ANNUAL REPORT 2019 WH GROUP LIMITED
For the year ended December 31, 2019
Notes to the Consolidated Financial Statements (Continued)
24. TRADE AND BILLS RECEIVABLES (Continued)In determining the recoverability of the trade receivables, the Group monitors the change in the credit quality of the trade receivables since the credit was granted and up to the reporting date. The directors of the Company considered that the concentration of credit risk is limited due to the customer base being large and unrelated.
No interest is charged on trade receivables. Loss allowances are made based on the estimated irrecoverable amounts from the sales of goods by reference to past default experience and objective evidences of impairment determined by the difference between the carrying amount and the present value of the estimate future cash flows discounted at the original effective interest rate.
Movement in loss allowance for impairment of trade receivables:
2019 2018US$’million US$’million
At January 1 (12) (10)Reversal of (impairment losses), net 1 (2)Currency realignment —* —*
At December 31 (11) (12)
ImpairmentAn impairment analysis is performed at each reporting date using a provision matrix to measure expected credit losses. The provision rates are based on days past due for groupings of various customer segments with similar loss patterns (i.e., by geographical region, product type, customer type and rating, and coverage by letters of credit or other forms of credit insurance). The calculation reflects the probability-weighted outcome, the time value of money and reasonable and supportable information that is available at the reporting date about past events, current conditions and forecasts of future economic conditions. Generally, trade receivables are written off if past due for more than one year and are not subject to enforcement activity.
* Less than US$1 million.

136 WH GROUP LIMITED ANNUAL REPORT 2019
For the year ended December 31, 2019
Notes to the Consolidated Financial Statements (Continued)
24. TRADE AND BILLS RECEIVABLES (Continued) Impairment (Continued)
Set out below is the information about the credit risk exposure on the Group’s trade receivables using a provision matrix:
December 31, 2019
Current
More than 90 days past due
More than 180 days past due Total
Expected loss rate 1.00% 0.25%–3.60% 5.30% 1.06%Gross carrying amount
(US$’million) 1,049 —* —* 1,049Loss allowance provision
(US$’million) 11 —* —* 11
December 31, 2018
Current
More than 90 days
past due
More than 180 days past due Total
Expected loss rate 1.02% 3.00% 5.14% 1.02%Gross carrying amount
(US$’million) 1,137 —* —* 1,137Loss allowance provision
(US$’million) 12 —* —* 12
* Less than US$1 million.
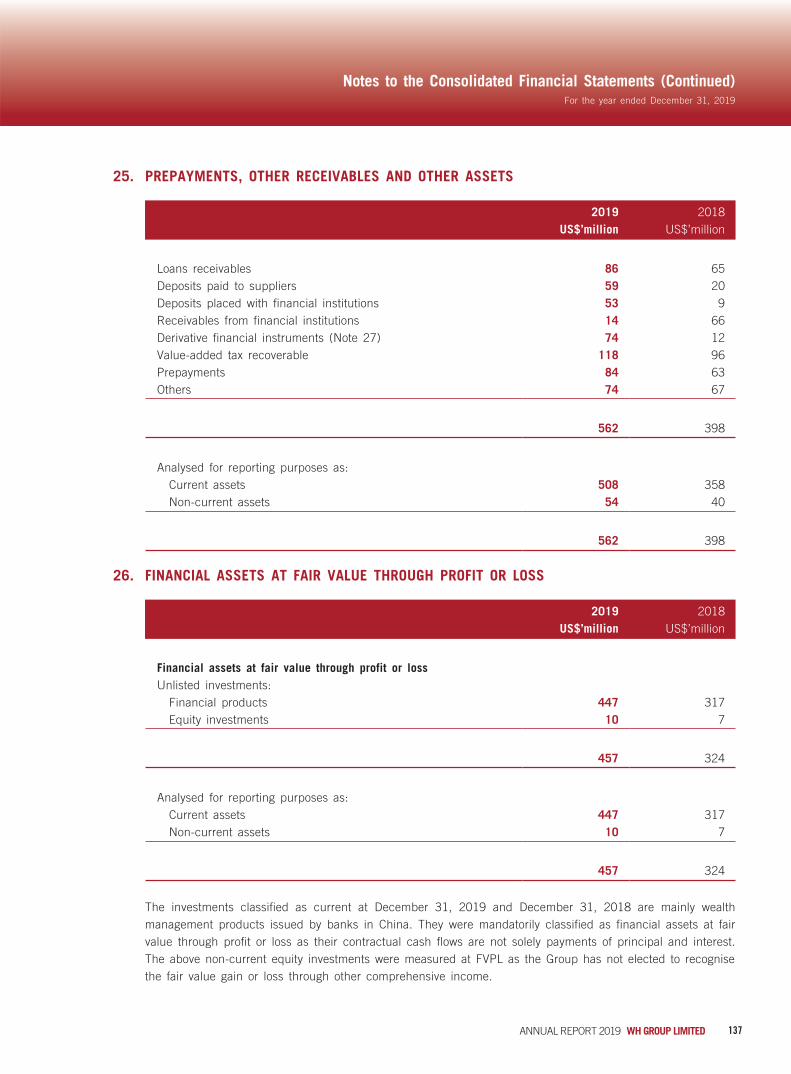
137ANNUAL REPORT 2019 WH GROUP LIMITED
For the year ended December 31, 2019
Notes to the Consolidated Financial Statements (Continued)
25. PREPAYMENTS, OTHER RECEIVABLES AND OTHER ASSETS
2019 2018US$’million US$’million
Loans receivables 86 65Deposits paid to suppliers 59 20Deposits placed with financial institutions 53 9Receivables from financial institutions 14 66Derivative financial instruments (Note 27) 74 12Value-added tax recoverable 118 96Prepayments 84 63Others 74 67
562 398
Analysed for reporting purposes as:Current assets 508 358Non-current assets 54 40
562 398
26. FINANCIAL ASSETS AT FAIR VALUE THROUGH PROFIT OR LOSS
2019 2018US$’million US$’million
Financial assets at fair value through profit or lossUnlisted investments:
Financial products 447 317Equity investments 10 7
457 324
Analysed for reporting purposes as:Current assets 447 317Non-current assets 10 7
457 324
The investments classified as current at December 31, 2019 and December 31, 2018 are mainly wealth management products issued by banks in China. They were mandatorily classified as financial assets at fair value through profit or loss as their contractual cash flows are not solely payments of principal and interest. The above non-current equity investments were measured at FVPL as the Group has not elected to recognise the fair value gain or loss through other comprehensive income.

138 WH GROUP LIMITED ANNUAL REPORT 2019
For the year ended December 31, 2019
Notes to the Consolidated Financial Statements (Continued)
27. DERIVATIVE FINANCIAL INSTRUMENTS Derivatives under hedge accounting
2019 2018
Assets Liabilities Assets LiabilitiesUS$’million US$’million US$’million US$’million
Fair value hedgesGrain contracts 1 —* 1 —*Livestock contracts 2 — 1 —*
Cash flow hedgesForeign currency
forward 1 2 —* —
Grain contracts —* 22 2 12Livestock contracts 78 6 10 2Interest rate contracts — — — —*
82 30 14 14
Fair value hedgesThe Group entered into derivative instruments (primarily forward contracts) to minimise its exposure to fair value changes of its commitments to transit grains and livestock. The directors of the Company consider that those derivative instruments are highly effective hedging instruments. Major terms of the derivative instruments are set out below:
At December 31, 2019
Notional volume
Change in fair value used for
measuring hedge ineffectiveness for
the yearDerivative instruments Minimum Maximum Metric MaturityUS$’million
Commodities contractsGrains —*— Soybeans 10,000 525,000 Bushels Up to November 2020— Corn 1,465,000 5,820,000 Bushels Up to March 2021Lean hogs 63,000,000 128,920,000 Pounds Up to December 2020 7
* Less than US$1 million.

139ANNUAL REPORT 2019 WH GROUP LIMITED
For the year ended December 31, 2019
Notes to the Consolidated Financial Statements (Continued)
27. DERIVATIVE FINANCIAL INSTRUMENTS (Continued) Fair value hedges (Continued) At December 31, 2018
Notional volume
Change in fair value used for
measuring hedge ineffectiveness for
the yearDerivative instruments Minimum Maximum Metric MaturityUS$’million
Commodities contractsGrains 4— Soybeans — 415,000 Bushels Up to November 2019— Corn 1,615,000 56,460,000 Bushels Up to December 2019Lean hogs — 90,440,000 Pounds Up to December 2020 2
The hedge ineffectiveness can arise from:
• changes to the forecasted amounts of cash flows of hedged items and hedging instruments
• differences in the timing of cash flows of the forecasted transactions and the hedging instruments
The commodities contracts as at December 31, 2019 and December 31, 2018 are recorded in “Prepayments, other receivables and other assets” and “Accrued expenses and other payables” in the consolidated statement of financial position.

140 WH GROUP LIMITED ANNUAL REPORT 2019
For the year ended December 31, 2019
Notes to the Consolidated Financial Statements (Continued)
27. DERIVATIVE FINANCIAL INSTRUMENTS (Continued) Cash flow hedges
At December 31, 2019 and December 31, 2018, the Group had the following foreign exchange forward contracts designated as highly effective hedging instruments in order to manage the Group’s foreign currency exposure in relation to foreign currency forecast sales and purchases.
The Group entered into derivative instruments, such as futures, swaps and option contracts designated as highly effective hedging instruments in order to manage the Group’s exposure to the variability in expected future cash flows attributable to commodity price risk associated with the forecasted sale of live hogs, fresh pork, and the forecasted purchase of corn and soybean meal, cash flow interest rate risk associated with floating rate borrowings as well as foreign currency risk associated with fluctuating foreign currency rates. The terms of the derivative instruments have been negotiated to match the terms of the respective designated hedged items. The major terms of these contracts are as follows:
At December 31, 2019
Notional volume
Change in fair value used for
measuring hedge ineffectiveness for
the yearDerivative instruments Minimum Maximum Metric MaturityUS$’million
Commodities contractsLean hogs 133,040,000 1,987,320,000 Pounds Up to March 2021 469Grains (32)— Corn 110,857,129 178,230,000 Bushels Up to December 2021— Soybean meal 665,600 1,170,600 Tons Up to March 2021
Foreign currency forward contracts
63,000 61,022,670 Various currencies
Up to December 2020 —*
* Less than US$1 million.

141ANNUAL REPORT 2019 WH GROUP LIMITED
For the year ended December 31, 2019
Notes to the Consolidated Financial Statements (Continued)
27. DERIVATIVE FINANCIAL INSTRUMENTS (Continued) Cash flow hedges (Continued) At December 31, 2018
Notional volume
Change in fair value used for
measuring hedge
ineffectiveness for the yearDerivative instruments Minimum Maximum Metric MaturityUS$’million
Commodities contractsLean hogs 39,840,000 902,160,000 Pounds Up to December 2019 130Grains (3)— Corn 157,900,000 216,485,000 Bushels Up to March 2021— Soybean meal 1,067,600 1,634,800 Tons Up to January 2021
Interest rate contracts 18,486,729 21,057,065 US$ Up to November 2019 —*Foreign currency
forward contracts10,361,996 52,624,265 Various
currenciesUp to September 2019 —*
The hedge ineffectiveness can arise from:
• changes to the forecasted amounts of cash flows of hedged items and hedging instruments
• differences in the timing of cash flows of the forecasted transactions and the hedging instruments
* Less than US$1 million.

142 WH GROUP LIMITED ANNUAL REPORT 2019
For the year ended December 31, 2019
Notes to the Consolidated Financial Statements (Continued)
27. DERIVATIVE FINANCIAL INSTRUMENTS (Continued) Cash flow hedges (Continued)
The impact of the hedged items on the consolidated financial statements are as follows:
Total hedging
gain (loss)
recognised
in other
comprehensive
income
Amount
reclassified
from other
comprehensive
income to profit
or loss
Hedge
ineffectiveness
recognised in
profit or loss
Deferred net
gain (loss)
included in
other reserve
Change in fair
value used for
measuring hedge
ineffectiveness
for the year
US$’million US$’million US$’million US$’million US$’million
As at December 31, 2019
Highly probable forecast lean
hog transactions 466 445 3 32 469
Highly probable forecast
grain transactions (31) (25) (1) (27) (32)
As at December 31, 2018
Highly probable forecast lean
hog transactions 125 115 5 11 130
Highly probable forecast
grain transactions (5) (1) 2 (21) (3)
The commodities contracts, interest rate contracts and foreign currency forward contracts as at December 31, 2019 and December 31, 2018 are recorded in “Prepayments, other receivables and other assets” and “Accrued expenses and other payables” in the consolidated statement of financial position.
The hedge ineffectiveness for forecast lean hog and grain transactions are recognised in “Revenue” and “Cost of sales” in the consolidated statement of profit or loss and other comprehensive income, respectively.

143ANNUAL REPORT 2019 WH GROUP LIMITED
For the year ended December 31, 2019
Notes to the Consolidated Financial Statements (Continued)
27. DERIVATIVE FINANCIAL INSTRUMENTS (Continued) Derivatives not under hedge accounting
2019 2018
Assets Liabilities Assets LiabilitiesUS$’million US$’million US$’million US$’million
Foreign currency forward —* —* 2 —*Grain contracts 5 9 —* 1Livestock contracts 1 1 —* —*Energy contracts 2 11 2 5
8 21 5 7
Major terms of such derivatives are as follows:
Notional volume
Derivative instruments Minimum Maximum Metric Maturity
At December 31, 2019
Commodities contractsWheat 165,000 1,950,000 Bushels Up to July 2020Soybean meal 1,400 49,900 Tons Up to August 2020Lean hogs 10,920,000 82,160,000 Pounds Up to December 2020Corn 2,702,871 21,047,468 Bushels Up to December 2021Soybeans 30,000 3,915,000 Bushels Up to January 2021Live cattle — 160,000 Pounds Up to August 2020
Natural gas 10,760,000 17,000,000 British Thermal Units
Up to December 2021
Wind energy — 3,300,615 Megawatt-hour Up to September 2032Diesel 17,136,000 21,168,000 Gallons Up to December 2021Foreign currency forward contracts 2,510,541 289,679,130 Various
currenciesUp to April 2020
* Less than US$1 million.

144 WH GROUP LIMITED ANNUAL REPORT 2019
For the year ended December 31, 2019
Notes to the Consolidated Financial Statements (Continued)
27. DERIVATIVE FINANCIAL INSTRUMENTS (Continued) Derivatives not under hedge accounting (Continued)
Notional volume
Derivative instruments Minimum Maximum Metric Maturity
At December 31, 2018
Commodities contractsWheat 65,000 1,805,000 Bushels Up to July 2020Soybean meal — 6,900 Tons Up to August 2019Lean hogs 480,000 291,160,000 Pounds Up to November 2019Corn 13,535,000 32,515,000 Bushels Up to March 2020Soybeans 10,000 8,040,000 Bushels Up to November 2019
Natural gas 14,660,000 18,660,000 British Thermal Units
Up to December 2021
Heating oil — 1,680,000 Gallons Up to April 2019Diesel 2,100,000 18,186,000 Gallons Up to December 2020Foreign currency forward contracts 4,849,775 215,246,768 Various
currenciesUp to April 2019
Derivative financial assets and liabilities of less than US$1 million, US$73 million, US$8 million and US$27 million (2018: US$1 million, US$11 million, US$8 million and US$6 million) are recorded as non-current assets, current assets, non-current liabilities and current liabilities, respectively.
28. PLEDGED/RESTRICTED BANK DEPOSITS AND BANK BALANCES AND CASHAt December 31, 2019, bank balances carry interest at market rates ranging from 0.01% to 4.50% (2018: 0.01% to 4.80%) per annum. The pledged and restricted bank deposits carry fixed interest rates from 0.01% to 3.91% (2018: 0.01% to 3.58%) per annum.
At December 31, 2019, pledged bank deposits represented deposits of US$13 million (2018: US$4 million) pledged to banks for securing banking and trading facilities such as letters of credit and bank loans granted to the Group, and US$2 million (2018: US$3 million) pledged for securing a loan from a third party. These pledged bank deposits will be released upon the settlement of relevant borrowings or the release of the relevant facilities.
At December 31, 2019, bank balance of US$1 million (2018: US$1 million) is pledged for worker’s compensation insurance claims in U.S..
At December 31, 2019, a subsidiary of the Group which engaged in financial services, was governed by the law to place US$29 million (2018: US$40 million) of a statutory deposit in the People’s Bank of China.
As at December 31, 2018, bank balance of US$10 million is pledged for construction of a plant in Poland.

145ANNUAL REPORT 2019 WH GROUP LIMITED
For the year ended December 31, 2019
Notes to the Consolidated Financial Statements (Continued)
29. TRADE PAYABLESThe average credit period on purchase of goods is about 30 days in China operations and the credit terms vary depending on the vendor for the U.S. and other countries of operations. The Group has financial risk management policies in place to ensure that all payables are paid within the credit timeframe.
2019 2018US$’million US$’million
Trade payables 1,074 977
The following is an analysis of trade payables based on the invoice date:
2019 2018US$’million US$’million
Within 30 days 1,045 92331 to 90 days 26 4091 to 180 days 2 7181 to 365 days 1 7
1,074 977

146 WH GROUP LIMITED ANNUAL REPORT 2019
For the year ended December 31, 2019
Notes to the Consolidated Financial Statements (Continued)
30. ACCRUED EXPENSES AND OTHER PAYABLES
2019 2018US$’million US$’million
Accrued staff costs 491 373Deposits received 91 104Sales rebates payables 191 238Payables in respect of acquisition of property, plant and
equipment 89 110Insurance payables 135 135Interest payable 24 25Balance of contingent consideration in respect of acquisition of
subsidiaries 10 11Growers payables 43 41Pension liability (Note 35) 18 14Amounts due to associates and joint ventures (Note 44(b)) 15 31Derivative financial instruments (Note 27) 35 14Accrued professional expenses 23 64Accrued rent and utilities 28 32Dividend payables 18 10Contract liabilities (Note) 234 161Other accrued expenses 233 172Other payables 197 107
1,875 1,642
Analysed for reporting purposes as:Current liabilities 1,686 1,428Non-current liabilities 189 214
1,875 1,642
Note:
Contract liabilities include advances received from customers in relation to sales of meat products. The increase in contract liabilities in 2019 was driven by more advances received at the end of the reporting period due to seasonal factors and agreed payment terms. As at January 1, 2018, contract liabilities were amounted to US$98 million.

147ANNUAL REPORT 2019 WH GROUP LIMITED
For the year ended December 31, 2019
Notes to the Consolidated Financial Statements (Continued)
31. OBLIGATIONS UNDER FINANCE LEASESThe Group has leased certain of its buildings, machinery, vehicles and other equipment. These leases were classified as finance leases prior to IFRS 16 becoming effective on January 1, 2019 and had remaining lease term ranging from 2 to 22 years. Interest rates underlying all obligations under finance leases are variable at respective contract dates with an average rate of 2.6% per annum for the year ended December 31, 2018.
As at December 31, 2018, the total future minimum lease payments under finance leases and their present values were as follows:
Minimum lease payments
Present value of minimum lease
paymentsUS$’million US$’million
Amounts payable under finance leases:Within one year 3 3One to two years 3 2Two to five years 6 4After five years 19 16
31 25Less: Future finance charges (6)
Present value of lease obligations 25
Less: Amounts due for settlement within one year and shown under current liabilities (2)
Amounts due after one year 23
The Group’s obligations under finance leases are secured by the lessor’s charge over the leased assets.

148 WH GROUP LIMITED ANNUAL REPORT 2019
For the year ended December 31, 2019
Notes to the Consolidated Financial Statements (Continued)
32. BORROWINGS
2019 2018US$’million US$’million
Senior unsecured notes:2.700% senior unsecured notes due January 2020 — 3992.650% senior unsecured notes due October 2021 399 3973.350% senior unsecured notes due February 2022 398 3974.250% senior unsecured notes due February 2027 595 5955.200% senior unsecured notes due April 2029 395 —
1,787 1,788Commercial papers (Note i) 125 236Bank loans (Note ii):
Secured 38 374Unsecured 1,139 677
Loans from third parties (Note iii):Secured 1 1Unsecured 2 2
Total borrowings other than bank overdrafts 3,092 3,078
Bank overdrafts (Note iv) — 41
The borrowings other than bank overdrafts are repayable as follows (Note v):Within one year 905 819One to two years 421 451Two to five years 773 1,211After five years 993 597
3,092 3,078Less: Amounts due within one year shown under current liabilities (905) (819)
Amounts due after one year 2,187 2,259
Total borrowings other than bank overdrafts:At fixed rates 2,385 2,370At floating rates 707 708
3,092 3,078

149ANNUAL REPORT 2019 WH GROUP LIMITED
For the year ended December 31, 2019
Notes to the Consolidated Financial Statements (Continued)
32. BORROWINGS (Continued)
2019 2018US$’million US$’million
Analysis of borrowings by currency:Denominated in US$ 2,273 2,458Denominated in RMB 582 464Denominated in PLN 144 76Denominated in RON 41 60Denominated in HK$ 50 18Denominated in EUR 2 2
3,092 3,078
Notes:
i. In May 2018, the Group established a new commercial paper program to issue short-term notes. The program allows the Group to use the proceeds to fund operating cash requirements. Under the terms of the commercial paper agreement, the Group pays a rate of interest based on, among other factors, the maturity of the issuance and market conditions. The maturities of the issued papers may vary, but may not exceed 397 days from the date of issuance. The issuance of commercial papers has the effect of reducing available liquidity by an amount equal to the principal outstanding amount of the commercial papers. Maximum issuance capacity under the program is US$1,750 million.
ii. Fixed rate bank loans carry interest at fixed rates ranging from 2.25% to 5.80% (2018: 2.25% to 5.70%) and floating rates ranging from WIBOR+0.50% to the U.S. Prime+0.375% per annum per annum at December 31, 2019 (2018: WIBOR+0.5% to the U.S. Prime+0.375% per annum).
iii. Loans from third parties carry interest at a fixed rate of 0.9% per annum at December 31, 2019 (2018: 0.9% per annum).
iv. Bank overdrafts at December 31, 2018 carry interest at a floating rate of 3.92% per annum.
v. The amounts due are based on scheduled repayment dates set out in the loan agreements.
The Group’s borrowings contain affirmative and negative covenants that, among other things, limit or restrict the Group’s ability to create liens and encumbrances, incur debt, enter into liquidation, enter into change of control transactions or change the scope of the business, or dispose of or transfer assets, in each case, subject to certain qualifications and exceptions. The Group has no material default in payment of the bank borrowings, nor did it breach any relevant finance covenants for the years ended December 31, 2019 and December 31, 2018. Details of assets pledged to secure borrowings are set out in note 42 to the financial statements.

150 WH GROUP LIMITED ANNUAL REPORT 2019
For the year ended December 31, 2019
Notes to the Consolidated Financial Statements (Continued)
33. DEFERRED TAXATIONFor the purpose of presentation in the consolidated statement of financial position, certain deferred tax assets and liabilities have been offset. The following is the analysis of the deferred tax balances for financial reporting purposes:
2019 2018US$’million US$’million
Deferred tax assets 66 57Deferred tax liabilities (660) (598)
(594) (541)
The following are the major deferred tax assets/liabilities recognised by the Group, and the movements thereon during the year:
Tax effect of deductible temporary differences:
Impairment of
financial assets
Impairment loss
and accelerated
accounting
depreciation on
property, plant
and equipment
Unrealised
profit in
inventories
Write-down of
inventories Tax losses
Unpaid staff
welfare
Fair value
changes arising
from biological
assets
Other
deductible
temporary
differences Total
US$’million US$’million US$’million US$’million US$’million US$’million US$’million US$’million US$ ’million
At January 1, 2018 —* 6 13 —* 74 112 — 60 265
Currency realignment —* —* —* —* (2) — — (1) (3)
Credited (charged) to profit or
loss —* (1) 2 —* (1) 13 33 12 58
Credited (charged) to equity — — — — — 1 — (2) (1)
At December 31, 2018 and
January 1, 2019 —* 5 15 —* 71 126 33 69 319
Currency realignment —* —* —* —* —* — — —* —*
Acquisition of subsidiaries
(Note 36) — — — — —* — — 1 1
Credited (charged) to profit
or loss —* —* 10 3 (9) (12) (21) 6 (23)
Credited to equity — — — — — 49 — —* 49
At December 31, 2019 —* 5 25 3 62 163 12 76 346
* Less than US$1 million

151ANNUAL REPORT 2019 WH GROUP LIMITED
For the year ended December 31, 2019
Notes to the Consolidated Financial Statements (Continued)
33. DEFERRED TAXATION (Continued)Tax effect of taxable temporary differences:
Accelerated tax
depreciation
Undistributed
earnings of
subsidiaries
Fair value
changes arising
from business
combination
Fair value
changes arising
from biological
assets
Other taxable
temporary
differences Total
US$’million US$’million US$’million US$’million US$’million US$’million
At January 1, 2018 (384) (27) (427) (5) (3) (846)
Currency realignment 6 — 5 —* 2 13
Acquisition of subsidiaries (Note 36) (3) — (4) — — (7)
(Charged) credited to profit or loss (42) 17 5 2 (2) (20)
At December 31, 2018 and January 1, 2019 (423) (10) (421) (3) (3) (860)
Currency realignment 2 — —* —* 2 4
Acquisition of subsidiaries (Note 36) (16) — — — — (16)
(Charged) credited to profit or loss (26) (22) (8) (—*) 2 (54)
(Charged) credited to equity (—*) — (—*) —* (14) (14)
At December 31, 2019 (463) (32) (429) (3) (13) (940)
At December 31, 2019, the Group had unused tax losses of US$263 million (2018: US$315 million) available for offsetting against future profits of which a deferred tax asset has been recognised in respect of US$207 million (2018: US$271 million) of such losses. No deferred tax asset has been recognised in respect of such losses of US$56 million (2018: US$44 million) due to unpredictability of future profit stream. There are no unrecognised tax losses at December 31, 2019 (2018: Nil) that may be carried forward indefinitely and other losses will expire on or before 2038.
* Less than US$1 million.
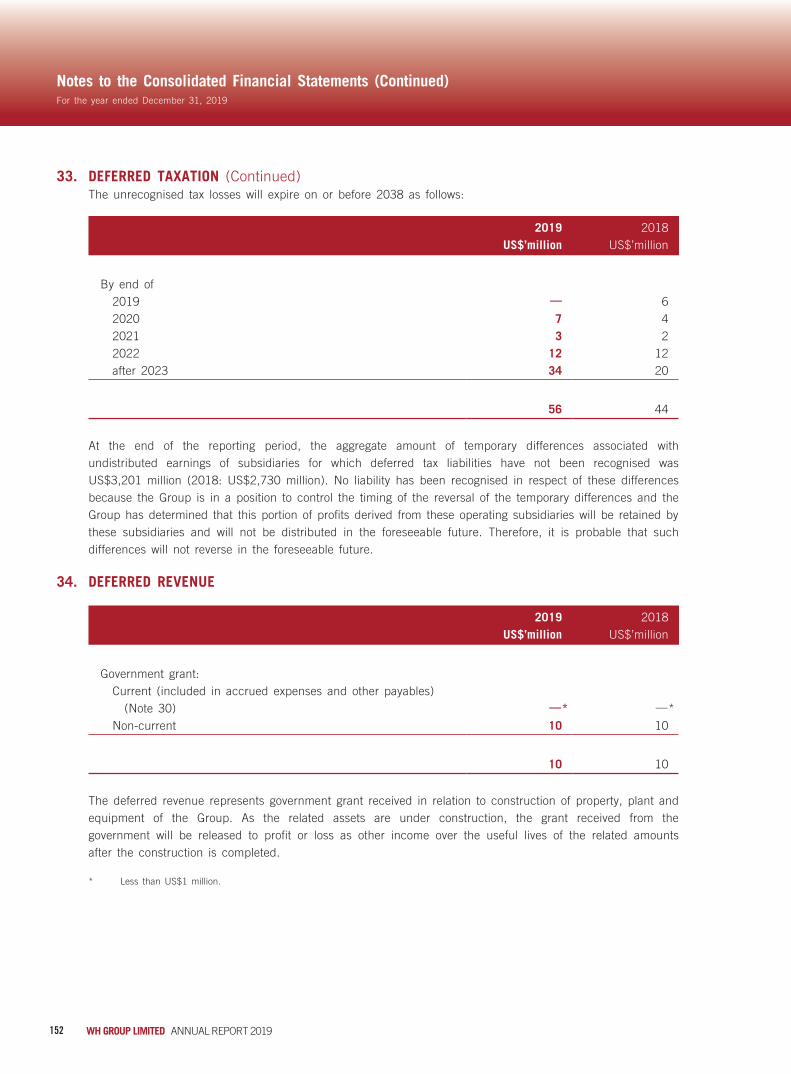
152 WH GROUP LIMITED ANNUAL REPORT 2019
For the year ended December 31, 2019
Notes to the Consolidated Financial Statements (Continued)
33. DEFERRED TAXATION (Continued)The unrecognised tax losses will expire on or before 2038 as follows:
2019 2018US$’million US$’million
By end of2019 — 62020 7 42021 3 22022 12 12after 2023 34 20
56 44
At the end of the reporting period, the aggregate amount of temporary differences associated with undistributed earnings of subsidiaries for which deferred tax liabilities have not been recognised was US$3,201 million (2018: US$2,730 million). No liability has been recognised in respect of these differences because the Group is in a position to control the timing of the reversal of the temporary differences and the Group has determined that this portion of profits derived from these operating subsidiaries will be retained by these subsidiaries and will not be distributed in the foreseeable future. Therefore, it is probable that such differences will not reverse in the foreseeable future.
34. DEFERRED REVENUE
2019 2018US$’million US$’million
Government grant:Current (included in accrued expenses and other payables)
(Note 30) —* —*Non-current 10 10
10 10
The deferred revenue represents government grant received in relation to construction of property, plant and equipment of the Group. As the related assets are under construction, the grant received from the government will be released to profit or loss as other income over the useful lives of the related amounts after the construction is completed.
* Less than US$1 million.

153ANNUAL REPORT 2019 WH GROUP LIMITED
For the year ended December 31, 2019
Notes to the Consolidated Financial Statements (Continued)
35. PENSION LIABILITY AND OTHER RETIREMENT BENEFITS Defined benefit plans
The group entities which operate in the U.S. operate funded defined benefit scheme for all their qualified employees. Pension benefits provided by the Group are currently organised primarily through defined benefit pension plans which cover virtually all the U.S. employees and certain foreign employees of the Group. Salaried employees are provided benefits based on years of service and average salary levels. Hourly employees are provided benefits of stated amounts for each year of service.
The defined benefit plan is administered by a separate fund that is legally separated from the entity. The board of the pension fund is composed of an equal number of representatives from both employers, employees and (former) employees. The board of the pension fund is required by law and by its articles of association to act in the interest of the fund and of all relevant stakeholders in the scheme, i.e. active employees, inactive employees, retirees and employers. The board of the pension fund is responsible for the investment policy with regard to the assets of the fund.
Under the plan, the employees are entitled to retirement benefits varying between 40% and 45% of final salary on attainment of a retirement age of 65. No other post-retirement benefits are provided to these employees.
The plan in the U.S. exposes the Group to actuarial risks such as investment risk, interest rate risk, longevity risk and salary risk are as follows:
Investment riskThe present value of the defined benefit plan liability is calculated using a discount rate determined by reference to high quality corporate bond yields; if the return on plan asset is below this rate, it will create a plan deficit. Currently the plan has a relatively balanced investment in equity securities, debt instruments and real estates. Due to the long-term nature of the plan liability, the board of the pension fund considers it is appropriate that a reasonable portion of the plan assets should be invested in equity securities and in real estates to leverage the return generated by the fund.
Interest riskA decrease in the interest rate of fixed income products will increase the plan liability; however, this will be partially offset by an increase in the return on the plan’s debt investments.
Longevity riskThe present value of the defined benefit plan liability is calculated by reference to the best estimate of the mortality of plan participants both during and after their employment. An increase in the life expectancy of the plan participants will increase the plan’s liability.
Salary riskThe present value of the defined benefit plan liability is calculated by reference to the future salaries of plan participants. As such, an increase in the salary of the plan participants will increase the plan’s liability.
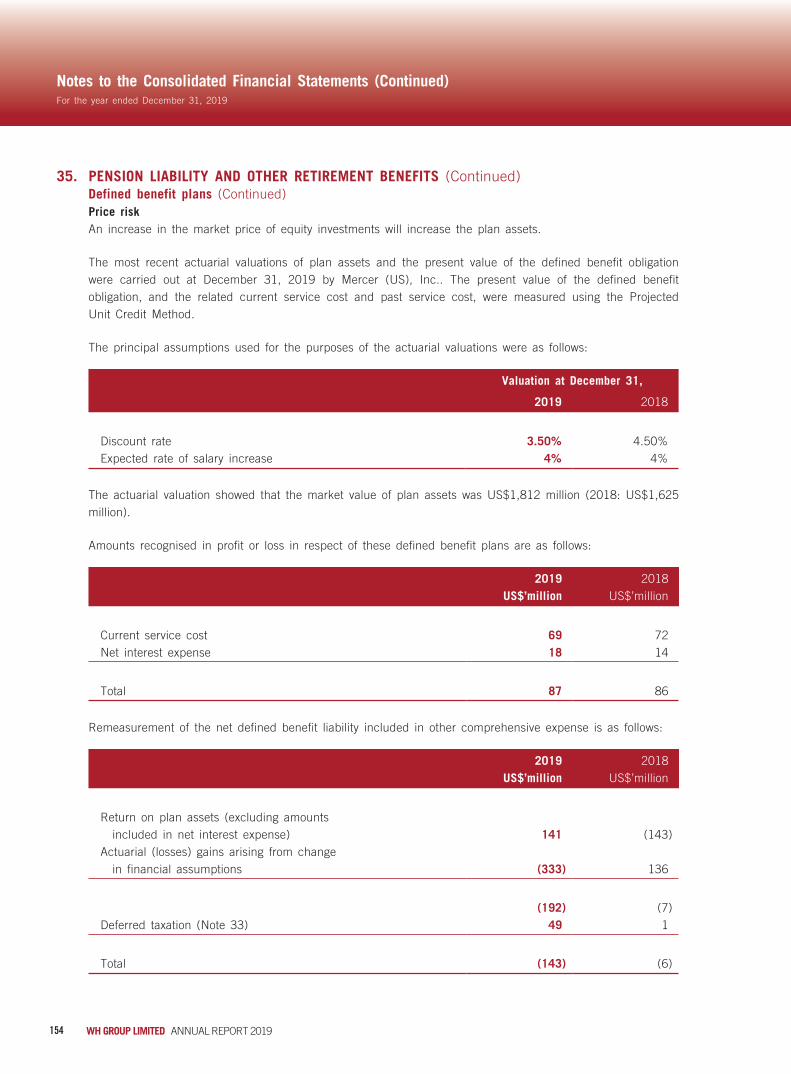
154 WH GROUP LIMITED ANNUAL REPORT 2019
For the year ended December 31, 2019
Notes to the Consolidated Financial Statements (Continued)
35. PENSION LIABILITY AND OTHER RETIREMENT BENEFITS (Continued) Defined benefit plans (Continued) Price risk
An increase in the market price of equity investments will increase the plan assets.
The most recent actuarial valuations of plan assets and the present value of the defined benefit obligation were carried out at December 31, 2019 by Mercer (US), Inc.. The present value of the defined benefit obligation, and the related current service cost and past service cost, were measured using the Projected Unit Credit Method.
The principal assumptions used for the purposes of the actuarial valuations were as follows:
Valuation at December 31,
2019 2018
Discount rate 3.50% 4.50%Expected rate of salary increase 4% 4%
The actuarial valuation showed that the market value of plan assets was US$1,812 million (2018: US$1,625 million).
Amounts recognised in profit or loss in respect of these defined benefit plans are as follows:
2019 2018US$’million US$’million
Current service cost 69 72Net interest expense 18 14
Total 87 86
Remeasurement of the net defined benefit liability included in other comprehensive expense is as follows:
2019 2018US$’million US$’million
Return on plan assets (excluding amounts included in net interest expense) 141 (143)
Actuarial (losses) gains arising from change in financial assumptions (333) 136
(192) (7)Deferred taxation (Note 33) 49 1
Total (143) (6)

155ANNUAL REPORT 2019 WH GROUP LIMITED
For the year ended December 31, 2019
Notes to the Consolidated Financial Statements (Continued)
35. PENSION LIABILITY AND OTHER RETIREMENT BENEFITS (Continued) Defined benefit plans (Continued)
The amount included in the consolidated statement of financial position arising from the Group’s obligation in respect of its defined benefit plans is as follows:
2019 2018US$’million US$’million
Present value of funded defined benefit obligations 2,378 2,071Fair value of plan assets (1,812) (1,625)
Funded status and net liability arising from defined benefit obligation 566 446
Other retirement benefits, net 10 10
576 456
Included in:Current liabilities (Note 30) 18 14Non-current liabilities 558 448Other non-current assets — (6)
576 456
Movements in the present value of the defined benefit obligation in the current year were as follows:
2019 2018US$’million US$’million
Defined benefit obligation at January 1 2,071 2,139Current service cost 69 72Interest cost 90 82Benefits paid (185) (86)Remeasurement losses (gains):
Actuarial losses (gains) arising from change in financial assumptions 333 (136)
Defined benefit obligation at December 31 2,378 2,071

156 WH GROUP LIMITED ANNUAL REPORT 2019
For the year ended December 31, 2019
Notes to the Consolidated Financial Statements (Continued)
35. PENSION LIABILITY AND OTHER RETIREMENT BENEFITS (Continued) Defined benefit plans (Continued)
Movements in the present value of the plan assets in the current year were as follows:
2019 2018US$’million US$’million
Fair value of plan assets at January 1 1,625 1,777Interest income 72 68Contributions from the employers 159 9Benefits paid (185) (86)Remeasurement gains (losses):
Return on plan assets (excluding amounts included in net interest expense) 141 (143)
Fair value of plan assets at December 31 1,812 1,625
The fair values of the plan assets as at the end of the reporting period for each category are as follows:
Fair value of plan assets at December 31,
2019 2018US$’million US$’million
Cash and cash equivalents 142 219Equity securities 616 426Debt securities 877 942Alternative investments 78 87Limited partnerships 179 127
Total fair value 1,892 1,801Unsettled transactions, net (80) (176)
Total plan assets 1,812 1,625
The fair values of the above equity and debt instruments are determined based on quoted market prices in active markets whereas the fair values of alternative investments and limited partnerships are not based on quoted market prices in active markets. As at December 31, 2019, US$757 million, US$956 million and US$179 million of plan assets (2018: US$691 million, US$983 million and US$127 million) are classified as Level 1, Level 2 and Level 3, respectively.
The actual return on plan assets was 5.55% (2018: 5.07%) over 5 years.
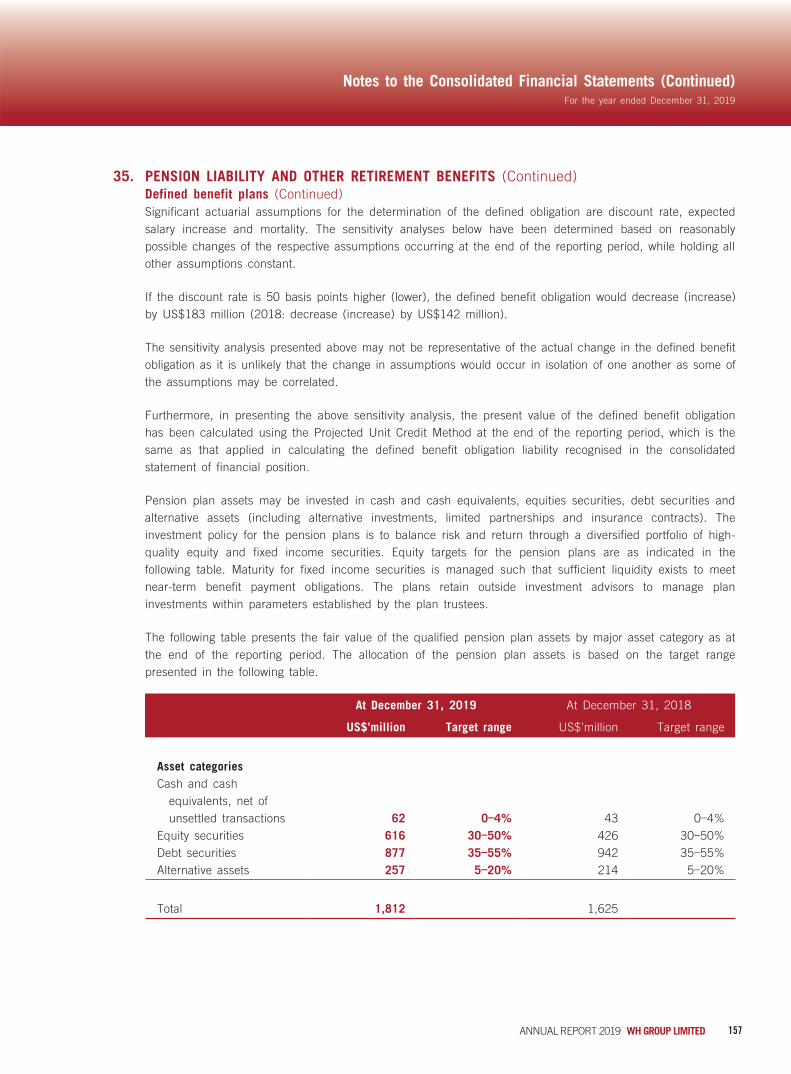
157ANNUAL REPORT 2019 WH GROUP LIMITED
For the year ended December 31, 2019
Notes to the Consolidated Financial Statements (Continued)
35. PENSION LIABILITY AND OTHER RETIREMENT BENEFITS (Continued) Defined benefit plans (Continued)
Significant actuarial assumptions for the determination of the defined obligation are discount rate, expected salary increase and mortality. The sensitivity analyses below have been determined based on reasonably possible changes of the respective assumptions occurring at the end of the reporting period, while holding all other assumptions constant.
If the discount rate is 50 basis points higher (lower), the defined benefit obligation would decrease (increase) by US$183 million (2018: decrease (increase) by US$142 million).
The sensitivity analysis presented above may not be representative of the actual change in the defined benefit obligation as it is unlikely that the change in assumptions would occur in isolation of one another as some of the assumptions may be correlated.
Furthermore, in presenting the above sensitivity analysis, the present value of the defined benefit obligation has been calculated using the Projected Unit Credit Method at the end of the reporting period, which is the same as that applied in calculating the defined benefit obligation liability recognised in the consolidated statement of financial position.
Pension plan assets may be invested in cash and cash equivalents, equities securities, debt securities and alternative assets (including alternative investments, limited partnerships and insurance contracts). The investment policy for the pension plans is to balance risk and return through a diversified portfolio of high-quality equity and fixed income securities. Equity targets for the pension plans are as indicated in the following table. Maturity for fixed income securities is managed such that sufficient liquidity exists to meet near-term benefit payment obligations. The plans retain outside investment advisors to manage plan investments within parameters established by the plan trustees.
The following table presents the fair value of the qualified pension plan assets by major asset category as at the end of the reporting period. The allocation of the pension plan assets is based on the target range presented in the following table.
At December 31, 2019 At December 31, 2018
US$’million Target range US$’million Target range
Asset categoriesCash and cash
equivalents, net of unsettled transactions 62 0–4% 43 0–4%
Equity securities 616 30–50% 426 30–50%Debt securities 877 35–55% 942 35–55%Alternative assets 257 5–20% 214 5–20%
Total 1,812 1,625

158 WH GROUP LIMITED ANNUAL REPORT 2019
For the year ended December 31, 2019
Notes to the Consolidated Financial Statements (Continued)
35. PENSION LIABILITY AND OTHER RETIREMENT BENEFITS (Continued) Defined benefit plans (Continued)
The Group expects to make a contribution of US$217 million to the defined benefit plan during the next financial year.
The following are descriptions of the valuation methodologies and key inputs used to measure pension plan assets recorded at fair value:
Cash and cash equivalentsCash equivalents include highly liquid investments with original maturities of three months or less. Due to their short-term nature, the carrying amount of these instruments approximates the estimated fair value. Actively traded money market funds are measured at their net asset values, which approximates to fair value, and classified as Level 1. The fair values of certain money market funds for which quoted prices are available but traded less frequently have been classified as Level 2.
Equity securitiesWhen available, the fair values of equity securities are based on quoted prices in active markets and classified as Level 1. Level 1 financial instruments include highly liquid instruments with quoted prices, such as equities and mutual funds traded in active markets.
If quoted prices are not available, fair values are obtained from pricing services, broker quotes or other model-based valuation techniques with observable inputs and classified as Level 2. The nature of these equity securities include securities for which quoted prices are available but traded less frequently, securities whose fair value has been derived using a model where inputs to the model are directly observable in the market, or can be derived principally from or corroborated by observable market data and securities that are valued using other financial instruments, the parameters of which can be directly observed. Level 2 equity securities include preferred stock and commingled funds that are not actively traded.
Debt securitiesThe fair values of debt securities are obtained from pricing services, broker quotes or other model-based valuation techniques with observable inputs and classified as Level 1 or Level 2. The nature of these debt securities includes instruments for which quoted prices are available but traded less frequently, instruments whose fair value has been derived using a model where inputs to the model are directly observable in the market, or can be derived principally from or corroborated by observable market data and securities that are valued using other financial instruments, the parameters of which can be directly observed. Level 1 debt securities include corporate debt securities and government debt securities. Level 2 debt securities include commingled funds, asset-backed securities and emerging market securities.
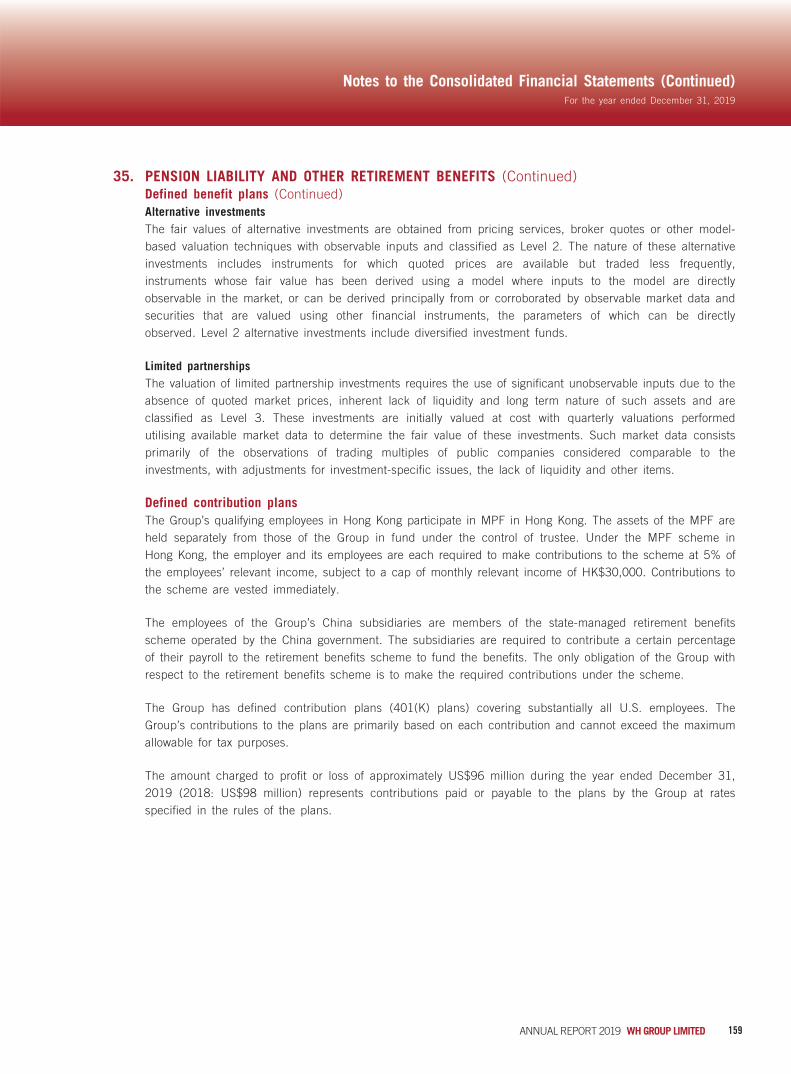
159ANNUAL REPORT 2019 WH GROUP LIMITED
For the year ended December 31, 2019
Notes to the Consolidated Financial Statements (Continued)
35. PENSION LIABILITY AND OTHER RETIREMENT BENEFITS (Continued) Defined benefit plans (Continued) Alternative investments
The fair values of alternative investments are obtained from pricing services, broker quotes or other model-based valuation techniques with observable inputs and classified as Level 2. The nature of these alternative investments includes instruments for which quoted prices are available but traded less frequently, instruments whose fair value has been derived using a model where inputs to the model are directly observable in the market, or can be derived principally from or corroborated by observable market data and securities that are valued using other financial instruments, the parameters of which can be directly observed. Level 2 alternative investments include diversified investment funds.
Limited partnershipsThe valuation of limited partnership investments requires the use of significant unobservable inputs due to the absence of quoted market prices, inherent lack of liquidity and long term nature of such assets and are classified as Level 3. These investments are initially valued at cost with quarterly valuations performed utilising available market data to determine the fair value of these investments. Such market data consists primarily of the observations of trading multiples of public companies considered comparable to the investments, with adjustments for investment-specific issues, the lack of liquidity and other items.
Defined contribution plansThe Group’s qualifying employees in Hong Kong participate in MPF in Hong Kong. The assets of the MPF are held separately from those of the Group in fund under the control of trustee. Under the MPF scheme in Hong Kong, the employer and its employees are each required to make contributions to the scheme at 5% of the employees’ relevant income, subject to a cap of monthly relevant income of HK$30,000. Contributions to the scheme are vested immediately.
The employees of the Group’s China subsidiaries are members of the state-managed retirement benefits scheme operated by the China government. The subsidiaries are required to contribute a certain percentage of their payroll to the retirement benefits scheme to fund the benefits. The only obligation of the Group with respect to the retirement benefits scheme is to make the required contributions under the scheme.
The Group has defined contribution plans (401(K) plans) covering substantially all U.S. employees. The Group’s contributions to the plans are primarily based on each contribution and cannot exceed the maximum allowable for tax purposes.
The amount charged to profit or loss of approximately US$96 million during the year ended December 31, 2019 (2018: US$98 million) represents contributions paid or payable to the plans by the Group at rates specified in the rules of the plans.
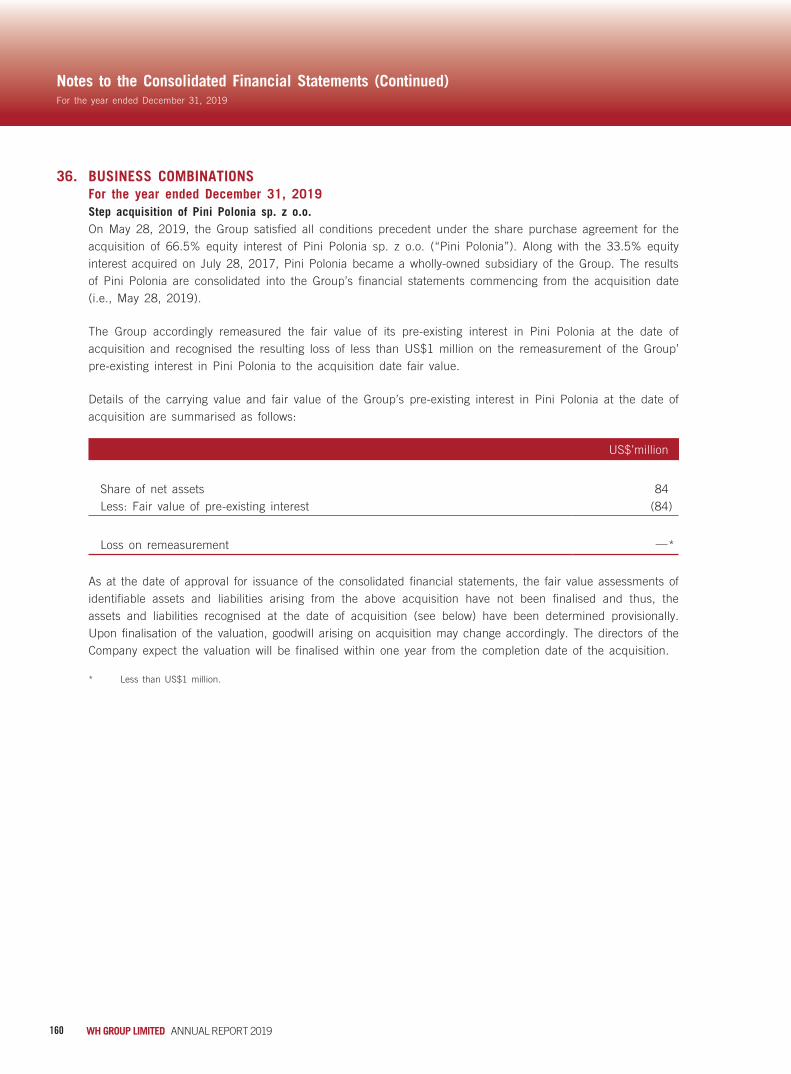
160 WH GROUP LIMITED ANNUAL REPORT 2019
For the year ended December 31, 2019
Notes to the Consolidated Financial Statements (Continued)
36. BUSINESS COMBINATIONS For the year ended December 31, 2019 Step acquisition of Pini Polonia sp. z o.o.
On May 28, 2019, the Group satisfied all conditions precedent under the share purchase agreement for the acquisition of 66.5% equity interest of Pini Polonia sp. z o.o. (“Pini Polonia”). Along with the 33.5% equity interest acquired on July 28, 2017, Pini Polonia became a wholly-owned subsidiary of the Group. The results of Pini Polonia are consolidated into the Group’s financial statements commencing from the acquisition date (i.e., May 28, 2019).
The Group accordingly remeasured the fair value of its pre-existing interest in Pini Polonia at the date of acquisition and recognised the resulting loss of less than US$1 million on the remeasurement of the Group’ pre-existing interest in Pini Polonia to the acquisition date fair value.
Details of the carrying value and fair value of the Group’s pre-existing interest in Pini Polonia at the date of acquisition are summarised as follows:
US$’million
Share of net assets 84Less: Fair value of pre-existing interest (84)
Loss on remeasurement —*
As at the date of approval for issuance of the consolidated financial statements, the fair value assessments of identifiable assets and liabilities arising from the above acquisition have not been finalised and thus, the assets and liabilities recognised at the date of acquisition (see below) have been determined provisionally. Upon finalisation of the valuation, goodwill arising on acquisition may change accordingly. The directors of the Company expect the valuation will be finalised within one year from the completion date of the acquisition.
* Less than US$1 million.

161ANNUAL REPORT 2019 WH GROUP LIMITED
For the year ended December 31, 2019
Notes to the Consolidated Financial Statements (Continued)
36. BUSINESS COMBINATIONS (Continued) For the year ended December 31, 2019 (Continued) Step acquisition of Pini Polonia sp. z o.o. (Continued)
The fair values of the identifiable assets and liabilities of the acquisition as at the date of acquisition (determined on a provisional basis) were as follows:
Fair value recognised on
acquisitionUS$’million
Property, plant and equipment 105Inventories 9Trade and bills receivables 72Prepayments, other receivables and other assets —*Bank balances and cash 1Other non-current assets 44Trade payables (65)Accrued expenses and other payables (2)Borrowings and other loans (13)Lease liabilities (3)Deferred tax liabilities (15)Other liabilities (48)
Total identifiable net assets at fair value 85Goodwill 111
196
Satisfied by:Cash 112Fair value of pre-existing interest 84
196
The Group incurred transaction costs of US$2 million for the acquisition. These transaction costs have been expensed and are included in other expenses in profit or loss.
* Less than US$1 million.

162 WH GROUP LIMITED ANNUAL REPORT 2019
For the year ended December 31, 2019
Notes to the Consolidated Financial Statements (Continued)
36. BUSINESS COMBINATIONS (Continued) For the year ended December 31, 2019 (Continued) Step acquisition of Pini Polonia sp. z o.o. (Continued)
An analysis of the cash flows in respect of the acquisition of the above subsidiaries is as follows:
US$’million
Cash consideration (112)Bank balances and cash acquired 1
Net outflow of cash and cash equivalents included in cash flows used in investing activities (111)
Transaction costs paid during the year included in cash flows from operating activities (2)
(113)
Since the completion of acquisition, Pini Polonia contributed US$167 million to the Group’s revenue and US$6 million loss to the consolidated profit before tax for the year ended December 31, 2019.
Had the acquisition of Pini Polonia taken place at the beginning of the year, the revenue and the consolidated profit before tax of the Group would have been US$24,307 million and US$2,048 million, respectively.

163ANNUAL REPORT 2019 WH GROUP LIMITED
For the year ended December 31, 2019
Notes to the Consolidated Financial Statements (Continued)
36. BUSINESS COMBINATIONS (Continued) For the year ended December 31, 2018 Acquisition of Elit S.R.L. and Vericom 2001 S.R.L.
On January 9, 2018, the Group acquired from an independent third party the entire equity interest in two Romanian companies, Elit S.R.L. and Vericom 2001 S.R.L. (“Elit and Vericom”). The acquisition was made as part of the Group’s strategy to increase profitability in branded packaged meats and strengthen their leading position in the packaged meats market in Romania.
The fair values of the identifiable assets and liabilities of the acquisition as at the date of acquisition were as follows:
Fair value recognised on
acquisitionUS$’million
Property, plant and equipment 36Intangible assets 26Inventories 5Trade and bills receivables 8Prepayments, other receivables and other assets —*Bank balances and cash 7Trade payables (3)Accrued expenses and other payables (3)Deferred tax liabilities (7)Other liabilities (13)
Total identifiable net assets at fair value 56Goodwill 28
Satisfied by cash 84
The Group incurred transaction costs of US$1 million for the acquisition. These transaction costs have been expensed and are included in other expenses in profit or loss.
* Less than US$1 million.

164 WH GROUP LIMITED ANNUAL REPORT 2019
For the year ended December 31, 2019
Notes to the Consolidated Financial Statements (Continued)
36. BUSINESS COMBINATIONS (Continued) For the year ended December 31, 2018 (Continued) Acquisition of Elit S.R.L. and Vericom 2001 S.R.L.
An analysis of the cash flows in respect of the acquisition of the above subsidiaries is as follows:
US$’million
Cash consideration (84)Bank balances and cash acquired 7Outstanding consideration at the end of the reporting period 18
Net outflow of cash and cash equivalents included in cash flows used in investing activities (59)
Transaction costs paid during the year included in cash flows from operating activities (1)
(60)
Since the acquisition, Elit and Vericom contributed US$117 million to the Group’s revenue and US$9 million to the consolidated profit before tax for year ended December 31, 2018.
The revenue and profit of the Group for the year ended December 31, 2018 would remain unchanged as the acquisition of Elit and Vericom had taken place at the beginning of the year.

165ANNUAL REPORT 2019 WH GROUP LIMITED
For the year ended December 31, 2019
Notes to the Consolidated Financial Statements (Continued)
37. NOTES TO THE CONSOLIDATED STATEMENT OF CASH FLOWS (a) Major non-cash transactions
During the year, the Group had non-cash additions to right-of-use assets and lease liabilities of US$190 million and US$180 million, respectively (2018: Nil).
On December 30, 2019, the Group contributed certain biogas operations to its joint venture, Align RNG, LLC (“Align”). The transaction resulted in a gain of US$42 million, which represented the difference between the fair value of the equity interests received from Align and the net book value of the biogas operations contributed.
(b) Changes in liabilities arising from financing activities
Dividend payables
Obligations under finance leases/lease liabilities
Borrowings and other loans
US$’million US$’million US$’million
At January 1, 2018 13 28 3,106Changes from financing cash flows (795) (5) 4Interest expense and amortisation of
transaction costs — — 5Dividends declared 786 — —Currency realignment 6 2 (37)
At December 31, 2018 10 25 3,078Effect of adoption of IFRS 16 — 361 —
At January 1, 2019 (restated) 10 386 3,078Changes from financing cash flows (464) (116) 3New leases — 180 —Interest expense — 18 —*Acquisition of subsidiaries (Note 36) — 3 13Dividends declared 472 — —Currency realignment (—*) (6) (2)
At December 31, 2019 18 465 3,092
(c) Total cash outflow for leasesThe total cash outflow for leases included in the statement of cash flows is as follows:
2019US$’million
Within operating activities 87Within investing activities (24)Within financing activities 116
179
* Less than US$1 million.

166 WH GROUP LIMITED ANNUAL REPORT 2019
For the year ended December 31, 2019
Notes to the Consolidated Financial Statements (Continued)
38. SHARE CAPITAL
Number of shares Amount’million US$’million
Ordinary shares of US$0.0001 each:
Authorised:At January 1, 2018, December 31, 2018, January 1, 2019, and
December 31, 2019 50,000.00 5
Issued and fully paid:At January 1, 2018 14,664.23 1Issue of shares on exercise of share options (Note) 11.25 —*
At December 31, 2018 and January 1, 2019 14,675.48 1Issue of shares on exercise of share options (Note) 45.27 —*
At December 31, 2019 14,720.75 1
Note:
The share options exercised during the years are under the pre-IPO share option scheme.
All the shares issued during the year rank pari passu with the then existing shares in all respects.
39. CAPITAL RISK MANAGEMENT AND FINANCIAL INSTRUMENTSThe Group manages its capital to ensure that entities in the Group will be able to continue as a going concern while maximising the return to owners through the optimisation of the debt and equity balance. The Group’s overall strategy remains unchanged during the years.
The capital structure of the Group consists of net debt, which includes the borrowings disclosed in note 32, net of cash and cash equivalents and equity attributable to owners of the Company, comprising issued share capital, reserves and retained profits. As at December 31, 2019, the Group’s net debt to equity ratio was 26.9% (2018: 30.8%)
* Less than US$1 million.
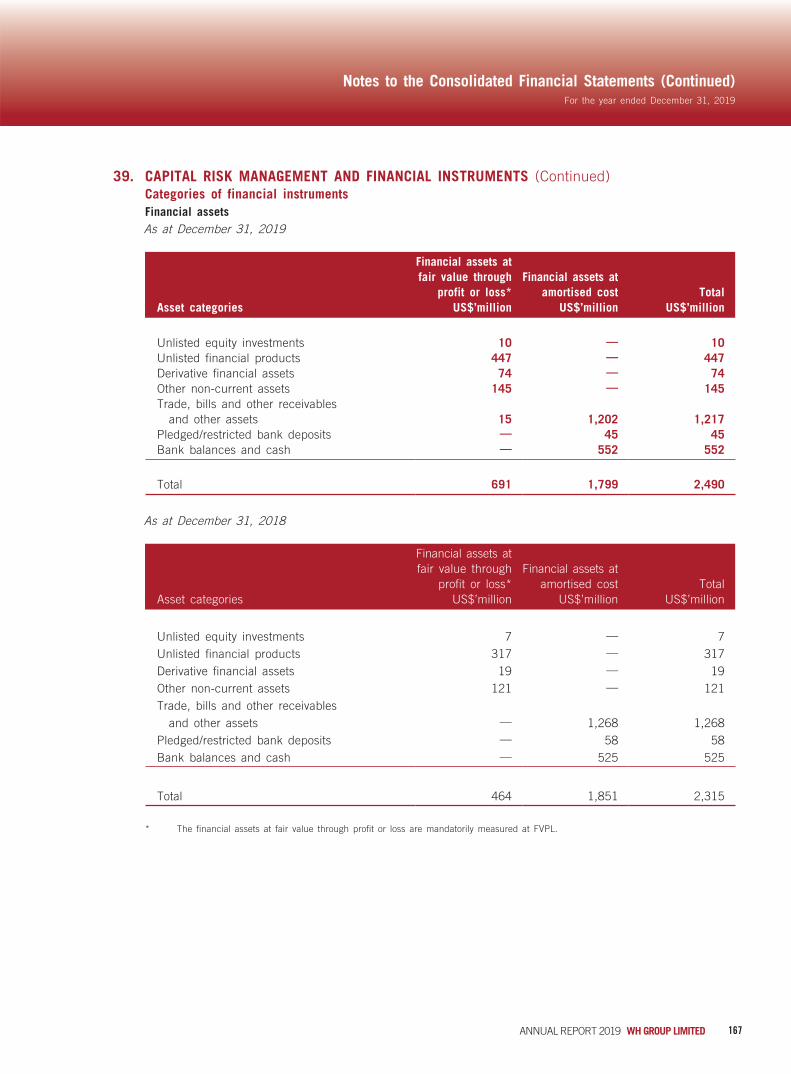
167ANNUAL REPORT 2019 WH GROUP LIMITED
For the year ended December 31, 2019
Notes to the Consolidated Financial Statements (Continued)
39. CAPITAL RISK MANAGEMENT AND FINANCIAL INSTRUMENTS (Continued) Categories of financial instruments Financial assets As at December 31, 2019
Financial assets at fair value through
profit or loss*Financial assets at
amortised cost TotalAsset categories US$’million US$’million US$’million
Unlisted equity investments 10 — 10Unlisted financial products 447 — 447Derivative financial assets 74 — 74Other non-current assets 145 — 145Trade, bills and other receivables
and other assets 15 1,202 1,217Pledged/restricted bank deposits — 45 45Bank balances and cash — 552 552
Total 691 1,799 2,490
As at December 31, 2018
Financial assets at fair value through
profit or loss*Financial assets at
amortised cost TotalAsset categories US$’million US$’million US$’million
Unlisted equity investments 7 — 7Unlisted financial products 317 — 317Derivative financial assets 19 — 19Other non-current assets 121 — 121Trade, bills and other receivables
and other assets — 1,268 1,268Pledged/restricted bank deposits — 58 58Bank balances and cash — 525 525
Total 464 1,851 2,315
* The financial assets at fair value through profit or loss are mandatorily measured at FVPL.

168 WH GROUP LIMITED ANNUAL REPORT 2019
For the year ended December 31, 2019
Notes to the Consolidated Financial Statements (Continued)
39. CAPITAL RISK MANAGEMENT AND FINANCIAL INSTRUMENTS (Continued) Categories of financial instruments (Continued) Financial liabilities
2019 2018US$’million US$’million
At amortised costs:Trade and other payables 1,462 1,329Lease liabilities/obligations under finance leases 465 25Borrowings (fixed and floating rates) 3,092 3,078Bank overdrafts — 41
5,019 4,473
At fair value through profit or loss:Derivative financial liabilities 35 21
Financial risk management objectives and policiesThe Group’s major financial instruments include pledged bank deposits, bank balances and cash, financial assets at FVPL, derivative financial instruments, trade, bills and other receivables, other non-current assets, trade and other payables, lease liabilities, obligation under finance leases, borrowings and bank overdrafts. Details of the financial instruments are disclosed in respective notes. The risks associated with these financial instruments include market risk (currency risk and interest rate risk), credit risk and liquidity risk. The policies on how to mitigate these risks are set out below. Management of the Group manages and monitors these exposures to ensure that appropriate measures are implemented in a timely and effective manner.
Market riskThe Group’s activities expose it primarily to the financial risks of changes in foreign currency exchange rates and interest rates.
There has been no change to the Group’s exposure to market risks or the manner in which it manages and measures the risk.
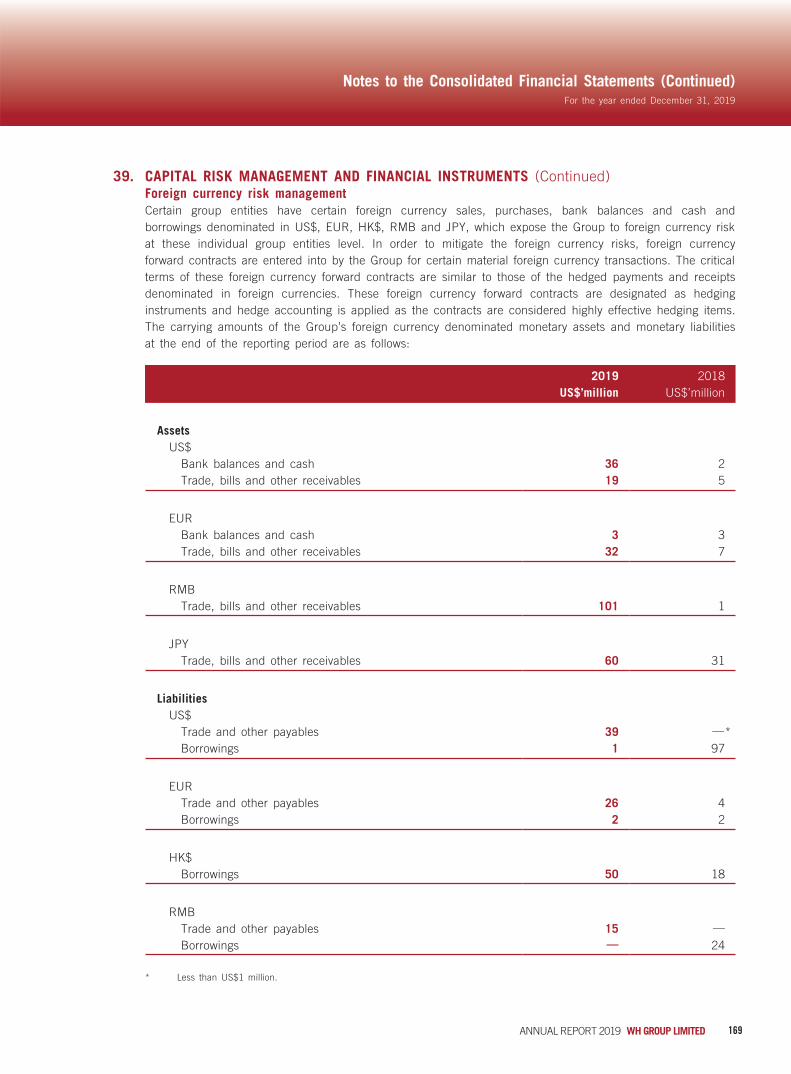
169ANNUAL REPORT 2019 WH GROUP LIMITED
For the year ended December 31, 2019
Notes to the Consolidated Financial Statements (Continued)
39. CAPITAL RISK MANAGEMENT AND FINANCIAL INSTRUMENTS (Continued) Foreign currency risk management
Certain group entities have certain foreign currency sales, purchases, bank balances and cash and borrowings denominated in US$, EUR, HK$, RMB and JPY, which expose the Group to foreign currency risk at these individual group entities level. In order to mitigate the foreign currency risks, foreign currency forward contracts are entered into by the Group for certain material foreign currency transactions. The critical terms of these foreign currency forward contracts are similar to those of the hedged payments and receipts denominated in foreign currencies. These foreign currency forward contracts are designated as hedging instruments and hedge accounting is applied as the contracts are considered highly effective hedging items. The carrying amounts of the Group’s foreign currency denominated monetary assets and monetary liabilities at the end of the reporting period are as follows:
2019 2018US$’million US$’million
AssetsUS$
Bank balances and cash 36 2Trade, bills and other receivables 19 5
EURBank balances and cash 3 3Trade, bills and other receivables 32 7
RMBTrade, bills and other receivables 101 1
JPYTrade, bills and other receivables 60 31
LiabilitiesUS$
Trade and other payables 39 —*Borrowings 1 97
EURTrade and other payables 26 4Borrowings 2 2
HK$Borrowings 50 18
RMBTrade and other payables 15 —
Borrowings — 24
* Less than US$1 million.

170 WH GROUP LIMITED ANNUAL REPORT 2019
For the year ended December 31, 2019
Notes to the Consolidated Financial Statements (Continued)
39. CAPITAL RISK MANAGEMENT AND FINANCIAL INSTRUMENTS (Continued) Foreign currency risk management (Continued) Sensitivity analysis
The Group is mainly exposed to the effect of US$ against the functional currencies of respective group entities, except for HK$ as it is pegged to the US$. The directors of the Company consider that the risks exposed to the effect of EUR and RMB are not material.
The following table details the Group’s sensitivity to a 5% (2018: 5%) increase and decrease in US$ against functional currencies of respective group entities which represent management’s assessment of the reasonably possible change in foreign exchange rates. The sensitivity analysis includes only outstanding foreign currency denominated monetary items and adjusts their translation to the functional currencies of respective group entities at year end for a 5% (2018: 5%) change in foreign currency rates. A positive (negative) number below indicates an increase (decrease) in post-tax profit where US$ strengthens 5% (2018: 5%) against the relevant currency.
2019 2018US$’million US$’million
US$ impact 6 (3)
In management’s opinion, the sensitivity analysis is unrepresentative of the inherent foreign exchange risk as the year end exposure does not reflect the exposure during the respective year.
Interest rate risk managementThe Group’s fair value interest rate risk relates primarily to its financial assets at FVPL, fixed-rate borrowings and finance leases (see notes 17, 26, 31 and 32 respectively for details). The Group currently does not enter into any derivative contracts to hedge its exposure to changes in fair values of financial assets at FVPL, fixed-rate borrowings and finance leases. However, the management of the Group will consider hedging significant interest rate exposure should the need arise.
The Group’s cash flow interest rate risk relates primarily to floating rates bank balances, borrowings and bank overdrafts (see notes 28 and 32 respectively for details). The Group’s exposures to interest rates on financial liabilities are detailed in the liquidity risk management section of this note.
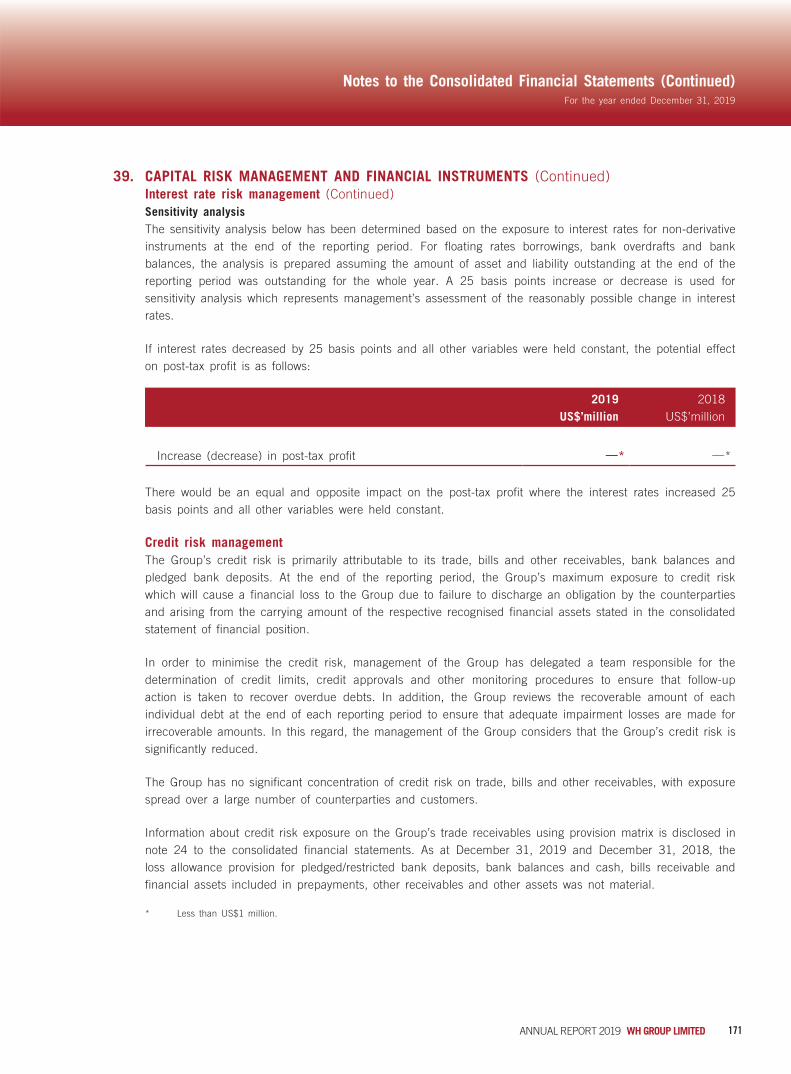
171ANNUAL REPORT 2019 WH GROUP LIMITED
For the year ended December 31, 2019
Notes to the Consolidated Financial Statements (Continued)
39. CAPITAL RISK MANAGEMENT AND FINANCIAL INSTRUMENTS (Continued) Interest rate risk management (Continued) Sensitivity analysis
The sensitivity analysis below has been determined based on the exposure to interest rates for non-derivative instruments at the end of the reporting period. For floating rates borrowings, bank overdrafts and bank balances, the analysis is prepared assuming the amount of asset and liability outstanding at the end of the reporting period was outstanding for the whole year. A 25 basis points increase or decrease is used for sensitivity analysis which represents management’s assessment of the reasonably possible change in interest rates.
If interest rates decreased by 25 basis points and all other variables were held constant, the potential effect on post-tax profit is as follows:
2019 2018US$’million US$’million
Increase (decrease) in post-tax profit —* —*
There would be an equal and opposite impact on the post-tax profit where the interest rates increased 25 basis points and all other variables were held constant.
Credit risk managementThe Group’s credit risk is primarily attributable to its trade, bills and other receivables, bank balances and pledged bank deposits. At the end of the reporting period, the Group’s maximum exposure to credit risk which will cause a financial loss to the Group due to failure to discharge an obligation by the counterparties and arising from the carrying amount of the respective recognised financial assets stated in the consolidated statement of financial position.
In order to minimise the credit risk, management of the Group has delegated a team responsible for the determination of credit limits, credit approvals and other monitoring procedures to ensure that follow-up action is taken to recover overdue debts. In addition, the Group reviews the recoverable amount of each individual debt at the end of each reporting period to ensure that adequate impairment losses are made for irrecoverable amounts. In this regard, the management of the Group considers that the Group’s credit risk is significantly reduced.
The Group has no significant concentration of credit risk on trade, bills and other receivables, with exposure spread over a large number of counterparties and customers.
Information about credit risk exposure on the Group’s trade receivables using provision matrix is disclosed in note 24 to the consolidated financial statements. As at December 31, 2019 and December 31, 2018, the loss allowance provision for pledged/restricted bank deposits, bank balances and cash, bills receivable and financial assets included in prepayments, other receivables and other assets was not material.
* Less than US$1 million.

172 WH GROUP LIMITED ANNUAL REPORT 2019
For the year ended December 31, 2019
Notes to the Consolidated Financial Statements (Continued)
39. CAPITAL RISK MANAGEMENT AND FINANCIAL INSTRUMENTS (Continued) Credit risk management (Continued)
The ECLs for financial assets included in prepayments, other receivables and other assets are based on assumptions about probability of default and expected loss rates. The Group uses judgement in making these assumptions and selecting inputs to the ECLs calculations, based on the Group’s historical loss record, current conditions as well as forward-looking information.
Maximum exposure and year-end stagingThe tables below shows the credit quality and the maximum exposure to credit risk based on the Group’s credit policy, which is mainly based on past due information unless other information is available without undue cost or effort, and year-end staging classification as at December 31. The amounts presented are gross carrying amounts for financial assets and the exposure to credit risk for the financial guarantee contracts.
As at December 31, 2019
12-month ECLs Lifetime ECLs
Stage 1 Stage 2 Stage 3Simplified approach Total
US$’million US$’million US$’million US$’million US$’million
Trade and bills receivables 9 — — 1,038 1,047
Financial assets included in prepayments, other receivables and other assets 155 — — — 155
Pledged deposits 45 — — — 45Cash and cash
equivalents 552 — — — 552
761 — — 1,038 1,799
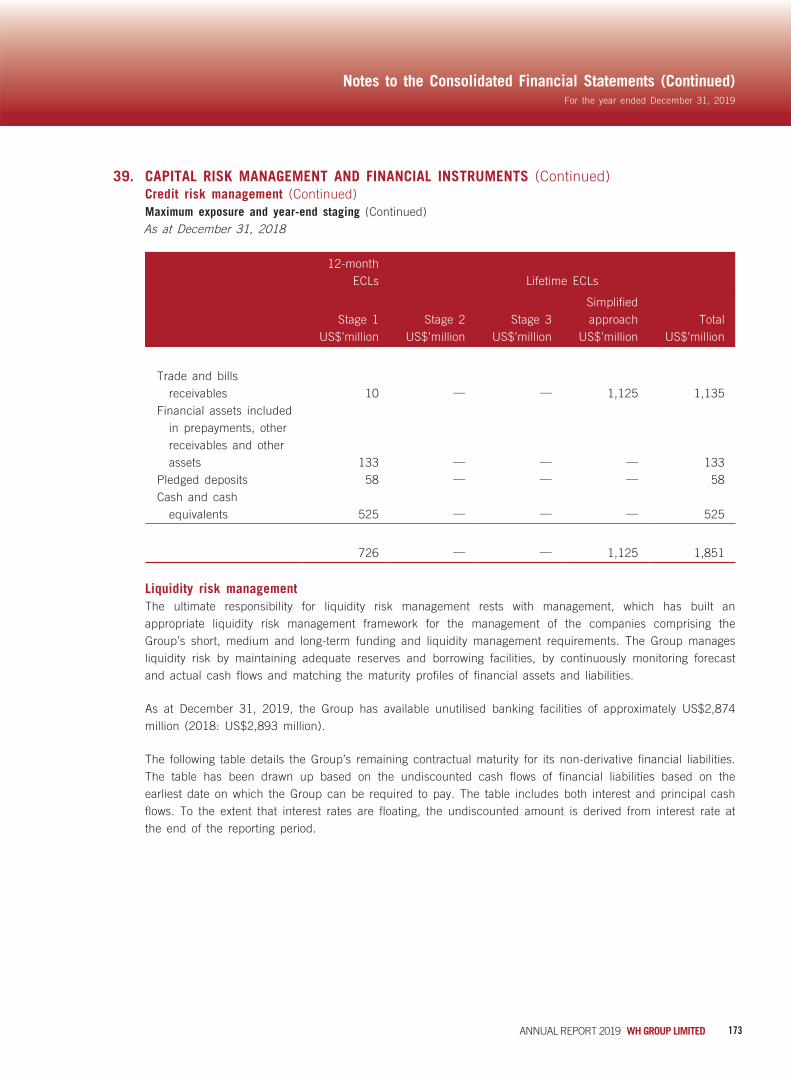
173ANNUAL REPORT 2019 WH GROUP LIMITED
For the year ended December 31, 2019
Notes to the Consolidated Financial Statements (Continued)
39. CAPITAL RISK MANAGEMENT AND FINANCIAL INSTRUMENTS (Continued) Credit risk management (Continued) Maximum exposure and year-end staging (Continued) As at December 31, 2018
12-month ECLs Lifetime ECLs
Stage 1 Stage 2 Stage 3Simplified approach Total
US$’million US$’million US$’million US$’million US$’million
Trade and bills receivables 10 — — 1,125 1,135
Financial assets included in prepayments, other receivables and other assets 133 — — — 133
Pledged deposits 58 — — — 58Cash and cash
equivalents 525 — — — 525
726 — — 1,125 1,851
Liquidity risk managementThe ultimate responsibility for liquidity risk management rests with management, which has built an appropriate liquidity risk management framework for the management of the companies comprising the Group’s short, medium and long-term funding and liquidity management requirements. The Group manages liquidity risk by maintaining adequate reserves and borrowing facilities, by continuously monitoring forecast and actual cash flows and matching the maturity profiles of financial assets and liabilities.
As at December 31, 2019, the Group has available unutilised banking facilities of approximately US$2,874 million (2018: US$2,893 million).
The following table details the Group’s remaining contractual maturity for its non-derivative financial liabilities. The table has been drawn up based on the undiscounted cash flows of financial liabilities based on the earliest date on which the Group can be required to pay. The table includes both interest and principal cash flows. To the extent that interest rates are floating, the undiscounted amount is derived from interest rate at the end of the reporting period.

174 WH GROUP LIMITED ANNUAL REPORT 2019
For the year ended December 31, 2019
Notes to the Consolidated Financial Statements (Continued)
39. CAPITAL RISK MANAGEMENT AND FINANCIAL INSTRUMENTS (Continued) Liquidity risk management (Continued)
In addition, the following table also details the Group’s analysis of its derivative financial instruments that settle on a net basis, based on their fair value recorded in liabilities as at the end of the reporting period.
On demand and
6 months or less
6 to 12 months
1 to 2 years
2 to 5 years
More than 5 years Total
US$’million US$’million US$’million US$’million US$’million US$’million
At December 31, 2019Trade payables 1,072 2 — — — 1,074Other payables 329 — 59 — — 388Lease liabilities 63 61 145 80 210 559Fixed-rate borrowings 610 38 477 496 1,188 2,809Floating-rate borrowings 244 75 30 359 — 708
2,312 176 711 935 1,398 5,538
Derivative financial liabilities, net 27 — 8 — — 35
At December 31, 2018Trade payables 970 7 — — — 977Other payables 302 — 50 — — 352Obligations under finance
leases 1 2 3 6 19 31Bank overdrafts 41 — — — — 41Fixed-rate borrowings 162 451 457 883 706 2,659Floating-rate borrowings 236 42 46 408 — 732
1,712 502 556 1,297 725 4,792
Derivative financial liabilities, net 6 — 8 — — 14

175ANNUAL REPORT 2019 WH GROUP LIMITED
For the year ended December 31, 2019
Notes to the Consolidated Financial Statements (Continued)
39. CAPITAL RISK MANAGEMENT AND FINANCIAL INSTRUMENTS (Continued) Fair value measurement
The directors of the Company consider that the carrying amounts of current financial assets and financial liabilities recorded at amortised cost in the consolidated financial statements approximate to their fair values due to the short term maturities of these instruments.
The fair values of non-current financial assets and financial liabilities have been calculated by discounting the expected future cash flows using rates currently available for instruments with similar terms, credit risk and remaining maturities and management has assessed that the fair values of non-current financial assets and financial liabilities approximate to their carrying amounts. The Group’s own non-performance risk for non-current financial liabilities as at December 31, 2019 and December 31, 2018 were assessed to be insignificant.
Fair value measurements recognised in the consolidated statement of financial positionThe following table provides an analysis of financial instruments that are measured subsequent to initial recognition at fair value, grouped into Levels 1 to 3 based on the degree to which the fair value is observable.
• Level 1 fair value measurements are those derived from quoted prices (unadjusted) in active markets for identical assets or liabilities.
• Level 2 fair value measurements are those derived from inputs other than quoted prices included within Level 1 that are observable for the asset or liability, either directly (i.e. as prices) or indirectly (i.e. derived from prices).
• Level 3 fair value measurements are those derived from valuation techniques that include inputs for the asset or liability that are not based on observable market data (unobservable inputs).
2019
Level 1 Level 2 Level 3 TotalUS$’million US$’million US$’million US$’million
Financial assets at fair value through profit or loss — 10 447 457
Derivative financial assets 71 17 2 90Other non-current assets 31 88 26 145Financial assets included
in prepayments, other receivables and other assets — 15 — 15
102 130 475 707
Derivative financial liabilities 18 26 7 51

176 WH GROUP LIMITED ANNUAL REPORT 2019
For the year ended December 31, 2019
Notes to the Consolidated Financial Statements (Continued)
39. CAPITAL RISK MANAGEMENT AND FINANCIAL INSTRUMENTS (Continued) Fair value measurements recognised in the consolidated statement of financial position (Continued)
2018
Level 1 Level 2 Level 3 TotalUS$’million US$’million US$’million US$’million
Financial assets at fair value through profit or loss — 7 317 324
Derivative financial assets 12 6 1 19Other non-current assets 29 70 22 121
41 83 340 464
Derivative financial liabilities 7 10 4 21
Financial assets at FVPL included (a) unlisted investments in equity securities whose fair values are determined by income approach based on discounted cash flow analysis on the expected interest rates (Level 2), and (b) unlisted financial products whose fair values are determined based on significant unobservable inputs (Level 3) including expected rate of return of 3.7% to 4.1% (December 31, 2018: 4.0% to 5.3%).
The fair values of derivative financial assets/liabilities are determined by quoted prices in active markets (Level 1) or using the income approach based on discounted cash flow analysis on the expected interest rates (Level 2), as appropriate.
Other non-current assets include mutual funds and institutional funds which are valued based on its quoted prices in active market (Level 1) or derived from the net asset value per share of the investment (Level 3), as appropriate, and insurance contracts which are valued at their cash surrender value using the daily asset unit value which is based on the quoted market price of the underlying securities and classified within Level 2.
There were no transfers between Level 1 and Level 2 fair value measurements during the year, and no transfers into or out of Level 3 fair value measurements during the year ended December 31, 2019.
Sensitivity analysisThe fair value of financial assets and financial liabilities that are classified as Level 3 is determined by using valuation techniques including Monte Carlo simulation. In determining the fair value, specific valuation techniques are used with reference to inputs such as RMB risk-free interest rate, LIBOR and other specific input relevant to those particular financial assets and financial liabilities.
Changing unobservable inputs used in Level 3 valuation to reasonable alternative assumptions would not have significant impact to the Group’s profit or loss.
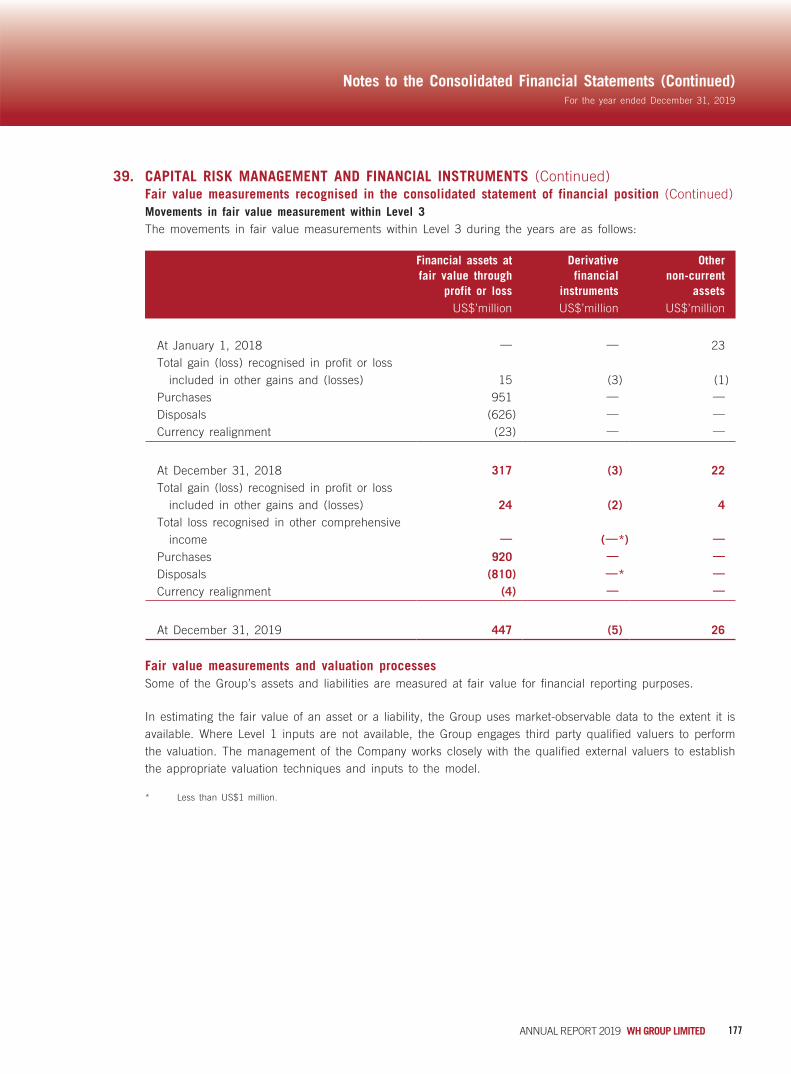
177ANNUAL REPORT 2019 WH GROUP LIMITED
For the year ended December 31, 2019
Notes to the Consolidated Financial Statements (Continued)
39. CAPITAL RISK MANAGEMENT AND FINANCIAL INSTRUMENTS (Continued) Fair value measurements recognised in the consolidated statement of financial position (Continued) Movements in fair value measurement within Level 3
The movements in fair value measurements within Level 3 during the years are as follows:
Financial assets at fair value through
profit or loss
Derivative financial
instruments
Other non-current
assetsUS$’million US$’million US$’million
At January 1, 2018 — — 23Total gain (loss) recognised in profit or loss
included in other gains and (losses) 15 (3) (1)Purchases 951 — —
Disposals (626) — —
Currency realignment (23) — —
At December 31, 2018 317 (3) 22Total gain (loss) recognised in profit or loss
included in other gains and (losses) 24 (2) 4Total loss recognised in other comprehensive
income — (—*) —
Purchases 920 — —
Disposals (810) —* —
Currency realignment (4) — —
At December 31, 2019 447 (5) 26
Fair value measurements and valuation processesSome of the Group’s assets and liabilities are measured at fair value for financial reporting purposes.
In estimating the fair value of an asset or a liability, the Group uses market-observable data to the extent it is available. Where Level 1 inputs are not available, the Group engages third party qualified valuers to perform the valuation. The management of the Company works closely with the qualified external valuers to establish the appropriate valuation techniques and inputs to the model.
* Less than US$1 million.
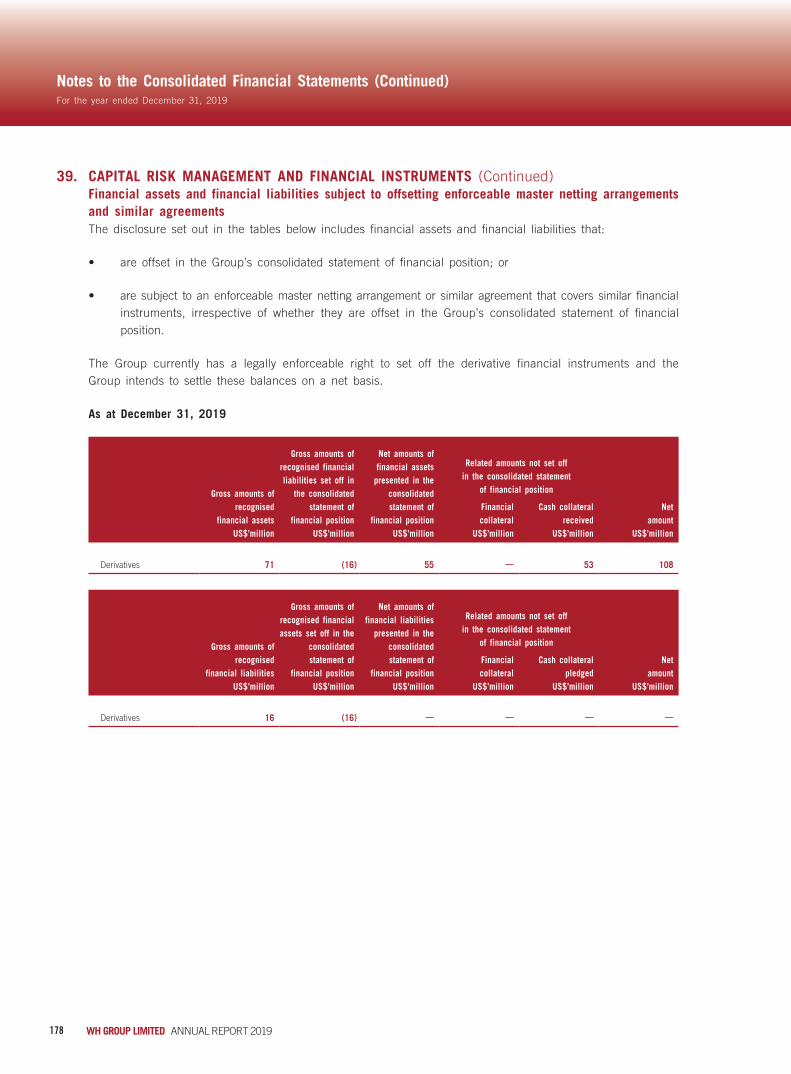
178 WH GROUP LIMITED ANNUAL REPORT 2019
For the year ended December 31, 2019
Notes to the Consolidated Financial Statements (Continued)
39. CAPITAL RISK MANAGEMENT AND FINANCIAL INSTRUMENTS (Continued) Financial assets and financial liabilities subject to offsetting enforceable master netting arrangements
and similar agreementsThe disclosure set out in the tables below includes financial assets and financial liabilities that:
• are offset in the Group’s consolidated statement of financial position; or
• are subject to an enforceable master netting arrangement or similar agreement that covers similar financial instruments, irrespective of whether they are offset in the Group’s consolidated statement of financial position.
The Group currently has a legally enforceable right to set off the derivative financial instruments and the Group intends to settle these balances on a net basis.
As at December 31, 2019
Gross amounts of recognised
financial assets
Gross amounts of recognised financial liabilities set off in
the consolidated statement of
financial position
Net amounts of financial assets
presented in the consolidated statement of
financial positionNet
amount
Related amounts not set off in the consolidated statement
of financial position Financial collateral
Cash collateral received
US$’million US$’million US$’million US$’million US$’million US$’million
Derivatives 71 (16) 55 — 53 108
Gross amounts of recognised
financial liabilities
Gross amounts of recognised financial assets set off in the
consolidated statement of
financial position
Net amounts of financial liabilities
presented in the consolidated statement of
financial positionNet
amount
Related amounts not set off in the consolidated statement
of financial position Financial collateral
Cash collateral pledged
US$’million US$’million US$’million US$’million US$’million US$’million
Derivatives 16 (16) — — — —
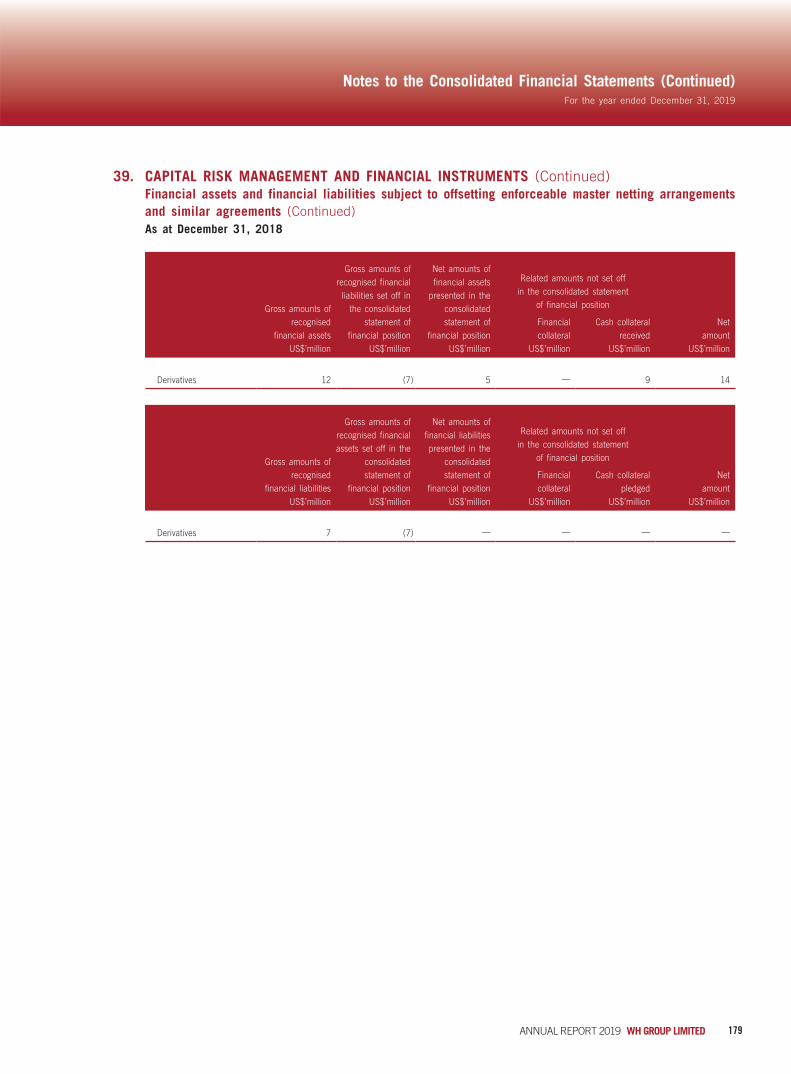
179ANNUAL REPORT 2019 WH GROUP LIMITED
For the year ended December 31, 2019
Notes to the Consolidated Financial Statements (Continued)
39. CAPITAL RISK MANAGEMENT AND FINANCIAL INSTRUMENTS (Continued) Financial assets and financial liabilities subject to offsetting enforceable master netting arrangements
and similar agreements (Continued) As at December 31, 2018
Gross amounts of recognised
financial assets
Gross amounts of recognised financial
liabilities set off in the consolidated
statement of financial position
Net amounts of financial assets
presented in the consolidated statement of
financial positionNet
amount
Related amounts not set off in the consolidated statement
of financial position Financial collateral
Cash collateral received
US$’million US$’million US$’million US$’million US$’million US$’million
Derivatives 12 (7) 5 — 9 14
Gross amounts of recognised
financial liabilities
Gross amounts of recognised financial assets set off in the
consolidated statement of
financial position
Net amounts of financial liabilities presented in the
consolidated statement of
financial positionNet
amount
Related amounts not set off in the consolidated statement
of financial position Financial collateral
Cash collateral pledged
US$’million US$’million US$’million US$’million US$’million US$’million
Derivatives 7 (7) — — — —
180 WH GROUP LIMITED ANNUAL REPORT 2019
For the year ended December 31, 2019
Notes to the Consolidated Financial Statements (Continued)
40. SHARE INCENTIVE SCHEMES (a) 2010 Share Award Plan
The Company’s share award plan (the “2010 Share Award Plan”) was adopted pursuant to a resolution in writing of all shareholders of the Company dated November 26, 2010 (the “Resolutions”). As a result of the completion of the reorganisation steps as described and approved in the Resolutions on December 26, 2013, 631,580,000 shares of the Company (the “Incentive Shares”), representing 6% of the then issued shares of the Company were transferred from Shine D Holding Limited, one of the shareholders of the Company, to Chang Yun Holdings Limited (“Chang Yun”) for the senior management of the Company and its subsidiaries and invested entities pursuant to the 2010 Share Award Plan. The Resolutions also approved the engagement of Tricor Services Limited by the Company to provide trustee services for the 2010 Share Award Plan and Teeroy Limited has been designated by Tricor Services Limited to act as trustee for the 2010 Share Award Plan (the “Trustee”). The voting rights in respect of the Incentive Shares held by Chang Yun will be exercised in accordance with the direction to be given by Heroic Zone, one of the shareholders of the Company.
If, at the date of termination of the 2010 Share Award Plan, Chang Yun holds any Incentive Shares which have not been set aside pursuant to the terms of the 2010 Share Award Plan in favour of any selected employee of the Company or retains any unutilised funds, the Trustee shall handle at the discretion of the board of directors of the Company according to the then applicable laws and regulations. Upon termination of the 2010 Share Award Plan, all the Incentive Shares and other distributions provisionally awarded to a selected employee to the extent not already vested pursuant to the terms of the 2010 Share Award Plan, shall become vested on such selected employee and any Incentive Shares which are not vested in accordance with the terms of the 2010 Share Award Plan or are forfeited in accordance with the terms thereunder, shall be handled at the discretion of the board of directors of the Company according to the then applicable laws and regulations. Chang Yun was hereby regarded as a special purpose entity of the Company and consolidated to the Group accordingly.

181ANNUAL REPORT 2019 WH GROUP LIMITED
For the year ended December 31, 2019
Notes to the Consolidated Financial Statements (Continued)
40. SHARE INCENTIVE SCHEMES (Continued) (a) 2010 Share Award Plan (Continued)
The 2010 Share Award Plan was amended pursuant to a resolution in writing of all directors dated February 9, 2012 and the assessment period for vesting the Incentive Shares were set to be 2012 to 2014.
Details of the 2010 Share Award Plan are as follows:
Number of shares 631,580,000 (subject to the lock-up period of 5 years and voting right shall be retained by Heroic Zone, the immediate holding company of the Company, thereafter)
Grant date December 26, 2012
Vesting condition Performance target for each year from 2012 to 2014
The management of the Company considers that the vesting condition on performance target is achieved and all Incentive Shares would be transferred from the Trustee ultimately. The estimated fair value of the Incentive Shares as at grant date amounting to US$128 million had been recognised in profit or loss during the vesting period. It was determined by market approach by JLL at the grant date.
All shares under the 2010 Share Award Plan have been transferred to selected employees during the year ended December 31, 2019. The 2010 Share Award Plan was terminated on December 23, 2019 upon determination by the board of directors.
(b) 2013 Share Award PlanThe Company had adopted another share award plan (the “2013 Share Award Plan”) pursuant to a written resolution of all the Company’s shareholders in October 2013, representing 3.0% of the then issued shares of the Company at the time of issuance pursuant to the 2013 Share Award Plan held by High Zenith Limited (“High Zenith”) for the recognition and reward to the contribution of certain employees and the growth and development of the Group. The resolution also approved the Trustee by the Company to provide trustee services for the 2013 Share Award Plan. The voting rights in respect of the shares held by High Zenith will be exercised in accordance with the direction to be given by Heroic Zone.
If, at the date of termination of the 2013 Share Award Plan, High Zenith holds any shares which have not been set aside pursuant to the terms of the 2013 Share Award Plan in favour of any selected employees of the Company or retains any unutilised funds, the Trustee shall handle at the discretion of the board of directors of the Company according to the then applicable laws and regulations. Upon termination of the 2013 Share Award Plan, all the shares and other distributions provisionally awarded to a selected employee to the extent not already vested pursuant to the terms of the 2013 Share Award Plan, shall become vested on such selected employee and any shares which are not vested in accordance with the terms of the 2013 Share Award Plan or are forfeited in accordance with the terms thereunder, shall be handled at the discretion of the board of directors of the Company according to the then applicable laws and regulations. High Zenith was hereby regarded as a special purpose entity of the Group accordingly.
182 WH GROUP LIMITED ANNUAL REPORT 2019
For the year ended December 31, 2019
Notes to the Consolidated Financial Statements (Continued)
40. SHARE INCENTIVE SCHEMES (Continued) (b) 2013 Share Award Plan (Continued)
On October 23, 2013, 350,877,333 newly issued shares of US$0.0001 each were allotted to High Zenith pursuant to the 2013 Share Award Plan as set out above.
Mr. Wan Long was granted 350,877,333 shares (the “Awarded Shares”) under the 2013 Share Award Plan on April 28, 2017, subject to the terms and conditions set out in the relevant award notice and under the rules of the 2013 Share Award Plan (the “Award”).
The management of the Company considers that the vesting condition on the attainment of financial target for 2017 has been achieved. The estimated fair value of the Awarded Shares as at the grant date amounting to US$278 million was recognised in profit or loss for the year ended December 31, 2017. The fair value of the Awarded Shares was determined by the market approach by JLL at the grant date.
All shares under the 2013 Share Award Plan have been transferred to Mr. Wan Long during the year ended December 31, 2019. The 2013 Share Award Plan was terminated on June 28, 2019 upon determination by the board of directors.
(c) Pre-IPO share optionThe pre-IPO share option scheme was adopted pursuant to a written resolution passed by the shareholders of the Company on January 21, 2014 as amended on April 4, 2014, the purpose of which is to incentivise and reward eligible participants of the scheme, including directors and employees of the Company or its subsidiaries by reason of their contribution or potential contribution to the Company and/or any of its subsidiaries.
In July 2014, the number of shares in respect of which options had been granted under the pre-IPO share option scheme was 584,795,555, with an exercise price of HK$6.20 per share, representing no more than 5% of the then issued share capital of the Company upon completion of the listing on the Stock Exchange. No consideration was paid by the grantees for the grant of the pre-IPO share options.
The fair value of the pre-IPO share options granted using the Binomial Option Pricing Model was HK$1,883 million (equivalent to approximately US$243 million), which was measured by JLL.
The key inputs into the model were as follows:
Share price HK$6.66Exercise price HK$6.20Option life 10 yearsExpected volatility 42%Risk-free rate 2.06%
183ANNUAL REPORT 2019 WH GROUP LIMITED
For the year ended December 31, 2019
Notes to the Consolidated Financial Statements (Continued)
40. SHARE INCENTIVE SCHEMES (Continued) (c) Pre-IPO share option (Continued)
The expected volatility was determined by using the historical volatility of the selected comparable companies in the same industry.
The following table discloses details of the Group’s outstanding share options under the pre-IPO share option scheme and their movements during the year:
Option type Date of grant
As at
January
1, 2018 Exercised Cancelled Lapsed
As at
December
31, 2018 Exercised Cancelled Lapsed
As at
December
31, 2019
Pre-IPO share
option scheme July 10, 2014 530,605,576 11,255,000 405,183 268,507 518,676,886 45,265,647 4,867,646 5,638,324 462,905,269
Exercisable at the
end of the year 355,831,075 462,905,269
In respect of the share options exercised during the year, the weighted average share price at the dates of exercise is HK$7.60 (2018: HK$7.23).
For the year ended December 31, 2019, the Group recognised a share-based payment expense of US$8 million (2018: US$21 million) in relation to the pre-IPO share option scheme.
41. COMMITMENTS (a) The Group had the following capital commitments at the end of the reporting period:
2019 2018US$’million US$’million
Contracted, but not provided for:Capital contribution to a joint venture 165 125Acquisition of property, plant and equipment 66 94Properties under development 14 —
(b) Operating lease commitments as at December 31, 2018The Group as lessee was committed to make the following future minimum lease payments under non-cancellable operating leases which fall due as follows:
US$’million
Within one year 96In the second to fifth year inclusive 164After five years 134
394
Leases were negotiated for a lease term of 3 to 50 years. The Group did not have an option to purchase the leased assets upon the expiry of the lease periods.

184 WH GROUP LIMITED ANNUAL REPORT 2019
For the year ended December 31, 2019
Notes to the Consolidated Financial Statements (Continued)
42. PLEDGE OF ASSETS
2019 2018US$’million US$’million
Pledged bank balances 45 58
As at December 31, 2019 and December 31, 2018, the Group’s material U.S. subsidiaries are jointly and severally liable for, as primary obligors, the obligations under certain banking facilities.
Smithfield Receivables Funding, LLC, a wholly-owned subsidiary of the Group, has a securitisation facility that matures in November 2021. As part of the arrangement, certain trade receivables are sold to a wholly-owned “bankruptcy remote” special purpose vehicle (“SPV”). The SPV pledges the receivables as security for loans and letters of credit. The SPV is included in the consolidated financial statements of financial position of the Group. However, the trade receivables owned by the SPV are separate and distinct from the other assets and are not available to other creditors of Smithfield if Smithfield was to become insolvent. As at December 31, 2019, the SPV held US$651 million (2018: US$835 million) of trade receivables and had outstanding borrowings of US$83 million (2018: US$237 million) on the securitisation facility. No financial or other support to this SPV was provided by the Group as at December 31, 2019 and December 31, 2018.

185ANNUAL REPORT 2019 WH GROUP LIMITED
For the year ended December 31, 2019
Notes to the Consolidated Financial Statements (Continued)
43. CONTINGENT LIABILITIESThe Group is subject to various laws and regulations administered by jurisdictional government entities. The Group had notices and inquiries from regulatory authorities and others asserting from time to time that the Group is not in compliance with the respective laws and regulations. In some instances, litigation ensues and individuals may initiate litigation against the Group.
North Carolina Nuisance LitigationIn August, September and October 2014, 25 complaints were filed in the United States District Court for the Eastern District of North Carolina by 515 individual plaintiffs against the Group’s wholly owned subsidiary, Murphy-Brown LLC (“Murphy-Brown”), alleging causes of action for nuisance and related claims. The complaints stemmed from the nuisance cases previously filed in the Superior Court of Wake County. Subsequent to this initial filing, certain plaintiffs joined the complaints and in response Murphy Brown has filed its answers and affirmative defense, all the complaints were amended pursuant to the Court’s order and some plaintiffs dismissed their claims during the process of discovery. As of December 31, 2017, there were 26 currently pending complaints which included claims on behalf of 511 plaintiffs and relate to approximately 14 company-owned and 75 contract farms. All 26 complaints include causes of action for temporary nuisance and negligence and seek recovery of an unspecified amount of compensatory, special and punitive damages.
In December 2017, an order was issued by the United States District Court for the Eastern District of North Carolina setting a date for the first trial, April 2, 2018, and establishing the protocol for all subsequent trials. These trials related to 5 of the 26 complaints and a total of 82 plaintiffs.
On April 26, 2018, a verdict was reached in favor of ten plaintiffs in the first trial. For each plaintiff, the jury awarded US$75,000 in compensatory damages and US$5 million in punitive damages. As North Carolina law limits punitive damages to the greater of three times compensatory damages or US$250,000, the court reduced the amount the jury awarded to each plaintiff for punitive damages to US$250,000, resulting in a total award of US$3.25 million for the ten plaintiffs combined. The Group has appealed the verdict of the first trial to the United States Court of Appeals for the Fourth Circuit.
On June 29, 2018, a verdict was reached in favor of two plaintiffs in the second trial. For each plaintiff, the jury awarded US$65,000 in compensatory damages and US$12.5 million in punitive damages. As a result of the limit on punitive damages, the court reduced the amount the jury awarded to each plaintiff for punitive damages to US$250,000, resulting in a total award of US$630,000 for the two plaintiffs combined. The Group has appealed the verdict of the second trial to the United States Court of Appeals for the Fourth Circuit.
On August 3, 2018, a verdict was reached in favor of six plaintiffs in the third trial. For each plaintiff, the jury awarded approximately US$3.9 million in compensatory damages and US$75 million in punitive damages. As a result of the limit on punitive damages, the court reduced the amount the jury awarded to each plaintiff for punitive damages to US$11.75 million, resulting in a total award of US$94 million for the six plaintiffs combined. The Group will appeal the verdict of the third trial to the United States Court of Appeals for the Fourth Circuit.

186 WH GROUP LIMITED ANNUAL REPORT 2019
For the year ended December 31, 2019
Notes to the Consolidated Financial Statements (Continued)
43. CONTINGENT LIABILITIES (Continued) North Carolina Nuisance Litigation (Continued)
On December 13, 2018 a verdict was reached in favor of eight plaintiffs in the fourth trial. However, unlike all the previous trials, the damages awarded in this trial were limited to compensatory damages only and varied per plaintiff. In total, compensatory damages awarded were US$102,400; which was comprised of US$100 awards for four of the plaintiffs, US$1,000 each to two plaintiffs, US$25,000 to one plaintiff and US$75,000 to the last plaintiff. The court denied, as a matter of law, the plaintiffs’ claim for punitive damages.
On March 7, 2019 a verdict was reached in favor of ten plaintiffs in the fifth trial. The jury awarded US$33,000 in compensatory damages and US$67,000 in punitive damages to two of the ten plaintiffs, US$10,000 in compensatory damages and US$20,000 in punitive damages to seven of the plaintiffs, and US$3,000 in compensatory damages and US$7,000 in punitive damages to one plaintiff. The Group will file a post-trial motion seeking a reduction in the award and if denied, will appeal the verdict of the fifth trial to the United States Court of Appeals for the Fourth Circuit.
On June 3, 2019, the United States District Court for the Eastern District of North Carolina issued an order staying the North Carolina litigation in its entirety pending the resolution of Murphy-Brown’s Fourth Circuit appeal of the verdict in the first trial.
Oral argument on Murphy-Brown’s Fourth Circuit appeal of the verdict in the first trial was held on January 31, 2020. As of the date of approval for the issuance of these consolidated financial statements, the appellate court has not announced its ruling on the appeal.
The Group continues to believe that the claims of the plaintiffs are unfounded and is defending these suits vigorously.
The Group’s policy for establishing accruals and disclosures for contingent liabilities is set out in note 3 to the consolidated financial statement. The Group established a reserve for the estimated expenses to defend against these and similar potential claims, which was subsequently re-evaluated.
Expenses and other liabilities associated with these claims will not affect the Group’s profits or losses in future periods unless the provision proves to be insufficient or excessive. However, legal expenses incurred in the Group’s defense of these claims and any payments made to plaintiffs through unfavorable verdicts or otherwise will negatively impact its cash flows and its liquidity position. The directors of the Company will continue to evaluate and adjust the provision as necessary upon changes in facts and circumstances.

187ANNUAL REPORT 2019 WH GROUP LIMITED
For the year ended December 31, 2019
Notes to the Consolidated Financial Statements (Continued)
44. RELATED PARTY TRANSACTIONS (a) The Group had the following significant transactions with associates/joint ventures during the years:
2019 2018US$’million US$’million
Sales of goods to associates 6 6Sales of goods to joint ventures 15 12Purchase of goods from associates 40 61Purchase of goods from joint ventures 20 22
(b) Balances with associates/joint ventures at the end of the reporting period:
2019 2018US$’million US$’million
Included in:Trade and bills receivables —* 1Prepayments, other receivables and other assets 18 —
Trade payables —* 1Accrued expenses and other payables 15 31
Note:
The amounts due from/to associates/joint ventures included in prepayments, other receivables and other assets are interest-bearing at LIBOR +4%. The remaining amounts are unsecured, interest-free and repayable on demand.
(c) Compensation of key management personnel of the GroupThe remuneration of key management personnel, representing emoluments of directors of the Company and senior management of the Group paid/payable during the period under review is set out below:
Year ended December 31,
2019 2018US$’million US$’million
Director fees —* —*Basic salaries and allowances 9 9Performance bonuses 26 4Retirement benefit scheme contributions —* —*Share-based payments 4 11
Total compensation paid to key management personnel 39 24
* Less than US$1 million.

188 WH GROUP LIMITED ANNUAL REPORT 2019
For the year ended December 31, 2019
Notes to the Consolidated Financial Statements (Continued)
45. STATEMENT OF FINANCIAL POSITION OF THE COMPANY
2019 2018US$’million US$’million
NON-CURRENT ASSETSInterests in unlisted subsidiaries 5,145 5,141
CURRENT ASSETSAmounts due from subsidiaries 127 122Prepayments, other receivables and other assets —* 1Bank balances and cash 2 —*
129 123
CURRENT LIABILITIESAmounts due to subsidiaries 337 364Other payables 2 2
339 366
NET CURRENT LIABILITIES (210) (243)
TOTAL ASSETS LESS CURRENT LIABILITIES 4,935 4,898
NET ASSETS 4,935 4,898
CAPITAL AND RESERVESShare capital (Note 38) 1 1Share premium 2,982 2,934Translation reserve 61 61Other reserve 231 1,213Retained profits 1,660 689
TOTAL EQUITY 4,935 4,898
* Less than US$1 million.

189ANNUAL REPORT 2019 WH GROUP LIMITED
For the year ended December 31, 2019
Notes to the Consolidated Financial Statements (Continued)
45. STATEMENT OF FINANCIAL POSITION OF THE COMPANY (Continued) Movements in the Company’s reserves
Share
capital
Share
premium
Translation
reserve
Other
reserve
Retained
profits Total
US$’million US$’million US$’million US$’million US$’million US$’million
(note)
At January 1, 2018 1 2,921 61 1,196 702 4,881
Profit and total comprehensive
income for the year — — — — 492 492
Dividend (Note 13) — — — — (505) (505)
Share-based payments — — — 21 — 21
Issue of shares upon exercise of
share options —* 13 — (4) — 9
—* 13 — 17 (13) 17
At December 31, 2018 and
January 1, 2019 1 2,934 61 1,213 689 4,898
Profit and total comprehensive
income for the year — — — — 373 373
Dividend (Note 13) — — — — (375) (375)
Share-based payments — — — 8 — 8
Termination of share award plan — — — (973) 973 —
Issue of shares upon exercise of
share options —* 48 — (17) — 31
—* 48 — (982) 971 37
At December 31, 2019 1 2,982 61 231 1,660 4,935
Note:
Other reserve comprises the fair value of share options granted which are yet to be exercised. The amount will either be transferred to share capital when the related options are exercised, or be transferred to retained profits should the related options expire or be forfeited.
* Less than US$1 million

190 WH GROUP LIMITED ANNUAL REPORT 2019
For the year ended December 31, 2019
Notes to the Consolidated Financial Statements (Continued)
46. NON-WHOLLY-OWNED SUBSIDIARIES THAT HAVE MATERIAL NON-CONTROLLING INTERESTSThe table below shows the details of non-wholly-owned subsidiaries of the Group that have material non-controlling interests at the end of the reporting period:
Name of subsidiary
Country of
incorporation
and principal
place of
business
Proportion of ownership
interests and voting rights
held by non-controlling
interests
Profit allocated to non-
controlling interests
Accumulated non-
controlling interests
2019 2018 2019 2018 2019 2018
US$’million US$’million US$’million US$’million
河南雙滙投資發展股份有限公司
Henan Shuanghui Investment &
Development Co., Ltd.
(“Shuanghui Development”)
China 26.59% 26.75% 220 209 755 654
Individually immaterial subsidiaries
with non-controlling interests
10 1 13 18
230 210 768 672
Summarised financial information in respect of Shuanghui Development that has material non-controlling interests is set out below. The summarised financial information below represents the amounts before intragroup eliminations.
As at December 31,
2019 2018US$’million US$’million
Non-current assets 1,774 1,833Current assets 2,342 1,424Current liabilities (1,619) (1,186)Non-current liabilities (46) (32)Equity attributable to owners of Shuanghui Development (2,365) (1,889)
Non-controlling interests of Shuanghui Development’s subsidiaries 86 150Non-controlling interests of Shuanghui Development 669 504
755 654

191ANNUAL REPORT 2019 WH GROUP LIMITED
For the year ended December 31, 2019
Notes to the Consolidated Financial Statements (Continued)
46. NON-WHOLLY-OWNED SUBSIDIARIES THAT HAVE MATERIAL NON-CONTROLLING INTERESTS (Continued)
Year ended December 31,
2019 2018US$’million US$’million
Revenue 8,693 7,390Total expenses (7,879) (6,623)
Profit for the year 814 767Other comprehensive income —* —*
Total comprehensive income for the year 814 767
Profit attributable to owners of the Company 594 558Profit attributable to the non-controlling interests of Shuanghui
Development’s subsidiaries 5 10Profit attributable to the non-controlling interests of Shuanghui
Development 215 199
814 767
Dividends paid to non-controlling interests of Shuanghui Development’s subsidiaries 18 17
Net cash inflow from operating activities 631 785Net cash outflow from investing activities (198) (340)Net cash outflow from financing activities (337) (960)
Net cash inflow (outflow) 96 (515)
* Less than US$1 million.

192 WH GROUP LIMITED ANNUAL REPORT 2019
For the year ended December 31, 2019
Notes to the Consolidated Financial Statements (Continued)
47. OTHER COMPREHENSIVE EXPENSEOther reserve included the fair value of the share options, share awards, remeasurement deficit of the defined benefit pension plans and fair value surplus in cash flow hedge attributable to the Group.
2019 2018US$’million US$’million
Other comprehensive expense includes:Items that will not be reclassified subsequently to profit or loss:
Remeasurement on defined benefit pension plans (192) (7)Income tax relating to defined benefit pension plans 49 1
(143) (6)
Items that may be reclassified subsequently to profit or loss:
Exchange differences arising on translation of foreign operations (51) (198)Fair value change in cash flow hedge 29 8Income tax relating to cash flow hedge (14) (2)
(37) (192)
Other comprehensive expense, net of income tax (179) (198)
48. EVENTS AFTER THE END OF THE REPORTING PERIODThe outbreak of coronavirus disease 2019 (“COVID-19”) is bringing unprecedented challenges to all industries. As the first imperative of the Company is to safeguard the health of its employees and to ensure the quality of its products, a wide range of measures such as enhanced cleaning and disinfection, boosted personal protective equipment and restricting nonessential visitors were implemented. In order to minimize the disruptions of COVID-19 on its ordinary operation and to assure the continuity of its business, the Company also reshuffled its production activities, reorganised its sales channels and adjusted its product mix. As pork products are consumer staples, the Company believe that the impact of COVID-19 is manageable under current assessment. Yet the Company is highly cautious about the latest development and the later implications of the pandemic.

193ANNUAL REPORT 2019 WH GROUP LIMITED
For the year ended December 31, 2019
Notes to the Consolidated Financial Statements (Continued)
49. PRINCIPAL SUBSIDIARIESDetails of the Company’s principal subsidiaries at December 31, 2019 and December 31, 2018 are as follows:
Name of subsidiary
Place of incorporation/
establishment/operation
Issued and fully paid share
capital/registered capital
Attributable proportion of
issued/registered capital held
by the Company Indirectly Principal activities
2019 2018
Rotary Vortex Limited Hong Kong Ordinary shares
HK$33,883,520,411
(2018: HK$33,883,520,411)
100% 100% Investment holding and trading
Shuanghui Development
(Note 1)
China Shares
RMB3,319,282,190
(2018: RMB3,299,558,284)
73.41% 73.25% Investment holding, livestock
breeding, livestock slaughtering,
manufacture and sales of
packaging materials and meat
products
Smithfield U.S. Note 2 100% 100% Investment holding, livestock
breeding, livestock slaughtering,
manufacture and sales of meat
products
Note 1: This company is listed on the A-Shares Market of the Shenzhen Stock Exchange and registered as a limited liability company under People’s Republic of China Law.
Note 2: The par value of the common shares of this subsidiary is zero.
The above table lists the principal subsidiaries of the Company which, in the opinion of the directors of the Company, principally affected the results for the year or formed a substantial portion of the consolidated net assets. To give details of all the subsidiaries would, in the opinion of the directors of the Company, result in particulars of excessive length.

194 WH GROUP LIMITED ANNUAL REPORT 2019
FIVE YEAR SUMMARY
As of and for the Year Ended December 31 US$ million (unless otherwise stated) 2019 2018 2017 2016 2015
Key operating dataHogs produced (million heads) 21.8 21.0 20.2 19.2 19.1Hogs processed (million heads) 53.8 56.1 53.8 49.3 48.3Packaged meats sold (million metric tons) 3.3 3.4 3.3 3.2 3.2
Key financial dataRevenue 24,103 22,605 22,379 21,534 21,209Revenue growth rate (%) 6.6% 1.0% 3.9% 1.5% (4.6%)
Operating profit 2,031 1,650 1,583 1,788 1,557Operating profit margin (%) 8.4% 7.3% 7.1% 8.3% 7.3%
Profit before taxation 2,052 1,411 1,501 1,703 1,302Taxation (357) (258) (182) (465) (307)
Profit for the year 1,695 1,153 1,319 1,238 995
Profit for the year attributable to:— owners of the Company 1,465 943 1,133 1,036 786— non-controlling interests 230 210 186 202 209
1,695 1,153 1,319 1,238 995
Profit attributable to owners of the Company, before biological fair value adjustments 1,378 1,046 1,126 1,014 866
Basic earnings per share (US cents) 9.96 6.43 7.79 7.58 5.75
Total assets 17,282 15,298 15,258 13,611 14,301Total liabilities (7,830) (6,880) (7,036) (6,573) (7,598)
Net assets 9,452 8,418 8,222 7,038 6,703
Equity attributable to owners of the Company 8,684 7,746 7,445 6,316 5,763Non-controlling interest 768 672 777 722 940
Total equity 9,452 8,418 8,222 7,038 6,703

195ANNUAL REPORT 2019 WH GROUP LIMITED
Five Year Summary (Continued)
Revenue (US$ million)
Basic earnings share (US cents)
EBITDA (US$ million)
Total equity (US$ million)
0
24,10322,605 22,379 21,534 21,209
2019 2018 2017 2016 2015
5,000
10,000
15,000
20,000
25,000
30,000
0
500
1,000
1,500
2,000
2,500
3,0002,777
1,9672,092
2,263
1,917
2019 2018 2017 2016 2015
9.96
6.43
7.79 7.58
5.75
2019 2018 2017 2016 20150.0
2.0
4.0
6.0
8.0
10.0
0
1,500
3,000
4,500
6,000
7,500
9,000
10,500
9,452
8,418 8,222
7,0386,703
2019 2018 2017 2016 2015

196 WH GROUP LIMITED ANNUAL REPORT 2019
GLOSSARY
“2010 Share Award Plan” the share award plan adopted by the Company on November 26, 2010, according to which, Teeroy Limited, as the trustee administering this share award plan, instructed Chang Yun to hold a pool of Shares subject to this share award plan; the principal terms of this share award plan are summarized in the section headed “Directors’ Report — 2010 Share Award Plan”
“2013 Share Award Plan” the share award plan adopted by the Company on October 23, 2013, according to which, Teeroy Limited, as the trustee administering this share award plan, instructed High Zenith to hold a pool of Shares subject to this share award plan; the principal terms of this share award plan are summarized in the section headed “Directors’ Report — 2013 Share Award Plan”
“AGM” the annual general meeting of the Company
“Articles of Association” the articles of association of the Company currently in force
“Audit Committee” the audit committee of the Company
“Auspicious Joy” Auspicious Joy Enterprises Limited, a limited liability company incorporated under the laws of BVI on July 8, 2019
“Board” the board of Directors of the Company
“Board Committees” collectively, the Audit Committee, the Remuneration Committee, the Nomination Committee, the Environmental, Social and Governance Committee, the Food Safety Committee and the Risk Management Committee
“BVI” the British Virgin Islands
“CG Code” the Corporate Governance Code set out in Appendix 14 to the Listing Rules
“Chang Yun” Chang Yun Holdings Limited (運昌控股有限公司) a limited liability company incorporated under the laws of the BVI on April 12, 2010 and one of the Controlling Shareholders
“Chang Yun Share Plan” the share plan dated December 23, 2019, under which a group of employees of the Group hold 100% of the beneficial interests in Auspicious Joy, which in turn holds 100% of the equity interest in Chang Yun

197ANNUAL REPORT 2019 WH GROUP LIMITED
Glossary (Continued)
“China” or “the PRC” the People’s Republic of China excluding, for the purposes of this report, Hong Kong, the Macau Special Administrative Region of the PRC and Taiwan
“Code of Conduct” the code of conduct regarding securities transactions by the Directors adopted by the Company
“Company” WH Group Limited (萬洲國際有限公司), a limited liability company incorporated under the laws of the Cayman Islands the Shares of which are listing on the Main Board of the Stock Exchange
“connected person(s)” has the meaning ascribed thereto under the Listing Rules
“Controlling Shareholders” has the meaning ascribed to it under the Listing Rules and, unless the context requires otherwise, refers to Rise Grand, Heroic Zone, Chang Yun, High Zenith, Sure Pass and Rich Matrix
“Director(s)” the director(s) of the Company
“EBITDA” Earnings before interest, taxation, depreciation and amortisation
“Environmental, Social and Governance Committee”
the environmental, social and governance committee of the Company
“EUR” the Euro, the lawful currency of the member states of the European Union
“Fitch” Fitch (Hong Kong) Limited or Fitch Ratings, Inc.
“Food Safety Committee” the food safety committee of the Company
“GCM” Granjas Carroll de Mexico S. de R.L. de C.V., a Mexican hog farming company incorporated under the laws of Mexico. The Company indirectly held 50% interest in GCM as a joint venture as of December 31, 2019
“Group”, “our Group”, “our”, “we”, “us” or “WH Group”
the Company and all of its subsidiaries, or any one of them as the context may require or, where the context refers to any time prior to its incorporation, the business which its predecessors or the predecessors of its present subsidiaries, or any one of them as the context may require, were or was engaged in and which were subsequently assumed by it
“Heroic Zone” Heroic Zone Investments Limited (雄域投資有限公司) a limited liability company incorporated under the laws of the BVI on July 23, 2007 and one of the Controlling Shareholders

198 WH GROUP LIMITED ANNUAL REPORT 2019
Glossary (Continued)
“Heroic Zone Share Plan” the share plan dated December 25, 2009, revised on December 17, 2012 and July 11, 2016 respectively, under which a group of employees of Shuanghui Development and its associated entities hold 100% of the beneficial interests in Rise Grand, which in turn holds 100% of the equity interest in Heroic Zone
“High Zenith” High Zenith Limited, a limited liability company incorporated under the laws of BVI on September 6, 2013 and one of the Controlling Shareholders
“HK$” Hong Kong dollars, the lawful currency of Hong Kong
“Hong Kong” the Hong Kong Special Administrative Region of the PRC
“IFRS” International Financial Reporting Standards
“kg” kilogram
“Listing” the listing of the Shares on the Main Board of the Stock Exchange
“Listing Date” August 5, 2014, being the date on which the Shares are listed on the Main Board of the Stock Exchange
“Listing Rules” the Rules Governing the Listing of Securities on The Stock Exchange of Hong Kong Limited (as amended, supplemented or otherwise modified from time to time)
“MOA” Ministry of Agriculture and Rural Affairs of the People’s Republic of China
“Model Code” Model Code for Securities Transactions by Directors of Listed Issuers as set out in Appendix 10 to the Listing Rules
“Moody’s” Moody’s Investor Service Limited
“Nomination Committee” the nomination committee of the Company
“Norson” Norson Holding, S. de R.L. de C.V., a Mexican meat products manufacturer and hog farming company incorporated under the laws of Mexico. The Company indirectly held 50% interest in Norson as a joint venture as of December 31, 2019
“Pini Polonia” Pini Polonia sp. z o.o., an indirect wholly-owned subsidiary of the Company and a limited company established under the laws of Poland
“PLN” Polish Zloty, the lawful currency of the Republic of Poland
“pp” percentage points

199ANNUAL REPORT 2019 WH GROUP LIMITED
Glossary (Continued)
“Pre-IPO Share Option Scheme” the pre-IPO share option scheme approved and adopted by our Company on January 21, 2014 as amended on April 4, 2014, for the benefit of any Director, employee, adviser, consultant, distributor, contractor, customer, supplier, agent, business partner, joint venture business partner or service provider of the Company or any of our subsidiaries; a summary of the principal terms is set forth in the section headed “Directors’ Report — Pre-IPO Share Option Scheme”
“Pre-IPO Share Options” the options granted under the Pre-IPO Share Option Scheme
“Prospectus” the prospectus of the Company in relation to the Listing dated July 24, 2014
“Remuneration Committee” the remuneration committee of the Company
“Review Period” the period from January 1, 2019 to December 31, 2019
“Rich Matrix” Rich Matrix Global Limited (裕基環球有限公司), a limited liability company incorporated under the laws of the BVI on September 9, 2013 and one of the Controlling Shareholders
“Rise Grand” Rise Grand Group Limited (興泰集團有限公司), a BVI Business Company incorporated under the laws of the BVI on July 3, 2007 and one of the Controlling Shareholders
“Risk Management Committee” the risk management committee of the Company
“RMB” Renminbi, the lawful currency of the PRC
“RON” Romanian Leu, the lawful currency of Romania
“Rotary Vortex” Rotary Vortex Limited (羅特克斯有限公司), a limited liability company incorporated under the laws of Hong Kong on February 28, 2006 and an indirect wholly-owned subsidiary of the Company
“SFO” the Securities and Futures Ordinance, Chapter 571 of the Laws of Hong Kong (as amended, supplemented or otherwise modified from time to time)
“Share(s)” ordinary share(s) with nominal value of US$0.0001 each in the share capital of the Company
“Shareholder(s)” holder(s) of the Share(s)
200 WH GROUP LIMITED ANNUAL REPORT 2019
Glossary (Continued)
“Shine B” Shine B Holding I Limited, which was a limited liability company incorporated under the laws of BVI on March 20, 2006 until it was officially dissolved on July 8, 2015, and a former Shareholder
“Shuanghui Development” Henan Shuanghui Investment & Development Co., Ltd. (河南雙匯投資發展股份有限公司), an indirect non-wholly owned subsidiary of the Company and a joint stock limited company established under the laws of the PRC on October 15, 1998, the shares of which are listed on the Shenzhen Stock Exchange in the PRC (stock code: 000895), and as the context may require, all or any of its subsidiaries
“Shuanghui Group” Henan Luohe Shuanghui Industry Group Co., Ltd. (河南省漯河市雙匯實業集團有限責任公司), a limited liability company established under the laws of the PRC on August 29, 1994 and an indirect wholly-owned subsidiary of the Company which ceased operation and was deregistered following the completion of the internal restructuring of the Group in September 2019
“Smithfield” Smithfield Foods, Inc., a corporation incorporated in the Commonwealth of Virginia, the United States on July 25, 1997 and an indirect wholly-owned subsidiary of the Company and, as the context may require, all or any of its subsidiaries or, where the context refers to any time prior to its incorporation, the business which its predecessors or the predecessors of its present subsidiaries were, or any one of them, as the context may require, were or was engaged in and which were subsequently assumed by it
“Stock Exchange” The Stock Exchange of Hong Kong Limited
“Subsidiary” has the meaning ascribed thereto under the Listing Rules
“Sure Pass” Sure Pass Holdings Limited (順通控股有限公司), a limited liability company incorporated under the laws of the BVI on September 25, 2013 and one of the Controlling Shareholders
“United States” or “U.S.” the United States of America, its territories, its possessions and all areas subject to its jurisdiction
“USDA” U.S. Department of Agriculture
“US$” or “U.S. dollars” United States dollars, the lawful currency of the United States
“U.S. Tax Reform” the enactment of the Tax Cuts and Jobs Act in U.S. on December 22, 2017

2019 AN
NU
AL R
EPO
RT
2 0 1 9 A N N U A L R E P O R T


![8{]:®~ - CEC · ·ti 17f 2016/12/5 2017/5/1 ~ 1lf iH!ie 111~ fl {£ 10 NB!T 31105-2016 ~ili J:. )X\, rt ~ .I{¥_ PJ if ·ti 2016/12/5 2017/5/1 17f ~ 1lf% t~ie 111u 1Jt {¥_ 11 NB!T](https://static.documents.pub/doc/80x56/5c0345c409d3f2c12d8c5f4f/8-ti-17f-2016125-201751-1lf-ihie-111-fl-10-nbt-31105-2016.jpg)


