TACKLING THE CHALLENGES OF FULL PIT LATRINES Volume 2: How fast do pit toilets fill up? A scientific understanding of sludge build up and accumulation in pit latrines Report to the Water Research Commission by David Still 1 & Kitty Foxon 2 1 Partners in Development 2 Pollution Research Group, University of KwaZulu-Natal WRC Report No. 1745/2/12 ISBN 978-1-4312-0292-8 Set No. 978-1-4312-0294-2 July 2012
Transcript
TACKLING THE CHALLENGES OF FULL PIT LATRINES Volume 2: How fast do pit toilets fill up? A scientific understanding of sludge
build up and accumulation in pit latrines
Report to the
Water Research Commission
by
David Still1 & Kitty Foxon
2
1Partners in Development
2Pollution Research Group, University of KwaZulu-Natal
WRC Report No. 1745/2/12
ISBN 978-1-4312-0292-8
Set No. 978-1-4312-0294-2
July 2012
TACKLING THE CHALLENGES OF FULL PIT LATRINES Volume 2: How fast do pit toilets fill up?
A scientific understanding of sludge build up and accumulation in pit latrines ii
Water Research Commission July 2012
Obtainable from:
Water Research Commission
Private Bag X03
Gezina, 0031
The publication of this report emanates from a project entitled: Understanding the sludge accumulation
in VIPs, UDs and other on-site sanitation systems, and strategies to manage desludging in the future
Figure 2.7 Change in height of pit contents over 6 months (laser measurement of height) ....................11
Figure 2.8 Change in height of pit latrine contents over 6 months (laser measurement of height). The
box for each data set represents the range of the 95% confidence interval on the mean, while the
whisker shows maxima and minima from within each data set. ............................................................11
Figure 2.9 Change in height of pit contents over 6 months (stereographic determination of volume) ...12
Figure 2.10 Box and Whisker plot showing change in height of pit latrine contents over 6 months
(stereographic measurement of volume). .............................................................................................12
Figure 2.11 Median cumulative increase in sludge level ........................................................................13
Figure 2.12 Median changes in sludge height from four 0.5 metre offset measurements ......................14
Figure 3.1 Distribution of pit filling rates in Besters study ......................................................................19
Figure 3.2 Distribution of pit filling rates in Limpopo study ...................................................................20
Figure 3.3 Two pits from the Mafunze study, showing high and low rubbish levels ...............................21
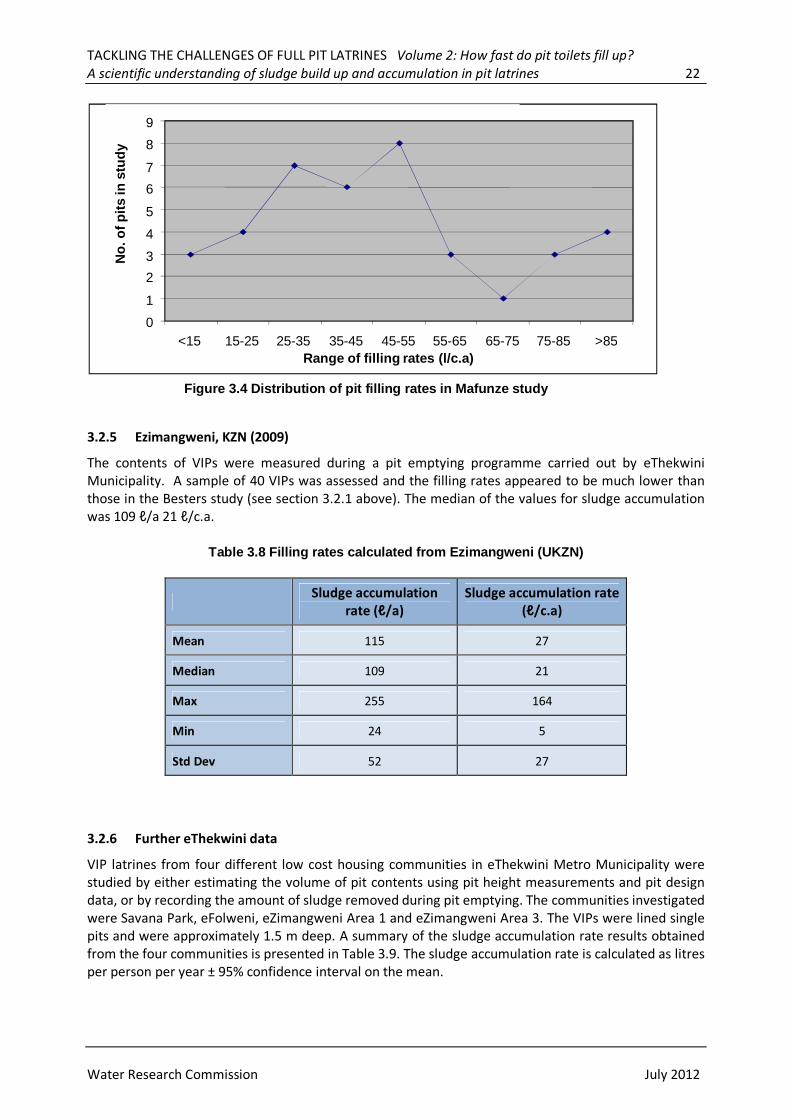
Figure 3.4 Distribution of pit filling rates in Mafunze study ...................................................................22
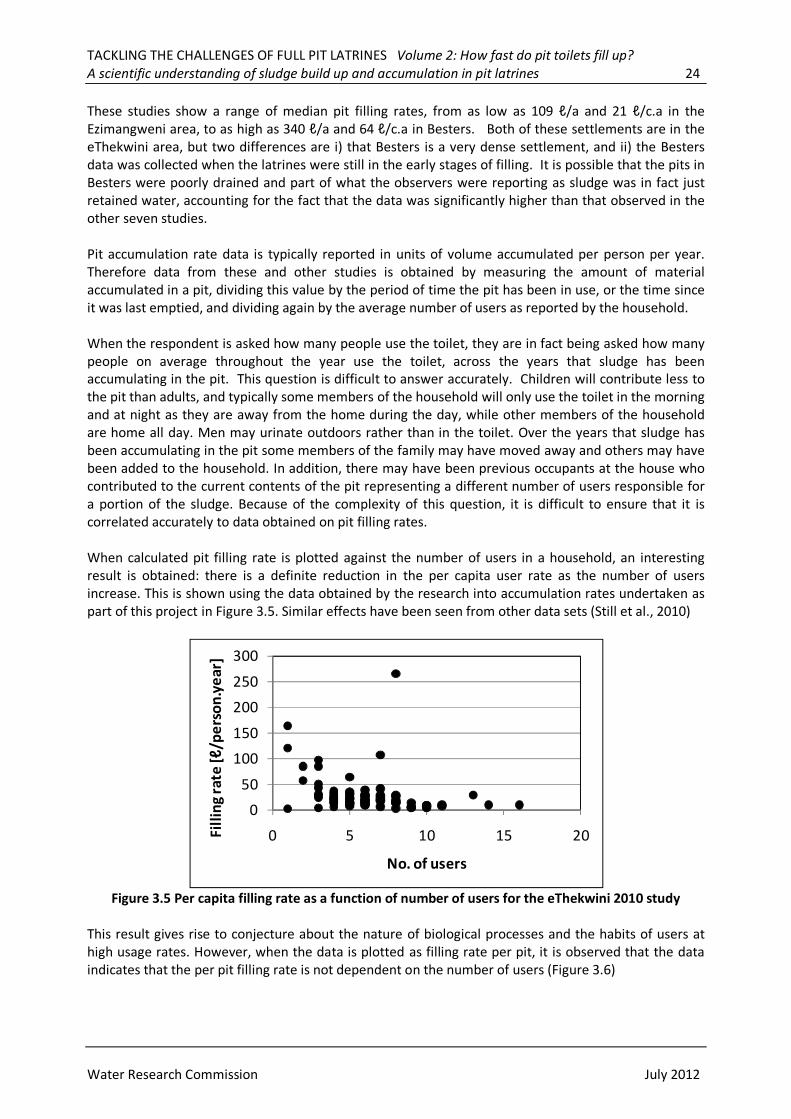
Figure 3.5 Per capita filling rate as a function of number of users for the eThekwini 2010 study ...........24
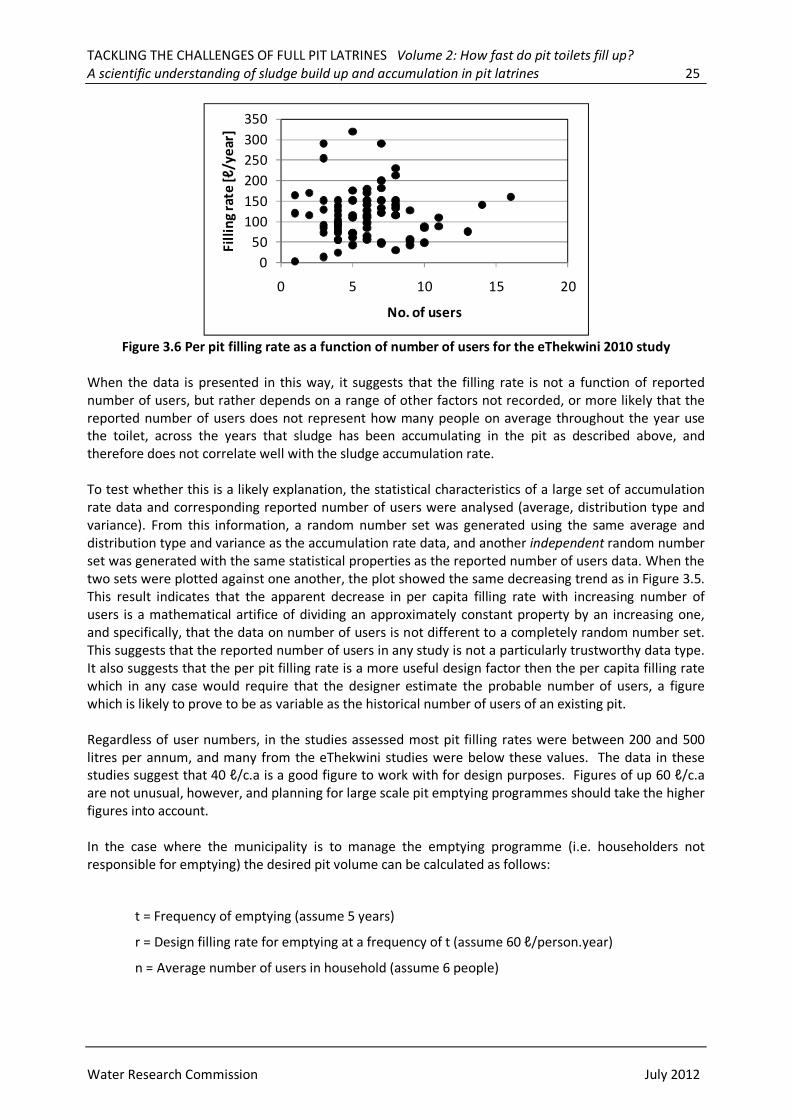
Figure 3.6 Per pit filling rate as a function of number of users for the eThekwini 2010 study.................25
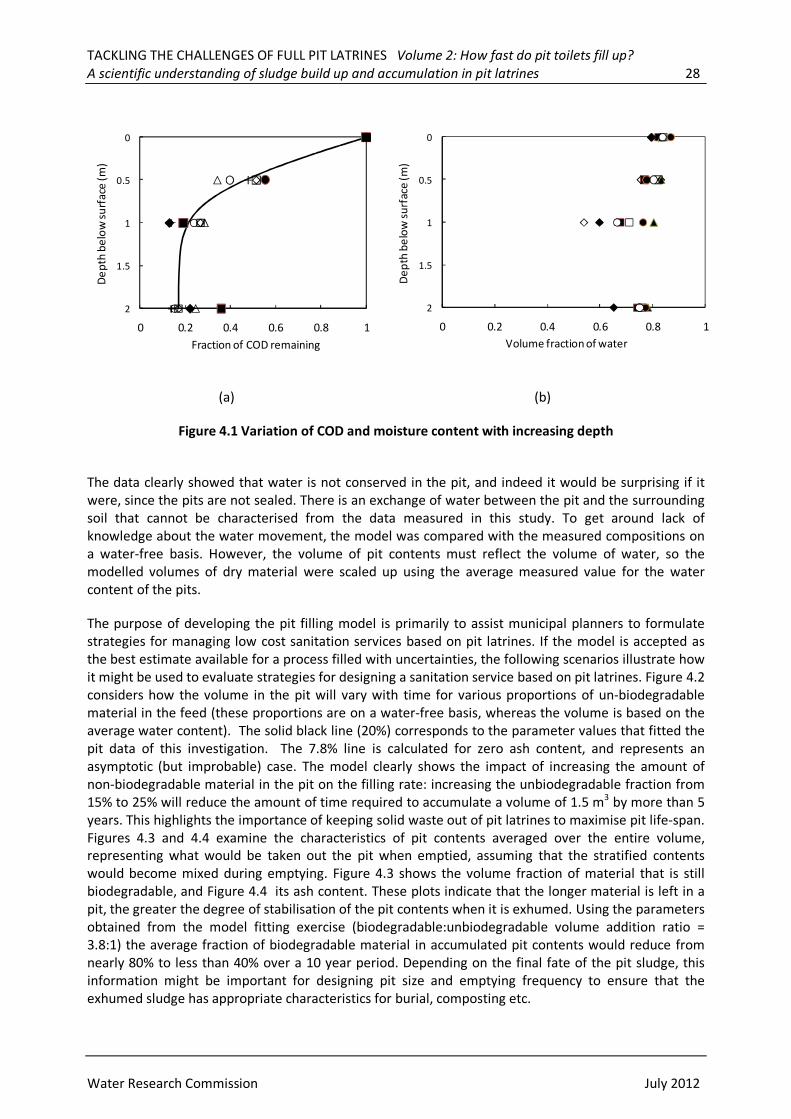
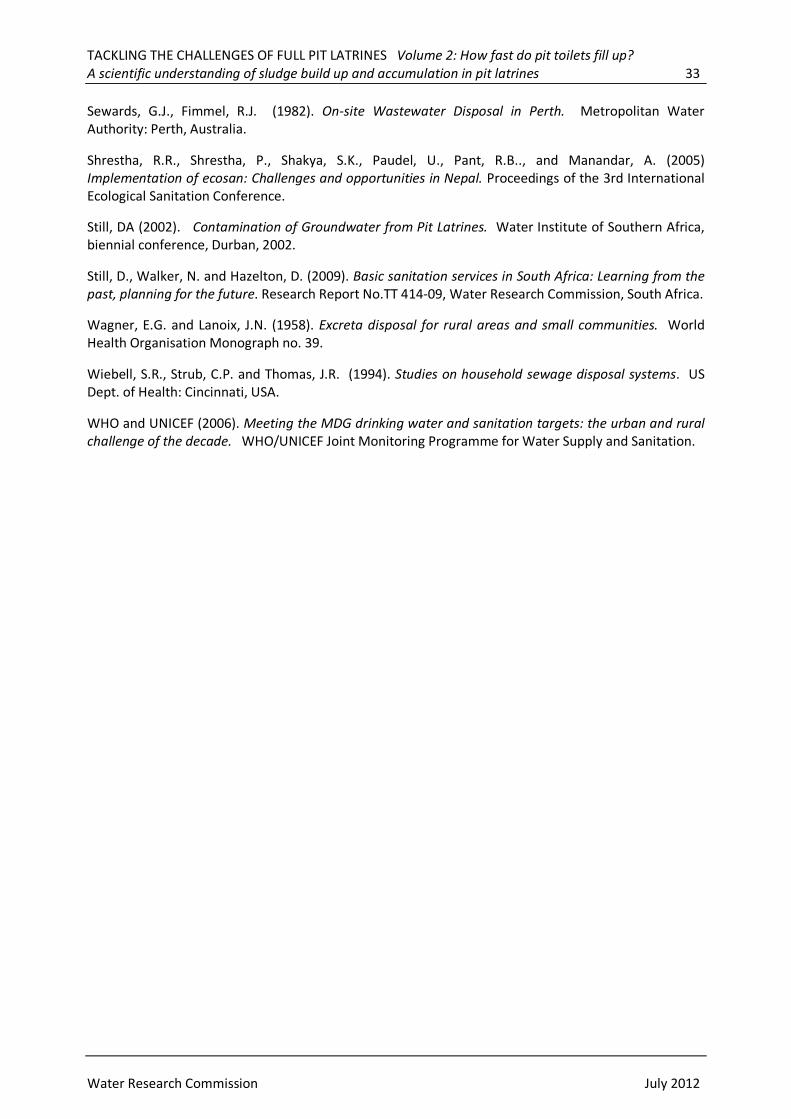
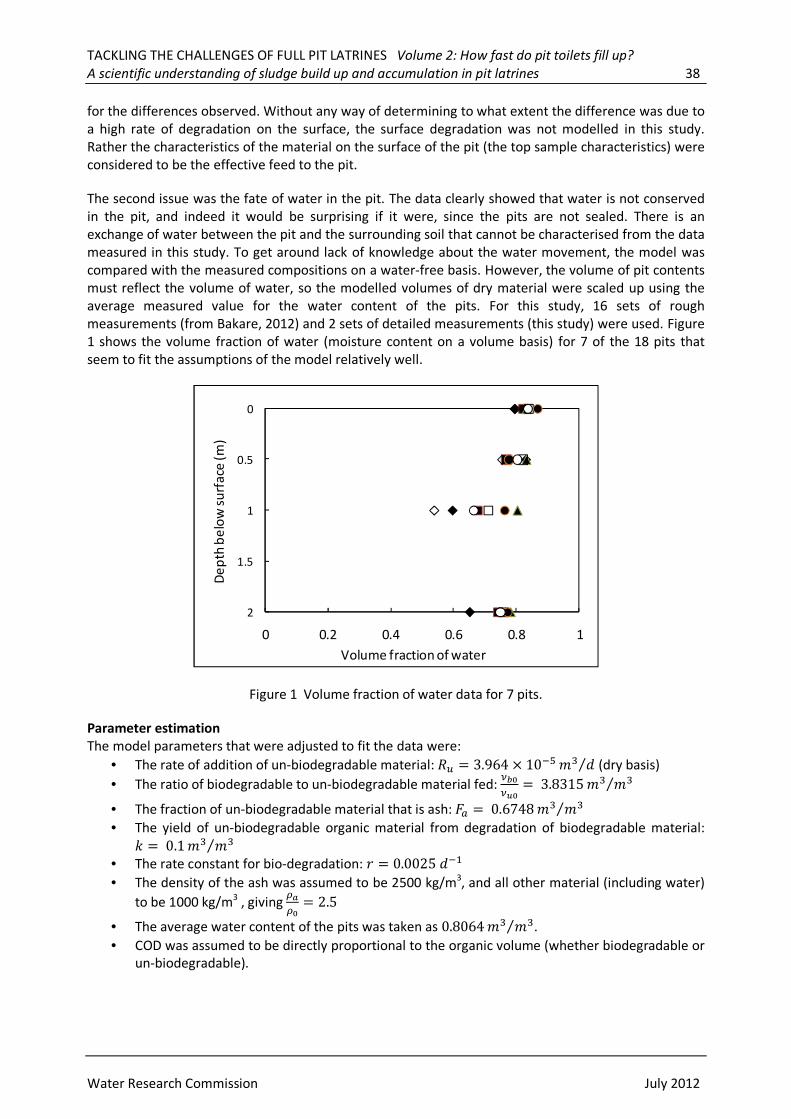
Figure 4.1 Variation of COD and moisture content with increasing depth ..............................................28
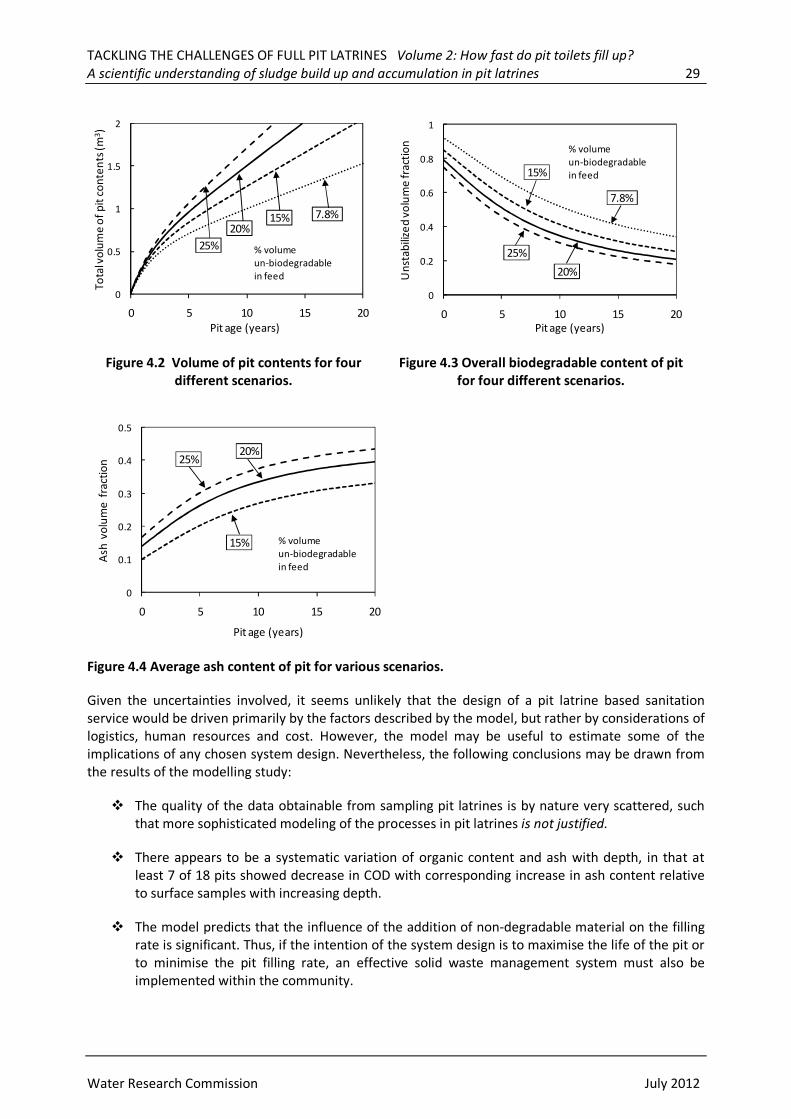
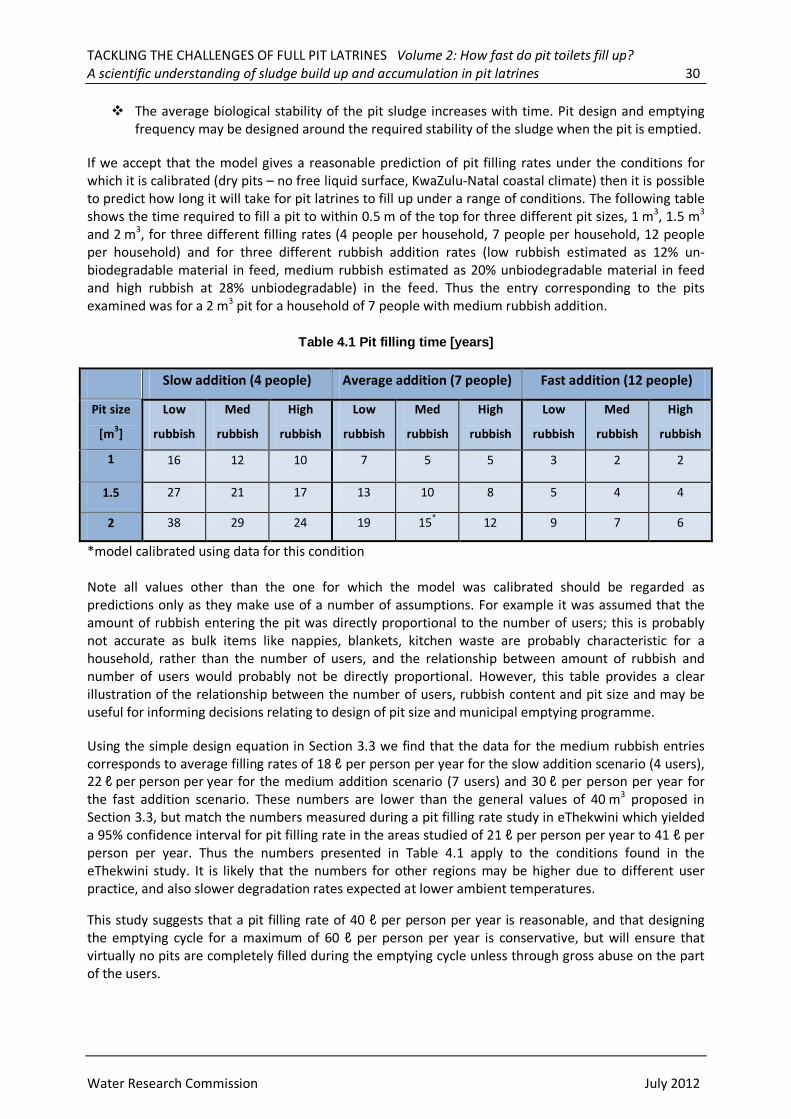
Figure 4.2 Volume of pit contents for four different scenarios..............................................................29
Figure 4.3 Overall biodegradable content of pit for four different scenarios..........................................29
Figure 4.4 Average ash content of pit for various scenarios. ..................................................................29
LIST OF TABLES
Table 3.1 Filling rates of septic tanks (Norris, 2000) ..............................................................................15
Table 3.2 Observed filling rates of septic tanks in South Africa (Norris, 2000) ........................................16
Table 3.3 Observations of pit filling rates (Still, 2009) ............................................................................17
Table 3.4 Filling rates calculated from unselected data, City of Durban, 1995........................................18
Table 3.5 Filling rates calculated from Mbazwana .................................................................................19
Table 3.6 Filling rates calculated from Limpopo Province ......................................................................20
Table 3.7 Filling rates calculated from Mafunze, KZN ............................................................................21
Table 3.8 Filling rates calculated from Ezimangweni (UKZN) ..................................................................22
Table 3.9 Pit sludge accumulation rates from four communities in eThekwini Municipality ...................23
Table 3.10 Filling rates averaged across studies ....................................................................................23
Table 4.1 Pit filling time [years] .............................................................................................................30
TACKLING THE CHALLENGES OF FULL PIT LATRINES Volume 2: How fast do pit toilets fill up?
A scientific understanding of sludge build up and accumulation in pit latrines 1
Water Research Commission July 2012
1 INTRODUCTION
This document represents the second in a series of three publications covering research undertaken by
Partners in Development and the Pollution Research Group at the University of KwaZulu-Natal for the
Water Research Commission (Project K5/1745). Additional funding was provided by Irish Aid. The
project was initiated in response to the fact that the VIP toilets which municipalities across South Africa
have built to meet the need for basic sanitation are approaching capacity and few municipalities have a
clear understanding of how fast their pits are filling, what challenges they will face in emptying them
and potential solutions to these challenges, or what options exist for the use of sludge which has been
removed from pits. The goal of this project was to contribute a clearer understanding to the questions
of how fast pits are filling, what challenges they will face in emptying them and potential solutions to
these challenges, or what options exist for the use of sludge which has been removed from pits. This
document investigates pit filling rates and the factors which influence them, with the goal of providing
municipalities with strategies for matching the pits under their jurisdiction with an appropriate
maintenance cycle.
In a survey conducted for this study investigating the management of VIP toilets, Water Services
Authorities (WSAs) in South Africa indicated that there were over one million VIPs within their
jurisdiction1. They estimated that 85% of these are older than 5 years and that most pits need to be
emptied every 5 to 9 years.
1 The full report on this survey can be obtained from the Water Research Commission, Project K5/1745.
A detailed summary of the survey is included in Volume 1 of this report series.
4
10
2
82
2
0
10
20
30
40
50
60
70
80
90
less than1 year
yearly 2-4years
5-9years
10 yearsor more
Time between pit emptying episodes
Per
cent
age
of V
IPs
in s
urve
y
42
8
65
20
0
10
20
30
40
50
60
70
less than1 year
1-2 years 3-4 years 5-9 years 10 yearsor more
Pit age
Per
cen
tag
e o
f V
IPs
surv
eyed
Figure 1.1 Age of VIPs and pit emptying frequency in WSAs surveyed (PID, 2009)
TACKLING THE CHALLENGES OF FULL PIT LATRINES Volume 2: How fast do pit toilets fill up?
A scientific understanding of sludge build up and accumulation in pit latrines 2
Water Research Commission July 2012
This suggests that pits are filling up more rapidly than was initially anticipated and that within the next
few years WSAs which do not already have a plan, budget or programme in place for emptying pits will
find themselves facing a crisis when pits reach capacity. To avert such a crisis, WSAs need to be able to
accurately predict the rate at which pits will become full and require emptying and rapidly develop the
capacity for emptying large numbers of pits.
A number of social, geophysical and biological factors impact the key processes within a pit which
determine the rate at which it will fill: the addition of new material into the pit, the transfer of water
into and out of the pit, biological transformations, and bacteria die-off (Buckley et al., 2008). A standard
pit generally contains a range of materials, including faeces, urine, anal cleansing material and general
solid waste. In the pit, the surface of the sludge has contact with the air, allowing aerobic degradation
to occur. As sludge is covered over with fresh material and no longer has contact with the air, anaerobic
degradation takes over. Understanding the interaction of these variables will not only enable
municipalities to predict filling rates with greater accuracy but also to manipulate these variables in
order to optimise both their pit designs and their pit servicing programmes.
TACKLING THE CHALLENGES OF FULL PIT LATRINES Volume 2: How fast do pit toilets fill up?
A scientific understanding of sludge build up and accumulation in pit latrines 3
Water Research Commission July 2012
2 FACTORS AFFECTING SLUDGE ACCUMULATION RATES
Pit design determines the holding capacity and drainage capacity of an on-site system and can limit or
facilitate various methods of sludge extraction. User behaviour affects the make-up of faeces, the
amount of urine that goes into the pit, the presence of solid or liquid waste in the pit and the presence
of chemical or biological agents in the pit which could suppress or enhance degradation. A range of
geophysical factors and biological processes influence the processes of accumulation and degradation
in the pit.
2.1 Design of on-site sanitation systems and chamber size
On-site sanitation systems range from rudimentary home-built pit latrines to the sophisticated indoor
urine diversion toilets now becoming fashionable in some affluent societies such as Sweden. Every on-
site system has some kind of chamber or receptacle for holding faeces which will eventually become
full. In addition to the number of users and their various behaviours which determine what goes into
the receptacle (for example diet, anal cleansing material, use of the toilet for disposal of liquid or solid
waste), the size of this chamber is a key factor determining how soon the chamber will fill. Systems
designed to divert urine will produce sludge with a different nutrient and moisture content than
systems which combine faeces and urine. In South Africa, the recommended pit size for VIPs is 2 to
3 m3, while in some countries, such as Tanzania,
pits may be as large as 10 m
3. The amount of water
that enters the pit (flushing water, greywater or rain) in combination with the drainage capacity of the
pit (affected by the lining of the pit, soil conditions and water table) also influence the filling rate.
Unless the pit is sealed much of the moisture in the excreta leaches away, and the remaining organics
slowly break down. Depending on the soil conditions, a pit must be reinforced in order to prevent the
top structure from collapsing into the pit (Figure 2.1). Typically, pits are reinforced by lining them with
bricks or blocks, laid with open vertical joints to allow for drainage.
Figure 2.1 Left: An unlined or unreinforced pit cannot support a heavy top structure. Right: A pit
lined with blocks laid with open vertical joints, allowing drainage through the bottom and sides of the pit.
If seepage into the surrounding soil is considered undesirable due to the proximity to drinking water
sources, such as a village borehole, then the pit should be sealed. A sealed pit that is unable to drain is
TACKLING THE CHALLENGES OF FULL PIT LATRINES Volume 2: How fast do pit toilets fill up?
A scientific understanding of sludge build up and accumulation in pit latrines 4
Water Research Commission July 2012
in essence a conservancy tank. Depending on the size of the tank, the number of users and whether
any greywater is added to the pit, conservancy tanks typically fill within days or months.
The design of the toilet as a system must be considered in order to determine sludge accumulation
rates. A key consideration in the design of the pit should be how to achieve filling rates that do not
exceed the planned emptying cycle.
2.2 User related factors
� Number of users
In broad terms, the number of users of a pit obviously plays a key role in sludge accumulation rates. An
individual produces between 0.12-0.40 litres of faeces and 0.6-1.5 litres of urine per day (Buckley et al.,
2008). Averaged over a year, this amounts to 110 litres of faeces and 440 litres of urine per person per
year: a total volume of 550 litres of excreta per person per year.
Accurately calculating the average number of users and their relative contribution to the contents of a
pit over its lifetime can prove extremely difficult, however. The household size may have increased or
decreased over the period that the pit has been in use, some members may have been away from the
home during the day or week and have contributed far less to the contents of the pit than others, and
children contribute less than adults to the pit. The current lifecycle of the pit may pre-date the current
occupants of the house, who may have no knowledge of the household size or user behaviour of the
former occupants who contributed to the pit during the first years of filling. As a result, studies
frequently do not indicate a strong relationship between household size and the rate at which the pit
fills. Bakare (2012) showed that there was no correlation between available data for pit filling rates and
reported number of users and concluded that this was due to uncertainty in the pit filling rate data and
confusion surrounding the interpretation of average number of pit users.
� Anal cleansing material
In Asian cultures “washing” is preferred over “wiping” as the anal cleansing method, which results in
more water entering the pit. Most South Africans are “wipers.” If toilet paper is unaffordable then
newspaper, and sometimes other materials such as plastic bags or maize cobs, will be used for anal
cleansing. As these materials represent different volumes and biodegradability, they can have very
different impacts on filling rates.
� Solid waste
Pits are often used for disposal of rubbish and greywater if the municipality has not provided
alternative means of disposal. Solid waste content varies widely in terms of volume and
biodegradability, impacted also by cultural and economic factors such as whether kitchen scraps are fed
to animals, the amount of packaging that enters the home with purchases, whether plastic packets are
provided free at shops, and the extent to which things are re-used rather than passed on. Families with
a higher socio-economic status typically produce more rubbish. On-site systems with offset pits which
operate with a flush tend to limit the disposal of rubbish into the pit to a large extent. While user
education programmes attempt to discourage householders from disposing of rubbish in a pit, if there
TACKLING THE CHALLENGES OF FULL PIT LATRINES Volume 2: How fast do pit toilets fill up?
A scientific understanding of sludge build up and accumulation in pit latrines 5
Water Research Commission July 2012
is no discreet alternative for disposal of personal items such as sanitary pads or condoms, or safe
alternative for the disposal of hazardous waste, these are likely to continue to be disposed of in the
toilet, whatever design it may be.
� Ownership
In South Africa, a toilet is usually owned by an individual family, and the public ownership model that is
common in Africa (WHO/Unicef, 2006) and India (Cotton et al., 1995) is rarely used. Since basic
sanitation is part of the Free Basic Water Services programme, toilets are usually provided at no
expense to the household. As less value is sgenerally placed on something that is offered free of
charge, owners are sometimes required to contribute their labour during the construction of the toilet,
with the idea that “sweat equity” may increase the householders’ sense of ownership and responsibility
for a system that they did not pay for. Generally, when users lack a sense of ownership, or are not
satisfied with the system they have been given, they are less willing to maintain the system properly.
� User education
The provision of toilets by government without concurrent education programmes has sometimes
failed to improve sanitation in a community. As a result, sanitation provision is most effective when it is
understood to include infrastructure, maintenance and health and hygiene education (Department of
Water Affairs, 2003). In South Africa, health and hygiene programmes have increasingly become part of
sanitation delivery, and 40% of the municipalities with VIPs now have ongoing programmes which are
often run through the schools or community meetings. When India introduced pour-flush latrines the
systems failed in some communities due to misuse and home conversion of the systems to pit latrines.
In response, the Kerala Water Authority added an education and follow-up programme as a component
of subsidised latrine provision. Community members served on Ward Water Committees which
facilitated the introduction of sanitation and inspected household latrines to ensure proper use (Kurup,
1996).
2.3 Geophysical and climactic factors
The conditions surrounding the pit, such as soil, slope and the interaction of the water table with the
pit, impact the rate of accumulation in the pit in a number of ways.
� Substrate and soil type
Clay soils slow the drainage of liquids from pits, while sand provides effective drainage and allows pit
contents to dehydrate, provided that little water is added by users. An impermeable substrate or sub-
formation and shallow soils may limit drainage from pits and increase the rate of filling (Pearson, 2002).
Wherever possible the lining of pits should be permeable in order to allow the liquid content to
percolate into the surrounding soil, reducing volume in the pit.
� Elevation, slope and water table
If pits are extended below the water table, water will tend to drain into, rather than out of the pits.
While higher moisture content may assist the decomposition process in the sludge, flooding of pits can
render them unusable and a health hazard. While there is a perceived risk of pathogens and nitrates in
the sludge contaminating the groundwater, the literature indicates that this does not occur unless
there is a highly permeable aquifer formation with a significant groundwater flow (Still, 2002).
TACKLING THE CHALLENGES OF FULL PIT LATRINES Volume 2: How fast do pit toilets fill up?
A scientific understanding of sludge build up and accumulation in pit latrines 6
Water Research Commission July 2012
� Evaporation, rainfall and seasonal temperatures Some loss of moisture from latrine pits occurs through evaporation – moisture is lost as vapour into the
air. The rate at which this occurs will be affected by temperature and humidity, with higher losses
occurring under warmer, drier conditions. Where precautions are not taken to prevent runoff of
rainwater from the surrounding area into the pit, it may fill with water after heavy rain.
2.4 Biological activity in the pit
Fungal organisms and other biota such as maggots, roaches and worms in the pit also play a role in
making the organic material more amenable to bacterial break down (Kele, 2005). The temperature,
pH, ammonia level and water content in a pit may affect microbial activity.
� Aerobic and anaerobic degradation
While matter cannot be created or destroyed, matter that enters the pit can exit the pit through
evaporation and transportation of dissolved particles into the surrounding soil, as discussed above, and
through the degradation of organic matter by bacteria present in the pit into liquids and gases
(primarily methane, carbon dioxide, ammonia and nitrogen) which can then exit the pit. During this
process the sludge becomes more stable (less prone to further changes) due to the decrease in organic
matter. Given enough time, all biodegradable matter in the pit will eventually be converted to
inorganic products that are either soluble or gaseous and a small amount of non-degradable organic
residue. The soluble and gaseous components will “disappear” from the pit through leaching and gas
evolution. As the complex range of degradation processes each depend on particular bacteria, the
populations of those bacteria will grow until they are in balance with their environment. As the
biodegradable material is depleted, the micro-organisms die and themselves degrade.
Where sludge in the pit has contact with air (oxygen), aerobic digestion takes place. In this process,
bacteria dependent on oxygen use the nutrients in sludge and the oxygen available at the sludge
surface to grow, converting sludge to biomass (more bacteria) in the pit and to carbon dioxide which
then exits the pit. Figure 2.2 below illustrates the area where aerobic digestion takes place where the
surface of the sludge is in contact with air. If the pit is unlined or has open joints, aerobic digestion may
also take place to a limited extent at the sludge/soil interface where bacteria can utilise oxygen found
in unsaturated soil.
Aerobic processes proceed fairly rapidly in comparison to anaerobic processes, which are orders of
magnitude slower. Where no oxygen is available, bacteria which do not require oxygen convert sludge
to additional biomass (more bacteria) and methane and CO2, which escape from the pit. The anaerobic
region of the pit is shown in Figure 2.2b.
TACKLING THE CHALLENGES OF FULL PIT LATRINES Volume 2: How fast do pit toilets fill up?
A scientific understanding of sludge build up and accumulation in pit latrines 7
Water Research Commission July 2012
Figure 2.2 Left (a): Areas in the pit where the sludge is in contact with air and aerobic digestion
occurs. Right (b): Areas in the pit where the sludge is not in contact with air and anaerobic digestion occurs.
Anaerobic degradation has a much lower yield of biomass than aerobic processes; for each g COD of
substrate consumed, only 0.05-0.10 g COD becomes more biomass and the remainder is converted to
methane, whereas in the case of aerobic digestion the conversion to bacteria is 0.50 to 0.70 g COD
biomass/g COD organics and the remainder is converted to CO2. With time the biomass thus generated
aerobically or anaerobically breaks down and becomes substrate for other bacteria, such that the
biodegradable material is all eventually removed. However, the growth of micro-organisms converts a
portion of biodegradable organic material to non-degradable organic cell components. These
accumulate with time in the pit and do not break down further.
Both aerobic and anaerobic processes will contribute to the breakdown and removal of biodegradable
organic matter in pit sludge. It is hypothesised that the greater the contribution of aerobic processes to
biodegradation, the more rapidly the material in the pit will stabilise, but because of the relatively
higher growth yields that are exhibited during aerobic digestion, a greater amount of non-degradable
residue is generated and eventually accumulates in a pit latrine. This may partially explain why it is
reported in the practitioner’s literature that wet pit contents (which are predominantly anaerobic due
to the occlusion of air by the water content) accumulate more slowly than dry pit latrines.
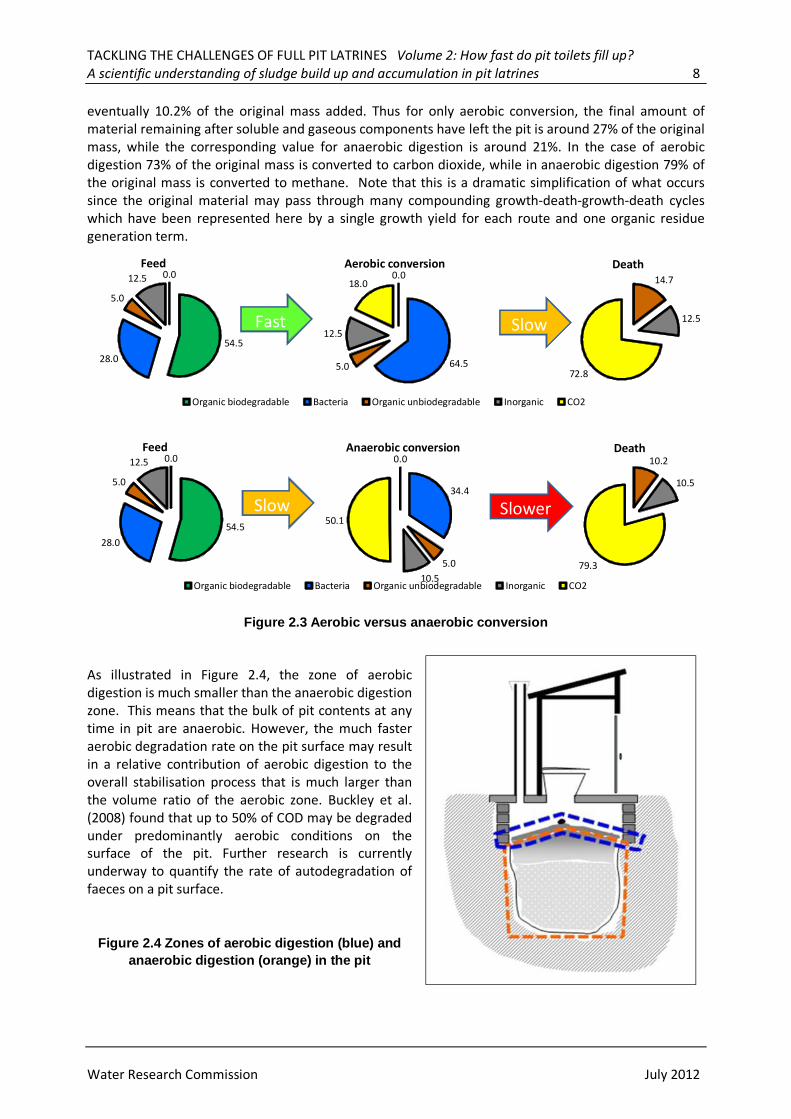
This concept is presented graphically in Figure 2.3: It is assumed that the material added to a pit latrine
has the following characteristics: organic biodegradable content 54.5%; biodegradable bacterial cell
mass 28%; organic unbiodegradable content 5%; inorganic content 12.5%.
Only the first two categories are degradable. If we assume that the aerobic cell yield is 67% on a mass
basis and that the generation of unbiodegradable COD as a result of growth is 15%, ultimately 14.7% of
the original mass of material is added as unbiodegradable organics. However, if the same feed material
undergoes anaerobic digestion with an anaerobic cell yield of 8% on a mass basis and the same
unbiodegradable generation factor of 15%, the unbiodegradable organic fraction that accumulates is
TACKLING THE CHALLENGES OF FULL PIT LATRINES Volume 2: How fast do pit toilets fill up?
A scientific understanding of sludge build up and accumulation in pit latrines 8
Water Research Commission July 2012
eventually 10.2% of the original mass added. Thus for only aerobic conversion, the final amount of
material remaining after soluble and gaseous components have left the pit is around 27% of the original
mass, while the corresponding value for anaerobic digestion is around 21%. In the case of aerobic
digestion 73% of the original mass is converted to carbon dioxide, while in anaerobic digestion 79% of
the original mass is converted to methane. Note that this is a dramatic simplification of what occurs
since the original material may pass through many compounding growth-death-growth-death cycles
which have been represented here by a single growth yield for each route and one organic residue
generation term.
Figure 2.3 Aerobic versus anaerobic conversion
As illustrated in Figure 2.4, the zone of aerobic
digestion is much smaller than the anaerobic digestion
zone. This means that the bulk of pit contents at any
time in pit are anaerobic. However, the much faster
aerobic degradation rate on the pit surface may result
in a relative contribution of aerobic digestion to the
overall stabilisation process that is much larger than
the volume ratio of the aerobic zone. Buckley et al.
(2008) found that up to 50% of COD may be degraded
under predominantly aerobic conditions on the
surface of the pit. Further research is currently
underway to quantify the rate of autodegradation of
faeces on a pit surface.
Figure 2.4 Zones of aerobic digestion (blue) and anaerobic digestion (orange) in the pit
54.5
28.0
5.0
12.5 0.0Feed
Organic biodegradable Bacteria Organic unbiodegradable Inorganic CO2
Fast Slow
14.7
12.5
72.8
Death0.0
64.55.0
12.5
18.0
Aerobic conversion
54.5
28.0
5.0
12.5 0.0Feed
Organic biodegradable Bacteria Organic unbiodegradable Inorganic CO2
Slow Slower
10.2
10.5
79.3
Death0.0
34.4
5.0
10.5
50.1
Anaerobic conversion
TACKLING THE CHALLENGES OF FULL PIT LATRINES Volume 2: How fast do pit toilets fill up?
A scientific understanding of sludge build up and accumulation in pit latrines 9
Water Research Commission July 2012
2.5 The effect of substances added to inhibit/enhance biological activity
Products that are added to the contents of pit latrines fall into two broad and opposed categories:
those added to reduce odours and insect activity, and those added to improve sludge degradation and
reduce the rate of filling.
Nwaneri et al. (2007) mention that household bleaches and disinfectants such as Jik and Domestos
(containing sodium hypochlorite), or Jeyes Fluid are often added to pit latrines to reduce odours. These
products have known microbiocidal properties, and may inhibit the functions of bacteria active in
sludge degradation, and therefore increase the rate of sludge build up. Organophosphates and
pyrethroid insecticides may be added to reduce the activity of fly maggots, which will also therefore
reduce the rate of sludge break down.
Substances containing active biological agents have also been developed to enhance the biological
activity in the pit. There are currently dozens of products marketed in South Africa with the claim that
they will prevent pits from filling up or reduce the rate at which they fill by enhancing the degradation
of sludge. The assumption driving the development of pit additives is that digestion is not already
occurring as efficiently as it could be in the pit. However, faecal sludge contains a wide range of
naturally occurring bacteria which increase in proportion to the available nutrient load and are effective
in digesting the sludge. These natural processes have already been found to work optimally in the
treatment of waste water: when a septic tank or a waste water treatment works is commissioned, no
seeding of the plant with appropriate bacteria is needed as the necessary bacteria arrive with the
incoming waste stream.
While it may be possible to manipulate the conditions in the pit to optimize bacterial activity, it is
impossible for even the optimal bacteria under the optimal conditions to empty a pit completely: as
discussed in Section 2.4, not all matter can be transformed into gases or liquids which can then exit the
pit. Aerobic bacteria consume sludge more quickly than anaerobic bacteria but (it is hypothesised)
ultimately leave more non-biodegradable mass in the pit.
Some pit additives claim to add aerobic bacteria to the pit, thereby increasing the aerobic conditions in
the pit. However is the amount of oxygen that determines whether conditions are aerobic or anaerobic,
and this cannot be manipulated in any way by adding a substance to a pit.
In a survey conducted for this study, 20% of the Water Service Authorities in South Africa which have
VIP toilets reported that they supply pit additives to householders or promote their use. Some are using
their sanitation budgets for pit additives rather than for emptying pits in the hope that these products
will prevent the need to empty pits or dramatically reduce the rate at which they fill. A typical pit
additive treatment costs R20 to R30 per month, representing a cost of R1 200 - R1 800 over a five year
period to allegedly slow – but not stop – accumulation of sludge in the pit. In contrast, a five year old
pit can be completely emptied and the sludge disposed of by manual or mechanical means for between
R500 and R1 500.
Investing in pit additives which may not be effective can therefore seriously compromise the capacity of
municipalities to maintain their on-site systems. As no formal protocol exists in South Africa for testing
the effectiveness of pit additives, the Water Research Commission has undertaken to test
approximately 20 pit additives in order to investigate whether any empirical evidence could be found
that any of these products actually do reduce filling rates.
TACKLING THE CHALLENGES OF FULL PIT LATRINES Volume 2: How fast do pit toilets fill up?
A scientific understanding of sludge build up and accumulation in pit latrines 10
Water Research Commission July 2012
2.5.1 Scientific investigation into the efficacy of pit additives
In 2007, the Water Research Commission tested a commercially available pit additive on nine VIP pits
over a period of three weeks using blind controls. No sludge reduction was observed (Foxon et al.,
2008). In 2009, laboratory tests were carried out on nine more products. None of the additives had a
statistically significant effect on the rate of mass loss from the sludge samples (Foxon et al., 2009).
Figure 2.5 combines the results for seven of the additives, comparing them against a control and also
against samples to which only an amount of water was added. As can be seen, the rate of mass loss
from the controls is no different to the rate of mass loss from the samples in which pit additives were
used.
Figure 2.5 Rate of mass loss in laboratory tests of pit additives
Further laboratory trials and field trials were conducted in 2009/2010. For laboratory trials, fresh
samples of two different pit additives were mixed with samples of VIP contents taken from the surface
of the pit beneath the pit pedestal and incubated for 30 days. Tests were performed in three or five
replicates and two reference treatments (or controls) were included for comparative purposes: (i) no
addition of water or chemicals (control); (ii) addition of water (water reference). It was found that while
there was significant variation in the measurement of mass loss rate in these experiments, there was
no significant difference between the rate of mass loss for each of the four treatments and the
controls.
Figure 2.6 Rate of mass loss from honey jar samples of pit latrine
sludge subjected to different treatments.
0
0.5
1
1.5
B C G H I J K Control Water
Rat
e o
f mas
s lo
ss [k
g/m
2 .d
]
Treatment (aerobic)
-0.5
0
0.5
1
1.5
2
2.5
A B no
treatment
reference
(water)
Ra
te o
f m
ass
lo
ss
[g/d
ay.
jar]
TACKLING THE CHALLENGES OF FULL PIT LATRINES Volume 2: How fast do pit toilets fill up?
A scientific understanding of sludge build up and accumulation in pit latrines 11
Water Research Commission July 2012
-60
-40
-20
0
20
40
60
Product A Product B Water Control
Net
cha
nge
in p
it sl
udge
hei
ght
(mm
/mon
th)
For the field trials, the two pit additives used in the laboratory trial were used to dose eight pit latrines
each, with reference and control groups of seven pit latrines each. Since the manufacturers advised
that the additives be added with water to the pits, the reference experiment aimed to isolate the effect
of adding water to pit contents on the sludge accumulation rate. In these pits, 10 ℓ of water was added
to each of the reference pits on a weekly basis. The rate of pit sludge accumulation was determined by
taking three measurements of the distance between the pedestal and pit surface for three locations
directly under the pedestal using a laser distance measure. These measurements were averaged to give
an indication of the distance between the top of the sludge heap and the pedestal.
Figure 2.7 Change in height of pit contents over 6 months (laser measurement of height)
KEY: Black – Pit additive A. Green – Pit additive B. Red – Water only C. Blue – Nothing added D
Over the six month period there was no evident difference in the sludge accumulation rate whether pit
additive A, pit additive B or simply plain water was added. There was however a noticeable difference
between treatments which involved the regular addition of water, and the control where nothing was
added. In this regard it is notable that the results for Treatments A, B and C were very similar despite
the very different amounts of water involved (10 litres every second month for A and 10 litres every
week for B and C). The results are summarised in Figure 2.8.
Figure 2.8 Change in height of pit latrine contents over 6 months (using laser measurement of height). The box for each data set
represents the range of the
95% confidence interval on
the mean, while the whisker
shows maxima and minima
from within each data set.
-150
-100
-50
0
50
100
150
0 5 10 15 20 25 30
Ch
an
ge
in p
it h
eig
ht
[mm
/mo
nth
]
Pit Number
Overall (6 m)
1st 3m
2nd 3m
TACKLING THE CHALLENGES OF FULL PIT LATRINES Volume 2: How fast do pit toilets fill up?
A scientific understanding of sludge build up and accumulation in pit latrines 12
Water Research Commission July 2012
-300
-200
-100
0
100
200
300
400
Product A Product B Water Control
Net
slud
ge R
educ
tion
(mm
per
mon
th)
These results suggest that the pit additives in themselves do not bring about a reduction of pit contents
but that some reduction in sludge accumulation rate can be achieved by the addition of water alone.
Whether the addition simply levels the heap, bringing about an apparent reduction, or enhances
biodegradation is not clear from these measurements.
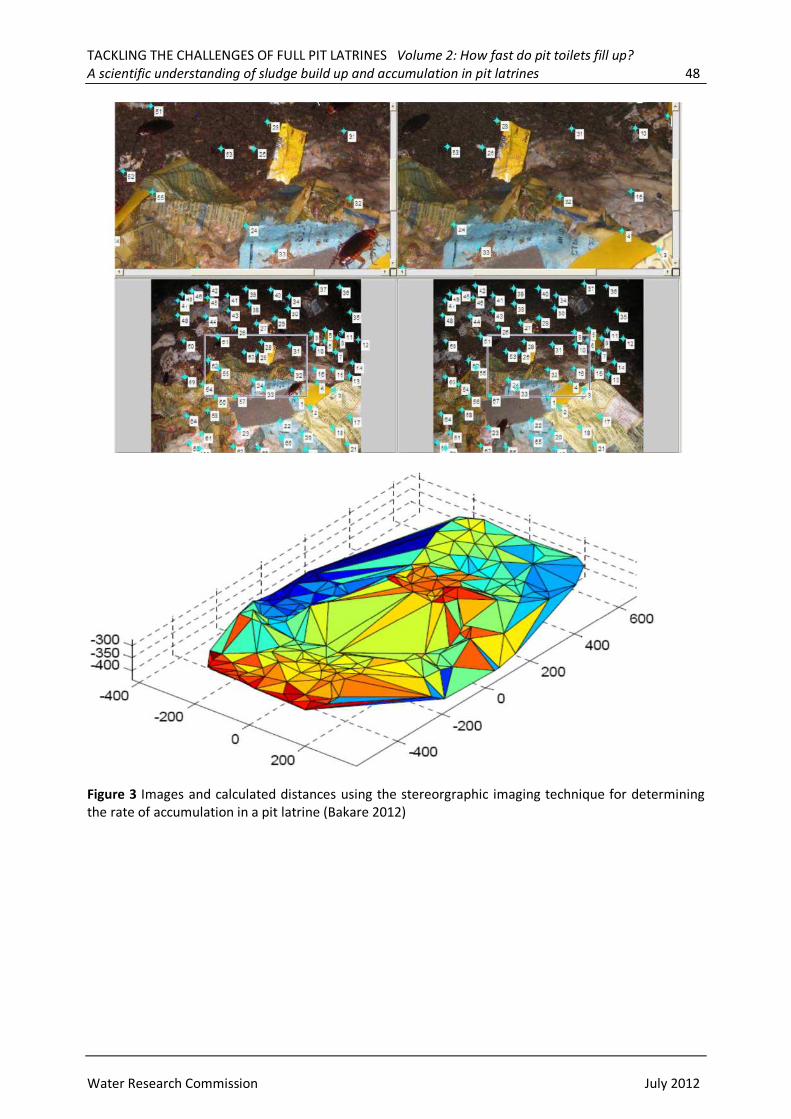
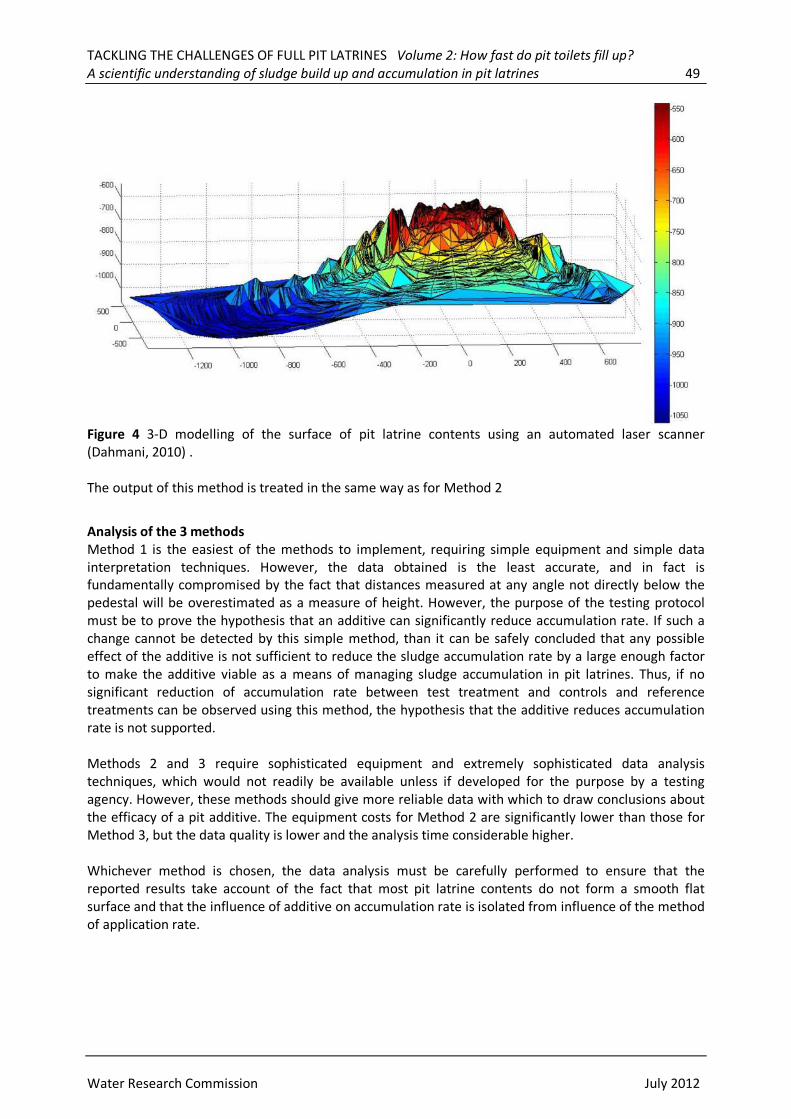
To clarify the mechanism of measured accumulation rate reduction stereographic imaging was used to
map the surface of the pit contents. This map was used to estimate the volume change of pit contents
over the 6 month period as opposed to the change in pit contents height. The results are presented in
Figure 2.9.
Figure 2.9 Change in height of pit contents over 6 months (stereographic determination of
volume) KEY: red – Pit additive A. blue – Pit additive B. green – Water only C. black – Nothing added D
In Figure 2.9, it is seen that there is no significant difference between the results from any of the
treatments. This suggests that the difference between the control and other treatments in Figure 2.7
was due to changes in the shape of the pit contents as a result of the addition rather than to the actual
volume rate of accumulation. The results are summarised in Figure 2.10.
Figure 2.10 Box and Whisker plot showing change in height of pit latrine contents over 6 months (stereographic measurement of volume).
-2000.00
-1500.00
-1000.00
-500.00
0.00
500.00
1000.00
1500.00
2000.00
0 5 10 15 20 25 30
Net
slud
ge r
educ
tion(
mm
per
mon
th)
Pit Numbers
1st 3 months 2nd 3 months overall 6 months
B water ControlA
TACKLING THE CHALLENGES OF FULL PIT LATRINES Volume 2: How fast do pit toilets fill up?
A scientific understanding of sludge build up and accumulation in pit latrines 13
Water Research Commission July 2012
Also in 2009, the University of KwaZulu-Natal and Partners in Development (PID) were approached by a
pit additive manufacturer and requested to test their product. Forty actively used pits were selected
for the trial and divided into four treatment groups which were dosed with the additive, coloured
water, a water and molasses mix or nothing. Over the period of the trial the median sludge height for
the control group increased 39 mm, while the median height for the group dosed with coloured water
increased 38 mm. The median increase for the latrines which had the molasses water mix added was
55 mm, and that for the group that was given the additive was 78 mm. The group that was given the
additive not only showed no reduction in the rate of sludge accumulation, but it in fact showed an
increased rate of sludge accumulation.
If these increases were extrapolated across the full 2.4 m2 surface area of the pit they would equate to
pit filling rates of between 300 and 600 litres in one year. These rates are within normal observed
ranges, but are higher than the rates at which these pits were observed to have filled over the three
years from the construction to the start of the trial, where the median increase was in fact 307 litres
per year. However an examination of the offset sludge height measurements showed that the pit
sludge height increase during the time of the trial was negligible on the sides in all cases, although once
again the increase for the set of latrines which were being dosed with the additive was the highest
(Figure 4.8). It is likely that sludge in a pit does not increase in height at a uniform rate over the area of
the pit, but builds in the centre and then slumps to the outside in a repeating cycle. For this reason,
while short studies of this nature may be of use for testing the efficacy of an additive, they are of
limited use for determining long term pit filling rates.
-40
-20
0
20
40
60
80
100
0 2 4 6 8 10 12 14 16
Time (Weeks)
Ch
ang
e in
slu
dg
e h
eig
ht
(m
m)
)
Pit additive Molasses plus waterColoured water
Figure 2.11 Median cumulative increase in sludge level
Control - nothing added
TACKLING THE CHALLENGES OF FULL PIT LATRINES Volume 2: How fast do pit toilets fill up?
A scientific understanding of sludge build up and accumulation in pit latrines 14
Water Research Commission July 2012
Figure 2.12 Median changes in sludge height from four 0.5 metre offset measurements
While sludge accumulation occurred at an irregular rate and with great variation between pits, the
filling rates observed in this study showed that the pits were filling at approximately the same rate at
which they had been filling during their first three years of use. The range of filling rates for that
period was 46 to 638 litres per annum, with a mean of 339 litres per year and a median of 307 litres per
year. The data does not indicate that the pit additive brought about any reduction in the accumulation
rate of sludge in these latrines, even with a doubling of the dosage over the second half of the trial.
2.5.2 Conclusions
In all trials undertaken to date by the Water Research Commission, no evidence has been found that
any of the pit additives tested made any difference to sludge build up. While one trial suggested that
the addition of large amounts of water might reduce sludge build up, this result was not seen in the
laboratory trials. This implies that the addition of water (or water and pit additive) probably did not
increase biodegradation rates but that reduction in height was more likely due to the flattening of the
surface by water, which possibly also increased leaching from the pit. This was confirmed by using
imaging techniques to determine the volume change of pit contents.
These studies do not prove that all pit additives are ineffective, but that no evidence was found that a
number of products on the market provide any measurable benefit. Clearly there is an urgent need for
a standardised laboratory test protocol that is able to investigate the effects of pit additives under
optimised, controlled and repeatable conditions. Until a standard test protocol is developed and put
into force, the onus should be placed on manufacturers to demonstrate where and under what
circumstances their products have worked. A laboratory protocol for testing pit additives was published
by Foxon et al. (2009). Appendix B contains the requirements for a field testing protocol.
-20
-10
0
10
20
30
40
4 6 8 10 12 14 16
Time (weeks)
Ch
ang
e in
slu
dg
e h
eig
ht (
mm
)
Pit additive Molasses plus water Coloured water Control - nothing added
TACKLING THE CHALLENGES OF FULL PIT LATRINES Volume 2: How fast do pit toilets fill up?
A scientific understanding of sludge build up and accumulation in pit latrines 15
Water Research Commission July 2012
3 OBSERVATIONS OF SLUDGE ACCUMULATION RATES
The factors affecting filling rates are many and complex. It is therefore critical to have data of actual
observed filling rates against which to test any theoretical models. The literature contains far more data
on sludge build up in septic tanks than in pit latrines. This should not be surprising given the greater
role of septic tanks as a sanitation solution for the more affluent.
3.1 On-site faecal sludge accumulation rates quoted in the literature
� Septic tanks
Table 3.1 gives some of the data from international studies on the filling rates of septic tanks. As can
be seen the quoted rates vary from 22 ℓ/c.a to 95 ℓ/c.a. With so wide a range, unless one knows where
the observations were made and under what circumstances, interpretation is impossible. For example,
ambient temperature has an effect on sludge digestion rates, and user behaviour also has an effect.
Table 3.1 Filling rates of septic tanks (Norris, 2000)
Country Reference Mean filling rate
litres/capita.annum
Not specific Hill and Ackers, 1954 94.9
South Africa Drews, 1985 32.9
USA Wiebel, Stub and Thomas, 1949 21.9
India Ensic, 1982 76.7
Australia Sewards and Fimmel, 1982 29.2
Canada Brandes, 1978 65.7
As a result the Water Research Commission conducted detailed field studies of filling rates of septic
tanks in South Africa during the late 1990s. These results, which are summarised in Table 3.2, show
that in South African conditions the lower end of the range (27 to 37 ℓ/c.a) is applicable.
TACKLING THE CHALLENGES OF FULL PIT LATRINES Volume 2: How fast do pit toilets fill up?
A scientific understanding of sludge build up and accumulation in pit latrines 16
Water Research Commission July 2012
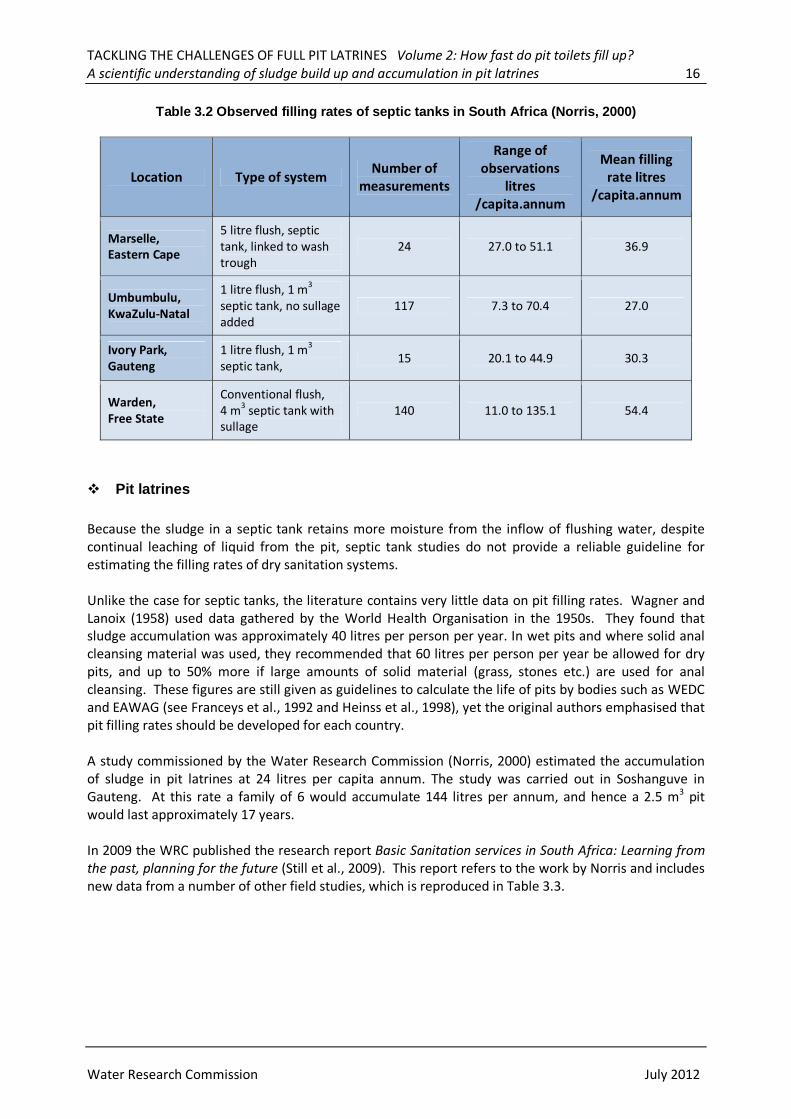
Table 3.2 Observed filling rates of septic tanks in South Africa (Norris, 2000)
Location Type of system Number of
measurements
Range of
observations
litres
/capita.annum
Mean filling
rate litres
/capita.annum
Marselle,
Eastern Cape
5 litre flush, septic
tank, linked to wash
trough
24 27.0 to 51.1 36.9
Umbumbulu,
KwaZulu-Natal
1 litre flush, 1 m3
septic tank, no sullage
added
117 7.3 to 70.4 27.0
Ivory Park,
Gauteng
1 litre flush, 1 m3
septic tank, 15 20.1 to 44.9 30.3
Warden,
Free State
Conventional flush,
4 m3 septic tank with
sullage
140 11.0 to 135.1 54.4
� Pit latrines
Because the sludge in a septic tank retains more moisture from the inflow of flushing water, despite
continual leaching of liquid from the pit, septic tank studies do not provide a reliable guideline for
estimating the filling rates of dry sanitation systems.
Unlike the case for septic tanks, the literature contains very little data on pit filling rates. Wagner and
Lanoix (1958) used data gathered by the World Health Organisation in the 1950s. They found that
sludge accumulation was approximately 40 litres per person per year. In wet pits and where solid anal
cleansing material was used, they recommended that 60 litres per person per year be allowed for dry
pits, and up to 50% more if large amounts of solid material (grass, stones etc.) are used for anal
cleansing. These figures are still given as guidelines to calculate the life of pits by bodies such as WEDC
and EAWAG (see Franceys et al., 1992 and Heinss et al., 1998), yet the original authors emphasised that
pit filling rates should be developed for each country.
A study commissioned by the Water Research Commission (Norris, 2000) estimated the accumulation
of sludge in pit latrines at 24 litres per capita annum. The study was carried out in Soshanguve in
Gauteng. At this rate a family of 6 would accumulate 144 litres per annum, and hence a 2.5 m3 pit
would last approximately 17 years.
In 2009 the WRC published the research report Basic Sanitation services in South Africa: Learning from
the past, planning for the future (Still et al., 2009). This report refers to the work by Norris and includes
new data from a number of other field studies, which is reproduced in Table 3.3.
TACKLING THE CHALLENGES OF FULL PIT LATRINES Volume 2: How fast do pit toilets fill up?
A scientific understanding of sludge build up and accumulation in pit latrines 17
Water Research Commission July 2012
Table 3.3 Observations of pit filling rates (Still, 2009)
Data from Brazil (Franceys et al., 1992) suggests that accumulation rates range from 40 ℓ/c.a where
water was used for anal cleansing in a pit which is above the water table, to 90 ℓ/c.a where solid anal
cleansing material is used and where the groundwater penetrates the pit. Shrestha et al. (2005)
described a double vault urine diversion system (i.e. no urine entering the vault) with a 0.5 m3 bucket
filled every 6-7 months by 6 family members – a filling rate of 150 ℓ/c.a. This rate of filling is likely to be
higher than for a pit latrine due to the lack of drainage and the addition of materials such as sand and
ash. Brouckaert et al. (2005) suggested that drying of faeces in the filling phase of a double vault UD
only takes place at the surface. Filling rates would be equivalent to the faeces produced per capita per
annum less the loss of gases through decomposition.
3.2 New observations of pit filling rates
Further analysis was done of the data from the Besters Camp study conducted by Durban Corporation
during the 1990s and the Mbazwana study conducted by Partners in Development more recently and
new field studies have been conducted in a number of villages in Limpopo province and KwaZulu-Natal.
3.2.1 Besters Camp, 1995 (City of Durban)
Besters Camp is a peri-urban settlement in what is now the eThekwini Metropolitan Municipality. VIPs
in the area studied were built between September 1991 and October 1992. The pits in the survey
ranged from 2.55 to 3.82 m3 in volume. The depth of the sludge below the pedestal was measured in
Location
Reference
Age of
latrines
Number of
sites
monitored
Number
of visits
Avg. pit
volume
m3
Range of
filling rates
observed
ℓ/c.a
Mean
filling
rate
ℓ/c.a
Soshanguve
WRC Report
approx 3
years
11
14 over
28
months
1.96
13.1 to 34.0
24.1
Bester’s Camp
City of
Durban
four
years
159
2 or 3
over 25
months
3.16
18.3 to
120.5
69.4
Mbila
New data
approx 5
years
11
1
2.83
10.0 to 33.2
18.5
Gaborone,
Dar es Salaam
WHO Paper,
1982
not
stated
not stated
Not
stated
not stated
25 to 30
27.5
(implied)
Mbazwana New data 11 years 19 1 3.40 14 to 123 29
(median)
Inadi New data 11 years 25 1 2.00 14 to 77 34
(median)
TACKLING THE CHALLENGES OF FULL PIT LATRINES Volume 2: How fast do pit toilets fill up?
A scientific understanding of sludge build up and accumulation in pit latrines 18
Water Research Commission July 2012
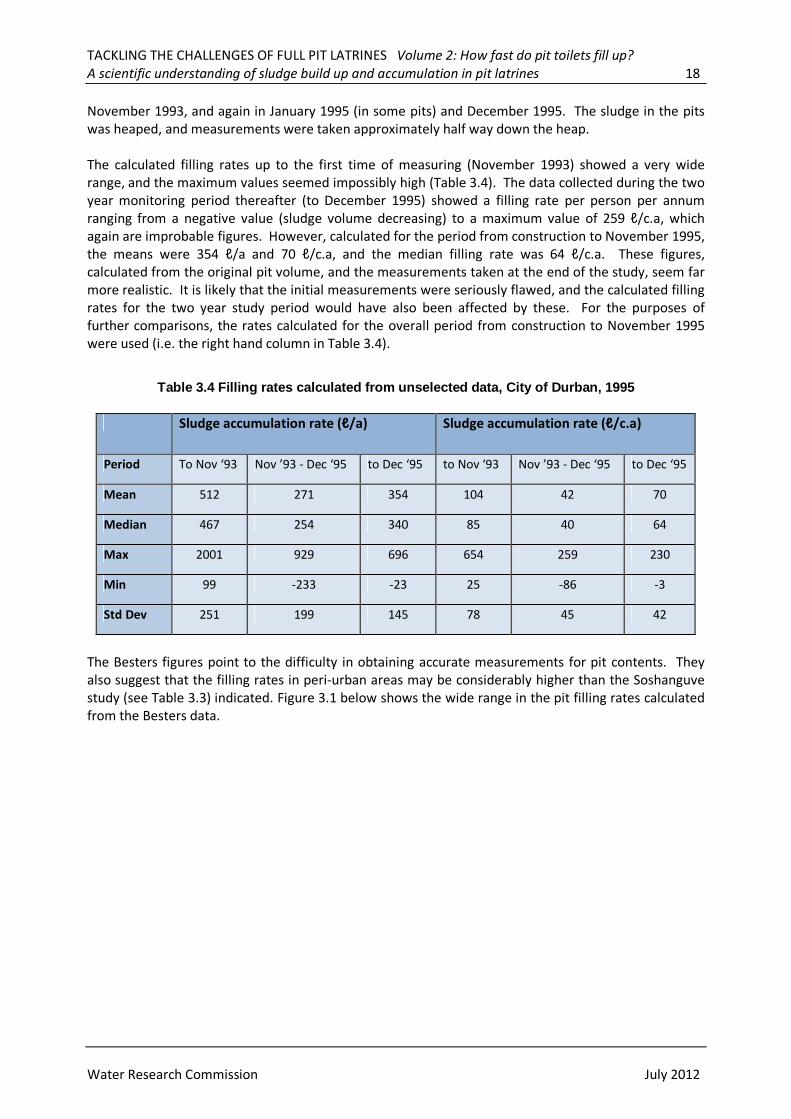
November 1993, and again in January 1995 (in some pits) and December 1995. The sludge in the pits
was heaped, and measurements were taken approximately half way down the heap.
The calculated filling rates up to the first time of measuring (November 1993) showed a very wide
range, and the maximum values seemed impossibly high (Table 3.4). The data collected during the two
year monitoring period thereafter (to December 1995) showed a filling rate per person per annum
ranging from a negative value (sludge volume decreasing) to a maximum value of 259 ℓ/c.a, which
again are improbable figures. However, calculated for the period from construction to November 1995,
the means were 354 ℓ/a and 70 ℓ/c.a, and the median filling rate was 64 ℓ/c.a. These figures,
calculated from the original pit volume, and the measurements taken at the end of the study, seem far
more realistic. It is likely that the initial measurements were seriously flawed, and the calculated filling
rates for the two year study period would have also been affected by these. For the purposes of
further comparisons, the rates calculated for the overall period from construction to November 1995
were used (i.e. the right hand column in Table 3.4).
Table 3.4 Filling rates calculated from unselected data, City of Durban, 1995


![Kalispell Ordinance No. 1745 › aviation › docs › Kalispell-Ordinance-1745.pdf11111111111111111 IIIII 1111111111111111111111111111111111111111 lllll lllll 111111111111111111 !:::;}]?!os](https://static.documents.pub/doc/80x56/5f213ebb2e287b5f527962c7/kalispell-ordinance-no-1745-a-aviation-a-docs-a-kalispell-ordinance-1745pdf.jpg)


