132
COSTAB and Financial and Economic Analysis Training Course 2. – 6. December 2012

COSTAB and Financial and Economic Analysis Training Course 2. – 6. December 2012
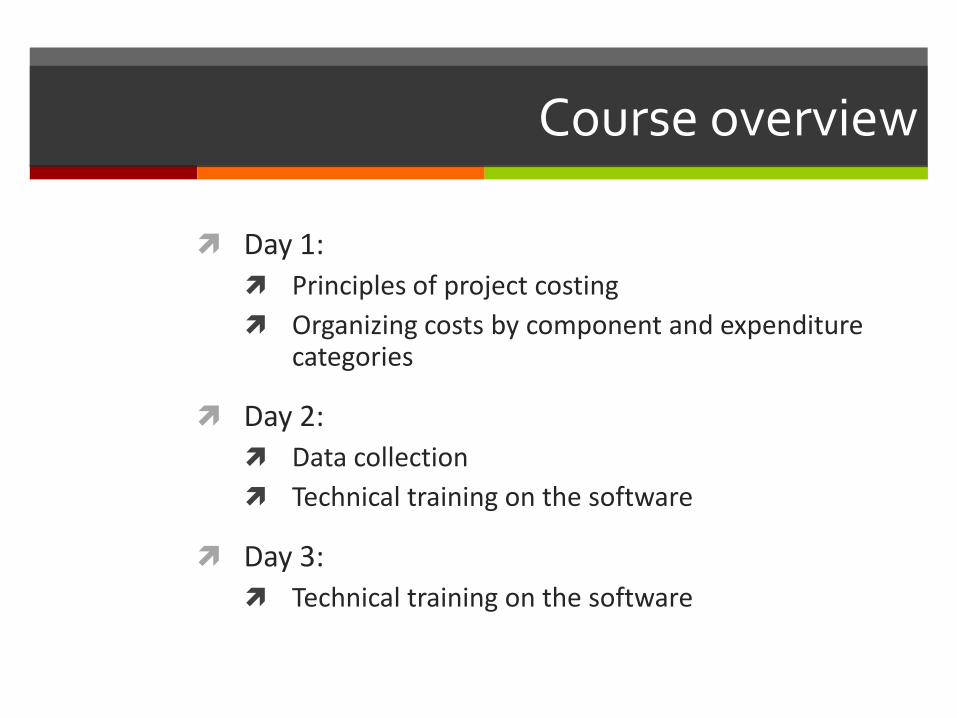
Course overview
Day 1:
Principles of project costing
Organizing costs by component and expenditure categories
Day 2:
Data collection
Technical training on the software
Day 3:
Technical training on the software
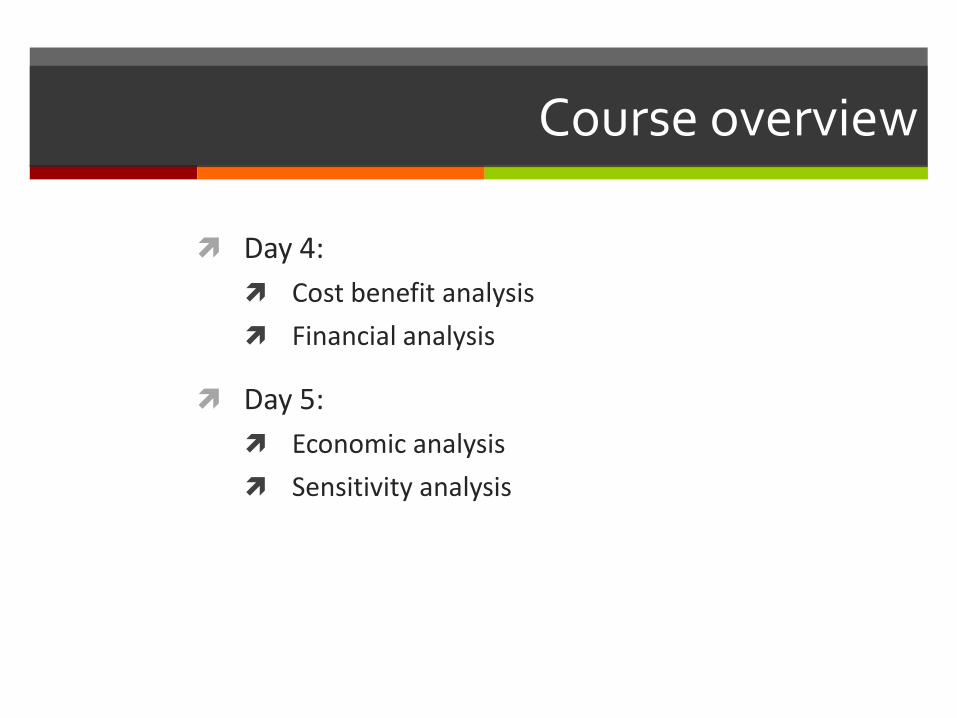
Course overview
Day 4:
Cost benefit analysis
Financial analysis
Day 5:
Economic analysis
Sensitivity analysis

Project costing
Why project costing?
Finding the sum of all incremental financial costs that a project incurs during its lifetime
But: Not an isolated activity
Costing is an important part of project design
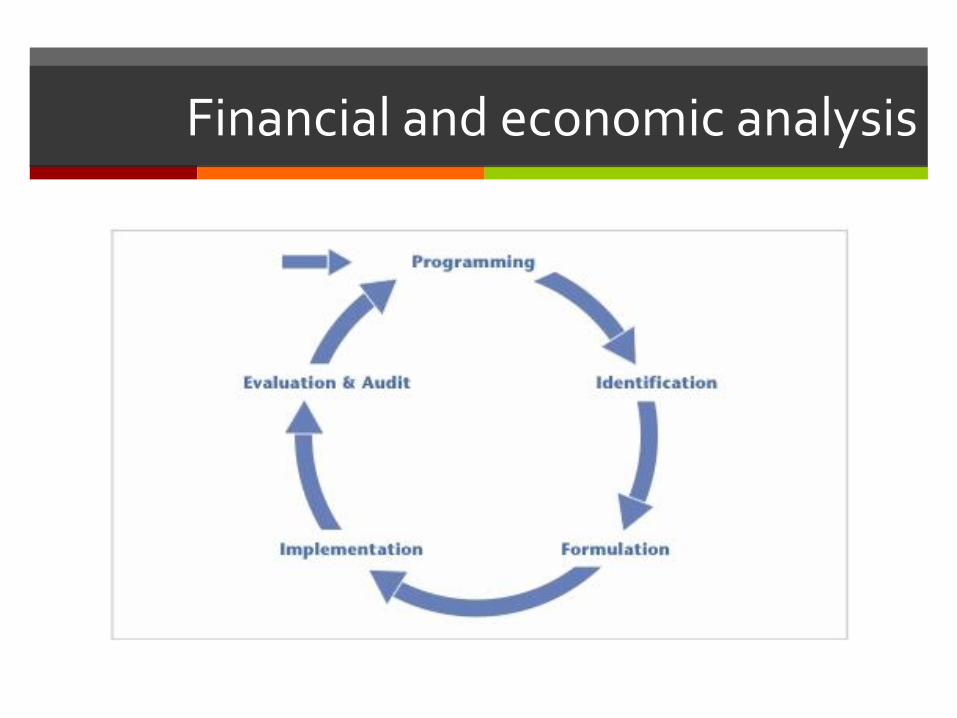
Project costs and project cycle
Moving from one stage of planning to the next
Costs indicate feasibility
Costs vet design refinements

Project cycle and costing
Identification
Preparation
Appraisal Negotiations
Implementation and supervision
Project cycle and costing
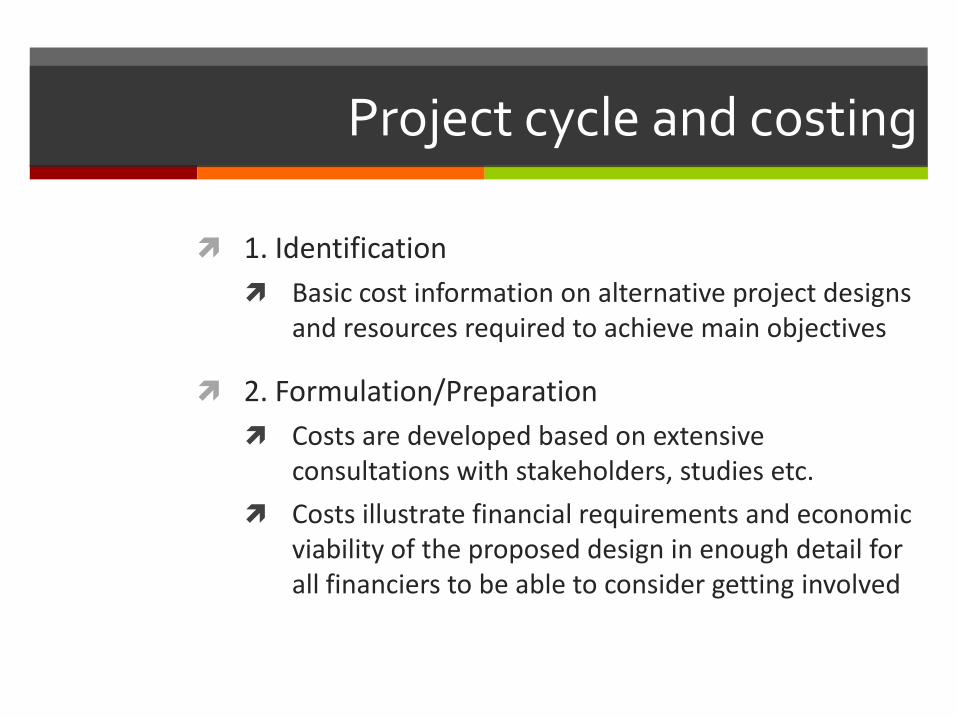
1. Identification
Basic cost information on alternative project designs and resources required to achieve main objectives
2. Formulation/Preparation
Costs are developed based on extensive consultations with stakeholders, studies etc.
Costs illustrate financial requirements and economic viability of the proposed design in enough detail for all financiers to be able to consider getting involved

Project cycle and costing
3. Appraisal The costs from preparation are reviewed to take into
consideration any design changes and any specific requirements from financiers
A financing plan is developed, disbursements are scheduled, procurement methods are decided on etc.
Costs can now be used for project implementation
4. Negotiations Borrower and financiers agree on terms of project financing.
They assess whether the resources included in the design will contribute to the project’s objectives, and they agree on what resources will be sourced from where.
The project costs become basis for legal agreement and must therefore be consistent throughout
Project cycle and costing
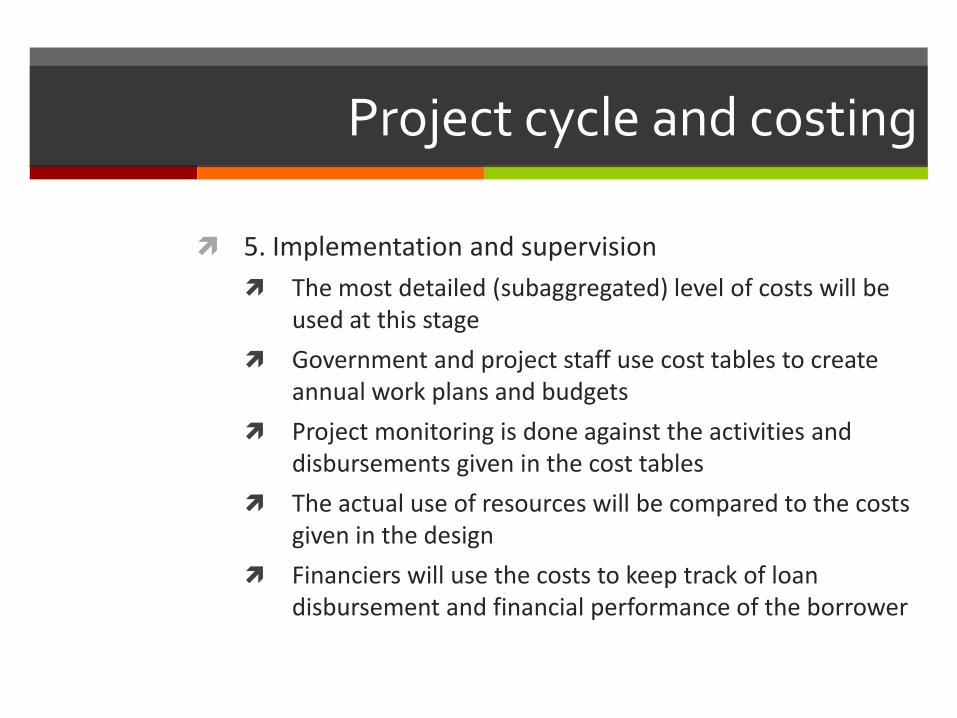
5. Implementation and supervision
The most detailed (subaggregated) level of costs will be used at this stage
Government and project staff use cost tables to create annual work plans and budgets
Project monitoring is done against the activities and disbursements given in the cost tables
The actual use of resources will be compared to the costs given in the design
Financiers will use the costs to keep track of loan disbursement and financial performance of the borrower

Getting involved in costing
I am not an economist, why does this matter to me?

Getting involved in costing
Costing should never be left to the economist/financial analyst alone
Each expert in the design team (agronomist, forester, livestock, business specialist) will have knowledge on the best design and the cost of these in his field
Government and project staff can provide information from their own ministries and departments, and from other ongoing or recent projects
If costing is done separately from the design process and without the input of the team, the result may be a poorly designed project where resources do not match the activities and stated objectives of the project
Organizing project costs
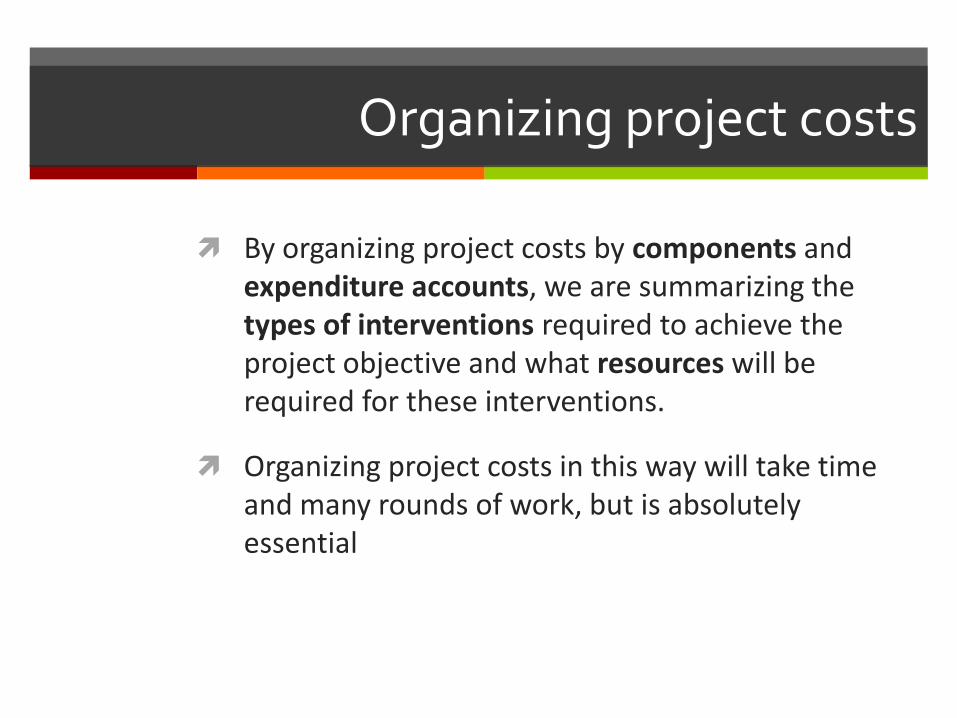
By organizing project costs by components and expenditure accounts, we are summarizing the types of interventions required to achieve the project objective and what resources will be required for these interventions.
Organizing project costs in this way will take time and many rounds of work, but is absolutely essential
Organizing project costs
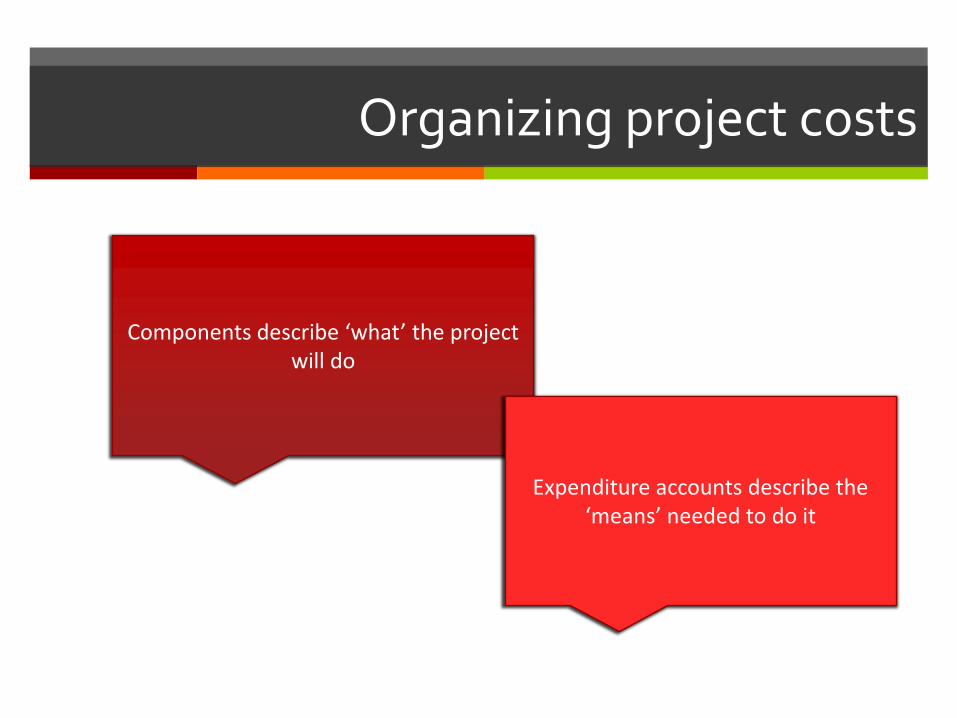
Components describe ‘what’ the project
will do
Expenditure accounts describe the ‘means’ needed to do it
Components
Components
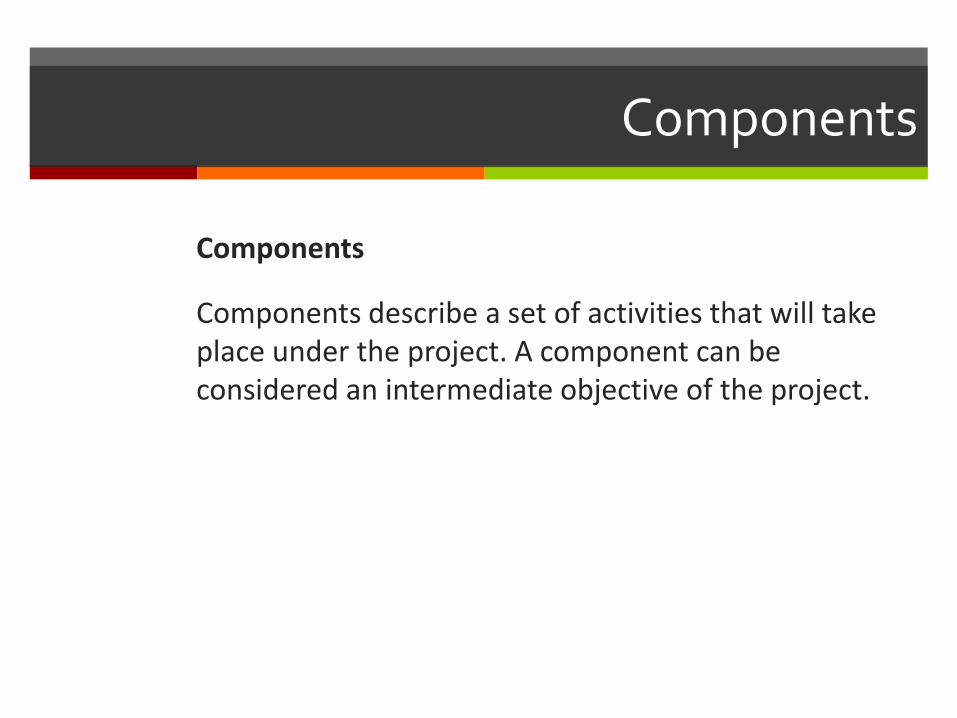
Components describe a set of activities that will take place under the project. A component can be considered an intermediate objective of the project.

Components
Component 1:
Improved agricultural technology
This component may include the introduction of new technology and/or training of farmers in using new techniques/technology. Costs may include a team
developing or installing this technology, the cost of a trainer for the farmers, inputs used in the training
course etc.

Components
The assumption is that when these resources are used as described, the technology will be promoted and used.
Further, it is assumed that when this component and its objective is fulfilled, it will contribute to the overall objective of the project. This could be “Decreased poverty in the X region of Bangladesh”.
The components will be used to evaluate the success or failure of the project upon its completion

Expenditure accounts
Expenditure accounts are used to describe what resources the project will require.
They are divided into investment costs and recurrent costs.
Investment costs are any one time investments, in civil works, machinery, training, consultancies etc.
Recurrent costs are associated with the regular operations of the project, and include staff salaries, operations and maintenance costs etc.

Expenditure accounts
The number and types of expenditure accounts vary between projects, and from financier to financier
Some expenditure accounts are however standard in most projects:

Expenditure accounts
Investments costs
Civil Works (can be split into construction, and design and supervision)
Vehicles
Equipment and machinery
Training
Specialist services (often called technical assistance)

Expenditure accounts
Recurrent costs
Incremental salaries
Operations and maintenance
Other
Expenditure accounts
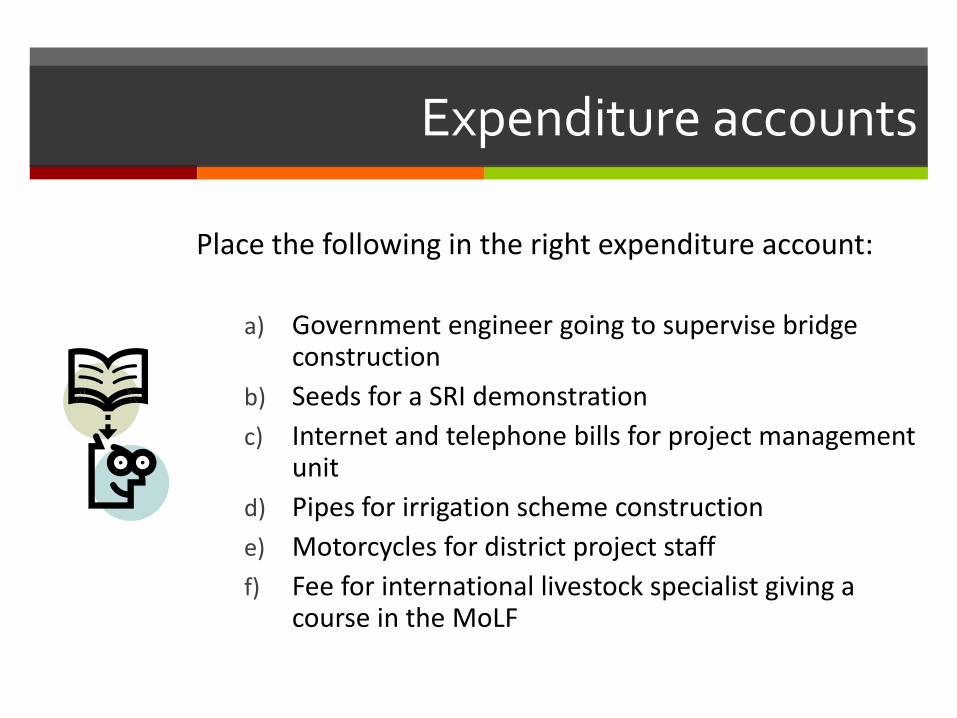
Place the following in the right expenditure account:
a) Government engineer going to supervise bridge construction
b) Seeds for a SRI demonstration
c) Internet and telephone bills for project management unit
d) Pipes for irrigation scheme construction
e) Motorcycles for district project staff
f) Fee for international livestock specialist giving a course in the MoLF
Components and expenditure accounts
Think about the most recent project you worked on.
Note down which components and subcomponents the project had
Which expenditure accounts do you think were used in each of these components?

Component-expenditure matrix
Resources Improved crop diversification
Access to health and sanitation
Improved project management
INVESTMENT COSTS
Civil works - Yes -
Equipment Yes - Yes
Training Yes - Yes
Specialist services Yes Yes Yes
RECURRENT
Operations and maintenance
Yes Yes Yes

Financing plan
The financing plan gives the sources (financiers) and uses (disbursement categories) for the project
Financiers are the 1) international financiers (IFIs, international NGOs, private sector, bilateral donors), 2) domestic financiers (central and local government, beneficiaries, local banks, NGOs etc)

Financing plan
Kingdom of Cambodia
Project for Agricultural Development and Economic Empow erment
Disbursement Accounts by Financiers
(US$ '000)
SNV FAO iDE IFAD GRANT IFAD LOAN Beneficiaries Total
Amount % Amount % Amount % Amount % Amount % Amount % Amount % Amount %
A. Vehicles & machinery
1. Cars - - - - - - - - - - - - 304.7 100.0 304.7 0.7
2. Motorcycles - - - - - - - - - - - - 721.8 100.0 721.8 1.7
Subtotal - - - - - - - - - - - - 1,026.5 100.0 1,026.5 2.4
B. Equipment - - - - - - - - 295.0 28.6 - - 736.1 71.4 1,031.1 2.4
C. Technical assistance - - - - - - 3,027.5 92.2 - - - - 255.4 7.8 3,282.9 7.6
D. Training - - - - - - 6,486.3 90.0 - - - - 720.7 10.0 7,207.0 16.7
E. Consulting services & studies - - - - - - 2,678.6 90.0 - - - - 297.6 10.0 2,976.3 6.9
F. Group Conditional Capital
Transfer Scheme - - - - - - - - 11,857.2 100.0 - - - - 11,857.2 27.4
G. Operating costs - - - - - - 2,145.7 43.2 1,649.4 33.2 - - 1,174.1 23.6 4,969.2 11.5
H. Priority Operating Costs - - - - - - - - 960.5 100.0 - - - - 960.5 2.2
I. Rural Business Stimulus
Facility - - - - - - - - 225.0 25.0 675.0 75.0 - - 900.0 2.1
J. FAO Implemented activities - - 313.3 10.7 - - 748.4 25.7 867.8 29.8 918.8 31.5 67.1 2.3 2,915.5 6.7
K. SNV implemented activities 668.5 15.4 - - - - 1,276.5 29.4 1,557.6 35.9 600.0 13.8 234.7 5.4 4,337.3 10.0
L. iDE implemented activties - - - - 378.5 21.3 1,136.8 63.8 87.6 4.9 - - 178.1 10.0 1,781.0 4.1
Total PROJECT COSTS 668.5 1.5 313.3 0.7 378.5 0.9 17,500.0 40.5 17,500.1 40.5 2,193.8 5.1 4,690.3 10.8 43,244.5 100.0

Disbursement accounts
Disbursement accounts are categories of expenses, “what is being bought and who is paying for it”
They allow for aggregating expenditures into broader categories (combining technical assistance and training, for example) or:
They allow for greater differentiation within a category (separating staff training and beneficiary training)

Disbursement accounts
Disbursement categories should be kept to a minimum to make accounting easier
Disbursement accounts are assigned to each type of expenditure and percentages agreed for each financier (financing rules)
It is recommended to start with:
Civil works
Equipment
Consulting services
Recurrent costs
Disbursement accounts and financing
Which expenditures are going to be financed by which financier depends on the agreement the financing institution has with the borrowing government
Some financing institutions have types of expenditures they prefer to cover, and other expenditures that they are not authorized to lend funds for
In your experience, which project expenditures are covered by the government if you have a donor funded project? Which are covered by the financing institution?

Procurement
Describe how items are purchased
Clear procurement arrangements are essential to good project implementation
Procurement arrangements are set out in advance, and follow the guidelines of the government and financing institutions.
Procurement
What is the purpose of procurement arrangements?
Economy and efficiency
Equal opportunity for qualified firms to compete in providing goods and services
Incentive for the development of local contractors and manufacturers in the borrowing country
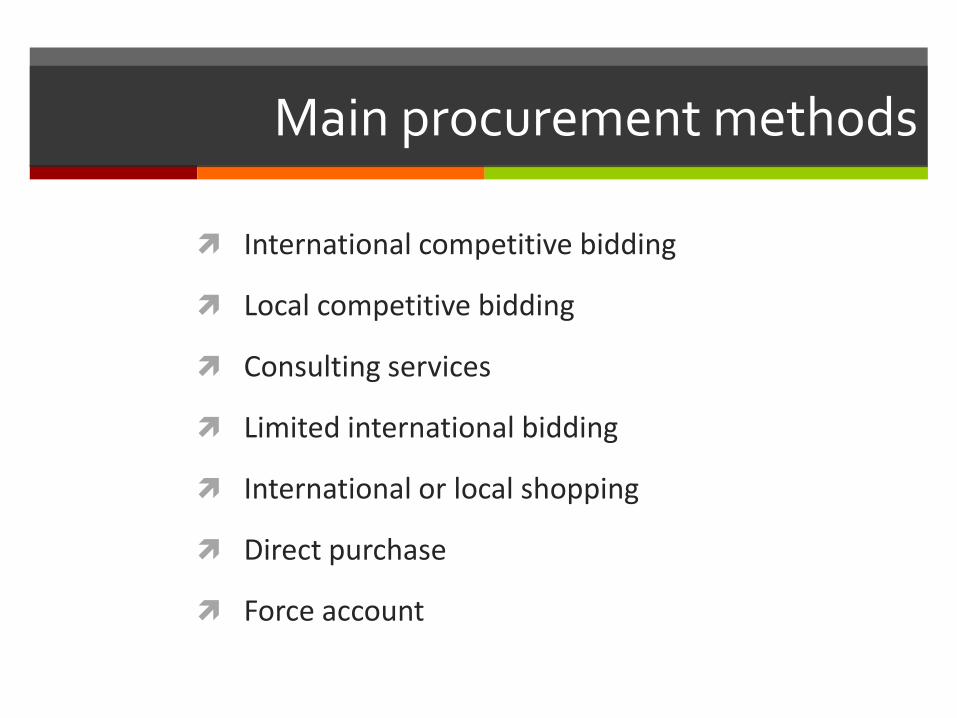
Main procurement methods
International competitive bidding
Local competitive bidding
Consulting services
Limited international bidding
International or local shopping
Direct purchase
Force account
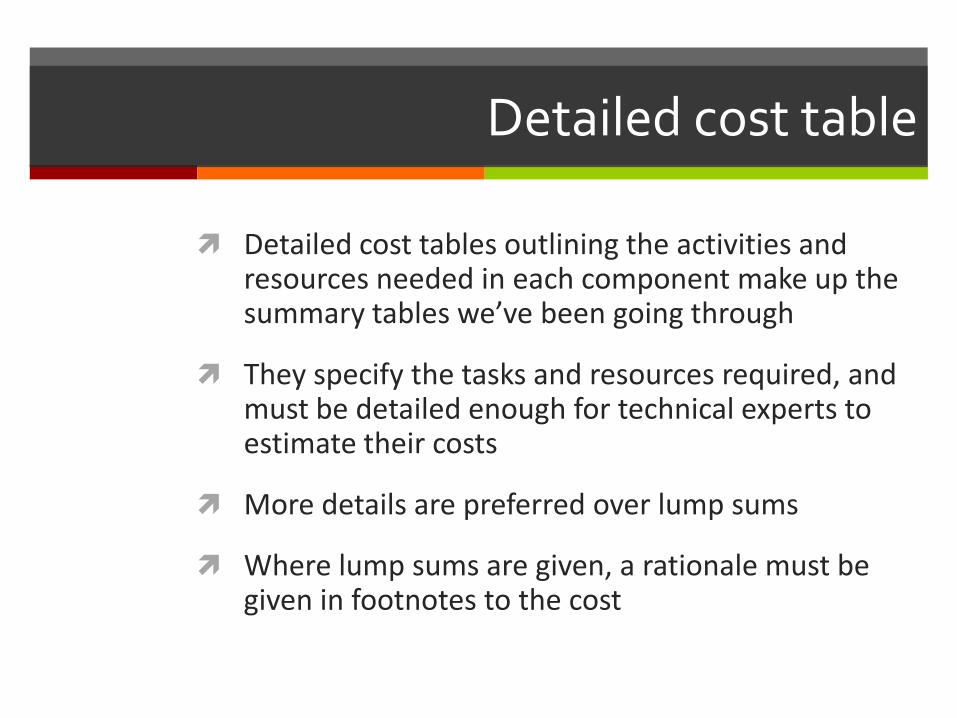
Detailed cost table
Detailed cost tables outlining the activities and resources needed in each component make up the summary tables we’ve been going through
They specify the tasks and resources required, and must be detailed enough for technical experts to estimate their costs
More details are preferred over lump sums
Where lump sums are given, a rationale must be given in footnotes to the cost
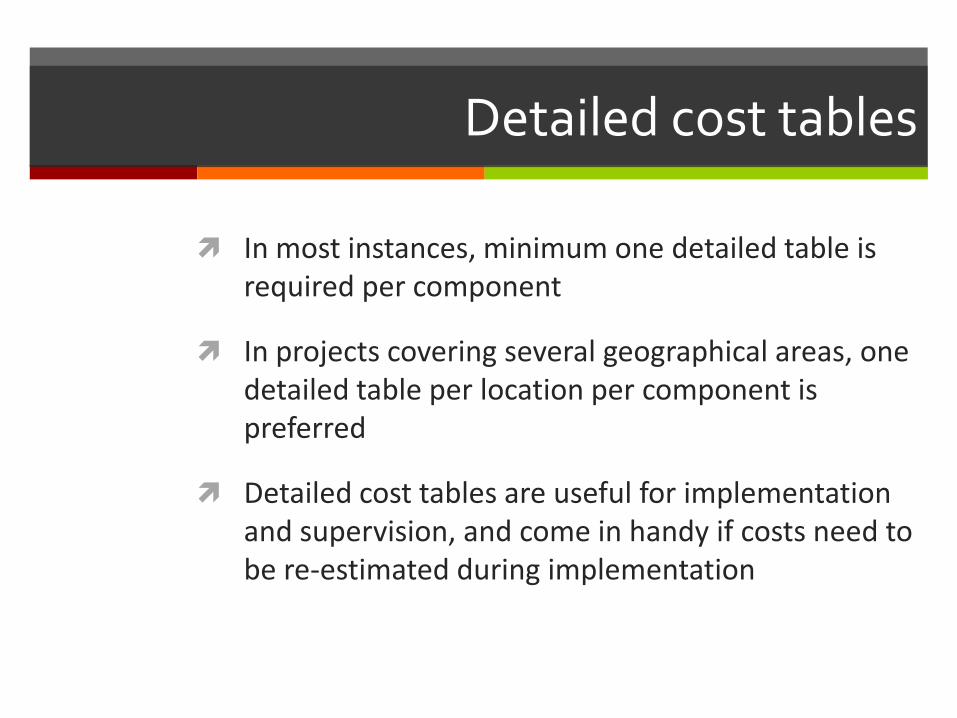
Detailed cost tables
In most instances, minimum one detailed table is required per component
In projects covering several geographical areas, one detailed table per location per component is preferred
Detailed cost tables are useful for implementation and supervision, and come in handy if costs need to be re-estimated during implementation

Structuring detailed cost tables
Detailed costs are best listed from most to least durable, with investment costs given before recurrent costs
Detailed cost tales include the unit, quantities, unit cost and base costs over the life of the project
Some costs may be given as lump sums, such as ‘office equipment’
They may also include physical contingencies, foreign exchange and tax rates

Exercise
Explain what is meant by disbursement accounts, procurement accounts and expenditure accounts. How are they linked?
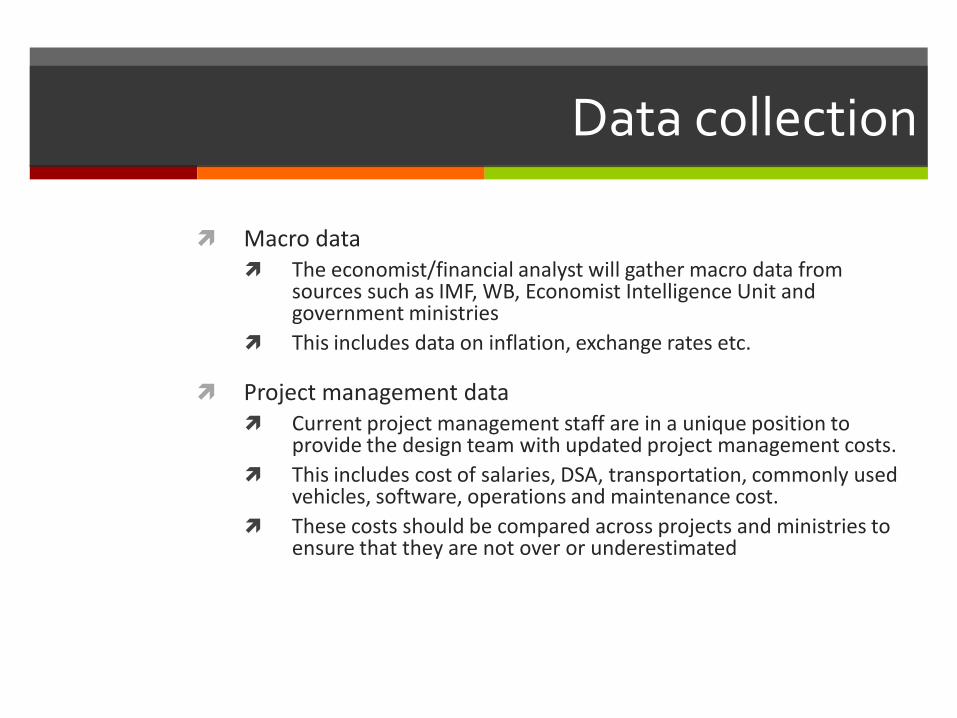
Data collection
Macro data The economist/financial analyst will gather macro data from
sources such as IMF, WB, Economist Intelligence Unit and government ministries
This includes data on inflation, exchange rates etc.
Project management data Current project management staff are in a unique position to
provide the design team with updated project management costs.
This includes cost of salaries, DSA, transportation, commonly used vehicles, software, operations and maintenance cost.
These costs should be compared across projects and ministries to ensure that they are not over or underestimated
Data collection
Project activities data
For these costs, the economist/financial analyst will rely a great deal on the specialists in the team.
The engineer will help provide data on costs of civil works construction through consulting with government staff or private companies
The agronomist/forester/livestock expert will provide data on the technologies, inputs or trainings being provided through the project

Data collection
Once these costs have been organized and verified, the economist/financial expert must determine the amount of foreign exchange and the tax percentage included in each of the unit costs. We will discuss why later.
He/she uses a combination of information from current or recent projects, information from project management staff, and information from relevant ministries to get this information.

Data collection
In sum, cost information must be:
Well organized
From reliable sources and routinely verified
Realistic (neither under or overestimated)
Gathered and used through a multi-disciplinary effort
Inclusive of foreign exchange percentage
Inclusive of tax percentage
Types of project costs
Investment costs represent the costs of goods and services that will generate benefits over many years
Recurrent costs represent the costs of goods and services required to produce benefits within a single year. They usually represent the level of cost that the borrower will need to fund after the project is completed.
Financial charges incurred during construction, i.e. interest payments
Local vs. foreign currency
All costs are expressed in both local currency and foreign currency (usually US dollars)
It is customary to collect and present costs in local currency first
Financiers will review the costs in the currency of their reserves, hence the two currency system
Local vs. foreign costs
Local costs are all costs paid for with local currency, meaning local goods and services
Foreign costs include imported goods and services – directly imported or local goods with imported components.
When COSTAB asks you to define % foreign exchange, it wants to know how much of the price will remain outside of the country, not the currency used to buy the good

Duties and taxes
Duties and taxes should be included in the cost estimated
These duties and taxes will in most cases have to be paid, and excluding them would mean underestimating the funding needed for the project
The duty or tax rate applicable to each type of good should be explicitly stated in the cost tables

Changes in project costs
Base costs are our best estimate of project costs at a specific date
Project costs during implementation are going to be different than the costs estimated at project preparation
To account for this, we include price and physical contingency estimates on top of the base costs, usually as a percentage of base costs

Changes in project costs
Take some time to consider reasons why project costs might change over time. You can use examples from projects you’ve worked on.
What do you think are reasonable allowances to be made for such changes?

Price contingencies
Allowances for price contingencies means expecting an increase in unit prices.
This includes the impact of expected inflation and changes in the exchange rate over time
There is usually a big difference between domestic and international inflation rates, so you will need estimates for both rates over time
Price contingencies
Forecasts for domestic inflation rates can be obtained from the Ministry of Finance or the Central Bank. These may be overly optimistic, so contrast them with estimates from WB, IMF, EIU
Forecasts for international inflation rates can be obtained from the World Bank’s MUV index, the “manufacturer’s unit value index”. Data from the UNDP, UNIDO and FAO can also be used.

Price contingencies
Some goods have different inflation rates from the economy as a whole. If the difference is significant, establish a local inflation rate for these goods in your COSTAB.
Information on exchange rate forecasts can also be obtained from MoF and Central Bank. Again, it is recommended to contrast these with information from WB, IMF or EIU to get the most accurate forecast.
Physical contingencies
Allowances for physical contingencies reflect expected increases in costs due to changes in quantities or methods of implementation
Calculated and expressed as percentage of base cost
What are potential sources of uncertainty?

Sources of uncertainty
Type of terrain (difficult)
Climatic conditions
Poor access to work site
Amount of field work necessary
Status and quality of design work
Precision during cost estimates

Sources of uncertainty (cont’d)
Quality of supervision
Possible design changes, addition of new items
Poor specification of material/equipment needs
Off the shelf or special order purchase
The extent to which the services of the project can be accurately and fully defined in advance will vary
Physical contingencies
Normal physical contingency levels for civil works (WB):
5% for standard designs and highly defined works (i.e. roads surfacing, canal lining)
10% for general civil works with predictable uncertainties (i.e. roads, building, pipelines)
15% for processing plants, buildings, major irrigation, works in difficult terrain

Recording costs
Quantity versus value:
It is most common to present base costs as physical quantities of units needed each project year, and the unit cost it can be bought for.
Sometimes, base costs are presented as money values/lump sums. This is usually done when several items are bulked together, or there is a budget ceiling for a program of activities.
Quantity versus lump sum
Quantity basis is the preferred method
Give some examples of when a lump sum would be useful. Use examples from actual projects.

Recording costs – value basis
Ways to record and present value basis costs:
Direct estimates
Functional relationships
Overhead costs
Operations and maintenance costs
Professional fees
Calculated cost patterns
Completion percentages
Phasing
Scaling
Case study
1) Increased crop productivity. The key investment is in new and improved irrigation infrastructure in three project districts.
2) Higher value added fish farming. This includes training on fish farming, and improved transport infrastructure to access central markets.
3) Efficient project management. Setting up, training and running a central PMU.

Using the COSTAB software
COSTAB, although very useful, is not a very flexible tool – and limited edit functions are available
It is recommended that you get all your information organized and verified before entering it into the program
Use Excel or another spreadsheet to detail the costs per component before entering into COSTAB
Using the COSTAB software
Once your team has supplied/reviewed the costs in the spreadsheet, you can enter the information into COSTAB
The program will calculate total project costs including contingencies
It will organize your costs by components, financiers, expenditure categories, disbursement accounts, procurement methods and other categories that the government or financing institutions will require
Using the COSTAB software
COSTAB converts financial costs to economic costs for economic analysis
It stores financial and economic data in Excel spreadsheets that you can link to new spreadsheets for custom calculations
You will find that once all the information has been added and calculated, a few rounds of refinements will be necessary to allocate the funds correctly

Basic information division
The basic information division is where you enter information such as:
project name
country
local currency
project start up year, number of years for the project
exchange rates

Price contingencies division
This section allows you to specify the local and foreign inflation rates that Costab should use to calculate price contingencies
Summary divisions
This division outlines the structure for the project’s components and expenditure accounts (=required resources)
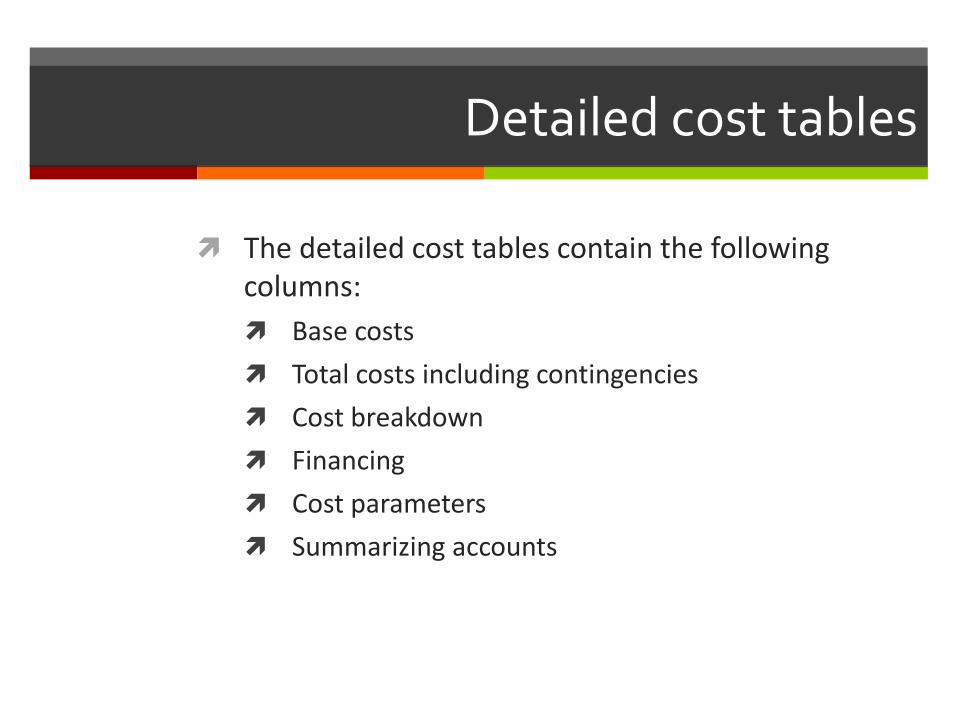
Detailed cost tables
The detailed cost tables contain the following columns:
Base costs
Total costs including contingencies
Cost breakdown
Financing
Cost parameters
Summarizing accounts

Summary Cost Tables
Summary cost tables summarize the costs shown in the detailed tables:
Project cost summaries
Base costs by year
Total costs by year
Cost breakdown
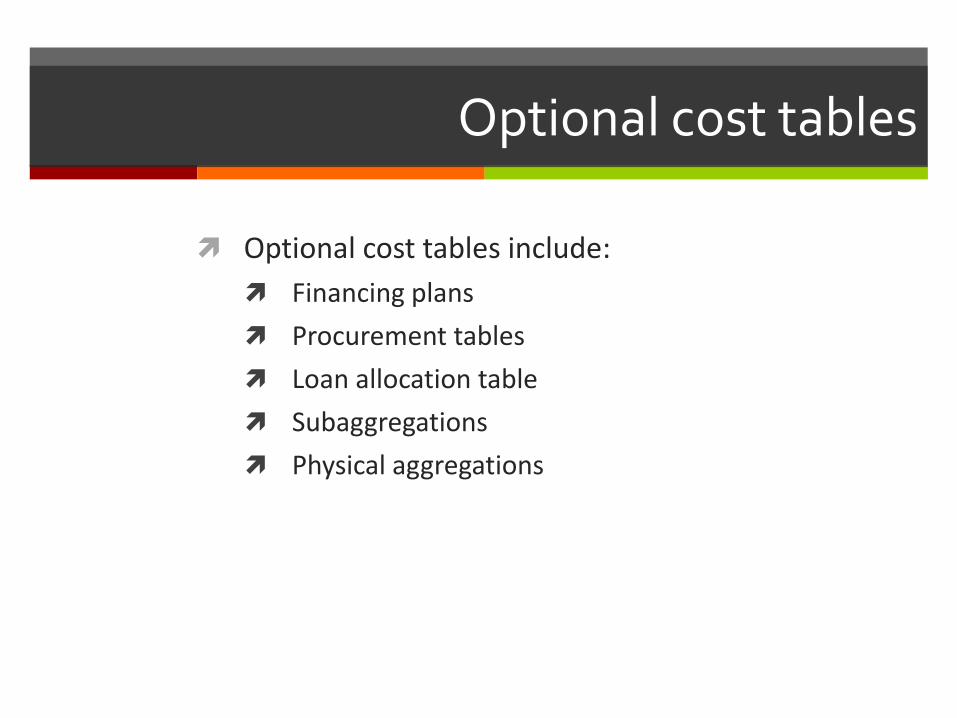
Optional cost tables
Optional cost tables include:
Financing plans
Procurement tables
Loan allocation table
Subaggregations
Physical aggregations

Case Study 1
Dominican Republic “Haina Coal Project”
In this case study, we will learn how summary tables, detailed tables and inflation and exchange rate tables work

Case Study 2
“Bangladesh Business Management Education Project”
This case study will go further and explore the full range of tools available in Costab

REVIEW From financial to economic costs
We need economic costs to carry out economic analysis: assessing the costs and benefits to the economy in the borrowing country as a whole as a result of the project
COSTAB can do this conversion for us, by removing taxes (transfer payments)

Section 2: F&E analysis
An important part of the project cycle and evaluating the soundness of a project (along with other considerations regarding the policy environment, institutional assessments, environmental impact assessments and gender and social concerns)
Financial and economic analyses are the building blocks of a full project cost-benefit analysis

Is economic analysis still relevant?
Developed decades ago
Different development paradigm
Yes, if we use it to assess:
Sustainability
Impacts on various groups in society
Risks
Evaluate environmental externalities
Financial and economic analysis

F&E analysis can help at many stages of the project cycle:
Defining objectives
Quantifying objectives
Quantifying inputs
Quantifying results
Cost-benefit analysis
Why do we do it?
Seeking the most efficient allocation of funds:
How can we get the most benefits/results from a limited amount of funds available for investment
Are the majority of stakeholders better off due to the project?
Is the country as a whole better off due to the project?

Cost-benefit analysis
Choosing the best project given the resources at hand, by comparing:
Combinations of projects
Mutually exclusive projects
Alternative designs for a given project
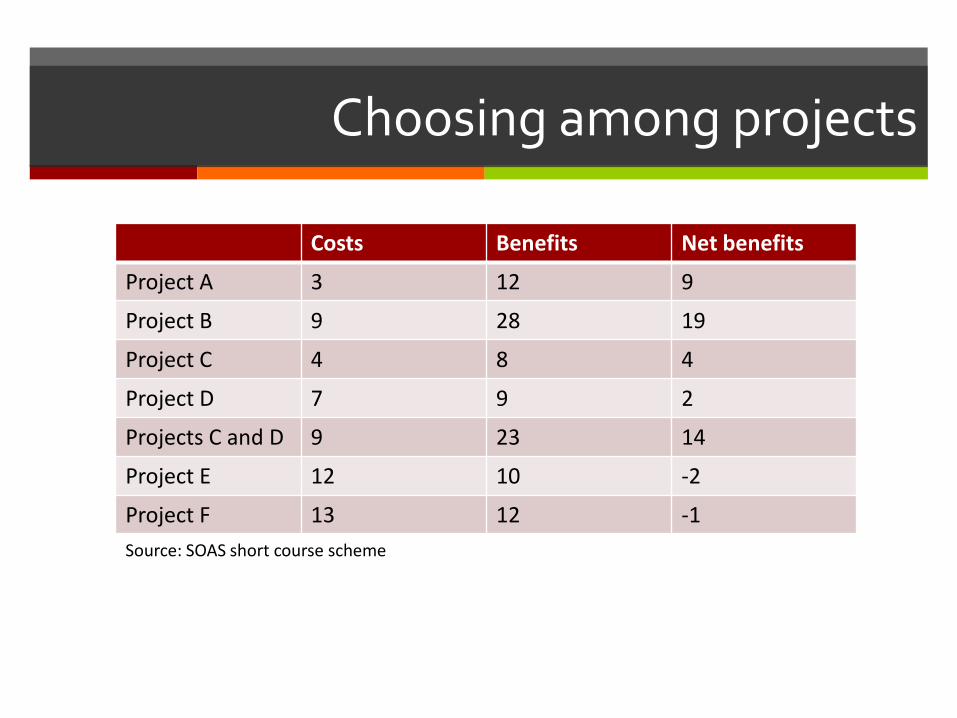
Choosing among projects
Costs Benefits Net benefits
Project A 3 12 9
Project B 9 28 19
Project C 4 8 4
Project D 7 9 2
Projects C and D 9 23 14
Project E 12 10 -2
Project F 13 12 -1
Source: SOAS short course scheme

Cost-benefit analysis
How do we do it?
Put a price/value on all relevant costs and benefits (insofar as possible given time and money constraints)
Discount the net benefits to find a current value for future costs and benefits
Compare the net benefits with the likely scenario without project

With and without project scenarios
When carrying out a cost benefit analysis, we compare the project scenario with the ‘without project’ scenario.
Take some time to consider why we do this, and whether this is different from comparing the situation before and after the project.

With and without project scenarios
A before and after comparison does not take into account any changes in production that would occur without the project and would thus lead to wrong assumptions about the benefits arising from the proposed project
When we compare with and without project scenarios, the difference we get is the incremental net benefit – the value which we will use when deciding whether to go forward with the project or not

With and without project scenarios
Potential without project scenarios:
Slow production increase (project aims to intensify production and thus achieve a greater increase)
Production decline without investment (project aims to prevent decrease in production, or increase it)

Identifying costs and benefits
Benefits:
Contribute to project objective
Costs:
Reduce the project objective

Identifying costs and benefits
We have already identified some costs when preparing our project budget. However, the costs used for financial and economic analyses extend beyond these.
We need to identify the costs at the farm and enterprise levels and aggregate these.
Typically, costs are easier to identify and value than benefits.
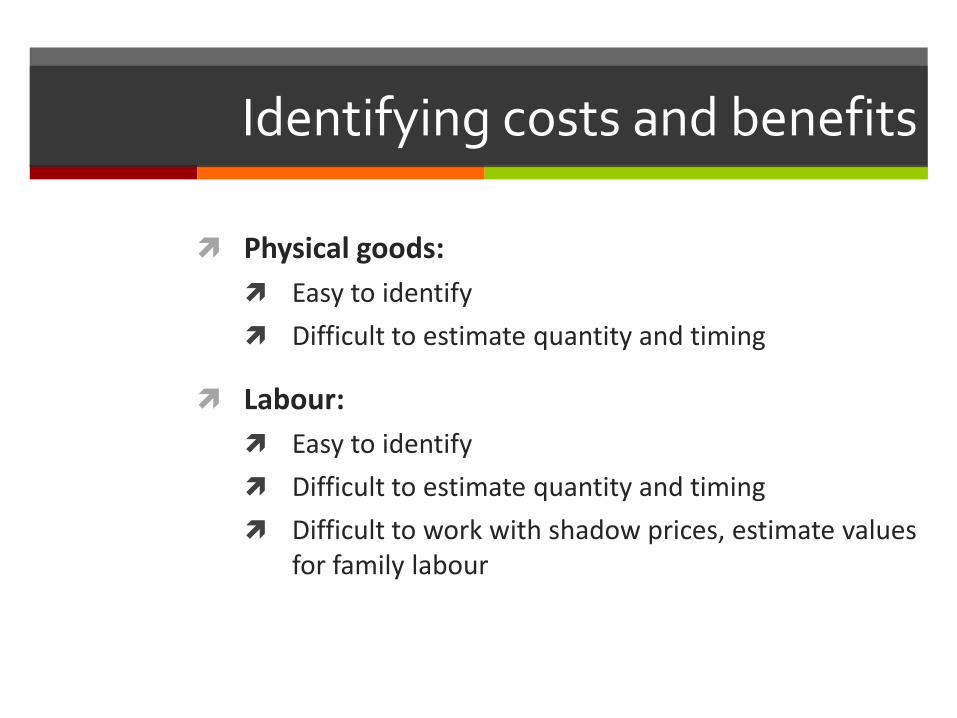
Identifying costs and benefits
Physical goods:
Easy to identify
Difficult to estimate quantity and timing
Labour:
Easy to identify
Difficult to estimate quantity and timing
Difficult to work with shadow prices, estimate values for family labour

Identifying costs and benefits
Land:
Easy to identify
Somewhat difficult to value
Taxes:
Costs in financial analysis
Transfer payments in economic analysis
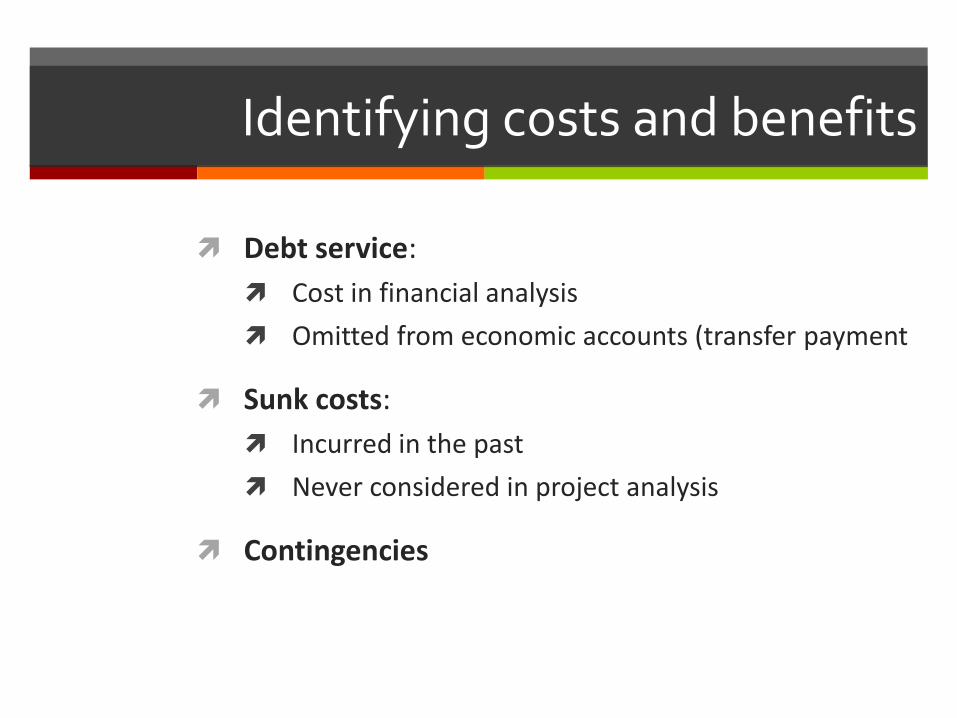
Identifying costs and benefits
Debt service:
Cost in financial analysis
Omitted from economic accounts (transfer payment
Sunk costs:
Incurred in the past
Never considered in project analysis
Contingencies

Identifying costs and benefits
More on types of costs:
Marketable: Goods or services that have a market cost and are sold and bought
Unmarketable: Goods and services that have a cost but not a market (many public goods)

Identifying costs and benefits
Commensurable: Goods and services that can be measured and compared in a common unit, meaning their value can easily be compared
Incommensurable: Goods and services that can not be compared using a common standard, but may be measurable in natural units (i.e. carbon dioxide released)

Identifying costs and benefits
Tangible: Things that are material in nature, meaning they can be touched, observed. Examples include increased yields, or reduced pollution,
Intangible: Goods and services that are not material in nature, and cannot be easily valued – access to services, reduced morbidity, etc.

Identifying costs and benefits
Take some time to consider each of these types of goods/services, and come up with some examples of each. How should we consider these in our analysis?

Identifying costs and benefits
Tangible benefits in agriculture:
Increased production
Quality improvement
Change in time of sale
Change in location of sale
Changes in product form
Cost reduction through mechanization
Reduced transport cost
Losses avoided
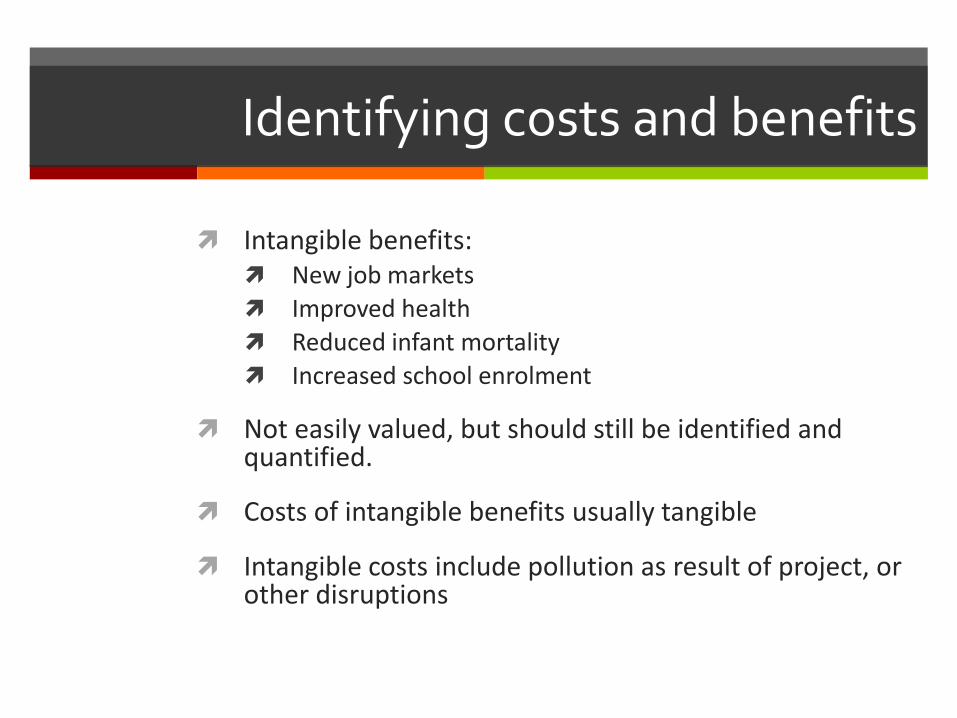
Identifying costs and benefits
Intangible benefits: New job markets
Improved health
Reduced infant mortality
Increased school enrolment
Not easily valued, but should still be identified and quantified.
Costs of intangible benefits usually tangible
Intangible costs include pollution as result of project, or other disruptions

Project scope
Who or what do we take into consideration when we look at the impact or effects of a project? Where do we draw the line?
Does this differ between public and private projects?

Market prices vs. farm gate prices
Market prices are those obtained for produce at local or central markets, and are often easy to collect. They do not necessarily reflect the value of the product to the farmer.
The farm gate price of a product is the price the farmer receives or pays at the boundary of his own farm. This is the first point of sale for outputs, and no transportation or marketing costs are included in the price. Farm gate prices are thus ideal for use in valuing home consumed production.
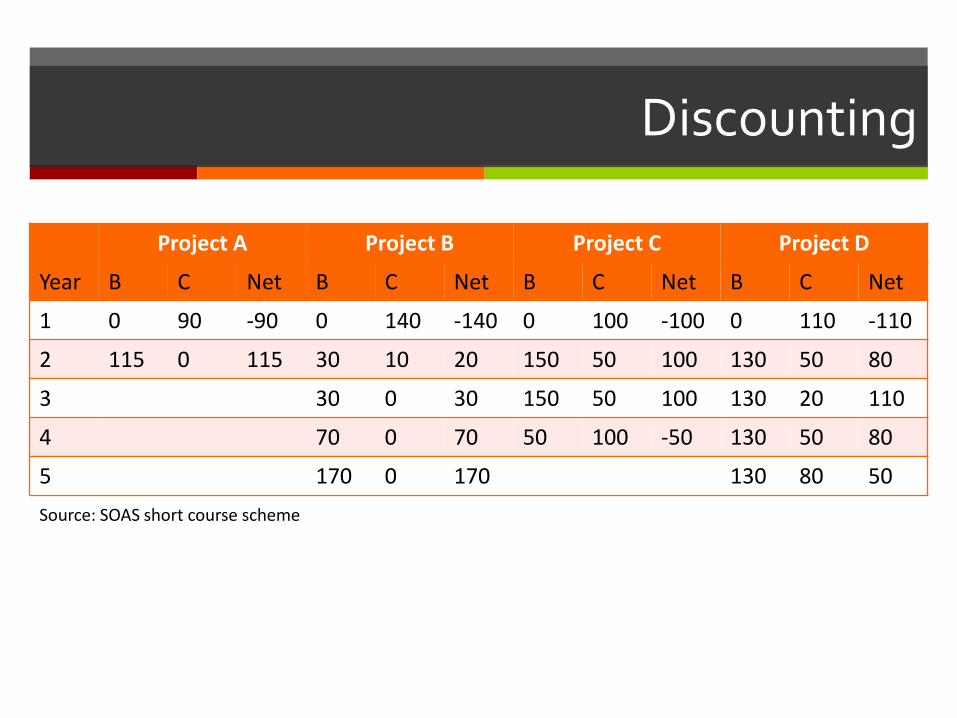
Discounting
Project A Project B Project C Project D
Year B C Net B C Net B C Net B C Net
1 0 90 -90 0 140 -140 0 100 -100 0 110 -110
2 115 0 115 30 10 20 150 50 100 130 50 80
3 30 0 30 150 50 100 130 20 110
4 70 0 70 50 100 -50 130 50 80
5 170 0 170 130 80 50
Source: SOAS short course scheme

Discounting
Cost and benefits flows need to be comparable in order for us to choose between projects
Knowing when costs and benefits occur can be as important as knowing the size of these costs and benefits.
Cost and benefit streams occurring in the future are therefore discounted
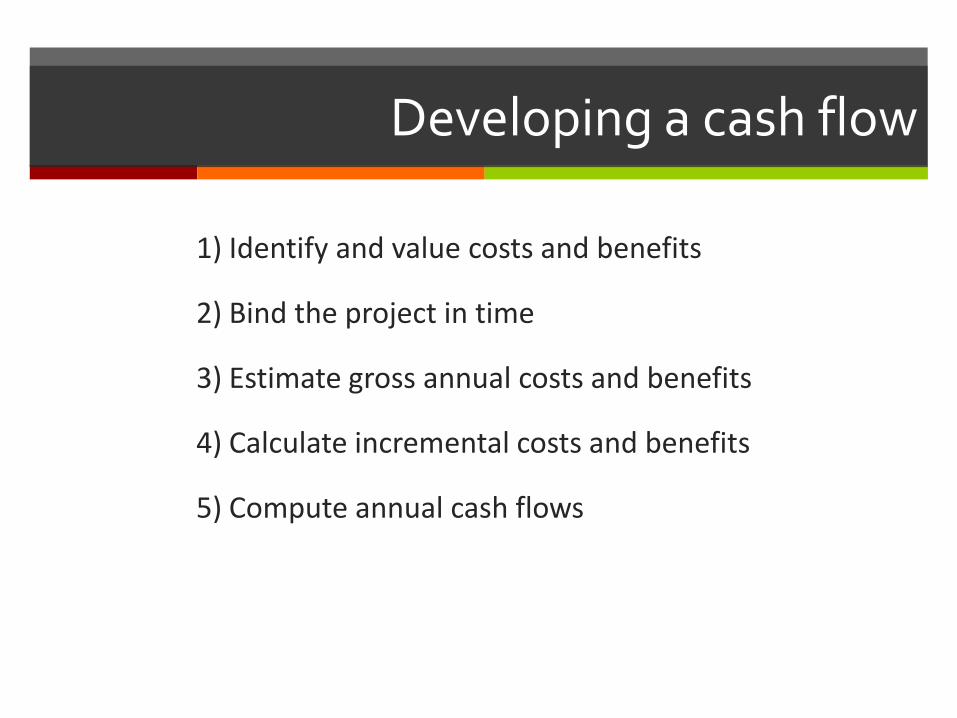
Developing a cash flow
1) Identify and value costs and benefits
2) Bind the project in time
3) Estimate gross annual costs and benefits
4) Calculate incremental costs and benefits
5) Compute annual cash flows

Choosing a discount rate
Financial analysis: Minimum the cost of borrowed funds
Economic analysis: Opportunity cost of capital, i.e. the cost of committing investment funds to a new project
IFI norm: 12%
NB: High discount rates biased towards projects with low initial cost, early benefits

Project criteria
Either of the below criteria should give the same project decision when the same information is used
Benefit-cost ratio (BCR):
Accept projects with a ratio of one or greater when costs and benefits are discounted at the opportunity cost of capital
Drawback: Netting out of costs and benefits must be done in exactly the same way for each project design being compared
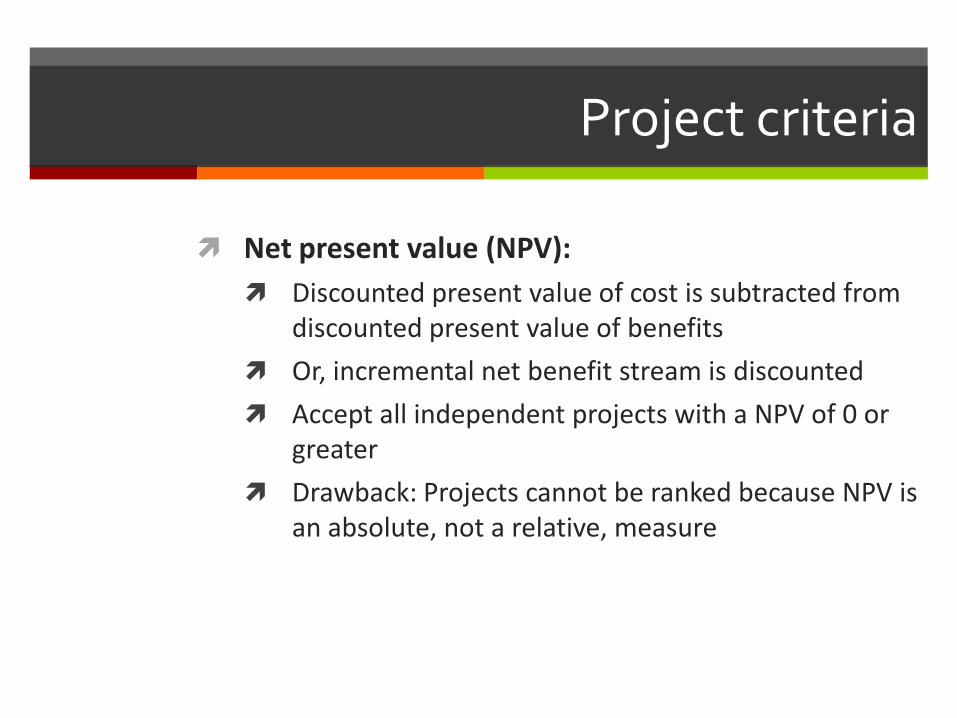
Project criteria
Net present value (NPV):
Discounted present value of cost is subtracted from discounted present value of benefits
Or, incremental net benefit stream is discounted
Accept all independent projects with a NPV of 0 or greater
Drawback: Projects cannot be ranked because NPV is an absolute, not a relative, measure
Project criteria
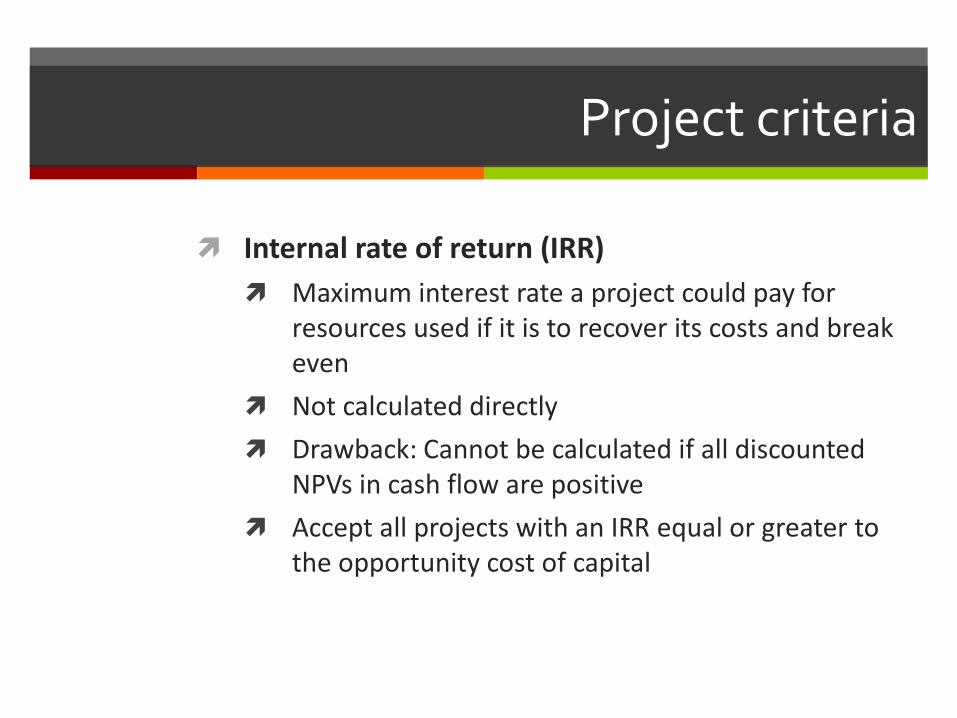
Internal rate of return (IRR)
Maximum interest rate a project could pay for resources used if it is to recover its costs and break even
Not calculated directly
Drawback: Cannot be calculated if all discounted NPVs in cash flow are positive
Accept all projects with an IRR equal or greater to the opportunity cost of capital
Financial Analysis
1. To evaluate the effect of the project on all stakeholders
2. To aggregate costs and benefits for the project as a whole

Financial analysis
Analyze the effect on main stakeholders
Farmers/beneficiaries
Government
Other financing institutions
Will the project present a loss for anyone?
Will the beneficiaries actually be better off?

Financial analysis
Do the beneficiaries have the incentives to take part in this project?
Can the beneficiaries afford to take part in this project?
Does the government/service provider have the necessary funds at all stages of project delivery?
In sum: are the project activities sustainable?

Financial analysis at the farm level
We aim to make sure that there are enough resources available for the activities we are proposing through the project;
Capital
Labour
Land
Please discuss why each one of these is important
Farm models
Gives an overview of the farm activities and resources with and without the project, and assumes farmers want to maximize their income/consumption
Do the project interventions change the allocation of key resources? Does this help the farmers maximize their income/consumption?
Creating a farm model
Decide on a few ‘average’ farms that are typical of your beneficiaries (highland vs lowland, subsistence vs semi-subsistence, paddy vs vegetables)
Map these farms’ resources and activities:
Land holdings
Crops/livestock/other agricultural activities
Family size
Other non-agriculture productive activities
Production and income from the above

Creating crop budgets
For each crop on the farm, develop a production budget per hectare or other standard measurement in your country
Quantity of inputs used (seeds, fertilizer, pesticides, labour)
Price of inputs used
Quantity of crop produced (yield)
(Quantity of crop bi-product produced (yield))
Sales price of crop
(Sales price of bi-product)

Creating crop budgets
Organize your information by:
Physical details
Prices
Financial calculations
Crop and farm budgets
Create one budget for the without project situation and one for the with project situation
Incorporate the budget into the farm level budget
From comparing the two crop budgets, you will find the incremental income derived from each crop
Together with other crops and other activities, you will get the financial activity of the farm as a whole

Farm models
Farm model 1a – what is the project intervention?
What changes in resources do you see?
Is there a benefit to the farmers? How can you tell?

Financial analysis of project agencies
Analyses what capital outlays and recurrent costs the project agencies will have to cover, and what returns they can expect from the investment
Analyses the financial ability of the agency to support/carry out the project
What is their current budget situation?
How much will they get from central government?
What user fees are the beneficiaries willing and able to pay?
Financial analysis of project agencies
What the analyst will need to see:
Balance sheet
Assets, liabilities, equity, reserves
Income and expenditure account
Cash flow statement
Objective is to assess the stability of the agency, its income and the source of its funds

Financial analysis of project agencies
What should the project design team do in cases of lack of financial viability?
Financial analysis of government
For government, a project is:
An investment
Foreign exchange earner or user
Instrument of fiscal-financial policy
A project should be evaluated on all of these accounts
What outflows and inflows might we find in a government project cash flow?

Economic analysis
Moving from stakeholders to the economy as a whole
What is the impact of the project for the borrowing country?
“Identify projects that contribute to the welfare of a country”
Economic analysis
Convert the information from the financial analysis into economic values
Removing distortions, transfer payments etc.
Shadow prices
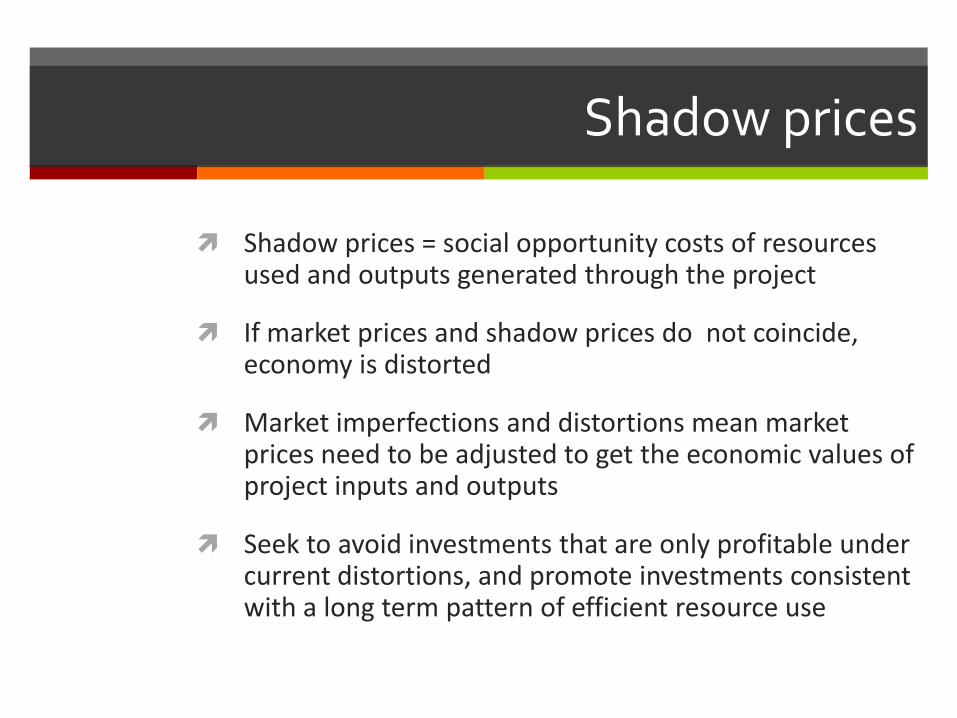
Shadow prices = social opportunity costs of resources used and outputs generated through the project
If market prices and shadow prices do not coincide, economy is distorted
Market imperfections and distortions mean market prices need to be adjusted to get the economic values of project inputs and outputs
Seek to avoid investments that are only profitable under current distortions, and promote investments consistent with a long term pattern of efficient resource use

Market distortions
Can you think of some reasons why markets may be distorted? Are developing countries more or less vulnerable to market distortions?

Market distortions in developing countries
High inflation -> overvalued currency -> government restrictions on import
Government fixed prices
Fixed wages
Income inequality -> consumer preferences not reflected in market prices
Fragmented capital markets, diverging interest rates
Market distortions
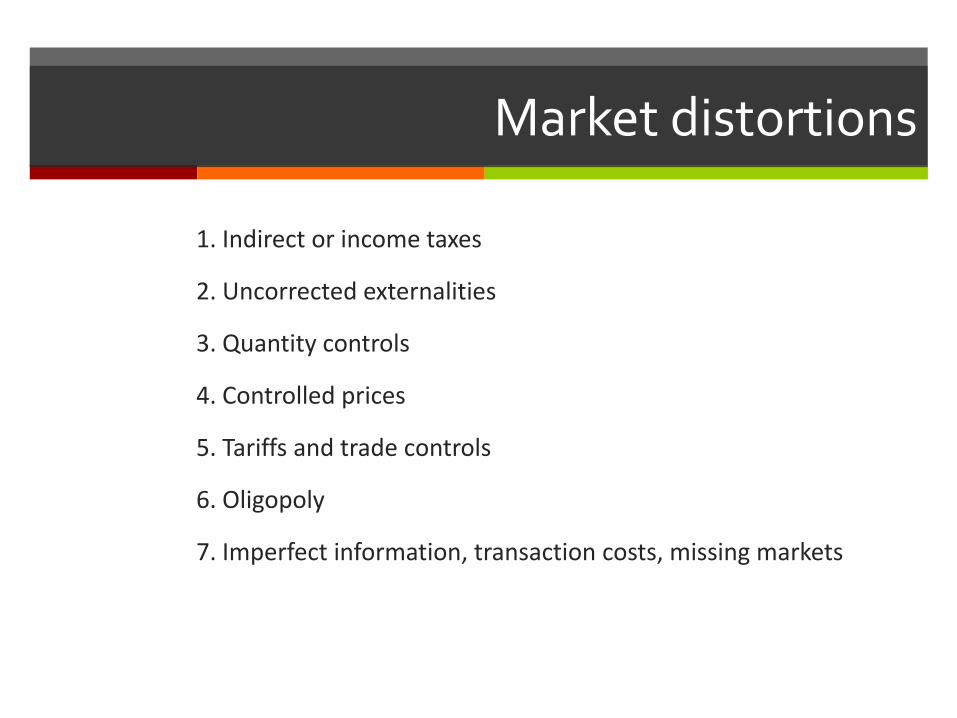
1. Indirect or income taxes
2. Uncorrected externalities
3. Quantity controls
4. Controlled prices
5. Tariffs and trade controls
6. Oligopoly
7. Imperfect information, transaction costs, missing markets
Adjustments to shadow prices
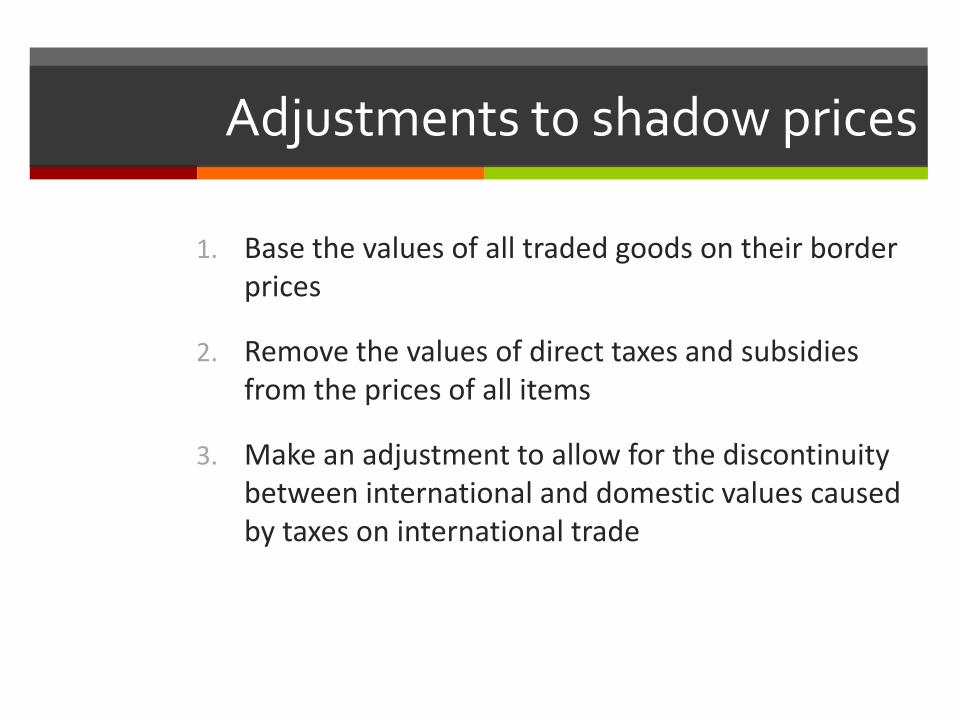
1. Base the values of all traded goods on their border prices
2. Remove the values of direct taxes and subsidies from the prices of all items
3. Make an adjustment to allow for the discontinuity between international and domestic values caused by taxes on international trade

Adjustments to shadow prices
4. Value non-traded inputs at their long-term marginal cost of supply
5. Make allowance where necessary for the fact that wages of some kinds of labour may be higher than their opportunity cost at market prices
6. Taking account of these basic shadow-pricing requirements, calculate the border or market parity values of the goods and services used and produced by the project
7. Estimate the values of all consumer surpluses gained (and lost) in the with project situation

Shadow prices
World price at the border
Cost, insurance, freight (CIF) for imports
FOB cost at point of export
Freight charges to point of import
Insurance charges
Unloading from ship to pier at dock
Free on board (FOB) for exports
All costs to get good on board ship in harbour
Project boundary price/farm gate price
Non-tradable goods and services
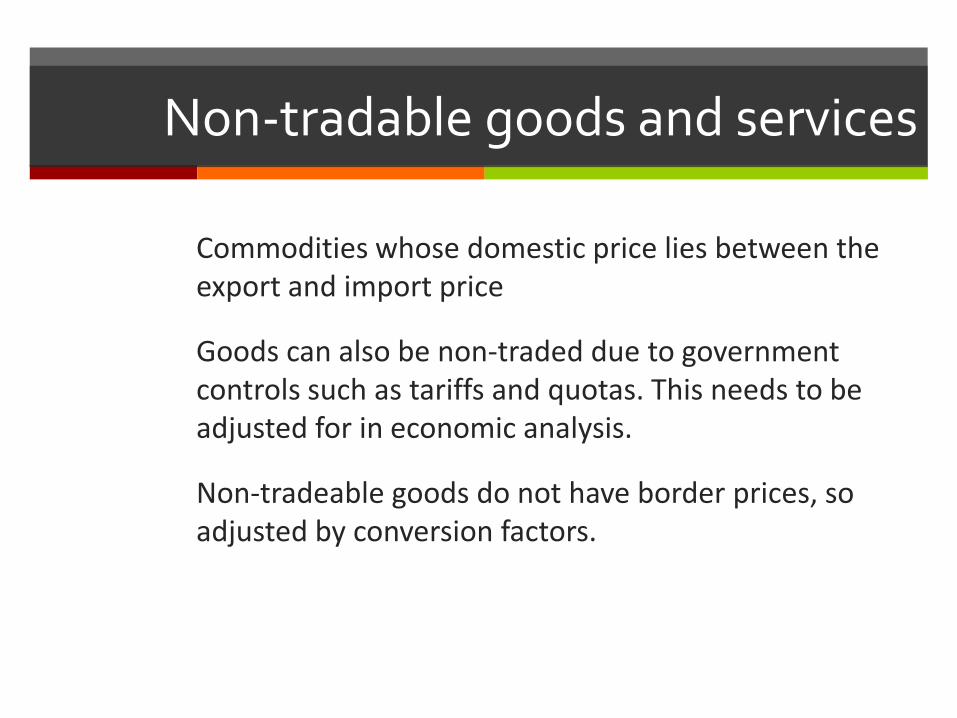
Commodities whose domestic price lies between the export and import price
Goods can also be non-traded due to government controls such as tariffs and quotas. This needs to be adjusted for in economic analysis.
Non-tradeable goods do not have border prices, so adjusted by conversion factors.

Conversion factors
Shadow pricing is most easily done by multiplying the market price value of each item by a conversion factor (CF)
The value the CF takes is a reflection of the relationship of the shadow price to the market price
If CF > 1, the social cost is higher than the market price
If CF < 1, the social cost is lower than the market price

Conversion factors
Ratio of economic to financial price, i.e. shadow price divided by domestic market price.
Used to convert market prices into shadow prices for economic analysis
They are calculated using either the world price system or the domestic price system

Uncertainty
With and without scenarios are predictions about future values
The predictions are not certain
Costs and investment time are often underestimated, gross margin calculations overestimated
Uncontrollable external forces
Uncertainty
What is the reliability of the assumptions we make in our analysis?
What are the possible consequences of deviations from these assumptions?
Sensitivity analysis tests the impact of likely variation in the project plan
Sensitivity analysis
Key risk factors are identified.
Carry out a sensitivity analysis on each of these to assess what the occurrence of such a risk would mean for the project’s profitability: changing one variable at a time and see how this affects NPV, EIRR
Key variables to change usually include:
Delays in costs or benefits
Increases and decreases in costs and benefits
Duration of project
Sensitivity analysis
Other variables:
Changes in input prices
Changes in product prices
Changes in yields
Switching values
Changing the value of a variable so that NPV becomes zero
This is the change in a variable that renders the project no longer profitable

Assumptions
The assumptions used for the analysis must be explicitly stated – this will allow other analysts to review your work and clarify under what circumstances your findings are valid


