2 7? A/8 /d Ho. 37SS PERSONAL VALUES SYSTEMS OF SENIOR CORPORATE AND PARTNERSHIP RESTAURANT MANAGERS AND HIGHER EDUCATION PROGRAMS IMPLICATIONS DISSERTATION Presented to the Graduate Council of the University of North Texas in Partial Fulfillment of the Requirements For the Degree of DOCTOR OF PHILOSOPHY By C. E. Vlisides, B.S., M.A. Denton, Texas May, 1993
Transcript
2 7? A/8 /d
Ho. 37SS
PERSONAL VALUES SYSTEMS OF SENIOR CORPORATE
AND PARTNERSHIP RESTAURANT MANAGERS
AND HIGHER EDUCATION PROGRAMS
IMPLICATIONS
DISSERTATION
Presented to the Graduate Council of the
University of North Texas in Partial
Fulfillment of the Requirements
For the Degree of
DOCTOR OF PHILOSOPHY
By
C. E. Vlisides, B.S., M.A.
Denton, Texas
May, 1993
H
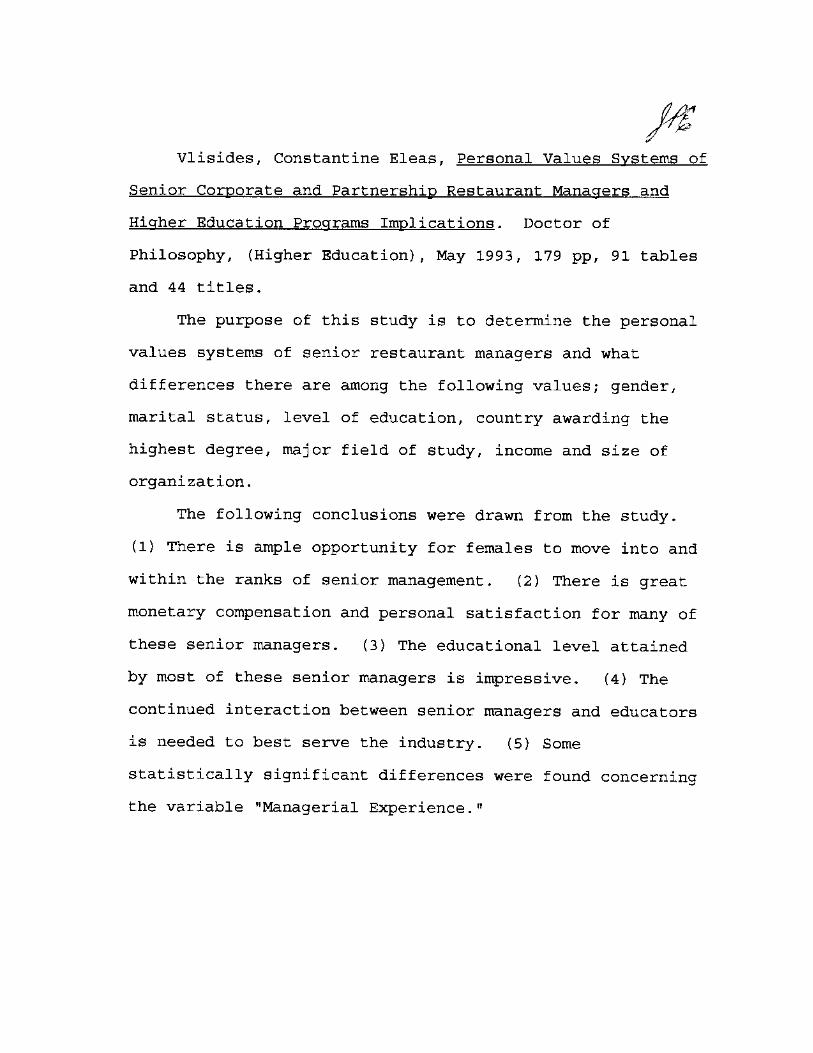
Vlisides, Constantine Eleas, Personal Values Systems of
Senior Corporate and Partnership Restaurant Managers and
Higher Education Programs Implications. Doctor of
Philosophy, (Higher Education), May 1993, 179 pp, 91 tables
and 44 titles.
The purpose of this study is to determine the personal
values systems of senior restaurant managers and what
differences there are among the following values; gender,
marital status, level of education, country awarding the
highest degree, major field of study, income and size of
organization.
The following conclusions were drawn from the study.
(1) There is ample opportunity for females to move into and
within the ranks of senior management. (2) There is great
monetary compensation and personal satisfaction for many of
these senior managers. (3) The educational level attained
by most of these senior managers is impressive. (4) The
continued interaction between senior managers and educators
is needed to best serve the industry. (5) Some
statistically significant differences were found concerning
the variable "Managerial Experience."
TABLE OF CONTENTS
Page
LIST OF TABLES V
Chapter
1. INTRODUCTION 1
Statement of the Problem Research Questions Hypotheses of the Study Definition of Terms Limitations of the Study Basic Assumptions Significance of the Study
2. REVIEW OF LITERATURE 10
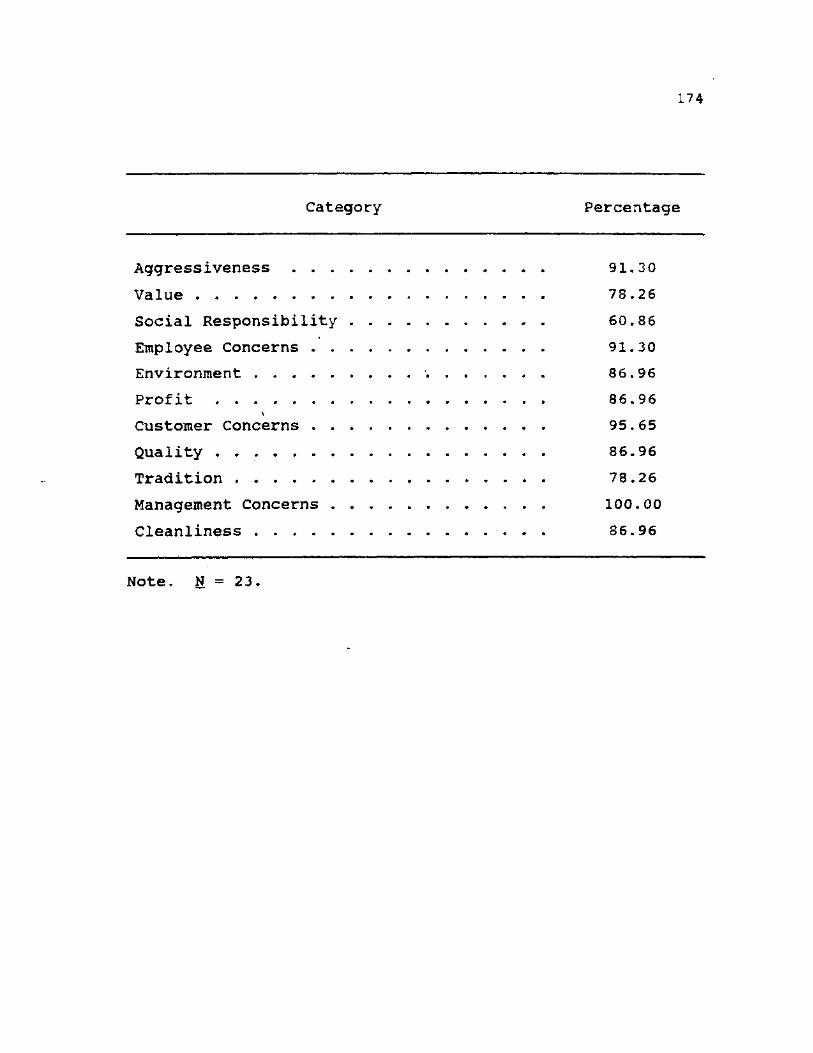
Introduction Review of the Refereed Articles Review of the 23 Corporate Annual Reports Summary
3. RESEARCH METHODS AND PROCEDURES 57
Introduction Population and Sample Description of Research Test Description of Research Instrument Validation of the Personal Value
Questionnaire Data Collection Procedures Statistical Analysis of the Data
4. PRESENTATION AND ANALYSIS OF DATA 63
Research Question One Research Question Two Hypothesis One Hypothesis Two Hypothesis Three Hypothesis Four Hypothesis Five Hypothesis Six Hypothesis Seven
i n
Chaptesr Page
Hypothesis Eight Summary
5. SUMMARY, STATISTICAL SUMMARY, VALUES PROFILES OF MANAGERS, CONCLUSIONS, RECOMMENDATIONS AND IMPLICATIONS 102
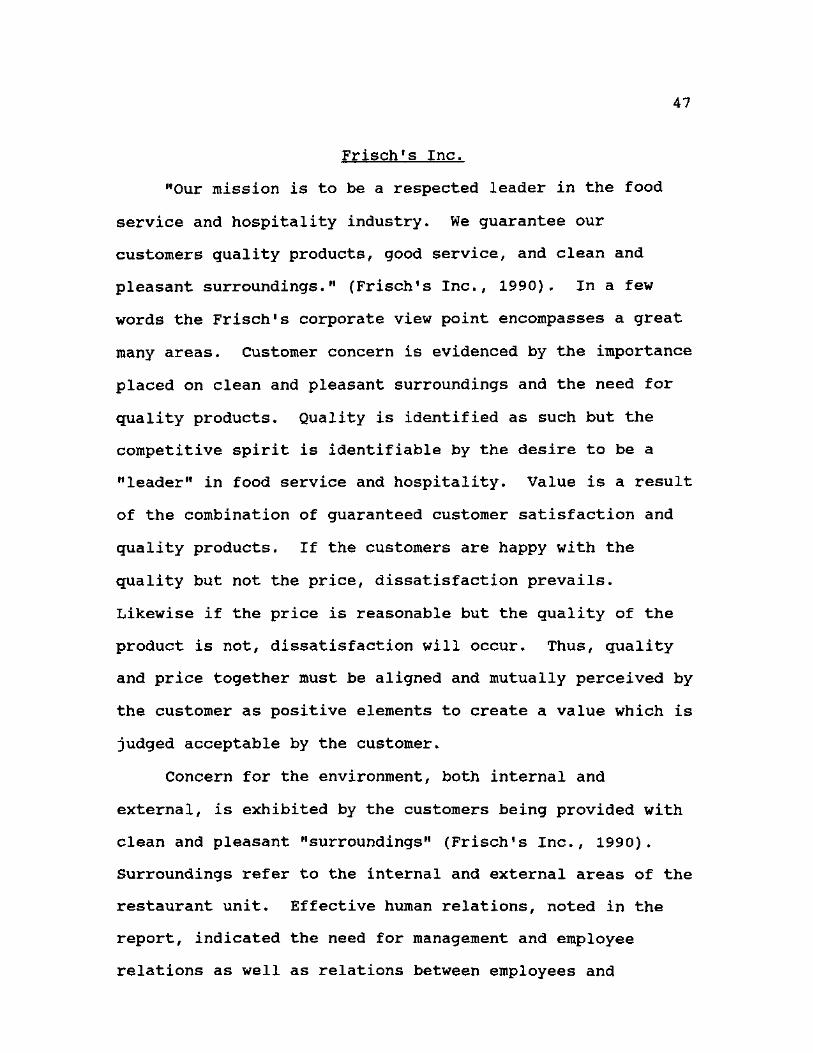
the corporation's final net profit and total operation.
Successful companies within the hospitality industry
can trace precisely their success to senior management. The
personal value systems that the managers of successful
companies employ affect their organizations—either
positively or negatively. By instilling the successful
traits of senior managers in other employees through
comprehensive training programs, company philosophy can
permeate additional levels of management. Both mid- and
lower-level management can be exposed to these traits of
successful managers through personal contact and continuous
training.
The interviewing of candidates for management level
positions can be more accurately implemented with the use of
the Personal Value Systems Questionnaire (England, 1967) .
By matching the candidates' personal values to those of
successful senior managers, employers can ensure a
continuation of company philosophy with minimized training
expense.
Hayajneh (1990) addressed the question, "Why should
managers be studied at all?" in the following manner:
Senior managers should be studied because their efforts affect the end result in the formulation and implementation of business strategies. Their personal value systems, beliefs, and attitudes affect the evaluation of information, decision-making process, motivation of subordinates, and general behavior in conducting routine business affairs (England, 1967, Hayajneh, 1990).
Personal value systems affect the managers' acceptance of
organizational change (England, 1975). Personal value
systems set limits on managers' ethical behavior. Because
of the tremendous impact that senior managers have upon an
organization, it is clear that their personal values also
have a great impact on the organization. The lack of
research conducted within the hospitality industry on this
subject makes this study especially important.
Statement of the Problem
The problem of this study concerned the identification of
senior corporate and partnership restaurant managers'
personal values and whether a significant difference exists
among them.
Research Questions
In order to determine if the personal value systems of
senior restaurant management are congruent with one another,
a survey of senior restaurant managers was conducted in an
effort to answer the following questions.
a survey of senior restaurant managers was conducted in an
effort to answer the following questions.
1. What are the personal values systems of senior
corporate and partnership restaurant managers?
2. What differences are there, if any, in senior
restaurant managers' personal value systems? (With respect
to gender, marital status, level of formal education,
country awarding highest degree, major field of study,
annual income level, and size of organization).
Hypotheses of the Study
1. Ho: The personal values systems of senior
restaurant managers are equal based on their gender.
Ha: The personal values systems of senior
restaurant managers are not equal based on their gender.
2. Ho: The personal values systems of senior
restaurant managers are equal based on their marital status,
Ha: The personal values systems of senior
restaurant managers are not equal based on their marital
status.
3. Ho: The personal values systems of senior
restaurant mangers are equal based on their level of formal
education.
Ha: The personal values systems of senior
restaureint managers are not equal based on their level of
formal education.
4. Ho: The personal values systems of senior
restaurant managers are equal based on their major field of
studies.
Ha: The personal values systems of senior
restaurant managers are not equal based on their major field
of studies.
5. Ho: The personal values systems of senior
restaurant managers are equal with based on the country
awarding the highest degree.
Ha: The personal values systems of senior
restaurant managers are not equal based on the country
awarding the highest degree.
6. Ho: The personal values systems of senior
restaurant managers are equal based on their annual incomes.
Ha: The personal values systems of senior
restaurant managers are not equal based on their annual
incomes.
7. Ho: The personal values systems of senior
restaurant managers are equal based on their number of years
of managerial experience.
Ha: The personal values systems of senior
restaurant managers are not equal based on their number of
years of managerial experience.
8. Ho: The personal values systems of senior
restaurant managers are equal based on the size of their
organizations.
Ha: The personal values systems of senior
restaurant managers are not equal based on the size of their
organizations.
Definition of Terms
Senior manager refers to all restaurant managers above
the level of supervisor. Inclusive in this group are
vice-presidents, controllers or comptrollers, presidents,
chief operating officers, chief executive officers, and
members of the board of directors (Henderson, 1989).
Personal value system refers to the system of beliefs
expressed by a respondent regarding emotional and behavioral
feelings about subjects that include, but are not limited
to, patriotism, organizational feelings about the work
environment, personnel, and government (England, 1967).
Organizational mission refers to the long-term
accomplishments of an organization and are expressed in
broad, value-laden terms with regard to products or services
that are intended to validate the existence of the
organization. Such statements provide a company philosophy
and can generate a corporate culture. Mission statements
can also be used as criteria to determine an organization's
long-term success and effectiveness. The success in
achieving the mission set forth by such statements suggests
the survival of the organization (Henderson, 1989) .
Organizational goal refers to the necessary and
detailed steps that must be taken in order to achieve the
Total 43 1.0465 .2131 .0325 • 9809 1.1121 1.0000 2.0000
Note. SE = Standard Error; 95% LC = 95% Level of Confidence; Int. Mean = Internal for the Mean; Min. Rank. = Minimum Ranking; Max. Rank. = Maximum Ranking.
Further differences appeared with the One-way Analysis
of Variance within this variable. "My Assistant" was
determined to be rated as "High" by Group Two and all other
groups rated this dependent variable as "Medium."
92
Table 3
One-way Analysis of Variance for "Mv Assistant"
Degrees of Sum of Mean Source Freedom Squares Squares
Between groups 3 1.6744 .5581
Within groups 39 6.0000 .1538
Total 42 7.6744
Table 4
Tests for homogeneity of variances of sample for "My Assistant"
95% Int. Min. Max. Group N Mean SD SE LC Mean Rank. Rank.
Total 43 1.2326 .4275 .0652 1.1010 1.3641 1.0000 2.0000
Note. SE - Standard Error; 95% LC = 95% Level of Confidence; Int. Mean = Internal for the Mean; Min. Rank. = Minimum Ranking; Max. Rank. = Maximum Ranking.
There is significance in this difference as the computed F
probability was found to be .0211. The Mean for this
93
variable was 1.2326 with a standard deviation of .4275 (see
Table 3 and Table 4).
"Tolerance" showed another significant difference among
the cells. Group Two differed from the other groups as they
valued "Tolerance" as "Low." The other three groups
assigned "Medium" as their value to "Tolerance."
Statistical significance was determined by the one-way
analysis of variance as the computed F probability was
determined to be .0436. The Mean was 1.6429 with a standard
deviation of .5329 (see Table 5 and Table 6).
Table 5
One-wav Analysis of Variance for "Tolerance"
Degrees of Sum of Mean Source Freedom Squares Squares
Between groups 3 2.2143 .7381
Within groups 38 9.4286 .2481
Total 41 11.6429
One-way analysis of variance could not determine
significance in three other dependent variables within the
section "Groups of People," however, they were nearly
significant enough to be noted. The first dependent
variable was "Prejudice." Group Two valued this dependent
94
variable as "Medium" while all other groups assigned a value
Table 6
95% Int. Min. Max. Group N Mean SD SE LC Mean Rank. Rank.
Note. SE = Standard Error; 95% LC = 95% Level of Confidence; Int. Mean = Internal for the Mean; Min. Rank. = Minimum Ranking; Max. Rank. = Maximum Ranking.
of "High." The computed F probability factor was determined
to be .0847. The Mean was 2.4762 with a standard deviation
of .7726 (see Table 7 and Table 8).
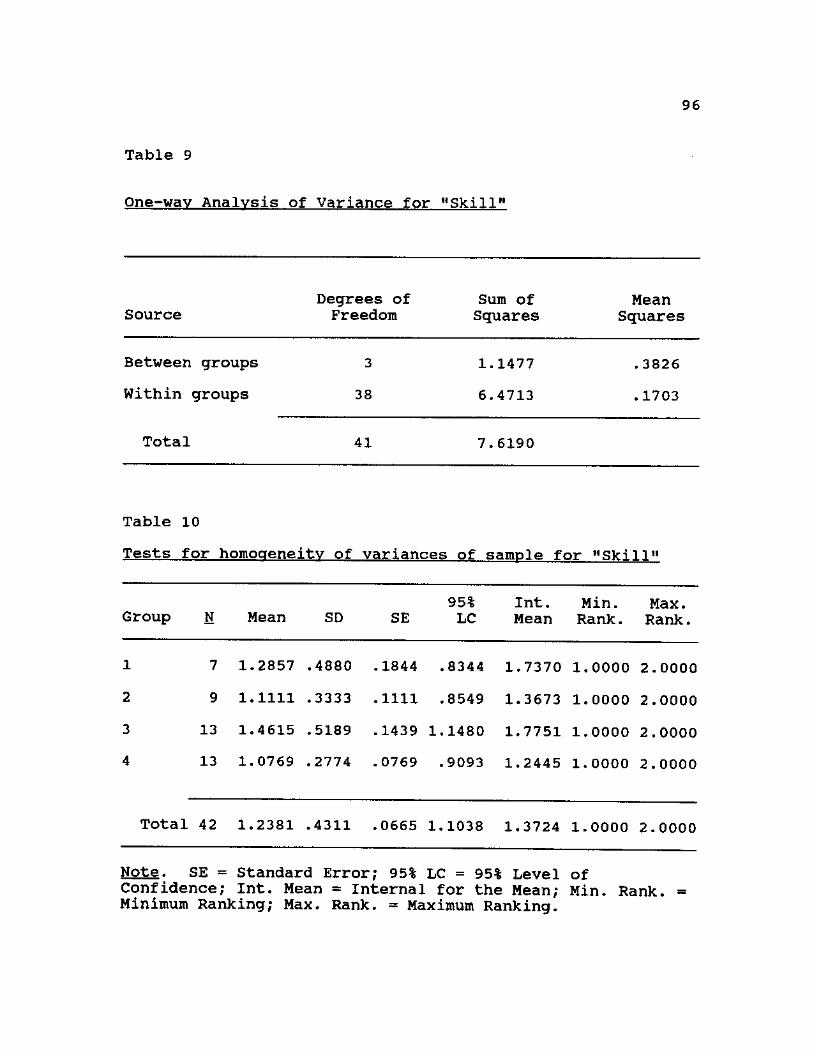
Near-significance was determined by use of a one-way
analysis of variance for the dependent variable "Skill."
However, Group Two again showed a variance in their
valuation of "Skill" as opposed to the other three groups.
The computed F probability was determined to be .0986 with a
Mean of 1.2381. The standard deviation was determined to be
.4311 (see Table 9 and Table 10).
Table 7
One-wav Analysis of Variance for "Prejudice"
95
Source Degrees of Freedom
Sum of Squares
Mean Squares
Between groups
Within groups
Total
3
38
41
3.8730
20.6032
24.4762
1.2910
.5422
Table 8
Tests for homogeneity of variances of sample for "Prejudice"
Group N Mean SD SE 95% Int. Min. Max. LC Mean Rank. Rank
Note. SE = Standard Error; 95% LC = 95% Level of Confidence; Int. Mean = Internal for the Mean; Min. Rank. = Minimum Ranking; Max. Rank. = Maximum Ranking.
Table 9
One-wav Analysis of Variance for "Skill"
96
Source Degrees of Freedom
Sum of Squares
Mean Squares
Between groups
Within groups
Total
3
38
41
1.1477
6.4713
7.6190
.3826
.1703
Table 10
Tests for homogeneity of variances of sample for "Skill"
95% Int. Min. Max. Group M Mean SD SE LC Mean Rank. Rank.
Total 42 1.2381 .4311 .0665 1.1038 1.3724 1.0000 2.0000
Note. SE = Standard Error; 95% LC = 95% Level of Confidence; Int. Mean = Internal for the Mean; Min. Rank. Minimum Ranking; Max. Rank. = Maximum Ranking.
97
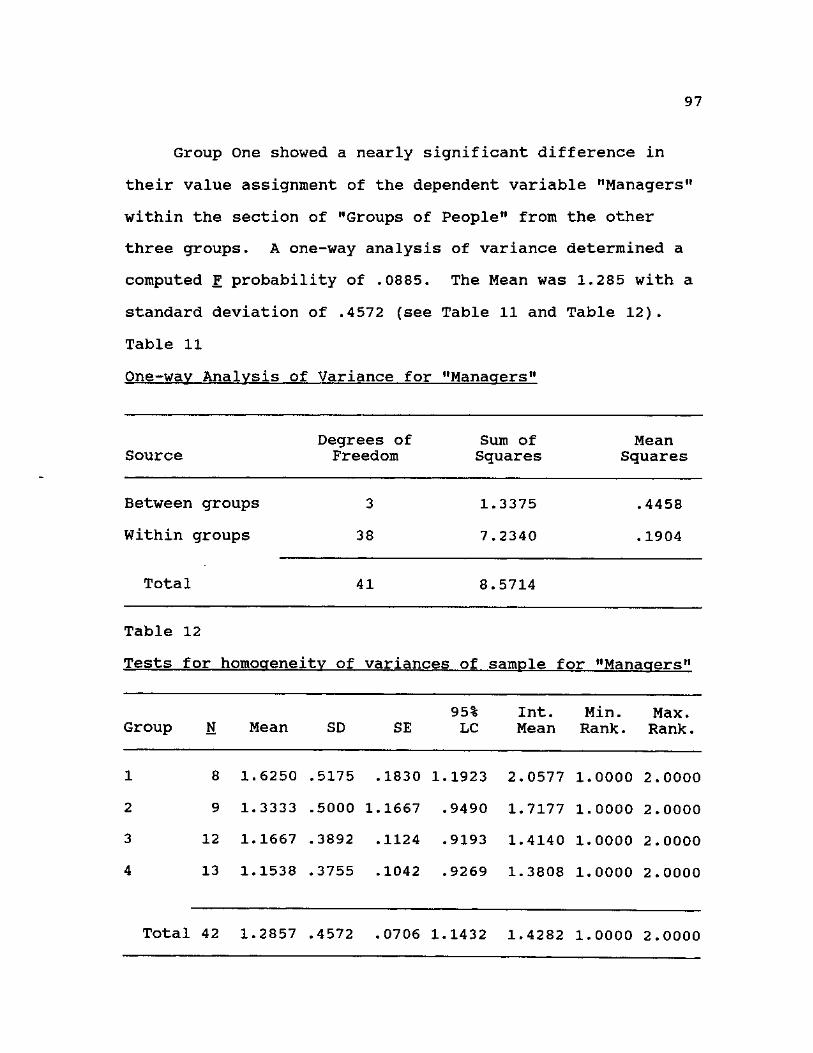
Group One showed a nearly significant difference in
their value assignment of the dependent variable "Managers"
within the section of "Groups of People" from the other
three groups. A one-way analysis of variance determined a
computed F probability of .0885. The Mean was 1.285 with a
standard deviation of .4572 (see Table 11 and Table 12).
Table 11
One-way Analysis of Variance for "Managers"
Source Degrees of Freedom
Sum of Squares
Mean Squares
Between groups
Within groups
Total
3
38
41
1.3375
7.2340
8.5714
.4458
.1904
Table 12
Tests for homogeneity of variances of sample for "Managers"
Group N Mean SD SE 95% Int. Min. Max. LC Mean Rank. Rank.
8 1.6250 .5175 .1830 1.1923 2.0577 1.0000 2.0000
9 1.3333 .5000 1.1667 .9490 1.7177 1.0000 2.0000
12 1.1667 .3892 .1124 .9193 1.4140 1.0000 2.0000
13 1.1538 .3755 .1042 .9269 1.3808 1.0000 2.0000
Total 42 1.2857 .4572 .0706 1.1432 1.4282 1.0000 2.0000
98
Note. SE = Standard Error; 95% LC = 95% Level of Confidence; Int. Mean = Internal for the Mean; Min. Rank. = Minimum Ranking; Max. Rank. = Maximum Ranking.
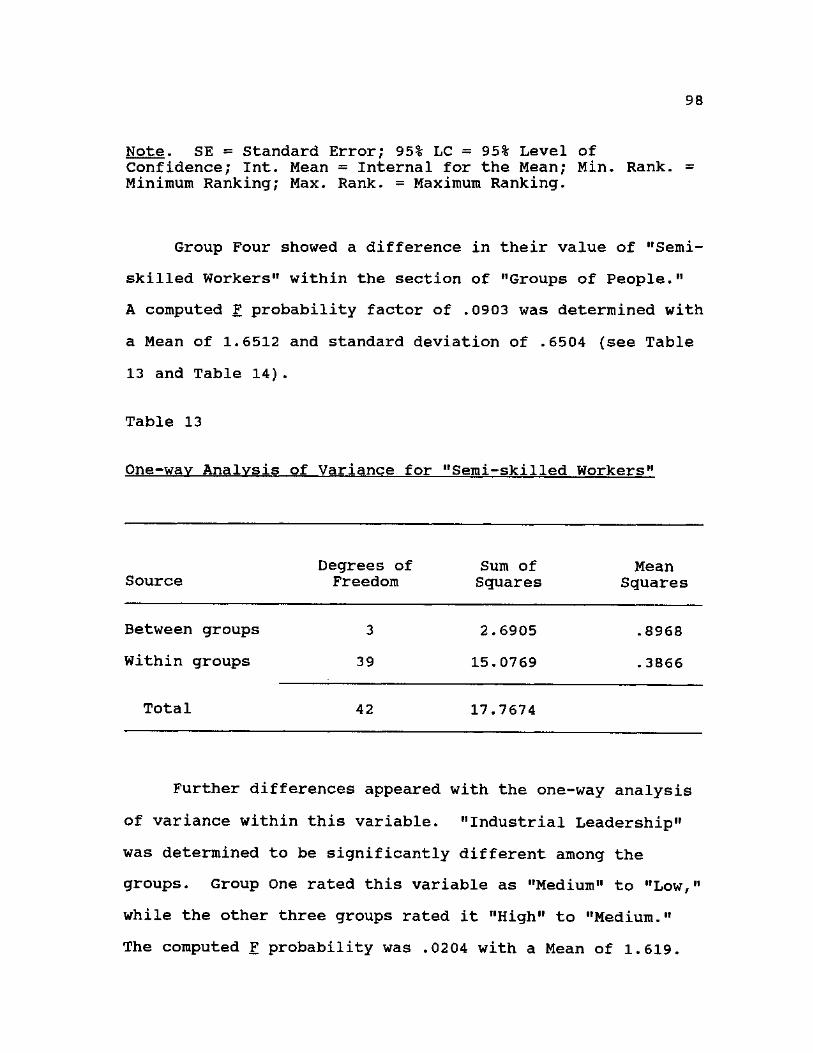
Group Four showed a difference in their value of "Semi-
skilled Workers" within the section of "Groups of People."
A computed F probability factor of .0903 was determined with
a Mean of 1.6512 and standard deviation of .6504 (see Table
13 and Table 14).
Table 13
One-way Analysis of Variance for "Semi-skilled Workers"
Source Degrees of Freedom
Sum of Squares
Mean Squares
Between groups
Within groups
Total
3
39
42
2.6905
15.0769
17.7674
.8968
.3866
Further differences appeared with the one-way analysis
of variance within this variable. "Industrial Leadership"
was determined to be significantly different among the
groups. Group One rated this variable as "Medium" to "Low,"
while the other three groups rated it "High" to "Medium."
The computed F probability was .0204 with a Mean of 1.619.
99
The computed F ratio was .0204 with a Mean of 1.619. The
standard deviation was .7309 (see Table 15 and Table 16).
No other significant or near significant factors were
determined in Hypothesis Seven.
Table 14
Tests for homogeneity of variances of sample for "Semi-skilled Workers11
95% Int. Min. Max. Group M Mean SD SE LC Mean Rank. Rank.
Total 43 1.6512 .6504 .0992 1. 4510 1.8513 1.0000 3.0000
Note. SE = Standard Error; 95% LC = 95% Level of Confidence; Int. Mean = Internal for the Mean; Min. Rank. Minimum Ranking; Max. Rank. = Maximum Ranking.
100
Table 15
One-way Analysis of Variance for "Industrial Leadership"
Source Degrees of Freedom
Sum of Squares
Mean Squares
Between groups
Within groups
Total
3
38
41
4.9206
16.9841
21.9048
1.6402
.4470
Table 16
Tests for homogeneity of variances of sample for industrial leadership
Group N Mean SD SE 95% LC
Int. Mean
Min. Rank.
Max. Rank.
7 2.2857 .7559
9 1.2222 .4410
13 1.4615 .6602
13 1.6923 .7511
.2857 1.5866 2.9848 1.0000 3.0000
.1470 .8833 1.5612 1.0000 2.0000
.1831 1.0626 1.8605 1.0000 3.0000
.2083 1.2384 2.1462 1.0000 3.0000
Total 42 1.6190 .7309 .1128 1.3913 1.8468 1.0000 3.0000
Note. SE = Standard Error; 95% LC = 95% Level of Confidence; Int. Mean = Internal for the Mean; Min. Rank. Minimum Ranking; Max. Rank. = Maximum Ranking.
101
Hypothesis Eight
Ho: The personal values systems of senior restaurant
managers are equal based on the size of their organization.
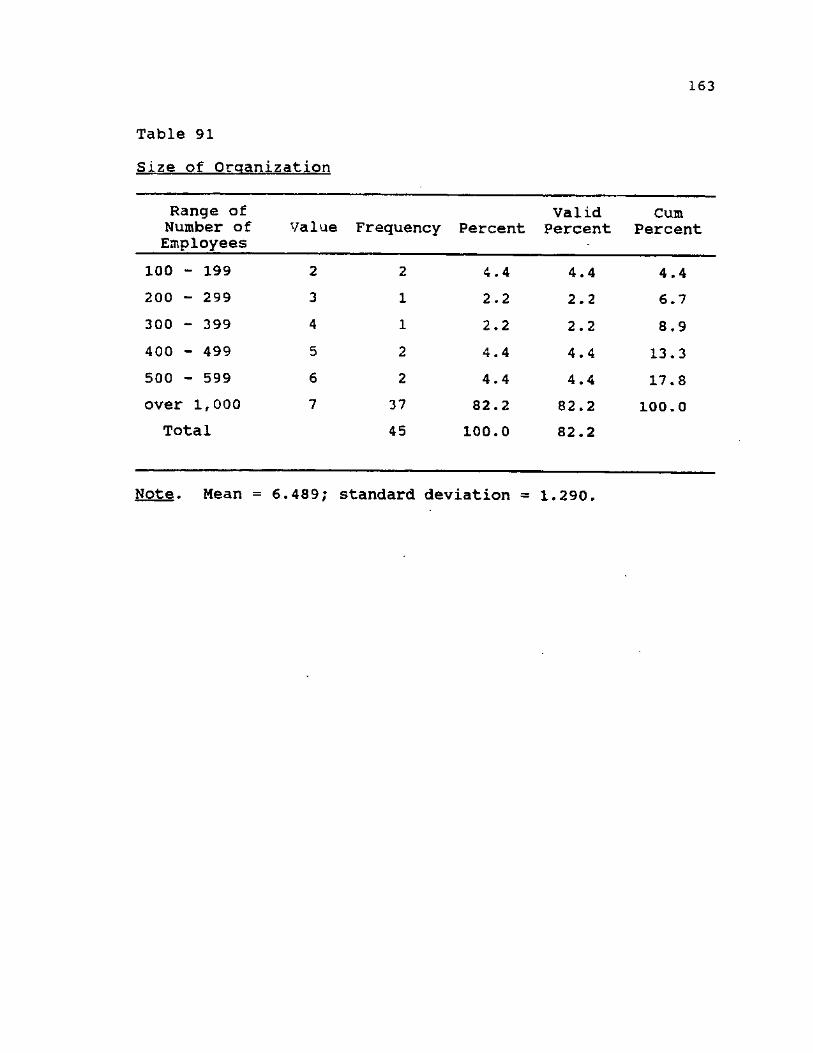
No significance was determined using the one-way
analysis of variance. The group sizes were not equivalent
enough to perform a valid statistical analysis. The
majority of responses were reported by 37 managers (or
82.2%) as the size of their organizations were in excess of
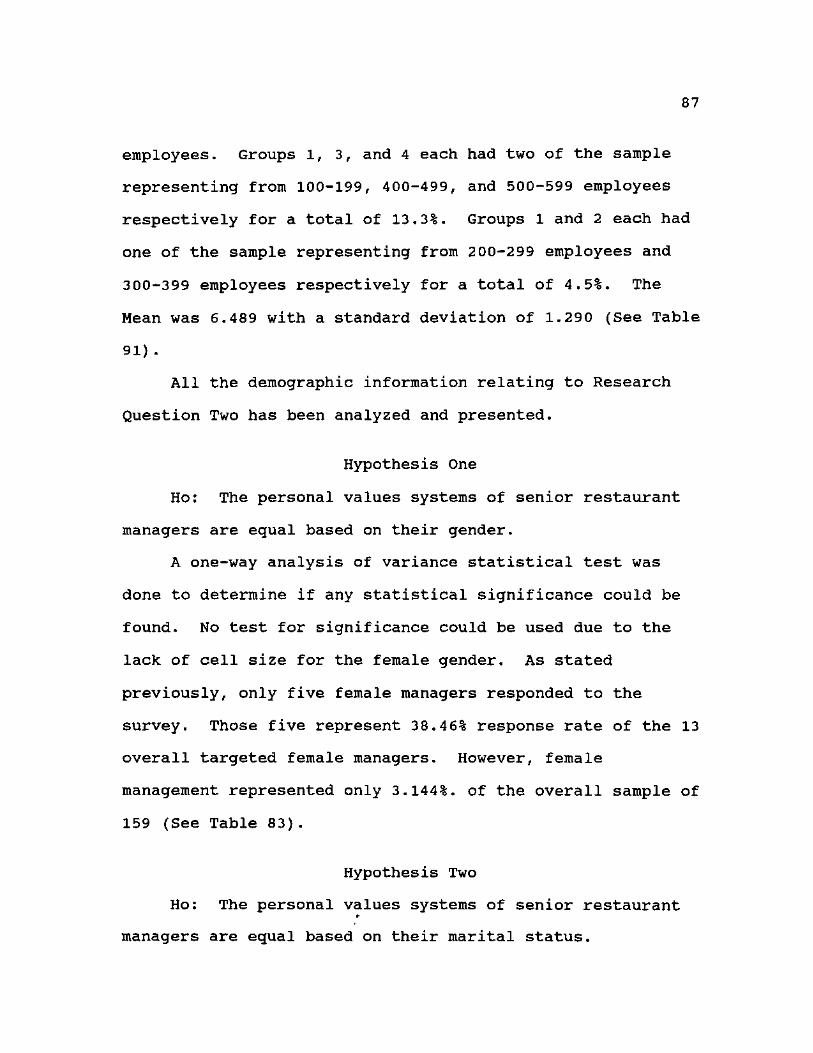
1,000 employees (See Table 91).
The statistical analysis of all eight hypothesis were
determined by use of the SPSS/PC+ Studentware 4.0 (Norusis,
1988). All hypothesis have been addressed as outlined in
Chapter 1.
Summary
The analysis of the sample and their responses as
outlined in Chapter 1 has been completed. While much of the
statistics detailed were descriptive in nature, there was
significance found in Hypothesis Seven. A closer look as to
what conclusions may be drawn will take place in Chapter 5.
CHAPTER 5
SUMMARY, STATISTICAL SUMMARY, VALUES PROFILES OF MANAGERS,
CONCLUSIONS, RECOMMENDATIONS, IMPLICATIONS,
AND IMPLICATIONS FOR HIGHER EDUCATION
Introduction
This chapter presents the summary of the problems,
purposes, methods and procedures, analysis of data, and
findings of this study. Discussion and conclusions based on
the findings are also included.
Summary
This study addressed the personal values systems of
senior restaurant managers of 23 corporations or
partnerships representing 12 states. The personal values of
these managers determine the way their companies are run as
expressed in previous studies by Hayajneh (1990), and Santos
(1990). In accordance with theories espoused by Maslow in
1954 and Hotter in 1982, managers have a great impact on
their respective organizations. If success breeds success
as Kotter indicated in 1982, what better way to determine
what makes a successful manager than by analyzing the
personal values of senior management? If managers are to be
fulfilled in their careers by means of recognition, praise,
and personality traits that breed success as suggested by
102
103
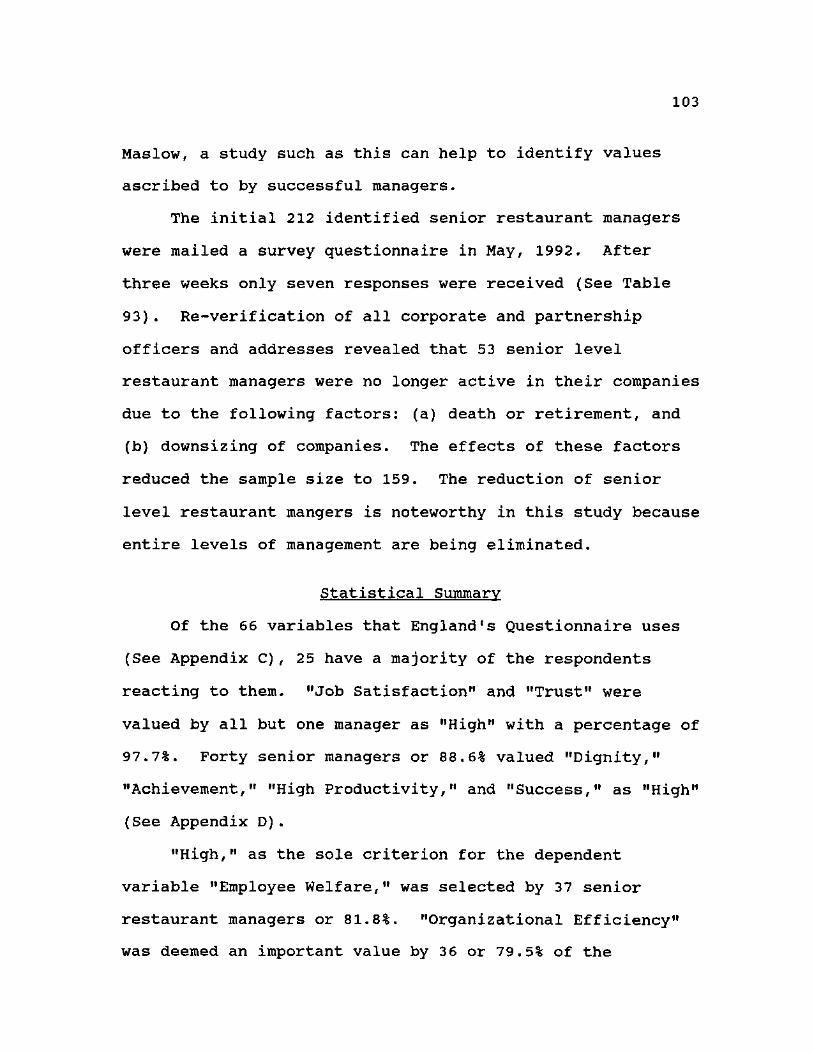
Maslow, a study such as this can help to identify values
ascribed to by successful managers.
The initial 212 identified senior restaurant managers
were mailed a survey questionnaire in May, 1992. After
three weeks only seven responses were received (See Table
93). Re-verification of all corporate and partnership
officers and addresses revealed that 53 senior level
restaurant managers were no longer active in their companies
due to the following factors: (a) death or retirement, and
(b) downsizing of companies. The effects of these factors
reduced the sample size to 159. The reduction of senior
level restaurant mangers is noteworthy in this study because
entire levels of management are being eliminated.
Statistical Summary
Of the 66 variables that England's Questionnaire uses
(See Appendix C), 25 have a majority of the respondents
reacting to them. "Job Satisfaction" and "Trust" were
valued by all but one manager as "High" with a percentage of
97.7%. Forty senior managers or 88.6% valued "Dignity,"
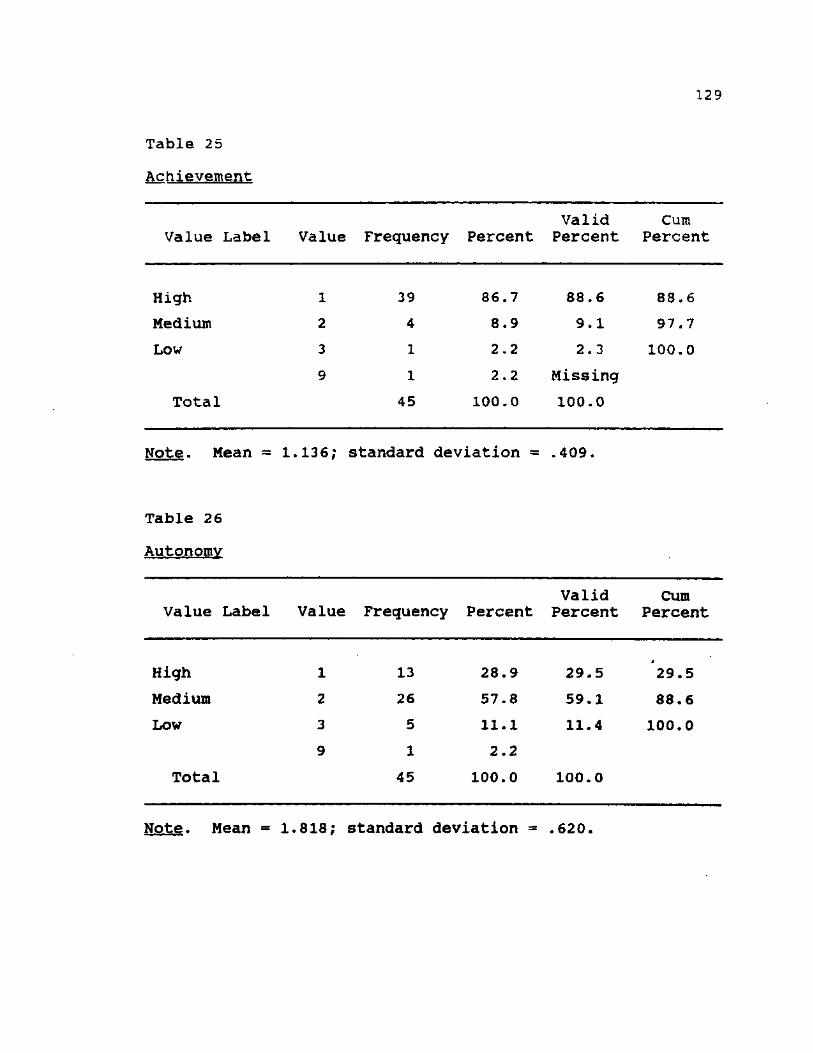
"Achievement," "High Productivity," and "Success," as "High"
(See Appendix D).
"High," as the sole criterion for the dependent
variable "Employee Welfare," was selected by 37 senior
restaurant managers or 81.8%. "Organizational Efficiency"
was deemed an important value by 36 or 79.5% of the
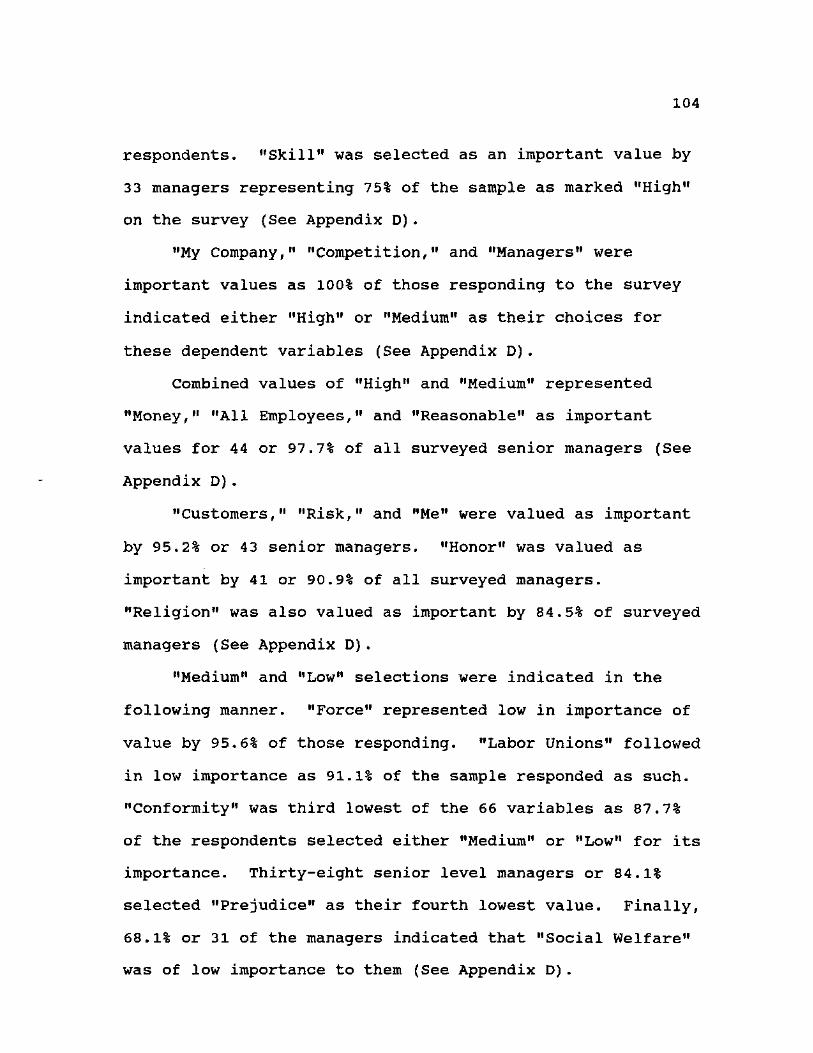
104
respondents. "Skill" was selected as an important value by
33 managers representing 75% of the sample as marked "High"
on the survey (See Appendix D).
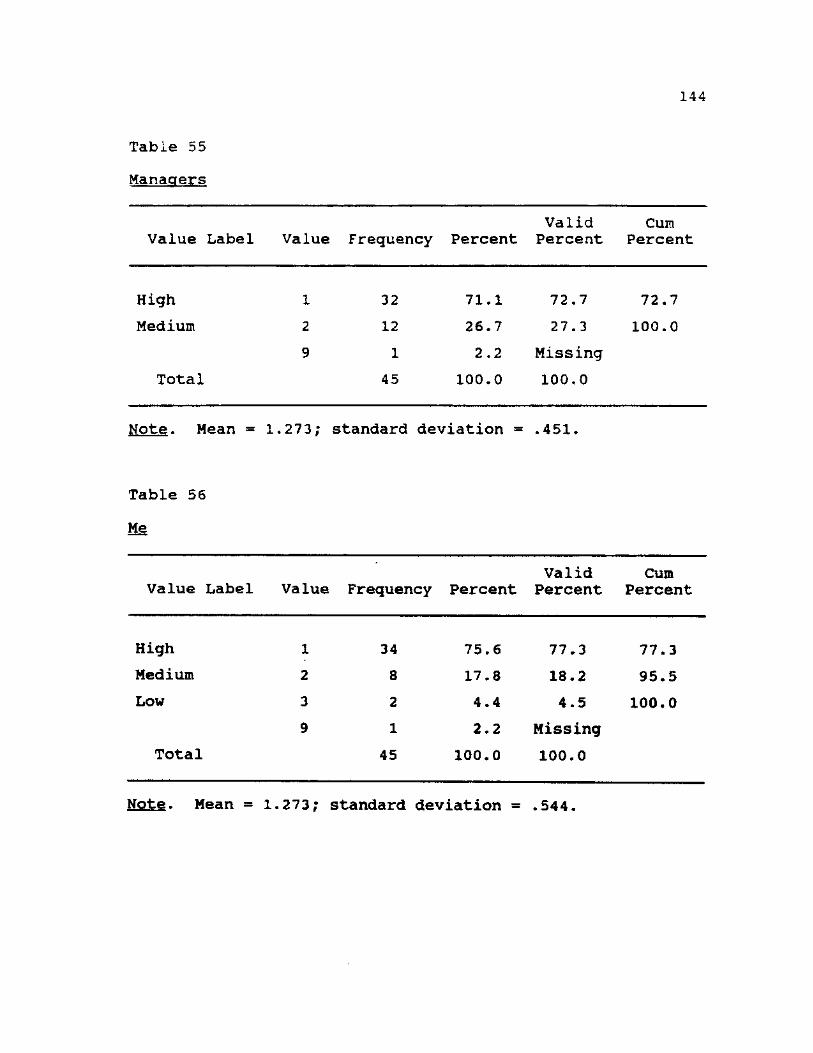
"My Company," "Competition," and "Managers" were
important values as 100% of those responding to the survey
indicated either "High" or "Medium" as their choices for
these dependent variables (See Appendix D).
Combined values of "High" and "Medium" represented
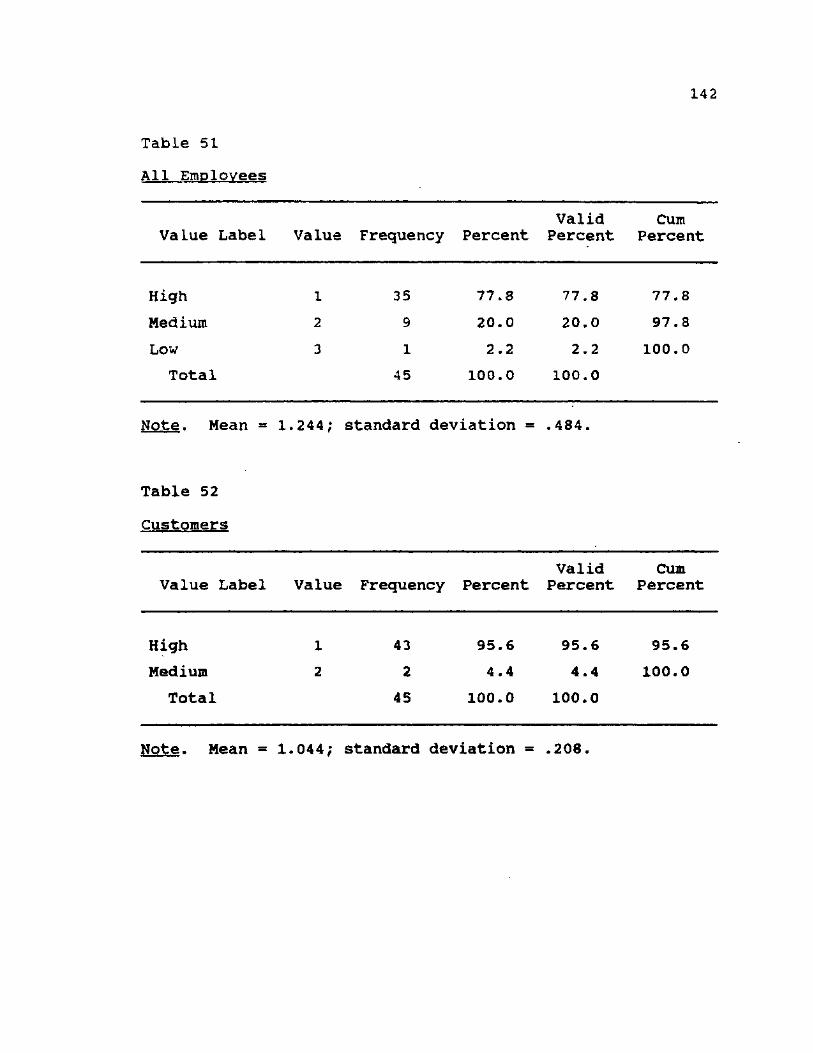
"Money," "All Employees," and "Reasonable" as important
values for 44 or 97.7% of all surveyed senior managers (See
Appendix D).
"Customers," "Risk," and "Me" were valued as important
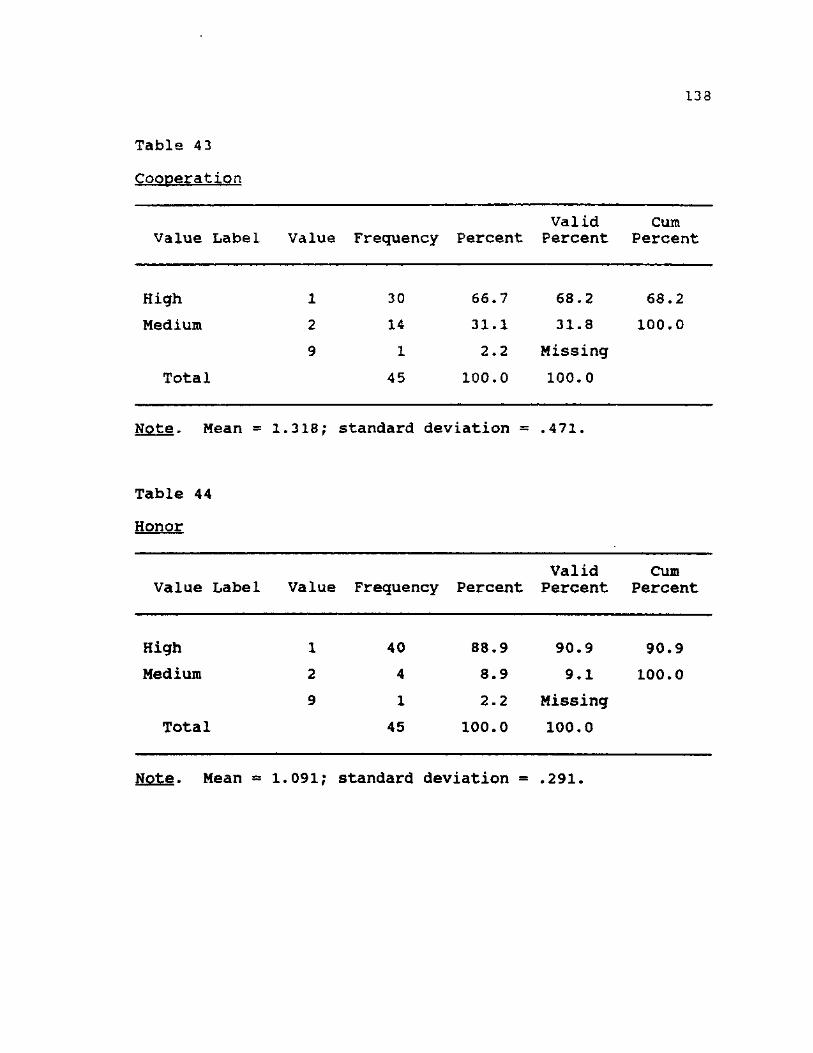
by 95.2% or 43 senior managers. "Honor" was valued as
important by 41 or 90.9% of all surveyed managers.
"Religion" was also valued as important by 84.5% of surveyed
managers (See Appendix D).
"Medium" and "Low" selections were indicated in the
following manner. "Force" represented low in importance of
value by 95.6% of those responding. "Labor Unions" followed
in low importance as 91.1% of the sample responded as such.
"Conformity" was third lowest of the 66 variables as 87.7%
of the respondents selected either "Medium" or "Low" for its
importance. Thirty-eight senior level managers or 84.1%
selected "Prejudice" as their fourth lowest value. Finally,
68.1% or 31 of the managers indicated that "Social Welfare"
was of low importance to them (See Appendix D).
105
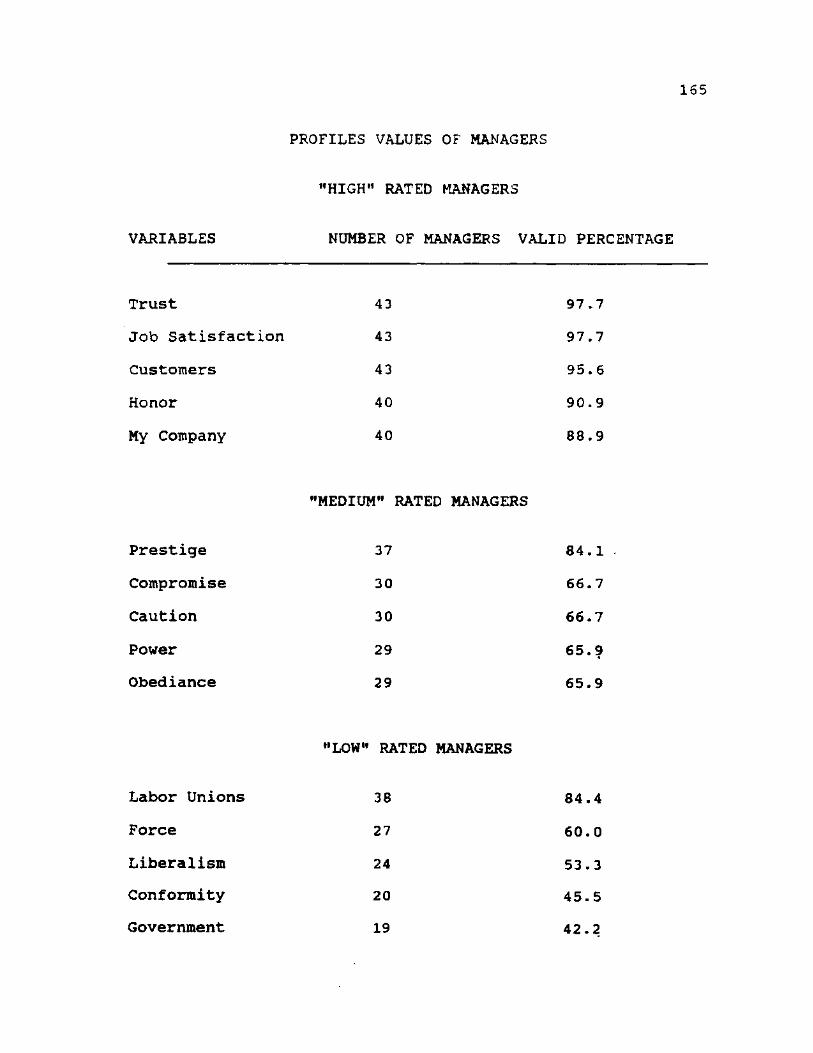
Values Profiles Of Managers
The values profiles of managers are provided in
Appendix E. This illustrates the range of values managers
have from "High," "Medium," and "Low" as determined from
their responses.
Conclusions
The following conclusions are drawn from this study.
1. There is ample opportunity for females to move into
and within senior level management in the corporate
restaurant industry.
2. There is great monetary compensation and personal
satisfaction for those managers who can sustain their
careers into their mid-forties.
3. The educational level attained by most senior
restaurant managers is impressive and is shown by the
preponderance of business degrees earned.
4. The continued interaction between industry leaders
and educators would help to resolve any differences that
each may have toward the philosophy of how to best serve the
industry.
Recommendations
Based on the findings of this study, the following
recommendations are warranted:
1. The study should be replicated with the advantage of
knowing the limitations of this study.
106
2. Placing a small gratuity in the second mailing of
the surveys dramatically increased the responses.
3. Verification of individuals and their corporate
addresses before the first mailing will save time, effort,
and cost.
4. Future studies should include a demographic listing
that would include ethnic data. Such data would be
important to gauge the progress of various ethnic group's
assimilation into senior level management.
5. Replication of this study could determine if
further downsizing is occurring within the restaurant
industry. The restaurant industry, being the largest
segment of the service industry, would then serve as a
barometer for national economic trends.
6. Assessment of how females move within the ranks of
senior level management should be determined. The
determination of success or failure could provide analysis
regarding how the system could better assimilate females
into senior management.
7. Identification of senior level managers1 values and
value systems would be beneficial for management training
programs. Additionally, the possibility of greater future
success of mid-level managers could be attained through such
training programs based on this and other studies.
8. Future studies should determine the benefits of a
law degree in the restaurant industry. This study found
107
that the two most senior managers in terms of both age and
years of service were attorneys.
Implications
The fact that only 13 females were available to be
surveyed raises the question of how female managers can
access senior-level management? Two of the thirteen females
had surnames that made them identifiable with their
organizations. Another two were listed as Executive
Secretary on the Board of Directors, suggesting that four of
the 13 or 30.77% of all senior level female managers were on
the boards of directors of their companies either by
nepotism or traditional female role-modeling.
Participation by industry management in surveys such as
this one is crucial in defining those personal values that
enable successful managers to lead their companies. If
Kotter (1982) was correct in his assertion that "success
breeds success"; corporate management should try and
identify individual successful mangers' values. Such
activity would help perpetuate success within their
corporate cultures. There is no better way to identify
themselves than to participate in surveys of this nature.
Downsizing of major proportions is taking place and
appears that it will continue in the foreseeable future
within the restaurant industry. Logic dictates that net
profit will increase with a decrease in the overall salary
108
structure. The salary structure is greatly influenced by
the number of senior-level management and the salaries of
those managers. As indicated by the survey results, most
senior managers are earning in excess of $101,000 per year.
The elimination of a few of those positions would create a
more accessible pool of cash for other business uses such as
expansion or new product development.
The profile of a successful senior level manager within
the restaurant industry, according to the results of this
study, is a male between the ages of 41 and 44 who has been
in management for a minimum of 11 years and has at least a
four year degree in business administration.
As shown in Hypothesis Seven, significance must be
noted as to how managers that are in their 11th through 15th
years view their jobs. Speculation is that this group of
managers are busy trying to establish themselves within the
corporate structure politically. This is one possible
explanation of the differences among the four groups.
Based on the above information, assistants are viewed
as allies by those trying to establish themselves within a
political organization. The assistants are then deemed as
necessary "eyes" and "ears" within the organization in order
to provide valuable information for promotions and the
solidification of positions for their superiors.
Furthermore, as managers in their 11th through 15th years
try to establish themselves within their corporate
109
organizations, the interaction with customers is reduced as
suggested by the significance of Hypothesis Seven.
Hypothesis Seven also suggests that "Tolerance" becomes
a "Low" priority when stress levels increase. As senior
managers establish themselves as an integral part of an
organization their stress levels rise, therefore reducing
their level of tolerance.
Implications For Higher Education Programs
Selective implications for higher education for the
study are:
1. That the hotel/restaurant administration programs
teach a course on values of managers and their adverse
affects on the industry.
2. That hotel/restaurant administration programs
survey their students, in their programs and counsel them on
their values as they negatively impact their future.
This study has helped to identify and show some
significance in the personal values systems of restaurant
management. Future studies should be able to provide even
more information that would be beneficial to those who care
about this industry.
APPENDIX A
LETTER REQUESTING PERMISSION TO USE ENGLAND'S
PERSONAL VALUE SYSTEM QUESTIONNAIRE
110
Ill
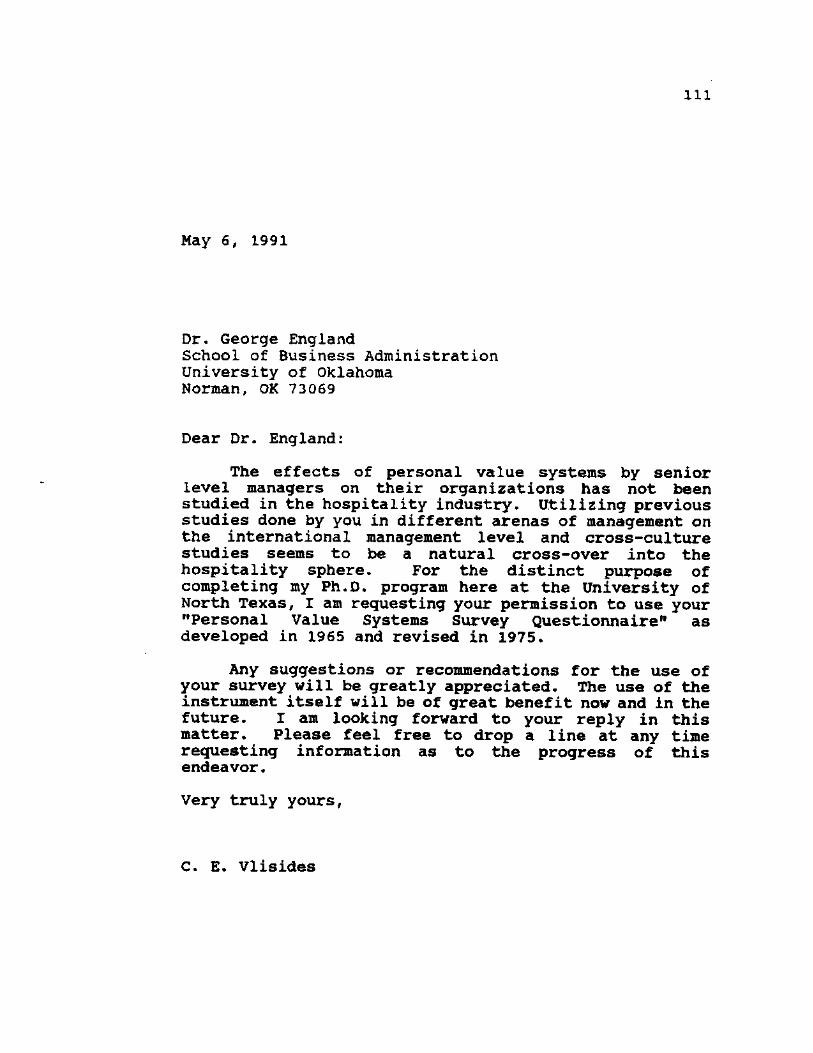
May 6, 1991
Dr. George England School of Business Administration University of Oklahoma Norman, OK 73069
Dear Dr. England:
The effects of personal value systems by senior level managers on their organizations has not been studied in the hospitality industry. Utilizing previous studies done by you in different arenas of management on the international management level and cross-culture studies seems to be a natural cross-over into the hospitality sphere. For the distinct purpose of completing my Ph.D. program here at the University of North Texas, I am requesting your permission to use your "Personal Value Systems Survey Questionnaire" as developed in 1965 and revised in 1975.
Any suggestions or recommendations for the use of your survey will be greatly appreciated. The use of the instrument itself will be of great benefit now and in the future. I am looking forward to your reply in this matter. Please feel free to drop a line at any time requesting information as to the progress of this endeavor.
Very truly yours,
C. E. Vlisides
APPENDIX B
LETTERS PERTAINING TO ENGLAND'S PERSONAL
VALUE SYSTEM QUESTIONNAIRE
112
1 1 3
f-1 y
rJSi>0 * The University of Oktafwma CENTER FOR ECONOMIC AND MANAGEMENT RESEARCH COLLEGE OF BUSINESS ADMINISTRATION 307 West Brooks Street, Room 4 Norman, Oklahoma 73019-0450 (405) 325-2931
January 23, 1992
Mr. C. E. VIIs Ides
University of North Texas
School of Human Resource Management P. 0. Box 5248
Denton, TX 76203-5248
Dear Mr. Vlisides;
Sorry your letter got put under a stack of work. You have ray permission to use the PVQ in your dissertation research and I would request that you send me a copy of the dissertation when it is completed. Best wishes in your research.
Sincerely,
UrJ.
George W . Englan^/
Professor Emeritus of Management
114
Dear
I was an owner and manager of different restaurants in several states. I am still active and enter my 27th year in the business. I love it and I used to get this mail on my desk too. Some of it I responded to, and some of it was pitched in ye olde circular file. If you have read my letter to this point, I am honored. Please read on and I promise you that you won't be disappointed.
Many of your colleagues in the restaurant field have already responded to the survey sent to you in May. However, I need only 50 more to complete this important study. Some of you have put the survey aside and forgot about it. Some of you have been on vacation and have not as yet seen it. Others have just thrown it out. Well, I remain persistent and hopeful that there are 50 of you that are not short-sighted and will complete the survey and send it back to me.
This is the first study of its kind to address the personal values of senior hospitality leaders. It is international in scope and takes LESS THAN 10 MINUTES TO COMPLETE. I guarantee your anonymity and I will send you a summary of the results, if you so desire. Hey, I even jpay the postage!! What more can I do??
Well, I'll throw in a buck so you can buy a soft drink, or a cup of coffee, or whatever, if you send me back the completed form. I am so sure of your integrity that the dollar is already enclosed. So, now you can be part of a historical survey, I pay the postage, you get a buck, and all this for less than 10 minutes of your time!! Give me a break and help me out. Your response will make you feel GOOD. So, PLEASE do it TODAY and fill my mail box!! If you have any questions PLEASE call me at 1-817-565-4696. Thank you in advance for your cooperation, it is most appreciated.
Sincerely,
C.E. (Dean) Vlisides Researcher
115
May 21, 1992
Dear Hospitality Industry leader,
Academic research is needed to better our industry and provide for a better future. Your assistance is critical in determining how the restaurant industry is being run. Research has shown that your personal values affect your business. By spending just a few minutes, you will be contributing to the future of the industry that you have helped create. I promise that completing the enclosed survey will take no more than 15 minutes of your time. Ethics, values, and the opportunity to improve our industry should be motivation enough. But, I know how busy you are and all I can say for further motivation is that with your help history can be made.
Confidentiality is assured as only the researcher will know to whom these few letters are being sent. A copy of a summary of the data will be made available to you, if you so desire. Another benefit will be that your company may be cited in any future publications. You are part of an international survey that can be of benefit to ydu today and in the future.
Please take the few minutes and send back the pre-stamped form as soon as possible. Without your immediate assistance, no one will benefit. Please accept my personal gratitude for the time that you spent reading this letter and filling out the short survey form.
Sincerely,
C.E. Vlisides Researcher University of North Texas
APPENDIX C
ENGLAND'S PERSONAL VALUE SYSTEM QUESTIONNAIRE
116
117
ENGLAND'S PERSONAL VALUES SYSTEMS QUESTIONNAIRE
This questionnaire is a part of a personal values study. The object of this study
is to have individuals evaluate various concepts which are about 1) groups of people, 2)
personal goals, 3) goals of organizations, 4) ideas associated with people, and 5) ideas
about general topics.
You will be asked to determine the degree of importance of each concept to you
and to rank the descriptions (pleasant, right, successful) as they best determine the
meaning of each concept to you.
Please be satisfied that your individual answers will never be disclosed to anyone
except the researcher. The data that I am trying to collect is only for this research
project on personal values of senior hospitality managers.
In advance, I would like to thank you for your participation in this research study.
It might be important to indicate that the progress in understanding managers' behavior
comes from your cooperation and participation in studies such as this one.
DIRECTIONS
Please determine the degree of importance for each concept by circling the
appropriate letter. The three lines after each concept indicate the degree of importance
for each concept. The "H" equals high importance, the "M" equals medium importance,
or the "L" equals low importance to indicate the degree of importance for each concept.
Then rank the three descriptions (pleasant, right, successful) on the right-hand
side as follows. On any of the three small lines following the specific concept, put a
113
number one f 1) on the line under the description that best fits the meaning or the specific
concept to you. Then put a number three (3) under the description that least fits the
meaning of the same specific concept to you. Finally, put a number twa (2) on the small
line under the remaining description for the same specific concept. Please notice how
you must assign an appropriate number to each description.
SAMPLES
Consider the concept "Patriotism", for example. Lf you believe that this concept
is of "high importance" CIRCLE the letter "H\ Here, you may choose only one degree
of importance (high, medium, low).
With respect to the three descriptions, if you believe that the description "right"
best fits the meaning of "Patriotism" to you, please put a number one (1) on the line
under "right" on the right-hand side. And if you believe that the description "successful"
least fits the meaning of "Patriotism" to you, please put a number three (3) on the small
line under the description "successful" in the same area. Then put the number two (2)
on the small line under the last description "right" as it appears in the drawn sample.
However, you might feel that none of the three descriptions apply for certain
concepts. The concept "dishonesty", for example, might be the concept that fits none
of the descriptions (pleasant, right, successful).
In this case, you may choose the description that least fits the meaning of the
concept to you. If you believe that the description "right" least fits the meaning of this
concept, then put a number three (3) on the small line under that description. Then do
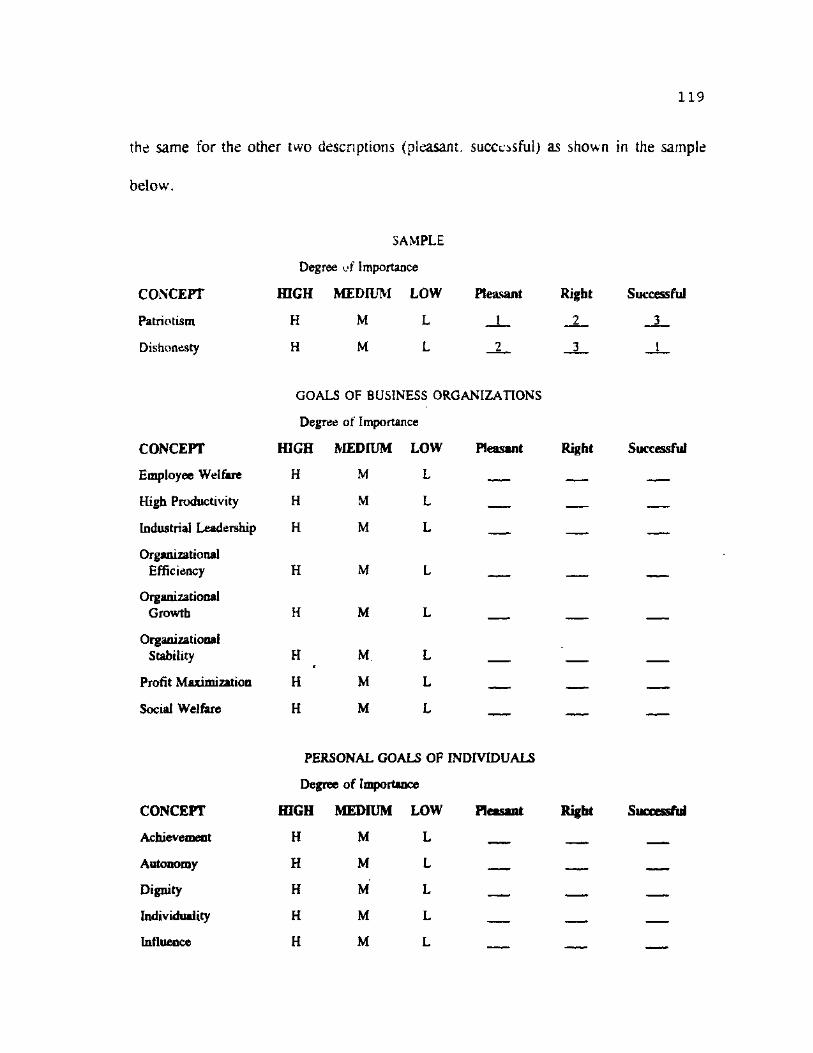
1 1 9
the same for the other two descriptions (pleasant, successful) as shown in the sample
below.
CONCEPT
Patriotism
Dishonesty
SAMPLE
Degree of Importance
HIGH MEDIUM LOW Pleasant Right Successful
H M L 1 2 3
H M L 2 3 1
CONCEPT
GOALS OF BUSINESS ORGANIZATIONS
Degree of Importance
HIGH MEDIUM LOW Pleasant
Employee Welfare H M L
High Productivity H M L
Industrial Leadership H M L
Organizational Efficiency H M L
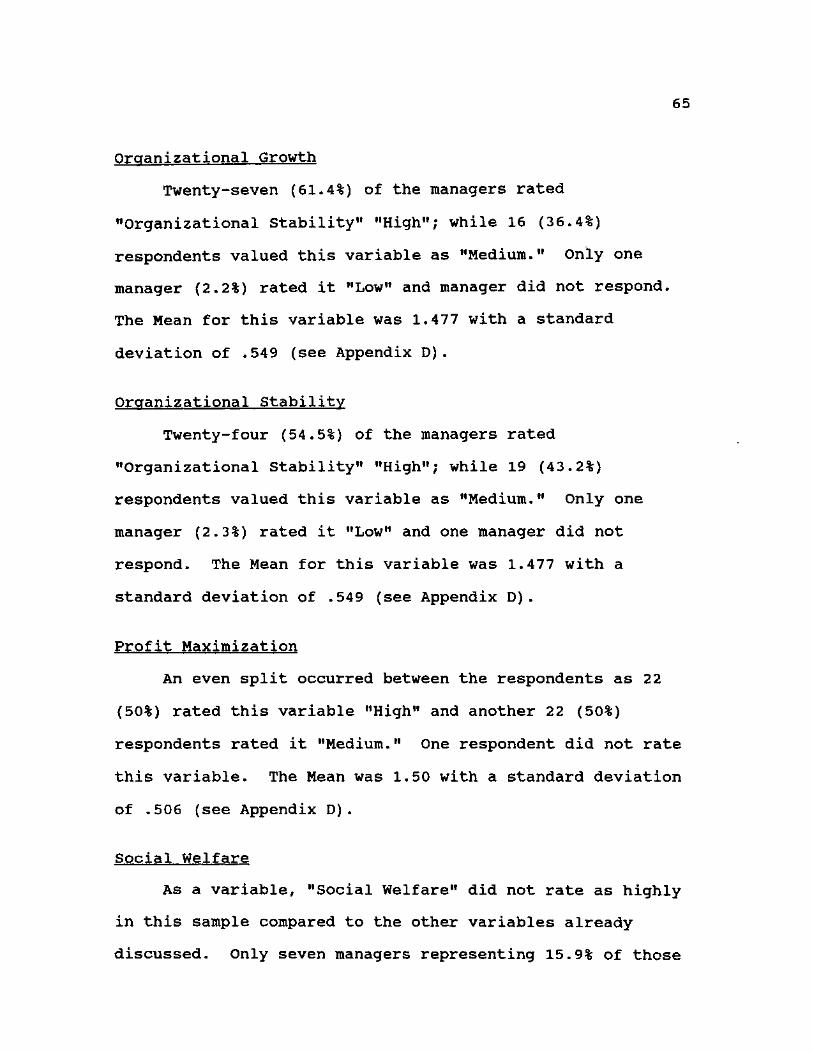
Organizational Growth H M L
Organizational Stability H
*
M. L
Profit Maximization H M L
Social Welfare H M L
Right Successful
PERSONAL GOALS OF INDIVIDUALS
Degree of Importance
CONCEPT HIGH MEDIUM LOW Pleasant Right
Achievement H M L
Autonomy H M L
Dignity H M L • • i. Individuality H M L
Influence H M L
Successful
120
Innovation H M L
Job Satisfaction H M L
Job Security H M L
Leisure H M L
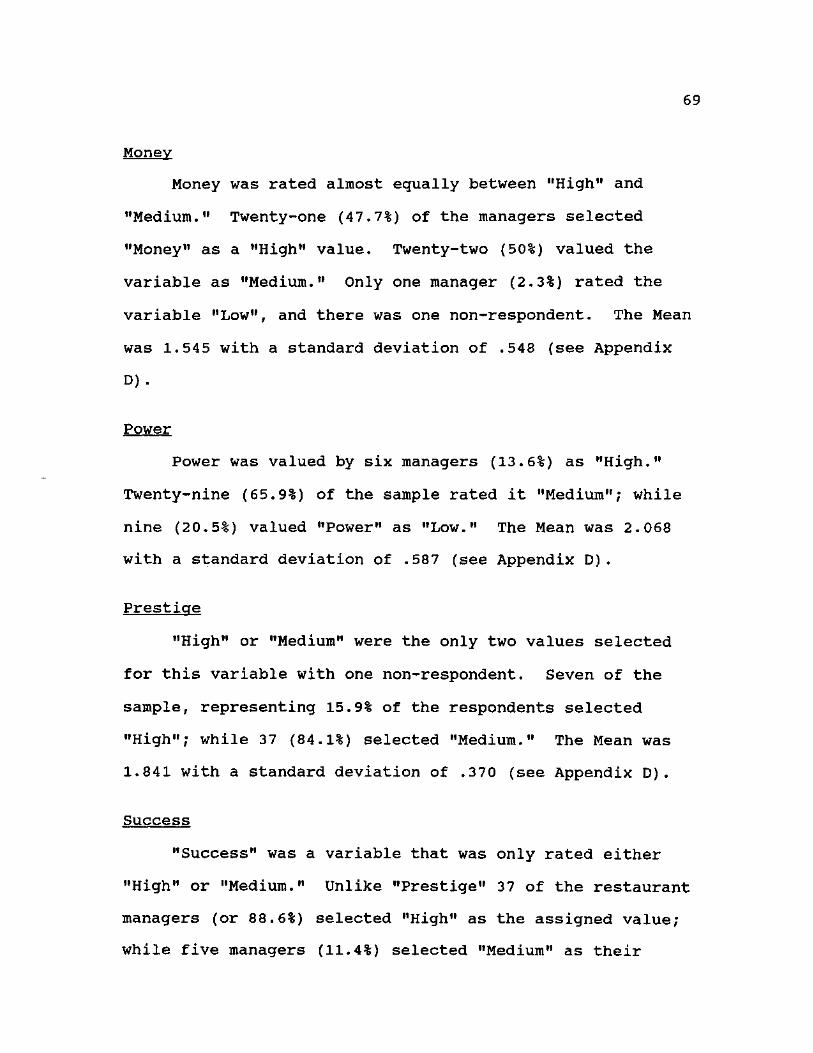
Money H M L ___
Power H M L -
Prestige H M L „ — ___
Success H M L
IDEAS ASSOCIATED WITH PEOPLE
Degree of Importance
CONCEPT HIGH MEDIUM LOW Pleasant Right Successful
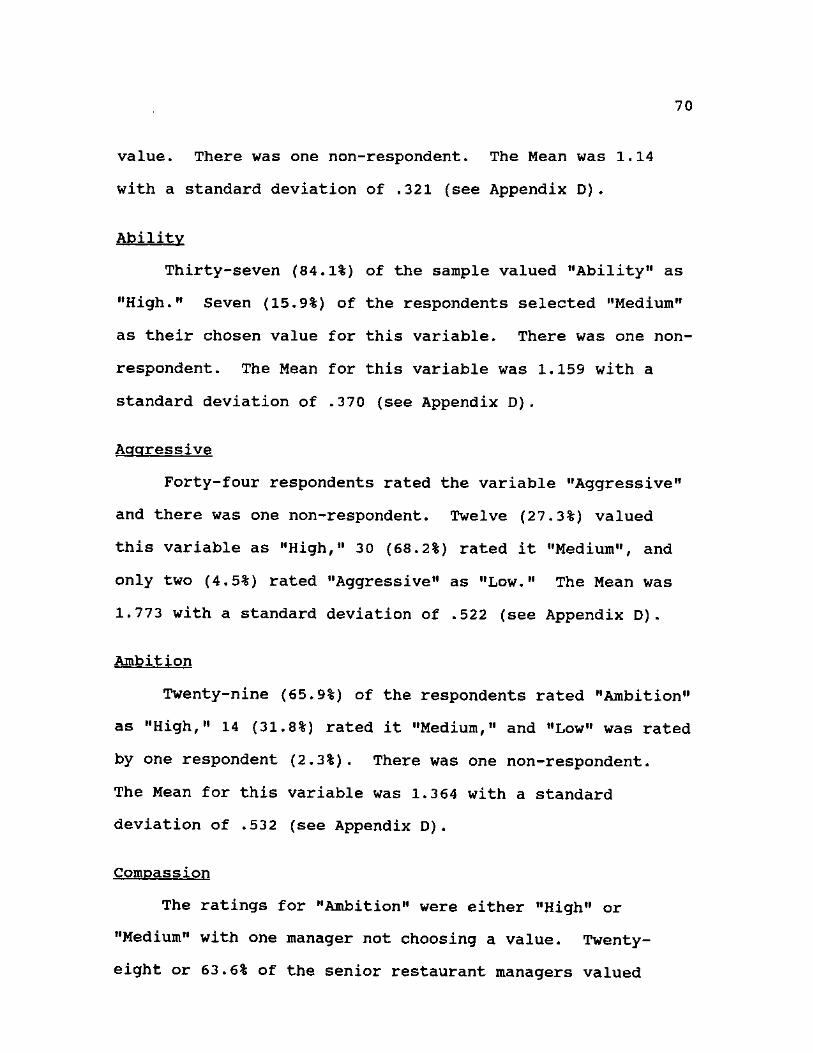
Ability H M L
Aggressiveness H M L
Ambition H M L
Compassion H M L
Conformity H M L •
Cooperation H M L . "
Honor H M L
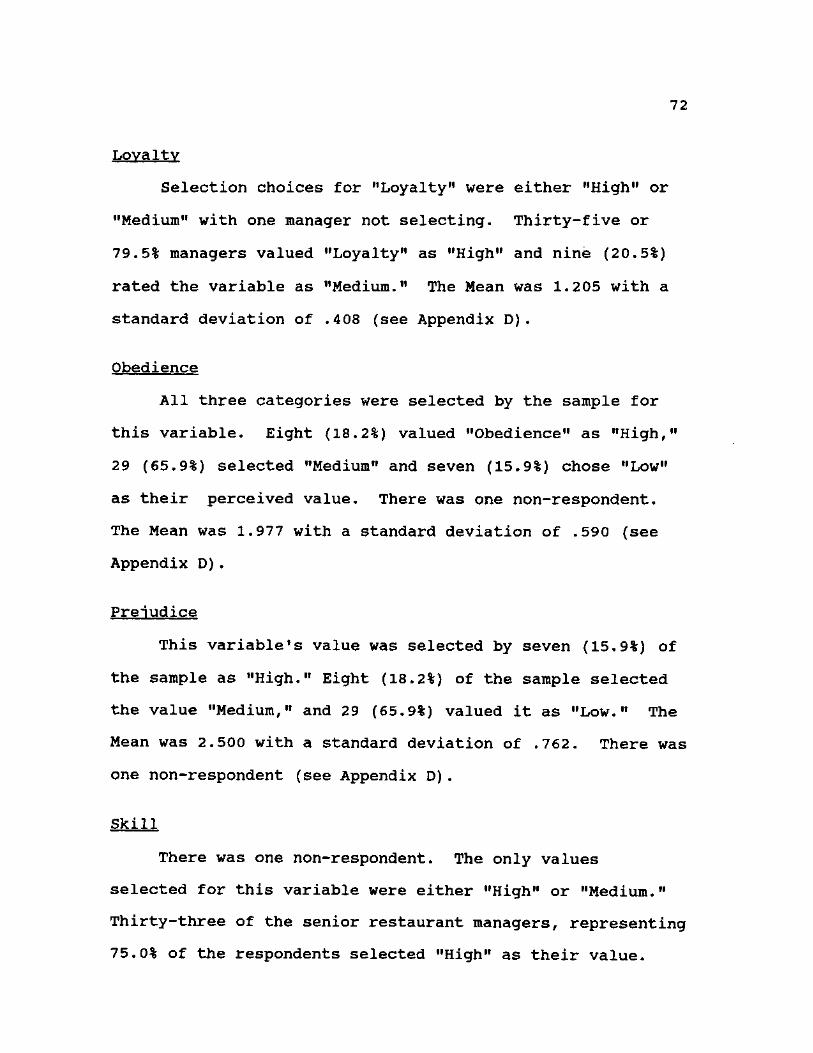
Loyalty H M L - —
Obedience H M L
Prejudice H M L •• -
Skill H M L ___ i Tolerance H M L ____ — —
Trust H M L
IDEAS ABOUT GENERAL TOPICS
Degree of Importance
CONCEPT HIGH MEDIUM LOW Pleasant Right Successful
Authority H M L • — _ —
Caution H M L ,
Change H M L
121
Competition H M L
Compromise H M L —
Conflict H M L — — — —
Conservatism H M L - ___
Emotions H M L - ____
Equality H M L •• Ml
Force H M L ___
Government H M L _ _
Liberalism H M L . ____
Property H M L I.
Reasonable H M L
Religion H M L M in. ___
Risk H M L
GROUPS OF PEOPLE
Degree of Importance
CONCEPT HIGH MEDIUM LOW Pleasant Right Successful
All Employees H M L , ,
Customers H M L
Government H M L
Highly-Skilled Workers H M L
Labor Unions H M L
Managers H M L . 1 1 M •
Me H M L
My Superior H M L
My Company H M L
My Co-Workers H M L • •n
My Assistants H M L • m .
Owners H M L — —
Semi-Skilled Workers H M L
122
Stockholders H M L
Technical Staff H M L
Unskilled Workers H M L
White-Co liar Workers H M L
PERSONAL AND ORGANIZATIONAL INFORMATION
DIRECTIONS: Please respond to each of the following items:
1. Your gender: a) male b) female
2. Your Marital Status:
a) Single b) Married
c) Divorced d) Remarried
e) Widow f) Widower
g) Other (please specify)
3. Your age:
4. Your formal education (check the highest one)
a) Some high school e) Bachelor's degree
b) High school degree f) Master's degree
c) Some college g) Doctorate
d) Technical training h) Other (please specify)
5. Your major field of study:
a) Humanities e) Biological Sciences
b) Fine Arts f) Social Science
c) Engineering g) Business Administration
d) Physical Sciences h) Other (please specify)
1 2 3
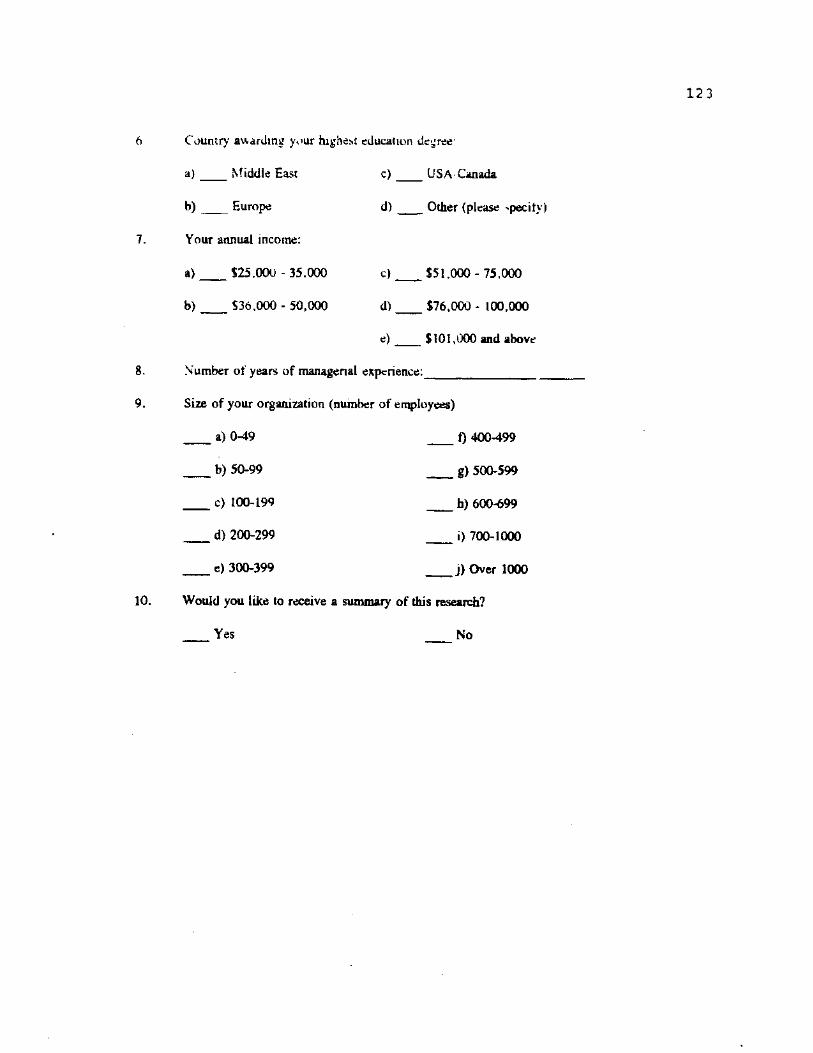
Country awarding your highest education degree-
a)
b)
Middle East
Europe
c) USA Canada
d) Other (please >pecify)
Your annual income:
a ) $25,000 - 35.000
b) 536,000 - 50,000
c)
d)
e)
$51,000 - 75.000
$76,000 - 100,000
$101,000 and above
8. Number of years of managerial experience:
9. Size of your organization (number of employees)
a) 0-49 f) 400-499
b) 50-99 g) 500-599
c) 100-199 h) 600-699
d) 200-299 i) 700-1000
e) 300-399 j) Over 1000
10. Would you like to receive a summary of this research?
Yes No
APPENDIX D
TABLES
124
Table 17
Employee Welfare
125
Valid Cum Value Label Value Frequency Percent Percent Percent
High 1 36 80.0 81.8 81.8
Medium 2 7 15.6 15.9 97.7
Low 3 1 2.2 2.3 100.0
9 1 2.2 Missing
Total 45 100.0 100.0
Note. Mean = 1.205; standard deviation = .462.
Table 18
Hiah Productivity
Value Label Value Frequency Percent Valid
Percent Cum
Percent
High 1 39 86.7 88.6 88.6
Medium 2 5 11.1 11.4 100.0
9 1 2.2 Missing
Total 45 100.0 100.0
Note. Mean = 1.114; standard deviation = .321.
126
Table 19
Industrial Leadership
Valid Cum Value Label Value Frequency Percent Percent Percent
High 1 22 48.9 50.0 50.0
Medium 2 16 35.6 36.4 86.4
Low 3 6 13.3 13.6 100.0
9 1 2.2 Missing
Total 45 100.0 100.0
Note. Mean = 1.636; standard deviation » .718.
Table 20
Oraanizational Efficiency
Valid Cum Value Label Value Frequency Percent Percent Percent
High 1 35
00 • 79.5 79.5
Medium 2 9 20.0 20.5 100.0
1 2.2 Missing
Total 45 100.0 100.0
Note. Mean = 1.205; standard deviation = .408.
127
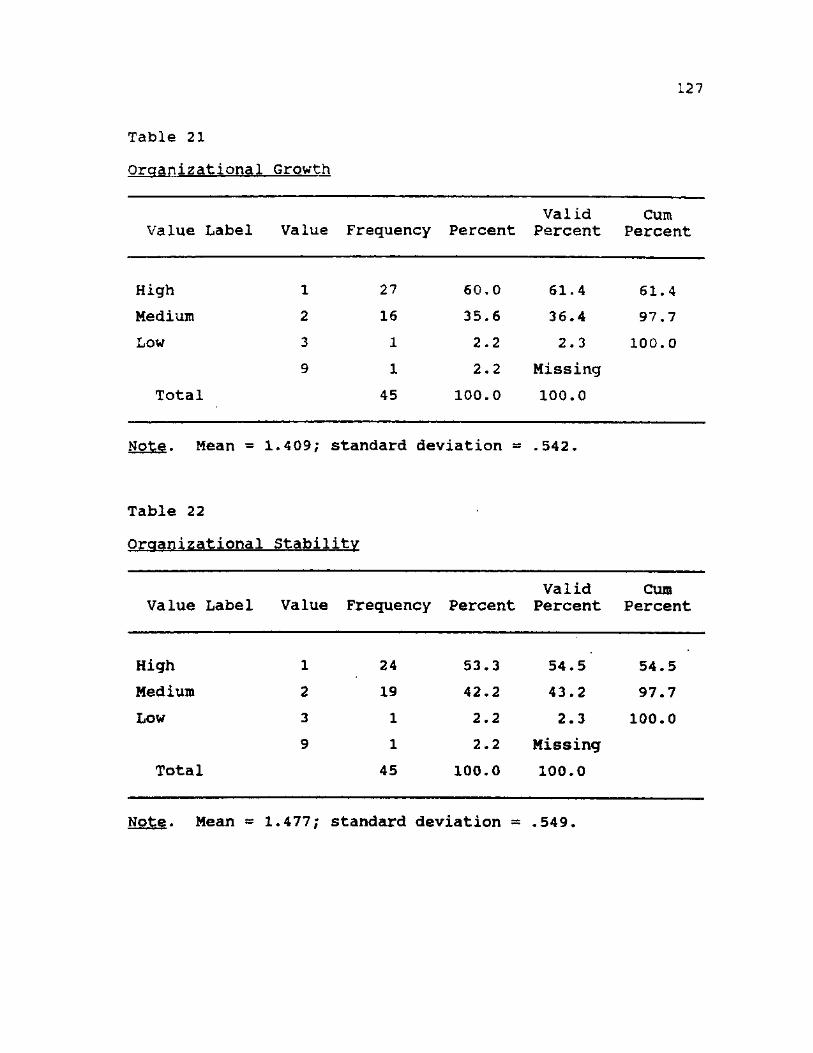
Table 21
Organizational Growth
Valid Cum Value Label Value Frequency Percent Percent Percent
High 1 27 60.0 61.4 61.4
Medium 2 16 35.6 36.4 97.7
Low 3 1 2.2 2.3 100.0
9 1 2.2 Missing
Total 45 100.0 100.0
Note. Mean - 1.409; standard deviation = .542.
Table 22
Organizational Stability
Valid Cum Value Label Value Frequency Percent Percent Percent
High 1 24 53.3 54.5 54.5
Medium 2 19 42.2 43.2 97.7
Low 3 1 2.2 2.3 100.0
9 1 2.2 Missing
Total 45 100.0 100.0
Note. Mean « 1.477; standard deviation = .549.
128
Table 23
Profit Maximization
Value Label Value Frequency Percent Valid Percent
Cum Percent
High 1 22 48.9 50.0 50.0
Medium 2 22 48.9 50.0 100.0
9 1 2.2 Missing
Total 45 100.0 100.0
Note. Mean = 1 .500; standard deviation = .506.
Table 24
Social Welfare
Value Label Value Frequency Percent Valid
Percent Cum
Percent
High 1 7 15.6 15.9 15.9
Medium 2 29 64.4 65.9 81.8
Low 3 8 17.8 18.2 100.0
9 1 2.2 Missing
Total 45 100.0 100.0
Note. Mean = 2 .023; standard deviation * .590.
129
Table 25
Achievement
Valid Cum Value Label Value Frequency Percent Percent Percent
High 1 39 86.7 88.6 88.6
Medium 2 4 8.9 9.1 97.7
Low 3 1 2.2 2.3 100.0
9 1 2.2 Missing
Total 45 100.0 100.0
Note. Mean = 1.136; standard deviation » .409.
Table 26
Autonomy
Valid Cum Value Label Value Frequency Percent Percent Percent
High 1 13 28.9 29.5 29.5
Medium 2 26 57.8 59.1 88.6
Low 3 5 11.1 11.4 100.0
9 1 2.2
Total 45 100.0 100.0
Note. Mean « 1.818; standard deviation = .620.
130
Table 27
Dignity
Value Label Value Frequency Percent Valid Percent
Cum Percent
High 1 39 86.7 88.6 88.6
Medium 2 5 11.1 11.4 100.0
9 1 2.2 Missing
Total 45 100.0 100.0
Note. Mean = 1.114; standard deviation = .321.
Table 28
Individuality
Value Label Value Frequency Percent Valid Percent
Cum Percent
High 1 19 42.2 43.2 43.2
Medium 2 22 48.9 50.0 93.2
Low 3 3 6.7 6.8 100.0
9 1 2.2 Missing
Total 45 100.0 100.0
Note. Mean = 1.636; standard deviation = .613.
131
Table 29
Influence
Value Label Value Frequency Percent Valid Percent
Cum Percent
High 1 15 33.3 34.1 34.1
Medium 2 27 60.0 61.4 95.5
Low 3 2 4.4 4.5 100.0
9 1 2.2 Missing
Total 45 100.0 100.0
Note. Mean = 1.705; standard deviation = .553.
Table 30
Innovation
Value Label Value Frequency Percent Valid Percent
Cum Percent
High 1 26 57.8 59.1 59.1
Medium 2 15 33.3 34.1 93.2
Low 3 3 6.7 6.8 100.0
9 1 2.2 Missing
Total 45 100.0 100.0
Note. Mean = 1.477; standard deviation = .628.
132
Table 31
Job Satisfaction
Value Label Value Frequency Percent Valid
Percent Cum
Percent
High 1 43 95.6 97.7 97.7
Medium 2 1 2.2 2.3 100.0
9 1 2.2 Missing
Total • 45 100.0 100.0
Note. Mean = 1.023; standard deviation = .151.
Table 32
Job Securitv
Value Label Value Frequency Percent Valid
Percent Cum
Percent
High 1 23 51.1 52.3 52.3
Medium 2 20 44.4 45.5 97.7
Low 3 1 2.2 2.3 100.0
9 1 2.2 Missing
Total 45 100.0 100.0
N o t e M e a n = 1.500; standard deviation • .550.
133
Table 3 3
Leisure
Value Label Value Frequency Percent Valid Percent
Cum Percent
High 1 8 17.8 18.2 18.2
Medium 2 27 60.0 61.4 79.5
Low 3 9 20.0 20.5 100.0
9 1 2.2 Missing
Total 45 100.0 100.0
Note. Mean » 2.023; standard* deviation = .628.
Table 34
Monev
Value Label Value Frequency Percent Valid Percent
Cum Percent
High 1 21 46.7 47.7 47.7
Medium 2 22 48.9 50.0 97.7
Low 3 1 2.2 2.3 100.0
9 1 2.2 Missing
Total 45 100.0 100.0
Note. Mean = 1.545; standard deviation = .548.
134
Table 35
Power
Value Label Value Frequency Percent Valid
Percent Cum
Percent
High 1 6 13.3 13.6 13.6
Medium 2 29 64.4 65.9 79.5
Low 3 9 20.0 20.5 100.0
9 1 2.2 Missing
Total 45 100.0 100.0
Note. Mean = 2.068; standard deviation = .587.
Table 36
Prestiae
Value Label Value Frequency Percent Valid Percent
Cum Percent
High 1 7 15.6 15.9 15.9
Medium 2 37 82.2 84.1 100.0
9 1 2.2 Missing
Total 45 100.0 100.0
Note. Mean = 1.841; standard deviation = .370.
135
Table 37
Success
Value Label Value Frequency Percent Valid Percent
Cum Percent
High 1 39 86.7 88.6 88.6
Medium 2 5 11.1 11.4 100.0
9 1 2.2 Missing
Total 45 100.0 100.0
Note. Mean = 1.114; standard deviation = .321.
Table 38
Abilitv
Value Label Value Frequency Percent Valid
Percent Cum
Percent
High 1 37 82.2 84.1 84.1
Medium 2 7 15.6 15.9 100.0
9 1 2.2 Missing
Total 45 100.0 100.0
Note. Mean = 1.159; standard deviation = .370.
136
Table 39
Aggressive
Value Label Value Frequency Percent Valid Percent
Cum Percent
High 1 12 26.7 27.3 27.3
Medium 2 30 66.7 68.2 95.5
Low 3 2 4.4 4.5 100.0
9 1 2.2 Missing
Total 45 100.0 100.0
Note. Mean = 1.773; standard deviation = .522.
Table 40
Ambition
Value Label Value Frequency Percent Valid Percent
Cum Percent
High 1 29 64.4 65.9 65.9
Medium 2 14 31.1 31.8 97.7
Low 3 1 2.2 2.3 100.0
9 1 2.2 Missing
Total 45 100.0 100.0
Note. Mean = 1.364; standard deviation • .532.
137
Table 41
Compassion
Value Label Value Frequency Percent Valid
Percent Cum
Percent
High 1 28 62.2 63.6 63.6
Medium 2 16 35.6 36.4 100.0
9 1 2.2 Missing
Total 45 100.0 100.0
Note. Mean » 1.364; standard deviation = .487.
Table 42
Conformity
Value Label Value Frequency Percent Valid Percent
Cum Percent
High 1 5 11.1 11.4 11.4
Medium 2 19 42.2 43.2 54.5
Low 3 20 44.4 45.5 100.0
9 1 2.2 Missing
Total 45 100.0 100.0
Note. Mean = 2.341; standard deviation = .680.
138
Table 4 3
Cooperation
Value Label Value Frequency Percent Valid Percent
Cum Percent
High 1 30 66.7 68.2 68.2
Medium 2 14 31.1 31.8 100.0
9 1 2.2 Missing
Total 45 100.0 100.0
Note„ Mean = 1.318; standard deviation = .471.
Table 44
Honor
Value Label Value Frequency Percent Valid Percent
Cum Percent
High 1 40 88.9 90.9 90.9
Medium 2 4 8.9 9.1 100.0
9 1 2.2 Missing
Total 45 100.0 100.0
Note. Mean » 1.091; standard deviation = .291.
139
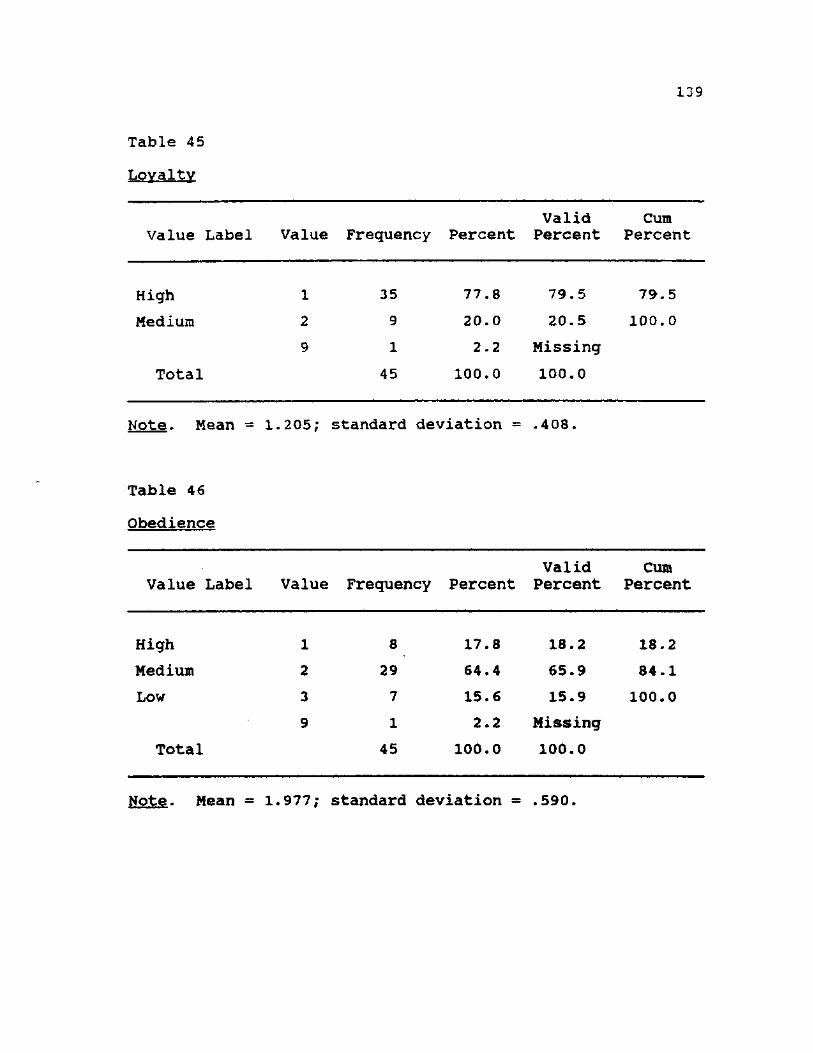
Table 45
Lovaltv
Value Label Value Frequency Percent Valid Percent
Cum Percent
High 1 35 77.8 79.5 79.5
Medium 2 9 20.0 20.5 100.0
9 1 2.2 Missing
Total 45 100.0 100.0
Note. Mean = 1.205; standard deviation = .408.
Table 46
Obedience
Value Label Value Frequency Percent Valid Percent
Cum Percent
High 1 8 17.8 18.2 18.2
Medium 2 29 64.4 65.9 84.1
Low 3 7 15.6 15.9 100.0
9 1 2.2 Missing
Total 45 100.0 100.0
Note. Mean = 1.977; standard deviation * .590.
.40
Table 47
Prejudice
Value Label Value Frequency Percent Valid Percent
Cum Percent
High 1 7 15.6 15.9 15.9
Medium 2 8 17.8 18.2 34.1
Low 3 29 64.4 65.9 100.0
9 1 2.2 Missing
Total 45 100.0 100.0
Note. Mean = 2.500; standard deviation = .762.
Table 48
Skill
Value Label Value Frequency Percent Valid Percent
Cum Percent
High 1 33 73.3 75.0 75.0
Medium 2 11 24.4 25.0 100.0
9 1 2.2 Missing
Total 45 100.0 100.0
Note. Mean = 1.250; standard deviation = .438.
141
Table 49
Tolerance
Value Label Value Freauency Percent Valid Percent
Cum Percent
High 1 17 37.8 38.6 38.6
Medium 2 25 55.6 56.8 95.5
Low 3 2 4.4 4.5 100.0
9 1 2.2 Missing
Total 45 100.0 100.0
Note. Mean = 1.659; standard deviation = .568.
Table 50
Trust
Value Label Value Frequency Percent Valid
Percent Cum
Percent
High 1 43 95.6 97.7 97.7
Medium 2 1 2.2 2.3 100.0
9 1 2.2 Missing
Total 45 100.0 100.0
Note. Mean = 1.023; standard deviation = .151.
142
Table 51
All Employees
Value Label Value Frequency Percent Valid Percent
Cum Percent
High 1 35 77.8 77.8 77.8
Medium 2 9 20.0 20.0 97.8
Low 3 1 2.2 2.2 100.0
Total 45 100.0 100.0
Note. Mean = 1.244; standard deviation = .484.
Table 52
Customers
Value Label Value Frequency Percent Valid Percent
Cum Percent
High 1 43 95.6 95.6 95.6
Medium 2 2 4.4 4.4 100.0
Total 45 100.0 100.0
Note. Mean = 1.044; standard deviation = .208.
143
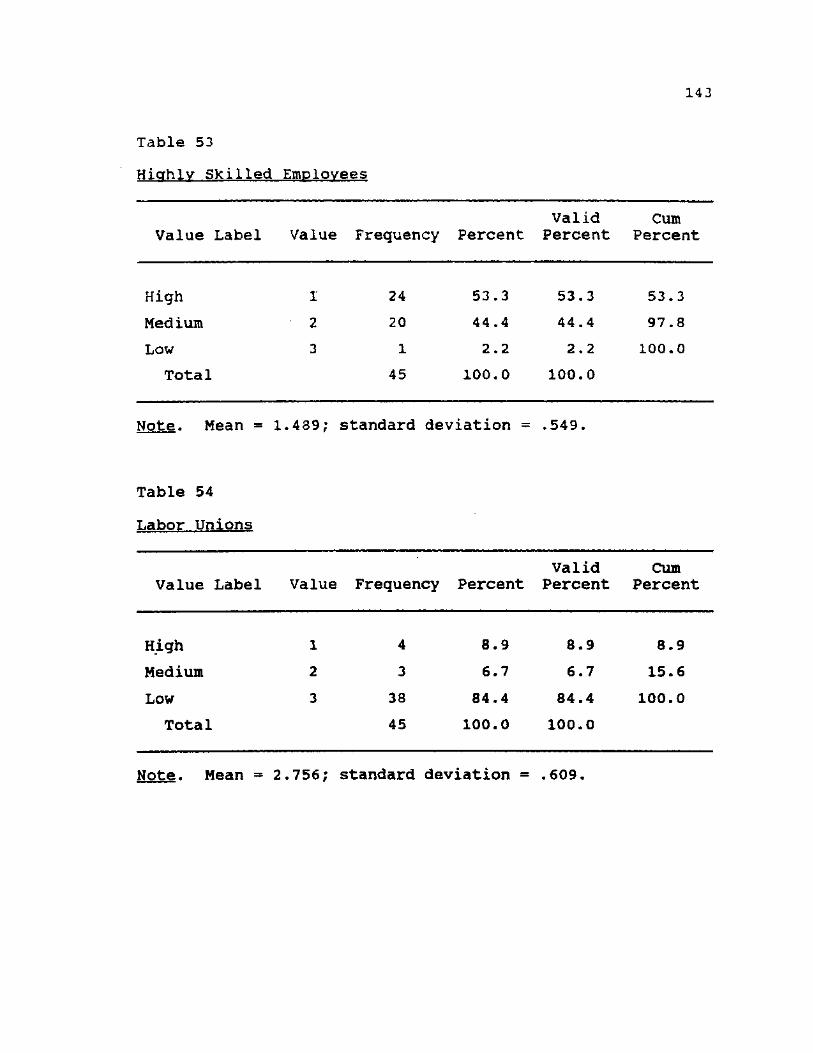
Table 53
Highly Skilled Employees
Value Label Value Frequency Percent Valid Percent
Cum Percent
High 1 24 53.3 53.3 53.3
Medium 2 20 44.4 44.4 97.8
Low 3 1 2.2 2.2 100.0
Total 45 100.0 100.0
Note. Mean = 1.489; standard deviation = .549.
Table 54
Labor Unions
Value Label Value Frequency Percent Valid Percent
Cum Percent
High 1 4 8.9 8.9 8.9
Medium 2 3 6.7 6.7 15.6
Low 3 38 84.4 84.4 100.0
Total 45 100.0 100.0
Note. Mean = 2.756; standard deviation « .609.
144
Table 55
Managers
Value Label Value Frequency Percent Valid Percent
Cum Percent
High 1 32 7 1 . 1 7 2 . 7 7 2 . 7
Medium 2 12 2 6 . 7 2 7 . 3 1 0 0 . 0
9 1 2 . 2 Missing
Total 45 1 0 0 . 0 1 0 0 . 0
Note. Mean = 1 . 2 7 3 ; standard deviation = . 4 5 1 .
Table 56
Me
Value Label Value Frequency Percent Valid Percent
Cum Percent
High 1 34 7 5 . 6 7 7 . 3 7 7 . 3
Medium 2 8 1 7 . 8 1 8 . 2 9 5 . 5
Low 3 2 4 . 4 4 . 5 1 0 0 . 0
9 1 2 . 2 Missing
Total 45 1 0 0 . 0 1 0 0 . 0
Note. Mean » 1 . 2 7 3 ; standard deviation = . 5 4 4 .
145
Table 57
Mv Supervisor
Value Label Value Frequency Percent Valid Percent
Cum Percent
High 1 34 75.6 75.6 75.6
Medium 2 11 24.4 24.4 100.0
Total 45 100.0 100.0
Note. Mean = 1.244; standard deviation = .435.
Table 58
Mv ComiDanv
Value Label Value Frequency Percent Valid Percent
Cum Percent
High 1 40 88.9 88.9 88.9
Medium 2 5 11.1 11.1 110.0
Total 45 100.0 100.0
Note. Mean = 1.111; standard deviation = .318.
146
Table 59
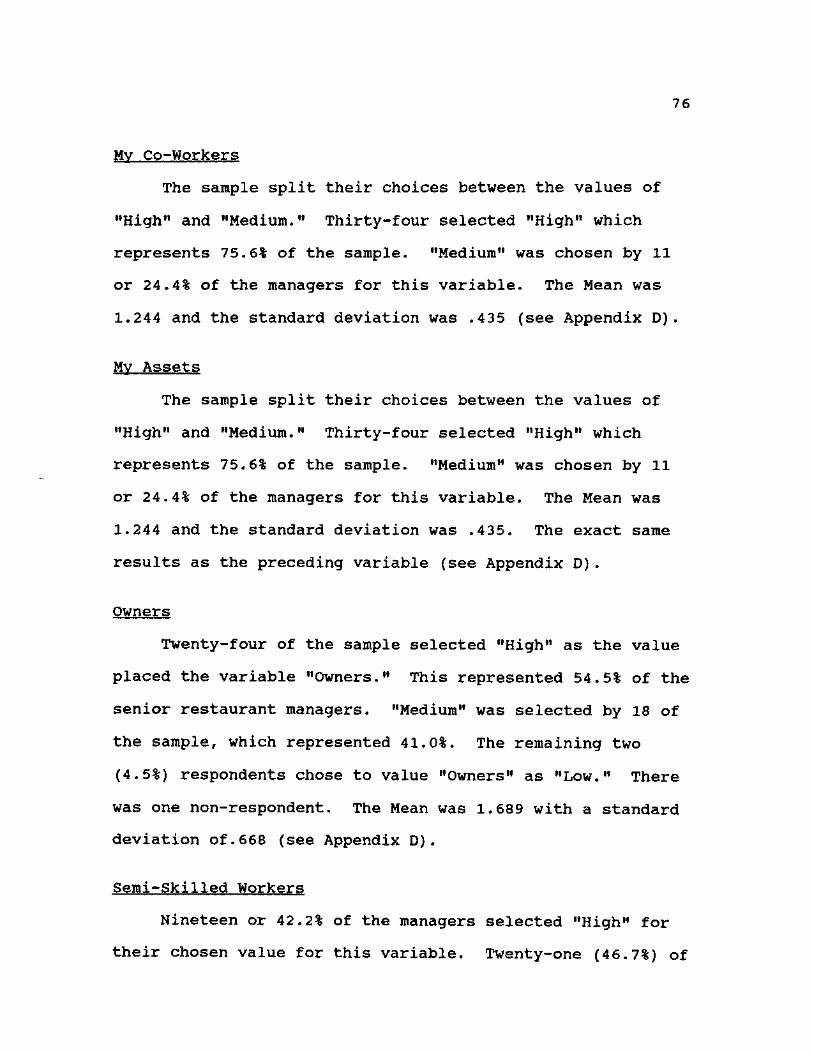
Mv Co-Workers
Value Label Value Frequency Percent Valid
Percent Cum
Percent
High 1 34 75.6 75.6 75.6
Medium 2 11 24.4 24.4 100.0
Total 45 100.0 100.0
Note. Mean « 1.244; standard deviation = .435.
Table 60
Mv Assets
Value Label Value Frequency Percent Valid
Percent Cum
Percent
High 1 34 75.6 75.6 75.6
Medium 2 11 24.4 24.4 100.0
Total 45 100.0 100.0
Note. Mean = 1.244; standard deviation = .435.
147
Table 6
Owners
Valid Cum Value Label Value Frequency Percent Percent Percent
High 1 24 53.3 54.5 54.5
Medium 2 18 40.0 40.9 95.5
Low 3 2 4.4 4.5 100.0
9 1 2.2 Missing
Total 45 100.0 100.0
Note. Mean « 1.500; standard deviation = .591.
Table 62
Semi-Skilled Workers
Valid Cum Value Label Value Frequency Percent Percent Percent
High 1 19 42.2 42.2 42.2
Medium 2 21 46.7 46.7 88.9
Low 3 5 11.2 11.1 100.0
Total 45 100.0 100.0
Note. Mean = 1.689; standard deviation = .668.
148
Table 63
Stockholders
Value Label Value Frequency Percent Valid Percent
Cum Percent
High 1 22 48.9 50.0 50.0
Medium 2 17 37.8 38.6 88.6
Low 3 5 11.1 11.4 100.0
9 1 2.2 Missing
Total 45 100.0 100.0
Note. Mean = 1 .614; standard deviation = .689.
Table 64
Technical Staff
Value Label Value Frequency Percent Valid Percent
Cum Percent
High 1 22 48.9 48.9 48.9
Medium 2 21 46.7 46.7 95.6
Low 3 2 4.4 4.4 100.0
Total 45 100.0 100.0
Note. Mean = 1.556; standard deviation « .586
149
Table 65
Unskilled Workers
Valid Cum Value Label Value Frequency Percent Percent Percent
High 1 18 40.0 40.0 40.0
Medium 2 19 42.2 42.2 82.2
Low 3 8 17.8 17.8 100.0
Total 45 100.0 100.0
Note. Mean = 1.778; standard deviation = .735.
Table 66
White Collar Emolovees
Valid Cum Value Label Value Frequency Percent Percent Percent
High 1 19 42.2 42.2 42.2
Medium 2 24 53.3 53.3 95.6
Low 3 2 4.4 4.4 100.0
Total 45 100.0 100.0
Note. Mean = 1.622; standard deviation « .576.
150
Table 67
Authority
Valid Cum Value Label Value Frequency Percent Percent Percent
High 1 16 35.6 35.6 35.6
Medium 2 27 60.0 60.0 95.6
Low 3 2 4.4 4.4 100.0
Total 45 100.0 100.0
Note. Mean = 1.689; standard deviation = .557.
Table 68
Caution
Valid Cum Value Label Value Frequency Percent Percent Percent
High 1 3 6.7 6.7 6.7
Medium 2 30 66.7 66.7 73.3
Low 3 12 26.7 26.7 100.0
Total 45 100.0 100.0
Note. Mean = 2.200; standard deviation = .548.
151
Table 69
Change
Value label Value Frequency Percent Valid Percent
Cum Percent
High 1 29 64.4 64.4 64.4
Medium 2 16 35.6 35.6 100.0
Total 45 100.0 100.0
Note. Mean = 1.356; standard deviation = .484.
Table 70
ComDetition
Value Label Value Frequency Percent Valid Percent
Cum Percent
High 1 32 71.1 71.1 71.1
Medium • 2 13 28.9 28.9 100.0
Total 45 100.0 100.0
Note. Mean » 1.289; standard deviation « .458.
152
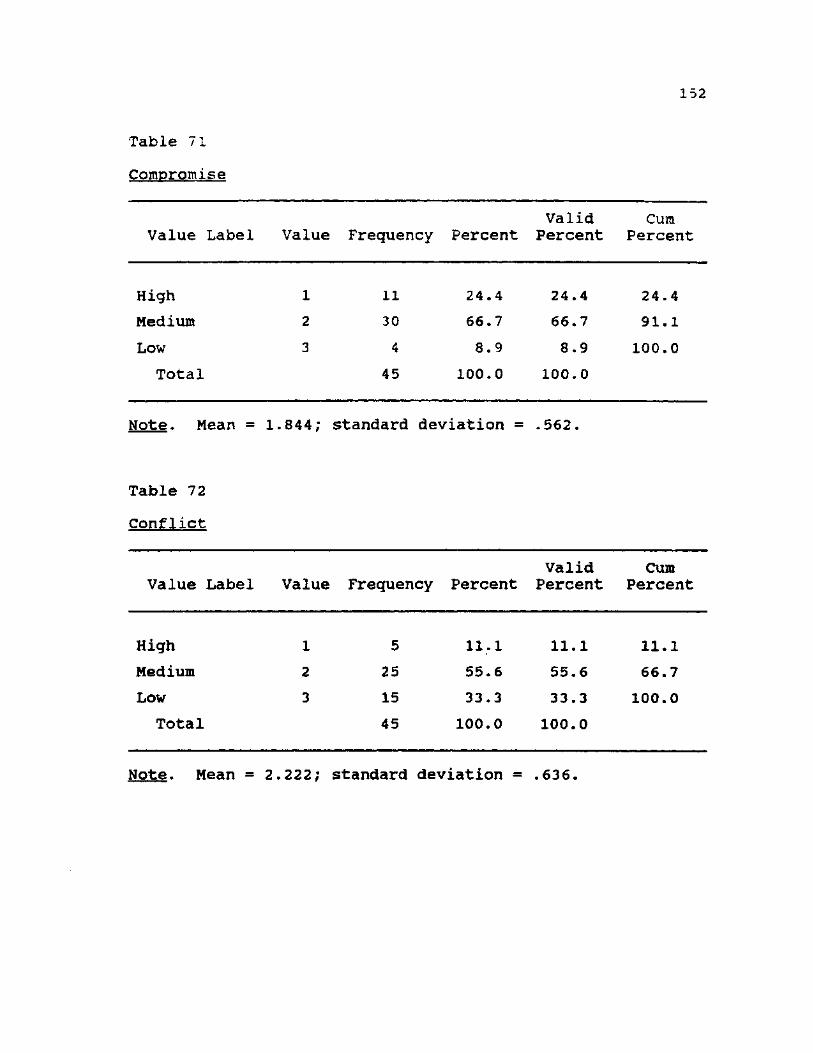
Table 71
Compromise
Value Label Value Frequency Percent Valid
Percent Cum
Percent
High 1 11 24.4 24.4 24.4
Medium 2 30 66.7 66.7 91.1
Low 3 4 8.9 8.9 100.0
Total 45 100.0 100.0
Note. Mean = 1.844; standard deviation = .562.
Table 72
Conflict
Value Label Value Frequency Percent Valid
Percent Cum
Percent
High 1 5 11.1 11.1 11.1
Medium 2 25 55.6 55.6 66.7
Low 3 15 33.3 33.3 100.0
Total 45 100.0 100.0
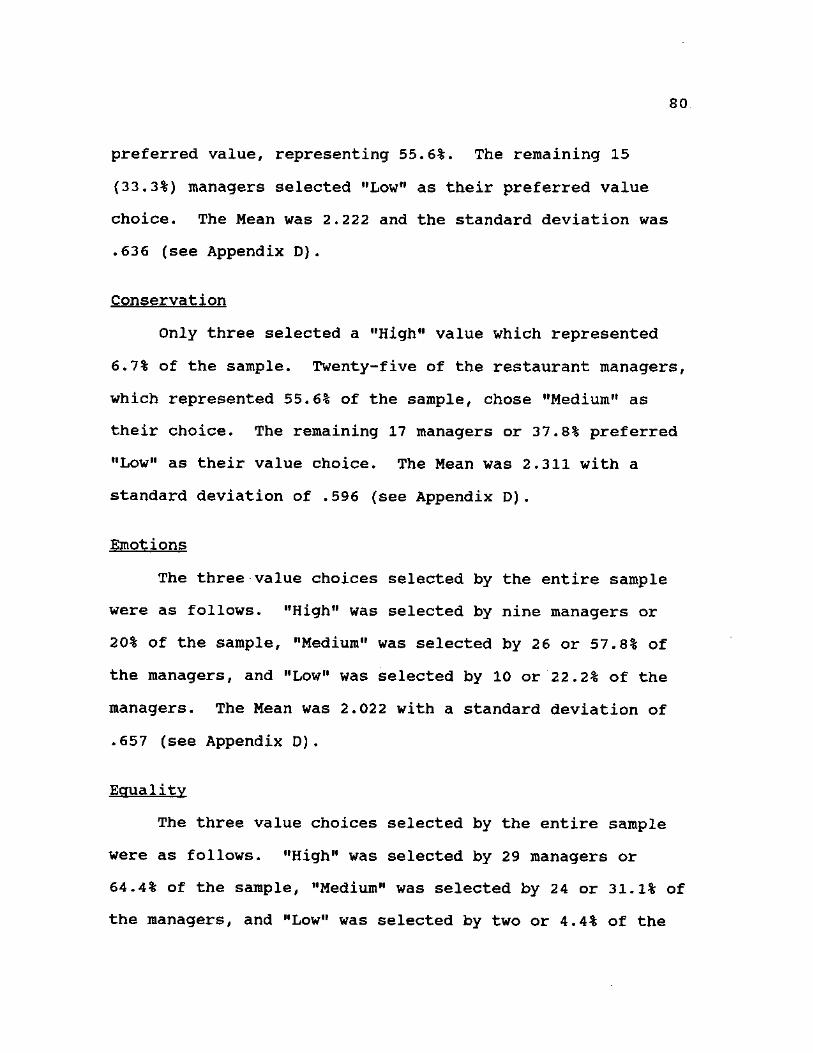
Note. Mean = 2.222; standard deviation = .636
153
Table 73
Conservation
Value Label Value Frequency Percent Valid Percent
Cum Percent
High 1 3 6.7 6.7 6.7
Medium 2 25 55.6 55.6 62.2
Low 3 17 37.8 37.8 100.0
Total 45 100.0 100.0
Note. Mean = 2.311; standard deviation = .596.
Table 74
Emotions
Value Label Value Frequency Percent Valid Percent
Cum Percent
High 1 9 2Q.0 20.0 20.0
Medium 2 26 57.8 57.8 77.8
Low 3 10 22.2 22.2 100.0
Total 45 100.0 100.0
Note. Mean = 2.022; standard deviation = .657.
154
Table 75
Equality
Value Label Value Frequency Percent Valid Percent
Cum Percent
High 1 29 64.4 64.4 64.4
Medium 2 14 31.1 31.1 95.6
Low 3 2 4.4 4.4 100.0
Total 45 100.0 100.0
Note. Mean « 1.400; standard deviation = .580.
Table 76
Force
Value Label Value Frequency Percent Valid
Percent Cum
Percent
High 1 2 4.4 4.4 4.4
Medium 2 16 35.6 35.6 40.0
Low 3 27 60.0 60.0 100.0
Total 45 100.0 100.0
Note. Mean = 2.556; standard deviation = .586.
155
Table 7 7
Government
Value Label Va lue Frequency Percent Valid Percent
Cum Percent
High 1 11 24.4 24.4 24.4
Medium 2 15 33.3 33.3 57.8
Low 3 19 42.2 42.2 100.0
Total 45 100.0 100.0
Note. Mean = 2.178; standard deviation - .806.
Table 78
Liberalism
Value Label Value Frequency Percent Valid
Percent Cum
Percent
High 1 4 8.9 8.9 8.9
Medium 2 17 37.8 37.8 46.7
Low 3 24 53.3 53.3 100.0
Total 45 100.0 100.0
Note. Mean = 2.444; standard deviation = .659.
156
Table 79
Property
Value Label Value Frequency Percent Valid Percent
Cum Percent
High 1 20 44.4 44.4 44.4
Medium 2 19 42.2 42.2 86.7
Low 3 6 13.3 13.3 100.0
Total 45 100.0 100.0
Note. Mean = 1.689; standard deviation = .701.
Table 80
Reasonable
Value Label Value Frequency Percent Valid Percent
Cum Percent
High 1 30 66.7 66.7 . 66.7
Medium 2 14 31.1 31.1 97.8
Low 3 1 2.2 2.2 100.0
Total 45 100.0 100.0
Note. Mean = 1.356; standard deviation = .529.
157
Table 81
Religion
Value Label Value Frequency Percent Valid
Percent Cum
Percent
High 1 17 37.8 37.8 37.8
Medium 2 21 46.7 46.7 84.4
Low 3 7 15.6 15.6 100.0
Total 45 100.0 100.0
Note. Mean = 1.778; standard deviation = .704.
Table 82
Risk
Value Label Value Frequency Percent Valid Percent
Cum Percent
High 1 37.8 40.5 40.5
Medium 2 23 51.1 54.8 95.2
Low 3 2
3
4.4
6.7
4.8
Missing
100.0
Total 45 100.0 100.0
Note. Mean = 1.643; standard deviation = .577.
158
Table 83
Gender
Gender Value Frequency Percent Valid Percent
Cum Percent
Male 1 40 88.9 88.9 88.9
Female 2 5 11.1 11.1 100.0
Total 45 100.0 100.0
Note. Mean = 1 . Ill; standard deviation = .318.
Table 84
Marital Status
Status Value Frequency Percent Valid
Percent Cum
Percent
Not Married 1 6 13.2 13.2
Married 2 39 85.8 100.0
Total 45 100.0 100.0
Note. Mean = 1 .688; standard deviation = .556.
159
Table 85
Age
Range of Age
Frequency Percent Valid Percent
Cum Percent
29 1 2.2 2.4 2.4
34 1 2.2 2.3 4.7
35 1 2.2 2.3 7.0
36 1 2.2 2.3 9.3
38 3 6.7 7.0 16.3
40 3 6.7 7.0 23.3
41 2 4.4 4.7 27.9
42 5 11.1 11.6 39.5
43 2 4.4 4.7 44.2
44 2 4.4 4.7 48.8
45 4 8.9 9.3 58.1
46 4 8.9 9.3 67.4
47 3 6.7 7.0 74.4
49 1 2.2 2.3 76.7
50 2 4.4 4.7 81.4
51 I 2.2 2.3 83.7
52 1 2.2 2.3 86.0
58 1 2.2 2.3 88.4
60 2 4.4 4.7 93.0
62 1 2.2 2.3 95.3
67 1 2.2 2.3 97.7
69 1 2.2 2.3 100.0
99 2 4.4 Missing
Total 45 100.0 100.0
Note. Mean = 45.744; standard deviation ® 8.421.
160
Table 86
Formal Education
Type of School Value Frequency Percent
Valid Percent
Cum Percent
High School 1 1 2.2 2.2 2.2
Some College 2 3 6.7 6.7 8.9
Bachelor degree
3 24 53.3 53.3 62.2
Master degree 4 14 31.1 31.1 93.3
Doctorate 5 2 4.4 4.4 97.8
Tech degree 6 1 2.2 2.2 100.0
Total 45 100.0 100.0
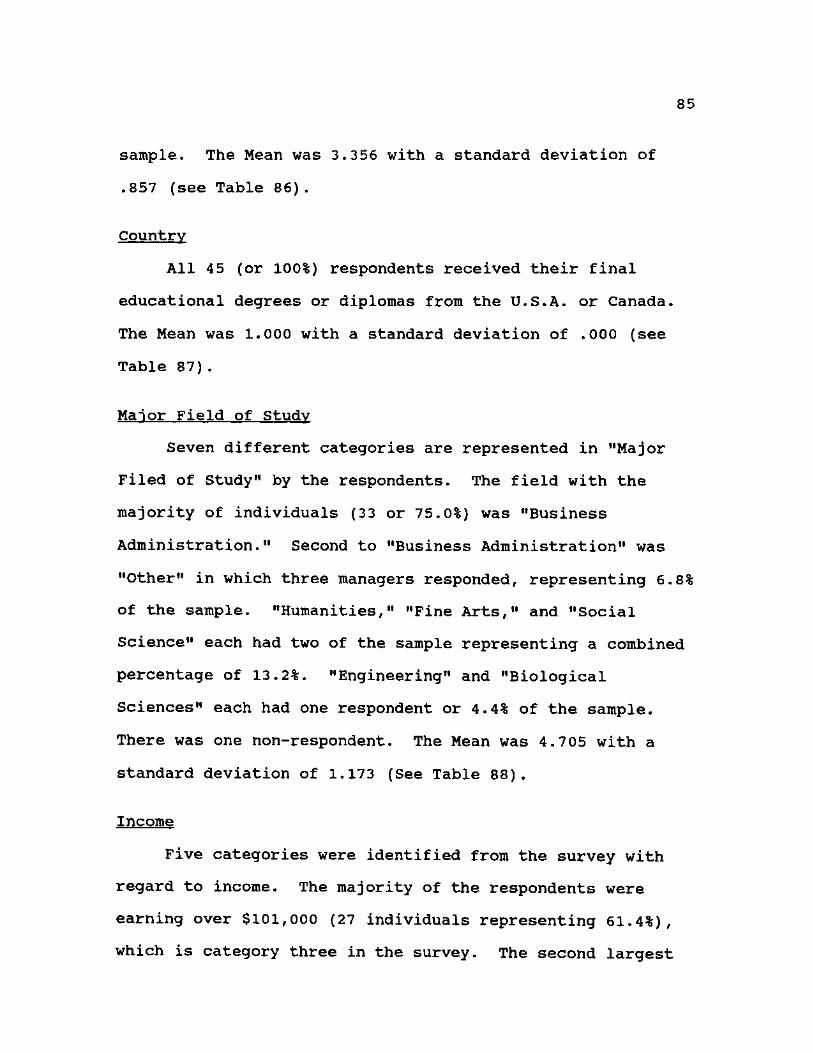
Note. Mean = 3 .356; standard deviation » .857.
Table 87
Country
Country Awarding Degree
Value Frequency Percent Valid Percent
Cum Percent
USA/Canada 1 45 100.0 100.0 100.0
Total 45 100.0 100.0
Note. Mean = 1.000; standard deviation = .000.
161
Table 88
Maior Field of Study
Areas Where Degreed Value Frequency Percent
Valid Percent
Cum Percent
Humanities 1 2 4.4 4.5 4.5
Fine arts 2 2 4.4 4.5 9.1
Engineering 3 1 2.2 2.3 11.4
Social science 4 2 4.4 4.5 15.9
Business 5 33 73.3 75.0 90.9
Other 6 3 6.7 6.8 97.7
Bio Science 7 1 2.2 2.3 100.0
9 1 2.2 Missing
Total 45 100.0 100.0
Note. Mean = 4.705; standard deviation = 1.173.
162
Table 89
Income
Range of Valid Cum Income Value Frequency Percent Percent Percent
36K to 5OK 1 4 8.9 9.1 9.1
5IK to 75K 2 3 6.7 6.8 15.9
76K to 100K 3 8 17.8 18.2 34.1
101K+ 4 27 60.0 61.4 95.5
25K to 35K 5 2 4.4 • 4.5 100.0
9 1 2.2 Missing
Total 45 100.0 100.0
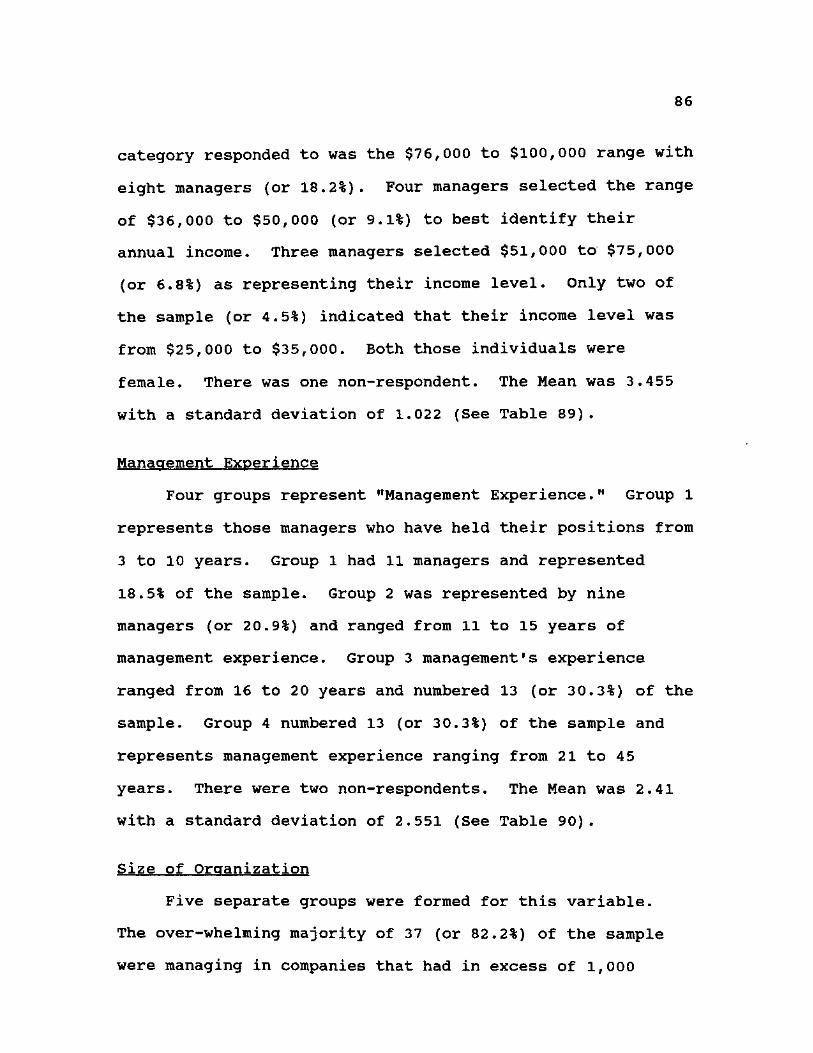
Note. Mean » 3.455; standard deviation = 1.022.
Table 90
Manacrement Experience
Range of Valid Cum Years Value Frequency Percent Percent Percent
Arkin, H., & Colton, R. R. (1950). Tables for statisticians. New York: Barnes and Noble, Inc.
Armistead, C. B. (1989). Customer service and operations in service business. The Service Industries Journal, 9(2), 247-260.
Atkinson, A., Branch, C., & LaHatte, G. (1987, August). Training for excellence. The Cornell Hotel and Restaurant Administration Quarterly. 28(1), 15-17.
Aylward, S. (1991). An employee of the National Restaurant Association: Washington, D.C. Telephone interview conducted by the author in April.
Bob Evans Farms, Inc. (1990). Annual report (90-5024-C). St. Petersburg, FL: Q Data Corporation.
Buffets, Inc. (1989). Annual report (89-5850-C). St. Petersburg, FL: Q Data Corporation.
Carl Karcher Enterprises, Inc. (1990). Annual report (90-5020—D). St. Petersburg, FL: Q Data Corporation.
Cracker Barrel Old Country Store, Inc. (1990). Annual report (90-5231-B). St. Petersburg, FL: Q Data Corporation.
England, G. W. (1967, March). Personal value systems of American managers. Academy of Management Journal. io, 53-68.
England, G. W. (1975). The manager and his values: An international perspective. Cambridge, MA: Ballinger.
Frisch's. (1990). Annual report (90-1028-B). St. Petersburg, FL: Q Data Corporation.
Furr's/Bishop's Cafeterias LP. (1989). Annual report (89—1360-C). St. Petersburg, FL: Q Data Corporation.
General Mills International, Inc. (1990). Annual report (90-1035-A). St. Petersburg, FL: Q Data Corporation.
177
178
Gilbert-Robinson Holding Company. (1989). Annual report (89-5674-B). St. Petersburg, FL: Q Data Corporation.
Godfather's Pizza, Inc. (1982). Annual report (82-1167-D). St. Petersburg, FL: Q Data Corporation.
Grand Metropolitan PLC. (1989). Annual report (90-5020-D). St. Petersburg, FL: Q Data Corporation.
Hayajneh, A. F. (1990). Personal value systems of American and Jordanian managers: A cross-cultural study. Unpublished doctoral dissertation, University of North Texas, Denton, TX.
Henderson, R. I. (1989). Compensation management: Rewarding performance (5th ed.). Englewood Cliffs, NJ: Prentice Hall.
IMASCO, Ltd. (1987). Annual report (87-5878-C). St. Petersburg, FL: Q Data Corporation.
International Dairy Queen, Inc. (1989). Annual report (89-5480-D). St. Petersburg, FL: Q Data Corporation.
International Proteins Corporation. (1989). Annual report (89-1498-E). St. Petersburg, FL: Q Data Corporation.
Kettle Restaurants, Inc. (1989). Annual report (89-5474-D). St. Petersburg, FL: Q Data Corporation.
Kotter, J. (1982). The general managers. New York: The Free Press.
Lewis, R. C., & Chambers, R. E. (1989). Marketing and leadership in hospitality. New York: VanNostrand Reinhold.
Lusk, E. J., & Oliver, B. L. (1974). American managers' personal value systems revisited. Academy of Management Journal. 17(3), 549-554.
Maslow, A. H. (1954). Motivation and personality (2d ed.). New York: Harper Brothers.
Morrison, Inc. (1990). Annual report (90-5102-H). St. Petersburg, FL: Q Data Corporation.
Norusis, M.J., (1988). SPSS/PC+, studentware. Chicago, IL: SPSS, Inc.
179
Piccadilly Cafeterias, Inc. (1989). Annual report (89-5178-1). St. Petersburg, FL: Q Data Corporation.
Rally's, Inc. (1990). Annual report (90-6265-D). St. Petersburg, FL: Q Data Corporation.
Roach, D. (1989). Washington Report: Restauranteurs—a key part of the debate. Restaurant USA. 9(1), 8.
Santos, R. D. (1990). Faculty and administrators' job preferential and job satisfaction factors at the University of Guam. Unpublished doctoral dissertation, University of North Texas, Denton, TX.
Schuler, R. S. (1987). Personnel and human resource management (3rd ed.). St. Paul, MN: West.
Small, R. (1987). Small, Robert: Excellence and employees. The Cornell Hotel and Restaurant Administration Quarterly. 28(2), 73-76.
Sonic Industries, Inc. (1985). Annual report (85-5119-J). St. Petersburg, FL: Q Data Corporation.
TGIF Texas, Inc. (1986). Annual report (86-1175-H). St. Petersburg, FL: Q Data Corporation.
Tidball, K. H. (1988). Creating a culture that builds your bottom line. The Cornell Hotel and Restaurant Administration Quarterly. 29(1), 63-69.
The Top 50 Growth Restaurants. (1991). Restaurant Business. 90(H), 118-119 & 124.
The Top 50 Public Restaurants. (1991). Restaurant Business. 90(11), 118-119.
The Top 100 Restaurants. (1991). Restaurant Business. 90(17), 115-138.
TPI Enterprises, Inc. (1989). Annual report (89-5553(1)).
TW Services, Inc. (1989). Annual report (89-1373-E). St. Petersburg, FL: Q Data Corporation.
Wendy's International, Inc. (1989). Annual report (89-1387-H). St. Petersburg, FL: Q Data Corporation.
Woods, R. H. (1989). More alike than different: The culture of the restaurant industry. The Cornell Hotel and Restaurant Administration Quarterly. 30(2), 92-97.