81
Leveraging information for smarter decision making resource decision-making, resource optimization and supply chain excellence Kuah Ann Thye IBM-ILOG WebSphere
Leveraging information for smarter decision making resourcedecision-making, resource optimization and supply chain excellence
Kuah Ann ThyeIBM-ILOG WebSphere

AgendaAgenda
Illustrate Use Case of Optimisation1
Share ILOG Optimisation Tools2
Share ILOG Optimisation Platforms3
Share ILOG Optimisation Packages4

Maximize resource efficiency What is Optimization?
Resources Examples of choices to make
Capital AllocateCapital Allocate
People Acquire, schedule, assign, train
Time Allocate
Equipment Acquire, schedule, locate
Facilities Locate, schedule
Vehicles Acquire route scheduleVehicles Acquire, route, schedule
Raw Material Acquire, assign
U d t ti t ti ith ‘HUsed to answer questions starting with ‘How many/much?’, ‘Who?’, ‘When?’, ‘Where?’, ‘Which?’
3

Optimization BenefitsDocumented ROI of INFORMS Edelman finalists using ILOG Products
2 Chilean Forestry firms Timber Harvesting $20 mil/yr + 30% fewer trucks
Documented ROI of INFORMS Edelman finalists using ILOG Products
UPS Air Network Design $87m/2yrs + 10% fewer planes
S th Af i D f F /E i Pl i $1 1 bil/South African Defense Force/Equip Planning $1.1 bil/year
Motorola Procurement Mgmnt $100-150 mil/year
Samsung Electronics Semiconductor Mfg 50% reduction in cycle time
SNCF (French RR) Scheduling & Pricing $16m/yr rev + 2% lower op ex
Continental Airlines Crew Re-scheduling $40 mil in one year
AT&T Network Recovery 35% reduction spare capacity
Grant Mayo van Otterloo Portfolio Optimization $4 mil/year
4

Optimization-based Applications
Financial Services
Utilities, Energy &
Telecom Multiple/OtherTransportation & Logistics
IndustrialSe ces gy
Natural Resources
& Logistics
• Yield Management
• Asset Optimization• Portfolio
optimization• Unit commitment • Workforce
scheduling• Network capacity
planning• Production
planning & • Asset Optimization• Fleet
Assignment• Depot &
warehouse location
p
• Portfolio in-kinding
• Trade crossing
• Loan pooling
• Supply portfolio planning
• Power generation scheduling
g
• Advertising scheduling
• Marketing campaign optimization
p g
• Routing
• Adaptive network configuration
p gscheduling
• Inventory optimization
• Supply Chain • Network design• Vehicle &
container loading
• Vehicle routing & delivery
• Loan pooling
• Product/price recommendations
• Distribution planning
• Water reservoir mgt
optimization
• Revenue/Yield Management
• Appointment & Field
• Antenna and concentrator location
• Equipment and
• Supply Chain Network Design
• Shipment planning& delivery scheduling
• Yard, Crew, Driver & Maintenance scheduling
• Mine operations
• Timber Harvesting
Service scheduling
• Combinatorial Auctions for Procurement
service configuration
• Truck loading
• Maintenance scheduling
From long term planning to operational scheduling
5

Let ILOG Show You How• Nissan increased productivity at Europe’s most efficient car production facility
by 30%
• Chile's two largest forest-products companies reduced their truck fleets by 30% and saved $20 million annually
• Samsung Electronics cut wafer processing cycle time in half to just 30 days• Samsung Electronics cut wafer-processing cycle time in half, to just 30 days
• Continental Airlines responded to unexpected delays with efficient crew rescheduling, saving $40 million in one yearrescheduling, saving $40 million in one year
• UPS cut package delivery costs by $87 million over 2 years and reduced its aircraft fleet by 10%
• A television network increased annual advertising revenue by $50 million
A i t t fi t t ti t b $100 illi• An investment firm cut transaction costs by $100 million
• A major consumer packaged goods manufacturer dramatically increased the direct loading of trucks off its packaging lines
6
direct loading of trucks off its packaging lines

Benefits is substantial: ROA, OpEx, CapEx, Top LineBenefits is substantial: ROA, OpEx, CapEx, Top Line
7

Top ILOG Optimization Industry SolutionsTop ILOG Optimization Industry Solutions
1. Industrial Production Planning & Scheduling
2. Travel & Transportation Yield Management & Asset Optimisation
3. Energy & Utilities Unit Commitment
4. Banking & Financial Markets Portfolio Optimization
5. Cross Industry Manpower
8
Optimisation Market Leadershipp p
“ILOG is the world’s leading provider of software components”
“The leading optimization component vendor is ILOG.”6/99, 6/00
"ILOG is the leading provider of optimization software components." Larry Lapide, Research Director, AMR Research
"ILOG - The Optimizer Inside." Byron Miller, Analyst, Giga Group

Industry Views …No 1 Optimisation since 80sy p
Optimization Technologies Evolution1960 1970 1980 1990 2005-20091947
Shifting
DispatchRules
CPMPERT
Primal Simplex
Interior Point
ShiftingBottleneck
First CP Systems
Global constraints
D l Si l U ifi dSA, GA, Tabu
Constraint-based Scheduling
pLP Constraint
Propagation
Dual Simplex UnifiedObjectModel
Parallel
CooperatingSolvers (MP/CP)
Barrier LPBarrier Crossover Single Modeling
Language (MP CP)
CP
Pioneered by ILOG/CPLEX
ParallelLP/MIP
ConcurrentSchedulingLarge MIPsMIP
(MP,CP)
Pioneered by ILOG/CPLEX
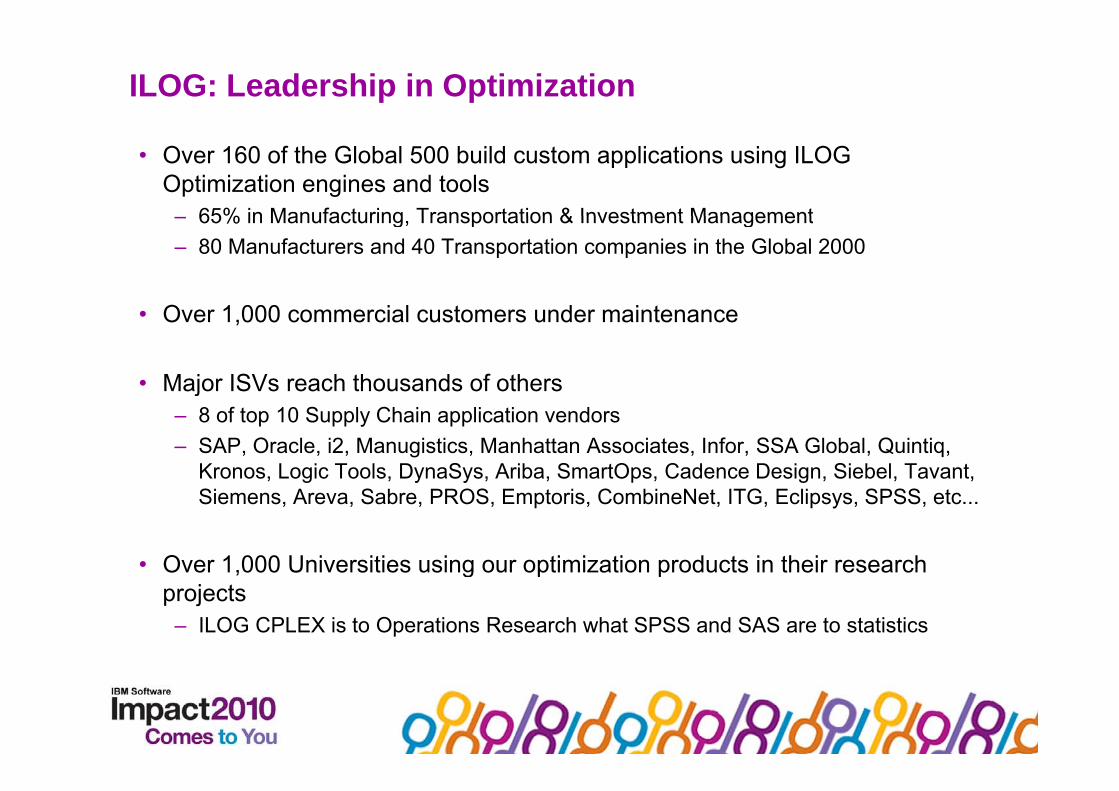
ILOG: Leadership in Optimization
• Over 160 of the Global 500 build custom applications using ILOG Optimization engines and tools
65% in Manufacturing Transportation & Investment Management– 65% in Manufacturing, Transportation & Investment Management– 80 Manufacturers and 40 Transportation companies in the Global 2000
O 1 000 i l t d i t• Over 1,000 commercial customers under maintenance
• Major ISVs reach thousands of others j– 8 of top 10 Supply Chain application vendors– SAP, Oracle, i2, Manugistics, Manhattan Associates, Infor, SSA Global, Quintiq,
Kronos, Logic Tools, DynaSys, Ariba, SmartOps, Cadence Design, Siebel, Tavant, Siemens, Areva, Sabre, PROS, Emptoris, CombineNet, ITG, Eclipsys, SPSS, etc...
• Over 1,000 Universities using our optimization products in their research , g p pprojects
– ILOG CPLEX is to Operations Research what SPSS and SAS are to statistics

CPLEX Across the World
1194 Cities – Excluding ISV deployments1194 Cities Excluding ISV deployments

Options for Planning & Scheduling Solutions
PROS CONS
Spreadsheet based li ti
Quickly getting startedFamiliar tool
Limited size and complexityHard to maintainapplications Familiar tool Hard to maintainCumbersome What-if analysis
Pre-packagedApplications
Out-of-the box functionalityPackaged best practices
Difficult to change GUIMay not integrateMay not capture all costs,Applications g p May not capture all costs,
constraints, or goalsMay impose the wrong businessprocess
Difficult for Business managers Custom Tailored to business needsto participate in dev process
Difficult to build GUIDifficult to build data integrationDifficult to maintain over time
Custom Applications Component based
“Obligation” to maintain customti i ti d d t d l
Custom
Tailored to business needsEasy for Business managersto participate in dev process
“Obligation” to maintain customoptimization and data model
optimization and data model
Custom Applications
Platform based
to participate in dev processEasy to build GUIEasy to build data integrationEasily maintain integrationof optimization model in application

ILOG Optimization Decision Manager (ODM) EnterpriseILOG Optimization Decision Manager (ODM) Enterprise
• A flexible planning platform– Highly configurable with low risk and low cost
C t i bl d t ibl f f t fit– Customizable and extensible for perfect fit
• Planning-centric FunctionalityData analysis & Visualization– Data analysis & Visualization
– Scenario management & Editing– Collaborative planning with Scenario Sharing– Collaborative planning with Scenario Sharing– What-if analysis & Sensitivity analysis
• Powered by OptimizationPowered by Optimization– Plan Generation & Checking
9/3/2010 14

How does optimization support decision making?
What-If Analysis
9/3/2010 15
Collaboration

ILOG ODM Enterprise ArchitectureILOG ODM Enterprise Architecture
ODM Enterprise IDEODM Optimization Server
ReportingIntegration
ODM Enterprise IDE
ODM Studio(for Planner & Reviewer)
(IT) DataModeling
(for Planner & Reviewer)Application
Configuration
Modeling`
(LoB)
ODM IDE ODM Scenario Repository
OptimizationModeling
( )
(OR)
g
Development Deployment
9/3/2010 16
Development Deployment
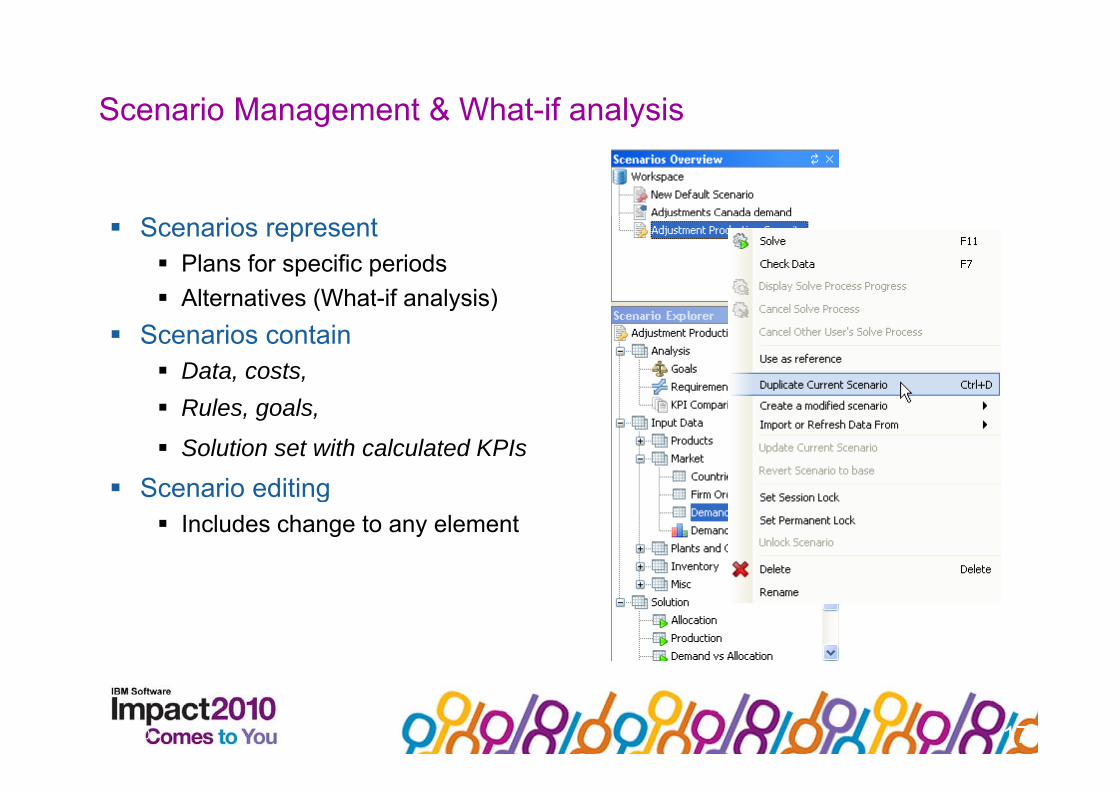
Scenario Management & What-if analysisg y
Scenarios representPlans for specific periodsAlternatives (What-if analysis)Alternatives (What if analysis)
Scenarios containData, costs, Rules, goals,
Solution set with calculated KPIs
Scenario editingScenario editingIncludes change to any element
9/3/2010 17

Displays using Simple Tables and Charts
9/3/2010 18

Business Goals and Plan Overview w/ Charts
9/3/2010 19
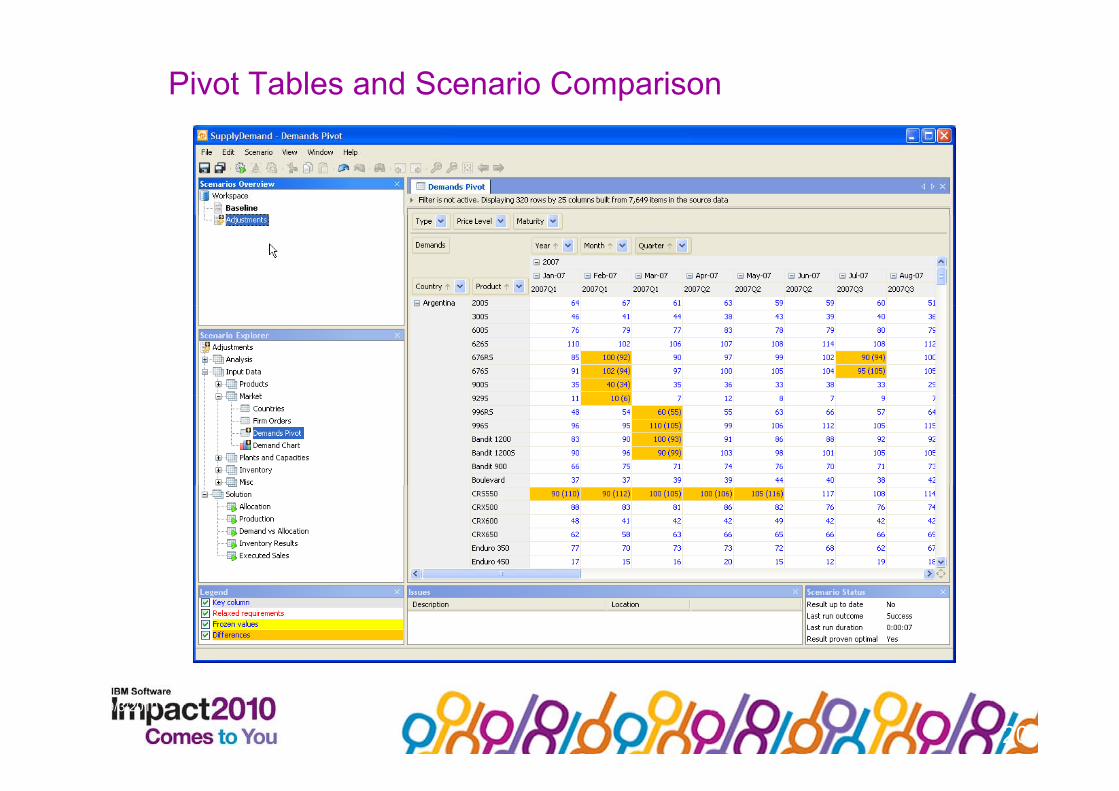
Pivot Tables and Scenario Comparison
9/3/2010
20

From Scenario Comparison to Sensitivity Analysis
Pair-wise Scenario ComparisonD t il d i t d t tDetailed inputs and outputs,
KPIs.
Multi-ScenarioMulti Scenario Comparison
GoalsGoals,
KPIs.
9/3/2010 21
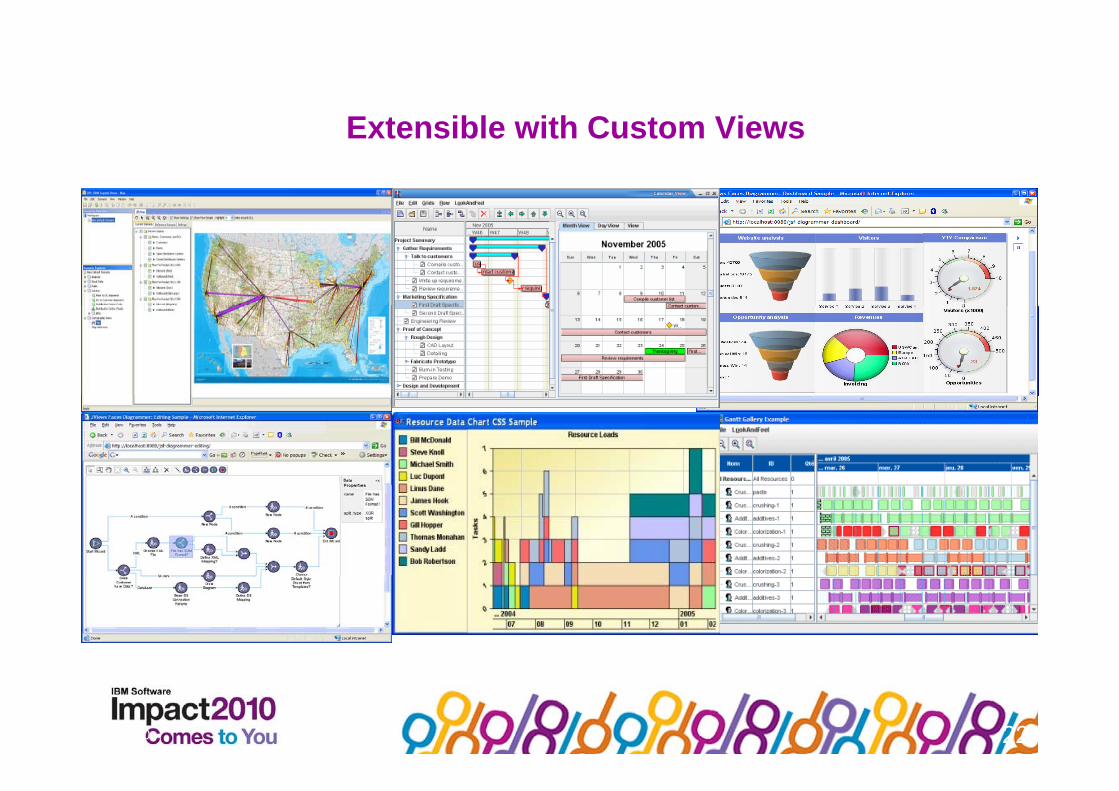
Extensible with Custom ViewsExtensible with Custom Views
9/3/2010 22
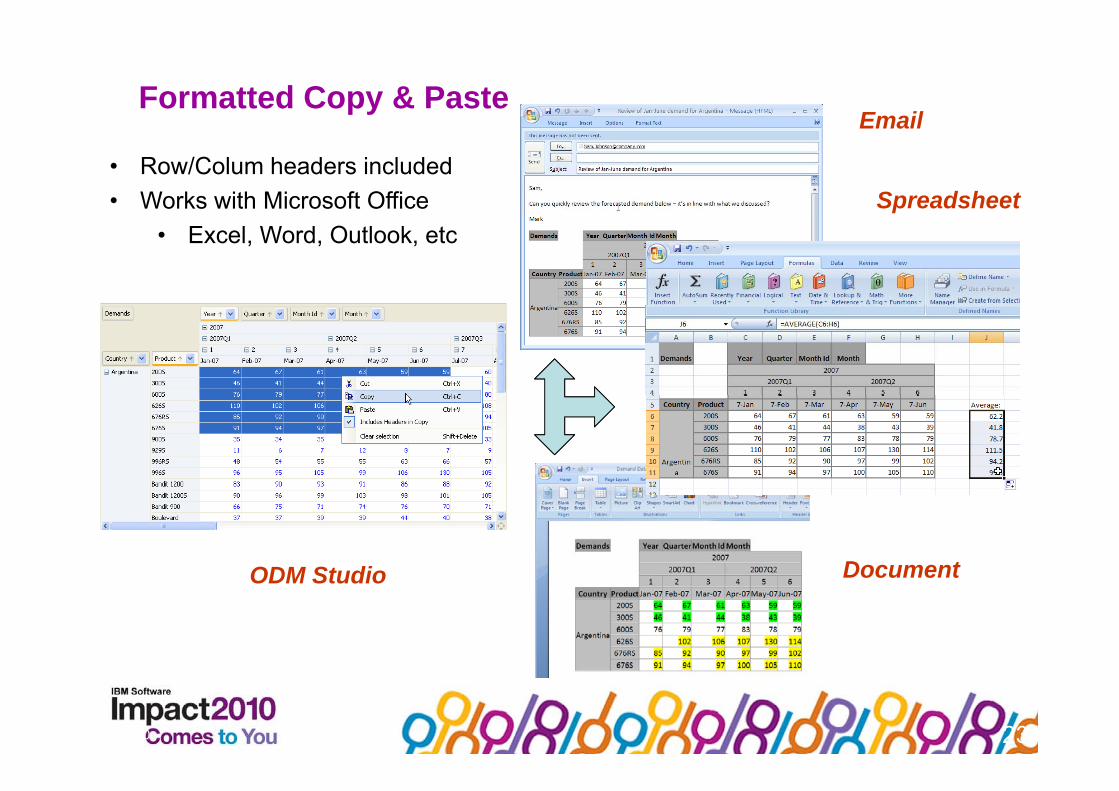
Formatted Copy & PasteEmail
• Row/Colum headers included• Works with Microsoft Office
Spreadsheet• Excel, Word, Outlook, etc
DocumentODM Studio DocumentODM Studio
9/3/2010 23

Optimizing Business Goals
Manage conflicting business goals
p g
Effective trade-offs & goal balancingUpper/lower limits, goal weightsDrill-downs for detailed cost analysis
9/3/2010 24

Controlled Relaxations of Constraints
Automatically relax constraints based on business priorityAutomatically relax constraints based on business priorityDisplay relaxed constraints in groups and allow trade-offs
9/3/2010 25
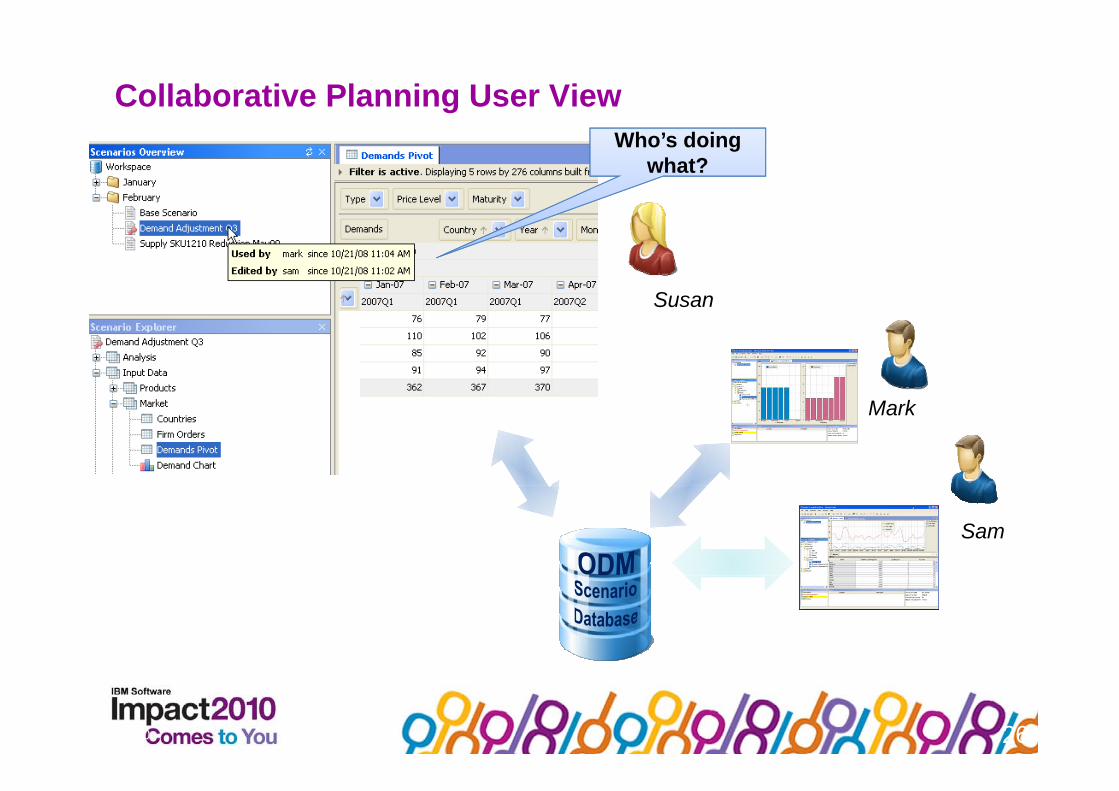
Collaborative Planning User View
what?Who’s doing
what?
SusanSusan
Mark
Sam
9/3/2010 26

Architectural OverviewArchitectural Overview
P d ti
Development
Production
ODM Users
Note: Normally development test and production servers are separate
9/3/2010 27
Note: Normally, development, test and production servers are separate.
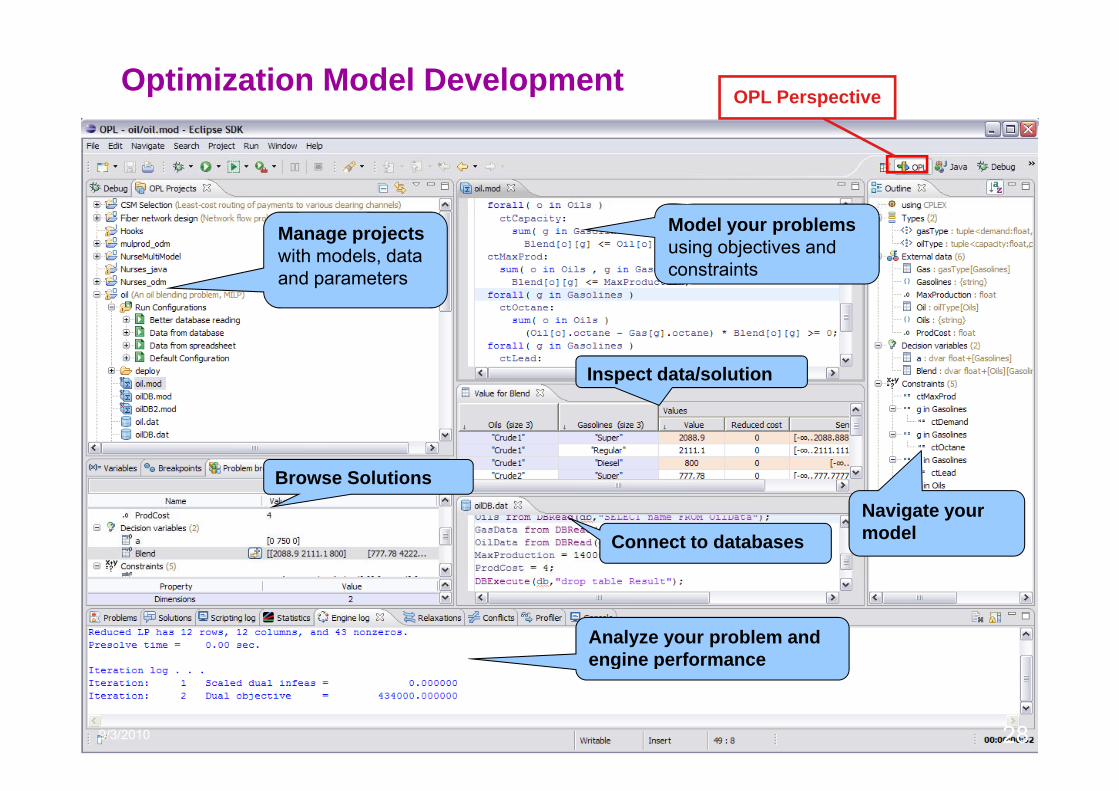
Optimization Model Development OPL Perspective
Model your problems using objectives and constraints
Manage projectswith models, data and parameters
Inspect data/solution
Browse Solutions
Connect to databasesNavigate your model
Analyze your problem and engine performance
9/3/2010 28
engine performance
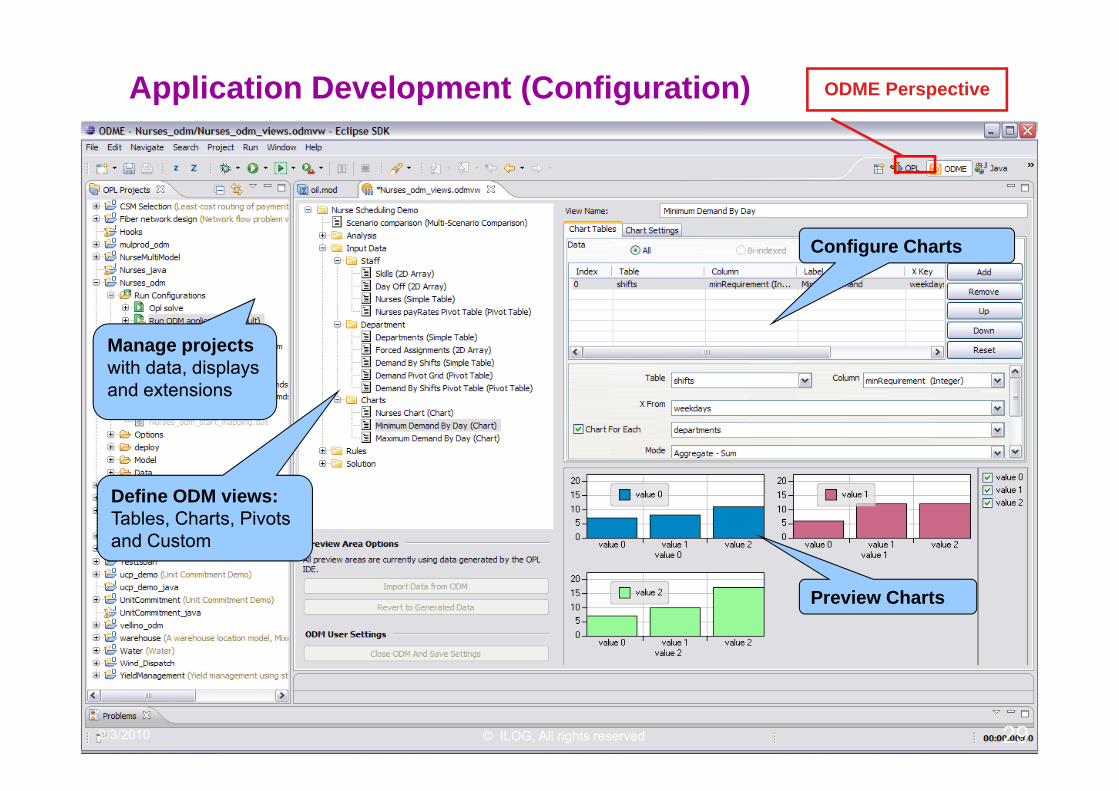
Application Development (Configuration) ODME Perspective
Configure Charts
Manage projectswith data, displays and extensionsand extensions
Define ODM views: Tables, Charts, Pivots and Custom
Preview Charts
9/3/2010 © ILOG, All rights reserved 29

ILOG LogicTools Suite
Plant PowerOpsPlanning and detailed finite
scheduling for process LogicNet Plus XEDetermine optimal number, location, territories, and size of warehouses, plants, and lines.Determine where products should be made
Transport PowerOps
manufacturing plantsProduction
Planning and Scheduling
StrategicNetwork Design
should be made. Advanced routing optimization engine for on-going use.
Multi-Site
Supply Chain
Applications Transportation Pl i
Product Flow OptimizerDetermine best flow considering inventory,
Transportation AnalystStrategic routing for fleet sizing,
multi stops backhauls and more
ProductionSourcing
Planning
Inventory
Inventory Analyst: Strategic
transportation, and mode
Determine push/pull locations, buffer locations,
multi-stops, backhauls, and more.
Inventory Analyst: Tactical
Inventory Optimization
Determine push/pull locations, buffer locations, postponement, and policy analysis Inventory Analyst: Tactical
Maintain the correct inventory levels on an on-going basis

LogicNet Plus and SAP
• Recognized as only SAP partner for Network design– LogicNet Plus integration with SAP APO is certified in November 2003– SAP software partner since January 2004SAP software partner since January 2004
• Inventory Analyst™ is Powered by SAP NetWeaver– Certified in April 2005– "Safety Stock Optimizer 1 0" xApp certified in April 2007Safety Stock Optimizer 1.0 xApp certified in April 2007
• Joint Marketing: – Exhibited as part of the SAP SCM booth at Sapphire 2004, 2005– GM presented for LogicTools on Inventory Optimization PanelGM presented for LogicTools on Inventory Optimization Panel
• Thought Leadership:– Chapter in Claus Heinrich book “RFID and beyond” – Article with Claus Heinrich in SCMR “Do IT investments pay off?”Article with Claus Heinrich in SCMR Do IT investments pay off?
• Complementary Products– LogicNet Plus provides SAP users with the ability to determine the optimal
structure of the supply chain (number and locations of plants, lines, warehouses, pp y ( pand information on what the territories should be for each)
– Inventory Analyst provides SAP users with strategic multi-echelon inventory calculations to determine where inventory should be positioned. It is also a nice complement to network design
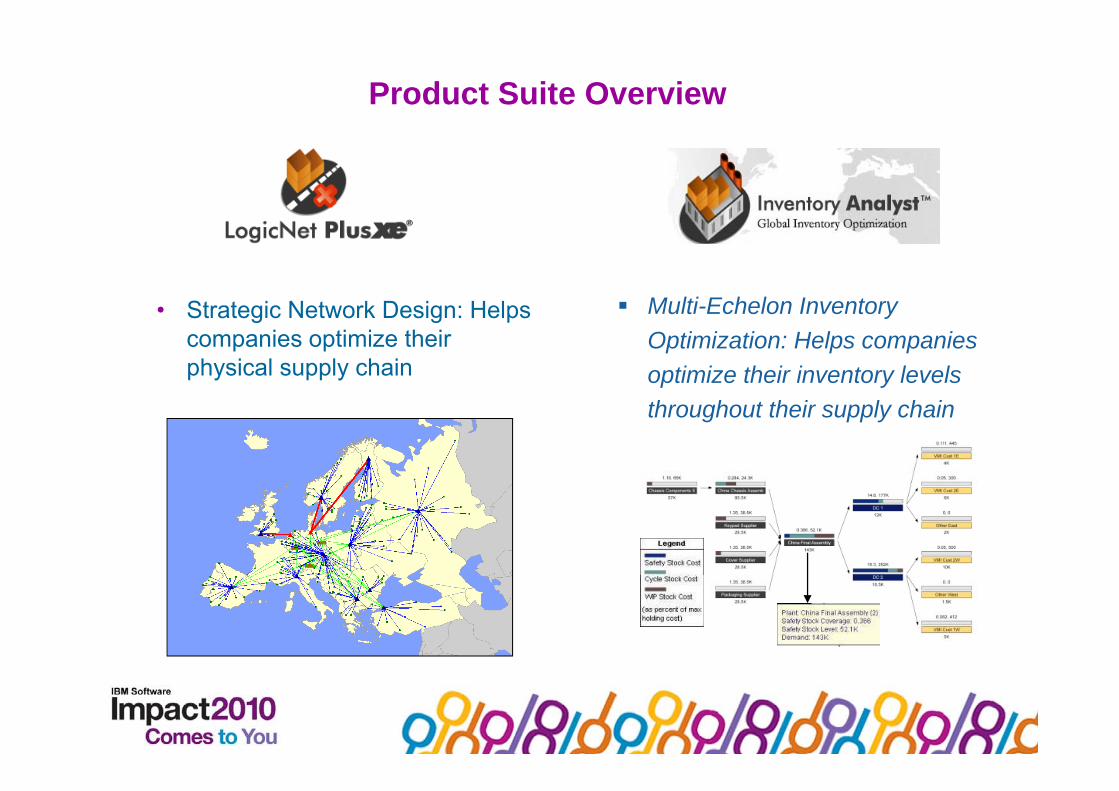
Product Suite Overview
Strategic Network Design: Helps Multi Echelon Inventory• Strategic Network Design: Helps companies optimize their physical supply chain
Multi-Echelon Inventory Optimization: Helps companies optimize their inventory levels throughout their supply chain
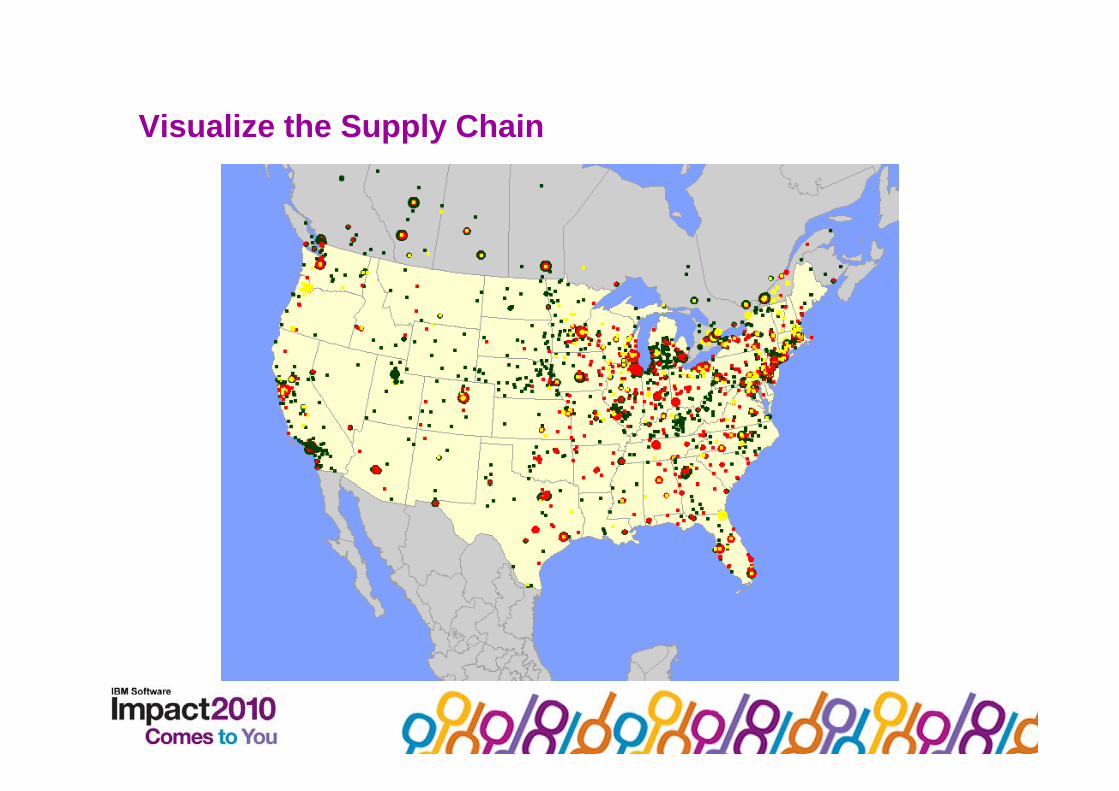
Visualize the Supply ChainVisualize the Supply Chain

Compare ScenariosCompare Scenarios

Making the Trade-Off Between Service and Cost
Optimal Network For Cost Optimal Network For Service
Savings: $6 million Savings: $3 millionSavings: $6 millionService: 40% next day
Savings: $3 millionService: 80% next day
Which is Better?Which is Better?

Direct Shipments to BKK (Orange Lines)
Transportation LaneWeighted Average
Distance (km)
Distance Baseline (km)
Supplier to Retailer 405 -DC to Retailer 379 276
Cost Description Cost (THB)Cost Baseline
(THB)Supplier to DC Shipping Cost 55,714,803 104,824,510Supplier to Retail S tore Shipping Cost 65,167,062 - DC to Retail S tore Shipping Cost 104,341,340 124,195,393Warehouse Variable Costs 110,163,990 192,311,915Supply Costs 1,333,063,820 1,333,063,820Warehouse Fixed Costs 70,000,000 70,000,000TOTAL COST 1 738 451 015 1 824 395 638TOTAL COST 1,738,451,015 1,824,395,638

Mattress sourced from CambodiaMattress sourced from Cambodia
Transportation LaneWeighted Average
Distance (km)
Distance Baseline (km)
Supplier to Retailer - -DC to Retailer 276 276
Cost Description Cost (THB)Cost Baseline
(THB)Supplier to DC Shipping Cost 105,822,375 104,824,510Supplier to Retail S tore Shipping Cost - - DC to Retail S tore Shipping Cost 124,195,393 124,195,393Warehouse Variable Costs 192,311,915 192,311,915Supply Costs 1,246,013,320 1,333,063,820Warehouse Fixed Costs 70,000,000 70,000,000TOTAL COST 1 738 343 002 1 824 395 638TOTAL COST 1,738,343,002 1,824,395,638
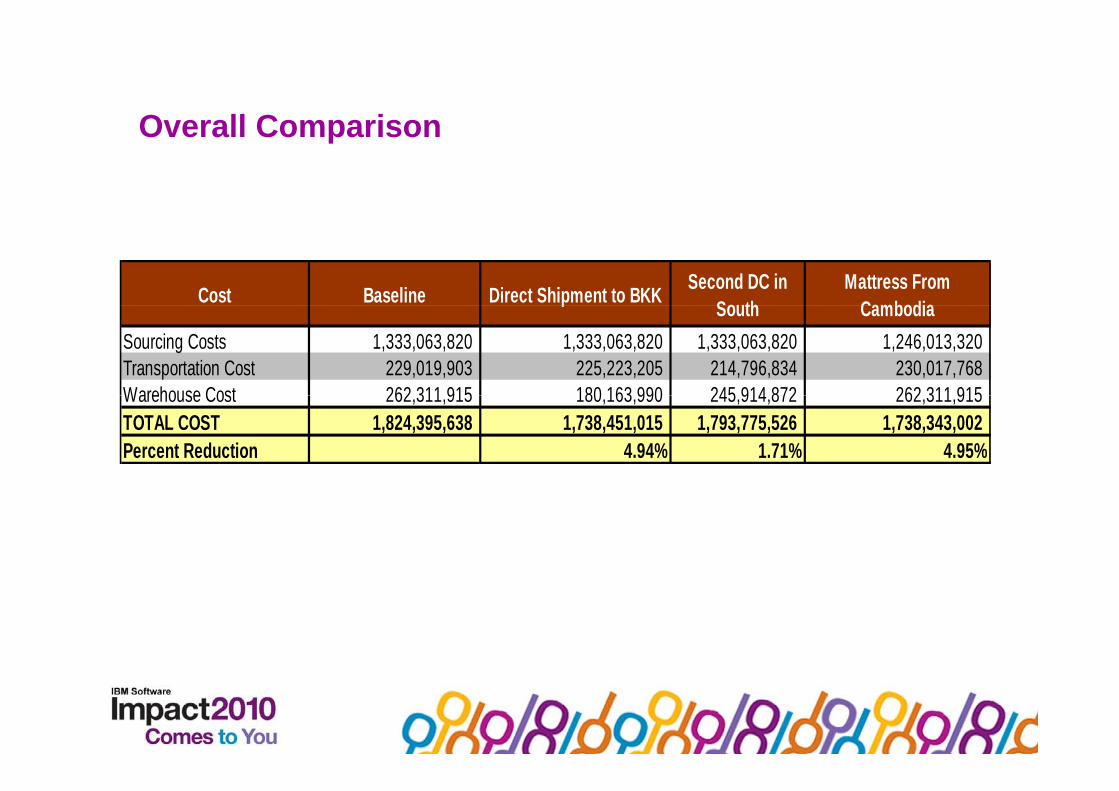
Overall ComparisonOverall Comparison
Cost Baseline Direct Shipment to BKKSecond DC in
SouthMattress From
Cambodiap
South CambodiaSourcing Costs 1,333,063,820 1,333,063,820 1,333,063,820 1,246,013,320 Transportation Cost 229,019,903 225,223,205 214,796,834 230,017,768 Warehouse Cost 262 311 915 180 163 990 245 914 872 262 311 915Warehouse Cost 262,311,915 180,163,990 245,914,872 262,311,915 TOTAL COST 1,824,395,638 1,738,451,015 1,793,775,526 1,738,343,002 Percent Reduction 4.94% 1.71% 4.95%
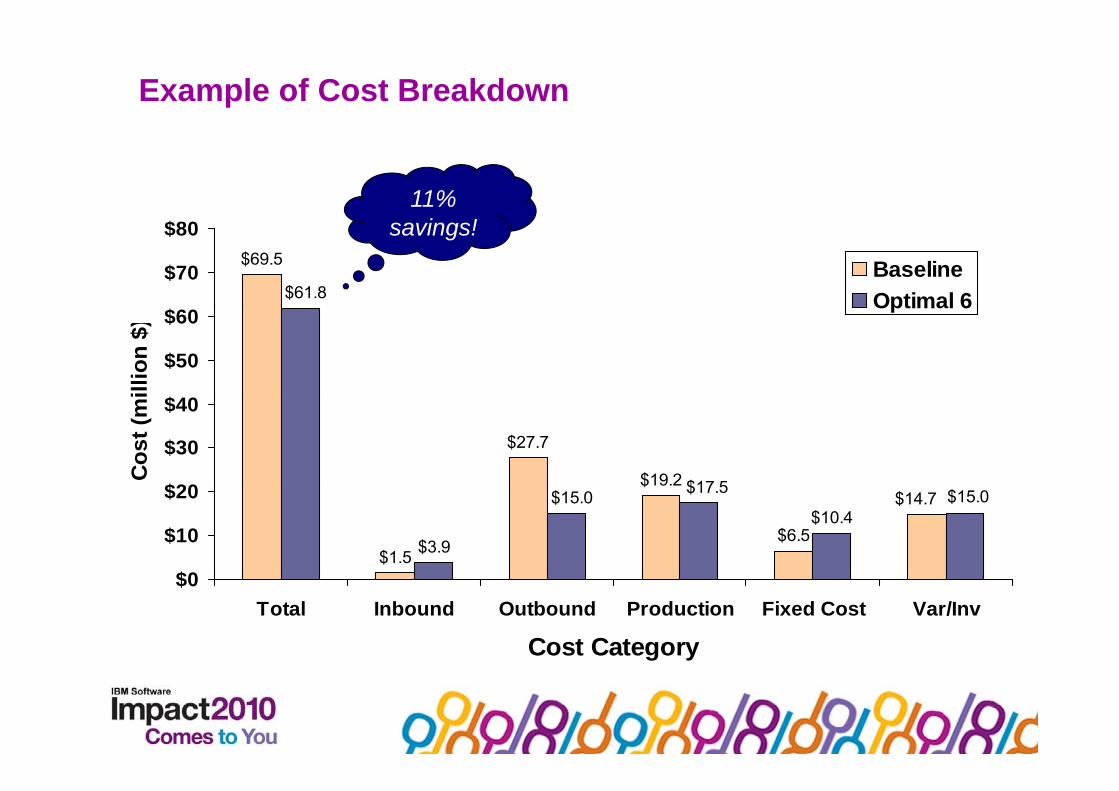
Example of Cost Breakdown
11%
$69.5
$61.8$70
$80
BaselineOptimal 6
savings!
$50
$60
illio
n $)
Optimal 6
$27.7
$19.2 $17 5$20
$30
$40
Cos
t (m
i
$1.5
$19.2
$6.5$3.9
$10.4$14.7$15.0 $15.0$17.5
$0
$10
$20
$0Total Inbound Outbound Production Fixed Cost Var/Inv
Cost Category

Current Inventory Levels vs. Optimized Inventory LevelsLevels
"Optimized Target Inv - Historic Avg Inv" for each SKU
$8M$7 404 836
Historical Avg Inv vs. Optimized Target Inv ($)
$100K
$200K
$300K
d $
Tar
get
- H
ist
Avg
$
$4M
$6M
ento
ry $
$7,404,836
$5,762,023
20
0D
-TU
40
CD
-BA
87
54
-TU
87
39
-TU
00
D-W
O
99
50
-BA
00
D-W
O
75
4-W
O
73
9-W
O
87
30
-TU
8K
D-W
O
73
0-W
O
63
8D
-BA
66
5D
-BA
10
CD
-BA
42
CD
-BA
40
0D
-TU
64
9D
-BA
2K
CD
-BA
12
D-W
O
73
5-W
O
12
CD
-BA
52
CD
-BA
87
35
-TU
2K
CD
-BA
67
1D
-BA
90
0D
-TU
2K
D-W
O
00
D-W
O
32
D-W
O
17
5D
-TU
60
0D
-TU
($100K)
$0K
Opt
imiz
ed
$0M
$2M
Inve
8.07.2
Months Supply
HD
2
CG
4
G2
48
G2
48
HD
20
G4
59
PD
30
G2
48
7
G2
48
7
G2
48
PD
75
8
G2
48
7
G1
82
6
G1
82
6
PD
21
CG
4
HD
4
G1
82
6
WD
96
2
PD
61
G2
48
7
PD
61
PD
75
G2
48
WD
82
2
G1
82
6
HD
9
WD
83
2
HD
60
PD
43
HD
1
HD
6Historical Avg Inv $ Optimized Target Inv $
$7,123,089
Safety Stock vs. Cycle Stock ($)
2.0
4.0
6.0
Mon
ths
Su
pply
1 31 41 41 51.61.61.61.61.81.91.92.22.22.42.42.42.5
3.6
5.8
$4M
$6M
Inve
nto
ry $
CG
40
CD
-BA
G4
59
95
0-.
.
WD
96
2K
C..
PD
75
2C
D-.
.
G2
48
73
9-.
.
PD
30
0D
-..
G2
48
73
9-.
.
PD
21
0C
D-.
.
PD
61
2C
D-.
.
HD
20
0D
-..
HD
20
0D
-TU
WD
83
2K
..
G2
48
73
5-.
.
G1
82
66
5..
G2
48
73
5-.
.
G1
82
63
8..
PD
43
2D
-..
G2
48
75
4-.
.
G2
48
75
4-.
.
PD
75
8K
D-.
.
CG
42
CD
-BA
WD
82
2K
C..
HD
90
0D
-TU
G1
82
64
9..
G1
82
67
1..
HD
60
0D
-..
G2
48
73
0-.
.
HD
60
0D
-TU
G2
48
73
0-.
.
PD
61
2D
-..
HD
40
0D
-TU
HD
17
5D
-TU
0.0 0.10.20.6
0.90.90.90.90.91.01.11.21.21.31.41.41.5
Sum of Safety Stock $ Sum of Cycle Stock $
$0M
$2M
$281,747

Detailed Output Showing Safety Stock by Product

Product Suite : ILOG Transport Analyst

From Network (LNP) to Transport Analysts (TA)
L i N t Pl XELogicNet Plus XE Transportation Analyst
Sacramento DCSacramento DC
Annual SnapshotTotal Weight Delivered = 19MM lbs
Typical WeekTotal Weight Delivered = 380K lbsTotal Weight Delivered 19MM lbs
- Avg. Week 375K lbsTotal Transportation Cost = $1.5MM
- Avg Week $28.6K per week
Total Weight Delivered 380K lbsTotal Transportation Cost = $29.4K
- Within 3% of LNP Weekly Avg
ILOG, All rights reserved 43

Shipment Routing Evaluation
Each customer is promised delivery during a portion of the week
(2 Time Windows)
Each Customer is promised delivery on a specific day
(5 Time Windows)
Deliveries can be made at any point throughout the week
(1 Time Window)
Value
Number of Vehicles 21
Value
Number of Vehicles 13
(2 Time Windows)(5 Time Windows) (1 Time Window)
Value
Number of Vehicles 6
Total Distance 34,386
Deadhead Distance 11,621
TOTAL COST $88,301
Total Distance 21,320
Deadhead Distance 5,595
TOTAL COST $55,877
Total Distance 11,001
Deadhead Distance 1,489
TOTAL COST $29,369
37% Savings
+ 30% Savings
ILOG, All rights reserved 44
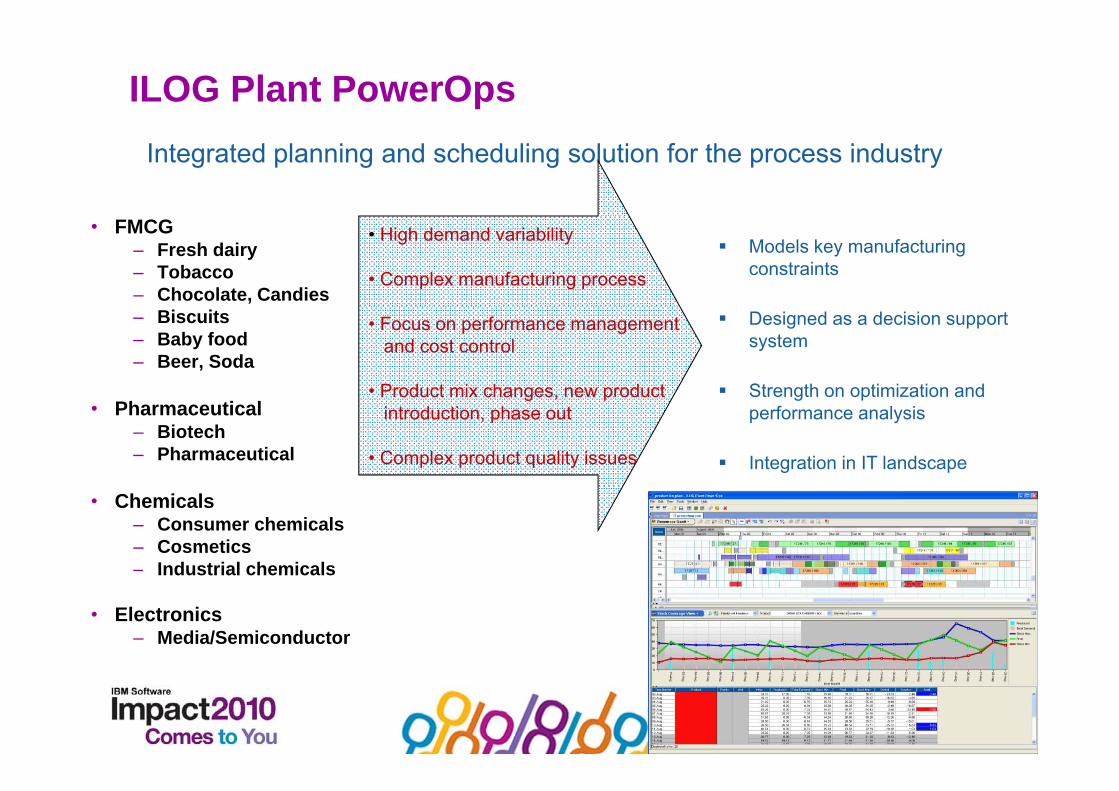
ILOG Plant PowerOpsIntegrated planning and scheduling solution for the process industry
• FMCG– Fresh dairy– Tobacco– Chocolate, Candies
Models key manufacturing constraints
• High demand variability
• Complex manufacturing process
– Biscuits– Baby food– Beer, Soda
Designed as a decision support system
Strength on optimization and
• Focus on performance management and cost control
• Product mix changes, new product• Pharmaceutical
– Biotech– Pharmaceutical
Strength on optimization and performance analysis
Integration in IT landscape
Product mix changes, new productintroduction, phase out
• Complex product quality issues
• Chemicals– Consumer chemicals– Cosmetics– Industrial chemicalsIndustrial chemicals
• Electronics– Media/Semiconductor

ILOG Plant PowerOps OverviewInteractive planning
EnterpriseIntegrated Planning
& SchedulingProductionPlanner
IntegrationPlanning
Interactive planning
EnterpriseResourcePlanning Planning
Scenarios DELLDELL
g& Scheduling
ILOG PlantPowerOps
ProductionPlanning
D t il dOptimize:
Supply Chain
ManagementInteractive Graphical Interactive
G tt Ch t
PowerOps DetailedScheduling
Business
GoalsConstraints
Optimize:• Order
fulfillment• Cycle time• Production
ManufacturingExecution Production orders
Planning BoardGantt Chart• Production
schedules• Pegging arcs
M hi li
• Daily or weekly plans
• Calendar view
BusinessRules Parameters
Filterscost
• Inventory• Utilization
ManufacturingDataAdvanced
ExecutionSystem Due dates
DependenciesResourcesCalendarsModes
• Machine lineups• Resource loads• Safety stock• Tank levels
• Plan validation• Exceptions• Alerts• Reports
KPI Anal sisAdvancedProcessControl
ModesSetup modelsRecipesShipment costs
• KPI Analysis• What-if analysis• Scenario comparison• Drag & drop (insert)• Partial Freeze & SolveModel• Undo/redo

Master Data Maintained in ERP/SCM System
ILOG Planning & S h d li& Scheduling System
Planning & Scheduling Model
M
ERP / SCM
Mapping
Websphere SAP Data
ERP/SCM ModelInstantiation
Load/Refresh/Commit
Master Data
Transactional DataAdapter
Instantiation
ILOG Solution
Data
ILOG Solution

PlanungsverfahrenSet the optimization goals
Planungsverfahren and parameters
© ILOG, All rights reserved 483-Sep-10

Integrated Planning and Schedulingg g g
Improve agility and visibility
Reach operational efficiency while respecting min and max days of supply
Analyze demand variation, inventory, min and max days of supply

Managing Plant Floor Constraints
With improved plan reliability
Continuous process
Max duration on storage tank
Multi-purpose storage tank
Max duration on storage tankCleaning policies

The stock summary gives an overview of the productionp
The stock coverage view details the situation of the inventory for each specific product
© ILOG, All rights reserved 513-Sep-10
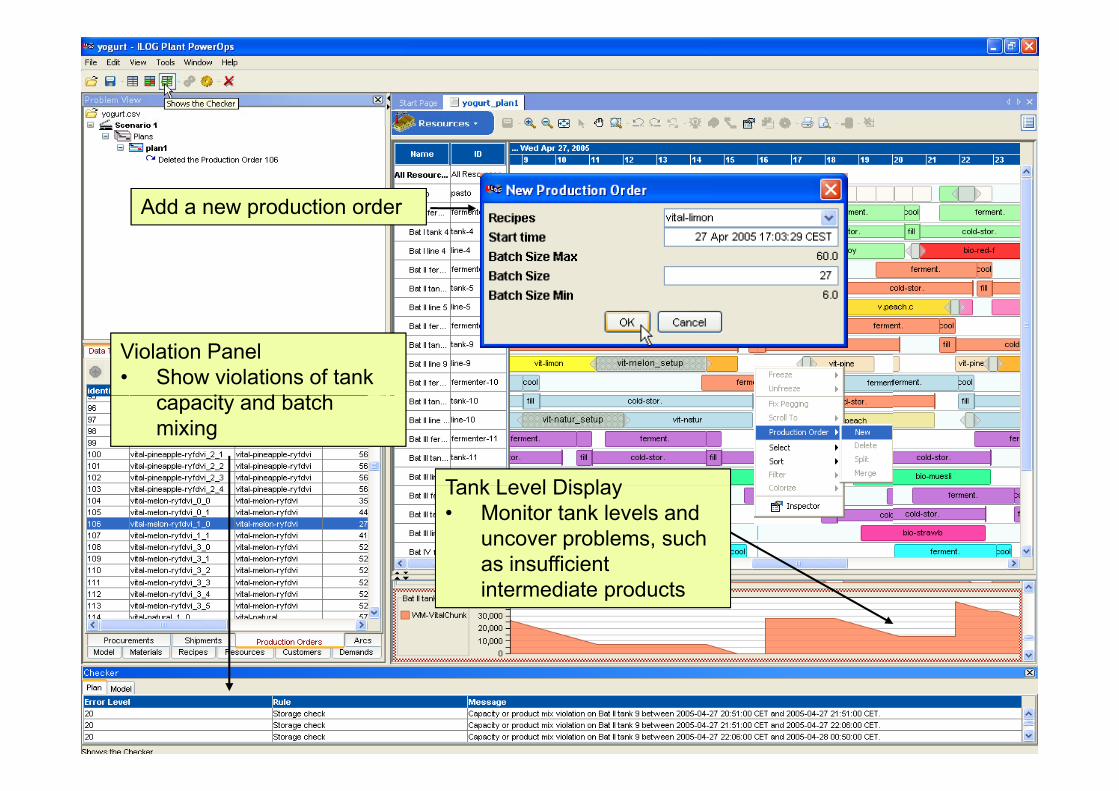
Add a new production orderp
Violation Panel• Show violations of tank
it d b t hcapacity and batch mixing
Tank Level DisplayTank Level Display• Monitor tank levels and
uncover problems, such as insufficient intermediate products
© ILOG, All rights reserved 523-Sep-10
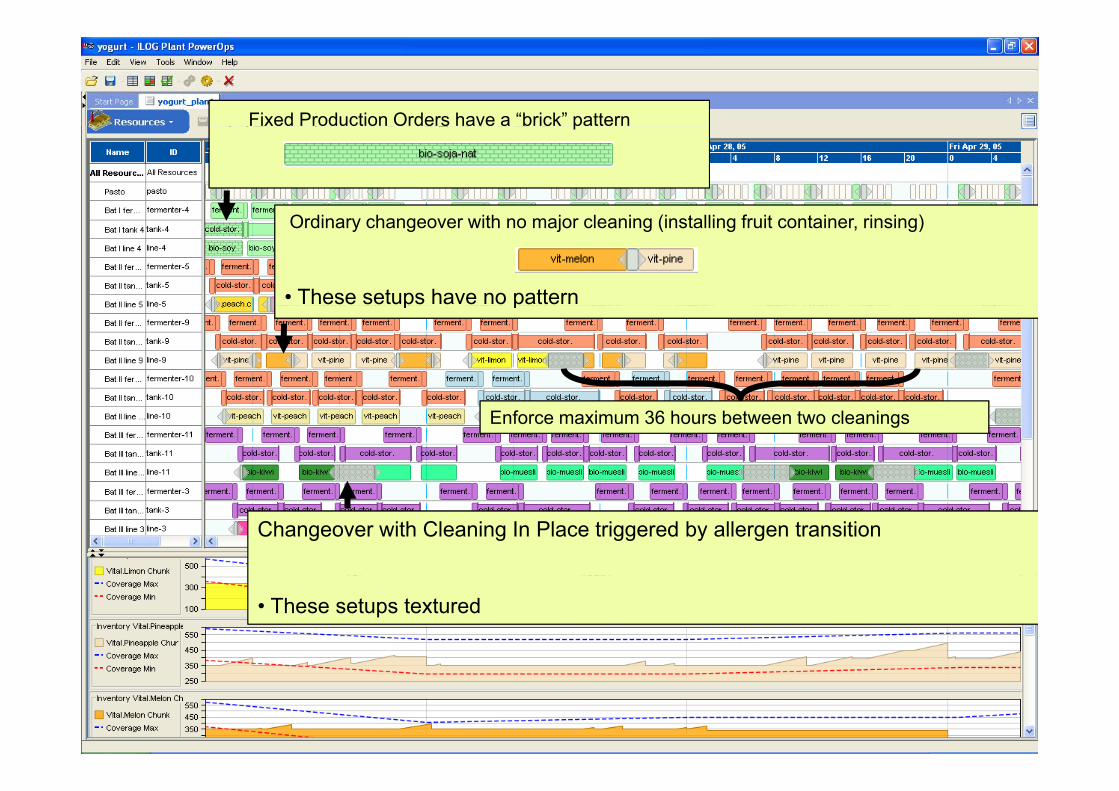
Fixed Production Orders have a “brick” pattern
O di h ith j l i (i t lli f it t i i i )
p
Ordinary changeover with no major cleaning (installing fruit container, rinsing)
• These setups have no patternp p
Enforce maximum 36 hours between two cleanings
Changeover with Cleaning In Place triggered by allergen transition
• These setups textured
9/3/2010 Internal ILOG Document53

Optimized inventory to remainin Coverage Corridor at the end of each dayy
9/3/2010 Internal ILOG Document54

Impact• Part of the additional demand is• Part of the additional demand is
left unsatisfied because of missing capacity
KPI Comparison Panel • Provides an easy way to compare
© ILOG, All rights reserved 553-Sep-10
Provides an easy way to compare scenario solutions
• A plug-in mechanism allows to define custom KPIs.
Scenario Creation and Comparison
What-if analysis with precise KPIs
• Create and manage scenarios
• Copy scenarios
T t diff t l i t t i• Test different planning strategies
• Define and apply business policiesDefine and apply business policies
• Define and compare custom KPIs
• Compare Gantt charts and solutions side by side
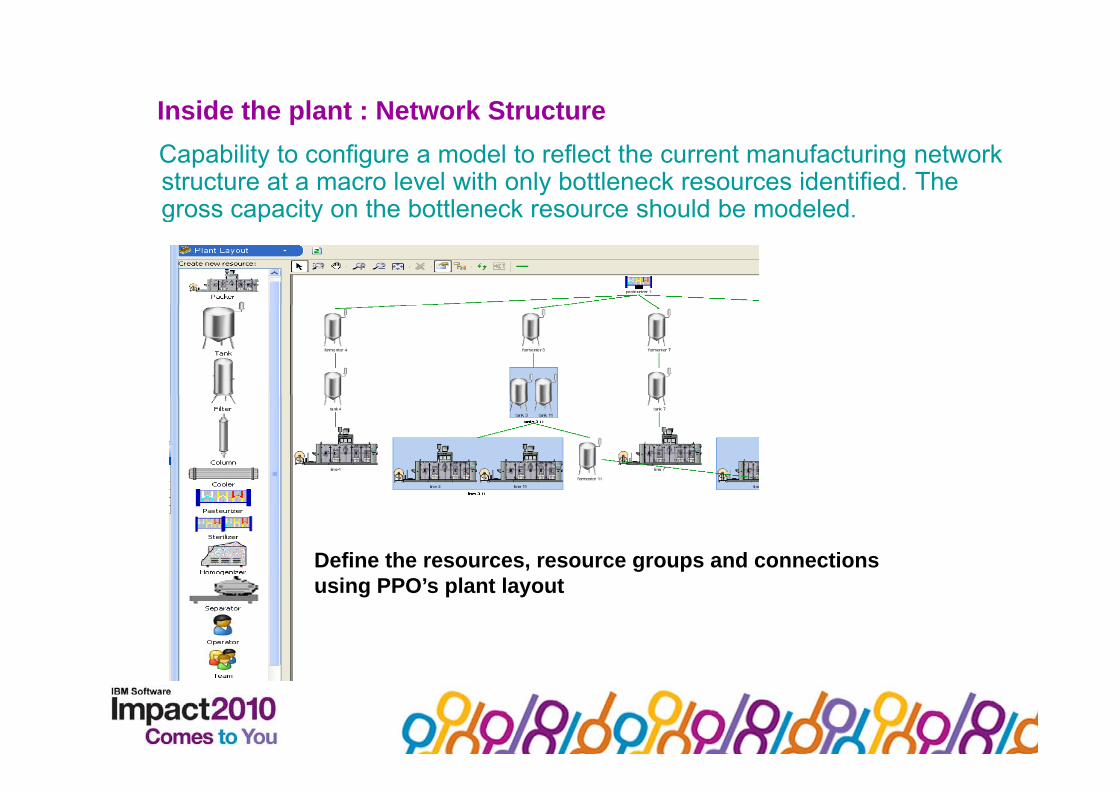
Inside the plant : Network StructureCapability to configure a model to reflect the current manufacturing network structure at a macro level with only bottleneck resources identified. The gross capacity on the bottleneck resource should be modeled.gross capacity on the bottleneck resource should be modeled.
Define the resources, resource groups and connectionsusing PPO’s plant layout
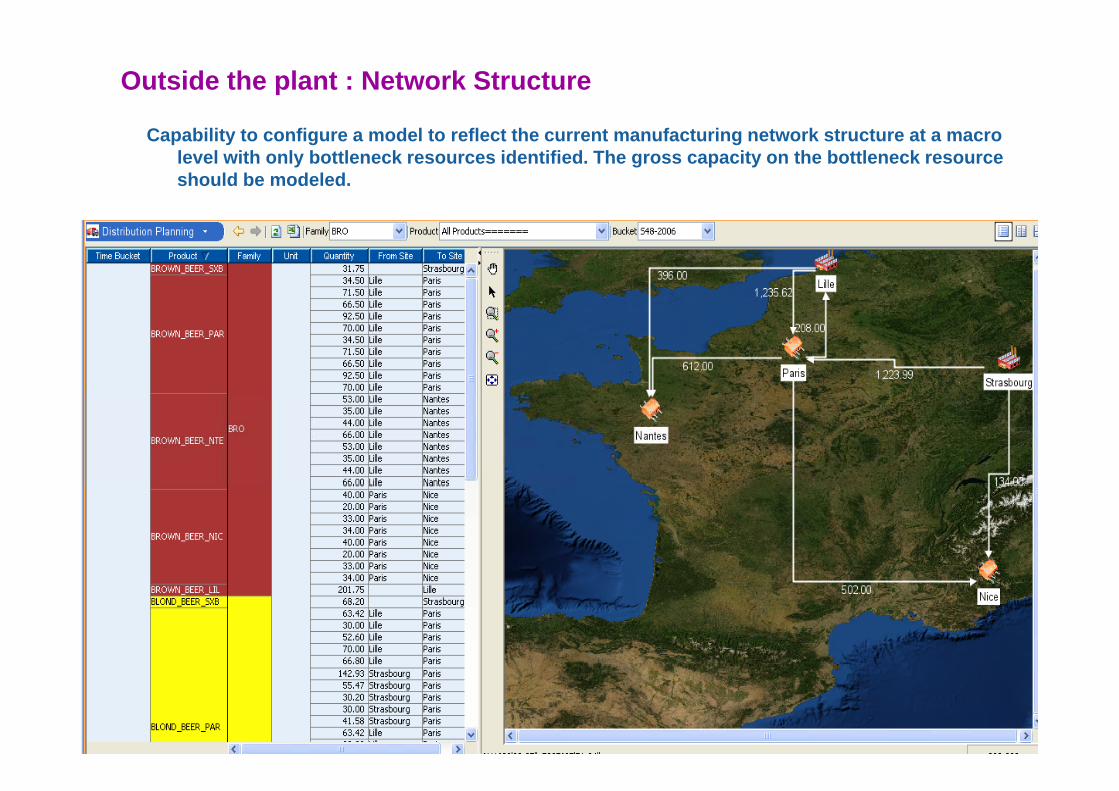
Outside the plant : Network Structure
Capability to configure a model to reflect the current manufacturing network structure at a macro level with only bottleneck resources identified. The gross capacity on the bottleneck resource should be modeled.

Multiple Optimisation ProfilesGenerate the supply plans based on forecast sales orders and inventory requirementsGenerate the supply plans based on forecast, sales orders and inventory requirements.
The different “optimization pprofiles” can be defined. E
Planners can choose an existing ti i ti fil tioptimization profile or creating a
new one.
Each optimization profile defines the goals of the sched le b settingthe goals of the schedule by setting the relative importance of different objectives

Editing Planned Production with Automatic Configuration
Multi-step Recipes:
Automatic configuration of the possible modes poss b e odesfunction of previous choices
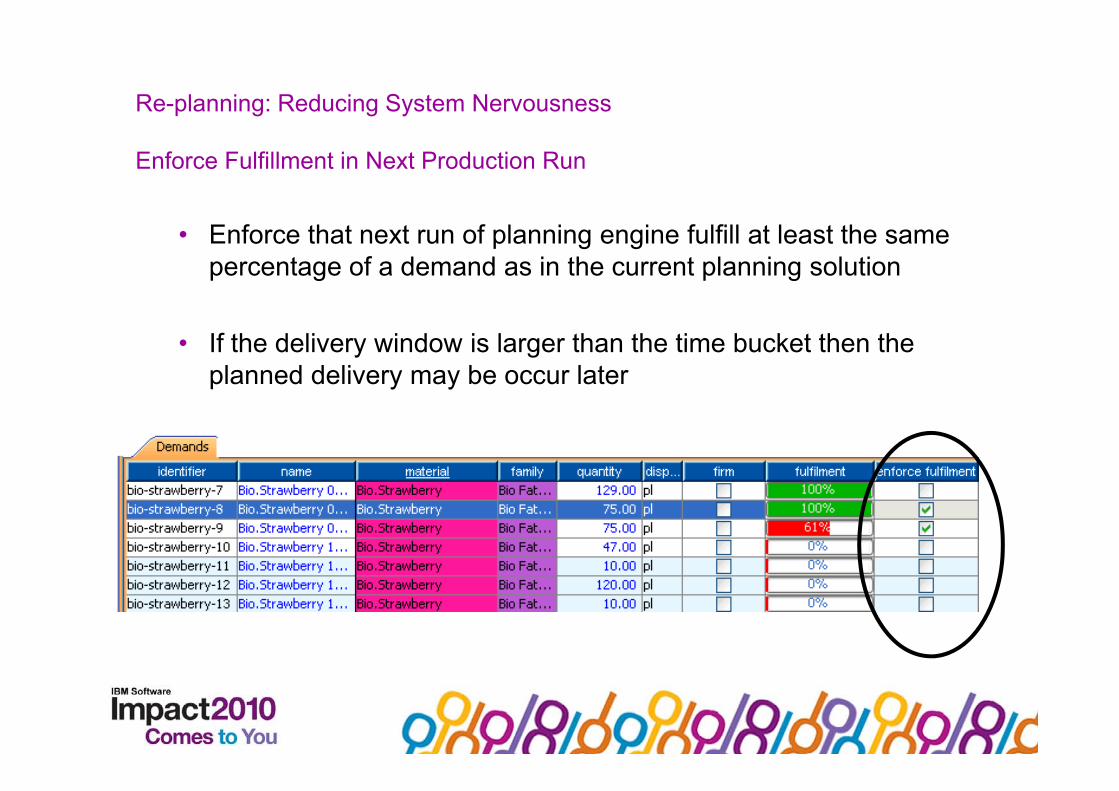
Re-planning: Reducing System Nervousness
Enforce Fulfillment in Next Production Run
• Enforce that next run of planning engine fulfill at least the same percentage of a demand as in the current planning solution
• If the delivery window is larger than the time bucket then the planned delivery may be occur later

Reducing Re-planning nervousnessg p g
Fix planned productions in current planning solutionFix planned productions in current planning solution
Fix planned deliveries in current planning solution
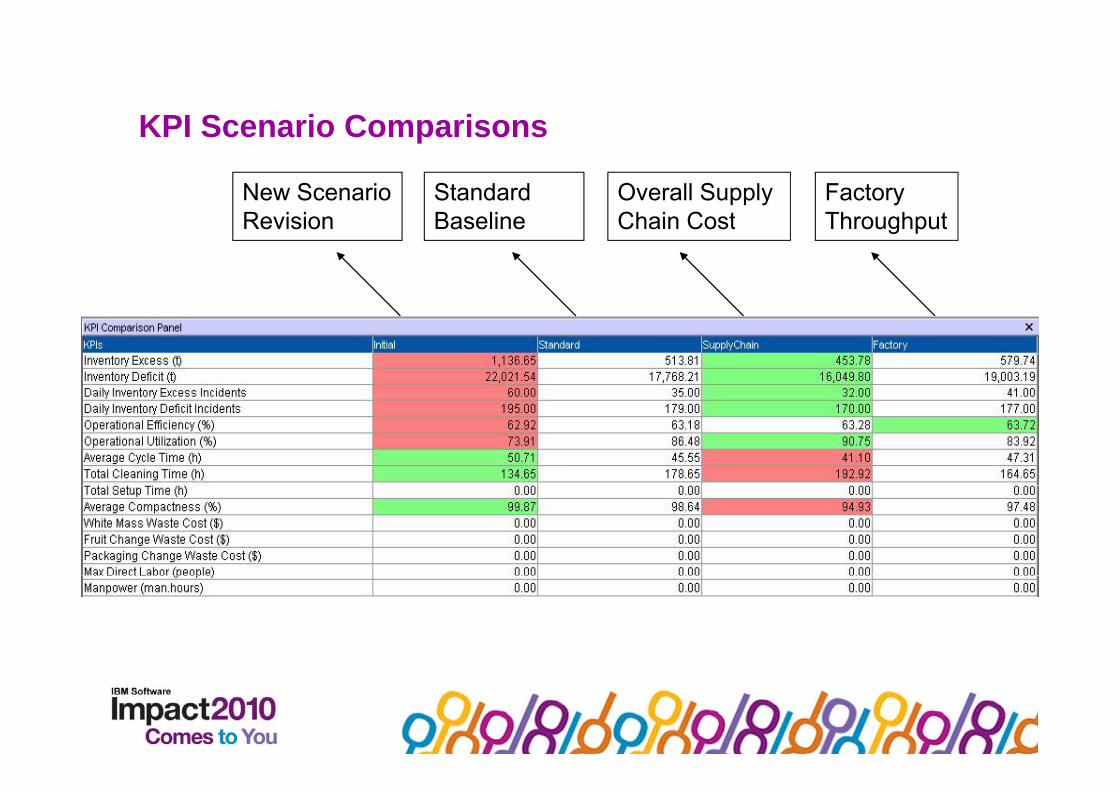
KPI Scenario ComparisonsKPI Scenario Comparisons
New ScenarioR i i
Standard B li
Overall Supply Ch i C t
Factory Th h tRevision Baseline Chain Cost Throughput
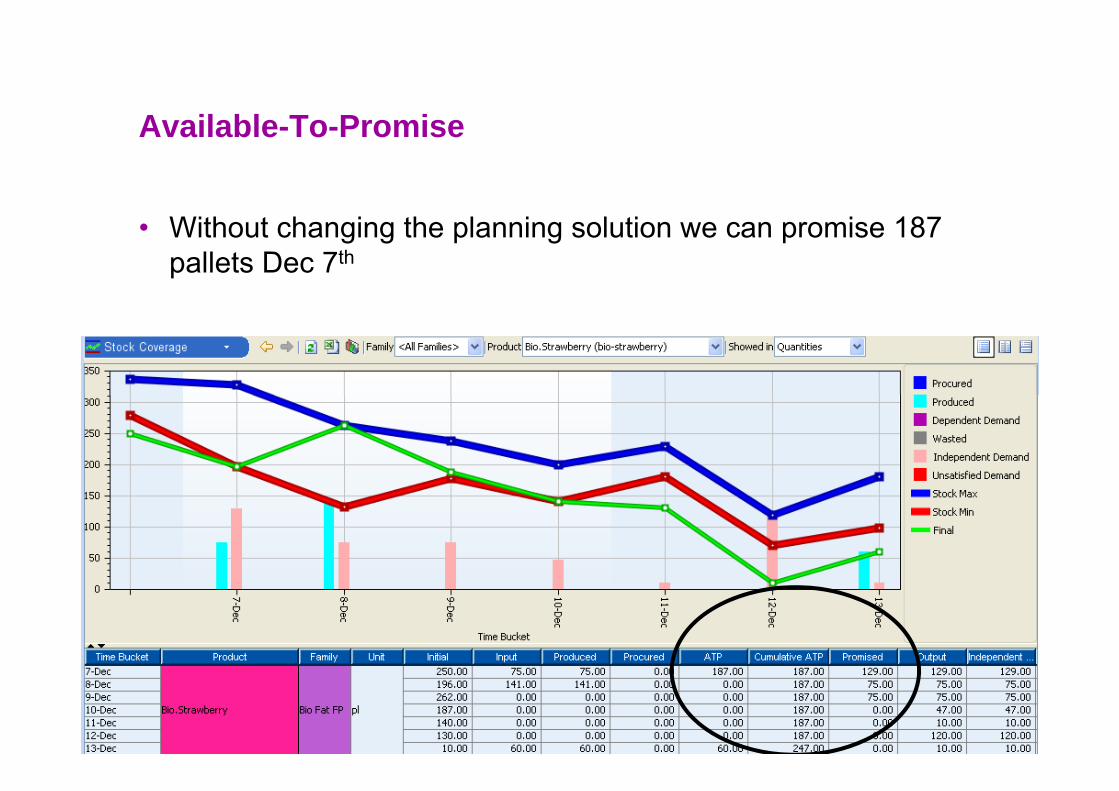
Available To PromiseAvailable-To-Promise
• Without changing the planning solution we can promise 187 pallets Dec 7th
© ILOG, All rights reserved 643-Sep-10

Capable-To-Promise
• Could we produce more bio-strawberry on December 7th with a different trade-off?
1000 achievable ?1000 achievable ?
Prioritize the customers using non-delivery costsand re-optimizePrioritize the customers using non-delivery costsand re-optimizeand re optimizeand re optimize

Capable-To-Promise
You can use a What-If scenario, not to clutter the repository withthis simulation of demandYou can use a What-If scenario, not to clutter the repository withthis simulation of demand
We can promise 751We can promise 751
We can promise 75% of the 1000 requiredWe can promise 75% of the 1000 required
We can promise 751We can promise 751
We let 249 unsatisfiedWe let 249 unsatisfied
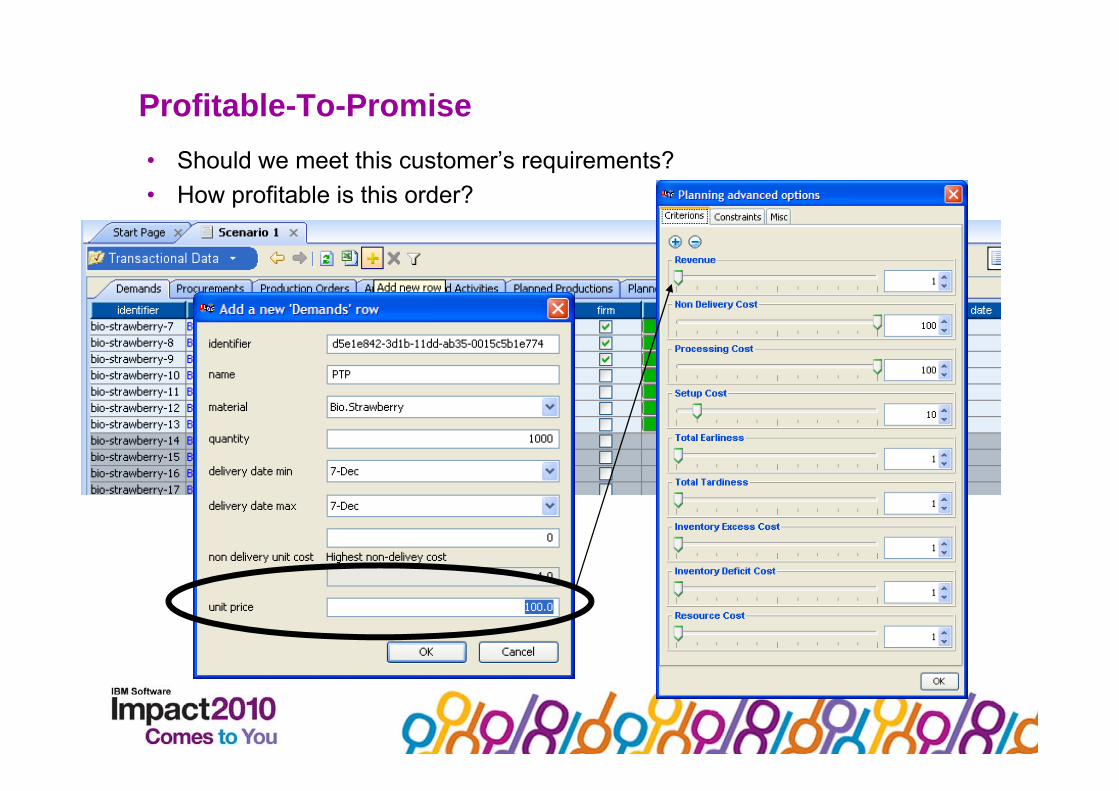
Profitable-To-Promise• Should we meet this customer’s requirements?• How profitable is this order?
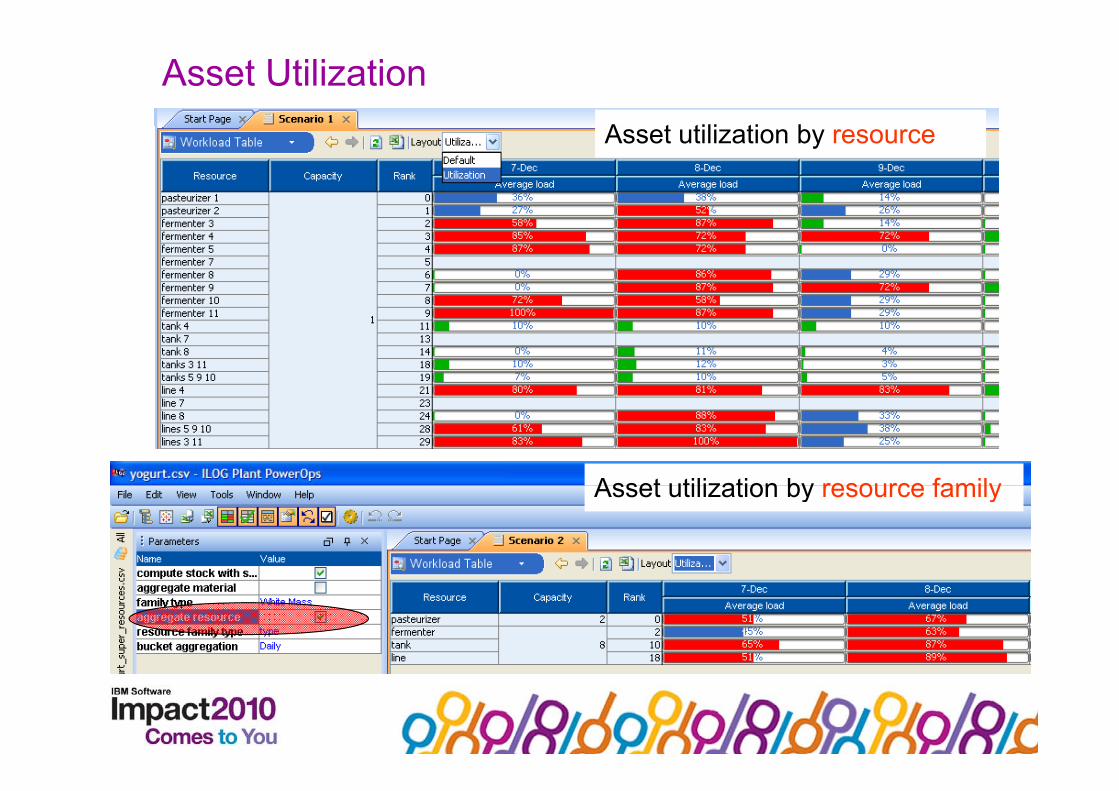
Asset UtilizationA t tili ti bAsset utilization by resource
Asset utilization by resource familyAsset utilization by resource family

Asset utilizationAsset utilization
• Detailed workload table including total changeover time, total d i i b b f ilproductive time etc. by resource or by resource family
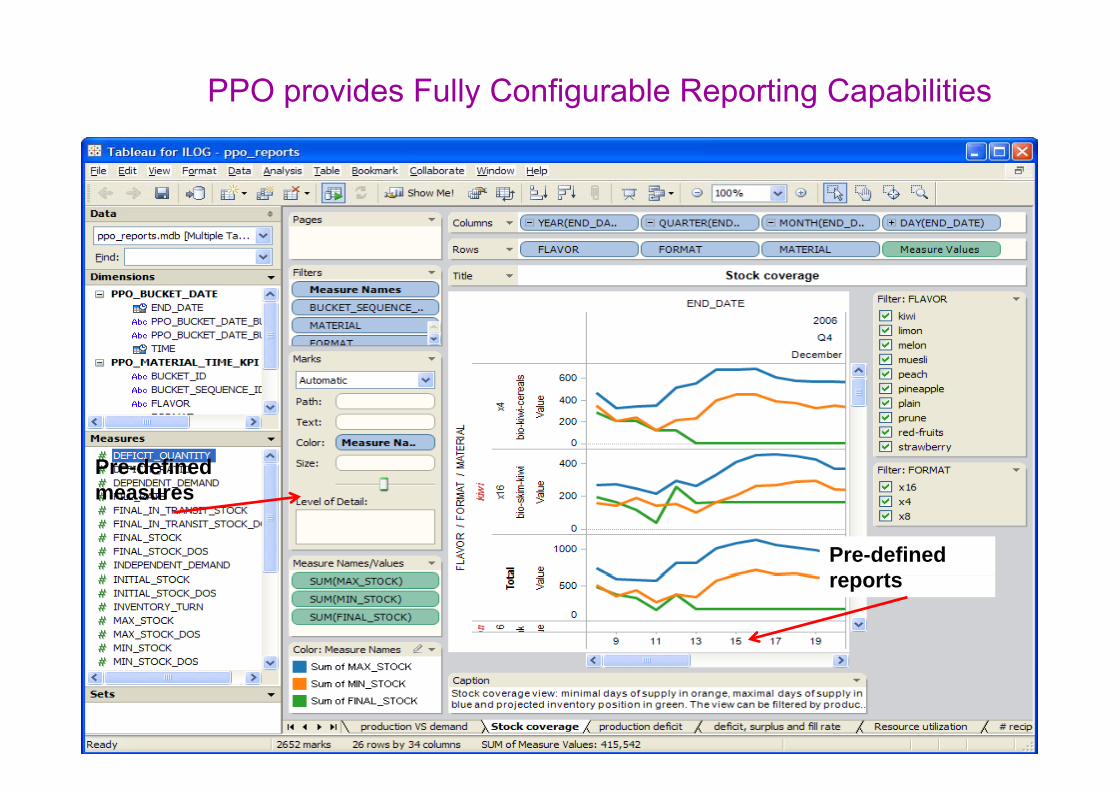
PPO provides Fully Configurable Reporting Capabilities
Pre-defined measures
Pre-defined treports

Integrated Planning and Schedulingg g g
Improve agility and visibility
Reach operational efficiency while respecting min and max days of supply
Analyze demand variation, inventory, min and max days
f lof supply

Inventory alerts in PPOy
Inventory excess with respect to max days of supply
Inventory deficit with respect to min days of supply
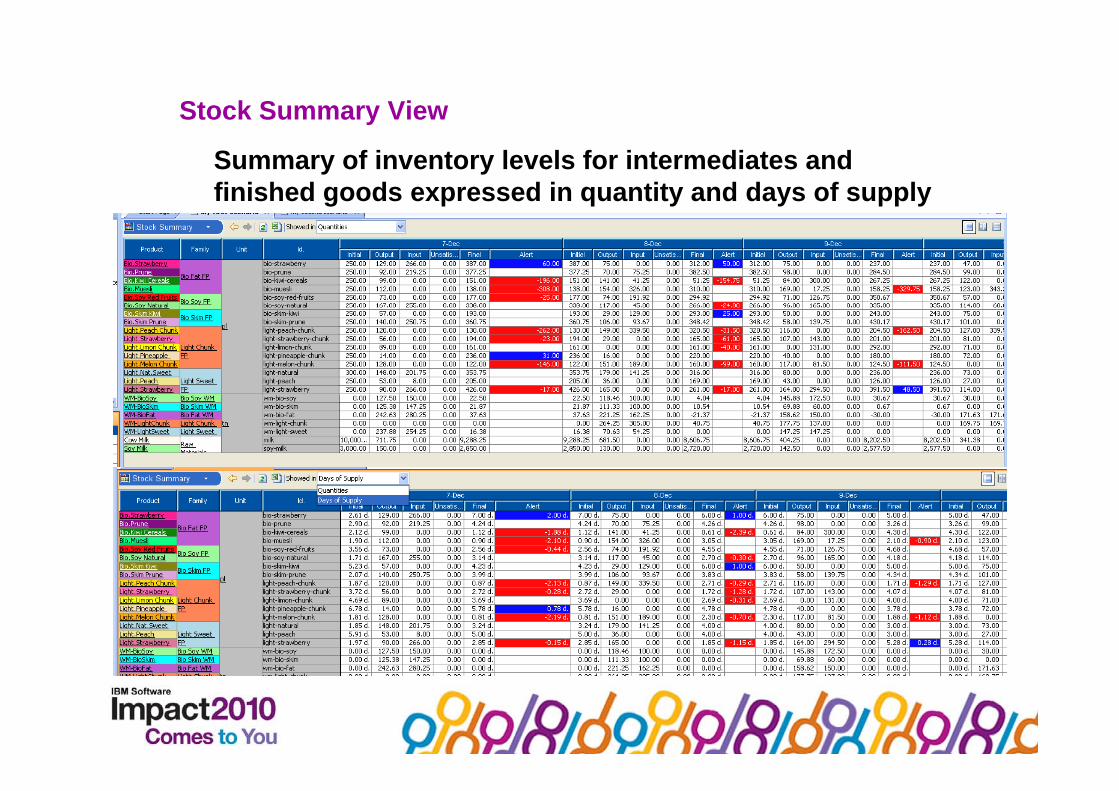
Stock Summary View
Summary of inventory levels for intermediates and finished goods expressed in quantity and days of supply

Fresh dairy products Yogurt Production Processy p g• Semi-finished product
• Setup times
Milk Pasteurizers Storage Tanks• Connectivity
• Capacity• Batch size
• Cow• Soy
Fermenters
Planning Objectives
Pl h h f h d t
• Compatibilityatc s e
Filli Li
• Plan how much of each product to produce per day
• Schedule production at minute granularity
• Minimize setupsMi i i t f t k i k
• Safety stock• Shelf life
Filling LinesFinishedProduct
• Minimize out-of-stock risks• Minimize waste• Push production • Multi-purpose
• Setup times• Cleaning in placeg p
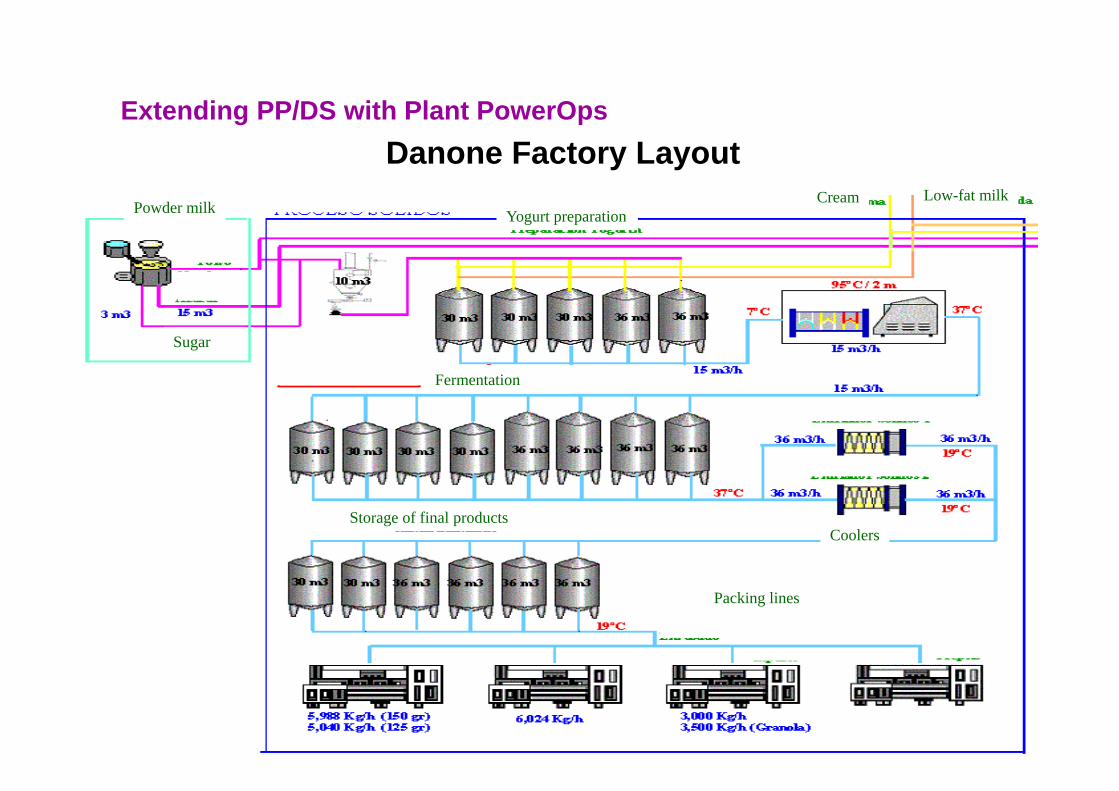
Extending PP/DS with Plant PowerOps
Powder milk Yogurt preparationCream Low-fat milk
Danone Factory Layout
Yogurt preparation
Sugar
Fermentation
CoolersStorage of final products
Packing lines

PASTO
CowMilk
SoyMilk
2 kind of raw materials: cow milk and soy milk, a setup time is incurred to clean the pasto after soy milk
BAT I BAT II BAT IVBAT IIIferment
Pasteurized MilkFermenter 7, Tank 7, Line 7 down
pasto after soy milk
FERMENTER 4 FERMENTER 5 FERMENTER 9 FERMENTER 10 FERMENTER 11 FERMENTER 3 FERMENTER 8 FERMENTER 7
BAT I BAT II BAT IVBAT IIIferment
Intermediates: different White Masses obtained from fermentation of milk in batches and stored in cold storage tanks
WMBio
Skim
WMVital.
Chunk
WMVital.
Chunk
WMVital.
Chunk
WMBioSoy
WMBioFat
WMBioFat
WMVital.
Sweet.down
fermentation of milk in batches and stored in cold storage tanks
TANK 4 TANK 5 TANK 9 TANK 10
L
TANK 11
L
TANK 3 TANK 8 TANK 7
fruit
LINE
4
LINE
5
LINE
9
LINE
10
LINE
11
LINE
3
LINE
8
LINE
7Connectivity to be managed between tanks and lines
O diti i li BioPrune
BioSoyRed
BioSoy
Natural
Vital.PeachChunk
Vital.Strawberry
BioSkimPrune
Vital.Limon
Vital.Pinapple
Vital.Peach
Vital.Strawberry
BioKiwi
Cereals
BioMuesli
BioStrawberry
BioPrune
BioStrawberry
BioKiwi
Cereals
BioMuesli
BioSkim
downOn conditioning lines:•Setup times when product switching (labeling, fruit container plugging etc.)•Cleaning In Place triggered on:Red
Fruits
yChunk
Vital.Natural
ppChunk Strawberry Muesli Strawberry
Vital.MelonChunk
Strawberry Muesli Kiwi
Final products: fruit adding and packagingNot all products can be made on all lines
g gg• transition from product with allergens• elapsed time since previous CIP

Pharmaceutical Industry
Chemical Substances Micro-organic cultures Vegetable or animal tissues
Fermentation & purificationSynthesis
Ph l i ll ti i di t
Extraction
PREPARATION OF THE ACTIVE INGREDIENT Pharmacologically active ingredient
Proportioning
ACTIVE INGREDIENT
p g
Mixing
PREPARATION OF THE PHARMACEUTICAL PRODUCT
Direct useCapsules, GranulesTablets, Pills, …
PackagingPACKAGING
9/3/2010
ILOG, All rights reserved 77
ac ag gPACKAGING

Example
Micro-organic cultures Cell culture and harvest Purification Bulk, fill, freeze, dry
Bioreactors and harvest Upstream purification Downstream purification
CIP SkidsCIP Skids
Media preparationand hold
Buffer preparation and hold
Buffer preparation and hold
9/3/2010 ILOG, All rights reserved 78

Example
Cleaning in place
9/3/2010 ILOG, All rights reserved 79

Conclusion: Benefits
Reduce waste, work-in-process inventory and cycle time
Increase throughput via improved resource utilization
Generate realistic schedules by taking into accounts true manufacturing constraints
Improve the synchronization between intermediate products and finished goods
Align manufacturing execution with demand sensing
Reduce planning and scheduling cycle time
Improve production smoothing by generating plans with stable production frequency and low production variability
Quickly align manufacturing strategies to changing market conditions
3-Sep-10 ILOG, All rights reserved80

Traditional Chinese
HindiVietnamese
धन्यवाद 謝謝你cảm ơn bạn
GraciasRussian Spanish
Chinese
спасибо
ObrigadoEnglish
Russian p
Brazilian Portugueseشكرا لك
Thank You
MerciGrazie DankeGermanItalian
Brazilian PortugueseArabic
MerciFrench
GermanItalian
谢谢你
Japanese
SimplifiedChinese Koreanありがとうございました
고맙습니다谢谢你


