23
| Date post: | 13-Dec-2015 |
| Category: |
Documents |
| Upload: | oswin-hampton |
| View: | 214 times |
| Download: | 0 times |

2
BEC World plc.BEC World plc.
1Q09 Results
SET Opportunity Day
June 05, 2009
Company’s background
Industry Overview
Financial Highlights
2009 Outlooks

3
Company Background:Company Background:
Over 39 years of experience in television.
11 more years to go under the existing license.
Concession fees were duly fixed.Much more than an ordinary
television company.

4
2008 Revenue:2008 Revenue:
Advertising Income
Copyright & Other Serices
Concerts & Shows
Advertising Revenues are dominant part of our revenues.
5
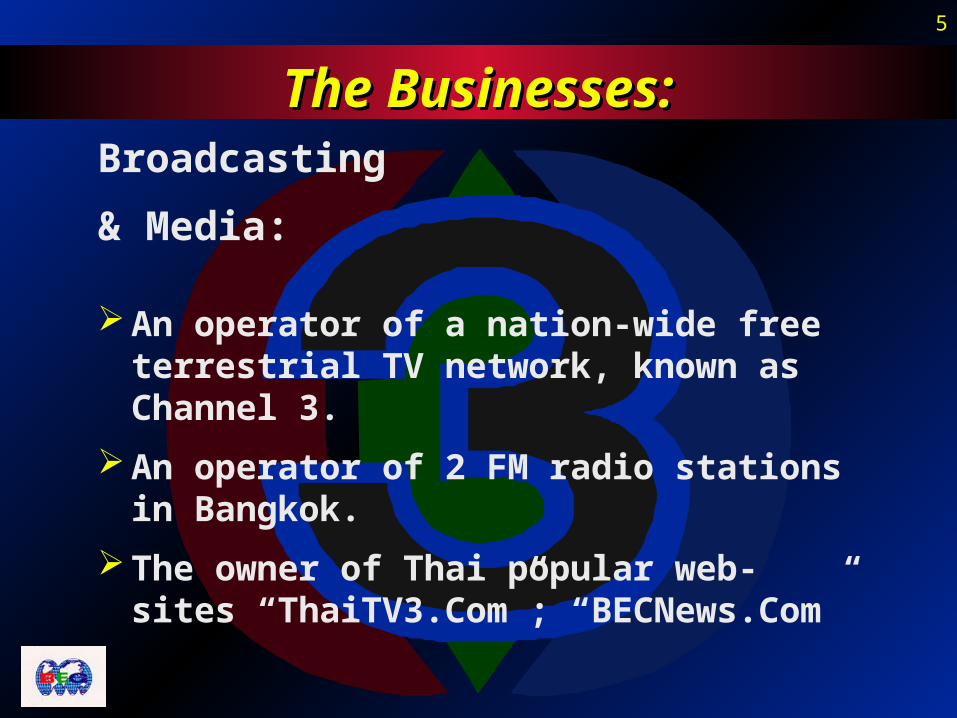
The Businesses:The Businesses:Broadcasting
& Media:
An operator of a nation-wide free terrestrial TV network, known as Channel 3.
An operator of 2 FM radio stations in Bangkok.
The owner of Thai popular web-sites “ThaiTV3.Com”; “BECNews.Com”
6
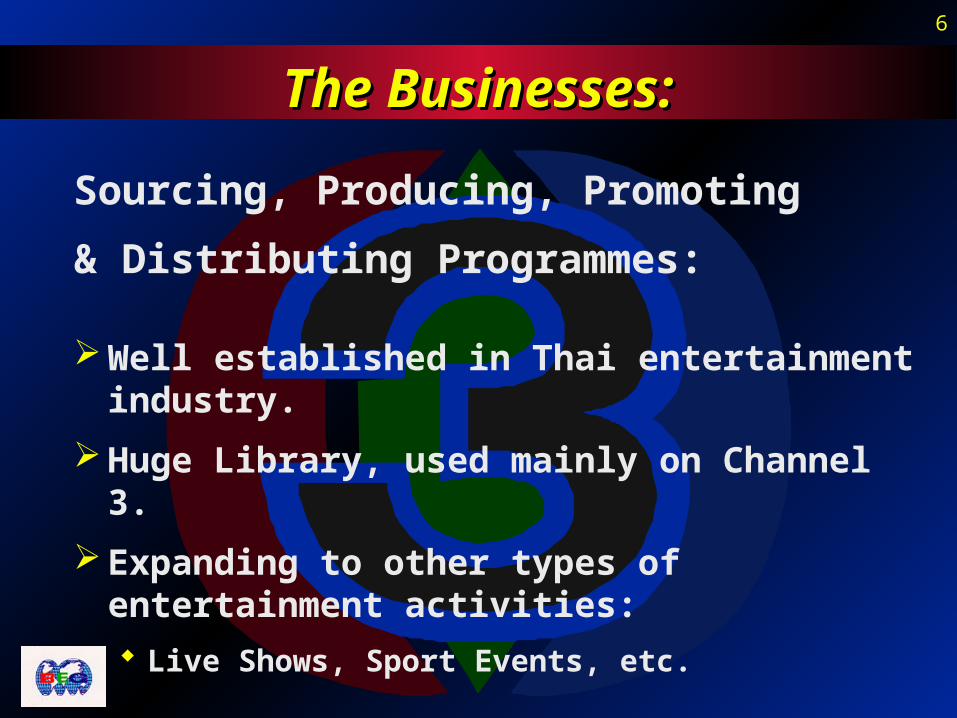
The Businesses:The Businesses:
Sourcing, Producing, Promoting
& Distributing Programmes:
Well established in Thai entertainment industry.
Huge Library, used mainly on Channel 3.
Expanding to other types of entertainment activities:
Live Shows, Sport Events, etc.

7
TV Advertising Trend:TV Advertising Trend:
0
10,000
20,000
30,000
40,000
50,000
60,000
1992 '9
4'9
6'9
820
00 '02
'04
'06
'08
Bt m
High Growth Rate – Recovers FastSource: AGB Nielsen Media Research
'95 '96 '97 '98 '99 2000 '01 '02 '03 '04 '05 '06 '07 '08
13.7% 18.6% 9.9% -15.1% 11.4% 17.7% 7.9% 13.6% 13.3% 11.5% 6.0% 6.9% 0.0% - 4.4%
Major Change in ’08 as T-PBS started.Trend was disrupted.
8
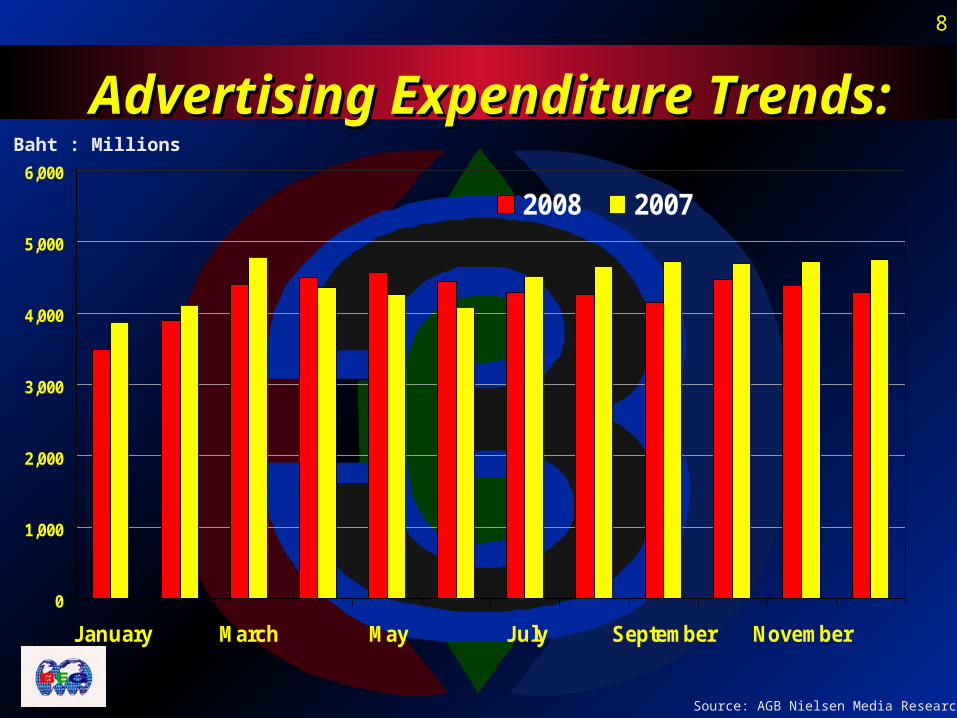
Source: AGB Nielsen Media Research
0
1,000
2,000
3,000
4,000
5,000
6,000
January March May July September November
2008 2007
Advertising Expenditure Trends:Advertising Expenditure Trends:Baht : Millions

9
Advertising Expenditure Trends:Advertising Expenditure Trends:
Source: AGB Nielsen Media Research
ESTIMATED TOTAL ADVERTISING EXPENDITURE BY MEDIUM
1st QUARTER ’09 VS ’08BAHT MILLIONS
MEDIA 1Q09 SOV% 1Q08 SOV% DIFF % Change
TV 12,055 59.3 11,779 56.6 279 2.34
RADIO 1,322 6.5 1,508 7.2 (186) (12.33)
NEWSPAPERS 3,173 15.6 3,631 17.4 (458) (12.61)
MAGAZINES 1,127 5.5 1,313 6.3 (186) (14.17)
CINEMA 961 4.7 979 4.7 (18) (1.84)
OUTDOOR 1,010 5.0 1,091 5.2 (81) (7.42)
TRANSIT 440 2.2 318 1.5 122 38.36
IN STORE 186 0.9 167 0.8 19 11.38
INTERNET 42 0.2 43 0.2 (2) (2.33)
TOTAL 20,315 100.00 20,827 100.00 (512) (2.46)

10
Source: AGB Nielsen Media Research
0
500
1,000
1,500
2,000
2,500
3,000
3,500
4,000
CHANNEL3
CHANNEL5
CHANNEL7
CHANNEL9
TITV / T-PBS
CHANNEL11
1Q09 1Q08
Advertising Spends on TV Advertising Spends on TV 1st QUARTER ’09 vs. ’081st QUARTER ’09 vs. ’08
Baht : Millions
+8.9%

11
Source: AGB Nielsen Media Research
ADVERTISER(x1,000BAHT)
1Q’091Q’0
8%
YoY
3 5 7 9 NBT
%CHG %CHG %CHG %CHG %CHG
UNILEVER (THAI) HOLDINGS9977,
41
102
299,1 -25. % 1.7% 8%
-375.% 565. %
BEIERSDORF (THAILAND)5376,
65
231,545
132.2%
267.5%
114.6%
168.% 835. %
PROCTER & GAMBLE (THAILAND)
3787, 87
424,614
-108.%
-13.8%
853.%
-327.%
214.1%
L'OREAL (THAILAND)3495,
57
236,938 47.5%
132.%
155.5%
445.%
212.2%
- COLGATE PALMOLIVE (THAILAND)
2860, 74
189,534
509
%463.
%921.
% -89. %336.5%
NESTLE (THAI)2331,
24
216,391 7.7%
124.%
199.% 12. %
-220.%
JOHNSON & JOHNSON THAILAND
1973, 99
169,567
164.%535.
% -33. %-154.
% -77. %
OSOTSPA CO.,LTD.1841,
54
221,022
-167.%100.
%-517.
% -15. % -85. %-131.
%
GMM GRAMMY Plc.1527,
04
115,726
320.% 0.0%
521.%
-444.% 02. %
CEREBOS(THAILAND)LTD.1493,
99
114,402
306.%282.
%386.
%310.
% 309. %
PTT PUBLIC CO.,LTD.1394,
69
137,894 11. %
410.% 59. %
377.%
-295.% 721. %
ADVANCE INFO SERVICE1389,
24
971,26
430.%316.
%131.5%
149.% 888. %
306,85. %
KAO COMMERCIAL (THAILAND)1338,
51
146,328 -85. % -75. %
266.%
-180.%
-236.%
BETTER WAY (THAILAND)1326,
44
112,956
174.%566.
% -77. %659.
%-163.
%
TOYOTA MOTOR THAILAND 1223,
22
192,893
-366.%
-55.3%
-166.%
-570.%
-333.% 833. %
LION (THAILAND) CO.,LTD.1197,
02
984,00
216.% 55. %
647.% 92. % 48. %
- COCA COLA (THAILAND)1130,
91
853,49
325.%531.
%-335.
%863.
% -34. %-562.
%
SINGHA CORP ORATION CO.,LTD.
9628, 7
313,94
206.7%
617.2%
106.7%
194.5%
276.6% 70. %
OFFICE OF THE PRIME MINISTER
9334, 8
576,30
620.%125.1%
742.2%
635.1%
152.1%
-287.%

12
Market Shares 1Q 2009:Market Shares 1Q 2009:
05
101520253035404550
Ch.3 Ch.5 Ch.7 Ch.9 Ch.11 TiTV / T-PBS
% Share of adspend Share of viewers
Source: AGB Nielsen Media Research

13
Baht:Millions 1Q’09 +/- YoY Advertising 1,834.0 -3.6%
Copyright & Services 36.2 -9.4%
Concerts & Shows 129.3 +6.6%
Total Sales Revenue 1,999.4 -3.1%
1Q’09 Highlights:1Q’09 Highlights:
Net Earnings 544.2 -18.8%

14
BEC WorldBEC WorldOperating ResultsOperating Results
BEC World 1Q’09 Operating Results:
Operating Results ฿ Million % +/- YoY
Total Sales Revenues 1,999.4 100% -63.3 - 3%
Operating Costs
Cost of Services 759.1 41% 78.6 +12%
Cost of Shows 117.3 91% 14.3 +14%
Cost of Sales & Services 876.4 44% 92.9 +12%
Selling Expenses 106.8 5% 12.2 +13%
Admin. Expenses 252.5 13% 33.8 +16%
Total Operating Costs 1,235.7 62% 138.8 +13%
Operating Profit 763.7 38% -202.1 - 21%
Share of Associates' Results 0 0% 43.3 +100%
Other Income 33.3 2% 1.0 +3%
Profit Before Tax 797.0 40% -157.9 - 16%
Corporate Income Tax 240.3 12% - 37.0 - 13%
Profit After Tax 556.7 28% -120.8 - 18%
Profit of Minority's Interest 12.4 1% 4.8
+63%
NET PROFIT 544.2 27% -125.6 -19%
15
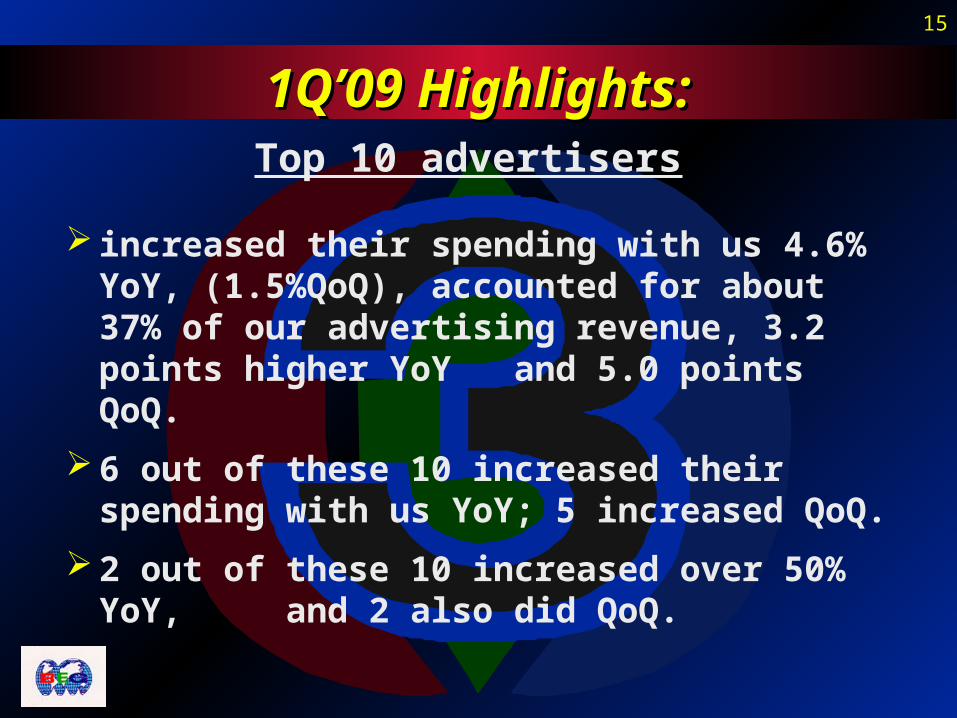
1Q’09 Highlights:1Q’09 Highlights:Top 10 advertisers
increased their spending with us 4.6% YoY, (1.5%QoQ), accounted for about 37% of our advertising revenue, 3.2 points higher YoY and 5.0 points QoQ.
6 out of these 10 increased their spending with us YoY; 5 increased QoQ.
2 out of these 10 increased over 50% YoY, and 2 also did QoQ.

16
1Q’09 Highlights:1Q’09 Highlights:Second top 10 advertisers
increased their spending with us 15.1% yoy (23.8% QoQ), accounted for about 11% of our advertising revenue, about 1.8 points higher YoY, and 3.4 points QoQ.
6 out of these 10 increased their spending YoY, 7 increased QoQ.
2 out of these 10 increased over 50% YoY, and 5 also did QoQ.
17
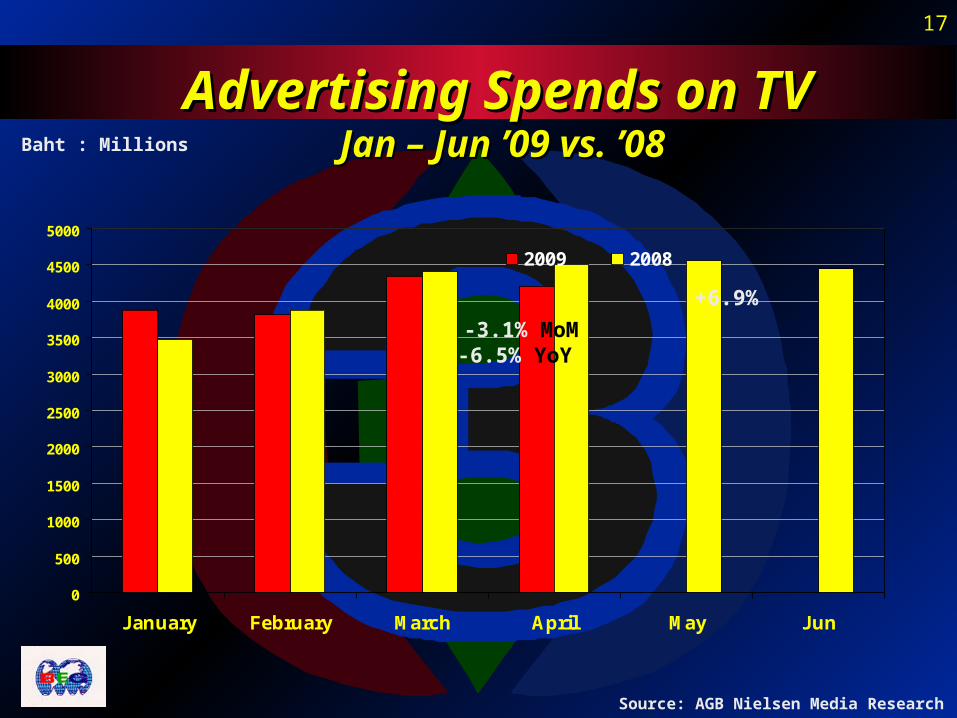
Source: AGB Nielsen Media Research
0
500
1000
1500
2000
2500
3000
3500
4000
4500
5000
January February March April May Jun
2009 2008
Advertising Spends on TVAdvertising Spends on TV Jan – Jun ’09 vs. ’08Jan – Jun ’09 vs. ’08Baht : Millions
-3.1% MoM-6.5% YoY
+6.9%
18
0
200
400
600
800
1000
1200
1400
1600
CHANNEL 3 CHANNEL 5 CHANNEL 7 CHANNEL 9 CHANNEL 11
2009 2008
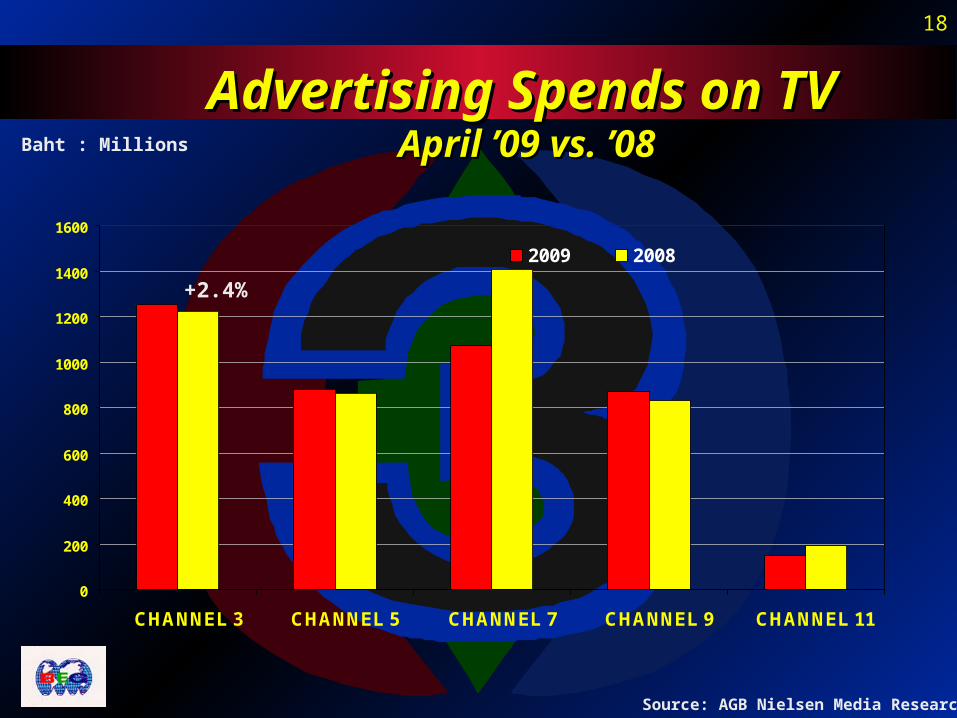
Advertising Spends on TVAdvertising Spends on TV April ’09 vs. ’08April ’09 vs. ’08Baht : Millions
Source: AGB Nielsen Media Research
+2.4%
19
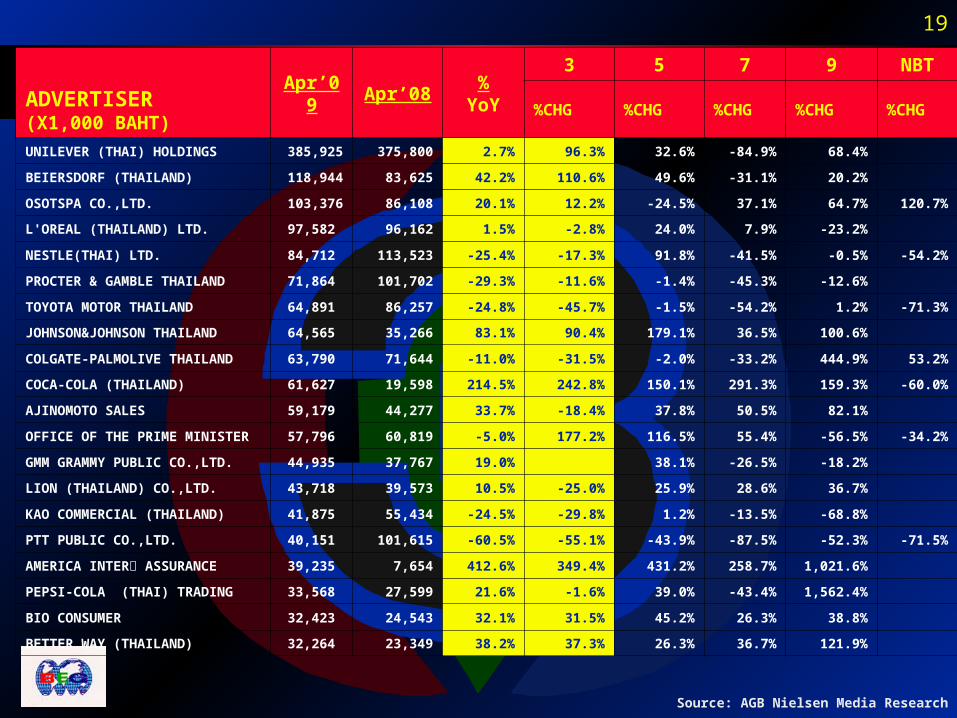
Source: AGB Nielsen Media Research
ADVERTISER(X1,000 BAHT)
Apr’09
Apr’08%
YoY
3 5 7 9 NBT
%CHG %CHG %CHG %CHG %CHG
UNILEVER (THAI) HOLDINGS385,925
3758,00 27. % 963. % 326. %
-849.% 684. %
BEIERSDORF (THAILAND)118,
944
8362,5
422.%1106.
% 496. %-311.
% 202. %
OSOTSPA CO.,LTD.103,
376
8610,8
201.% 122. % -245. %
371.% 647. %
120.7%
L'OREAL (THAILAND) LTD.975,
82
9616,2 15. % -28. % 240. % 79. % -232. %
NESTLE(THAI) LTD.847,
12
1135,23
-254.% -173. % 918. %
-415.% -05. %
-542.%
PROCTER & GAMBLE THAILAND718,
64
1017,02
-293.% -116. % -14. %
-453.% -126. %
TOYOTA MOTOR THAILAND 648,
91
8625,7
-248.% -457. % -15. %
-542.% 12. %
-713.%
JOHNSON&JOHNSON THAILAND645,
65
3526,6
831.% 904. %
1791.%
365.%1006.
%
- COLGATE PALMOLIVE THAILAND
637, 90
7164,4
-110.% -315. % -20. %
-332.%4449.
%532.
%
- COCA COLA (THAILAND)616,
27
1959,8
214.5%
2428.%1501.
%291.3%
1593.%
-600.%
AJINOMOTO SALES591,
79
4427,7
337.% -184. % 378. %
505.% 821. %
OFFICE OF THE PRIME MINISTER
577, 96
6081,9 -50. %
1772.%1165.
%554.
% -565. %-342.
%
GMM GRAMMY PUBLIC CO.,LTD.
449, 35
3776,7
190.% 381. %
-265.% -182. %
LION (THAILAND) CO.,LTD.437,
18
3957,3
105.% -250. % 259. %
286.% 367. %
KAO COMMERCIAL (THAILAND)418,
75
5543,4
-245.% -298. % 12. %
-135.% -688. %
PTT PUBLIC CO.,LTD.401,
51
1016,15
-605.% -551. % -439. %
-875.% -523. %
-715.%
AMERICA INTERใ ASSURANCE392,
35 7654,412.6%
3494.%4312.
%258.7%
1021,6. %
PEPSI-COLA (THAI) TRADING335,
68
2759,9
216.% -16. % 390. %
-434.%1562,
4. %
BIO CONSUMER324,
23
2454,3
321.% 315. % 452. %
263.% 388. %
BETTER WAY (THAILAND)322,
64
2334,9
382.% 373. % 263. %
367.%1219.
%

20
Industry Reform:Industry Reform:
The Broadcasting Bill is now effective.
The reform is about to begin.
The reform is “blessing in disguised” for BEC as the industry will be more transparent and orderly.
Long awaited new investment opportunities in domestic market will be opened for BEC.

21
High Operating Leverage:High Operating Leverage:
As our operating costs and expenses are mostly fixed in nature, thus BEC World has high operating leverage.
Our profitability will improve greater than the growth rate of our revenue growth.
0.60
0.80
1.00
1.20
1.40
1.60
1.80
2.00
2.20
2.40
2.60
2.80
3.00
3.20
3.40
Revenue Profit
Revenue and Profit Growth
(1Q99 is BASE)
22
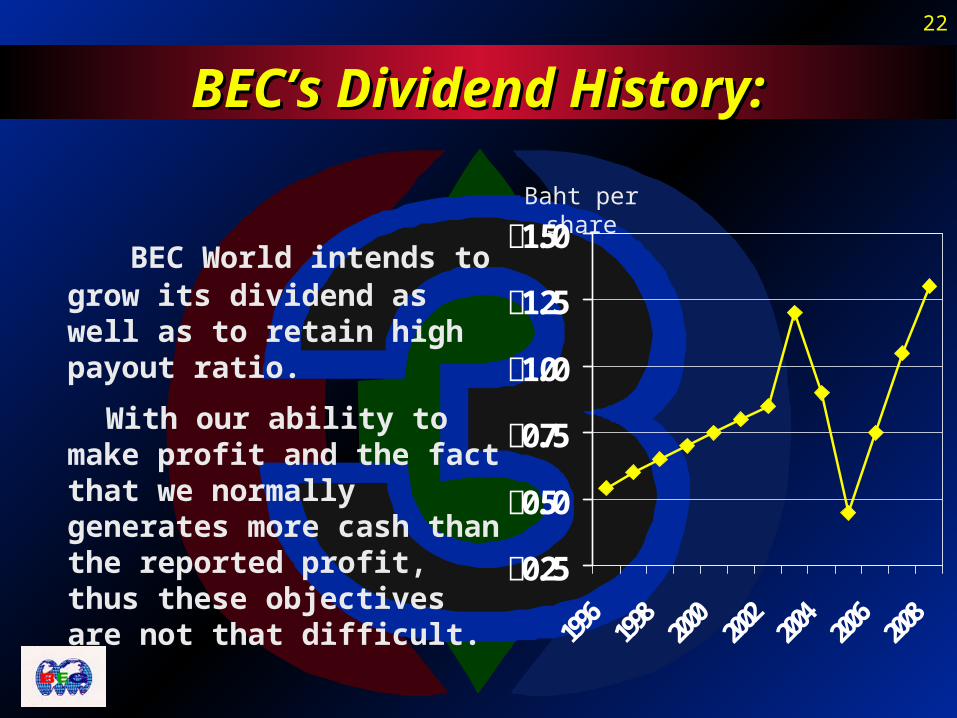
BEC’s Dividend History:BEC’s Dividend History:
BEC World intends to grow its dividend as well as to retain high payout ratio.
With our ability to make profit and the fact that we normally generates more cash than the reported profit, thus these objectives are not that difficult.
Baht per share
฿0.25
฿0.50
฿0.75
฿1.00
฿1.25
฿1.50


![TMB Bank Plc. · Analysts & Investors Presentation. May 2009 [2] Operating performance and financial outlook Economic outlook and 1Q09 results review Key developments after 1Q09 Business](https://static.documents.pub/doc/80x56/5f7c361172bb5363dd7bd77e/tmb-bank-plc-analysts-investors-presentation-may-2009-2-operating-performance.jpg)
![1Q09 Financial Advisory[1]](https://static.documents.pub/doc/80x56/577d2fa81a28ab4e1eb244fa/1q09-financial-advisory1.jpg)