18
| Date post: | 28-Dec-2015 |
| Category: |
Documents |
| Upload: | helen-montgomery |
| View: | 217 times |
| Download: | 0 times |

2
BEC World plc.BEC World plc.
Asian Investment Conference
March 31 – April 2, 2008
Industry Overview
Financial Highlights
2008 Outlooks

3
Company Background:Company Background:
Over 38 years of experience in television.
12 more years to go under the existing license.
Concession fees were duly fixed.Much more than an ordinary
television company.

4
The Businesses:The Businesses:Broadcasting
& Media:
An operator of a nation-wide free terrestrial TV network, known as Channel 3.
An operator of 3 FM radio stations in Bangkok.
The owner of Thai popular web-sites “ThaiTV3.Com”; “BECNews.Com”
5
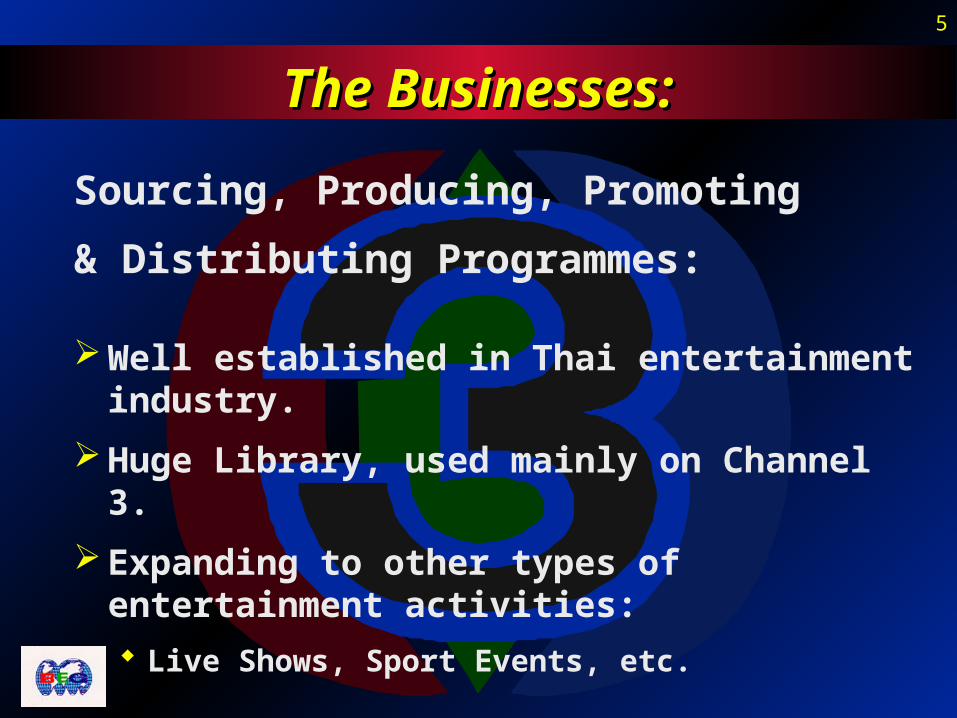
The Businesses:The Businesses:
Sourcing, Producing, Promoting
& Distributing Programmes:
Well established in Thai entertainment industry.
Huge Library, used mainly on Channel 3.
Expanding to other types of entertainment activities:
Live Shows, Sport Events, etc.

6
2007 Revenue:2007 Revenue:
Advertising Income
Copyright & Other Serices
Concerts & Shows
Advertising Revenues are dominant part of our revenues.

7
TV Advertising Trend:TV Advertising Trend:
0
10,000
20,000
30,000
40,000
50,000
60,000Bt m
High Growth Rate – Recovers FastSource: AGB Nielsen Media Research
8
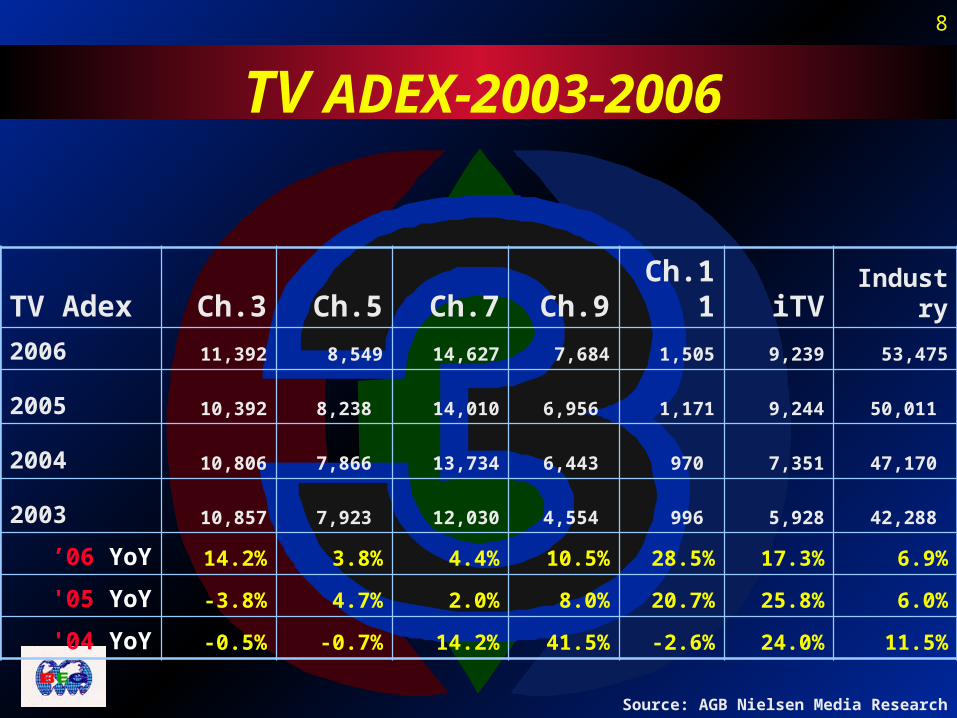
TV ADEX-2003-2006
TV Adex Ch.3 Ch.5 Ch.7 Ch.9 Ch.11 iTV Industry
2006 11,392 8,549 14,627 7,684 1,505 9,239 53,475
2005 10,392 8,238 14,010 6,956 1,171 9,244 50,011
2004 10,806 7,866 13,734 6,443 970 7,351 47,170
2003 10,857 7,923 12,030 4,554 996 5,928 42,288
’06 YoY 14.2% 3.8% 4.4% 10.5% 28.5% 17.3% 6.9%
'05 YoY -3.8% 4.7% 2.0% 8.0% 20.7% 25.8% 6.0%
'04 YoY -0.5% -0.7% 14.2% 41.5% -2.6% 24.0% 11.5%
Source: AGB Nielsen Media Research

9
Advertising Expenditure Trends:Advertising Expenditure Trends:
Source: AGB Nielsen Media Research
ESTIMATED TOTAL ADVERTISING EXPENDITURE BY MEDIUM
2007 VS 2006
BAHT MILLIONS
MEDIA 2007 SOV% 2006 SOV% DIFF % Change
TV 53,484 58.13 53,473 59.59 11 0.02
RADIO 6,401 6.96 6,596 7.35 (195) (2.96)
NEWSPAPERS 15,286 17.20 15,425 17.19 401 2.60
MAGAZINES 5,903 6.42 6,179 6.89 (276) (4.47)
CINEMA 4,391 4.77 2,086 2.32 2,305 110.50
OUTDOOR 4,480 4.87 4,667 5.20 (187) (4.01)
TRANSIT 956 1.04 994 1.11 (38) (3.82)
IN STORE 570 0.62 314 0.35 256 81.53
TOTAL 92,010 100.00 89,735 100.00 2,275 2.54
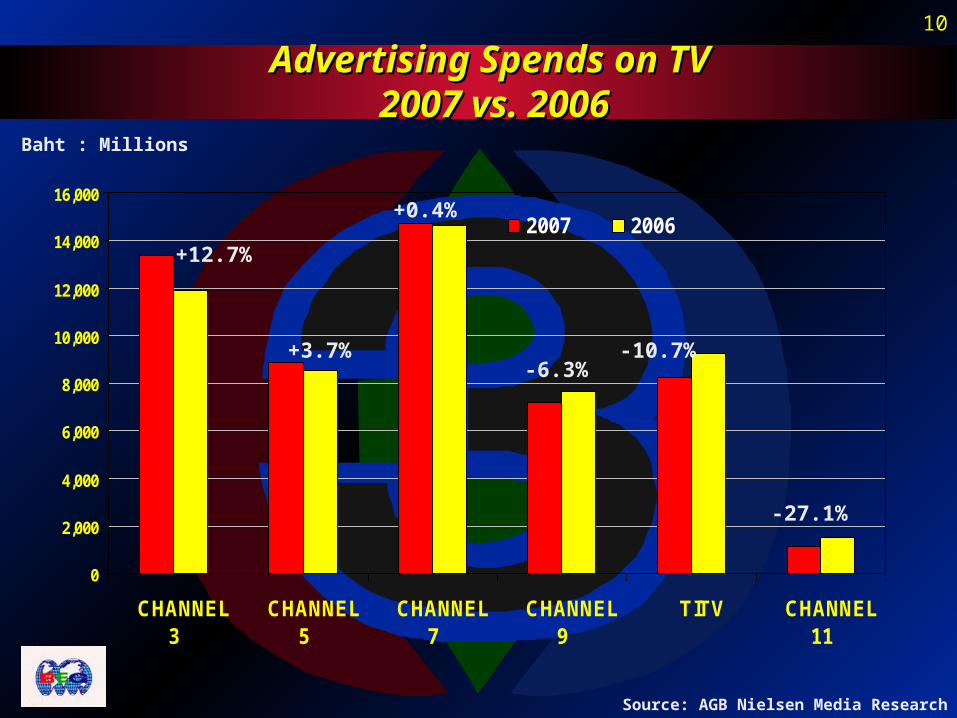
10
Source: AGB Nielsen Media Research
0
2,000
4,000
6,000
8,000
10,000
12,000
14,000
16,000
CHANNEL3
CHANNEL5
CHANNEL7
CHANNEL9
TITV CHANNEL11
2007 2006
Advertising Spends on TV Advertising Spends on TV 2007 vs. 20062007 vs. 2006
Baht : Millions
+12.7%
+3.7%
+0.4%
-6.3%-10.7%
-27.1%
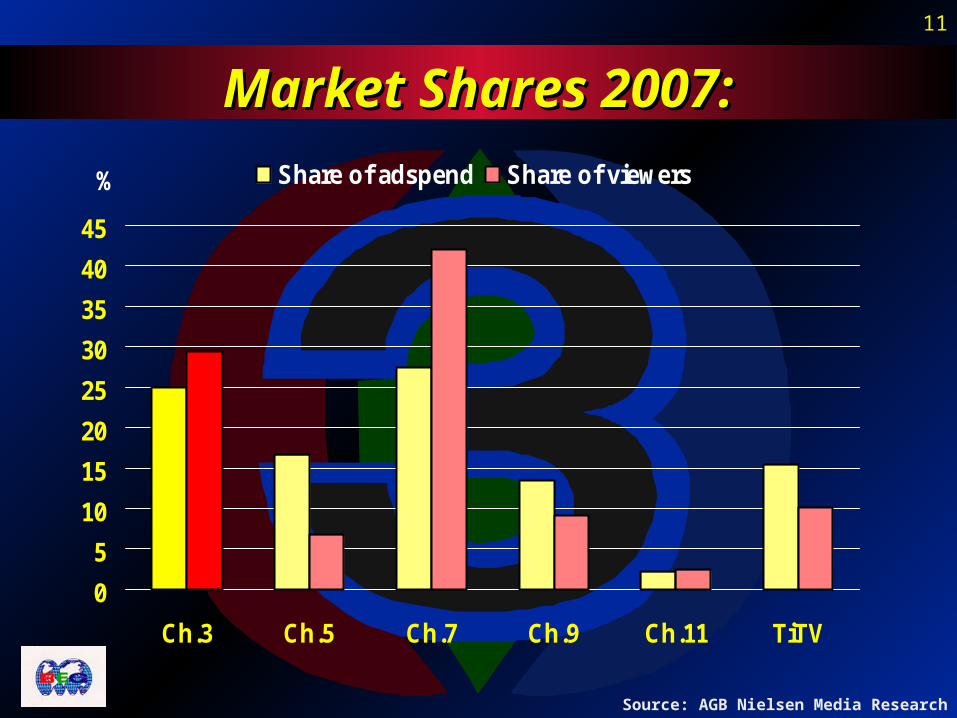
11
Market Shares 2007:Market Shares 2007:
0
5
10
15
20
25
30
35
40
45
Ch.3 Ch.5 Ch.7 Ch.9 Ch.11 TiTV
% Share of adspend Share of viewers
Source: AGB Nielsen Media Research
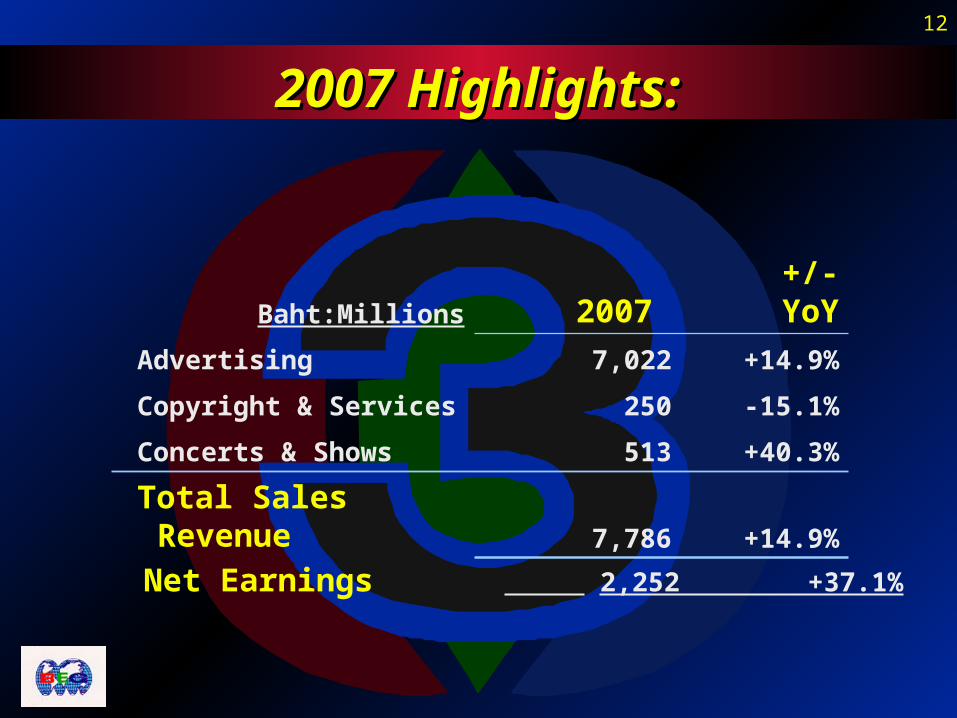
12
Baht:Millions 2007 +/- YoY Advertising 7,022 +14.9%
Copyright & Services 250 -15.1%
Concerts & Shows 513 +40.3%
Total Sales Revenue 7,786 +14.9%
2007 Highlights:2007 Highlights:
Net Earnings 2,252 +37.1%

13
BEC WorldBEC WorldOperating ResultsOperating Results
BEC World 2007 Operating Results:
Operating Results ฿ Million % +/- YoY
Total Sales Revenues 7,786 100% +908 +15%
Operating Costs
Cost of Services 2,776 38% -135 -5%
Cost of Shows 471 92% +94 +26%
Cost of Sales & Services 3,247 42% -37 -2%
Selling & Admin. Expenses 1,366 17% 34 +3%
Total Operating Costs 4,613 59% -3 -0%
Operating Profit 3,712 41% 1,015 +47%
Share of Associates' Results -60 -1% -64 -1754%
Other Income 182 2% 21 +13%
Profit Before Tax 3,294 42% 971 +42%
Corporate Income Tax 984 13% 324 +49%
Profit After Tax 2,310 30% 647 +39%
Profit of Minority's Interest 58 1% 38 +195%
NET PROFIT 2,252 29% 609 +37%

14
Industry Reform:Industry Reform:
The Broadcasting Bill is now effective.
The reform is about to begin.
The reform is “blessing in disguised” for BEC as the industry will be more transparent and orderly.
Long awaited new investment opportunities in domestic market will be opened for BEC.
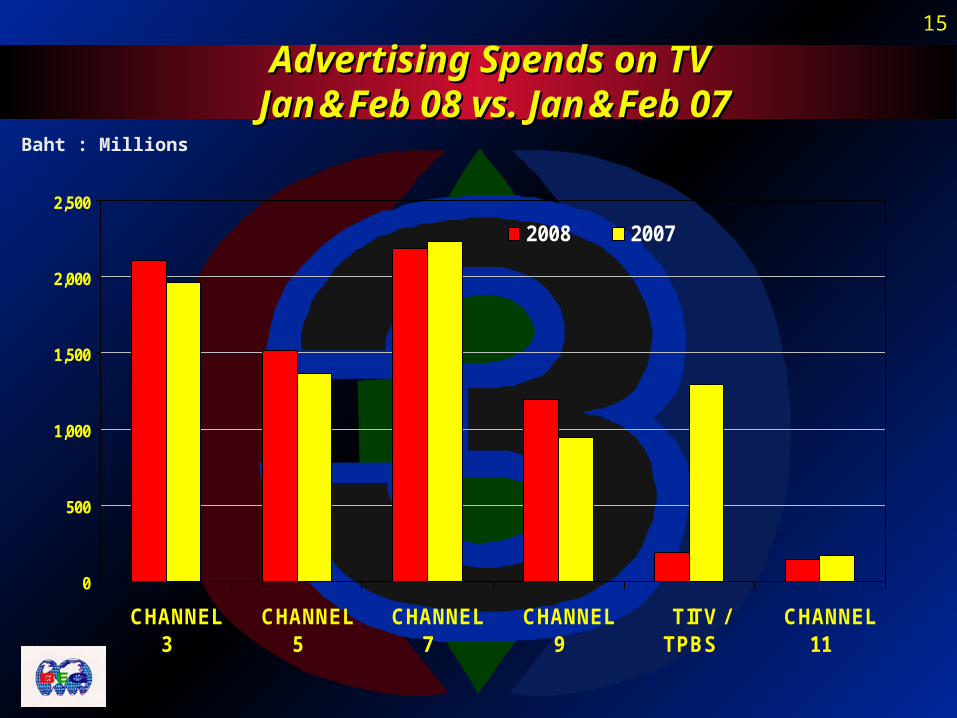
15
0
500
1,000
1,500
2,000
2,500
CHANNEL3
CHANNEL5
CHANNEL7
CHANNEL9
TITV /TPBS
CHANNEL11
2008 2007
Advertising Spends on TV Advertising Spends on TV JanJan && Feb 08 vs. JanFeb 08 vs. Jan && Feb 07Feb 07
Baht : Millions

16
High Operating Leverage:High Operating Leverage:
As our operating costs and expenses are mostly fixed in nature, thus BEC World has high operating leverage.
Our profitability will improve greater than the growth rate of our revenue growth.
0.60
0.80
1.00
1.20
1.40
1.60
1.80
2.00
2.20
2.40
2.60
2.80
3.00
Revenue Profit
Revenue and Profit Growth
(1Q99 is BASE)
17
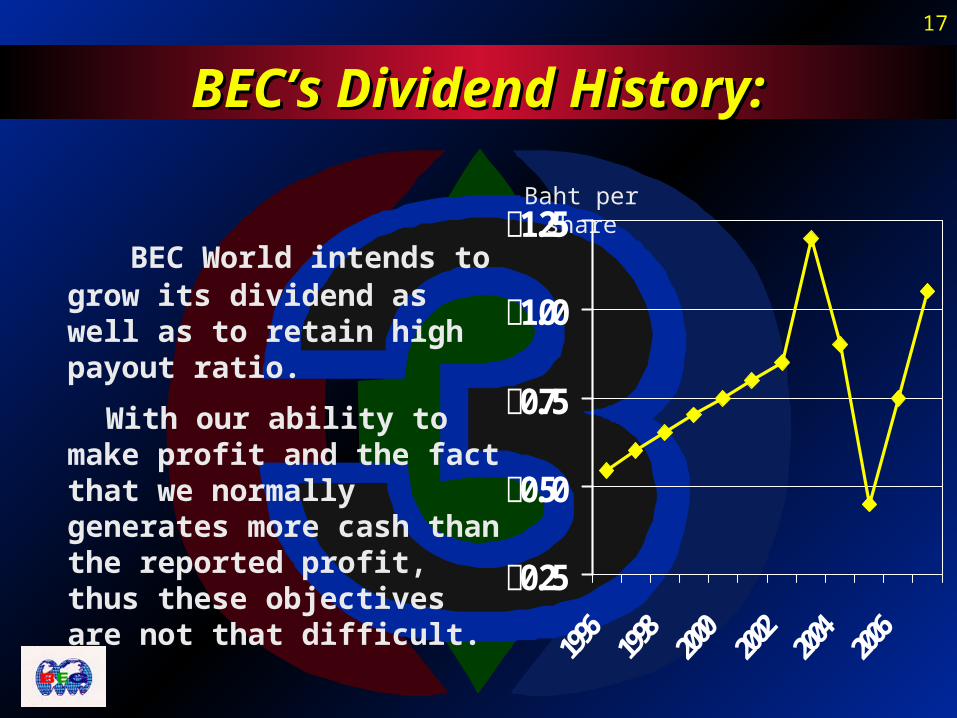
BEC’s Dividend History:BEC’s Dividend History:
BEC World intends to grow its dividend as well as to retain high payout ratio.
With our ability to make profit and the fact that we normally generates more cash than the reported profit, thus these objectives are not that difficult.
Baht per share
฿0.25
฿0.50
฿0.75
฿1.00
฿1.25