5 Original Scientific Paper Čerče, L., Pušavec, F., Dugar, J., Kopač, J. FURTHER DEVELOPMENT OF THE SPATIAL CUTTING TOOL WEAR MEASUREMENT SYSTEM Received: 7 September 2013 / Accepted: 09 October 2013 Abstract: The tool wear evaluation has a very strong impact on the product quality as well as efficiency of the manufacturing process. This paper presents the further development of an innovative and reliable direct measuring procedure for measuring spatial cutting tool wear. The influence of the orientation of measurement head according to the measurand was examined. Based on the analysis of measurements accuracy and the amount of captured reliable data, the optimal setup of the measuring system was defined. Further a special clamping system was designed to mount the measurement device on the machine tool. To test the measurement system tool life experiment were performed, where cutting tool wear was measured directly on machine tool. The results showed that novel tool wear diagnostic represent objective estimation, performed on a machine tool that provides higher productivity and quality of the machining process. Key words: spatial cutting tool wear, wear diagnostic on machine tool, optical triangulation Dalji razvoj volumetrijskog mernog sistema habanja reznog alata. Određivanje pohabanosti reznog alata ima veliki uticaj na kvalitet proizvoda kao i na efikasnost proizvodnog procesa. Ovaj rad predstavlja dalji razvoj inovativnog i pouzdanog direktnog načina volumetrijskog merenja habanja reznog alata. Ispitivan je uticaj orijentacije merne glave u odnosu na merni predmet. Na osnovu analiza tačnosti merenja i broja izmerenih pouzdanih podataka, optimalno podešavanje sistema je definisano. Takođe je razvijen i specijalan sistem pribora za prihvatanje mernog uređaja na mašinu alatku. Radi testiranja mernog sistema sprovedeno je eksperimentalno ispitivanje habanja alata, gde je pohabanost alata merena direktno na mašini alataki. Rezultati su pokazali da moderno merenje habanja alata predstavlja objektivnu procenu a izvođenje na mašini alatki obezbeđuje povećanu proizvodnost i kvalitet proizvodnog procesa. Ključne reči: volumsko habanje reznog alata, dijagnostika pohabanosti na mašinama alatkama, optička trijangulacija 1. INTRODUCTION Machining performance of material is very important in terms of material processing and quality of final product. Based on the machining performance optimal machining parameters are usually determinate. The term machining performance refers to the ease with which a metal can be machined to an acceptable surface finish, and is hardly measured/evaluated. It is defined by the following criteria: cutting tool wear, cutting tool life, cutting forces, power consumption, chip formation, machined surface integrity and geometrical accuracy of the machined surface. Criteria, such as cutting force, roughness, energy consumption, integrity and geometrical accuracy of the machined surface can be objectively determined by exact measurements, while cutting tool wear is in practice measured manually and on a subjective level [1]. Most frequently, cutting tool wear is measured with the use of toolmakers microscopes to help determine the range of wear (flank face). In addition to poor precision of this method, the problem is in three- dimensional nature of wear, which cannot be fully analyzed with 2D based measurements/measurement principles. It can be concluded that research on defining and analyzing tool wear in three dimensions is still of great significance. A survey of the literature indicates that many different approaches have been applied for tool wear prediction [2-6], contrary direct measuring techniques make an assessment of tool wear by either evaluating the worn surface by optical methods (microscope), or measuring the tool material loss by radiometric techniques. Direct methods require to periodically interrupting the cutting process. Optical methods use optical equipment like the toolmaker's microscope, optical microscope, scanning electrical microscope, charged coupled devices (CCD cameras), white light interferometry etc. [7-11]. The main disadvantages of mentioned methods is the inability of measuring crater depth KT (spatial geometry) and/or needs to preform them off line of the machining process. In one of our previous works [12] spatial tool wear measurement system has been presented which is able to measure crater depth KT on-line on the machine tool. In next chapters, optimisation of this measurement system and test on a case study will be presented. 2. MEASURING SYSTEM The measuring system consists of a high-accuracy 2D profile laser displacement sensor Keyence LJ-G015 with proper controller Keyence LJ-G5001 [13] and
Transcript
5
Original Scientific Paper
Čerče, L., Pušavec, F., Dugar, J., Kopač, J.
FURTHER DEVELOPMENT OF THE SPATIAL CUTTING TOOL WEAR MEASUREMENT SYSTEM
Received: 7 September 2013 / Accepted: 09 October 2013
Abstract: The tool wear evaluation has a very strong impact on the product quality as well as efficiency of the manufacturing process. This paper presents the further development of an innovative and reliable direct measuring procedure for measuring spatial cutting tool wear. The influence of the orientation of measurement head according to the measurand was examined. Based on the analysis of measurements accuracy and the amount of captured reliable data, the optimal setup of the measuring system was defined. Further a special clamping system was designed to mount the measurement device on the machine tool. To test the measurement system tool life experiment were performed, where cutting tool wear was measured directly on machine tool. The results showed that novel tool wear diagnostic represent objective estimation, performed on a machine tool that provides higher productivity and quality of the machining process. Key words: spatial cutting tool wear, wear diagnostic on machine tool, optical triangulation Dalji razvoj volumetrijskog mernog sistema habanja reznog alata. Određivanje pohabanosti reznog alata ima veliki uticaj na kvalitet proizvoda kao i na efikasnost proizvodnog procesa. Ovaj rad predstavlja dalji razvoj inovativnog i pouzdanog direktnog načina volumetrijskog merenja habanja reznog alata. Ispitivan je uticaj orijentacije merne glave u odnosu na merni predmet. Na osnovu analiza tačnosti merenja i broja izmerenih pouzdanih podataka, optimalno podešavanje sistema je definisano. Takođe je razvijen i specijalan sistem pribora za prihvatanje mernog uređaja na mašinu alatku. Radi testiranja mernog sistema sprovedeno je eksperimentalno ispitivanje habanja alata, gde je pohabanost alata merena direktno na mašini alataki. Rezultati su pokazali da moderno merenje habanja alata predstavlja objektivnu procenu a izvođenje na mašini alatki obezbeđuje povećanu proizvodnost i kvalitet proizvodnog procesa. Ključne reči: volumsko habanje reznog alata, dijagnostika pohabanosti na mašinama alatkama, optička trijangulacija 1. INTRODUCTION Machining performance of material is very important in terms of material processing and quality of final product. Based on the machining performance optimal machining parameters are usually determinate. The term machining performance refers to the ease with which a metal can be machined to an acceptable surface finish, and is hardly measured/evaluated. It is defined by the following criteria: cutting tool wear, cutting tool life, cutting forces, power consumption, chip formation, machined surface integrity and geometrical accuracy of the machined surface. Criteria, such as cutting force, roughness, energy consumption, integrity and geometrical accuracy of the machined surface can be objectively determined by exact measurements, while cutting tool wear is in practice measured manually and on a subjective level [1]. Most frequently, cutting tool wear is measured with the use of toolmakers microscopes to help determine the range of wear (flank face). In addition to poor precision of this method, the problem is in three-dimensional nature of wear, which cannot be fully analyzed with 2D based measurements/measurement principles. It can be concluded that research on defining and analyzing tool wear in three dimensions is still of great significance.
A survey of the literature indicates that many different approaches have been applied for tool wear prediction [2-6], contrary direct measuring techniques make an assessment of tool wear by either evaluating the worn surface by optical methods (microscope), or measuring the tool material loss by radiometric techniques. Direct methods require to periodically interrupting the cutting process. Optical methods use optical equipment like the toolmaker's microscope, optical microscope, scanning electrical microscope, charged coupled devices (CCD cameras), white light interferometry etc. [7-11].
The main disadvantages of mentioned methods is the inability of measuring crater depth KT (spatial geometry) and/or needs to preform them off line of the machining process. In one of our previous works [12] spatial tool wear measurement system has been presented which is able to measure crater depth KT on-line on the machine tool. In next chapters, optimisation of this measurement system and test on a case study will be presented. 2. MEASURING SYSTEM The measuring system consists of a high-accuracy 2D profile laser displacement sensor Keyence LJ-G015 with proper controller Keyence LJ-G5001 [13] and
6
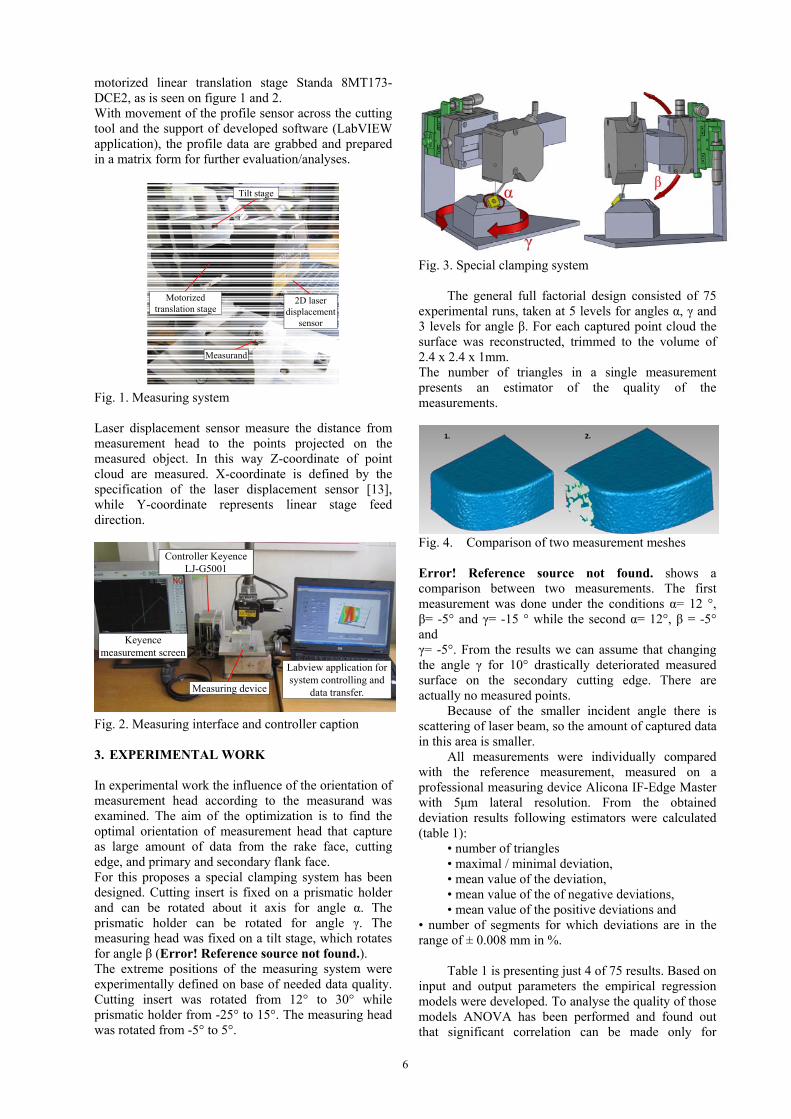
motorized linear translation stage Standa 8MT173-DCE2, as is seen on figure 1 and 2. With movement of the profile sensor across the cutting tool and the support of developed software (LabVIEW application), the profile data are grabbed and prepared in a matrix form for further evaluation/analyses.
Measurand
2D laser displacement
sensor
Motorizedtranslation stage
Tilt stage
Fig. 1. Measuring system Laser displacement sensor measure the distance from measurement head to the points projected on the measured object. In this way Z-coordinate of point cloud are measured. X-coordinate is defined by the specification of the laser displacement sensor [13], while Y-coordinate represents linear stage feed direction.
Keyence measurement screen
Labview application for system controlling and
data transfer.Measuring device
Controller KeyenceLJ-G5001
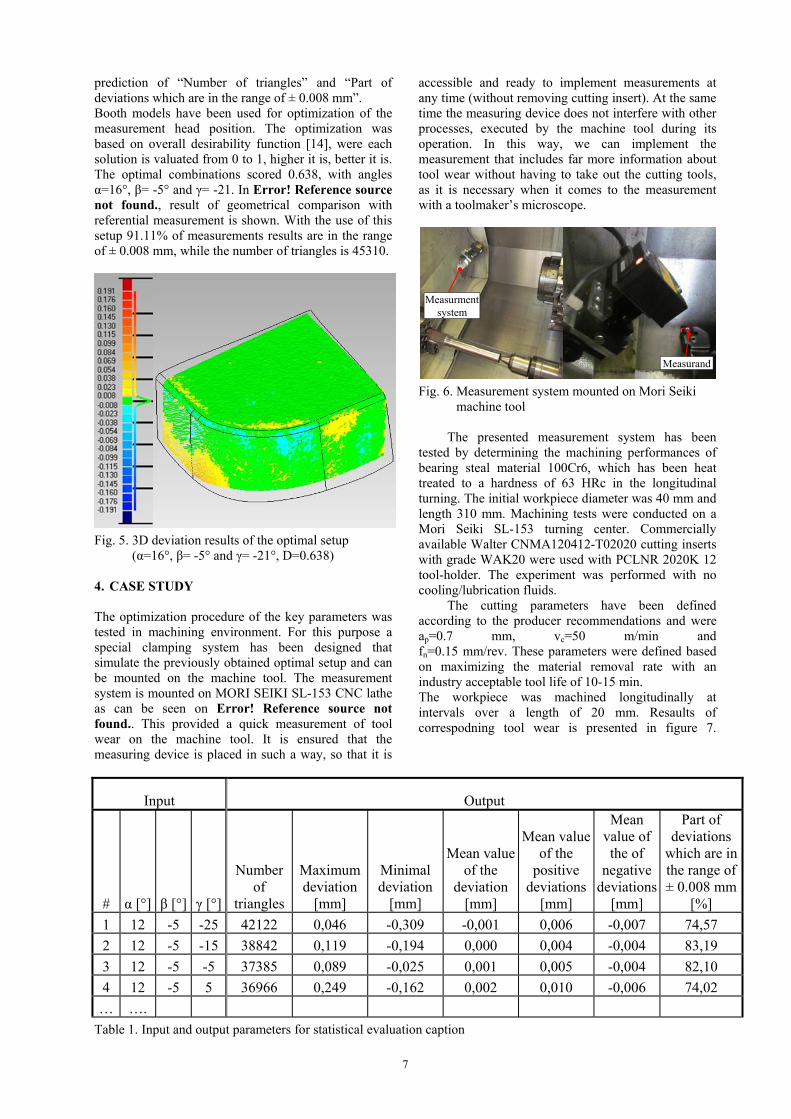
Fig. 2. Measuring interface and controller caption 3. EXPERIMENTAL WORK In experimental work the influence of the orientation of measurement head according to the measurand was examined. The aim of the optimization is to find the optimal orientation of measurement head that capture as large amount of data from the rake face, cutting edge, and primary and secondary flank face. For this proposes a special clamping system has been designed. Cutting insert is fixed on a prismatic holder and can be rotated about it axis for angle α. The prismatic holder can be rotated for angle γ. The measuring head was fixed on a tilt stage, which rotates for angle β (Error! Reference source not found.). The extreme positions of the measuring system were experimentally defined on base of needed data quality. Cutting insert was rotated from 12° to 30° while prismatic holder from -25° to 15°. The measuring head was rotated from -5° to 5°.
Fig. 3. Special clamping system
The general full factorial design consisted of 75 experimental runs, taken at 5 levels for angles α, γ and 3 levels for angle β. For each captured point cloud the surface was reconstructed, trimmed to the volume of 2.4 x 2.4 x 1mm. The number of triangles in a single measurement presents an estimator of the quality of the measurements.
Fig. 4. Comparison of two measurement meshes Error! Reference source not found. shows a comparison between two measurements. The first measurement was done under the conditions α= 12 °, β= -5° and γ= -15 ° while the second α= 12°, β = -5° and γ= -5°. From the results we can assume that changing the angle γ for 10° drastically deteriorated measured surface on the secondary cutting edge. There are actually no measured points.
Because of the smaller incident angle there is scattering of laser beam, so the amount of captured data in this area is smaller.
All measurements were individually compared with the reference measurement, measured on a professional measuring device Alicona IF-Edge Master with 5μm lateral resolution. From the obtained deviation results following estimators were calculated (table 1):
• number of triangles • maximal / minimal deviation, • mean value of the deviation, • mean value of the of negative deviations, • mean value of the positive deviations and
• number of segments for which deviations are in the range of ± 0.008 mm in %.
Table 1 is presenting just 4 of 75 results. Based on
input and output parameters the empirical regression models were developed. To analyse the quality of those models ANOVA has been performed and found out that significant correlation can be made only for
7
prediction of “Number of triangles” and “Part of deviations which are in the range of ± 0.008 mm”. Booth models have been used for optimization of the measurement head position. The optimization was based on overall desirability function [14], were each solution is valuated from 0 to 1, higher it is, better it is. The optimal combinations scored 0.638, with angles α=16°, β= -5° and γ= -21. In Error! Reference source not found., result of geometrical comparison with referential measurement is shown. With the use of this setup 91.11% of measurements results are in the range of ± 0.008 mm, while the number of triangles is 45310.
Fig. 5. 3D deviation results of the optimal setup
(α=16°, β= -5° and γ= -21°, D=0.638) 4. CASE STUDY The optimization procedure of the key parameters was tested in machining environment. For this purpose a special clamping system has been designed that simulate the previously obtained optimal setup and can be mounted on the machine tool. The measurement system is mounted on MORI SEIKI SL-153 CNC lathe as can be seen on Error! Reference source not found.. This provided a quick measurement of tool wear on the machine tool. It is ensured that the measuring device is placed in such a way, so that it is
accessible and ready to implement measurements at any time (without removing cutting insert). At the same time the measuring device does not interfere with other processes, executed by the machine tool during its operation. In this way, we can implement the measurement that includes far more information about tool wear without having to take out the cutting tools, as it is necessary when it comes to the measurement with a toolmaker’s microscope.
Measurand
Measurmentsystem
Fig. 6. Measurement system mounted on Mori Seiki
machine tool
The presented measurement system has been tested by determining the machining performances of bearing steal material 100Cr6, which has been heat treated to a hardness of 63 HRc in the longitudinal turning. The initial workpiece diameter was 40 mm and length 310 mm. Machining tests were conducted on a Mori Seiki SL-153 turning center. Commercially available Walter CNMA120412-T02020 cutting inserts with grade WAK20 were used with PCLNR 2020K 12 tool-holder. The experiment was performed with no cooling/lubrication fluids.
The cutting parameters have been defined according to the producer recommendations and were ap=0.7 mm, vc=50 m/min and fn=0.15 mm/rev. These parameters were defined based on maximizing the material removal rate with an industry acceptable tool life of 10-15 min. The workpiece was machined longitudinally at intervals over a length of 20 mm. Resaults of correspodning tool wear is presented in figure 7.
Table 1. Input and output parameters for statistical evaluation caption
8
1. 2. 3.
4. 5. 6.
8.7. 9.
10. 11. 12.
13. 14. 15.
Fig. 7. 3D deviation results
After each operation, the measurement procedure is carried out in the following order:
1. Machine tool moves the cutting insert to the
measuring area. 2. Machine tool operator starts the measurement
on PC measuring interface. 3. Laser displacement sensor captures the first
profile. 4. Motorized linear stage Standa 8MT173-DCE2
move the measurement head for predefined ΔY.
5. By repeating steps 3 and 4 gradually the system captured a large number of 2D profiles and stores theme in internal memory of Keyence LJ-G5001 controller.
6. When the last profile is measured, the system transfer data from the Keyence LJ-G5001 controller to PC and move the translation stage to zero position.
7. Machine tool moves the cutting insert to the working area.
The measurement itself is executed in approximately 20 seconds (at 3 mm length measurement and ΔY = 0.005mm).
A total of 15 repeated measurements were performed. Error! Reference source not found. is showing the progression of wear on flank and rake face, BUE and chipping of cutting edge. The increase of crater wear depth is evident with growing darker blue color. The maximum crater wear depth KT after the last experiment was in a range between 0.021 mm and 0.086 mm (figure 8). From the results it is also clearly visible the progression of chipping on cutting edge.
0.922
0.395
0.278
0.862
1.388
Fig. 8. Measurement of crater wear and chipping with
spatial tool wear measurement system Additionally, presented measurement of crater wear, obtained with spatial measurement system, was compared to the conventional measurement made with toolmakers microscope (figure 9).
Fig. 9. Measurement of crater wear made with
toolmakers microscope
From these measurements carried out with spatial tool wear measurement system (Error! Reference source not found.), it is evident that the length of crater wear is 0.922 mm, the crater wear width is 0.395 mm. With the use of toolmakers microscope the length of crater wear is 1.023 mm, the crater wear width is 0.391 mm. The results show a good correlation between the measurements carried out with spatial tool wear measurement system and toolmakers microscope. Some minor variations in measurements may be attributed to the subjective nature of measuring with toolmakers microscope. This error may also occur due to the precision of determining the lower limit of the wear formation, since the microscope image does not reveal the depth of wear.
Whit the use of spatial measurement system, the limit of the wear formation can be accurately determined. Depth of flank wear can be seen from the comparison of cutting inserts cross-sections (Error! Reference source not found.). From cross-sections becomes clear that the depth of flank wear (VB) where chipping occurs is in the area from 0 to 0.150 mm, and
9
the width of wear goes from approximately 0.3 mm to 0.1 mm.
Such critical tools wear negatively effect on roughness and tolerances of produced parts.
0.15 0.30 0.45 0.60 0.75 0.90
Chipping
Crater wear
Fig. 10. Chipping, crater wear and cross sections parallel to secondary flank face
5. CONCLUSION
In this work further development of spatial tool wear evaluation system is presented. The influence of incident angles of the scanning process was examined. Based on the analysis of measurements accuracy and the amount of captured data, the optimal setup of the measuring system was defined. Further a special clamping system was designed to mount the measurement device on the machine tool. To test the measurement system, machining experiment was done, where cutting tool was measured directly on the machine tool. The results had been compared with the result obtained with conventional measurement method, with the use of toolmakers microscope. From the results of the measurements we can say that the proposed spatial tool wear measurement system offers high resolution and accuracy 3D dimensional deviation measurement. It outperforms traditional 2D deviation methods both in accuracy, efficiency and reliability. Another huge benefit of this method is the fact that the measurement can be performed very quickly, without removing the cutting tool from the machine tool. Obtained measurement data are realistic 3D models of the cutting tool, where we can clearly see what the existing conditions of the cutting tool are.
Future work will be focused on developing computational procedures for the analysis of 3D deviation data provided. The objective is automatic diagnostics and early alert pointing to possible tool damage, excessive local tool wear, tool misalignment and other possible causes for tool breakage and stop of the process. 6. REFERENCES [1] W. Grzesik, Advanced Machining Processes of
Metallic Materials, Elsevier B.V., 2008. [2] J. Kopač: Odrezavanje; Teoretične osnove in
tool-wear mechanisms and their effects on chip-curl~chip-form in machining with grooved tools: an extended application of the equivalent toolface (ET) model, Wear, vol. 255, 2003, p. 1404-1413.
[4] G. Byrne, D. Dornfeld, I. Inasaki, G. Ketteler, W. Konig, R. Teti, Tool Condition Monitoring (TCM) - The Status of Research and Industrial Application, CIRP Annals - Manufacturing Technology, vol. 44, Issue 2, 1995, p. 541-567.
[5] E. Govekar, J. Gradišek, I. Grabec, Analysis of acoustic emission signals and monitoring of machining processes, Ultrasonics 38, vol. 1–8,
10
2000, p. 598–603. [6] E. Dimla, Sensor signals for tool-wear monitoring
in metal cutting operations--a review of methods, International Journal of Machine Tools and Manufacture, vol. 40, Issue 8, 2000, p. 1073-1098.
[7] S. Kurada, C. Bradley, A review of machine vision sensor for tool condition monitoring, Comput. Ind., vol 34, 1997, p. 52-72.
[8] J. Jurkovič, M. Korošec, J. Kopač, New approach in tool wear measuring technique using CCD vision system, International journal of machine tools & manufacture, vol. 45, 2005, p. 1023-1030.
[9] T. G. Dawson, Thomas R. Kurfess, Quantification of tool wear using white light interferometry and three-dimensional computational metrology, International Journal of Machine Tools and Manufacture, vol. 45, Issues 4-5, April 2005, p. 591-596.
[10] W.H. Wang, Y.S. Wong, G.S. Hong, 3D measurement of crater wear by phase shifting
method, Wear, vol. 261, Issue 2, 31 Julij 2006, p. 164-171.
[11] A. Weckenmann, K. Nalbantic, Precision Measurement of Cutting Tools with two Matched Optical 3D-Sensors, CIRP Annals - Manufacturing Technology, vol. 52, Issue 1, 2003, p. 443-446.
[12] L. Čerče, F. Pušavec, J. Kopač, Spatial cutting tool wear evaluation, Journal of Production Engineering, Vol. 15, no. 2, p. 10 - 14, 2012.
[14] Raymond H. Myers, Douglas C. Montgomery, Christine M. Anderson-Cook, Response Surface Methodology: Process and Product Optimization Using Designed Experiments, 3rd Edition, 2009.
Authors: L. Čerče, F. Pušavec, J. Dugar, and J. Kopač, University of Ljubljana, Slovenia E-mail: [email protected]