40
| Date post: | 24-Dec-2015 |
| Category: |
Documents |
| Upload: | myrtle-clarke |
| View: | 213 times |
| Download: | 0 times |

2
Citizens was created in 2002 in the merger of the state’s two insurers of last resort, the Florida Windstorm Underwriting Association (FWUA) and the Florida Residential Property and Casualty Joint Underwriting Association (FRPCJUA). The merger has allowed Citizens to become exempt from all federal taxes, resulting in millions of dollars in annual savings. Citizens is also designed to realize additional administrative and economic efficiencies over its predecessor organizations.
Quick Reference– FWUA: created in 1972 to provide wind-only coverage in coastal
regions.
– FRPCJUA: created in December, 1992 following Hurricane Andrew for Floridians unable to find homeowners insurance.
Creation of Citizens Property Insurance Creation of Citizens Property Insurance CorporationCorporation

3
Citizens Board of GovernorsCitizens Board of Governors
Member Appointed By
County Occupation
Bruce DouglasChairman
Governor St. Johns County Chief Executive Officer Douglas Capital Management
Gloria FletcherVice Chair
President of the Senate
Alachua County Gloria W. Fletcher, P.A.
Richard DeChene Governor Leon County Retired - CNA
Allan Katz Chief Financial Officer
Leon County AttorneyAkerman Senterfitt
Andrea “Andy” Bennett
Chief Financial Officer
Manatee County PresidentA.M. Bennett & Company
Carol Everhart President of the Senate
Pinellas County Vice PresidentBB&T
Jay Odom Speaker of the House
Okaloosa County PresidentCrystal Beach Development
Company of Northwest Florida
Earl Horton Speaker of the House
Pinellas County Executive Vice PresidentBouchard Insurance, Inc.

4
Staff/FacilitiesStaff/Facilities
Location # of Employees
Jacksonville Main Office - 6676 Corporate Center Parkway
377
Jacksonville - 8301 Cypress Plaza Drive 105
Tallahassee Main Office - Monroe Park Towers101 N. Monroe Street
59
Tallahassee – Citizens Centre2101 Maryland Circle
116
Tampa302 Knights Run Avenue
153
TOTALTotal employees does not include contract consultant or temporary employees
810 Employees

5
Each of the following three accounts are separate statutory accounts and have separate calculations of surplus, plan year deficit and assessment bases. Assets may not be commingled or used to fund losses in another account.
• Personal Lines Account (PLA) - Multi-peril policies– Former FRPCJUA : Homeowners, mobile homeowners, dwelling
fire, tenants, condominium unit owners and similar policies.
• Commercial Lines Account (CLA) - Multi-peril policies– Former FPCJUA: Condominium association, apartment building
and homeowners association policies.– Currently developing statutorily mandated commercial non-
residential program.• High-Risk Account (HRA) – Wind-only policies
– Former FWUA: Personal lines wind-only policies, commercial residential wind-only policies and commercial non-residential wind-only policies issued in coastal HRA eligible areas.
– In the process of introducing statutorily mandated multi-peril residential and commercial policies to be written in eligible areas.
Overview of AccountsOverview of Accounts

6
Citizens Coverage AreasCitizens Coverage Areas
• The Personal and Commercial Lines Accounts write personal and commercial residential coverage, respectively, in all 67 counties.
• The High-Risk Account (HRA) writes in 29 counties.

7
PLA Risk Counts–12/31/07

8
CLA Risk Counts– 12/31/07

9
PLA/CLA Policy and Coverage TrendPLA/CLA Policy and Coverage TrendPLA/CLA Policy Count (PIF) and Risk Exposure (TIV)
-
200,000
400,000
600,000
800,000
1,000,000
1,200,000
2004 2005 2006 2007
Po
licy
Co
un
t
$0
$50,000
$100,000
$150,000
$200,000
$250,000
$300,000
Exp
osu
re (
Co
vera
ges
A &
C O
nly
)(m
illi
on
s)
PIF
TIV (Cov A& C Only)
10
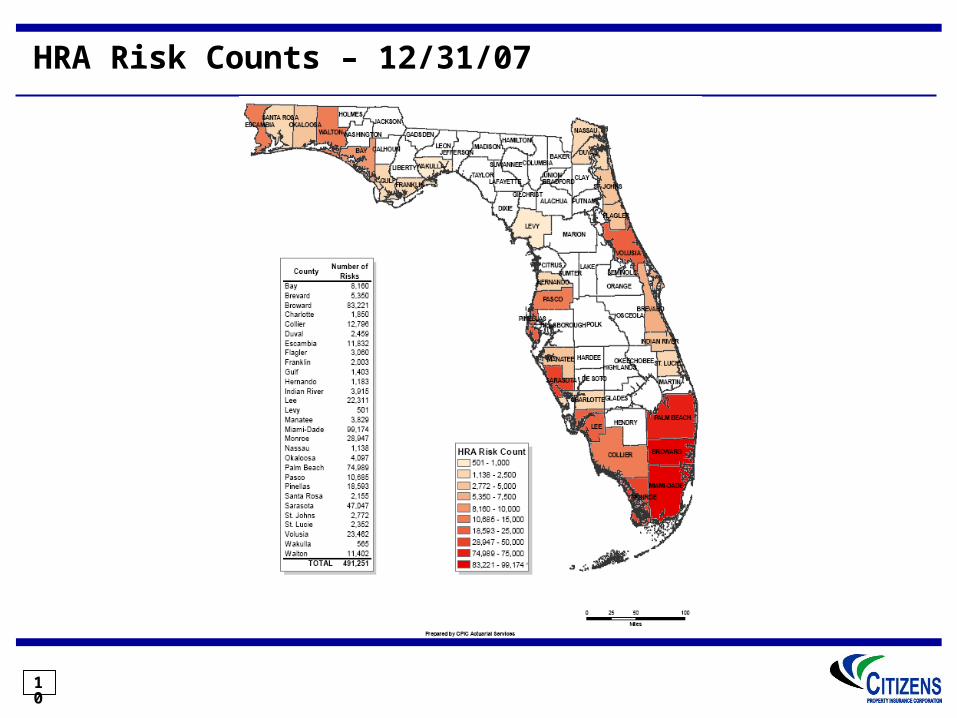
HRA Risk Counts – 12/31/07
11
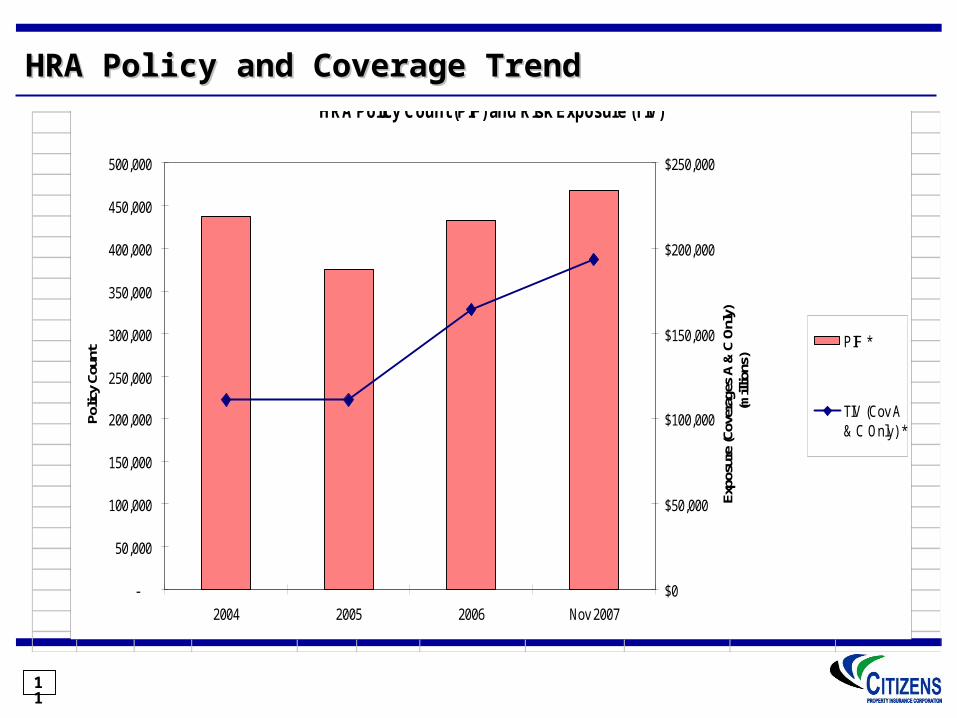
HRA Policy and Coverage TrendHRA Policy and Coverage TrendHRA Policy Count (PIF) and Risk Exposure (TIV)
-
50,000
100,000
150,000
200,000
250,000
300,000
350,000
400,000
450,000
500,000
2004 2005 2006 Nov 2007
Polic
y Co
unt
$0
$50,000
$100,000
$150,000
$200,000
$250,000
Expo
sure
(Cov
erag
es A
& C
Onl
y)(m
illio
ns)
PIF *
TIV (Cov A& C Only) *
12
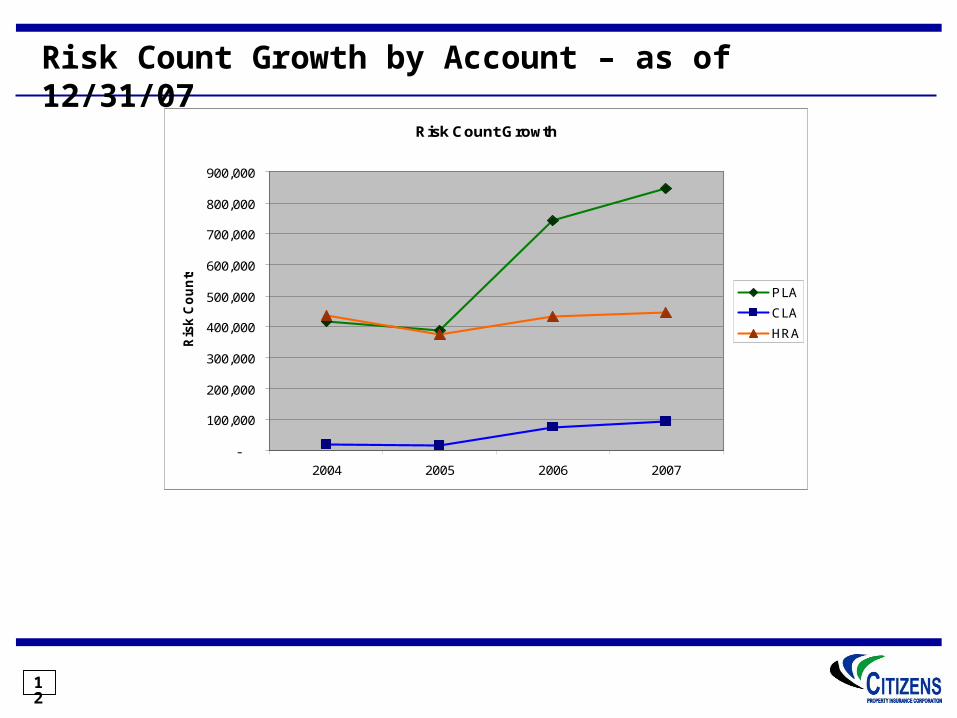
Risk Count Growth by Account – as of 12/31/07
Risk Count Growth
-
100,000
200,000
300,000
400,000
500,000
600,000
700,000
800,000
900,000
2004 2005 2006 2007
Ris
k C
ou
nts
PLA
CLA
HRA

13
Florida Residential Admitted Market Breakdown
The Florida residential property insurance admitted market is divided into 4 major parts based on policy counts: Citizens – 21%“Pups” of the major national writers – 28%Florida-only domestic companies – 34%Others, including USAA, etc. – 17%
All Other17%
Citizens21%
"Pup" Companies
28%
Florida Domestics
34%

14
PLA Policy Trends
PLA Policy Count Trend
-
100,000
200,000
300,000
400,000
500,000
600,000
700,000
800,000
900,000
1,000,000
2004 2005 2006 Nov 2007
Num
ber o
f Pol
icie
s
Tenant
MobileHomeowners
Condo UnitOwners
Dwelling
Homeowner
2004 2005 2006 Nov 2007
Homeowner 245,635 179,969 340,675 410,600
Dwelling 113,180 122,169 185,952 221,992
Condo Unit Owner 27,124 25,757 47,338 59,038
Mobile Homeowner 23,244 59,195 166,757 190,502
Tenant 6,305 2,117 2,870 4,420
PLA Policy Counts by Policy Form
HO40%
HO67%
MHO40%
DP13%
DP322%
MHO311%
MDP110%
HO347%
DP1
DP3
HO3
HO4
HO6
MDP1
MHO3
MHO4

15
CLA Policy Trends
CLA Risk Count Trend (Includes only non-special class risks)
-
10,000
20,000
30,000
40,000
50,000
60,000
70,000
80,000
90,000
100,000
2004 2005 2006 Nov 2007
Num
ber
of P
olic
ies Homeowners
Associations
CondoAssociations
ApartmentBuildings
CLA Risk Counts by Product
Homeow ners Associations
13%
Apartment Buildings17%
Condo Associations
70%
ApartmentBuildings
CondoAssociations
Homeow nersAssociations
2004 2005 2006 Nov 2007
Apartment Buildings 4,948 3,680 16,939 14,919
Condo Associations 12,137 9,651 50,339 63,462
Homeowners Associations 2,008 1,944 8,861 12,005
Note: The assumption of the Poe Group commercial residential policies during 2006 caused a large portion of the significant increase in risk counts.

16
Determination of Rates
• Starting in 2002, rates were based on the “top twenty” insurers
• Citizens rates were chosen to be equal to the highest rated company in a particular territory
• Citizens’ rates were set to be uncompetitive
• Only eligible for insurance with Citizens if you could not get insurance elsewhere

17
Rates
• In 2006, the “highest rated” mandate was relaxed
• Citizens’ rates were ordered to be based on actuarial principles
• Rate indications showed Citizens’ rates to be inadequate
• Rate increases went into effective 1/1/2007
• A policyholder is now eligible for coverage by Citizens only if any offers from admitted insurers are more than 15% higher than Citizens’ rates for comparable coverage

18
RatesRates
• The rate increases effective January 1, 2007 were rescinded by legislative action. Any amounts collected were ordered to be refunded, and rates were frozen at 12/31/06 levels for all of 2007 and 2008
• Thereafter, Citizens will submit recommended rates to OIR and OIR will set rates within 45 days; no challenge is allowed.
• The senate is considering a bill that would extent the rate freeze until 1/1/2010 with severe restrictions on rate increases in years 2011, 2012, 2013

19
Depopulation Programs and Projections
Only non-bonus takeout contracts for PLA and HRA are currently available. Assuming carrier must remove during the 18-month contract period a minimum of
either:• 10,000 policies with wind coverage; or• Policies with wind coverage with TIV (coverages A, B, C, and D) of $2 billion.
Each assumption during a contract period must remove a minimum of either:• 2,500 policies; or• TIV of $500 million.
Policies must be retained by the assuming carrier for a minimum of three (3) years.
CLA takeout program being developed. Projected implementation to occur in 2008.
Projected number of policies to be assumed during 2008:• PLA: 320,000• CLA: 5,500

20
Historical Depopulation – Policy Counts
Policies Removed During the Year (as Portion of Total Policies)
-
200,000
400,000
600,000
800,000
1,000,000
1,200,000
1,400,000
1,600,000
1,800,000
2003 2004 2005 2006 2007
Po
licy
Co
un
t
PoliciesRemoved
RemainingPolicies
Policy Removal12/31/200
312/31/200
412/31/200
512/31/200
612/31/200
7
PLA 28,219 145,959 218,128 26,225 247,923
HRA - 12,457 75,556 41,628 -
Total Policies Removed 28,219 158,416 293,684 67,853 247,923
Total Policies Remaining 820,255 873,996 810,017 1,298,922
1,344,240
21
Capital Build-UP Incentive Program
• Created in 2006 for the purpose of increasing the availability of residential property insurance
• The Florida legislature appropriated $250 Million for use in providing Surplus Notes to qualified companies
• Estimated that 1.7 million policies were written by other companies as a result of this program
• This program has also lead to 165K policies being removed from Citizens
• Estimated that 480K policies have been kept of Citizens due to this program

22
Capital Build-UP Incentive Program – Goals
• Further spread of hurricane risk to new capital in Florida
• Continued depopulation of Citizens
• Mitigation of policy growth in Citizens
• Reduction in exposure and assessment potential for Florida
• Currently considering making more capital available for 2008

23
Wind Mitigation Credits
• In 2001, there were changes to the Florida Building Codes
• ARA conducted a study to quantify the impact of the new building codes
• Studied characteristics such as roof covering, roof shape, roof-to wall connections, openings, building height, roof framing, etc
• Developed hurricane severity relativities
• OIR has mandated wind premium discounts based on results of this study
24
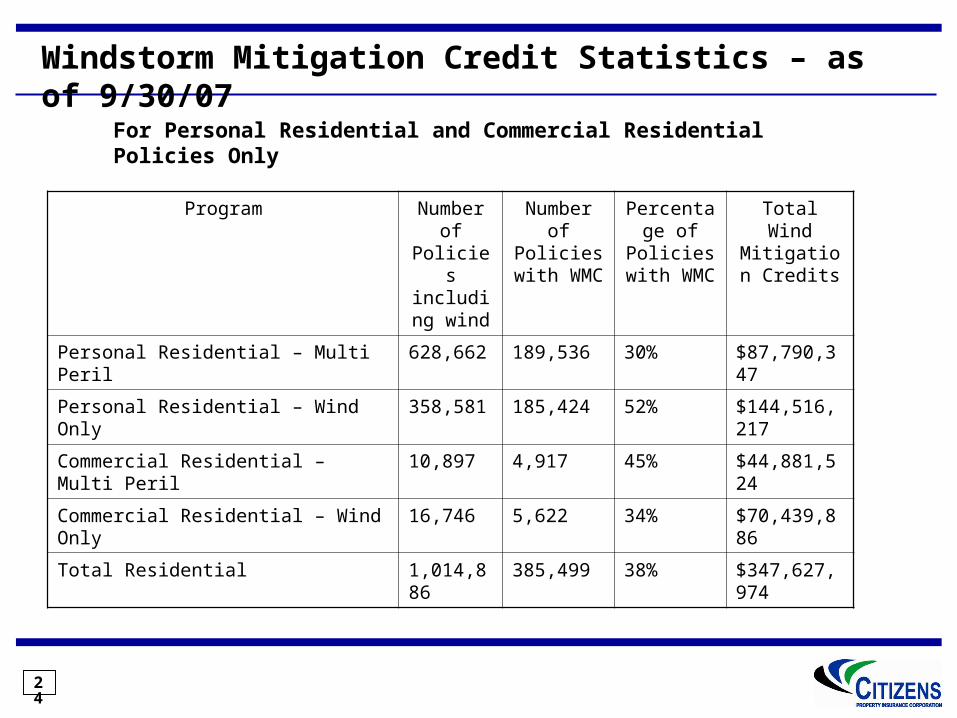
Windstorm Mitigation Credit Statistics – as of 9/30/07
Program Number of
Policies including wind
Number of
Policies with WMC
Percentage of
Policies with WMC
Total Wind Mitigation
Credits
Personal Residential – Multi Peril 628,662 189,536 30% $87,790,347
Personal Residential – Wind Only 358,581 185,424 52% $144,516,217
Commercial Residential – Multi Peril
10,897 4,917 45% $44,881,524
Commercial Residential – Wind Only
16,746 5,622 34% $70,439,886
Total Residential 1,014,886
385,499 38% $347,627,974
For Personal Residential and Commercial Residential Policies Only

25
Reduction in Coverage
• Offer higher hurricane deductibles
• Exclude screen enclosures – offer buyback
• Exclude sinkhole coverage – offer buyback
• Limit HO coverage A amount to $1 million
• Offer lower coverage B coverage
• Over $750K and in a WBDR, must have storm shutters
• Within 2,500 of coast, must be built to Code Plus (built after 1/1/2009)

26
Florida Hurricane Cat Fund
• Purpose : Improve the availability and affordability of property insurance in Florida by providing inexpensive reinsurance to insurers
• Created in 1993 after Andrew
• Under the control and direction of the State Board of Administration of Florida (SBA - Board of Trustees: Governor, CFO, Attorney General )
• Nine member committee – 3 Consumer reps, 3 industry business professionals (agent, reinsurer, primary insurer), 3 technical professionals (meteorologist, engineer, & actuary)
• Participation is mandatory
• FHCF provides more then 50% of all reinsurance coverage in the state

27
Florida Hurricane Cat Fund
Insurers pay the FHCF a premium based on their proportionate residential risk in the state – $1.4B of premium in 2007
Insurers have individual retentions – Industrial-wide retention of $6.1B in 2007
After the retention is filled, FHCF reimburses insurers for 90% of their covered residential losses; insurers pay 10% co-payment (There are 25% and 45% co-payment options available)
FHCF’s total liability is defined and limited statutorily – maximum 2007 liability was $27.85B

28
FHCF - Funding
The FHCF receives annual reimbursement premiums from participating insurers; these premiums are actuarially set to be equal to the average annual expected loss for the FHCF
If losses occur, and accumulated reimbursement premiums are insufficient to pay claims, the FHCF can issue tax-exempt bonds secured by emergency assessments for up to 30 years on a broad range of P&C insurance premiums in the state (This liability for losses is limited to the lesser of the statutory maximum or what the FHCF can raise in the capital markets)
The “post-event” bonds would be repaid by an ongoing emergency assessment of up to 6% per year on direct premiums for most P&C lines of business in Florida (current assessment base is $37.4B)
The FHCF has one tax-exempt bond issue outstanding in the amount of $1.35B with a final maturity of 2012, secured by a 1% emergency assessment

29
FHCF - Liquidity
$2.8 B of proceeds from 2006 pre-event extendible note transaction
$1.0 B from 2006 reimbursement premiums
$1.4 B collected from 2007 reimbursement premiums
Total of $5.2 B on hand
30
Funding the FHCF
31
Citizens’ Financial Highlights
• 2007 net income of $1.46 b on net earned premium of $3.16b
• 2008 budgeted income of $1.54 b
• 2008 year end surplus of $4.18 b
• Cash and investments of over $10 b
• Cash paying ability before emergency assessments of over $22 b– This includes premium revenue, surplus, pre-event
financing, and FHCF reimbursements

32
Assessment Base is Broad and DiverseAssessment Base is Broad and Diverse
Total Premium Subject to Assessment
Direct Written $33.3B
Surplus Lines $4.1B
Total $37.4B
Auto $14.86 B
43%
All O thers$8.48 B
24%
Commercial $3.80 B
11%
Homeowners $7.70 B
22%

33
Assessment Base is Broad and DiverseAssessment Base is Broad and Diverse
Fire Private Passenger Auto No FaultAllied Lines Other Private Passenger Auto LiabilityMultiple Peril Crop Commercial Auto No FaultFarmowners Multiple Peril Other Commercial Auto LiabilityHomeowners Multiple Peril Private Passenger Auto Physical DamageCommercial Multiple Peril (non liability) Commercial Auto Physical DamageCommercial Multiple Peril (liability portion) Aircraft (all perils)Mortgage Guaranty FidelityOcean Marine Surety Inland Marine Burglary and TheftFinancial Guaranty Boiler and MachineryEarthquake CreditOther Liability Aggregate Write-InsProducts Liability Community Association Self - Insurance
The following lines are subject to assessment in 2008:

34
Citizens’ Assessment TypesCitizens’ Assessment Types11
Non-homestead assessment – levied on non-homestead Citizens’ policyholders, up to a total of 10% of premium for each account with a deficit (up to 30% total); billed immediately
Citizens policyholder surcharge – levied on all Citizens’ policyholders up to an additional 10% of premium of premium for each account with a deficit (up to 30% total); billed on renewal/new business
Additional Citizens policyholder assessment – levied on all Citizens’ policyholders up to 10% of premium for each account with a deficit (up to 30% total); billed on renewal/new business
Regular assessment – levied on all non-Citizens property and casualty policyholders up to 10% of premium for each account with a deficit (up to 30%); billed on renewal/new business
Emergency assessments – levied on all P&C policyholders up to 10% of premium (per account); this assessment is collected for as many years as necessary to cover deficits, but not exceed 10% per account in a calendar year (per account).

35
PLA/CLA Projected Claims Paying Resources (2008 PLA/CLA Projected Claims Paying Resources (2008 Hurricane Season) Hurricane Season)
100 Year PML - $8.59 Billion
(Not to scale)(Not to scale)
FHCF Recovery - Regular
(90% of $2.826 Billion xs $969 Million)
$2.543 BillionFHCF Attachment Point - $969
Million
Surplus - $969 Million$0.969 Billion
$5.814 Billion
$14.656 Billion
10% of
$2.826 B or $283
M from Surpl
us
Regular Assessments - $5.800 Billion
1 in 5-year PML
1 in 27-year PML
Remaining Surplus - $1.302 Billion
FHCF Recovery - TICL
(90% of $2.019 Billion= $1.817 Billion)
10% of
$2.019 B or $202
M from Surpl
us
100 Year PML - $9.278 Billion
As of 12/31/07
1 in 220-year PML
1 in 49-year PML
$7.116 Billion
1 in 68-year PML
Liquidity Target $3.794 Billion
Citizens’ Policyholder Surcharge - $800 Million
Additional Assessment - $800M
Non Homestead Assessments $140 million
36
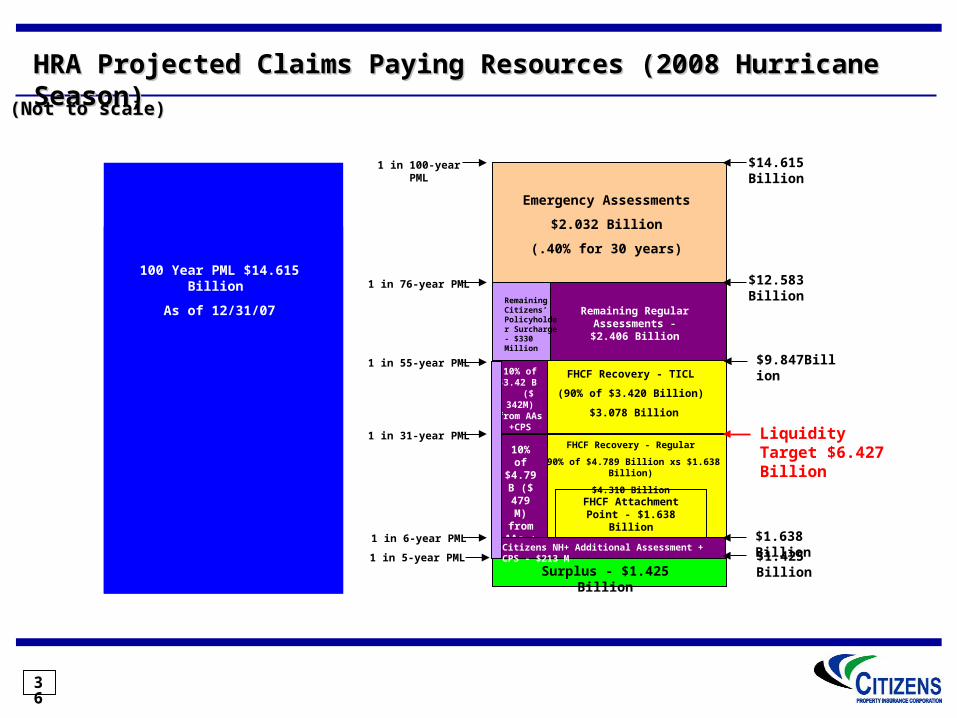
HRA Projected Claims Paying Resources (2008 Hurricane HRA Projected Claims Paying Resources (2008 Hurricane Season) Season)
Surplus - $1.425 Billion
Remaining Regular Assessments - $2.406 Billion
FHCF Recovery - Regular
(90% of $4.789 Billion xs $1.638 Billion)
$4.310 BillionFHCF Attachment
Point - $1.638 Billion
$9.847Billion
$1.425 Billion
100 Year PML $14.615 Billion
As of 12/31/07
10% of
$4.79 B ($ 479 M)
from AAs + CPSCitizens NH+ Additional Assessment +
CPS - $213 M
$14.615 Billion
1 in 6-year PML
1 in 31-year PML
$1.638 Billion
1 in 100-year PML
(Not to scale)(Not to scale)
FHCF Recovery - TICL
(90% of $3.420 Billion)
$3.078 Billion
10% of $3.42 B
($ 342M) from AAs
+CPS
$12.583 Billion
1 in 55-year PML
1 in 76-year PMLRemaining Citizens’ Policyholder Surcharge - $330 Million
1 in 5-year PML
Emergency Assessments
$2.032 Billion
(.40% for 30 years)
Liquidity Target $6.427 Billion

37
Claim Stats for 2004-2005 Hurricanes as of 12/31/07
Claim Payments by Hurricane 2004-2005
4%
0%
42%20%
10%
2% 7%
15%
Charley Frances Ivan Jeanne Dennis
Katrina Rita Wilma
Hurricane Total Claims Payments% of Total Payments
Charley 530,837,268 10%
Frances 1,075,967,150 20%
Ivan 837,407,191 15%
Jeanne 431,944,992 7%
Dennis 85,128,853 2%
Katrina 191,229,225 4%
Rita 7,329,607 0%
Wilma 2,313,717,737 43%
TOTAL 5,381,250,727 100%
Data includes PLA, HRA, and CLA claims.

38
Insured Losses in Florida 2004-2005……..Who Paid
FL quasi-governmental entities paid almost 40% of 2004-2005 lossesFL quasi-governmental entities paid almost 40% of 2004-2005 losses(even without considering FIGA payments for Poe insolvency)(even without considering FIGA payments for Poe insolvency)
Storm
Florida Insured
Losses
Citizens'
Losses (Net of
FHCF) % FHCF Losses %
Net
Governmental
Losses %
Charley 10,158,405$ 536,360$ 5% 2,271,452$ 22% 2,807,812$ 28%
Frances 7,952,636 1,111,990 14% 1,516,459 19% 2,628,449 33%
Ivan 3,314,848 947,376 29% 405,162 12% 1,352,538 41%
Jeanne 3,634,646 444,297 12% 309,954 9% 754,251 21%
2004 TOTAL 25,060,535$ 3,040,023$ 12% 4,503,027$ 18% 7,543,050$ 30%
Dennis 297,399$ 93,563$ 31% 373$ 0% 93,936$ 32%
Katrina 853,000 216,647 25% 241 0% 216,888 25%
Rita 25,243 9,304 37% 0 0% 9,304 37%
Wilma 9,659,383 1,675,057 17% 4,767,516 49% 6,442,573 67%
2005 Total 10,835,025$ 1,994,572$ 18% 4,768,130$ 44% 6,762,702$ 62%
2004 - 2005 Total 35,895,560$ 5,034,595$ 14% 9,271,157$ 26% 14,305,752$ 40%
($ in 000's)

39
Reported Claims and Complaints
20,821
51,634
16,805
33,233
156,274
24,599
8966,196
9.60%
7.70%
10.06%
5.09%4.01%
0.67%
0.02%0.11%0
20,000
40,000
60,000
80,000
100,000
120,000
140,000
160,000
180,000
Charley Frances Ivan Jeanne Dennis Katrina Rita Wilma
To
tal
Cla
ims
Rep
ort
ed
0%
2%
4%
6%
8%
10%
12%
Per
cen
tag
e o
f C
om
pla
ints
Total Claims Reported Percentage of Complaints

40
FIGA(Florida InsuranceGuaranty Assoc.)
$10 billion residential premium (estimated), representing $2
trillion of insured property value
= Quasi-governmental entityPrivate Reinsurers
(approx. 125)
Private Insurers(5.2 million policies;
205 insurers)
FHCF($28 B in coverage;
approx. 50% mkt share)
Citizens(1.3 million policies)
Residential Policyholders(6.5 million risks)
Florida Residential Property Insurance MarketFlorida Residential Property Insurance Market


