200


Annual Report 2017
2 Corporate Information
3 Directors’ Profile
5 Chairman’s Statement
26 Management Discussion and Analysis
36 Report of the Directors
57 Corporate Governance Report
66 Financial Statements
66 Consolidated Statement of Profit or Loss
67 Consolidated Statement of Comprehensive Income
68 Consolidated Statement of Financial Position
70 Consolidated Statement of Changes in Equity
72 Consolidated Statement of Cash Flows
75 Notes to Financial Statements
182 Independent Auditor’s Report
187 Schedule of Principal Properties
195 Published Five Year Financial Summary
2
Corporate Information
Annual Report 2017
DIRECTORS
Executive DirectorsLo Yuk Sui (Chairman and Chief Executive Officer) Jimmy Lo Chun To (Vice Chairman)Lo Po Man (Vice Chairman)Kenneth Ng Kwai Kai (Chief Operating Officer)Donald Fan Tung Kelvin Leung So Po
Independent Non-Executive DirectorsAnthony Chuang Winnie Ng, JPWong Chi Keung
AUDIT COMMITTEE
Winnie Ng, JP (Chairman) Anthony ChuangWong Chi Keung
REMUNERATION COMMITTEE
Wong Chi Keung (Chairman) Lo Yuk SuiAnthony Chuang Winnie Ng, JP
NOMINATION COMMITTEE
Lo Yuk Sui (Chairman) Anthony ChuangWinnie Ng, JPWong Chi Keung
SECRETARY
Eliza Lam Sau Fun
AUDITOR
Ernst & Young
PRINCIPAL BANKERS
The Hongkong and Shanghai Banking Corporation Limited Hang Seng Bank LimitedThe Bank of East Asia, LimitedStandard Chartered Bank (Hong Kong) Limited
PRINCIPAL REGISTRAR
MUFG Fund Services (Bermuda) Limited The Belvedere Building, 69 Pitts Bay Road Pembroke HM08, Bermuda
BRANCH REGISTRAR IN HONG KONG
Tricor Tengis LimitedLevel 22, Hopewell Centre 183 Queen’s Road East Hong Kong
REGISTERED OFFICE
The Belvedere Building, 69 Pitts Bay Road Pembroke HM08, Bermuda
HEAD OFFICE AND PRINCIPAL PLACE OF BUSINESS
11th Floor, 68 Yee Wo Street Causeway Bay, Hong Kong
Tel: 2894 7888Fax: 2890 1697Website: www.centurycity.com.hk

3
Directors’ Profile
Annual Report 2017
Mr. Lo Yuk Sui, aged 73; Chairman and Chief Executive Officer — Chairman and Managing Director since 1989 when the Company was established in Bermuda as the ultimate holding company of the Group and designated as the Chief Executive Officer in 2007. Mr. Lo has been the Chairman and the Managing Director of the predecessor listed company of the Group since 1985 and 1986, respectively. He is also an executive director, the chairman and the chief executive officer of Paliburg Holdings Limited (“PHL”), Regal Hotels International Holdings Limited (“RHIHL”) and Cosmopolitan International Holdings Limited (“Cosmopolitan”), all listed subsidiaries of the Company, and a non-executive director and the chairman of Regal Portfolio Management Limited (“RPML”), the manager of Regal Real Estate Investment Trust (the listed subsidiary of RHIHL). Mr. Lo is a qualified architect. In his capacity as the Chief Executive Officer, Mr. Lo oversees the overall policy and decision making of the Group. Mr. Lo is the father of Mr. Jimmy Lo Chun To and Miss Lo Po Man.
Mr. Jimmy Lo Chun To, aged 44; Vice Chairman and Executive Director — Appointed to the Board in 1999. Mr. Jimmy Lo has been a Vice Chairman of the Company since 2013. He is also an executive director, the vice chairman and the managing director of PHL, an executive director of RHIHL, an executive director, a vice chairman and the managing director of Cosmopolitan, and a non-executive director of RPML. Mr. Jimmy Lo graduated from Cornell University, New York, the United States, with a Degree in Architecture. He joined the Century City Group in 1998. Mr. Jimmy Lo is primarily involved in overseeing the Group’s property projects in the People’s Republic of China (the “PRC”) and, in addition, undertakes responsibilities in the business development of the Century City Group. He is the son of Mr. Lo Yuk Sui and the brother of Miss Lo Po Man.
Miss Lo Po Man, aged 38; Vice Chairman and Executive Director — Appointed to the Board in 2007. Miss Lo has been a Vice Chairman of the Company since 2013. She is also an executive director of PHL, an executive director, a vice chairman and the managing director of RHIHL, an executive director and a vice chairman of Cosmopolitan, and a non-executive director and the vice chairman of RPML. Miss Lo graduated from Duke University, North Carolina, the United States, with a Bachelor’s Degree in Psychology. She joined the RHIHL Group in 2000 and is an experienced executive in sales and marketing and corporate management. Miss Lo oversees the sales and marketing functions of the RHIHL Group and also undertakes responsibilities in the business development of the Century City Group. She is the daughter of Mr. Lo Yuk Sui and the sister of Mr. Jimmy Lo Chun To.
Mr. Kenneth Ng Kwai Kai, aged 63; Executive Director and Chief Operating Officer — Appointed to the Board in 1989 and designated as the Chief Operating Officer in 2007. Mr. Ng is also an executive director of PHL, RHIHL and Cosmopolitan, and a non-executive director of RPML. He joined the Group in 1985 and is in charge of the corporate finance, company secretarial and administrative functions of the Century City Group. Mr. Ng is a Chartered Secretary.
Mr. Anthony Chuang, aged 73; Independent Non-Executive Director — Invited to the Board as Independent Non- Executive Director in 1993. Mr. Chuang graduated from University of Notre Dame, South Bend, Indiana, the United States and has extensive experience in the commercial field.

4
Directors’ Profile (Cont’d)
Annual Report 2017
Mr. Donald Fan Tung, aged 61; Executive Director — Appointed to the Board in 2007. Mr. Fan is a qualified architect and has been with the Group since 1987. He is also an executive director and the chief operating officer of PHL, an executive director of RHIHL, and a non-executive director of RPML. Mr. Fan is in charge of the property development, architectural design and project management functions as well as overseeing the building construction business of the Group.
Mr. Kelvin Leung So Po, aged 45; Executive Director — Appointed to the Board in 2010. Mr. Leung has been with the Group since 1997. He is also an executive director and the chief financial officer of Cosmopolitan. Mr. Leung is involved in the corporate finance function as well as in the China business division of the Century City Group. He holds a Bachelor’s Degree in Business Administration and a Master of Laws Degree in Chinese Business Law both from The Chinese University of Hong Kong. Mr. Leung is a member of the American Institute of Certified Public Accountants. He has over 22 years of experience in accounting and corporate finance field.
Ms. Winnie Ng, JP, aged 54; Independent Non-Executive Director — Invited to the Board as Independent Non-Executive Director on 1st January, 2018. She is also an independent non-executive director of PHL and RHIHL since 1st January, 2018. Ms. Ng holds an MBA (Master of Business Administration) from University of Chicago and an MPA (Master of Public Administration) from Harvard University. Ms. Ng has received numerous awards and recognition. In 2017, she was appointed a Justice of the Peace. In 2016, she won Nobel Laureate Series: Asian Chinese Leadership Award and China Top Ten Outstanding Women Entrepreneurs. In previous years, she received recognitions as a Woman of Excellence in Hong Kong, one of 60 Meritorious Chinese Entrepreneurs with Achievement and National Contribution, Yazhou Zhoukan Young Chinese Entrepreneur Award, one of China’s 100 Outstanding Women Entrepreneurs and was Mason Fellow of Harvard University. Active in public service, Ms. Ng is Chairman of Hospital Governing Committee of Prince of Wales Hospital, Member of Town Planning Board, Advisor of Our Hong Kong Foundation, Council Member of The Better Hong Kong Foundation, and Court Member of The Hong Kong Polytechnic University. She was Member of Hong Kong Tourism Board and its Marketing & Business Development Committee Chairman, and Member of Hospital Authority and its Supporting Services Development Committee Chairman from 2010 to 2016. She was Member of Employees Retraining Board and its Course Vetting Committee Convenor, and Member of Vocational Training Council from 2011 to 2017. Ms. Ng is also a non-executive director of Transport International Holdings Limited, and she was the founder, deputy chairman and a non-executive director of RoadShow Holdings Limited. Both companies are listed on the Stock Exchange.
Mr. Wong Chi Keung, aged 63; Independent Non-Executive Director — Invited to the Board as Independent Non- Executive Director in 2004. Mr. Wong is also an independent non-executive director of PHL and RHIHL. He holds a Master’s Degree in Business Administration from the University of Adelaide in Australia. He is a fellow member of Hong Kong Institute of Certified Public Accountants, The Association of Chartered Certified Accountants and CPA Australia and an associate member of The Institute of Chartered Secretaries and Administrators and The Chartered Institute of Management Accountants. Mr. Wong is a responsible officer for asset management and advising on securities under the Securities and Futures Ordinance of Hong Kong. Mr. Wong was an executive director, the deputy general manager, group financial controller and company secretary of Guangzhou Investment Company Limited (now known as Yuexiu Property Company Limited), a company listed on the Stock Exchange, for over ten years. He is also an independent non-executive director and a member of the audit committee of Asia Orient Holdings Limited, Asia Standard International Group Limited, China Shanshui Cement Group Limited, China Ting Group Holdings Limited, Fortunet e-Commerce Group Limited, Golden Eagle Retail Group Limited, Nickel Resources International Holdings Company Limited, TPV Technology Limited, Yuan Heng Gas Holdings Limited and Zhuguang Holdings Group Company Limited, all of which are companies listed on the Stock Exchange. Mr. Wong has over 35 years of experience in finance, accounting and management.

5
Chairman’s Statement
Annual Report 2017
Dear shareholders,
I am pleased to present the Annual Report of the Company for the year ended 31st December, 2017.
FINANCIAL RESULTS
For the year ended 31st December, 2017, the Group achieved a consolidated profit attributable to shareholders of HK$381.2 million, which represents an increase of about 1.8 times over the profit of HK$136.2 million attained in 2016. The substantial increase in the profit achieved was mainly attributable to the fair value gains on the investment properties and financial assets held by the Group.

6
Chairman’s Statement (Cont’d)
Annual Report 2017
The Group’s operating profit before depreciation and amortisation, finance costs and tax for the year amounted to HK$1,823.4 million, as compared to HK$1,192.8 million for the preceding year. As previously explained, as all the Group’s operating hotel properties in Hong Kong are owned and operated within the Group, they are classified in the Group’s consolidated financial statements as property, plant and equipment and are subject to depreciation to conform to applicable accounting standards. Accordingly, depreciation charges in an aggregate amount of HK$525.6 million have been provided on such hotel properties in the financial results under review which, although having no impact on cash flow, have nevertheless affected the overall reported profit.
Supplementary information showing the adjusted net asset value of the Company of HK$3.53 per share as at 31st December, 2017, after adjusting for the independent market valuations of the hotel properties in Hong Kong owned through Regal group on the basis therein presented, is contained in the paragraph headed “Asset Value” in the section headed “Management Discussion and Analysis” in this Annual Report.
BUSINESS OVERVIEW
The Century City Group comprises a total of five listed entities in Hong Kong, with the Company acting as the ultimate holding company of the Group. As at 31st December, 2017, the Company held approximately 62.3% shareholding in Paliburg Holdings Limited and the core hotel and property businesses of the Group are conducted through different subsidiaries of Paliburg.
Regal Hotels International Holdings Limited, a listed subsidiary approximately 69.3% held by Paliburg as at the year end date, primarily undertakes the Group’s hotel businesses. Apart from engaging in hotel operating and management businesses, Regal has a significant portfolio of diversified business interests and held approximately 74.6% of the outstanding units of Regal Real Estate Investment Trust, a listed subsidiary of Regal which presently owns nine Regal and iclub Hotels operating in Hong Kong.
The Group’s property development businesses are principally conducted through P&R Holdings Limited, which is a joint venture 50:50 owned by each of Paliburg and Regal. As Regal is a subsidiary of the Group, P&R Holdings is effectively also a subsidiary of the Company. As at 31st December, 2017, P&R Holdings also held an effective controlling shareholding interest of approximately 75.4% in Cosmopolitan International Holdings Limited (comprising interests in its ordinary shares and convertible preference shares) and, in addition, interests in the convertible bonds of Cosmopolitan. Cosmopolitan is consequently also a listed member of the Group, which is principally undertaking property development and investment in the People’s Republic of China and other investment businesses.
As mentioned in the Interim Report 2017, the Group entered into an agreement in August 2017 for the disposal of the Boeing 737-800 passenger aircraft, which was approximately 85% owned by the Group’s wholly owned subsidiaries, upon its lease expiry. The disposal has been duly completed in November 2017 and yielded satisfactory profit. Currently, the Group continues to own through its wholly owned subsidiaries a Boeing B737-300F freighter aircraft on finance lease to a logistics operator, which is generating steady income. In addition, the Regal group also owns at present a fleet of 13 aircraft.
The Hong Kong Government has recently promulgated a new tax regime for the aircraft leasing business with an aim to promoting Hong Kong as a base for the aircraft leasing and financing business. Responding to the Government’s initiatives, the Group is carefully studying the operative details of the new regime in the context of reviewing its overall holding structure for its aircraft leasing business.

7
Chairman’s Statement (Cont’d)
Annual Report 2017
The Group effectively owns an aggregate of 48% interest (comprising 36% held by the Regal group and 12% held through wholly owned subsidiaries of the Company) in Century Innovative Technology group (CIT), an edutainment company principally engaged in the production of education and entertainment multimedia content, products and services.
To date, CIT has developed over 2,000 minutes of award-winning 3D animated content based on its flagship brand, Bodhi and Friends . The first and second seasons debuted on China’s two leading children television channels and reached No.1 in viewership ratings. The third and fourth seasons were released in 2017, with season four written by an Emmy-award winning writer. To support the global expansion plans of Bodhi and Friends , CIT plans to work with local and international partners to develop the fifth season for international markets.
Bodhi and Friends was the first Chinese IP licensed to Mattel, one of the world’s largest toy companies. The first collection of Bodhi and Friends toys was launched last year across more than 700 points of sales in China. Bodhi and Friends was also the first Chinese animated IP licensed to Scholastic, one of the world’s largest children publishers. The Bodhi and Friends branded books published by Scholastic were distributed across Asia.
CIT is taking different initiatives to further enhance the brand’s awareness, including the diversification of its portfolio of licensed products and the expansion of the content licensing and distribution on online platforms.
Management is confident that the launch of unique high-quality educational content and products through our leading partnerships will be a major step for Bodhi and Friends to become China’s first international preschool brand.
The operational performance and business review of the different listed members of the Group for the year under review are highlighted below.
PALIBURG HOLDINGS LIMITED
For the year ended 31st December, 2017, Paliburg achieved a consolidated profit attributable to shareholders of HK$528.5 million, which represents an increase of about 1.4 times over the profit of HK$217.0 million attained in 2016. The substantial increase in the profit achieved was mainly attributable to the fair value gains on the investment properties and financial assets held by the Paliburg group.
Operating profit before depreciation and amortisation, finance costs and tax for the year amounted to HK$1,746.1 million, as compared to HK$1,174.8 million in 2016. Depreciation charges in the amount of HK$525.6 million have been provided by Paliburg in its financial statement for the year on the hotel properties owned in Hong Kong which, although having no impact on the cash flow, have nevertheless affected its reported profit.

8
Chairman’s Statement (Cont’d)
Annual Report 2017
BUSINESS OVERVIEW
PROPERTIES
The property market in Hong Kong as a whole remained buoyant in 2017. During the year, a total of 17 development sites were sold under government tenders. The aggregate land sale premium realised was in excess of HK$120 billion, which was a significant increase of over 50% above that recorded in 2016, and the unit land prices under these tender awards have repeatedly created new records. The residential market was robust, with price and transaction volume reported to have increased by 13% and 24%, respectively, from the 2016 levels. The primary residential market continued to be strong, with property developers offering attractive purchasing terms and financing schemes. In spite of the hefty stamp duties, the secondary market also remained active, as driven by the favourable market sentiment and the pent-up underlying demand. The market for the luxury residential properties was particularly red hot, with the unit prices for strata apartment units continually recording all-time highs. On the other hand, with the support of a rising local consumption power and the gradual recovery in the tourist market, the retail property sector regained momentum after a few years of low period.
Since its establishment in 2011, P&R Holdings has served as the main operating arm of Paliburg for its property development and investment business. In September 2017, the iclub Ma Tau Wai Hotel in Kowloon, developed by P&R Holdings, was sold to Regal REIT for a cash consideration of HK$1,360 million. In the meantime, the occupation permit for its shopping mall development at Ma On Shan, Sha Tin was issued in September 2017. This regional shopping mall has been named as the “We Go MALL” and is intended to be retained by P&R Holdings as an investment property for rental income. Leasing works are progressing satisfactorily and the mall is planned to be opened in May this year.
Three other ongoing development projects of P&R Holdings are scheduled to be completed within 2018. They are, respectively, the joint venture commercial/residential project with the Urban Renewal Authority of Hong Kong in Sham Shui Po, most of the residential units of which have been presold; the iclub Mong Kok Hotel project also with the Urban Renewal Authority in Tai Kok Tsui; and, more importantly, the large scale luxury residential development at Kau To, Sha Tin.
Considering the increasing challenge in acquiring suitable development sites in Hong Kong to replenish land bank, despite the Hong Kong Government’s efforts to increase land supply, the Paliburg group will have no haste in the disposal of their properties, particularly having regard to the optimistic outlook of the Hong Kong property market. At the same time, the Paliburg group is also actively reviewing appropriate acquisition opportunities in real estate and hotel projects overseas that can serve to broaden and diversify its overall asset portfolio.
Pending completion and/or sale of the property projects under development, Regal has also been undertaking through its wholly owned subsidiaries property developments in Hong Kong since 2017.
In the meanwhile, the property development business of the Paliburg group in China is undertaken through the Cosmopolitan group.
Additional information on the Paliburg group’s development property projects and properties, including those undertaken by P&R Holdings, Regal and Cosmopolitan, are contained in the section headed “Management Discussion and Analysis” in this Annual Report.
REGAL HOTELS INTERNATIONAL HOLDINGS LIMITED
For the year ended 31st December, 2017, Regal achieved a consolidated profit attributable to shareholders of HK$982.1 million, an increase of about 3.6 times over the profit of HK$213.7 million recorded in 2016.

9
Chairman’s Statement (Cont’d)
Annual Report 2017
The increase in the profit attained for the year was mainly attributable to the fair value gains on its financial assets portfolio, the reimbursement of rental expenses (net of hotel operating income) received from P&R Holdings with regards to the leasing by the Regal group of the iclub Sheung Wan Hotel and iclub Fortress Hill Hotel for their initial 3-year terms and its share of the fair value gains on the investment properties held by the P&R Holdings group.
Operating profit before depreciation, finance costs and tax for the year amounted to HK$1,814.7 million, as compared to HK$987.1 million in the preceding year. Total depreciation charges provided by Regal on its hotel portfolio in Hong Kong for the year amounted to HK$463.2 million which, although not affecting cash flow, has nevertheless impacted on its reported profit.
BUSINESS OVERVIEW
HOTELS
MARKET OVERVIEW
Based on a recent research by the World Bank Group, the growth in advanced economies strengthened in 2017, assisted by recoveries in capital spending and exports. The recoveries were markedly stronger than expected in the Euro Area and, to a lesser degree, in the United States and Japan. The growth in the Gross Domestic Product (GDP) in China reached 6.9% in 2017, which was higher than the previous forecast of 6.5% by some analysts, reflecting the positive effects of the continued fiscal support and economic reforms, as well as recoveries in exports and contribution from net trade. Hong Kong’s economy also continued to grow, with its GDP for the year increased by 3.8% in real terms over 2016, above the forecast by the Hong Kong Government of 2-3% in early 2017.
In 2017, visitor arrivals to Hong Kong increased by 3.2% year-on-year to a total of 58.5 million, led by a rebound in the overall number of visitors from Mainland China. During the year, there was a total of 44.4 million visitors from Mainland China, of which 18.5 million were overnight visitors, which was an increase of 6.7% year-on-year. Meanwhile, business from the traditional long haul markets and other short haul markets (excluding Mainland China) remained steady. Total overnight visitors to Hong Kong in 2017 amounted to 27.9 million, representing an increase of 5% year-on-year. Based on a hotel survey published by the Hong Kong Tourism Board (HKTB), the average hotel occupancy rate for all the surveyed hotels in different categories in 2017 was 89.0%, an increase of 2.0 percentage points from 2016, while the industry-wide average room rate recorded an upward adjustment of 0.1%, resulting in a year-on-year increase of 2.3% in the Revenue per Available Room (RevPAR).
HOTEL OWNERSHIP
As reported before, a wholly owned subsidiary of Regal is developing a new hotel within the SKYCITY Project at the Hong Kong International Airport under an agreement for sublease from the Airport Authority. The project is progressing steadily and the new hotel is presently scheduled to be completed in 2020.
The Regal group also wholly owns the 186-room La Mola Hotel & Conference Centre in Barcelona, Spain. This hotel was acquired in 2014 and was formerly managed and operated by the Regal group. In August 2017, the Regal group entered into a lease agreement for the leasing of the hotel property to an independent third party for a term till August 2029, of which the lease period to August 2023 is fixed and mandatory on both parties. The lease agreement has formally commenced on 1st September, 2017 and is yielding satisfactory rentals. The hotel is now renamed as Campus La Mola.

10
Chairman’s Statement (Cont’d)
Annual Report 2017
REGAL REAL ESTATE INVESTMENT TRUST
As at 31st December, 2017, the Regal group continued to hold approximately 74.6% of the total outstanding issued units of Regal REIT while Regal Portfolio Management Limited, a wholly-owned subsidiary of the Regal group, acts as the REIT Manager.
For the year ended 31st December, 2017, Regal REIT recorded a consolidated profit before distributions to Unitholders of HK$2,488.3 million, as compared to the profit of HK$564.0 million for the financial year 2016. The consolidated profit recorded for 2017 included a fair value gain of HK$2,044.2 million arising from the increase in the appraised values of the hotel properties in Hong Kong owned by Regal REIT as investment properties, after offsetting the additional capital expenditures for the year, while for the financial year 2016, the corresponding fair value gain was only HK$91.3 million. If the effects of the fair value changes are excluded, the core profit before distributions to Unitholders for the year under review would amount to HK$444.1 million, as compared to HK$472.7 million for the preceding year.
Apart from the five initial Regal Hotels, Regal REIT is gradually building up a separate portfolio of iclub Hotels, a select service hotel brand that is being developed by the Regal group. Including the latest addition of the iclub Ma Tau Wai Hotel, Regal REIT now owns a total of four iclub Hotels operating in Hong Kong.
With the exception of the iclub Wan Chai Hotel, which is being self-operated by Regal REIT, and the iclub Ma Tau Wai Hotel, which is under a lease to the Regal group’s wholly-owned lessee for a term of 5 years with escalating fixed rentals, all the initial Regal Hotels and the two other iclub Hotels are presently under leases to the same lessee of the Regal group based on market rental packages to be determined annually.
The iclub Wan Chai Hotel was the first iclub Hotel in Hong Kong, which is self-operated by Regal REIT and also managed by a subsidiary of the Regal group. The iclub Wan Chai Hotel has always enjoyed very high occupancies and additional focus has been placed on yield enhancement. Although the year-round average occupancy of 95.3% maintained by this hotel in 2017 was slightly below the 98.5% attained in 2016, the average room rate has increased by 6.3%, with RevPAR consequently improving by 2.8% year-on-year.
In September 2017, Regal REIT completed the acquisition of the iclub Ma Tau Wai Hotel in Kowloon from P&R Holdings at a consideration of HK$1,360 million, following satisfaction of all the requisite conditions precedent. The iclub Ma Tau Wai Hotel is a new hotel with 340 guestrooms which commenced business operations in May 2017 and is the fourth iclub Hotel owned by Regal REIT. The iclub Ma Tau Wai Hotel carries the benefit of a lease to the Regal group’s lessee for a term of 5 years with escalating fixed rentals at an average yield of 4.5% per annum which, in turn, assures Regal REIT with stable returns during the hotel’s start up period. The lease will be extendable at the option of Regal REIT up to 31st December, 2027, with rentals to be based on annual market rental reviews.
Regal REIT has recently concluded in March 2018 a bilateral financing arrangement for a 5-year term loan in the principal amount of HK$3.0 billion, which is principally secured by a mortgage over the Regal Kowloon Hotel. This term loan was arranged mainly for the purpose of financing the repayment of the two medium term notes due in March and May, respectively, this year. Based on the interest spread under the new term loan and the current Hong Kong Interbank Offered Rate (HIBOR), as compared to the coupon rates under the two medium term notes, it is expected there will be substantial savings on Regal REIT’s future financing costs.
HOTEL OPERATIONS
Favour Link International Limited, a wholly owned subsidiary of Regal, is the lessee operating all the eight Regal Hotels and iclub Hotels under lease from Regal REIT.

11
Chairman’s Statement (Cont’d)
Annual Report 2017
The five initial Regal Hotels have achieved during the year positive improvements in their operating results. Their combined average occupancy rate in 2017 was 87.4%, as compared to 86.0% last year, while their combined average room rate increased by 4.8%, resulting in an enhancement of 6.5% year-on-year in terms of RevPAR, which outperformed the industry average. Total hotel revenue from the five initial Regal Hotels in 2017 amounted to HK$1,967.0 million, as compared to HK$1,864.4 million in 2016. The total net property income generated by these hotels for the year amounted to HK$807.3 million, which was 4.7% higher than the HK$770.9 million in 2016. This represented an excess of HK$74.3 million over the aggregate annual base rent of HK$733.0 million for the year and 50% of such excess was attributable to Regal REIT as variable rent. For the year 2018, the aggregate annual base rent for the five initial Regal Hotels is HK$751.0 million, which represents an increment of HK$18.0 million as compared to 2017, with variable rent continuing to be based on 50% sharing of the excess of the aggregate net property income over the aggregate base rent.
The first three years of the lease terms with escalating fixed annual rentals for the iclub Sheung Wan Hotel and the iclub Fortress Hill Hotel ended in February and July 2017, respectively. Their rental packages are now being determined annually by an independent professional property valuer. In accordance with the terms of the agreed arrangements with P&R Holdings when the leases for these two hotels were entered into by the Regal group’s lessee, the Regal group received from P&R Holdings during the year an aggregate sum of HK$273.4 million in reimbursement of the rental expenses (net of hotel operating income) for their initial 3-year terms, the impact of which has been reflected in the consolidated financial statements of the Regal group for 2017. During the year under review, the operating performances of these two iclub Hotels have shown substantial improvement. Their combined annual average occupancy was 91.6%, 2.5 percentage points above the level in 2016, while their combined average room rate was enhanced by 5.9% year-on-year. Under the market rental reviews conducted for the iclub Sheung Wan Hotel and iclub Fortress Hill Hotel, the base rents for 2018 have been determined to be HK$42.0 million and HK$42.4 million, respectively, with variable rent basing on 50% sharing of the excess of the net property income over the base rent.
As mentioned above, the iclub Ma Tau Wai Hotel has also been leased to the Regal group’s lessee for hotel operation. Similar to the previous arrangements with the two other iclub Hotels, P&R Holdings, as the vendor of the iclub Ma Tau Wai Hotel, has agreed to reimburse to the Regal group’s lessee any shortfall of the total cumulative net income from the hotel below the total cumulative payments (including rent) payable by the Regal group’s lessee under the lease for the initial 5-year term with escalating fixed rentals, but in this case, on an annual basis. Although still in its early stage of operation, this hotel has managed to attain satisfactory performance, with average occupancy in 2017, since its acquisition by Regal REIT in September, maintained at 88.1%.
HOTEL MANAGEMENT
Regal Hotels International Limited, the wholly owned management arm of the Regal group, is the hotel manager providing services to nine operating Regal and iclub Hotels in Hong Kong. The three other hotels in Hong Kong coming on stream, which are intended to be named as the iclub Mong Kok Hotel, the iclub Soho Hotel and the Regala Skycity Hotel, respectively, will also be managed by the Regal group.
In other China cities outside Hong Kong, the Regal group is managing a total of nine operating Regal and iclub Hotels, including four in Shanghai, two in Dezhou and one in Xi’an, Foshan and Zhengzhou, respectively. The 186-room iclub Yuhong Hotel in Zhengzhou, opened in February 2016, was the first hotel managed by the Regal group under the iclub by Regal brand in China. Three other hotels to be managed by the Regal group are in the pipeline, covering strategic locations in Chengdu, Jiangmen and Kunshan.
The Regal group believes that the continuing expansion of the hotel management businesses in China will further strengthen the recognition of the Regal brand and promote reciprocal businesses among the Regal group’s different hotels.

12
Chairman’s Statement (Cont’d)
Annual Report 2017
PROPERTIES
The Regal group holds a 50% joint venture interest in P&R Holdings. In addition, the Regal group has also been undertaking through its wholly owned subsidiaries property developments in Hong Kong, including the development properties at Queen’s Road West, Hong Kong and the new airport hotel development project at the Hong Kong International Airport through the tender award from the Airport Authority, both acquired in 2017.
During the year, the Regal group completed the disposal of one garden house in Regalia Bay, Stanley which was held for sale. The Regal group still retains a total of 14 garden houses in Regalia Bay, 8 of which are held as investment properties, 3 as held for sale and the other 3 as fixed assets.
OTHER INVESTMENTS
The Regal group maintains a sizable investment portfolio comprising listed securities, investment funds, bonds as well as treasury and yield enhancement products. The Regal group also directly held within this portfolio significant investment in the issued shares of Cosmopolitan. Benefiting from the buoyant capital and securities market in Hong Kong and globally, the Regal group recorded substantial fair value gains on its financial assets portfolio during the year, which have been reflected in its results under review.
In December 2017, the Regal group completed the process for the acquisition of a mid-life Airbus 319 model aircraft, which is under an operating lease to an airline operator flying European routes. At present, the Regal group owns a fleet of 13 aircraft (including one aircraft which is 85% owned), of which 2 aircraft were on operating leases, 6 aircraft on finance leases and 4 aircraft pending re-lease or disposal. The one remaining aircraft, an Airbus A321-200 aircraft, has been repossessed from the lessee in February this year and a letter of intent already entered into for its disposal. In order to further replenish its aircraft fleet, the Regal group entered into agreement in February 2018 for the acquisition of two Airbus A320-232 passenger aircraft which are under leases to a major international airline operator. These two purchase agreements are expected to be completed by the end of April this year.
COSMOPOLITAN INTERNATIONAL HOLDINGS LIMITED
For the year ended 31st December, 2017, Cosmopolitan attained a profit attributable to shareholders in the amount of HK$13.7 million, as compared to a loss of HK$115.3 million recorded for the preceding financial year. The profit for the year was principally attributable to the realised profits from the sale of the residential units in its composite development project in Chengdu, China completed before the end of 2017 and, in addition, fair value gains on its financial assets and the write-back of impairment loss previously provided on certain component part in the Chengdu development project.
BUSINESS OVERVIEW
Presently, the core business of the Cosmopolitan group is mainly focused on the two development projects in Chengdu, Sichuan Province and in Tianjin, China.
For the year under review, the economy in China expanded by 6.9 percent, which was higher than the previous forecast by most analysts, reflecting the positive effects of the continued fiscal support and economic reforms. The property market in China on the whole remained steady in 2017, with the transacted volume of the real estate commodities likely to set another new record. Property prices maintained a moderate uptrend, with the market in the third to fourth tier cities performing better than expected, due to the spill-over of buying demands from the prime cities.
13
Chairman’s Statement (Cont’d)
Annual Report 2017
In the wake of the various fiscal and administrative policies promulgated by the government authorities during the latter part of 2017 to curb speculative activities, the aggregate volume of property sales in 2018 would likely be suppressed. However, as the level of inventories held for sale in some of the first and second tier cities is now relatively low, a major downward adjustment in the property prices is not anticipated. To meet the strong underlying demand for residential accommodation in the prime cities, the central government is promoting the development of the leasing property sector, in an aim to building up a stable and healthy property market in China in the long term.
The Cosmopolitan group’s two composite development projects in China, namely, the Regal Cosmopolitan City in Chengdu and the Regal Renaissance in Tianjin, are both progressing steadily.
The nine residential towers comprising 1,296 residential units in the first and second stages of the Chengdu project have been completed, of which 1,258 units have been sold for aggregate sale proceeds of RMB828 million (HK$1,030 million). Most of the units sold have been handed over to the purchasers before the year end and the profits therefrom accounted for in the results for the year under review. As the sale prices of the units presold in the early stages of the sale programme were at comparatively low levels, the profits so far recorded on the units sales have been relatively modest. The other parts of the development, including a hotel, commercial and office space and ten residential towers comprising 1,555 units are proceeding as planned.
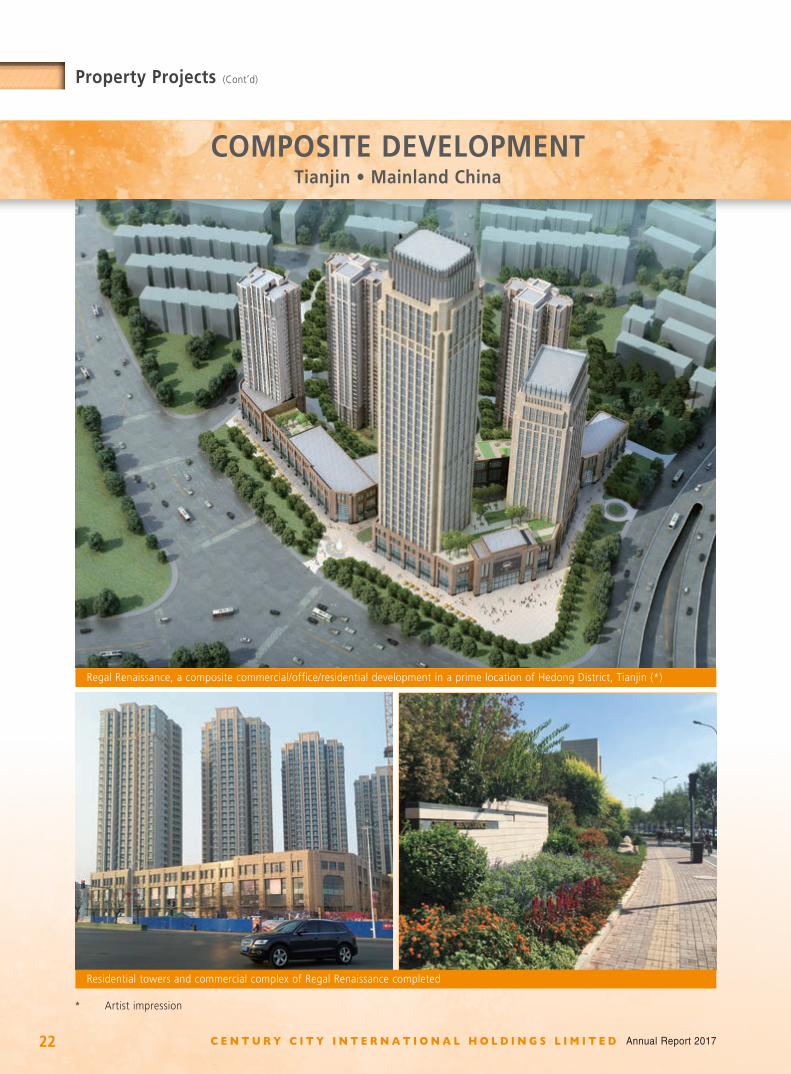
In the meanwhile, the construction works of the four residential towers, the commercial complex and the associated car parking spaces in the Tianjin project have recently been completed. Of the total 512 units comprised in the four residential towers, 479 units have been presold to date, securing contracted sales of RMB1,498 million (HK$1,863 million). The presold residential units are being handed over to the individual purchasers. The profits to be derived from the sales of these units will be accounted for in the first half of this year after the handover process is completed.
As explained in the Interim Report for 2017, the Cosmopolitan group has disposed of the 60% interest previously held in a logistics group operating in Shanghai in June 2017. The convertible bonds in the aggregate nominal amount of HK$57.05 million, which were issued by the Cosmopolitan group as part consideration for its acquisition of the 60% interest, have been converted into ordinary shares of Cosmopolitan before the year end in 2017.
OUTLOOK
REGAL GROUP
For the first two months of 2018, the hotel market in Hong Kong continued to recover steadily but the overall external economic environment is still posing uncertainties, due to increased geopolitical tensions, volatilities in financial markets and the normalisation of interest rates as well as threats on free trade.
In Hong Kong, the two mega infrastructure projects, namely, the Hong Kong-Zhuhai-Macao Bridge (HZMB) and the Hong Kong Section of the Guangzhou-Shenzhen-Hong Kong Express Rail Link (Express Rail Link) are expected to be completed in 2018. The connectivity of these two projects will further enhance Hong Kong’s position as a trade and logistics hub for goods and services from the Pearl River Delta region and will benefit different business sectors in Hong Kong, including tourism, finance and commerce. The location of the West Kowloon Station for the Express Rail Link is adjacent to the West Kowloon Cultural District, which will create synergies for world-class integrated arts and cultural events as well as tourism related activities. Meanwhile, the two major theme parks in Hong Kong, Ocean Park and Hong Kong Disneyland, are both embarking on expansion plans. With these favourable factors in the background, the REIT Manager is optimistic that the tourism and hotel markets in Hong Kong will continue to grow and Hong Kong will be able to maintain its position as a preferred tourist destination, for both business and leisure travellers alike.

14
Chairman’s Statement (Cont’d)
Annual Report 2017
Presently, the Regal group owns through Regal REIT a total of nine operating hotels, with an aggregate of 4,909 guestrooms and suites and is one of the major hotel owner and operator groups in Hong Kong. During the course of the next three years, three other hotels under development by P&R Holdings and the Regal group will be gradually completed and will come on stream. They are, respectively, the iclub Mong Kok Hotel with 288 guestrooms in 2018 and another iclub Hotel in Sheung Wan with 98 guestrooms and suites in 2019, both developed by P&R Holdings, and the new airport hotel with 1,203 guestrooms and suites in 2020 developed by the Regal group.
While committed to maintaining (together with Regal REIT) its position as one of the market leaders in Hong Kong, the Regal group is also actively exploring potential acquisition opportunities overseas, with a view to strengthening its hotel network and to enhancing its market positioning globally.
Overall, the directors of Regal are confident that the Regal group as a whole will continue to grow and will bring to its shareholders increasing returns.
COSMOPOLITAN GROUP
The sale transactions of the residential units in the Tianjin development, which have been presold at satisfactory prices, are expected to be duly completed within the first half of this year and will contribute substantial profit to the Cosmopolitan group. On the other hand, the development works of the ten residential towers in the third stage of the Chengdu project are under way and the presale programme is planned to be launched before the end of this year. Having regard to the favourable market response towards the residential units in the first and second stages of the project, the Cosmopolitan group is optimistic that the selling prices and, consequently, the cash flow and profits to be generated from the sale of the third stage residential units of this Chengdu project will be significantly higher than those in the first two stages.
The Cosmopolitan group has strong financial resources and is actively looking for appropriate investment opportunities to expand the size and diversity of its business portfolio, with a view to establishing a solid platform for its future growth.
PALIBURG GROUP
Despite the ongoing normalisation of interest rates and the tapering of market liquidity by some central banks, the process is expected to be very gradual and the negative real interest rate environment in Hong Kong should persist in the near term. Coupling with the rising confidence in economic growth, the effects of increasing private wealth and the continuing inflow of investment capital from Mainland China, the outlook of the property market in Hong Kong in 2018 is expected to remain buoyant.
Though it has proven to be challenging, the Paliburg group will continue to work strenuously to replenish its land bank in Hong Kong. While it will continue to participate in bidding for sites that are suitable for the Paliburg group under government tenders, the Paliburg group will also actively seek opportunities for the acquisition of development sites and properties through other alternative avenues. At the same time, the Paliburg group is carefully reviewing proposals for properties and projects overseas, where comparatively more investment opportunities may be available.
As mentioned above, three of the development projects of P&R Holdings are scheduled to be completed in 2018. As most of the residential units in the joint venture project in Sham Shui Po have already been presold, and with the issue of its occupation permit earlier in March this year, the profits to be derived from these unit sales will be accounted for in the current financial year.

15
Chairman’s Statement (Cont’d)
Annual Report 2017
Worthy of particular mention is the luxury residential project at Kau To, which is a large scale development comprising 24 garden houses and 136 apartment units in 7 mid-rise apartment blocks, also scheduled to be completed later this year. The sale programme is planned to be commenced soon after the development is completed later this year and will be launched in phases on a gradual basis. Having regard to the prevailing prices of properties in the neighborhood area, the Paliburg group is confident that very substantial profits and cash flow will be contributed by the unit sales of this development.
Overall, the directors of Paliburg are optimistic of the future prospects of the Paliburg group.
CENTURY CITY GROUP
The Century City Group as a whole has been growing progressively over the past few years and has emerged as a conglomerate with substantial assets and diversified business interests. As the ultimate holding company of the Century City Group, the Company keeps under review the corporate and asset holding structure of all its member companies, with an aim to achieving an optimum group structure that can serve to release and realise the underlying true value of their assets and business interests and, at the same time, can facilitate their continuing expansion and development.
Having regard to the promising prospects of all its member companies, the Directors are optimistic that the Century City Group as a whole will continue to prosper.
DIRECTORS AND STAFF
Taking this opportunity, I would like to express my sincere gratitude to Mr. Ng Siu Chan who resigned as an Independent Non-executive Director of the Company on 1st January, 2018. Mr. Ng had served the Company in that capacity since 1994 and the advice and support that he rendered all through these years have been most invaluable. At this juncture, I would also like to extend my warm welcome to Ms. Winnie Ng, a daughter of Mr. Ng Siu Chan, who joined the Board of the Company as an Independent Non-executive Director on 1st January, 2018. With her wide working experience in the transport industry and active involvement in public service, Ms. Ng will be able to provide independent and valuable advice to the Company on various corporate management affairs.
Finally, I would like to thank my fellow Directors for their continuous support and all the management and staff members for their loyalty and hard work.
LO YUK SUI
Chairman
Hong Kong26th March, 2018

16 Annual Report 2017
Property Projects
Casa Regalia, the garden houses in the residential development at Nos. 65-89 Tan Kwai Tsuen Road, Yuen Long, New Territories
A luxurious garden house at Casa Regalia
The Ascent, a commerical/resident development at No. 83 Shun Ning Road, Sham Shui Po, Kowloon - occupation permit issued
RESIDENTIAL / COMMERCIAL DEVELOPMENTSHong Kong

17Annual Report 2017
Property Projects (Cont’d)
L iv ing room in a garden house of the luxur ious res identia l development at Kau To, Sha Tin (*)
Luxurious residential development at Sha Tin Town Lot No. 578, Area 56A, Kau To, Sha Tin, New Territories – superstructure works in progress
Bedroom in a garden house of the luxurious residential development at Kau To, Sha Tin (*)
* Artist impression
RESIDENTIAL / COMMERCIAL DEVELOPMENTSHong Kong

18 Annual Report 2017
Property Projects (Cont’d)
Interior of We Go MALL
We Go MALL, a shopping mall at No. 16 Po Tai Street, Ma On Shan, Sha Tin, New Territories - occupation permit issued
RESIDENTIAL / COMMERCIAL DEVELOPMENTSHong Kong

19Annual Report 2017
Property Projects (Cont’d)
iclub Mong Kok Hotel – superstructure works in progress
iclub Mong Kok Hotel at Anchor Street/Fuk Tsun Street, Tai Kok Tsui, Kowloon (*)
* Artist impression
HOTEL DEVELOPMENTSHong Kong

20 Annual Report 2017
Property Projects (Cont’d)
Nos. 5-7 Bonham Strand West and Nos. 169-171 Wing Lok Street, Sheung Wan Intended to be named as “iclub Soho Hotel” – superstructure works in progress (*)
New hotel project to be named as "Regala Skycity Hotel" at Chek Lap Kok Lot No. 3, Hong Kong International Airport (*)
Model of Regala Skycity Hotel
* Artist impression
HOTEL DEVELOPMENTSHong Kong

21Annual Report 2017
Property Projects (Cont’d)
Commercial/office towers of Regal Cosmopolitan City (*)Residential towers in first stage of Regal Cosmopolitan City – completed
* Artist impression
COMPOSITE DEVELOPMENTChengdu • Mainland China
Regal Cosmopolitan City, a composite hotel/commerical/office/serviced apartment/residential development in Xindu District, Chengdu, Sichuan (*)
22 Annual Report 2017
Property Projects (Cont’d)
Regal Renaissance, a composite commercial/office/residential development in a prime location of Hedong District, Tianjin (*)
COMPOSITE DEVELOPMENTTianjin • Mainland China
Residential towers and commercial complex of Regal Renaissance completed
* Artist impression

23Annual Report 2017
Other Investments
Airbus A319
Boeing 737-33A(SF)
AIRCRAFT OWNERSHIP AND LEASING
ERJ-145 Embraer Aircraft ERJ-135 Embraer Aircraft

24 Annual Report 2017
Other Investments (Cont’d)
1st Chinese Brand licensed to Mattel – available in over 700 points of sale in China
Over 2 million Bodhi and Friends bilingual books distributed via KFC with more than 5,000 outlets in China
EDUTAINMENT PRODUCTS

25Annual Report 2017
Other Investments (Cont’d)
1st Chinese Animation IP to be licensed to Scholastic – available across Asia
Bodhi and Friends theme café and rooms in hotels Co-produced consumer products with B.Duck
EDUTAINMENT PRODUCTS

26
Management Discussion and Analysis
Annual Report 2017
BUSINESS REVIEW
The Group’s significant investments and principal business activities mainly comprise property development and investment, construction and building related businesses, hotel ownership, hotel operation and management, asset management, aircraft ownership and leasing business and other investments including financial assets investments.
The principal businesses of Paliburg Holdings Limited (“PHL”), the Group’s listed intermediate subsidiary, comprise its investment in Regal Hotels International Holdings Limited (“RHIHL”), its property development and investment businesses (including those undertaken in Hong Kong through P&R Holdings Limited (“P&R Holdings”), the joint venture with RHIHL, and those in the PRC through Cosmopolitan International Holdings Limited (“Cosmopolitan”), which is a listed subsidiary of P&R Holdings), construction and building related businesses, and other investment businesses. The business review of PHL during the year, the commentary on the property sectors in which the PHL group operates and the changes in the general market conditions and the potential impact on their operating performances and future prospects are contained in the preceding Chairman’s Statement.
The significant investments and business interests of RHIHL comprise hotel ownership business undertaken through Regal Real Estate Investment Trust (“Regal REIT”), hotel operation and management businesses, asset management of Regal REIT, property development and investment, including those undertaken through the joint venture in P&R Holdings, aircraft ownership and leasing and other investment businesses. The performance of RHIHL’s hotel, property and other investment businesses as well as that of Regal REIT during the year under review, the commentary on the hotel and property sectors in which the RHIHL group operates and the changes in general market conditions and the potential impact on their operating performances and future prospects are contained in the preceding Chairman’s Statement.
The Group has no immediate plans for material investments or capital assets, other than those as disclosed in the sections headed “Business Overview” and “Outlook” and in the preceding Chairman’s Statement and in this section.
CENTURY INNOVATIVE TECHNOLOGY GROUP (CIT)
The Group effectively owns an aggregate of 48% interests (comprising 36% held by the RHIHL group and 12% held through wholly owned subsidiaries of the Company) in 8D Matrix Limited (“8D Matrix”), an associate of the Group, which wholly owns CIT. The remaining 52% interest in 8D Matrix is held by private companies owned by Mr. Lo Yuk Sui, the Chairman and controlling shareholder of the Company. CIT is a dynamic edutainment company principally engaged in the production of high-quality education and entertainment multimedia content as well as related products and services for families of preschoolers, focusing primarily on the China market. CIT’s flagship property “Bodhi and Friends” has been created by Miss Lo Po Man, the daughter of Mr. Lo and a Vice Chairman and an Executive Director of the Company, and the intellectual property rights over such characters are beneficially owned by Miss Lo.
To date, CIT has developed over 2,000 minutes of award-winning 3D animated content based on its flagship brand, Bodhi and Friends . The first and second seasons debuted on China’s two leading children television channels, CCTV (China Central Television) and Hunan Television, and reached No.1 in viewership ratings. The third and fourth seasons were released in 2017. Season four, written by an Emmy-award winning writer, achieved No. 1 status on Kaku TV and Jinying TV. It was also launched on CCTV, Shandong TV, and TVB, Hong Kong’s leading television channel. In 2017, Bodhi and Friends was awarded the Gold Cup for China’s Top 10 Animated Characters and the Jade Monkey Award for Most Commercial Animated IP. To support the global expansion plans of Bodhi and Friends , CIT plans to work with local and international partners to develop the fifth season for international markets.

27
Management Discussion and Analysis (Cont ’d )
Annual Report 2017
Bodhi and Friends was the first Chinese IP licensed to Mattel, one of the world’s largest toy companies. The first collection of Bodhi and Friends toys was launched last year across more than 700 points of sales in China, including: Toys”R”Us, Carrefour, Kidswant (孩子王), and Walmart. Bodhi and Friends was also the first Chinese animated IP licensed to Scholastic, one of the world’s largest children publishers. The Bodhi and Friends branded books published by Scholastic were distributed across Asia. As further testament to the brand’s growing popularity, CIT collaborated with KFC, which has over 5,000 outlets in China, to distribute over 2 million Bodhi and Friends bilingual books.
CIT plans to invest in efforts to enhance the brand’s awareness by (a) diversifying the portfolio of licensed products, (b) expanding content licensing and distribution on online platforms, (c) developing musical tours in collaboration with local event partners, and (d) organizing promotional reading events at major retail outlets across China.
To foster holistic child development, CIT is developing an innovative series of offline educational services and physical products based on its proprietary interactive content. Books, learning devices, and subscription packs will be distributed via retail partners. In addition, to encourage out-of-home parent-child interactions, CIT is also planning to develop STEAM playgroups and kids cafes in shopping malls across Hong Kong and China. The first kids café is planned to be opened in the “We Go MALL” in Ma On Shan, Hong Kong in 2018.
CIT also plans to launch an interactive language learning platform for children and parents offering adaptive edutainment content (including videos, books, and songs), paid online courses, and premium subscription products. Leveraging the existing fan base drawn from content distribution and licensing exposure, the platform will feature Bodhi Galaxy content and curated content from the West. The educational social network will provide content that will offer an international kindergarten experience for children and parents.
Management is confident that the launch of unique high-quality educational content and products through our leading partnerships will be a major step for Bodhi and Friends to become China’s first international preschool brand.
P&R HOLDINGS LIMITED
P&R Holdings is a 50:50 owned joint venture established by PHL and RHIHL, with capital contributions provided by PHL and RHIHL on a pro-rata basis in accordance with their respective shareholdings in P&R Holdings. P&R Holdings is effectively a subsidiary of PHL and the Company, and its business scope encompasses the development of real estate projects for sale and/or leasing, the undertaking of related investment and financing activities, and the acquisition or making of any investments (directly or indirectly) in the financial assets of or interests in, or extending loans to, any private, public or listed corporations or undertakings that have interests in real estate projects or other financial activities where the underlying assets or security comprise real estate properties.
Further information relating to the property development projects being undertaken and properties owned by the P&R Holdings group in Hong Kong is set out below:
Apart from the Shun Ning Road development project in Sham Shui Po, Kowloon and the Anchor Street/Fuk Tsun Street development project in Tai Kok Tsui, Kowloon, both of which are being undertaken pursuant to the development contracts awarded by the Urban Renewal Authority of Hong Kong, all of the other ongoing development projects and properties are presently wholly owned by P&R Holdings group.

28
Management Discussion and Analysis (Cont ’d)
Annual Report 2017
Domus and Casa Regalia at Nos.65-89 Tan Kwai Tsuen Road, Yuen Long, New Territories
This residential project has a site area of approximately 11,192 square metres (120,470 square feet) and provides a total of 170 units, comprising 36 luxurious garden houses and a low-rise apartment block with 134 units, having aggregate gross floor area of approximately 11,192 square metres (120,470 square feet). The occupation permit for the project was issued in November 2015 and the certificate of compliance was obtained in April 2016.
With the exception of 1 unit, all the other 133 units in the apartment block, named Domus, had been sold in 2015. The sale programme for the garden houses, named Casa Regalia, which constitute the main component of the development, was first launched in May 2016 and, up to date, 14 houses have been contracted to be sold. While the remaining houses are presently planned to be disposed of on a gradual basis, some of them may in the meantime be retained for rental income.
iclub Ma Tau Wai Hotel, No.8 Ha Heung Road, To Kwa Wan, Kowloon
The project has an aggregate site area of approximately 700 square metres (7,535 square feet) and has been developed into a 22-storey hotel (including 1 basement floor) with 340 guestrooms, having total gross floor area of approximately 6,298 square metres (67,790 square feet) and covered floor area of approximately 9,490 square metres (102,160 square feet). The occupation permit of the hotel was issued in November 2016. The hotel commenced business operations in May 2017.
P&R Holdings re-consolidated a 100% ownership interest in the project in May 2017. The entire equity interests in the group of companies that own this iclub Ma Tau Wai Hotel was sold to Regal REIT at a consideration of HK$1,360 million in September 2017.
Shopping mall named as “We Go MALL” at Sha Tin Town Lot No.482 at No.16 Po Tai Street, Ma On Shan,Sha Tin, New Territories
This development site has a site area of 5,090 square metres (54,788 square feet) and a maximum permissible gross floor area of 15,270 square metres (164,364 square feet). The site is being developed into a shopping mall with 5 storeys above ground level and 1 storey of basement floor. The occupation permit for the project was issued in September 2017. This completed property has been named as the “We Go MALL” and is intended to be retained for rental income. Leasing works are progressing satisfactorily and the mall is planned to be opened in May 2018.
The Ascent at No.83 Shun Ning Road, Sham Shui Po, Kowloon
This is a joint venture project awarded by the Urban Renewal Authority of Hong Kong through a tender process in March 2014. The land has a site area of 824.9 square metres (8,879 square feet) and is being developed into a 28-storey commercial/residential building (including 1 basement floor) with total gross floor area of 7,159 square metres (77,059 square feet), providing 157 residential units, 2 storeys of shops and 1 storey of basement carpark. The occupation permit for the project was recently issued in March 2018. The presale of the residential units in this development was launched in July 2016 and, up to date, 155 of the total 157 residential units have been contracted to be sold. The sale programme for the commercial units is planned to be launched shortly.
Sha Tin Town Lot No.578, Area 56A, Kau To, Sha Tin, New Territories
The project has a site area of 17,476 square metres (188,100 square feet) and is being developed into a luxury residential complex comprising 7 mid-rise apartment blocks with 136 units, 24 detached garden houses and 197 carparking spaces, with aggregate gross floor area of approximately 32,474 square metres (349,547 square feet). The superstructure works are in progress and scheduled to be completed later this year. The sale programme is planned to be commenced soon after the development is completed and will be launched in phases on a gradual basis.

29
Management Discussion and Analysis (Cont ’d )
Annual Report 2017
iclub Mong Kok Hotel at Anchor Street/Fuk Tsun Street, Tai Kok Tsui, Kowloon
This is a hotel development project also awarded by the Urban Renewal Authority of Hong Kong through a tender process in June 2015, which has a site area of 725.5 square metres (7,809 square feet). The project has total permissible gross floor area of approximately 6,529 square metres (70,278 square feet) and covered floor area of approximately 9,355 square metres (100,697 square feet) and is being developed into a 20-storey hotel building comprising about 288 guestrooms, with ancillary accommodation. The superstructure works are nearing completion and the project is scheduled to be completed in the third quarter of 2018.
Nos.5-7 Bonham Strand West and Nos.169-171 Wing Lok Street, Sheung Wan intended to be named as “iclub Soho Hotel”
The project has an aggregate site area of approximately 345 square metres (3,710 square feet) and is planned for the development of a hotel with 98 guestrooms and suites, with total gross floor area of approximately 5,236 square metres (56,360 square feet) and covered floor area of approximately 6,420 square metres (69,120 square feet). After extensive periods of delay to resolve the technical difficulties encountered on the sub-structure works, the superstructure works are progressing steadily and the project is presently anticipated to be completed in 2019.
REGAL HOTELS INTERNATIONAL HOLDINGS LIMITED
RHIHL is a listed subsidiary of PHL. Further information relating to the property projects undertaken and principal properties owned by the RHIHL group in Hong Kong, all of which are wholly owned by RHIHL, is set out below:
New hotel project intended to be named as “Regala Skycity Hotel” at the Hong Kong International Airport
A wholly owned subsidiary of RHIHL was awarded by the Airport Authority in Hong Kong in February 2017 the development right for a new hotel project at the Hong Kong International Airport, at a consideration payable in the form of non-refundable rental payment of approximately HK$2,188.9 million.
The hotel project has a site area of approximately 6,650 square metres (71,580 square feet) and permissible gross floor area of 33,700 square metres (362,750 square feet) and is situated at a site surrounded by Terminal 2 of the Hong Kong International Airport, the Asia World-Expo and SkyPier. The hotel project is also the first phase of the mega SKYCITY Project by the Airport Authority, which contains large scale retail and offices, dining and entertainment facilities.
The new project is planned for the development of a 13-storey (including one basement floor) hotel with 1,203 guestrooms and suites as well as extensive banquet, meeting and food and beverage facilities. The hotel is intended to be named as the Regala Skycity Hotel, which will be operated as a full service hotel targeting at commercial, airline related, leisure and meeting businesses. The foundation works have been commenced and the new hotel is presently scheduled to be completed in 2020.
Nos.150-158 and 160-162 Queen’s Road West, Hong Kong
The properties located at Nos.150-158 Queen’s Road West, Hong Kong were acquired through private treaty in March 2017, which have an aggregate site area of about 480 square metres (5,178 square feet) and are planned for a commercial/residential development. The RHIHL group has since further acquired units with more than 85% of the total undivided shares in the adjoining properties at Nos.160-162 Queen’s Road West, which have an aggregate site area of about 187 square metres (2,012 square feet). The two properties are intended to be consolidated for development and the combined site will have a total aggregate site area of about 667 square metres (7,190 square feet).

30
Management Discussion and Analysis (Cont ’d)
Annual Report 2017
Regalia Bay, 88 Wong Ma Kok Road, Stanley, Hong Kong
During the year, the RHIHL group completed the sale of one garden house in Regalia Bay, Stanley which was held for sale. A total of 14 garden houses in Regalia Bay with a total gross area of about 6,320 square metres (68,000 square feet) are still being retained, 8 of which are held as investment properties, 3 as held for sale and 3 as fixed assets. The RHIHL group will continue to dispose of some of these houses if the price offered is considered satisfactory.
COSMOPOLITAN INTERNATIONAL HOLDINGS LIMITED
Cosmopolitan is a listed subsidiary of P&R Holdings. Further information relating to the property projects of the Cosmopolitan group in the PRC, all of which are wholly owned, and it’s 60% owned logistics business in the PRC (disposed of in June 2017) is set out below:
Property Development
Chengdu Project – Regal Cosmopolitan City
Located in the Xindu District in Chengdu, Sichuan Province, the project is a mixed use development consisting of residential, hotel, commercial and office components, with an overall total gross floor area of approximately 497,000 square metres (5,350,000 square feet).
The nine residential towers comprising 1,296 residential units in the first and second stages of the Chengdu project have been completed, of which 1,258 units have been sold for aggregate sale proceeds of RMB828 million (HK$1,030 million). Most of the units sold have been handed over to the purchasers before the year end and the profits therefrom accounted for in the results for the year under review.
To cope with the changing market conditions, the business profile of the 317-room hotel has been revised and the corresponding interior design and guestroom mock-up works are in progress. The hotel is scheduled to open in phases from early 2019. The planning approval of the remaining ten residential towers in the third stage of the development has been obtained and the construction works are scheduled to commence shortly. The presale programme of these residential units is planned to be launched before the end of 2018. The planning approval of the other components within the development, comprising primarily commercial and office space, has also been obtained and the associated construction works are expected to commence in early 2019.
Tianjin Project – Regal Renaissance
Located in the Hedong District in Tianjin, this project entails a development site with total site area of about 31,700 square metres (341,000 square feet), which is planned for a mixed use development comprising residential, commercial and office components with total gross floor area of about 145,000 square metres (1,561,000 square feet).
The construction works of the four residential towers, the commercial complex and the associated car parking spaces have recently been completed. Of the total 512 units comprised in the four residential towers, 479 units have been presold to date, securing contracted sales of RMB1,498 million (HK$1,863 million). The presold residential units are being handed over to the individual purchasers. The presale of the commercial complex, comprising mainly shops of about 19,000 square metres (205,000 square feet), and 530 residential car parking spaces is continuing, with contracted sales to date of RMB139 million (HK$173 million). The superstructure works of the two office towers have been suspended due to the tightened government planning controls. The Cosmopolitan group is devising contingent plans and conducting negotiations with the local government with an aim to minimize any adverse impacts on the design and to have the construction works resumed as soon as possible.

31
Management Discussion and Analysis (Cont ’d )
Annual Report 2017
Xinjiang Project
This is a re-forestation and land grant project for a land parcel with site area of about 7,600 mu in accordance with the relevant laws and policies in Urumqi, Xinjiang Uygur Autonomous Region. The Cosmopolitan group has re-forested an aggregate area of about 4,300 mu within the project site and in accordance with the relevant government policies of Urumqi, a parcel of land with an area of about 1,843 mu (equivalent to approximately 1,228,700 square metres) within the project site will be available for real estate development after the requisite inspection, land grant listing and tender procedures are completed.
The Cosmopolitan group has completed the site survey on the parcels of land within the project site which have been illegally occupied by trespassers and has commenced communications with the relevant government authority to initiate appropriate measures to settle the land disputes. Based on the legal advice obtained, the legitimate interests of the Cosmopolitan group in this re-forestation and land grant contract remain valid and effective. The Cosmopolitan group has carried out the required remedial re-forestation works, such that the inspection and measurement of the reforested area by the relevant government authorities can be resumed and the final procedures leading to the land grant listing and tender of the development land may be concluded.
Logistics Business
Shanghai Logistics Project
As mentioned in the 2016 Annual Report, the Cosmopolitan group entered into a framework agreement in January 2016 to acquire 60% effective interests in a group of companies (the “Logistics Group”) operating logistics and related business in the PRC and the remaining 40% interests in the Logistics Group was held by an affiliate of the seller (the “JV Partner”). The acquisition was completed in May 2016 and as consideration therefor, the Cosmopolitan group issued convertible bonds in the aggregate principal amount of HK$57.05 million.
Having operated the logistics business for a period of about one year and after undertaking a review of all relevant circumstances including, in particular, the performance and development progress of the Logistics Group and the difference in the management style of the joint venture parties, the Cosmopolitan group agreed, after amicable negotiations with the JV Partner, to accept his proposal to buy back the Cosmopolitan group’s interest in the Logistics Group.
Accordingly, on 30th June, 2017, the Cosmopolitan group entered into a deed of arrangement with the JV Partner for the disposal of its entire interests in the Logistics Group for an aggregate consideration of HK$71.0 million, details of which were disclosed in the circular of the Cosmopolitan dated 18th August, 2017. The Cosmopolitan group received HK$45.6 million in cash upon completion of the disposal on 30th June, 2017. The balance of the consideration in the sum of HK$25.4 million was also received by the Cosmopolitan group in the second half of 2017. The Cosmopolitan group ceased to have any interest in the Logistics Group after completion of the related transactions. The aforesaid convertible bonds were converted into ordinary shares of Cosmopolitan before the year end in 2017.

32
Management Discussion and Analysis (Cont ’d)
Annual Report 2017
HANG FOK PROPERTIES LIMITED
Hang Fok Properties Limited (“Hang Fok”) is an entity that is 50% beneficially owned by each of the PHL group and the RHIHL group and is effectively a subsidiary of the Group. Hang Fok holds equity interests in a joint venture project company involved in a development project in the Central Business District in Beijing, the PRC. As previously reported, Hang Fok was engaged in a series of legal actions in the PRC with the other joint venture parties in the Beijing project, some of which were initiated by Hang Fok to protect its equity interests in the Beijing project. As also reported before, in the process of the legal actions taken, Hang Fok recovered in February 2016 about RMB195 million (equivalent to approximately HK$228.4 million) from the joint venture project company, as repayment of certain of the shareholder’s loans owing to Hang Fok, plus accrued contractual interest thereon. As at 31st December, 2016, the interest held by the Group in the project was carried in the consolidated financial statements at an insignificant amount. In March 2017, Hang Fok further recovered an additional amount of about RMB34 million (equivalent to approximately HK$37.8 million) from the joint venture project company, which principally represented late payment interest as required by the relevant court rules in the PRC. The Group will continue to exercise strenuous efforts with a view to salvaging the value of the Group’s interest in this investment.
FINANCIAL REVIEW
ASSETS VALUE
All the hotel properties of the Group in Hong Kong are owned by Regal REIT and, with the exception of the iclub Sheung Wan Hotel, the iclub Fortress Hill Hotel and the iclub Ma Tau Wai Hotel, were stated in the financial statements at their fair values as at 7th May, 2012 when RHIHL, together with Regal REIT, became subsidiaries of the Group, plus subsequent capital additions and deducting accumulated depreciation. The market valuations of these hotel properties have since appreciated substantially but have not been reflected in the Group’s financial statements. Moreover, the iclub Sheung Wan Hotel, the iclub Fortress Hill Hotel and the iclub Ma Tau Wai Hotel were stated in the Group’s financial statements at cost after full elimination of the unrealised gain arising from the disposal of the hotels by P&R Holdings to Regal REIT, and are also subject to depreciation. For the purpose of providing supplementary information, if the entire hotel property portfolio of the RHIHL group in Hong Kong is restated in the consolidated financial statements at its market value as at 31st December, 2017, the unaudited adjusted net asset value of the ordinary shares of the Company would be HK$3.53 per share, as follows:
As at 31st December, 2017
HK$’millionHK$ per
ordinary share
Book net assets attributable to equity holders of the parent 9,015.3 2.81Adjustment to restate the RHIHL group’s hotel property portfolio in Hong Kong at its market value and add back the relevant deferred tax liabilities 2,306.4 0.72
Unaudited adjusted net assets attributable to equity holders of the parent 11,321.7 3.53
33
Management Discussion and Analysis (Cont ’d )
Annual Report 2017
CAPITAL RESOURCES AND FUNDING
Funding and Treasury Policy
The Group adopts a prudent funding and treasury policy with regard to its overall business operations. Cash balances are mostly placed on bank deposits, and treasury and yield enhancement products are deployed when circumstances are considered to be appropriate.
Property development projects in Hong Kong are financed partly by internal resources and partly by bank financing. Project financing is normally arranged in local currency to cover a part of the land cost and a major portion or the entire amount of the construction cost, with interest calculated by reference to the interbank offered rates and the loan maturity tied in to the estimated project completion date. Property development projects in the PRC are presently financed by internal resources and proceeds from the presale of the units. Project financing for the projects in the PRC may be arranged in local currency on appropriate terms to cover a part of the land cost and/or construction cost, and with the loan maturity tied in to the estimated project completion date.
The Group’s banking facilities are mostly denominated in Hong Kong dollar with interest primarily determined with reference to interbank offered rates, while its senior unsecured notes are denominated in US dollar and Hong Kong dollar with fixed coupon interest rates. The use of hedging instruments for interest rate purposes to cater to business and operational needs is kept under review by the Group’s management from time to time. As the Hong Kong dollar is pegged to the US dollar, the exchange risks are considered to be insignificant and no currency hedging has been deployed. As regards the Group’s overseas investments and investments in the PRC which are based in currencies other than US dollar and Hong Kong dollar, the Group will consider hedging part or all of the investment amounts into US dollar or Hong Kong dollar to contain the Group’s exposure to currency fluctuation.
Cash Flows
Net cash flows generated from operating activities during the year under review amounted to HK$112.1 million (2016 - HK$1,278.1 million). Net interest payment for the year amounted to HK$306.5 million (2016 - HK$202.5 million).
Borrowings and Gearing
As at 31st December, 2017, the Group had cash and bank balances and deposits of HK$5,039.2 million (2016 - HK$5,319.1 million) and the Group’s borrowings, net of cash and bank balances and deposits, amounted to HK$13,013.9 million (2016 - HK$11,145.0 million).
As at 31st December, 2017, the gearing ratio of the Group was 28.2% (2016 - 26.5%), representing the Group’s borrowings net of cash and bank balances and deposits of HK$13,013.9 million (2016 - HK$11,145.0 million), as compared to the total assets of the Group of HK$46,100.5 million (2016 - HK$41,982.1 million).
On the basis of the adjust total assets as at 31st December, 2017 of HK$53,070.3 million (2016 - HK$46,284.1 million) with the hotel portfolio owned by the RHIHL group in Hong Kong restated at its market value on the basis presented above, the gearing ratio would be 24.5% (2016 - 24.1%).
Details of the maturity profile of the borrowings of the Group as of 31st December, 2017 are shown in notes 33, 34 and 36 to the financial statements.

34
Management Discussion and Analysis (Cont ’d)
Annual Report 2017
Pledge of Assets
As at 31st December, 2017, certain of the Group’s property, plant and equipment, investment properties, properties held for sale, properties under development, available-for-sale investments, financial assets at fair value through profit or loss, held-to-maturity investments, time deposits and bank balances in the total amount of HK$27,144.0 million (2016 - HK$20,405.4 million) were pledged to secure general banking facilities granted to the Group as well as bank guarantees procured by the Group pursuant to certain lease guarantees in connection with the leasing of the hotel properties from Regal REIT. In addition, as at 31st December, 2017, certain ordinary shares in a listed subsidiary with a market value of HK$536.8 million (2016 - HK$370.7 million) were also pledged to secure general banking facilities granted to the Group.
Capital Commitments
Details of the capital commitments of the Group as at 31st December, 2017 are shown in note 48 to the financial statements.
Contingent Liabilities
Details of the contingent liabilities of the Group as at 31st December, 2017 are shown in note 46 to the financial statements.
Share Capital
During the year under review, there was no change in the share capital of the Company.
MATERIAL ACQUISITIONS OR DISPOSALS OF SUBSIDIARIES OR ASSOCIATES
Disposal of Logistics Group
As previously reported, on 30th June, 2017, the Cosmopolitan group entered into a deed of arrangement with the JV Partner for the disposal of its 60% effective interests in the Logistics Group for an aggregate consideration of HK$71.0 million (the “Disposal”). The Disposal was completed on 30th June, 2017 and the companies under the Logistics Group then ceased to be subsidiaries of the Group. Further details relating to the Disposal are mentioned under the section headed “Business Overview” in the preceding Chairman’s Statement, the sub-section headed “Business Review” in this section and note 43(c)(i) to the financial statements.
Acquisition of 50% interest in Prosper Harvest Investments Limited by P&R Holdings Limited
As previously reported, on 23rd May, 2017, a sale and purchase agreement (“S&P Agreement 1”) was entered into between Dragon Pier Investments Limited as the seller and P&R Holdings as the purchaser, relating to the acquisition of the other 50% equity interest in Prosper Harvest Investments Limited (“Prosper Harvest”), in which P&R Holdings held 50% equity interest, held by the seller at a consideration of HK$165.7 million (the “Acquisition”). Upon completion of the Acquisition, Prosper Harvest became a wholly owned subsidiary of P&R Holdings. The principal asset of Prosper Harvest is its interest in the iclub Ma Tau Wai Hotel located at No.8 Ha Heung Road, To Kwa Wan, Kowloon (the “Hotel”) held through its wholly owned subsidiaries. The Hotel has commenced operation under the “iclub by Regal (富薈酒店)” brand.
35
Management Discussion and Analysis (Cont ’d )
Annual Report 2017
The consideration of HK$165.7 million was determined after taking into account the value of the Hotel with reference to its location and specifications and the market conditions regarding the hotel and tourism industry in Hong Kong, the shareholder loan (the “Shareholder Loan”) owing by Prosper Harvest to P&R Holdings on date of completion of the S&P Agreement 1, and the terms of the possible transactions under the Letter of Intent (as referred to below).
Further details relating to the S&P Agreement 1 and the Letter of Intent were disclosed in the joint announcement of the Company dated 23rd May, 2017.
Disposal of 100% interest in Prosper Harvest Investments Limited by P&R Holdings Limited to Regal Real Estate Investment Trust
On 23rd May, 2017, P&R Holdings and Regal Portfolio Management Limited (in its capacity as manager of Regal REIT) executed a letter of intent (the “Letter of Intent”) setting out the principal terms of the possible disposal of the entire share capital of Prosper Harvest and the Shareholder Loan by P&R Holdings to Regal REIT or its designated wholly owned subsidiary.
On 29th June, 2017, a sale and purchase agreement (“S&P Agreement 2”) was entered into between P&R Holdings as vendor and DB Trustee (Hong Kong) Limited (in its capacity as trustee of Regal REIT) (the “Purchaser”), in relation to (i) the disposal of the entire issued share capital of Prosper Harvest; and (ii) the assignment of the Shareholder Loan to the Purchaser, for a consideration of HK$1,360 million (the “Transaction”). The consideration was determined after arm’s length negotiation between the parties taking into account, among others, the valuation of the Hotel of HK$1,400 million as of 23rd June, 2017 as appraised by an independent property valuer, the Shareholder Loan and that the Prosper Harvest group shall not have any liabilities other than the Shareholder Loan at completion of the S&P Agreement 2, and the previous transactions under the Acquisition.
The Transaction under the S&P Agreement 2 was subject to the approval of the independent shareholders of RHIHL and that of the unitholders of Regal REIT. The S&P Agreement 2 was approved by the independent unitholders of Regal REIT at an extraordinary general meeting held on 20th July, 2017. A special general meeting of RHIHL was held on 28th August, 2017 to seek its independent shareholders’ approval for the S&P Agreement 2. After completion of the S&P Agreement 2, Prosper Harvest continues to be a subsidiary of the Company, but held through the RHIHL group instead.
Further details relating to the S&P Agreement 2 were disclosed in the joint announcement of the Company dated 30th June, 2017.
Save as disclosed above, during the year under review, there were no other material acquisitions or disposals of subsidiaries or associates of the Company.
STAFF AND REMUNERATION POLICY
The Group employs approximately 2,330 staff in Hong Kong and the PRC. The Group’s management considers the overall level of staffing employed and the remuneration cost incurred in connection with the Group‘s operations to be compatible with market norm.
Remuneration packages are generally structured by reference to market terms and individual merits. Salaries are normally reviewed on an annual basis based on performance appraisals and other relevant factors. Staff benefit plans maintained by the Group include a mandatory provident fund scheme as well as medical and life insurance for staff in Hong Kong, and the social security fund and the housing provident fund for staff in the PRC.
36
Report of the Directors
Annual Report 2017
The Directors have pleasure in presenting their report together with the audited financial statements of the Company and its subsidiaries for the year ended 31st December, 2017.
PRINCIPAL ACTIVITIES
The principal activity of the Company is that of a holding company. The principal activities of the subsidiaries are property development and investment, construction and building related businesses, hotel ownership business through Regal Real Estate Investment Trust (“Regal REIT”), the listed subsidiary of Regal Hotels International Holdings Limited (“RHIHL”) (a listed subsidiary of the Company), hotel operation and management businesses through RHIHL, asset management of Regal REIT, aircraft ownership and leasing business, and other investments including financial assets investments. There have been no significant changes in the above activities during the year.
The turnover and contribution to trading results by each principal activity are set out in note 4 to the financial statements.
FINANCIAL RESULTS
The results of the Group for the year ended 31st December, 2017 and the Group’s financial position at that date are set out in the financial statements on pages 66 to 181.
BUSINESS REVIEW
Further discussion and review on the business activities of the Group as required by Schedule 5 to the Companies Ordinance (Cap. 622) of Hong Kong, including a description of the principal risks and uncertainties facing the Group material events that have occurred since the year end date and an indication of likely future development in the Group’s business are contained in the preceding Chairman’s Statement and Management Discussion and Analysis set out on pages 5 to 15 and pages 26 to 35, respectively, of this Annual report. These discussions form part of this Report of the Directors. Details of the Group’s financial risk management are disclosed in note 51 to the financial statements.
In addition, relevant details of the Company’s environment policies and performance and key relationships with employees, customers and suppliers will be reported in the Environmental, Social and Governance Report of the Company to be published separately. The Directors were not aware of any non-compliance with the relevant laws and regulations that have a significant impact on the Group during the year.
DIVIDENDS
An interim dividend of HK0.65 cent (2016 - HK0.63 cent) per ordinary share, absorbing a total amount of approximately HK$20.8 million (2016 - HK$20.2 million), was paid to holders of ordinary shares during the year.
The Directors have resolved to recommend the payment of a final dividend of HK1.70 cents (2016 - HK1.37 cents) per ordinary share for the year ended 31st December, 2017. This proposed final dividend will absorb an amount of approximately HK$54.5 million (2016 - HK$43.9 million) and will be payable to the holders of ordinary shares on the Register of Ordinary Shareholders on 12th June, 2018.
Together with the interim dividend of HK0.65 cent (2016 - HK0.63 cent) per oridinary share paid in October, 2017, total dividends per oridiary share for the year ended 31st December, 2017 will amount to HK2.35 cents (2016 - HK2.00 cents).

37
Report of the Directors (Cont’d)
Annual Report 2017
ANNUAL GENERAL MEETING
The 2018 Annual General Meeting of the Company will be convened to be held on Monday, 4th June, 2018. Relevant notice of the Meeting will be contained in the circular of the Company relating to the re-election of Directors and the general mandates to issue and repurchase ordinary shares (the “Circular”) to be sent to the shareholders, together with this Annual Report.
CLOSURE OF REGISTER
The Register of Ordinary Shareholders of the Company will be closed during the following periods, and no transfers of shares will be effected during such periods:
(i) from Wednesday, 30th May, 2018 to Monday, 4th June, 2018, both days inclusive, for the purpose of ascertaining shareholders’ entitlement to attend and vote at the 2018 Annual General Meeting. In order to be entitled to attend and vote at the 2018 Annual General Meeting, all transfers of ordinary shares, duly accompanied by the relevant share certificates, must be lodged with the Company’s branch registrar in Hong Kong, Tricor Tengis Limited (the “Branch Registrar”), no later than 4:30 p.m. on Tuesday, 29th May, 2018; and
(ii) from Friday, 8th June, 2018 to Tuesday, 12th June, 2018, both days inclusive, for the purpose of ascertaining shareholders’ entitlement to the proposed final dividend. In order to qualify for the proposed final dividend, all transfers of ordinary shares, duly accompanied by the relevant share certificates, must be lodged with the Branch Registrar no later than 4:30 p.m. on Thursday, 7th June, 2018.
The relevant dividend warrants for the aforesaid final dividend are expected to be despatched on or about 27th June, 2018.
DIRECTORS
The Directors of the Company are:
Mr. Lo Yuk SuiMr. Jimmy Lo Chun To Miss Lo Po ManMr. Kenneth Ng Kwai Kai Mr. Anthony ChuangMr. Donald Fan Tung Mr. Kelvin Leung So Po Ms. Winnie Ng, JPMr. Wong Chi Keung
During the year, there have been no changes in the Directors of the Company.
Subsequent to the reporting period, on 1st January, 2018, Mr. Ng Siu Chan resigned as an Independent Non-Executive Director and Ms. Winnie Ng was appointed as an Independent Non-Executive Director.

38
Report of the Directors (Cont’d)
Annual Report 2017
In accordance with Bye-law 109(A) of the Bye-laws of the Company, the following Directors will retire from office by rotation at the 2018 Annual General Meeting:
(i) Mr. Anthony Chuang (Independent Non-Executive Director);
(ii) Mr. Donald Fan Tung (Executive Director); and
(iii) Mr. Kelvin Leung So Po (Executive Director).
In accordance with Bye-law 100 of the Bye-laws of the Company, Ms. Winnie Ng, who was appointed subsequent to the last annual general meeting of the Company held on 7th June, 2017, shall hold office until the 2018 Annual General Meeting.
All the above retiring Directors, being eligible, have offered themselves for re-election at the 2018 Annual General Meeting. Details of these Directors, which are required to be disclosed pursuant to Rules 13.51(2) and 13.74 of the Rules Governing the Listing of Securities on The Stock Exchange of Hong Kong Limited (the “Stock Exchange”) (the “Listing Rules”), will be set out in the Circular.
The Company has received from each of the three incumbent Independent Non-Executive Directors an annual confirmation of independence as required under Rule 3.13 of the Listing Rules. The Company considers that all of these Independent Non-Executive Directors are independent.
DIRECTORS’ INTERESTS IN TRANSACTIONS, ARRANGEMENTS OR CONTRACTS
Save as otherwise disclosed, none of the Directors of the Company nor a connected entity of the Directors had any beneficial interests, whether direct or indirect, in any significant transactions, arrangements or contracts to which the Company or any of its subsidiaries was a party at the end of the reporting period or at any time during the year.
None of the Directors had any service contract, which is not determinable by the employer within one year without payment of compensation (other than statutory compensation), with the Company or any of its subsidiaries during the year.
At no time during the year was the Company or any of its subsidiaries a party to any arrangement whose objects are to enable a Director to acquire benefits by means of the acquisition of shares in or debentures of the Company or any other body corporate.
PERMITTED INDEMNITY PROVISION
A permitted indemnity provision for the benefit of the Directors is currently in force and was in force throughout the year. The Company has taken out and maintained directors’ liability insurance that provides appropriate cover for the Directors.

39
Report of the Directors (Cont’d)
Annual Report 2017
DIRECTORS’ INTERESTS IN SHARE CAPITAL
As at 31st December, 2017, the interests and short positions of the Directors and chief executive of the Company in the shares, underlying shares and debentures of the Company or any associated corporation (within the meaning of Part XV of the Securities and Futures Ordinance (“SFO“)) of the Company, which (a) are as recorded in the register required to be kept under section 352 of the SFO; or (b) are as otherwise notified to the Company and the Stock Exchange pursuant to the Model Code for Securities Transactions by Directors of Listed Issuers (the “Model Code“) as set out in Appendix 10 of the Listing Rules, were as follows:
Number of shares held
The Company/Name of associated corporation
Name of Director
Class of shares held
Personal interests
Corporateinterests
Family/Otherinterests
Total (Approximate
percentage of the
issued shares as at 31st
December, 2017)
1. The Company Mr. Lo Yuk Sui Ordinary 110,667,396 1,769,164,691 380,683 1,880,212,770(issued) (Note a) (58.69%)
Mr. Jimmy Lo Chun To
Ordinary(issued)
251,735 – – 251,735(0.008%)
Miss Lo Po Man Ordinary (issued)
112,298 – – 112,298(0.004%)
Mr. Kelvin Leung So Po
Ordinary(issued)
4,000 – – 4,000(0.000%)
Mr. Ng Siu Chan(Note ac)
Ordinary(issued)
– – 3,521,973 3,521,973(0.11%)
2. Paliburg Holdings Limited (“PHL”)
Mr. Lo Yuk Sui Ordinary(issued)
90,078,014 740,860,803(Note b)
15,000 830,953,817(74.55%)
Mr. Jimmy Lo Chun To
Ordinary(issued)
2,274,600 – – 2,274,600(0.20%)
Miss Lo Po Man Ordinary(issued)
1,116,000 – – 1,116,000(0.10%)
Mr. Kenneth Ng Kwai Kai
Ordinary(issued)
176,200 – – 176,200(0.02%)
Mr. Donald Fan Tung
Ordinary(issued)
556 – – 556(0.000%)
Mr. Kelvin Leung So Po
Ordinary(issued)
50,185 – – 50,185(0.005%)

40
Report of the Directors (Cont’d)
Annual Report 2017
Number of shares held
The Company/Name of associated corporation
Name of Director
Class of shares held
Personal interests
Corporate interests
Family/Otherinterests
Total (Approximate
percentage of the
issued shares as at 31st
December, 2017)
2. PHL Mr. Ng Siu Chan(Note ac)
Ordinary(issued)
– – 80,474 80,474(0.007%)
3. RHIHL Mr. Lo Yuk Sui Ordinary(issued)
24,200 622,855,261(Note c)
260,700 623,140,161(68.01%)
Miss Lo Po Man Ordinary(issued)
300,000 – 269,169 (Note d)
569,169(0.06%)
Mr. Kelvin Leung So Po
Ordinary(issued)
200 – – 200 (0.000%)
4. Cosmopolitan International Holdings Limited (“Cosmopolitan”)
Mr. Lo Yuk Sui Ordinary(i) (issued)
– 3,267,616,716(Note e)
– 3,267,616,716
(ii) (unissued) – 5,024,058,784 (Note f)
– 5,024,058,784
Total: 8,291,675,500
(187.86%)
Preference(issued)
– 2,345,487,356(Note f)
– 2,345,487,356(99.99%)
Mr. Jimmy Lo Chun To
Ordinary(issued)
2,269,101 – – 2,269,101 (0.05%)
Miss Lo Po Man Ordinary (issued)
1,380,000 – – 1,380,000 (0.03%)
5. Regal REIT Mr. Lo Yuk Sui Units(issued)
– 2,443,033,102 (Note g)
– 2,443,033,102 (74.99%)
6. 8D International (BVI) Limited
Mr. Lo Yuk Sui Ordinary(issued)
– 1,000 (Note h)
– 1,000 (100%)
7. 8D Matrix Limited Mr. Lo Yuk Sui Ordinary(issued)
– 2,000,000 (Note i)
– 2,000,000 (100%)
8. 8D International Limited
Mr. Lo Yuk Sui Ordinary(issued)
– 500,000(Note j)
– 500,000 (100%)

41
Report of the Directors (Cont’d)
Annual Report 2017
Number of shares held
The Company/Name of associated corporation
Name of Director
Class of shares held
Personal interests
Corporate interests
Family/Otherinterests
Total (Approximate
percentage of the
issued shares as at 31st
December, 2017)
9. 8D International (China) Limited
Mr. Lo Yuk Sui Ordinary (issued)
– 1 (Note k)
– 1(100%)
10. Century Digital Communications (BVI) Limited
Mr. Lo Yuk Sui Ordinary (issued)
– 1(Note l)
– 1(100%)
11. Century Digital Communications Limited
Mr. Lo Yuk Sui Ordinary (issued)
– 2 (Note m)
– 2(100%)
12. Century Digital Enterprise Limited
Mr. Lo Yuk Sui Ordinary (issued)
– 100(Note n)
– 100(100%)
13. Century Digital Holdings Limited
Mr. Lo Yuk Sui Ordinary (issued)
– 3 (Note o)
– 3(100%)
14. Century Digital Investments Limited
Mr. Lo Yuk Sui Ordinary (issued)
– 49,968(Note p)
– 49,968 (99.94%)
15. China Noble Investments Limited
Mr. Lo Yuk Sui Ordinary (issued)
– 1(Note q)
– 1(100%)
16. Full Range Technology Limited
Mr. Lo Yuk Sui Ordinary (issued)
– 10,000(Note r)
– 10,000(100%)
17. Giant Forward Holdings Limited
Mr. Lo Yuk Sui Ordinary (issued)
– 1(Note s)
– 1(100%)
18. Grand Modern Investments Limited
Mr. Lo Yuk Sui Ordinary (issued)
– 330(Note t)
– 330(100%)
19. Important Holdings Limited
Mr. Lo Yuk Sui Ordinary (issued)
– 10,000(Note u)
– 10,000(100%)
20. Net Age Technology Limited
Mr. Lo Yuk Sui Ordinary (issued)
– 97(Note v)
– 97(100%)

42
Report of the Directors (Cont’d)
Annual Report 2017
Number of shares held
The Company/Name of associated corporation
Name of Director
Class of shares held
Personal interests
Corporate interests
Family/Otherinterests
Total (Approximate
percentage of the
issued shares as at 31st
December, 2017)
21. Net Community Limited
Mr. Lo Yuk Sui Ordinary(issued)
– 3(Note w)
– 3 (100%)
22. Pilot Pro Holdings Limited
Mr. Lo Yuk Sui Ordinary (issued)
– 1(Note x)
– 1 (100%)
23. Speedway Technology Limited
Mr. Lo Yuk Sui Ordinary (issued)
– 50,000(Note y)
– 50,000 (100%)
24. Task Master Technology Limited
Mr. Lo Yuk Sui Ordinary (issued)
– 1(Note z)
– 1 (100%)
25. Top Technologies Limited
Mr. Lo Yuk Sui Ordinary (issued)
– 10,000(Note aa)
– 10,000 (100%)
26. Treasure Collection International Limited
Mr. Lo Yuk Sui Ordinary (issued)
– 2(Note ab)
– 2 (100%)
Notes:
(a) The interests in 1,769,164,691 issued ordinary shares of the Company were held through companies wholly owned by Mr. Lo Yuk Sui (“Mr. Lo”).
(b) The interests in 694,124,547 issued ordinary shares of PHL were held through companies wholly owned by the Company, in which Mr. Lo held 58.67% shareholding interests.
The interests in 16,271,685 issued ordinary shares of PHL were held through corporations controlled by Mr. Lo as detailed below:
Name of corporation Controlled by % of control
Wealth Master International Limited Mr. Lo 90.00Select Wise Holdings Limited Wealth Master International Limited 100.00
The interests in 30,464,571 issued ordinary shares of PHL were held through corporations controlled by Mr. Lo as detailed below:
Name of corporation Controlled by % of control
Wealth Master International Limited Mr. Lo 90.00Select Wise Holdings Limited Wealth Master International Limited 100.00Splendid All Holdings Limited Select Wise Holdings Limited 100.00

43
Report of the Directors (Cont’d)
Annual Report 2017
(c) The interests in 421,400 issued ordinary shares of RHIHL were held through companies wholly owned by the Company, in which Mr. Lo held 58.67% shareholding interests. The interests in 599,025,861 issued ordinary shares of RHIHL were held through companies wholly owned by PHL, in which the Company held 62.28% shareholding interests. The interests in the other 23,408,000 issued ordinary shares of RHIHL were held through a wholly owned subsidiary of Cosmopolitan, in which P&R Holdings Limited (“P&R Holdings”) (which is owned as to 50% each by PHL and RHIHL through their respective wholly owned subsidiaries) held 62.33% shareholding interests. PHL held 69.25% shareholding interests in RHIHL.
(d) The interests in 269,169 issued ordinary shares of RHIHL were held by Miss Lo Po Man as the beneficiary of a trust.
(e) The interests in 2,751,176,716 issued ordinary shares of Cosmopolitan were held through wholly owned subsidiaries of P&R Holdings, which is owned as to 50% each by PHL and RHIHL through their respective wholly owned subsidiaries. The interests in the other 516,440,000 issued ordinary shares of Cosmopolitan were held through wholly owned subsidiaries of RHIHL. PHL, in which the Company held 62.28% shareholding interests, held 69.25% shareholding interests in RHIHL. Mr. Lo held 58.67% shareholding interests in the Company.
(f) The interests in 5,024,058,784 unissued ordinary shares of Cosmopolitan were held through wholly owned subsidiaries of P&R Holdings, which is owned as to 50% each by PHL and RHIHL through their respective wholly owned subsidiaries. PHL, in which the Company held 62.28% shareholding interests, held 69.25% shareholding interests in RHIHL. Mr. Lo held 58.67% shareholding interests in the Company.
The interests in 2,345,487,356 unissued ordinary shares of Cosmopolitan are derivative interests held through interests in 2,345,487,356 convertible preference shares of Cosmopolitan, convertible into new ordinary shares of Cosmopolitan on a one to one basis (subject to adjustments in accordance with the terms of the convertible preference shares).
The interests in 1,428,571,428 unissued ordinary shares of Cosmopolitan are derivative interests held through interests in the convertible bonds in the principal amount of HK$500,000,000 issued by a wholly owned subsidiary of Cosmopolitan (the “CB Issuer”). The convertible bonds are convertible into new ordinary shares of Cosmopolitan at a conversion price of HK$0.35 per ordinary share (subject to adjustments in accordance with the terms of the convertible bonds).
The interests in 1,250,000,000 unissued ordinary shares of Cosmopolitan are derivative interests held through interests in convertible bonds in a principal amount of HK$500,000,000 issued by the CB Issuer. The convertible bonds are convertible into new ordinary shares of Cosmopolitan at a conversion price of HK$0.40 per ordinary share (subject to adjustments in accordance with the terms of the convertible bonds).
(g) The interests in 10,219,000 issued units of Regal REIT were held through a wholly owned subsidiary of Cosmopolitan. The interests in 2,429,394,739 issued units of Regal REIT were held through wholly owned subsidiaries of RHIHL. The interests in 732,363 issued units of Regal REIT were held through wholly owned subsidiaries of PHL. The interests in 2,687,000 issued units of Regal REIT were held through wholly owned subsidiaries of the Company. Cosmopolitan was held as to 62.33% shareholding interests by P&R Holdings, which is owned as to 50% each by PHL and RHIHL through their respective wholly owned subsidiaries. PHL, in which the Company held 62.28% shareholding interests, held 69.25% shareholding interests in RHIHL. Mr. Lo held 58.67% shareholding interests in the Company.
(h) 400 shares were held through companies controlled by the Company, in which Mr. Lo held 58.67% shareholding interests, and 600 shares were held through a company controlled by Mr. Lo.
(i) 800,000 shares were held through companies controlled by the Company, in which Mr. Lo held 58.67% shareholding interests, and 1,200,000 shares were held through companies controlled by Mr. Lo (including 8D International (BVI) Limited).
44
Report of the Directors (Cont’d)
Annual Report 2017
(j) The interests in these shares of 8D International Limited were held through corporations controlled by Mr. Lo as detailed below:
(a) Name of corporation Controlled by % of control
Century City International Holdings Limited (“CCIHL”)
Mr. Lo 58.67
Century City BVI Holdings Limited CCIHL 100.008D International (BVI) Limited Century City BVI Holdings Limited 40.00Task Master Technology Limited 8D International (BVI) Limited 100.00Important Holdings Limited Task Master Technology Limited 33.338D Matrix Limited Century City BVI Holdings Limited 40.00
(b) Name of corporation Controlled by % of control
Manyways Technology Limited Mr. Lo 100.008D International (BVI) Limited Manyways Technology Limited 60.00Task Master Technology Limited 8D International (BVI) Limited 100.00Important Holdings Limited Task Master Technology Limited 33.33Secure Way Technology Limited Mr. Lo 100.00Important Holdings Limited Secure Way Technology Limited 66.678D Matrix Limited Important Holdings Limited 60.00
(k) The interest in the share of 8D International (China) Limited was held through corporations controlled by Mr. Lo as detailed below:
(a) Name of corporation Controlled by % of control
CCIHL Mr. Lo 58.67Century City BVI Holdings Limited CCIHL 100.008D International (BVI) Limited Century City BVI Holdings Limited 40.00Task Master Technology Limited 8D International (BVI) Limited 100.00Important Holdings Limited Task Master Technology Limited 33.338D Matrix Limited Century City BVI Holdings Limited 40.00
(b) Name of corporation Controlled by % of control
Manyways Technology Limited Mr. Lo 100.008D International (BVI) Limited Manyways Technology Limited 60.00Task Master Technology Limited 8D International (BVI) Limited 100.00Important Holdings Limited Task Master Technology Limited 33.33Secure Way Technology Limited Mr. Lo 100.00Important Holdings Limited Secure Way Technology Limited 66.678D Matrix Limited Important Holdings Limited 60.00

45
Report of the Directors (Cont’d)
Annual Report 2017
(l) The interest in the share of Century Digital Communications (BVI) Limited was held through corporations controlled by Mr. Lo as detailed below:
(a) Name of corporation Controlled by % of control
CCIHL Mr. Lo 58.67Century City BVI Holdings Limited CCIHL 100.008D International (BVI) Limited Century City BVI Holdings Limited 40.00Task Master Technology Limited 8D International (BVI) Limited 100.00Important Holdings Limited Task Master Technology Limited 33.33
(b) Name of corporation Controlled by % of control
Manyways Technology Limited Mr. Lo 100.008D International (BVI) Limited Manyways Technology Limited 60.00Task Master Technology Limited 8D International (BVI) Limited 100.00Important Holdings Limited Task Master Technology Limited 33.33Secure Way Technology Limited Mr. Lo 100.00Important Holdings Limited Secure Way Technology Limited 66.67
(m) The interests in these shares of Century Digital Communications Limited were held through corporations controlled by Mr. Lo as detailed below:
(a) Name of corporation Controlled by % of control
CCIHL Mr. Lo 58.67Century City BVI Holdings Limited CCIHL 100.008D International (BVI) Limited Century City BVI Holdings Limited 40.00Task Master Technology Limited 8D International (BVI) Limited 100.00Important Holdings Limited Task Master Technology Limited 33.33Century Digital Communications (BVI) Limited
Important Holdings Limited 100.00
(b) Name of corporation Controlled by % of control
Manyways Technology Limited Mr. Lo 100.008D International (BVI) Limited Manyways Technology Limited 60.00Task Master Technology Limited 8D International (BVI) Limited 100.00Important Holdings Limited Task Master Technology Limited 33.33Secure Way Technology Limited Mr. Lo 100.00Important Holdings Limited Secure Way Technology Limited 66.67Century Digital Communications (BVI) Limited
Important Holdings Limited 100.00

46
Report of the Directors (Cont’d)
Annual Report 2017
(n) The interests in these shares of Century Digital Enterprise Limited were held through corporations controlled by Mr. Lo as detailed below:
(a) Name of corporation Controlled by % of control
CCIHL Mr. Lo 58.67Century City BVI Holdings Limited CCIHL 100.008D International (BVI) Limited Century City BVI Holdings Limited 40.00Task Master Technology Limited 8D International (BVI) Limited 100.00Important Holdings Limited Task Master Technology Limited 33.33Century Digital Investments Limited Important Holdings Limited 99.93
(b) Name of corporation Controlled by % of control
Manyways Technology Limited Mr. Lo 100.008D International (BVI) Limited Manyways Technology Limited 60.00Task Master Technology Limited 8D International (BVI) Limited 100.00Important Holdings Limited Task Master Technology Limited 33.33Secure Way Technology Limited Mr. Lo 100.00Important Holdings Limited Secure Way Technology Limited 66.67Century Digital Investments Limited Important Holdings Limited 99.93
(o) The interests in these shares of Century Digital Holdings Limited were held through corporations wholly owned by Mr. Lo.
(p) The interests in these shares of Century Digital Investments Limited were held through corporations controlled by Mr. Lo as detailed below:
(a) Name of corporation Controlled by % of control
CCIHL Mr. Lo 58.67Century City BVI Holdings Limited CCIHL 100.008D International (BVI) Limited Century City BVI Holdings Limited 40.00Task Master Technology Limited 8D International (BVI) Limited 100.00Important Holdings Limited Task Master Technology Limited 33.33
(b) Name of corporation Controlled by % of control
Manyways Technology Limited Mr. Lo 100.008D International (BVI) Limited Manyways Technology Limited 60.00Task Master Technology Limited 8D International (BVI) Limited 100.00Important Holdings Limited Task Master Technology Limited 33.33Secure Way Technology Limited Mr. Lo 100.00Important Holdings Limited Secure Way Technology Limited 66.67

47
Report of the Directors (Cont’d)
Annual Report 2017
(q) The interest in the share of China Noble Investments Limited was held through corporations controlled by Mr. Lo as detailed below:
(a) Name of corporation Controlled by % of control
CCIHL Mr. Lo 58.67Century City BVI Holdings Limited CCIHL 100.008D International (BVI) Limited Century City BVI Holdings Limited 40.00Task Master Technology Limited 8D International (BVI) Limited 100.00Important Holdings Limited Task Master Technology Limited 33.338D Matrix Limited Important Holdings Limited 60.008D Matrix Limited Century City BVI Holdings Limited 40.00Pilot Pro Holdings Limited 8D Matrix Limited 100.00
(b) Name of corporation Controlled by % of control
Manyways Technology Limited Mr. Lo 100.008D International (BVI) Limited Manyways Technology Limited 60.00Task Master Technology Limited 8D International (BVI) Limited 100.00Important Holdings Limited Task Master Technology Limited 33.33Secure Way Technology Limited Mr. Lo 100.00Important Holdings Limited Secure Way Technology Limited 66.678D Matrix Limited Important Holdings Limited 60.00Pilot Pro Holdings Limited 8D Matrix Limited 100.00
(r) The interests in these shares of Full Range Technology Limited were held through corporations controlled by Mr. Lo as detailed below:
(a) Name of corporation Controlled by % of control
CCIHL Mr. Lo 58.67Century City BVI Holdings Limited CCIHL 100.008D International (BVI) Limited Century City BVI Holdings Limited 40.00Task Master Technology Limited 8D International (BVI) Limited 100.00Important Holdings Limited Task Master Technology Limited 33.33
(b) Name of corporation Controlled by % of control
Manyways Technology Limited Mr. Lo 100.008D International (BVI) Limited Manyways Technology Limited 60.00Task Master Technology Limited 8D International (BVI) Limited 100.00Important Holdings Limited Task Master Technology Limited 33.33Secure Way Technology Limited Mr. Lo 100.00Important Holdings Limited Secure Way Technology Limited 66.67

48
Report of the Directors (Cont’d)
Annual Report 2017
(s) The interest in the share of Giant Forward Holdings Limited was held through corporations controlled by Mr. Lo as detailed below:
(a) Name of corporation Controlled by % of control
CCIHL Mr. Lo 58.67Century City BVI Holdings Limited CCIHL 100.008D International (BVI) Limited Century City BVI Holdings Limited 40.00Task Master Technology Limited 8D International (BVI) Limited 100.00Important Holdings Limited Task Master Technology Limited 33.338D Matrix Limited Important Holdings Limited 60.008D Matrix Limited Century City BVI Holdings Limited 40.00
(b) Name of corporation Controlled by % of control
Manyways Technology Limited Mr. Lo 100.008D International (BVI) Limited Manyways Technology Limited 60.00Task Master Technology Limited 8D International (BVI) Limited 100.00Important Holdings Limited Task Master Technology Limited 33.33Secure Way Technology Limited Mr. Lo 100.00Important Holdings Limited Secure Way Technology Limited 66.678D Matrix Limited Important Holdings Limited 60.00
(t) The interests in these shares of Grand Modern Investments Limited were held through corporations wholly owned by Mr. Lo.
(u) The interests in these shares of Important Holdings Limited were held through corporations controlled by Mr. Lo as detailed below:
(a) Name of corporation Controlled by % of control
CCIHL Mr. Lo 58.67Century City BVI Holdings Limited CCIHL 100.008D International (BVI) Limited Century City BVI Holdings Limited 40.00Task Master Technology Limited 8D International (BVI) Limited 100.00
(b) Name of corporation Controlled by % of control
Manyways Technology Limited Mr. Lo 100.008D International (BVI) Limited Manyways Technology Limited 60.00Task Master Technology Limited 8D International (BVI) Limited 100.00Secure Way Technology Limited Mr. Lo 100.00
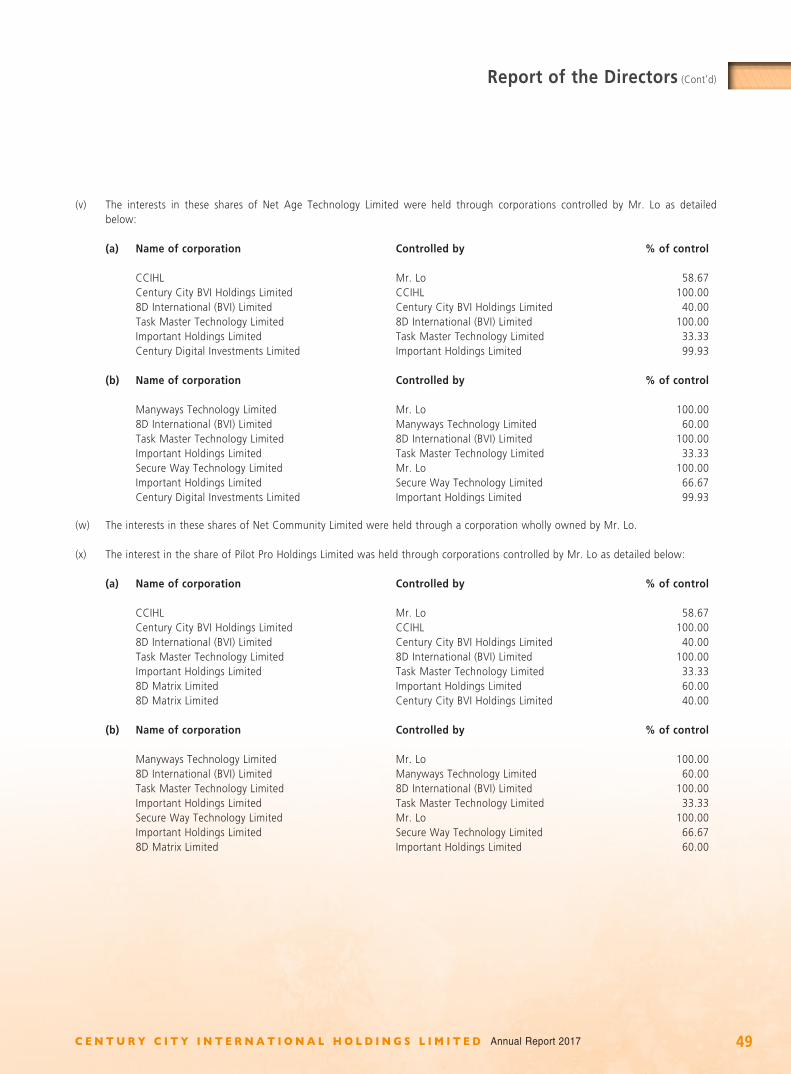
49
Report of the Directors (Cont’d)
Annual Report 2017
(v) The interests in these shares of Net Age Technology Limited were held through corporations controlled by Mr. Lo as detailed below:
(a) Name of corporation Controlled by % of control
CCIHL Mr. Lo 58.67Century City BVI Holdings Limited CCIHL 100.008D International (BVI) Limited Century City BVI Holdings Limited 40.00Task Master Technology Limited 8D International (BVI) Limited 100.00Important Holdings Limited Task Master Technology Limited 33.33Century Digital Investments Limited Important Holdings Limited 99.93
(b) Name of corporation Controlled by % of control
Manyways Technology Limited Mr. Lo 100.008D International (BVI) Limited Manyways Technology Limited 60.00Task Master Technology Limited 8D International (BVI) Limited 100.00Important Holdings Limited Task Master Technology Limited 33.33Secure Way Technology Limited Mr. Lo 100.00Important Holdings Limited Secure Way Technology Limited 66.67Century Digital Investments Limited Important Holdings Limited 99.93
(w) The interests in these shares of Net Community Limited were held through a corporation wholly owned by Mr. Lo.
(x) The interest in the share of Pilot Pro Holdings Limited was held through corporations controlled by Mr. Lo as detailed below:
(a) Name of corporation Controlled by % of control
CCIHL Mr. Lo 58.67Century City BVI Holdings Limited CCIHL 100.008D International (BVI) Limited Century City BVI Holdings Limited 40.00Task Master Technology Limited 8D International (BVI) Limited 100.00Important Holdings Limited Task Master Technology Limited 33.338D Matrix Limited Important Holdings Limited 60.008D Matrix Limited Century City BVI Holdings Limited 40.00
(b) Name of corporation Controlled by % of control
Manyways Technology Limited Mr. Lo 100.008D International (BVI) Limited Manyways Technology Limited 60.00Task Master Technology Limited 8D International (BVI) Limited 100.00Important Holdings Limited Task Master Technology Limited 33.33Secure Way Technology Limited Mr. Lo 100.00Important Holdings Limited Secure Way Technology Limited 66.678D Matrix Limited Important Holdings Limited 60.00
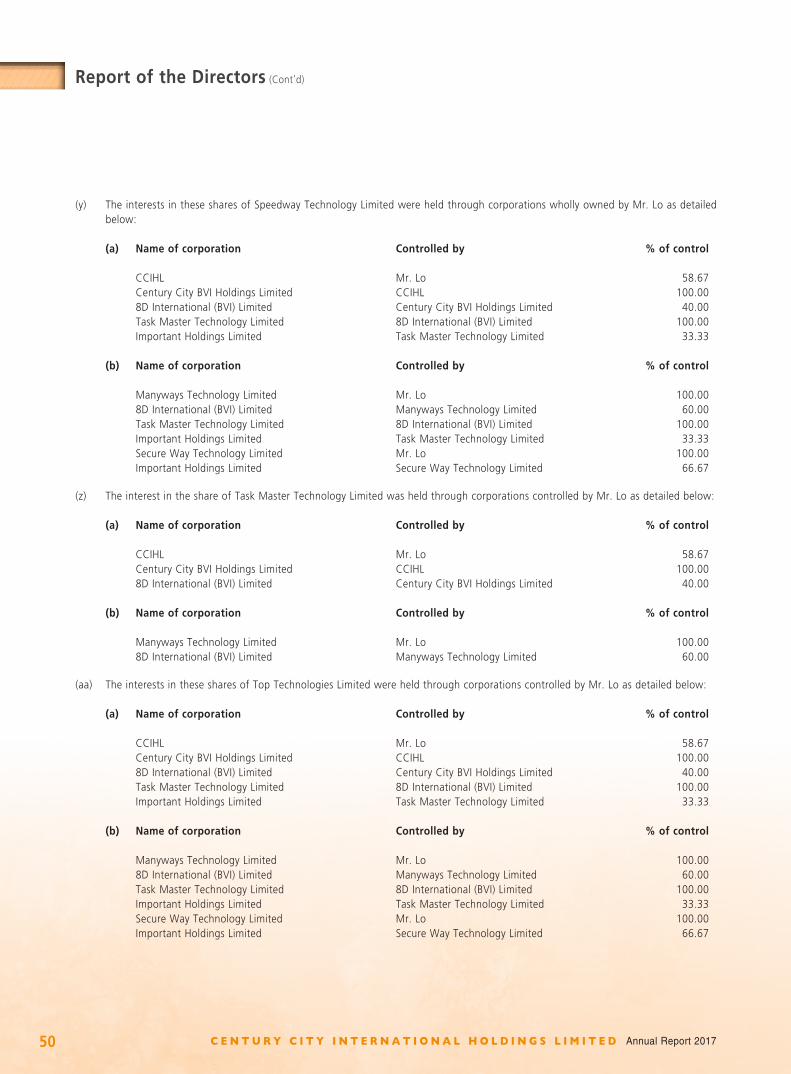
50
Report of the Directors (Cont’d)
Annual Report 2017
(y) The interests in these shares of Speedway Technology Limited were held through corporations wholly owned by Mr. Lo as detailed below:
(a) Name of corporation Controlled by % of control
CCIHL Mr. Lo 58.67Century City BVI Holdings Limited CCIHL 100.008D International (BVI) Limited Century City BVI Holdings Limited 40.00Task Master Technology Limited 8D International (BVI) Limited 100.00Important Holdings Limited Task Master Technology Limited 33.33
(b) Name of corporation Controlled by % of control
Manyways Technology Limited Mr. Lo 100.008D International (BVI) Limited Manyways Technology Limited 60.00Task Master Technology Limited 8D International (BVI) Limited 100.00Important Holdings Limited Task Master Technology Limited 33.33Secure Way Technology Limited Mr. Lo 100.00Important Holdings Limited Secure Way Technology Limited 66.67
(z) The interest in the share of Task Master Technology Limited was held through corporations controlled by Mr. Lo as detailed below:
(a) Name of corporation Controlled by % of control
CCIHL Mr. Lo 58.67Century City BVI Holdings Limited CCIHL 100.008D International (BVI) Limited Century City BVI Holdings Limited 40.00
(b) Name of corporation Controlled by % of control
Manyways Technology Limited Mr. Lo 100.008D International (BVI) Limited Manyways Technology Limited 60.00
(aa) The interests in these shares of Top Technologies Limited were held through corporations controlled by Mr. Lo as detailed below:
(a) Name of corporation Controlled by % of control
CCIHL Mr. Lo 58.67Century City BVI Holdings Limited CCIHL 100.008D International (BVI) Limited Century City BVI Holdings Limited 40.00Task Master Technology Limited 8D International (BVI) Limited 100.00Important Holdings Limited Task Master Technology Limited 33.33
(b) Name of corporation Controlled by % of control
Manyways Technology Limited Mr. Lo 100.008D International (BVI) Limited Manyways Technology Limited 60.00Task Master Technology Limited 8D International (BVI) Limited 100.00Important Holdings Limited Task Master Technology Limited 33.33Secure Way Technology Limited Mr. Lo 100.00Important Holdings Limited Secure Way Technology Limited 66.67

51
Report of the Directors (Cont’d)
Annual Report 2017
(ab) The interests in these shares of Treasure Collection International Limited were held through corporations controlled by Mr. Lo as detailed below:
(a) Name of corporation Controlled by % of control
CCIHL Mr. Lo 58.67Century City BVI Holdings Limited CCIHL 100.008D International (BVI) Limited Century City BVI Holdings Limited 40.00Task Master Technology Limited 8D International (BVI) Limited 100.00Important Holdings Limited Task Master Technology Limited 33.338D Matrix Limited Important Holdings Limited 60.008D Matrix Limited Century City BVI Holdings Limited 40.00Giant Forward Holdings Limited 8D Matrix Limited 100.00
(b) Name of corporation Controlled by % of control
Manyways Technology Limited Mr. Lo 100.008D International (BVI) Limited Manyways Technology Limited 60.00Task Master Technology Limited 8D International (BVI) Limited 100.00Important Holdings Limited Task Master Technology Limited 33.33Secure Way Technology Limited Mr. Lo 100.00Important Holdings Limited Secure Way Technology Limited 66.678D Matrix Limited Important Holdings Limited 60.00Giant Forward Holdings Limited 8D Matrix Limited 100.00
(ac) Mr. Ng Siu Chan resigned as an Independent Non-Executive Director of the Company with effect from 1st January, 2018.
Save as disclosed herein, as at 31st December, 2017, none of the Directors and chief executive of the Company had any interests and short positions in the shares, underlying shares and debentures of the Company or any associated corporation (within the meaning of Part XV of the SFO) of the Company, which (a) are required, pursuant to section 352 of the SFO, to be entered in the register referred to therein; or (b) are required, pursuant to the Model Code to be notified to the Company and the Stock Exchange.
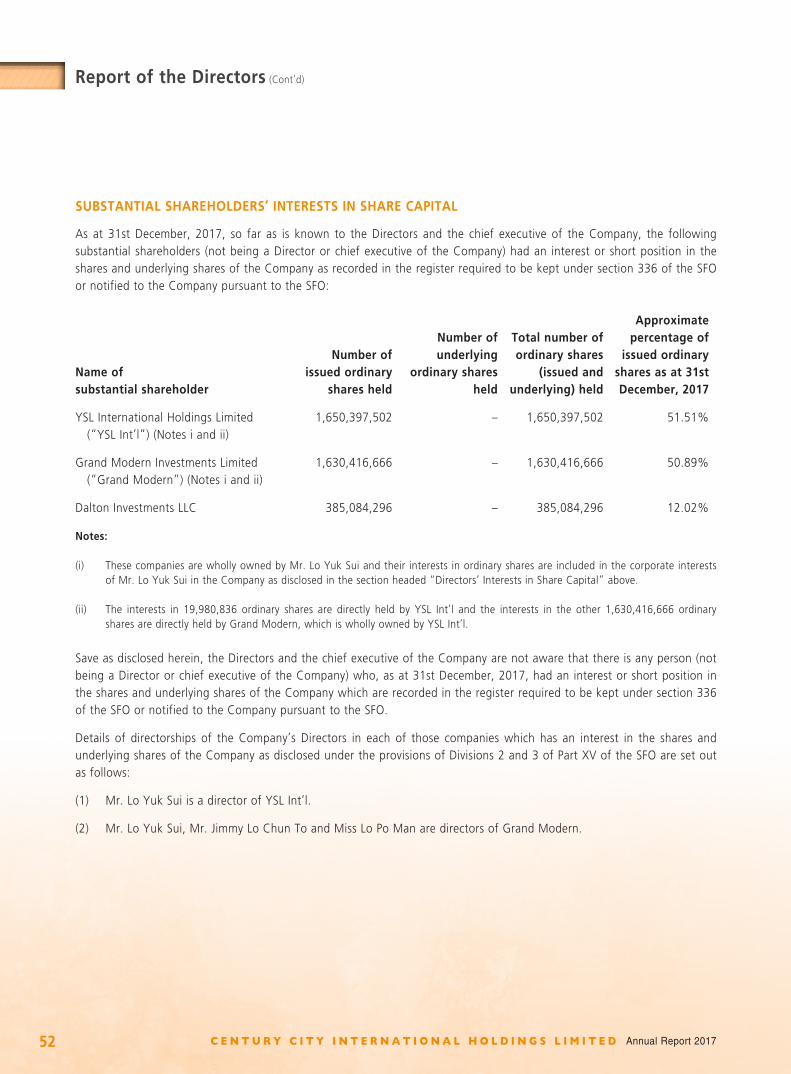
52
Report of the Directors (Cont’d)
Annual Report 2017
SUBSTANTIAL SHAREHOLDERS’ INTERESTS IN SHARE CAPITAL
As at 31st December, 2017, so far as is known to the Directors and the chief executive of the Company, the following substantial shareholders (not being a Director or chief executive of the Company) had an interest or short position in the shares and underlying shares of the Company as recorded in the register required to be kept under section 336 of the SFO or notified to the Company pursuant to the SFO:
Name of substantial shareholder
Number ofissued ordinary
shares held
Number ofunderlying
ordinary sharesheld
Total number ofordinary shares
(issued andunderlying) held
Approximatepercentage of
issued ordinaryshares as at 31st December, 2017
YSL International Holdings Limited (“YSL Int’l”) (Notes i and ii)
1,650,397,502 – 1,650,397,502 51.51%
Grand Modern Investments Limited (“Grand Modern”) (Notes i and ii)
1,630,416,666 – 1,630,416,666 50.89%
Dalton Investments LLC 385,084,296 – 385,084,296 12.02%
Notes:
(i) These companies are wholly owned by Mr. Lo Yuk Sui and their interests in ordinary shares are included in the corporate interests of Mr. Lo Yuk Sui in the Company as disclosed in the section headed “Directors’ Interests in Share Capital” above.
(ii) The interests in 19,980,836 ordinary shares are directly held by YSL Int’l and the interests in the other 1,630,416,666 ordinary shares are directly held by Grand Modern, which is wholly owned by YSL Int’l.
Save as disclosed herein, the Directors and the chief executive of the Company are not aware that there is any person (not being a Director or chief executive of the Company) who, as at 31st December, 2017, had an interest or short position in the shares and underlying shares of the Company which are recorded in the register required to be kept under section 336 of the SFO or notified to the Company pursuant to the SFO.
Details of directorships of the Company’s Directors in each of those companies which has an interest in the shares and underlying shares of the Company as disclosed under the provisions of Divisions 2 and 3 of Part XV of the SFO are set out as follows:
(1) Mr. Lo Yuk Sui is a director of YSL Int’l.
(2) Mr. Lo Yuk Sui, Mr. Jimmy Lo Chun To and Miss Lo Po Man are directors of Grand Modern.

53
Report of the Directors (Cont’d)
Annual Report 2017
CHANGE IN INFORMATION OF DIRECTORS
The change in the information of the Directors of the Company, which is required to be disclosed pursuant to Rule 13.51B(1) of the Listing Rules, since the publication of the interim report of the Company for the six months ended 30th June, 2017 is set out below:
Name of Director Details of changes
Executive Directors :
Mr. Lo Yuk Sui ‧ Entitled to an allocated monthly salary, based on services rendered to the Group, in an amount of HK$843,000 commencing from January 2018. (Notes (i) and (ii))
Mr. Jimmy Lo Chun To ‧ Entitled to an allocated monthly salary, based on services rendered to the Group, in an amount of HK$222,000 commencing from January 2018. (Note (i))
Miss Lo Po Man ‧ Entitled to an allocated monthly salary, based on services rendered to the Group, in an amount of HK$222,000 commencing from January 2018. (Note (i))
‧ Resigned as an independent non-executive director of Meitu, Inc., a company listed on the Stock Exchange, with effect from 22nd February, 2018.
Mr. Kenneth Ng Kwai Kai ‧ Entitled to an allocated monthly salary, based on services rendered to the Group, in an amount of HK$247,000 commencing from January 2018. (Note (i))
Mr. Donald Fan Tung ‧ Entitled to an allocated monthly salary, based on services rendered to the Group, in an amount of HK$227,000 commencing from January 2018. (Note (i))
Mr. Kelvin Leung So Po ‧ Entitled to an allocated monthly salary, based on services rendered to the Group, in an amount of HK$172,000 commencing from January 2018. (Note (i))
Independent Non-Executive Director:
Mr. Wong Chi Keung ‧ Resigned as an independent non-executive director of Heng Xin China Holdings Limited, a company listed on the Stock Exchange, with effect from 19th September, 2017.
Notes:
(i) Each Executive Director is also entitled to a performance based discretionary bonus and other related employee benefits and allowances for the executive role in the Group, and normal Director’s fee in the amount of HK$150,000 per annum in acting as a Director of the Company. Details of the remuneration of the Executive Directors for the year ended 31st December, 2017 are disclosed in note 8 to the financial statements.
(ii) Mr. Lo Yuk Sui, who is also the chairman of the Nomination Committee and a member of the Remuneration Committee of the Company, is entitled to normal fee of HK$50,000 per annum in acting as the chairman or a member of each of such board committees.
(iii) The Independent Non-Executive Directors are each entitled to normal Director’s fee in the amount of HK$150,000 per annum in acting as a Director of the Company. The Independent Non-Executive Directors, who are also the chairman or members of the board committees of the Company, are each entitled to the following normal fees:

54
Report of the Directors (Cont’d)
Annual Report 2017
Normal fee per annumChairman Member
Audit Committee HK$150,000 HK$100,000Nomination Committee HK$50,000 HK$50,000Remuneration Committee HK$50,000 HK$50,000
Details of the remuneration of all Directors for the year ended 31st December, 2017 are disclosed in note 8 to the financial statements.
Save as disclosed above, there is no other information required to be disclosed pursuant to Rule 13.51B(1) of the Listing Rules. The updated biographical details of the Directors of the Company are set out in the preceding section headed “Directors’ Profile”.
CONNECTED TRANSACTION
On 30th June, 2017, a deed of arrangement (the “Deed of Arrangement”) was entered into between, among others, Sunview Vision Limited (“Sunview”), a wholly owned subsidiary of Cosmopolitan (together with its subsidiaries, the “Cosmopolitan Group”), and the co-venturer of the Logistics Group (as described below) (the “Co-Venturer”), pursuant to which the Cosmopolitan Group disposed of the investments and related interests in the 60%-owned Logistics Group.
The Logistics Group was a group of companies held under Cosmopolitan Logistics Holdings Limited (“Cosmopolitan Logistics”), a joint venture vehicle in which Sunview and the Co-Venturer had 60% and 40% equity interests respectively before the execution of the Deed of Arrangement. The joint venture was formed in 2016 to provide logistics services in the People’s Republic of China (the “PRC”) through its PRC subsidiary licensed to provided such services.
The principal object of the Deed of Arrangement was to dispose of the Cosmopolitan Group’s investments and effective interests currently held in the Logistics Group by selling back the 99%-owned PRC subsidiary of the Logistics Group to the Co-Venturer and end the relevant Joint Venture Arrangements (being the various contracts and relevant security arrangements) (excluding for the avoidance of doubt, the convertible bonds issued by the Cosmopolitan Group relating to the joint venture), details of which were disclosed in the joint announcements of the Company dated 13th January, 2016, 11th March, 2016, 12th April, 2016 and 29th April, 2016 in connection with the joint venture between Sunview and the Co-Venturer in Cosmopolitan Logistics. The total net consideration to Sunview from all of the transactions under the Deed of Arrangement amounted to HK$71,000,000. On completion of the transactions under the Deed of Arrangement, which took place immediately after execution of the Deed of Arrangement on 30th June, 2017, the Cosmopolitan Group received HK$45.6 million in cash. The remaining consideration balance of HK$25.4 million was subsequently settled pursuant to the Deed of Arrangement.
FSS Holding Limited, wholly-owned by the Co-Venturer, was a substantial shareholder of Cosmopolitan Logistics, the 60% owned subsidiary of Cosmopolitan. The Co-Venturer himself was also a director of Cosmopolitan Logistics and other members of the Logistics Group. Therefore, the Co-Venturer and his associates were connected persons of the Company. The transactions under the Deed of Arrangement constituted a connected transaction for the Company under Chapter 14A of the Listing Rules. As the highest applicable percentage ratio in respect of the transactions under the Deed of Arrangement exceeded 1% but was less than 5%, the transactions were therefore subject to announcement requirement and exempted from the circular (including independent financial advice) and independent shareholders’ approval requirements.

55
Report of the Directors (Cont’d)
Annual Report 2017
Further details relating to the Deed of Arrangement were disclosed in the joint announcement of the Company dated 30th June, 2017.
PURCHASE, SALE OR REDEMPTION OF THE COMPANY’S LISTED SECURITIES
Neither the Company nor any of its subsidiaries has purchased, sold or redeemed any listed securities of the Company during the year.
SUFFICIENCY OF PUBLIC FLOAT
Based on information that is publicly available to the Company and within the knowledge of the Directors, as at the date of this report, the Company has maintained sufficient public float as required under the Listing Rules.
PRE-EMPTIVE RIGHTS
No pre-emptive rights exist in Bermuda being the jurisdiction in which the Company is incorporated.
MAJOR CUSTOMERS AND SUPPLIERS
During the year, the percentage of purchases attributable to the Group’s five largest suppliers and the percentage of turnover or sales attributable to the Group’s five largest customers combined in respect of goods and services was in each case less than 30% of the total amount involved.
BORROWINGS
The details of the Group’s borrowings at the end of the reporting period are set out in notes 33, 34 and 36 to the financial statements.
SHARE CAPITAL
The details of movements in the share capital of the Company, together with reasons therefor, during the year are set out in note 38 to the financial statements.
SHARE PREMIUM ACCOUNT
The details of movements in the Company’s share premium account during the year are set out in note 38 to the financial statements.
SUBSIDIARIES
Particulars of the Company’s principal subsidiaries are set out in note 1 to the financial statements.
JOINT VENTURE AND ASSOCIATES
Particulars of the Group’s investments in a joint venture and associates are set out in notes 16 and 17 to the financial statements.

56
Report of the Directors (Cont’d)
Annual Report 2017
CHARITABLE CONTRIBUTIONS
During the year, the Group made charitable contributions totalling HK$2.1 million.
DISTRIBUTABLE RESERVES
As at 31st December, 2017, the Company’s reserves available for distribution calculated in accordance with the Companies Act 1981 of Bermuda amounted to HK$3,899.9 million, of which HK$54.5 million has been proposed as final dividend for the year.
In addition, the Company’s share premium account, in the amount of HK$1,559.4 million, may be distributed in the form of fully paid bonus shares.
FINANCE COSTS CAPITALISED
Finance costs in the amount of HK$218.5 million were capitalised during the year in respect of the Group’s property development projects.
EVENT AFTER THE REPORTING PERIOD
Details of the significant event of the Group after the reporting period are set out in note 52 to the financial statements.
AUDITOR
Ernst & Young retire and, being eligible, offer themselves for re-appointment.
ENVIRONMENTAL, SOCIAL AND GOVERNANCE REPORT
The Environmental, Social and Governance Report of the Company for the year ended 31st December, 2017 will be published as a separate report from this Annual Report in compliance with relevant requirements under the Listing Rules on or before 31st July, 2018.
On behalf of the Board
LO YUK SUIChairman
Hong Kong26th March, 2018
57Annual Report 2017
Corporate Governance Report
The Board of Directors of the Company (the “Board”) is pleased to present the Corporate Governance Report of the Company for the year ended 31st December, 2017.
The Company is committed to maintaining good corporate governance practices and procedures. Review of existing policies and practices in respect of the management and corporate matters of the Group has been conducted by the Company. Enhancement to the current standards for complying with new requirements, revision of the existing policies and practices and introduction of appropriate new measures have been implemented. Periodic review of the system and controls within the Group will be carried out by the Company to comply with the prevailing standards and requirements of good corporate governance.
(I) CORPORATE GOVERNANCE PRACTICES
The Company has complied with the Code Provisions in the Corporate Governance Code (the “CG Code”) as set out in Appendix 14 of the Rules Governing the Listing of Securities on The Stock Exchange of Hong Kong Limited (the “Stock Exchange”) (the “Listing Rules”) during the year ended 31st December, 2017, except that:
(1) The roles of the Chairman and Chief Executive Officer are not separated and performed by two different individuals due to practical necessity to cater to the Group’s corporate operating structure.
(2) The Independent Non-Executive Directors of the Company were not appointed for specific terms, but in accordance with the provisions of the Bye-laws of the Company, all Directors (including the Independent Non- Executive Directors) of the Company are subject to retirement by rotation at least once every three years, and the retiring Directors are eligible for re-election.
(II) BOARD OF DIRECTORS
The Board currently comprises the following members:
Executive Directors:
Mr. Lo Yuk Sui (Chairman and Chief Executive Officer)Mr. Jimmy Lo Chun To (Vice Chairman)Miss Lo Po Man (Vice Chairman)Mr. Kenneth Ng Kwai Kai (Chief Operating Officer)Mr. Donald Fan Tung Mr. Kelvin Leung So Po
Independent Non-Executive Directors:
Mr. Anthony Chuang Ms. Winnie Ng, JP (appointed on 1st January, 2018)Mr. Wong Chi Keung
Mr. Ng Siu Chan, who was an Independent Non-Executive Director of the Company, resigned with effect from 1st January, 2018.
The personal and biographical details of the current Directors, including the relationship among them, are disclosed in the preceding section headed “Directors’ Profile” contained in this Annual Report.

58 Annual Report 2017
Corporate Governance Report (Cont’d)
During the year ended 31st December, 2017, the Company has fully complied with Rules 3.10 and 3.10A of the Listing Rules regarding the number of Independent Non-Executive Directors and the requirement that at least one of these Directors must have appropriate professional qualifications.
Each of the Independent Non-Executive Directors has made an annual confirmation of independence pursuant to Rule 3.13 of the Listing Rules. The Company considers that all Independent Non-Executive Directors have met the independence guidelines of Rule 3.13 of the Listing Rules.
The Board conducts regular meetings to discuss and decide on major corporate, strategic, business and operational issues. Appropriate and sufficient information is provided to Board members in a timely manner in order to enable them to discharging their duties.
All material policies and decisions remain within the authority of the Board as a whole. The Board only delegates authorities to management to an extent that would not significantly hinder or reduce the ability of the Board to discharge its proper functions as a whole. The functions of the Board and those delegated to management of the Company are properly distinguished and clarified. Review of the formalised arrangements will be carried out on a periodic basis to ensure that they remain appropriate to the needs of the Company. The Board is also responsible for developing, reviewing and/or monitoring the Company’s policies and practices on corporate governance and compliance with legal and regulatory requirements.
In year 2017, the attendance rates of individual Board members of the Company were as follows:
Name of Directors Attendance
Board Meetings General Meetings
Executive Directors
Mr. Lo Yuk Sui (Chairman and Chief Executive Officer) 8/8 1/1Mr. Jimmy Lo Chun To (Vice Chairman) 8/8 1/1Miss Lo Po Man (Vice Chairman) 8/8 1/1Mr. Kenneth Ng Kwai Kai (Chief Operating Officer) 8/8 1/1Mr. Donald Fan Tung 8/8 1/1Mr. Kelvin Leung So Po 8/8 1/1
Independent Non-Executive Directors
Mr. Anthony Chuang 8/8 1/1Mr. Ng Siu Chan# 7/8 1/1Mr. Wong Chi Keung 8/8 1/1
# (resigned on 1st January, 2018)

59Annual Report 2017
Corporate Governance Report (Cont’d)
The Chairman or an Executive Director so delegated is responsible for providing every newly appointed Director with an induction on the first occasion of his/her appointment to ensure that he/she has a proper understanding of the operations and business of the Group. With respect to compliance matters, the Company Secretary is responsible for providing any new Director with information and materials relating to his/her responsibilities under applicable statutory and regulatory requirements. Subsequent updating about the latest changes and development of such requirements will be sent to the Directors by the Company Secretary. In addition, the Directors have participated in continuous professional development to develop and refresh their knowledge and skills to ensure their contribution to the Board remains informed and relevant. In the year 2017, the Company arranged for Directors a seminar covering topics on, among others, the Consultation Paper on Proposed Exemption for Aircraft Leasing Activities issued by the Stock Exchange. The training received by the Directors during the year 2017 is summarised below:
Name of Directors Types of training
Executive Directors
Mr. Lo Yuk Sui (Chairman and Chief Executive Officer) A, BMr. Jimmy Lo Chun To (Vice Chairman) A, BMiss Lo Po Man (Vice Chairman) A, BMr. Kenneth Ng Kwai Kai (Chief Operating Officer) A, BMr. Donald Fan Tung A, BMr. Kelvin Leung So Po A, B
Independent Non-Executive Directors
Mr. Anthony Chuang BMr. Ng Siu Chan# BMr. Wong Chi Keung A, B
A - Attending briefings/seminars/conferences/forumsB - Reading/studying training or other materials
# (resigned on 1st January, 2018)

60 Annual Report 2017
Corporate Governance Report (Cont’d)
(III) BOARD COMMITTEES
There are three board committees, namely the Audit Committee, the Remuneration Committee and the Nomination Committee, established by the Board for overseeing different functions delegated by the Board.
(a) Audit Committee
The Audit Committee was established with reference to “A Guide for the Formation of an Audit Committee” issued by the Hong Kong Institute of Certified Public Accountants. The terms of reference of the Audit Committee are available on the websites of the Company and the Stock Exchange.
The Audit Committee currently comprises the following members:
Independent Non-Executive Directors:
Ms. Winnie Ng, JP (Chairman of the Committee) (appointed on 1st January, 2018) Mr. Anthony Chuang (Member)Mr. Wong Chi Keung (Member)
The Audit Committee has reviewed with management the accounting principles and practices adopted by the Group and discussed auditing, internal control and financial reporting matters including the review of the interim and annual financial statements.
As both the Board and the Audit Committee recommended to re-appoint the current external Auditor, Messrs. Ernst & Young, no circumstances exist as would require an explanation from the Audit Committee as to why the Board has taken a different view from that of the Audit Committee regarding the selection, appointment, resignation or dismissal of the external Auditor.
In year 2017, the Audit Committee met twice and the meetings were attended by the external Auditor of the Company. The attendance rates of individual Audit Committee members of the Company were as follows:
Name of Audit Committee members Attendance
Mr. Ng Siu Chan (Chairman of the Committee) (resigned on 1st January, 2018) 2/2Mr. Anthony Chuang 2/2Mr. Wong Chi Keung 2/2
(b) Remuneration Committee
The Remuneration Committee was established with specific written terms of reference that deal with its authority and duties. The terms of reference of the Remuneration Committee are available on the websites of the Company and the Stock Exchange. The principal responsibilities of the Remuneration Committee are to review the remuneration of individual Directors and senior management and to make recommendations to the Board on the policy and structure for the determination of the remuneration of Directors and senior management and on the establishment of a formal and transparent procedure for developing the policy of the Company on such matters.

61Annual Report 2017
Corporate Governance Report (Cont’d)
The Remuneration Committee currently comprises the following members:
Executive Director:
Mr. Lo Yuk Sui (Member)
Independent Non-Executive Directors:
Mr. Wong Chi Keung (Chairman of the Committee)Mr. Anthony Chuang (Member)Ms. Winnie Ng, JP (Member) (appointed on 1st January, 2018)
Mr. Kenneth Ng Kwai Kai, an Executive Director of the Company, has acted as the Secretary of the Committee.
In year 2017, the Remuneration Committee met once and has reviewed the Company’s policy and structure for the remuneration of Directors and senior management. The attendance rates of individual Remuneration Committee members of the Company were as follows:
Name of Remuneration Committee members Attendance
Mr. Wong Chi Keung (Chairman of the Committee) 1/1Mr. Lo Yuk Sui 1/1Mr. Anthony Chuang 1/1Mr. Ng Siu Chan (resigned on 1st January, 2018) 1/1
Pursuant to the terms of reference of the Remuneration Committee, the Remuneration Committee is delegated to make recommendations to the Board on the remuneration packages of individual Executive Directors and senior management, including benefits in kind, pension rights and compensation payments (including any compensation payable for loss or termination of their office or appointment).
The remuneration of the senior management (comprising Executive Directors) of the Company for the year ended 31st December, 2017 by band is set out below:
Remuneration band Number of individuals
HK$2,500,001 – 3,000,000 1Within bands from HK$3,000,001 – 4,000,000 1Within bands from HK$4,000,001 – 6,000,000 1HK$6,000,001 – 6,500,000 1Within bands from HK$6,500,001 – 17,000,000 1HK$17,000,001 – 17,500,000 1
Further details of the Executive Directors’ remuneration for the year ended 31st December, 2017 are disclosed in note 8 to the financial statements contained in this Annual Report.

62 Annual Report 2017
Corporate Governance Report (Cont’d)
(c) Nomination Committee
The Nomination Committee was established with specific written terms of reference by the Board for the purpose of making recommendations to the Board in relation to the nomination and appointment of Directors, with a view to ensuring fairness and transparency in the nomination and selection procedures. The terms of reference of the Nomination Committee are available on the websites of the Company and the Stock Exchange.
The Nomination Committee currently comprises the following members:
Executive Director:
Mr. Lo Yuk Sui (Chairman of the Committee)
Independent Non-Executive Directors:
Mr. Anthony Chuang (Member)Ms. Winnie Ng, JP (Member) (appointed on 1st January, 2018) Mr. Wong Chi Keung (Member)
The Company views diversity at the Board level essential for attaining the Group’s strategic and business objectives as well as ensuring its sustainable development. A Board Diversity Policy has been adopted to set out policy for designing the composition of the Board with diversity in Board members having balanced skills and expertise. The diversity of the Board members should be assessed on a diversity of perspectives including but not limited to gender, age, cultural and educational background, ethnicity, professional knowledge, industry experience, skills and other individual qualities. The Nomination Committee will discuss and review annually the structure, size and composition of the Board and agree on measurable objectives for achieving diversity on the Board and make relevant recommendation to the Board for adoption.
In year 2017, the Nomination Committee met once to review and assess the overall diversity of the composition of the Board with reference to the various aspects as set out in the Board Diversity Policy. The attendance rates of individual Nomination Committee members of the Company were as follows:
Name of Nomination Committee members Attendance
Mr. Lo Yuk Sui (Chairman of the Committee) 1/1Mr. Anthony Chuang 1/1Mr. Ng Siu Chan (resigned on 1st January, 2018) 1/1Mr. Wong Chi Keung 1/1

63Annual Report 2017
Corporate Governance Report (Cont’d)
(IV) DIRECTORS’ RESPONSIBILITY FOR FINANCIAL REPORTING
The Directors of the Company acknowledge their responsibility for preparing the financial statements of the Group, which give a true and fair view of the state of affairs of the Group, and ensuring that appropriate accounting policies are selected and applied consistently and that the financial statements are prepared in accordance with the relevant statutory requirements and applicable accounting standards. The Directors will also ensure that the financial statements are published in a timely manner. As a manpower policy of the Group, which is subject to regular review by the Directors and senior management, adequate resources have been allocated to the accounting, financial reporting and internal audit functions with staff members possessing appropriate qualifications and experience engaged in the discharge of those relevant functions. The relevant staff members attend seminars and workshops organised by the professional accounting bodies on a regular basis. The overall budgets allocated to those functions have been reviewed and considered to be adequate.
The statement by the external Auditor, Messrs. Ernst & Young, about their reporting responsibilities is set out in the Independent Auditor’s Report contained in this Annual Report.
The financial statements are prepared on a going concern basis. The Directors confirm that, to the best of their knowledge, they are not aware of material uncertainties relating to events or conditions that may cast significant doubt upon the Company’s ability to continue as a going concern.
(V) DIRECTORS’ SECURITIES TRANSACTIONS
The Company has adopted the “Code for Securities Transactions by Directors of Century City International Holdings Limited” (the “Century Code”), on terms no less exacting than the required standard set out in the Model Code for Securities Transactions by Directors of Listed Issuers as set out in Appendix 10 of the Listing Rules (the “Model Code”), as the code of conduct governing the securities transactions by the Directors of the Company.
Following specific enquiry by the Company, the Directors have confirmed that they have complied with the Model Code and the Century Code during the year ended 31st December, 2017.
(VI) RISK MANAGEMENT AND INTERNAL CONTROL
The Board oversees the risk management and internal control systems of the Group on an ongoing basis. It has conducted an annual review of the effectiveness of the risk management and internal control systems of the Group during the year, including financial, operational and compliance controls and risk management and internal control functions, with a view to safeguarding the shareholders’ investment and the Company’s assets and business operations. The risk management and internal control systems of the Group are considered effective and adequate. Such systems were designed to manage rather than to eliminate the risk of failure in achieving the Group’s business objectives.
Management of the Company has put into effect a set of corporate policies and procedures for the principal business operations of the Group, with an objective to achieving sound and effective risk management and internal control systems. Separate meetings participated by Executive Directors, Group Financial Controller and related division heads are held regularly to review the effectiveness of the risk management and internal control systems, to identify any significant management and operational risks as well as control failings or weaknesses, and also to review the need for any control improvements or updating to respond to changes in the business and external environment. While the regular monitoring of the risk management and internal control mechanisms is mainly conducted by the delegated Executive Directors and senior management staff members, support and advice from external consultants and professionals are sought as and when required.

64 Annual Report 2017
Corporate Governance Report (Cont’d)
The Board is responsible for the Company’s risk management and internal control systems and for reviewing the effectiveness of such systems. Accordingly, while periodic committee meetings are held with the delegated Executive Directors and senior management staff members, clear instructions have been provided to management of the Company that any material issues relating to the risk management and internal control systems, particularly any incidence of significant control failings or weaknesses that has had, or might have, a material impact on the business of the Group is to be reported to the Board and the Audit Committee of the Company on a timely basis.
The Company has established policy for ensuring that inside information is disseminated to the public in an equal and timely manner in accordance with applicable laws and regulations. Senior management executives of the corporate affairs and financial control functions of the Group are delegated with responsibilities to control and monitor the proper procedures to be observed on the disclosure of inside information. Access to inside information is at all times confined to relevant senior management executives and on “as needed” basis, until proper disclosure or dissemination of inside information in accordance with applicable laws and regulations. Relevant personnel and other professional parties involved are reminded to preserve confidentiality of the inside information until it is publicly disclosed.
In addition, the Group’s internal auditor has selected different aspects of the internal control system for his review on a regular basis and has confirmed to the Audit Committee that no material deficiency is noted.
(VII) AUDITOR’S REMUNERATION
Messrs. Ernst & Young have been re-appointed as the external auditor of the Company at the 2017 Annual General Meeting until the conclusion of the forthcoming 2018 Annual General Meeting.
The remuneration to Messrs. Ernst & Young, the auditor of the Company, in respect of the audit and non-audit services rendered for the year ended 31st December, 2017 were HK$12.9 million (2016 - HK$12.0 million) and HK$5.6 million (2016 - HK$5.8 million), respectively. The significant non-audit services covered by these fees are as follows:
Nature of services Fees paid(HK$’milion)
(1) Interim review of the financial statements of the Group for the six months ended 30th June, 2017 2.1
(2) Compliance and other services to the Group 3.5

65Annual Report 2017
Corporate Governance Report (Cont’d)
(VIII) SHAREHOLDERS’ RIGHT
Special general meetings may be convened upon receipt of written request submitted by any shareholder(s) of the Company holding not less than one-tenth of the share capital of the Company carrying the right of voting at general meetings of the Company. Such written requisition must state the purposes of the meeting, and be signed by the requisitionist(s) and deposited at the Head Office of the Company at 11th Floor, 68 Yee Wo Street, Causeway Bay, Hong Kong (for the attention of the Company Secretary).
Shareholders may also send written enquiries to the Company for putting forward any enquiries or proposals to the Board of the Company at the abovementioned address (for the attention of the Company Secretary).
During the year ended 31st December, 2017, the Company has not made any changes to its Bye-laws. A consolidated version of the Memorandum of Association and New Bye-laws of the Company is available on the website of the Company.

66
Consolidated Statement of Profit or LossFor the year ended 31st December, 2017
Annual Report 2017
2017 2016Notes HK$’million HK$’million
REVENUE 5 3,620.8 2,804.3Cost of sales (2,351.9) (1,639.3)
Gross profit 1,268.9 1,165.0
Other income and gains, net 5 236.4 56.1Fair value gains on investment properties, net 14 671.2 69.4Fair value gains/(losses) on financial assets at fair value through profit or loss, net 74.4 (24.7)Gain on bargain purchase 41 – 3.1Gain on disposal of subsidiaries 43(c) 0.2 403.0Write-back of impairment loss on property under development 15 57.0 –Impairment loss on properties held for sale – (15.5)Impairment loss on items of property, plant and equipment 13 (50.5) –Property selling and marketing expenses (42.3) (57.6)Administrative expenses (391.9) (406.0)
OPERATING PROFIT BEFORE DEPRECIATION AND AMORTISATION 1,823.4 1,192.8Depreciation and amortisation (611.2) (626.4)
OPERATING PROFIT 1,212.2 566.4
Finance costs 7 (309.4) (310.1)Share of profits and losses of associates (32.7) (14.1)
PROFIT BEFORE TAX 6 870.1 242.2
Income tax 10 (91.5) (4.1)
PROFIT FOR THE YEAR BEFORE ALLOCATION BETWEEN EQUITY HOLDERS OF THE PARENT AND NON-CONTROLLING INTERESTS 778.6 238.1
Attributable to: Equity holders of the parent 381.2 136.2 Non-controlling interests 397.4 101.9
778.6 238.1
EARNINGS PER ORDINARY SHARE ATTRIBUTABLE TO EQUITY HOLDERS OF THE PARENT 12
Basic and diluted HK10.83 cents* HK4.25 cents
* Before deducting the distribution related to perpetual securities of HK$34.3 million for the year ended 31st December, 2017, the basic and diluted earnings per share would have been HK11.90 cents and HK11.90 cents, respectively.

67
Consolidated Statement of Comprehensive IncomeFor the year ended 31st December, 2017
Annual Report 2017
2017 2016Notes HK$’million HK$’million
PROFIT FOR THE YEAR BEFORE ALLOCATION BETWEEN EQUITY HOLDERS OF THE PARENT AND NON-CONTROLLING INTERESTS 778.6 238.1
OTHER COMPREHENSIVE INCOME/(LOSS)
Other comprehensive income/(loss) to be reclassified to profit or loss in subsequent periods: Changes in fair value of available-for-sale investments 34.2 (3.8) Exchange differences on translating foreign operations 202.8 (159.1) Reclassification adjustment on disposal of foreign operations 43(c)(i) 1.6 – Share of other comprehensive income/(loss) of associates 0.2 (0.1)
Other comprehensive income/(loss) to be reclassified to profit or loss in subsequent periods 238.8 (163.0)
Other comprehensive income not to be reclassified to profit or loss in subsequent periods: Gain on revaluation of property 13 10.6 – Income tax effect 37 (2.5) –
Net other comprehensive income not to be reclassified to profit or loss in subsequent periods 8.1 –
OTHER COMPREHENSIVE INCOME/(LOSS) FOR THE YEAR, NET OF TAX 246.9 (163.0)
TOTAL COMPREHENSIVE INCOME FOR THE YEAR 1,025.5 75.1
Attributable to: Equity holders of the parent 492.3 65.2 Non-controlling interests 533.2 9.9
1,025.5 75.1

68
Consolidated Statement of Financial PositionAs at 31st December, 2017
Annual Report 2017
2017 2016Notes HK$’million HK$’million
NON-CURRENT ASSETS Property, plant and equipment 13 22,676.2 19,517.4 Investment properties 14 3,445.2 2,395.3 Properties under development 15 2,075.3 1,293.0 Investment in a joint venture 16 – 1,150.7 Investments in associates 17 24.5 35.3 Available-for-sale investments 18 447.7 335.6 Financial asset at fair value through profit or loss 19 1.9 1.9 Contingent consideration receivable 21 – 10.3 Loans receivable 22 111.9 93.4 Finance lease receivables 23 35.1 81.9 Debtors, deposits and prepayments 29 101.4 80.3 Deferred tax assets 37 51.7 94.0 Other assets 0.2 5.2 Goodwill 24 261.0 261.0 Trademark 25 610.2 610.2 Other intangible assets 26 – 97.1
Total non-current assets 29,842.3 26,062.6
CURRENT ASSETS Properties under development 15 7,194.9 6,465.5 Properties held for sale 27 1,285.8 1,268.5 Aircraft held for sale 13 18.4 – Inventories 28 65.5 64.8 Loans receivable 22 4.5 3.7 Finance lease receivables 23 46.0 45.0 Debtors, deposits and prepayments 29, 32 716.6 1,304.9 Held-to-maturity investments 20 167.9 466.7 Financial assets at fair value through profit or loss 19 1,707.7 968.3 Derivative financial instruments 35 – 12.8 Tax recoverable 11.7 0.2 Restricted cash 30 145.6 438.5 Pledged time deposits and bank balances 550.4 265.1 Time deposits 1,979.7 2,726.0 Cash and bank balances 2,363.5 1,889.5
Total current assets 16,258.2 15,919.5

69
Consolidated Statement of Financial Position (Cont’d)
As at 31st December, 2017
Annual Report 2017
2017 2016Notes HK$’million HK$’million
CURRENT LIABILITIES Creditors and accruals 31, 32 (1,061.3) (854.8) Deposits received 15 (2,568.5) (2,259.2) Interest bearing bank borrowings 33 (4,251.6) (992.8) Other borrowings 34 (1,945.8) (2,258.5) Derivative financial instruments 35 (3.0) (5.7) Tax payable (141.1) (145.5)
Total current liabilities (9,971.3) (6,516.5)
NET CURRENT ASSETS 6,286.9 9,403.0
TOTAL ASSETS LESS CURRENT LIABILITIES 36,129.2 35,465.6
NON-CURRENT LIABILITIES Creditors and deposits received (76.7) (170.8) Interest bearing bank borrowings 33 (9,142.0) (8,560.4) Other borrowings 34 (2,713.7) (4,621.3) Convertible bonds 36 – (31.1) Deferred tax liabilities 37 (2,048.5) (2,169.9)
Total non-current liabilities (13,980.9) (15,553.5)
Net assets 22,148.3 19,912.1
EQUITYEquity attributable to equity holders of the parent Issued capital 38 320.4 320.4 Reserves 39 8,694.9 8,237.1
9,015.3 8,557.5
Perpetual securities 40 1,732.9 –Non-controlling interests 11,400.1 11,354.6
Total equity 22,148.3 19,912.1
KENNETH NG KWAI KAI LO YUK SUIDirector Director

70
Consolidated Statement of Changes in EquityFor the year ended 31st December, 2017
Annual Report 2017
Attrib
utable
to eq
uity h
olders
of th
e pare
nt
Issue
dcap
ital
Share
premi
umacc
ount
Capit
alred
empti
onres
erve
Capit
alres
erve
Avail
able-
for-sa
le inv
estme
ntrev
aluati
onres
erve
Equit
ycom
pone
nt of
conver
tible
bond
sof
a list
edsub
sidiar
y
Excha
nge
equa
lisatio
nres
erve
Retai
ned
profi
tsTo
tal
Non-
contro
lling
intere
stsTo
taleq
uity
Notes
HK$’ m
HK$’ m
HK$’ m
HK$’ m
HK$’ m
HK$’ m
HK$’ m
HK$’ m
HK$’ m
HK$’ m
HK$’ m
At 1st
Janu
ary, 2
016
320.4
1,559
.44.3
1,410
.657
.7–
(59.6)
5,208
.78,5
01.5
11,75
6.720
,258.2
Profit
for th
e year
––
––
––
–13
6.213
6.210
1.923
8.1Oth
er com
prehen
sive lo
ss for
the y
ear:
Chan
ges in
fair v
alue o
f avai
lable-f
or-sal
e inves
tment
s–
––
–(1.
2)–
––
(1.2)
(2.6)
(3.8)
Exch
ange d
ifferen
ces on
transl
ating
for
eign o
peratio
ns–
––
––
–(69
.7)–
(69.7)
(89.4)
(159.1
) S
hare o
f othe
r com
prehen
sive lo
ss of
an ass
ociate
––
––
––
(0.1)
–(0.
1)–
(0.1)
Tot
al com
prehen
sive in
come/(l
oss) fo
r the y
ear–
––
–(1.
2)–
(69.8)
136.2
65.2
9.975
.1
Acqu
isition
/Deem
ed acq
uisitio
n of
non
-contr
olling
inter
ests
in l
isted s
ubsid
iaries
––
–41
.5–
––
–41
.5(24
6.2)
(204.7
)Ac
quisit
ion of
subsi
diaries
36, 4
1–
––
––
13.4
––
13.4
53.0
66.4
Distrib
ution
to no
n-con
trollin
g shar
eholde
rs–
––
––
––
––
(14.3)
(14.3)
Final 2
015 d
ividend
decla
red–
––
––
––
(43.9)
(43.9)
(121.9
)(16
5.8)
Interim
2016
divid
end11
––
––
––
–(20
.2)(20
.2)(82
.6)(10
2.8)
At
31st D
ecemb
er, 20
1632
0.41,5
59.4
4.31,4
52.1
56.5
13.4
(129.4
)5,2
80.8
8,557
.511
,354.6
19,91
2.1

71
Consolidated Statement of Changes in Equity (Cont’d)
For the year ended 31st December, 2017
Annual Report 2017
Attrib
utable
to eq
uity h
olders
of th
e pare
nt
Issue
dcap
ital
Share
premi
umacc
ount
Capit
alred
empti
onres
erve
Capit
alres
erve
Avail
able-
for-sa
le inv
estme
ntrev
aluati
onres
erve
Equit
ycom
pone
nt of
conver
tible
bond
sof
a list
edsub
sidiar
y
Prope
rties
revalu
ation
reserv
e
Excha
nge
equa
lisatio
nres
erve
Retai
ned
profi
tsTo
talPer
petua
l sec
uritie
s
Non-
contro
lling
intere
stsTo
taleq
uity
Notes
HK$’ m
HK$’ m
HK$’ m
HK$’ m
HK$’ m
HK$’ m
HK$’ m
HK$’ m
HK$’ m
HK$’ m
HK$’ m
HK$’ m
HK$’ m
At 1st
Janu
ary, 2
017
320.4
1,559
.44.3
1,452
.156
.513
.4–
(129.4
)5,2
80.8
8,557
.5–
11,35
4.619
,912.1
Profit
for th
e year
––
––
––
––
381.2
381.2
–39
7.477
8.6Oth
er com
prehen
sive in
come
for
the ye
ar: C
hanges
in fa
ir valu
e of
ava
ilable-f
or-sal
e inves
tment
s–
––
–16
.6–
––
–16
.6–
17.6
34.2
Exch
ange d
ifferen
ces on
transl
ating
for
eign o
peratio
ns–
––
––
––
90.3
–90
.3–
112.5
202.8
Recl
assific
ation a
djustm
ent on
dispo
sal of
foreig
n oper
ations
43(c)(
i)–
––
––
––
0.7–
0.7–
0.91.6
Shar
e of o
ther c
ompre
hensive
incom
e of a
n asso
ciate
––
––
––
–0.1
–0.1
–0.1
0.2 G
ain on
reval
uation
of pr
opert
y,
net of
tax
––
––
––
3.4–
–3.4
–4.7
8.1
Total c
ompre
hensive
incom
e f
or the
year
––
––
16.6
–3.4
91.1
381.2
492.3
–53
3.21,0
25.5
Acqu
isition
/Deem
ed acq
uisitio
n of
non
-contr
olling
inter
ests
in l
isted s
ubsid
iaries
––
–67
.9–
(13.4)
––
–54
.5–
(204.0
)(14
9.5)
Dispo
sal of
subsi
diaries
43(c)(
i)–
––
––
––
––
––
(31.0)
(31.0)
Issue o
f perp
etual s
ecuriti
es by
a lis
ted su
bsidia
ry40
––
––
––
––
––
1,732
.9–
1,732
.9Dis
tributi
on to
non-c
ontro
lling
shar
eholde
rs–
––
––
––
––
––
(15.0)
(15.0)
Distrib
ution
to ho
lders o
f p
erpetu
al secu
rities
––
––
––
––
(24.3)
(24.3)
–(32
.7)(57
.0)Fin
al 201
6 divid
end de
clared
––
––
––
––
(43.9)
(43.9)
–(12
0.8)
(164.7
)Int
erim 20
17 di
vidend
11–
––
––
––
–(20
.8)(20
.8)–
(84.2)
(105.0
)
At 31
st Dece
mber,
2017
320.4
1,559
.44.3
1,520
.073
.1–
3.4(38
.3)5,5
73.0
9,015
.31,7
32.9
11,40
0.122
,148.3

72
Consolidated Statement of Cash FlowsFor the year ended 31st December, 2017
Annual Report 2017
2017 2016Notes HK$’million HK$’million
CASH FLOWS FROM OPERATING ACTIVITIESProfit before tax 870.1 242.2Adjustments for: Finance costs 7 309.4 310.1 Share of profits and losses of associates 32.7 14.1 Interest income 5 (165.5) (77.2) Depreciation and amortisation 6 611.2 626.4 Dividend income 5 (20.7) (14.6) Gain on bargain purchase – (3.1) Gain on disposal of subsidiaries (0.2) (403.0) Gain on disposal of items of property, plant and equipment, net 5 (66.6) (19.7) Loss/(Gain) on disposal of an investment property 5 (0.1) 23.7 Fair value gain upon reclassification of a property held for sale to an investment property 5 – (3.7) Fair value gains on investment properties, net (671.2) (69.4) Fair value losses/(gains) on financial assets at fair value through profit or loss, net (74.4) 24.7 Write-off of items of property, plant and equipment 6 – 0.4 Write-back of impairment loss on property under development (57.0) – Impairment loss on properties held for sale – 15.5 Impairment loss on items of property, plant and equipment 50.5 – Impairment of trade debtors 6 0.1 – Write-back of impairment of trade debtors 6 (0.1) (0.1) Recovery of deposits paid for acquisition of a subsidiary 6 – (14.4) Reversal of impairment of loans receivable 6 (0.1) (0.1)
818.1 651.8
Additions to properties under development (1,937.5) (980.9)Decrease in properties held for sale 935.3 335.5Increase in financial assets at fair value through profit or loss (659.8) (104.8)Decrease in derivative financial instruments 7.1 1.9Increase in inventories (0.7) (12.1)Decrease/(Increase) in debtors, deposits and prepayments 569.9 (325.3)Receipt from finance leases 46.8 23.7Decrease/(Increase) in restricted cash 314.2 (257.0)Decrease in creditors and accruals (37.0) (8.1)Increase in deposits received 182.4 1,988.2
Cash generated from operations 238.8 1,312.9Dividends received from listed investments 16.9 13.4Interest received 40.7 23.2Interest received from finance leases 13.3 7.5Hong Kong profits tax paid (143.8) (77.9)Overseas tax paid (53.8) (1.0)
Net cash flows from operating activities 112.1 1,278.1

73
Consolidated Statement of Cash Flows (Cont’d)
For the year ended 31st December, 2017
Annual Report 2017
2017 2016Notes HK$’million HK$’million
CASH FLOWS FROM INVESTING ACTIVITIESAcquisition of subsidiaries 41 – 0.7Disposal of subsidiaries 43(c) 116.4 99.9Purchases of available-for-sale investments (82.7) (119.5)Purchases of held-to-maturity investments (2,629.2) (1,533.2)Proceeds from redemption of held-to-maturity investments 2,928.0 1,267.7Increase in loans receivable (19.2) (87.2)Proceeds from disposal of an investment property 1.0 95.4Additions to investment properties (250.5) (218.4)Proceeds from disposal of items of property, plant and equipment 143.7 2.7Purchases of items of property, plant and equipment (2,757.4) (206.4)Deposits paid for purchase of items of property, plant and equipment (6.6) –Recovery of deposits paid for acquisition of a subsidiary – 14.4Advances to associates (21.7) (29.5)Interest received 113.1 117.2Dividends received from unlisted investments 3.8 1.2Dividend received from an associate – 3.2Increase in restricted cash (4.3) (16.9)Decrease/(Increase) in pledged time deposits and bank balances (285.3) 81.2
Net cash flows used in investing activities (2,750.9) (527.5)
CASH FLOWS FROM FINANCING ACTIVITIESDrawdown of new bank loans 5,037.5 5,964.8Repayment of bank loans (1,203.2) (5,918.3)Increase/(Decrease) in other borrowings (2,277.8) 2,667.4Payment of loan and other costs (45.9) (100.7)Interest paid (473.6) (350.4)Dividends paid (64.7) (64.1)Dividends paid to non-controlling shareholders (204.8) (204.3)Distribution to non-controlling shareholders (15.0) (14.3)Acquisition of non-controlling interests in listed subsidiaries (77.8) (170.0)Repurchase and cancellation of ordinary shares by a listed subsidiary (117.1) (34.7)Issue of perpetual securities by a listed subsidiary, net of issue expenses 1,734.2 –Distribution to holders of perpetual securities (57.0) –Increase in restricted cash – (6.4)
Net cash flows from financing activities 2,234.8 1,769.0

74
Consolidated Statement of Cash Flows (Cont’d)
For the year ended 31st December, 2017
Annual Report 2017
2017 2016HK$’million HK$’million
NET INCREASE/(DECREASE) IN CASH AND CASH EQUIVALENTS (404.0) 2,519.6
Cash and cash equivalents at beginning of year 4,615.5 2,154.7
Effect of foreign exchange rate changes, net 131.7 (58.8)
CASH AND CASH EQUIVALENTS AT END OF YEAR 4,343.2 4,615.5
ANALYSIS OF BALANCES OF CASH AND CASH EQUIVALENTS Cash and bank balances 2,363.5 1,889.5 Non-pledged time deposits with original maturity of less than three months when acquired 1,979.7 2,726.0
4,343.2 4,615.5

75
Notes to Financial Statements31st December, 2017
Annual Report 2017
1. CORPORATE AND GROUP INFORMATION
Century City International Holdings Limited (the “Company”) is a limited liability company incorporated in Bermuda. The head office and principal place of business of the Company is located at 11th Floor, 68 Yee Wo Street, Causeway Bay, Hong Kong.
During the year, the Company and its subsidiaries (collectively referred to as the “Group”) were principally engaged in property development and investment, construction and building related businesses, hotel ownership, hotel operation and management, asset management, aircraft ownership and leasing business, and other investments including financial assets investments.
Information about subsidiaries
Particulars of the Company’s principal subsidiaries are as follows:
Name
Place ofincorporation/
registration and business
Issued ordinaryshare capital/
registered capital/ issued units
Percentage of equity interest attributable
to the CompanyPrincipal
activities
2017 2016
Aikford Financial Services Limited
Hong Kong HK$2 100 100 Securitiesinvestment
Almighty International Limited
British Virgin Islands
US$1 100 100 Investmentholding
Century City BVI Holdings Limited
British Virgin Islands
HK$10 100 100 Investmentholding
Century City Finance Limited
Hong Kong HK$2 100 100 Financing
Century City Holdings Limited
Hong Kong HK$264,488,059 100 100 Investmentholding and
managementservices
Century City (Nominees) Limited
Hong Kong HK$2 100 100 Nomineeservices
Century City (Secretaries) Limited
Hong Kong HK$2 100 100 Secretarialservices
世紀城市(北京)企業
管理有限公司 (i)
The People’sRepublic of China
(“PRC”)/Mainland China
HK$4,500,000 100 100 Corporatemanagement
Cityline Finance Limited Hong Kong HK$2 100 100 Financing
Cleverview Investments Limited
British Virgin Islands
US$1 100 100 Investmentholding
Fortunate Star Investments Limited
British Virgin Islands
US$1 100 100 Investmentholding

76
Notes to Financial Statements (Cont’d)
Annual Report 2017
Name
Place ofincorporation/
registration and business
Issued ordinaryshare capital/
registered capital/ issued units
Percentage of equity interest attributable
to the CompanyPrincipal
activities
2017 2016
Gold Concorde Holdings Limited
British Virgin Islands
US$1 100 100 Investmentholding
Meylink Limited British Virgin Islands
US$1 100 100 Investmentholding
PB Leasing Aircraft No. 24 Limited
Gibraltar GBP2,000 84.9 84.9 Aircraftownership
and leasing
Saxonworld Limited British Virgin Islands
US$1 100 100 Investmentholding
Smartaccord Limited British Virgin Islands
US$1 100 100 Investmentholding
Splendor Glow Limited British Virgin Islands
US$1 100 100 Investmentholding
Splendour Corporation British Virgin Islands
US$1 100 100 Investmentholding
T.M. Nominees Limited Hong Kong HK$2 100 100 Nomineeservices
Treasure Bright Holdings Limited
British Virgin Islands
US$1 100 100 Investmentholding
Treasure Pyramid Limited
British Virgin Islands
US$1 100 – Investmentholding
Zoom Wealth Investments Limited
British Virgin Islands
US$1 100 100 Aircraftownership
and leasing
Paliburg Holdings Limited (“PHL”)
Bermuda/Hong Kong
Ordinary -HK$111,458,547
62.3 62.3 Investmentholding
303 Technology Limited Hong Kong HK$2 62.3 62.3 Securitysystems and
software design,development
and distribution
Bajan Company Limited Hong Kong HK$2 62.3 62.3 Securitiesinvestment

77
Notes to Financial Statements (Cont’d)
Annual Report 2017
Name
Place ofincorporation/
registration and business
Issued ordinaryshare capital/
registered capital/ issued units
Percentage of equity interest attributable
to the CompanyPrincipal
activities
2017 2016
Chatwin Engineering Limited
Hong Kong HK$16,800,000 62.3 62.3 Buildingconstruction
Cosmos Best Development Limited
Hong Kong HK$2 62.3 62.3 Managementservices
Cosmos Gain Investment Limited
Hong Kong HK$2 62.3 62.3 Propertydevelopment
and investmentand financing
Farich Investment Limited Hong Kong HK$2 62.3 62.3 Investmentholding
Finso Limited Hong Kong HK$2 62.3 62.3 Investmentholding
Gain World Investments Limited
British Virgin Islands
US$1 62.3 62.3 Investmentholding
Glaser Holdings Limited British Virgin Islands
US$1 62.3 62.3 Investmentholding
Glorymark Investments Limited
British Virgin Islands
US$1 62.3 62.3 Investmentholding
Grand Equity Limited British Virgin Islands
US$1 62.3 62.3 Investmentholding
Guo Yui Investments Limited
British Virgin Islands
US$1 62.3 62.3 Investment holding
H.P. Nominees Limited Hong Kong HK$2 62.3 62.3 Investmentholding,
securitiesinvestment and
nominee services
Hang Fok Properties Limited
British Virgin Islands
US$100 52.4 52.1 Investment holding
Hilmark Investments Limited
British Virgin Islands
US$1 62.3 62.3 Investment holding
Leading Lighting Technology Limited
Hong Kong HK$1 62.3 62.3 Lightingtechnology
services

78
Notes to Financial Statements (Cont’d)
Annual Report 2017
Name
Place ofincorporation/
registration and business
Issued ordinaryshare capital/
registered capital/ issued units
Percentage of equity interest attributable
to the CompanyPrincipal
activities
2017 2016
Leading Technology Holdings Limited
British Virgin Islands
US$100 62.3 62.3 Investmentholding
Linkprofit Limited Hong Kong HK$1,000 62.3 62.3 Investmentholding
Paliburg BVI Holdings Limited
British Virgin Islands
HK$10 62.3 62.3 Investment holding
Paliburg Building Services Limited
Hong Kong HK$2 62.3 62.3 Mechanicaland electrical
engineeringservices
Paliburg Development BVI Holdings Limited
British Virgin Islands
US$1 62.3 62.3 Investmentholding
Paliburg Development Consultants Limited
Hong Kong HK$100,000 62.3 62.3 Propertydevelopment
consultancy
Paliburg Development Finance Limited
Hong Kong HK$2 62.3 62.3 Financing andsecurities
investment
Paliburg Estate Agents Limited
Hong Kong HK$20 62.3 62.3 Estate agent
Paliburg Estate Management Limited
Hong Kong HK$20 62.3 62.3 Estatemanagement
Paliburg Finance Limited Hong Kong HK$2 62.3 62.3 Financing
Paliburg Investments Limited
Hong Kong HK$526,506,860 62.3 62.3 Investment holding and
managementservices
Paliburg Property Development (Shanghai) Co., Ltd.(i)
PRC/Mainland China
US$10,000,000 62.3 62.3 Property development
and investment
Rich Pearl Limited Hong Kong HK$10,000 62.3 62.3 Financing
Sanefix Development Limited
Hong Kong HK$2 62.3 62.3 Property investment

79
Notes to Financial Statements (Cont’d)
Annual Report 2017
Name
Place ofincorporation/
registration and business
Issued ordinaryshare capital/
registered capital/ issued units
Percentage of equity interest attributable
to the CompanyPrincipal
activities
2017 2016
Shenzhen Leading Technology Co., Ltd.(i)
PRC/Mainland China
RMB20,000,000 62.3 62.3 Securitysystems and
software design,development
and distribution
Taylor Investments Ltd. British VirginIslands
US$1 62.3 62.3 Investmentholding
Transcar Investments Limited
British Virgin Islands
US$1 62.3 62.3 Investment holding
Wiggans Investments Limited
British Virgin Islands
US$1 62.3 62.3 Securities investment
Winrise Investments Limited
Hong Kong HK$2 62.3 62.3 Securitiesinvestment
Yield Star Limited British Virgin Islands
US$1 62.3 62.3 Investmentholding
Yieldtop Holdings Limited
British Virgin Islands
US$100 52.4 52.1 Investmentholding
昆明中美二戰友誼公園
文化傳播有限公司(ii)
PRC/Mainland China
RMB5,000,000 54.2 54.2 Projectmanagement
Advance Fame Investments Limited
Hong Kong HK$1 52.4 52.1 Propertydevelopment
Alpha Advantage Investments Limited
British Virgin Islands
US$1 52.4 52.1 Securitiesinvestment
Eminent Gold Investments Limited
Hong Kong HK$1 52.4 52.1 Propertydevelopment
Equal Advantage Limited Hong Kong HK$1 52.4 – Property investment
Estate Legend Investments Limited
Hong Kong HK$1 52.4 52.1 Financing
Fine Cosmos Development Limited
Hong Kong HK$2 52.4 52.1 Propertydevelopment
Fountain Sky Limited Hong Kong HK$2 52.4 52.1 Securitiesinvestment

80
Notes to Financial Statements (Cont’d)
Annual Report 2017
Name
Place ofincorporation/
registration and business
Issued ordinaryshare capital/
registered capital/ issued units
Percentage of equity interest attributable
to the CompanyPrincipal
activities
2017 2016
Great Select Holdings Limited
British Virgin Islands
US$1 52.4 52.1 Securities investment
Interzone Investments Limited
British Virgin Islands
US$1 52.4 52.1 Securities investment
Jumbo Pearl Investments Limited
British Virgin Islands
US$1 52.4 52.1 Securitiesinvestment
Lead Fortune Development Limited
Hong Kong HK$2 52.4 52.1 Propertydevelopment
and investment
Lendas Investments Limited
British Virgin Islands
US$1 52.4 52.1 Securities investment
Lucky Achievement Limited
Hong Kong HK$1 52.4 – Property investment
Multiple Achievement Limited
Hong Kong HK$1 52.4 – Property investment
New Multi-Profit Limited Hong Kong HK$1 52.4 – Property investment
P&R Finance Limited Hong Kong HK$1 52.4 52.1 Financing
P&R Holdings Limited (“P&R Holdings”)
British Virgin Islands
US$100 52.4 52.1 Investment holding
P&R Strategic Limited British Virgin Islands
US$1 52.4 52.1 Investment holding
Real Charm Investment Limited
Hong Kong HK$2 52.4 52.1 Propertydevelopment
and investment
Star Yield Investments Limited
Hong Kong HK$1 52.4 52.1 Propertydevelopment
Sun Joyous Investments Limited
British Virgin Islands
US$1 52.4 52.1 Securitiesinvestment
Super Residence Limited Hong Kong HK$1 52.4 – Property investment
Time Crest Investments Limited
British Virgin Islands
US$1 52.4 52.1 Securitiesinvestment

81
Notes to Financial Statements (Cont’d)
Annual Report 2017
Name
Place ofincorporation/
registration and business
Issued ordinaryshare capital/
registered capital/ issued units
Percentage of equity interest attributable
to the CompanyPrincipal
activities
2017 2016
Ultimate Lead Limited Hong Kong HK$1 52.4 52.1 Propertydevelopment
Valuegood International Limited
British Virgin Islands
US$1 52.4 52.1 Securitiesinvestment
Well Mount Investments Limited
British Virgin Islands
US$1 52.4 52.1 Securitiesinvestment
Winart Investments Limited
British Virgin Islands
US$1 52.4 52.1 Securities investment
富豪(重慶)股權投資基金 合夥企業(有限合夥)(iii)
PRC/Mainland China
RMB250,000,000 52.4 52.1 Investmentholding and
managementconsultancy
成都富譽實業有限公司(iv) PRC/Mainland China
RMB250,000,000 52.4 52.1 Investmentholding
Cosmopolitan International Holdings Limited (“Cosmopolitan”)
Cayman Islands/Hong Kong
Ordinary - HK$8,827,445
(2016 - HK$8,500,912)
37.2 36.8 Investment holding
Preference - HK$4,691,383
(2016 - HK$4,691,917)
51.9 51.5
Apex Team Limited Hong Kong HK$1 42.8 42.5 Financing
Cosmopolitan International Finance Limited
Hong Kong HK$1 42.8 42.5 Financing and financial assets
investment
Cosmopolitan International Management Services Limited
Hong Kong HK$1 42.8 42.5 Management services
Evercharm Investments Limited
British Virgin Islands
US$1 42.8 42.5 Financial assets investment
新疆麗寶生態開發 有限公司(i)
PRC/ Mainland China
US$16,800,000 42.8 42.5 Property development
成都富博房地產開發 有限公司(i)
PRC/Mainland China
HK$175,000,000 42.8 42.5 Propertydevelopment
天津市富都房地產開發 有限公司(i)
PRC/Mainland China
RMB650,000,000(2016 -
RMB1,200,000,000)
42.8 42.5 Propertydevelopment

82
Notes to Financial Statements (Cont’d)
Annual Report 2017
Name
Place ofincorporation/
registration and business
Issued ordinaryshare capital/
registered capital/ issued units
Percentage of equity interest attributable
to the CompanyPrincipal
activities
2017 2016
置富投資開發(成都)
有限公司 (i)
PRC/Mainland China
HK$336,000,960 42.8 42.5 Propertydevelopment
北京富利企業管理
有限公司 (i)
PRC/ Mainland China
RMB298,000,000 42.8 42.5 Investment holding
富宏(深圳)諮詢管理
有限公司 (i)
PRC/ Mainland China
RMB10,000,000 42.8 42.5 Development consultancy
上海久輝快遞有限公司 (ii), (vi) PRC/ Mainland China
RMB3,500,000 – 25.5 Logistics and related operations
Regal Hotels International Holdings Limited (“RHIHL”)
Bermuda/Hong Kong
Ordinary - HK$89,878,233
(2016 - HK$91,605,633)
42.6 41.8 Investment holding
Alpha Season Investments Limited
British Virgin Islands
US$1 42.6 41.8 Investment holding
Ascent Human Resources Holdings Limited
Hong Kong HK$2 42.6 41.8 Provision of housekeeping
services
Camomile Investments Limited
Hong Kong HK$2 42.6 41.8 Propertyinvestment
Capital Charm Holdings Limited
Hong Kong HK$1 42.6 41.8 Propertydevelopment
Cheerview Limited Hong Kong HK$1 42.6 41.8 Food and beverageoperations
Chest Gain Development Limited
Hong Kong HK$10,000 42.6 41.8 Propertydevelopment
and investment, and investment
holding
Clear Gain Investments Limited
Hong Kong HK$1 42.6 41.8 Property development
Come On Investment Company Limited
Hong Kong HK$10,000 42.6 41.8 Securitiestrading and investment
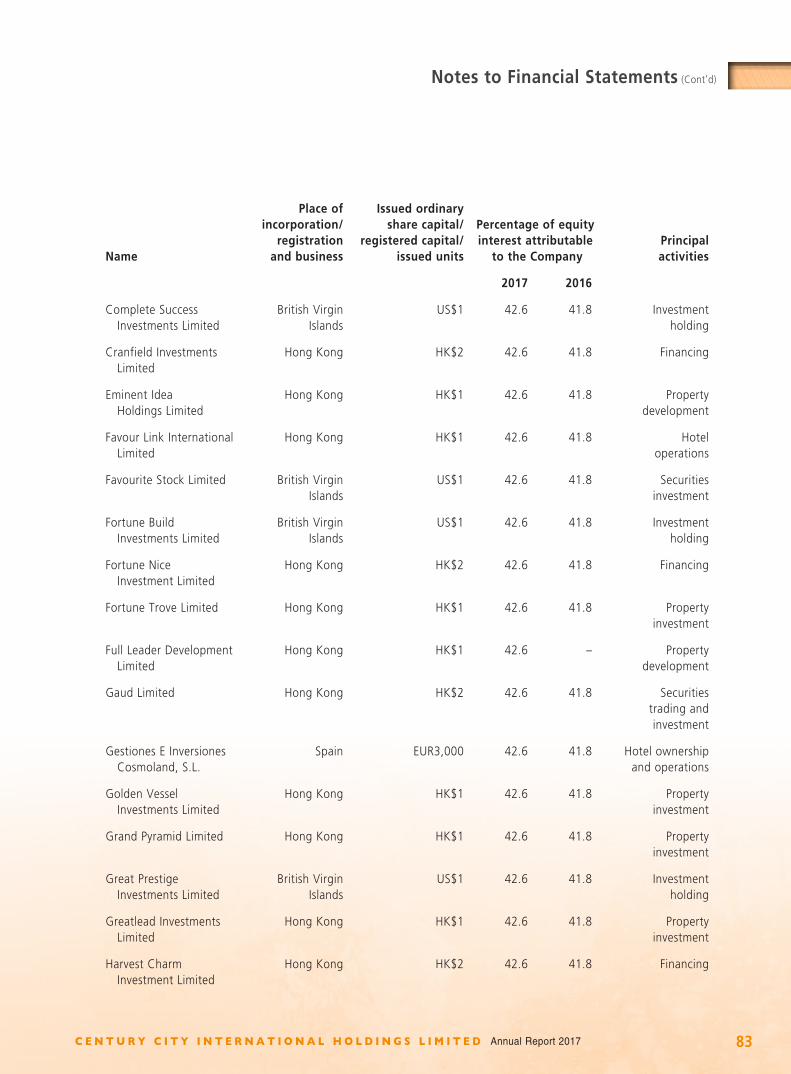
83
Notes to Financial Statements (Cont’d)
Annual Report 2017
Name
Place ofincorporation/
registration and business
Issued ordinaryshare capital/
registered capital/ issued units
Percentage of equity interest attributable
to the CompanyPrincipal
activities
2017 2016
Complete Success Investments Limited
British Virgin Islands
US$1 42.6 41.8 Investmentholding
Cranfield Investments Limited
Hong Kong HK$2 42.6 41.8 Financing
Eminent Idea Holdings Limited
Hong Kong HK$1 42.6 41.8 Property development
Favour Link International Limited
Hong Kong HK$1 42.6 41.8 Hotel operations
Favourite Stock Limited British Virgin Islands
US$1 42.6 41.8 Securitiesinvestment
Fortune Build Investments Limited
British Virgin Islands
US$1 42.6 41.8 Investmentholding
Fortune Nice Investment Limited
Hong Kong HK$2 42.6 41.8 Financing
Fortune Trove Limited Hong Kong HK$1 42.6 41.8 Propertyinvestment
Full Leader Development Limited
Hong Kong HK$1 42.6 – Property development
Gaud Limited Hong Kong HK$2 42.6 41.8 Securitiestrading andinvestment
Gestiones E Inversiones Cosmoland, S.L.
Spain EUR3,000 42.6 41.8 Hotel ownershipand operations
Golden Vessel Investments Limited
Hong Kong HK$1 42.6 41.8 Propertyinvestment
Grand Pyramid Limited Hong Kong HK$1 42.6 41.8 Propertyinvestment
Great Prestige Investments Limited
British Virgin Islands
US$1 42.6 41.8 Investmentholding
Greatlead Investments Limited
Hong Kong HK$1 42.6 41.8 Property investment
Harvest Charm Investment Limited
Hong Kong HK$2 42.6 41.8 Financing

84
Notes to Financial Statements (Cont’d)
Annual Report 2017
Name
Place ofincorporation/
registration and business
Issued ordinaryshare capital/
registered capital/ issued units
Percentage of equity interest attributable
to the CompanyPrincipal
activities
2017 2016
Hill Treasure Limited British VirginIslands
US$1 42.6 – Aircraft ownership and
leasing
Honormate Nominees Limited
Hong Kong HK$2 42.6 41.8 Securitiesinvestment
and nomineeservices
Honrich Investment Limited
Hong Kong HK$2 42.6 41.8 Financing
Jubilee Ace Holdings Limited
Hong Kong HK$1 42.6 41.8 Property investment
Kaybro Investments Limited
British VirginIslands
US$1 42.6 41.8 Investmentholding
Loraine Developments, S.L. Spain EUR3,000 42.6 41.8 Hotel ownership
Maximum Good Limited Hong Kong HK$1 42.6 41.8 Property investment
Metropolitan F&B Management Limited
Hong Kong HK$1 42.6 41.8 Provision of management
services for food and beverage
operations
Metropolitan Umami (Tsim Sha Tsui East) Limited
Hong Kong HK$1 42.6 41.8 Food and beverage operations
Million Sharp International Limited
Hong Kong HK$1 42.6 41.8 Property investment
New Blossom International Limited
British Virgin Islands
US$1 42.6 41.8 Investment holding
New Surplus Investments Limited
Hong Kong HK$1 – 41.8 Property investment
PBL0781 Limited Gibraltar GBP2,000 42.6 41.8 Aircraft ownership and
leasing
PBL1017 Limited Gibraltar GBP2,000 36.2 35.5 Aircraft ownership and
leasing

85
Notes to Financial Statements (Cont’d)
Annual Report 2017
Name
Place ofincorporation/
registration and business
Issued ordinaryshare capital/
registered capital/ issued units
Percentage of equity interest attributable
to the CompanyPrincipal
activities
2017 2016
Regal Contracting Agency Limited
Hong Kong HK$1 42.6 41.8 Contractingagency
Regal Estate Agents Limited Hong Kong HK$2 42.6 41.8 Estate agency
Regal Estate Management Limited
Hong Kong HK$2 42.6 41.8 Estatemanagement
Regal F&B Management Limited
Hong Kong HK$1 42.6 41.8 Provision of management
services for food and beverage
operation
Regal F&B (ROH) Limited Hong Kong HK$1 42.6 41.8 Food and beverage operation
Regal F&B (RRH) Limited Hong Kong HK$1 42.6 41.8 Food and beverage operation
Regal Hotels (Holdings) Limited
Hong Kong HK$1,151,598,638 42.6 41.8 Investmentholding and
managementservices
Regal Hotels Company Limited
Hong Kong HK$2 42.6 41.8 Investmentholding
Regal Hotels International Limited
Hong Kong HK$100,000 42.6 41.8 Hotelmanagement
and investmentholding
Regal Hotels Management (BVI) Limited
British VirginIslands/
Mainland China
US$1 42.6 41.8 Investmentholding
and hotelmanagement
Regal International Limited British VirginIslands
US$20 42.6 41.8 Investmentand trademark
holding
Regal International (BVI) Holdings Limited
British VirginIslands
HK$10.1 42.6 41.8 Investmentholding
Regal Portfolio Management Limited
Hong Kong HK$11,611,937 42.6 41.8 Assetmanagement

86
Notes to Financial Statements (Cont’d)
Annual Report 2017
Name
Place ofincorporation/
registration and business
Issued ordinaryshare capital/
registered capital/ issued units
Percentage of equity interest attributable
to the CompanyPrincipal
activities
2017 2016
Regal Quality Foods Limited
Hong Kong HK$2 42.6 41.8 Sale of foodproducts
RH International Finance Limited
British Virgin Islands/
Hong Kong
US$1 42.6 41.8 Financing
R.H.I. Licensing B.V. The Netherlands NLG40,000 42.6 41.8 Trademarkholding
Rich Capital Investment Limited
Hong Kong HK$1 42.6 – Property development
Solution Key Investments Limited
Hong Kong HK$1 42.6 41.8 Propertyinvestment
Speedy Track Limited Hong Kong HK$1 42.6 41.8 Property investment
Success Path Investments Limited
Hong Kong HK$1 42.6 41.8 Property investment
Swift Lion Investments Limited
British VirginIslands
US$1 42.6 41.8 Aircraft ownership
and leasing
Tenshine Limited Hong Kong HK$2 42.6 41.8 Securitiestrading andinvestment
and financing
Top Esteem Investments Limited
British VirginIslands
US$1 42.6 41.8 Aircraft ownership
and leasing
Total Blessing Limited British VirginIslands
US$1 42.6 – Investmentholding
Total Wisdom Investments Limited
British VirginIslands
US$1 42.6 41.8 Investmentholding
Treasure Dealer Limited Hong Kong HK$1 42.6 41.8 Propertyinvestment
Treasure Wagon Company Limited
Hong Kong HK$2 42.6 41.8 Operation of security storage lounge
Triumphant Sky Investments Limited
British VirginIslands
US$1 42.6 41.8 Aircraft ownership
and leasing

87
Notes to Financial Statements (Cont’d)
Annual Report 2017
Name
Place ofincorporation/
registration and business
Issued ordinaryshare capital/
registered capital/ issued units
Percentage of equity interest attributable
to the CompanyPrincipal
activities
2017 2016
Unicorn Star Limited British VirginIslands
US$1 42.6 41.8 Securitiesinvestment
Unique Sky Holdings Limited
British VirginIslands
US$1 42.6 41.8 Investmentholding
Vast Charm International Limited
Hong Kong HK$1 42.6 41.8 Propertyinvestment
Wealth Virtue Investments Limited
British VirginIslands
US$1 42.6 41.8 Investmentholding
Wealthy Path Investments Limited
British VirginIslands
US$1 42.6 41.8 Investmentholding
Wealthy Smart Investments Limited
British VirginIslands
US$1 42.6 41.8 Investmentholding
Wing Bright Holdings Limited
British VirginIslands
US$1 42.6 100 Investment holding
Will Smart Investments Limited
Hong Kong HK$1 42.6 41.8 Propertyinvestment
Yuanman Enterprise Limited
Hong Kong HK$1 42.6 – Property investment
廣州市富堡訂房服務
有限公司(i)
PRC/Mainland China
RMB100,000 42.6 41.8 Roomreservation
services
富豪酒店投資管理(上海)
有限公司 (i)
PRC/Mainland China
US$140,000 42.6 41.8 Hotelmanagement
上海八端旅遊服務
有限公司(i)
PRC/Mainland China
US$375,000 42.6 41.8 Travel agency
Regal Real Estate Investment Trust (“Regal REIT”)
Hong Kong 3,257,431,189units
31.8 31.2 Propertyinvestment
Bauhinia Hotels Limited Hong Kong HK$2 31.8 31.2 Hotel ownership
Cityability Limited Hong Kong HK$10,000 31.8 31.2 Hotel ownership
Gala Hotels Limited Hong Kong HK$2 31.8 31.2 Hotel ownership

88
Notes to Financial Statements (Cont’d)
Annual Report 2017
Name
Place ofincorporation/
registration and business
Issued ordinaryshare capital/
registered capital/ issued units
Percentage of equity interest attributable
to the CompanyPrincipal
activities
2017 2016
Land Crown International Limited(v)
Hong Kong HK$1 31.8 26.0 Hotel ownership
Prosper Harvest Investments Limited(v)
British Virgin Islands
US$2 31.8 26.0 Investment holding
Regal Asset Holdings Limited
Bermuda/Hong Kong
US$12,000 31.8 31.2 Investmentholding
Regal Riverside Hotel Limited
Hong Kong HK$2 31.8 31.2 Hotel ownership
Rich Day Investments Limited
Hong Kong HK$1 31.8 31.2 Financing
Ricobem Limited Hong Kong HK$100,000 31.8 31.2 Hotel ownership
Sonnix Limited Hong Kong HK$2 31.8 31.2 Property
ownership andhotel operations
R-REIT International Finance Limited
British VirginIslands
US$1 31.8 31.2 Financing
Tristan Limited Hong Kong HK$20 31.8 31.2 Hotel ownership
Wise Decade Investments Limited
Hong Kong HK$1 31.8 31.2 Hotel ownership
Notes:
(i) These subsidiaries are registered as wholly foreign owned enterprises under PRC law.
(ii) These subsidiaries are registered as domestic enterprises under PRC law.
(iii) This is a fund registered as a limited partnership under PRC partnership law.
(iv) This subsidiary is registered as a foreign owned enterprise under PRC law.
(v) During the year, the Group reacquired 50% equity interest in these companies and they became subsidiaries of the Company thereafter. Further details are included in note 16 to the financial statements.
(vi) During the year, the Group disposed of the entire equity interest in a group of companies principally engaged in the provision of logistics and related services in Shanghai, the PRC. Further details of the disposal are included in note 43(c)(i) to the financial statements.
Except for Century City BVI Holdings Limited, all of the above subsidiaries are indirectly held by the Company.
The above table lists the subsidiaries of the Company which, in the opinion of the Directors, principally affected the results for the year or formed a substantial portion of the net assets of the Group. To give details of other subsidiaries would, in the opinion of the Directors, result in particulars of excessive length.

89
Notes to Financial Statements (Cont’d)
Annual Report 2017
2.1 BASIS OF PREPARATION
These financial statements have been prepared in accordance with Hong Kong Financial Reporting Standards (“HKFRSs”) (which include all Hong Kong Financial Reporting Standards, Hong Kong Accounting Standards (“HKASs”) and Interpretations) issued by the Hong Kong Institute of Certified Public Accountants (“HKICPA”), accounting principles generally accepted in Hong Kong and the disclosure requirements of the Hong Kong Companies Ordinance. They have been prepared under the historical cost convention, except for investment properties, certain available-for-sale investments, financial assets at fair value through profit or loss, contingent consideration receivable and derivative financial instruments, which have been measured at fair value. Aircraft held for sale are stated at the lower of their carrying amounts and fair values less costs to sell as further explained in note 2.4. These financial statements are presented in Hong Kong dollars (“HK$”) and all values are rounded to the nearest million except when otherwise indicated.
Basis of consolidation
The consolidated financial statements include the financial statements of the Group for the year ended 31st December, 2017. A subsidiary is an entity (including a structured entity), directly or indirectly, controlled by the Company. Control is achieved when the Group is exposed, or has rights, to variable returns from its involvement with the investee and has the ability to affect those returns through its power over the investee (i.e., existing rights that give the Group the current ability to direct the relevant activities of the investee).
When the Company has, directly or indirectly, less than a majority of the voting or similar rights of an investee, the Group considers all relevant facts and circumstances in assessing whether it has power over an investee, including:
(a) the contractual arrangement with the other vote holders of the investee;
(b) rights arising from other contractual arrangements; and
(c) the Group’s voting rights and potential voting rights.
The financial statements of the subsidiaries are prepared for the same reporting period as the Company, using consistent accounting policies. The results of subsidiaries are consolidated from the date on which the Group obtains control, and continue to be consolidated until the date that such control ceases.
Profit or loss and each component of other comprehensive income are attributed to the owners of the parent of the Group and to the non-controlling interests, even if this results in the non-controlling interests having a deficit balance. All intra-group assets and liabilities, equity, income, expenses and cash flows relating to transactions between members of the Group are eliminated in full on consolidation.
The Group reassesses whether or not it controls an investee if facts and circumstances indicate that there are changes to one or more of the three elements of control described above. A change in the ownership interest of a subsidiary, without a loss of control, is accounted for as an equity transaction.
If the Group loses control over a subsidiary, it derecognises (i) the assets (including goodwill) and liabilities of the subsidiary, (ii) the carrying amount of any non-controlling interest and (iii) the cumulative translation differences recorded in equity; and recognises (i) the fair value of the consideration received, (ii) the fair value of any investment retained and (iii) any resulting surplus or deficit in profit or loss. The Group’s share of components previously recognised in other comprehensive income is reclassified to profit or loss or retained profits, as appropriate, on the same basis as would be required if the Group had directly disposed of the related assets or liabilities.

90
Notes to Financial Statements (Cont’d)
Annual Report 2017
2.2 CHANGES IN ACCOUNTING POLICIES AND DISCLOSURES
The Group has adopted the following revised HKFRSs for the first time for the current year’s financial statements.
Amendments to HKAS 7 Disclosure InitiativeAmendments to HKAS 12 Recognition of Deferred Tax Assets for Unrealised LossesAmendments to HKFRS 12 included in Annual Improvements to HKFRSs 2014-2016 Cycle
Disclosure of Interests in Other Entities: Clarification of the Scope of HKFRS 12
Other than as explained below regarding the impact of amendments to HKAS 7, the adoption of the above revised standards has had no significant financial effect on these financial statements.
Amendments to HKAS 7 require an entity to provide disclosures that enable users of financial statements to evaluate changes in liabilities arising from financing activities, including both changes arising from cash flows and non-cash changes. Disclosure of the changes in liabilities arising from financing activities is provided in note 43(b) to the financial statements.
2.3 ISSUED BUT NOT YET EFFECTIVE HONG KONG FINANCIAL REPORTING STANDARDS
The Group has not applied the following new and revised HKFRSs, that have been issued but are not yet effective, in these financial statements.
Amendments to HKFRS 2 Classification and Measurement of Share-based Payment Transactions 1
Amendments to HKFRS 4 Applying HKFRS 9 Financial Instruments with HKFRS 4 Insurance Contracts1
HKFRS 9 Financial Instruments 1
Amendments to HKFRS 9 Prepayment Features with Negative Compensation 2
Amendments to HKFRS 10 and HKAS 28 (2011)
Sale or Contribution of Assets between an Investor and its Associate or Joint Venture4
HKFRS 15 Revenue from Contracts with Customers 1
Amendments to HKFRS 15 Clarifications to HKFRS 15 Revenue from Contracts with Customers 1
HKFRS 16 Leases 2
HKFRS 17 Insurance Contracts 3
Amendments to HKAS 28 Long-term Interests in Associates and Joint Ventures 2
Amendments to HKAS 40 Transfers of Investment Property 1
HK(IFRIC)-Int 22 Foreign Currency Transactions and Advance Consideration 1
HK(IFRIC)-Int 23 Uncertainty over Income Tax Treatments 2
Annual Improvements to HKFRSs 2014-2016 Cycle
Amendments to HKFRS 1 and HKAS 281
Annual Improvements to HKFRSs 2015-2017 Cycle
Amendments to HKFRS 3, HKFRS 11, HKAS 12 and HKAS 232
1 Effective for annual periods beginning on or after 1st January, 20182 Effective for annual periods beginning on or after 1st January, 20193 Effective for annual periods beginning on or after 1st January, 20214 No mandatory effective date yet determined but available for adoption

91
Notes to Financial Statements (Cont’d)
Annual Report 2017
Further information about those HKFRSs that are expected to be applicable to the Group is described below. Of those standards, HKFRS 9 and HKFRS 15 will be applicable for the Group’s financial year ending 31st December, 2018 and are expected to have certain impacts upon adoption. Whilst management has performed an assessment of the estimated impacts of these standards, that assessment is based on the information currently available to the Group. The actual impacts upon adoption could be different to those below, depending on additional reasonable and supportable information being made available to the Group at the time of applying the standards.
In September 2014, the HKICPA issued the final version of HKFRS 9, bringing together all phases of the financial instruments project to replace HKAS 39 and all previous versions of HKFRS 9. The standard introduces new requirements for classification and measurement, impairment and hedge accounting. The Group will adopt HKFRS 9 from 1st January, 2018. The Group will not restate comparative information and will recognise any transition adjustments against the opening balance of equity at 1st January, 2018. During 2017, the Group has performed an assessment of the impacts of the adoption of HKFRS 9. The expected impacts relate to the classification and measurement and the impairment requirements which are summarised as follows:
(a) Classification and measurement
Upon adoption of HKFRS 9, the classification and measurement of financial assets depends on two assessments: the financial asset’s contractual cash flow characteristics and the entity’s business model for managing the financial asset. The Group does not expect that the adoption of HKFRS 9 will have a significant impact on the classification and measurement of its financial assets except:
‧ the Group’s equity investments currently classified as available-for-sale investments will be reclassified to financial assets at fair value through profit or loss or other comprehensive income;
‧ the financial assets which are not held to collect contractual cash flows will be reclassified as financial assets at fair value through other comprehensive income.
Certain of equity investments currently held as available for sale will be measured at fair value through other comprehensive income as the investments are intended to be held for the foreseeable future and the Group expects to apply the option to present fair value changes in other comprehensive income. Gains and losses recorded in other comprehensive income for the equity investments cannot be recycled to profit or loss when the investments are derecognised.
(b) Impairment
HKFRS 9 requires an impairment on debt instruments recorded at amortised cost or at fair value through other comprehensive income, lease receivables, loan commitments and financial guarantee contracts that are not accounted for at fair value through profit or loss under HKFRS 9, to be recorded based on an expected credit loss model either on a twelve-month basis or a lifetime basis. The Group will apply the simplified approach and record lifetime expected losses that are estimated based on the present values of all cash shortfalls over the remaining life of all of its trade receivables. Furthermore, the Group will apply the general approach and record twelve-month expected credit losses that are estimated based on the possible default events on its other receivables within the next twelve months. The Group has determined that, due to the unsecured nature of certain of its trade and other receivables, the provision for impairment may increase upon the initial adoption of the standard.

92
Notes to Financial Statements (Cont’d)
Annual Report 2017
HKFRS 15, issued in July 2014, establishes a new five-step model to account for revenue arising from contracts with customers. Under HKFRS 15, revenue is recognised at an amount that reflects the consideration to which an entity expects to be entitled in exchange for transferring goods or services to a customer. The principles in HKFRS 15 provide a more structured approach for measuring and recognising revenue. The standard also introduces extensive qualitative and quantitative disclosure requirements, including disaggregation of total revenue, information about performance obligations, changes in contract asset and liability account balances between periods and key judgements and estimates. The standard will supersede all current revenue recognition requirements under HKFRSs. Either a full retrospective application or a modified retrospective adoption is required on the initial application of the standard. In June 2016, the HKICPA issued amendments to HKFRS 15 to address the implementation issues on identifying performance obligations, application guidance on principal versus agent and licences of intellectual property, and transition. The amendments are also intended to help ensure a more consistent application when entities adopt HKFRS 15 and decrease the cost and complexity of applying the standard. The Group plans to adopt the transitional provisions in HKFRS 15 to recognise the cumulative effect of initial adoption as an adjustment to the opening balance of retained profits at 1st January, 2018. In addition, the Group plans to apply the new requirements only to contracts that are not completed before 1st January, 2018. The Group expects that the transitional adjustment to be made on 1st January, 2018 upon initial adoption of HKFRS 15 may not be material. However, the expected changes in accounting policies, as further explained below, may have material impacts on the Group’s financial statements from 2018 onwards. During 2017, the Group has performed an assessment on the impacts of the adoption of HKFRS 15.
The Group is principally engaged in property development and investment, construction and building related businesses, hotel ownership, hotel operation and management, asset management, aircraft ownership and leasing business, and other investments including financial assets investments. The expected impacts arising from the adoption of HKFRS 15 on the Group are summarised as follows:
(a) Timing of revenue recognition for sale of properties
Based on the Group’s current accounting policy, income from the sale of properties is recognised when the significant risks and rewards of ownership of the properties have been transferred to the property buyers, provided that the Group maintains neither managerial involvement to the degree usually associated with ownership, nor effective control over the properties sold.
Upon the adoption of HKFRS 15, income from the sale of properties will be recognised when control over the properties is transferred to the property buyers. Judgement will be required to assess whether control transfers over time or at a point of time. Properties that have no alternative use to the Group due to contractual restriction and when the Group has an enforceable right to payment from the property buyers for performance completed to date, the Group will recognise revenue as the performance obligations are satisfied over time by applying an input method for measuring progress.
The Group has preliminarily assessed that the sale agreements used by the Group are standardised in a large extent and in the case of pre-completion sales using standard agreements for sale and purchase, the Group does not have an enforceable right to payment for performance completed to date in accordance with HKFRS 15, and accordingly, the criteria for recognising revenue over time are not met for the majority of the sale of properties. The Group expects to recognise majority of the sale of properties until the point in time at which the Group delivers the properties to the buyers. The Group does not anticipate that the adoption of HKFRS 15 will have a material impact on the timing of revenue recognised in the respective periods.
93
Notes to Financial Statements (Cont’d)
Annual Report 2017
(b) Financing component for sale of properties
HKFRS 15 requires property developers to account for the financing component in a contract separately from revenue if the financing effects are significant, subject to a practical expedient where the period between the payment and delivery of properties will be less than one year. Currently, it is expected that the length of time between the payment and delivery of some properties of the Group will exceed one year. Accordingly, the financing component is considered to be significant. The amount of the financing component is estimated at the contract inception and the payment plan is confirmed by the property buyer by using a discount rate that would be reflected in a separate financing transaction between the Group and the property buyer reflecting the credit characteristics of the Group as well as any collateral or security provided. Interest expense is recognised only to the extent that a contract liability (deposits received) is recognised in accounting for the contract with the property buyer. The Group expects an adjustment to increase the current year opening retained profits with a corresponding increase in deposits received.
In addition, the adoption of HKFRS 15 in the future will result in more disclosures in the consolidated financial statements.
HKFRS 16, issued in May 2016, replaces HKAS 17 Leases, HK(IFRIC)-Int 4 Determining whether an Arrangement contains a Lease , HK(SIC)-Int 15 Operating Leases - Incentives and HK(SIC)-Int 27 Evaluating the Substance of Transactions Involving the Legal Form of a Lease . The standard sets out the principles for the recognition, measurement, presentation and disclosure of leases and requires lessees to recognise assets and liabilities for most leases. The standard includes two elective recognition exemptions for lessees – leases of low-value assets and short-term leases. At the commencement date of a lease, a lessee will recognise a liability to make lease payments (i.e., the lease liability) and an asset representing the right to use the underlying asset during the lease term (i.e., the right-of-use asset). The right-of-use asset is subsequently measured at cost less accumulated depreciation and any impairment losses unless the right-of-use asset meets the definition of investment property in HKAS 40, or relates to a class of property, plant and equipment to which the revaluation model is applied. The lease liability is subsequently increased to reflect the interest on the lease liability and reduced for the lease payments. Lessees will be required to separately recognise the interest expense on the lease liability and the depreciation expense on the right-of-use asset. Lessees will also be required to remeasure the lease liability upon the occurrence of certain events, such as change in the lease term and change in future lease payments resulting from a change in an index or rate used to determine those payments. Lessees will generally recognise the amount of the remeasurement of the lease liability as an adjustment to the right-of-use asset. Lessor accounting under HKFRS 16 is substantially unchanged from the accounting under HKAS 17. Lessors will continue to classify all leases using the same classification principle as in HKAS 17 and distinguish between operating leases and finance leases. HKFRS 16 requires lessees and lessors to make more extensive disclosures than under HKAS 17. Lessees can choose to apply the standard using either a full retrospective or a modified retrospective approach. The Group expects to adopt HKFRS 16 from 1st January, 2019. The Group is currently assessing the impact of HKFRS 16 upon adoption and is considering whether it will choose to take advantage of the practical expedients available and which transition approach and reliefs will be adopted. As disclosed in note 47(b) to the financial statements, at 31st December, 2017, the Group had future minimum lease payments under non-cancellable operating leases in aggregate of approximately HK$58.9 million. Upon adoption of HKFRS 16, certain amounts included therein may need to be recognised as new right-of-use assets and lease liabilities. Further analysis, however, will be needed to determine the amount of new rights of use assets and lease liabilities to be recognised, including, but not limited to, any amounts relating to leases of low-value assets and short term leases, other practical expedients and reliefs chosen, and new leases entered into before the date of adoption.

94
Notes to Financial Statements (Cont’d)
Annual Report 2017
2.4 SUMMARY OF SIGNIFICANT ACCOUNTING POLICIES
(a) Business combinations and goodwill
Business combinations are accounted for using the acquisition method. The consideration transferred is measured at the acquisition date fair value which is the sum of the acquisition date fair values of assets transferred by the Group, liabilities assumed by the Group to the former owners of the acquiree and the equity interests issued by the Group in exchange for control of the acquiree. For each business combination, the Group elects whether to measure the non-controlling interests in the acquiree that are present ownership interests and entitle their holders to a proportionate share of net assets in the event of liquidation at fair value or at the proportionate share of the acquiree’s identifiable net assets. All other components of non-controlling interests are measured at fair value. Acquisition-related costs are expensed as incurred.
When the Group acquires a business, it assesses the financial assets and liabilities assumed for appropriate classification and designation in accordance with the contractual terms, economic circumstances and pertinent conditions as at the acquisition date. This includes the separation of embedded derivatives in host contracts of the acquiree.
If the business combination is achieved in stages, the previously held equity interest is remeasured at its acquisition date fair value and any resulting gain or loss is recognised in profit or loss.
Any contingent consideration to be transferred by the acquirer is recognised at fair value at the acquisition date. Contingent consideration classified as an asset or liability is measured at fair value with changes in fair value recognised in profit or loss. Contingent consideration that is classified as equity is not remeasured and subsequent settlement is accounted for within equity.
Goodwill is initially measured at cost, being the excess of the aggregate of the consideration transferred, the amount recognised for non-controlling interests and any fair value of the Group’s previously held equity interests in the acquiree over the identifiable net assets acquired and liabilities assumed. If the sum of this consideration and other items is lower than the fair value of the net assets acquired, the difference is, after reassessment, recognised in profit or loss as a gain on bargain purchase.
After initial recognition, goodwill is measured at cost less any accumulated impairment losses. Goodwill is tested for impairment annually or more frequently if events or changes in circumstances indicate that the carrying value may be impaired. The Group performs its annual impairment test of goodwill as at 31st December. For the purpose of impairment testing, goodwill acquired in a business combination is, from the acquisition date, allocated to each of the Group’s cash-generating units, or groups of cash-generating units, that are expected to benefit from the synergies of the combination, irrespective of whether other assets or liabilities of the Group are assigned to those units or groups of units.
Impairment is determined by assessing the recoverable amount of the cash-generating unit (group of cash- generating units) to which the goodwill relates. Where the recoverable amount of the cash-generating unit (group of cash-generating units) is less than the carrying amount, an impairment loss is recognised. An impairment loss recognised for goodwill is not reversed in a subsequent period.
Where goodwill has been allocated to a cash-generating unit (or group of cash-generating units) and part of the operation within that unit is disposed of, the goodwill associated with the operation disposed of is included in the carrying amount of the operation when determining the gain or loss on the disposal. Goodwill disposed of in these circumstances is measured based on the relative value of the operation disposed of and the portion of the cash-generating unit retained.

95
Notes to Financial Statements (Cont’d)
Annual Report 2017
(b) Investments in associates and a joint venture
An associate is an entity in which the Group has a long term interest of generally not less than 20% of the equity voting rights and over which it is in a position to exercise significant influence. Significant influence is the power to participate in the financial and operating policy decisions of the investee, but is not control or joint control over those policies.
A joint venture is a type of joint arrangement whereby the parties that have joint control of the arrangement have rights to the net assets of the joint venture. Joint control is the contractually agreed sharing of control of an arrangement, which exists only when decisions about the relevant activities require the unanimous consent of the parties sharing control.
The Group’s investments in associates and a joint venture are stated in the consolidated statement of financial position at the Group’s share of net assets under the equity method of accounting, less any impairment losses. Adjustments are made to bring into line any dissimilar accounting policies that may exist. The Group’s share of the post-acquisition results and other comprehensive income of associates and a joint venture is included in the consolidated statement of profit or loss and consolidated other comprehensive income, respectively. In addition, when there has been a change recognised directly in the equity of the associate or joint venture, the Group recognises its share of any changes, when applicable, in the consolidated statement of changes in equity. Unrealised gains and losses resulting from transactions between the Group and its associates or joint venture are eliminated to the extent of the Group’s investments in the associates or joint venture, except where unrealised losses provide evidence of an impairment of the assets transferred.
If an investment in an associate becomes an investment in a joint venture or vice versa, the retained interest is not remeasured. Instead, the investment continues to be accounted for under the equity method. In all other cases, upon loss of significant influence over the associate or joint control over the joint venture, the Group measures and recognises any retained investment at its fair value. Any difference between the carrying amount of the associate or joint venture upon loss of significant influence or joint control and the fair value of the retained investment and proceeds from disposal is recognised in profit or loss.
(c) Interests in joint operations
A joint operation is a joint arrangement whereby the parties that have joint control of the arrangement have rights to the assets, and obligations for the liabilities, relating to the arrangement. Joint control is the contractually agreed sharing of control of an arrangement, which exists only when decisions about the relevant activities require the unanimous consent of the parties sharing control.
The Group recognises in relation to its interests in joint operations:
‧ its assets, including its share of any assets held jointly;
‧ its liabilities, including its share of any liabilities incurred jointly;
‧ its revenue from the sale of its share of the output arising from the joint operations;
‧ its share of the revenue from the sale of the output by the joint operations; and
‧ its expenses, including its share of any expenses incurred jointly.
The assets, liabilities, revenues and expenses relating to the Group’s interests in joint operations are accounted for in accordance with the HKFRSs applicable to the particular assets, liabilities, revenues and expenses.

96
Notes to Financial Statements (Cont’d)
Annual Report 2017
(d) Fair value measurement
The Group measures its investment properties, contingent consideration receivable, derivative financial instruments and certain investments at fair value at the end of each reporting period. Fair value is the price that would be received to sell an asset or paid to transfer a liability in an orderly transaction between market participants at the measurement date. The fair value measurement is based on the presumption that the transaction to sell the asset or transfer the liability takes place either in the principal market for the asset or liability, or in the absence of a principal market, in the most advantageous market for the asset or liability. The principal or the most advantageous market must be accessible by the Group. The fair value of an asset or a liability is measured using the assumptions that market participants would use when pricing the asset or liability, assuming that market participants act in their economic best interest.
A fair value measurement of a non-financial asset takes into account a market participant’s ability to generate economic benefits by using the asset in its highest and best use or by selling it to another market participant that would use the asset in its highest and best use.
The Group uses valuation techniques that are appropriate in the circumstances and for which sufficient data are available to measure fair value, maximising the use of relevant observable inputs and minimising the use of unobservable inputs.
All assets and liabilities for which fair value is measured or disclosed in the financial statements are categorised within the fair value hierarchy, described as follows, based on the lowest level input that is significant to the fair value measurement as a whole:
Level 1 – based on quoted prices (unadjusted) in active markets for identical assets or liabilities
Level 2 – based on valuation techniques for which the lowest level input that is significant to the fair value measurement is observable, either directly or indirectly
Level 3 – based on valuation techniques for which the lowest level input that is significant to the fair value measurement is unobservable
For assets and liabilities that are recognised in the financial statements on a recurring basis, the Group determines whether transfers have occurred between levels in the hierarchy by reassessing categorisation (based on the lowest level input that is significant to the fair value measurement as a whole) at the end of each reporting period.
(e) Impairment of non-financial assets
Where an indication of impairment exists, or when annual impairment testing for an asset is required (other than inventories, properties held for sale, construction contract assets, financial assets, investment properties and deferred tax assets), the asset’s recoverable amount is estimated. An asset’s recoverable amount is the higher of the asset’s or cash-generating unit’s value in use and its fair value less costs of disposal, and is determined for an individual asset, unless the asset does not generate cash inflows that are largely independent of those from other assets or groups of assets, in which case the recoverable amount is determined for the cash-generating unit to which the asset belongs.
An impairment loss is recognised only if the carrying amount of an asset exceeds its recoverable amount. In assessing value in use, the estimated future cash flows are discounted to their present value using a pre-tax discount rate that reflects current market assessments of the time value of money and the risks specific to the

97
Notes to Financial Statements (Cont’d)
Annual Report 2017
asset. An impairment loss is charged to the statement of profit or loss in the period in which it arises in those expense categories consistent with the function of the impaired asset.
An assessment is made at the end of each reporting period as to whether there is an indication that previously recognised impairment losses may no longer exist or may have decreased. If such an indication exists, the recoverable amount is estimated. A previously recognised impairment loss of an asset other than goodwill is reversed only if there has been a change in the estimates used to determine the recoverable amount of that asset, but not to an amount higher than the carrying amount that would have been determined (net of any depreciation/amortisation) had no impairment loss been recognised for the asset in prior years. A reversal of such an impairment loss is credited to the statement of profit or loss in the period in which it arises.
(f) Investment properties
Investment properties are interests in land and buildings (including the leasehold interest under an operating lease for a property which would otherwise meet the definition of an investment property) held to earn rental income and/or for capital appreciation, rather than for use in the production or supply of goods or services or for administrative purposes; or for sale in the ordinary course of business. Such properties are measured initially at cost, including transaction costs. Subsequent to initial recognition, investment properties are stated at fair value, which reflects market conditions at the end of the reporting period.
Gains or losses arising from changes in the fair values of investment properties are included in the statement of profit or loss in the year in which they arise.
Any gains or losses on the retirement or disposal of an investment property are recognised in the statement of profit or loss in the year of the retirement or disposal.
For a transfer from investment properties to owner-occupied properties, the deemed cost of a property for subsequent accounting is its fair value at the date of change in use. If a property occupied by the Group as an owner-occupied property becomes an investment property, the Group accounts for such property in accordance with the policy stated under “Property, plant and equipment and depreciation” up to the date of change in use, and any difference at that date between the carrying amount and the fair value of the property is accounted for as a revaluation in accordance with the policy stated under “Property, plant and equipment and depreciation” below. For a transfer from properties held for sale to investment properties, any difference between the fair value of the property at the date of change in use and its previous carrying amount is recognised in the statement of profit or loss.
(g) Intangible assets (other than goodwill)
Intangible assets acquired separately are measured on initial recognition at cost. The cost of intangible assets acquired in a business combination is the fair value at the date of acquisition. The useful lives of intangible assets are assessed to be either finite or indefinite. Intangible assets with finite lives are subsequently amortised on the straight-line basis over the useful economic lives and assessed for impairment whenever there is an indication that the intangible asset may be impaired. The amortisation period and the amortisation method for an intangible asset with a finite useful life are reviewed at least at each financial year end.
Intangible assets with indefinite useful lives are tested for impairment annually either individually or at the cash-generating unit level. Such intangible assets are not amortised. The useful life of an intangible asset with an indefinite life is reviewed annually to determine whether the indefinite life assessment continues to be supportable. If not, the change in the useful life assessment from indefinite to finite is accounted for on a prospective basis.
98
Notes to Financial Statements (Cont’d)
Annual Report 2017
The Group’s intangible assets represent (i) backlog contracts, favourable lease agreement, non-compete and consultancy arrangements with finite useful lives and are stated at cost, which comprise the purchase prices thereof, less accumulated amortisation and any impairment losses; and (ii) trademark with indefinite useful life, which is stated at cost less any impairment losses.
The estimated useful life of each class of intangible assets is as follows:
Non-compete and consultancy arrangements 4 to 13 yearsBacklog contracts 2 yearsFavourable lease agreement 8 years
Trademark of the Group is regarded to have indefinite useful life as there is no foreseeable limit to the period over which it is expected to generate cash flows for the Group.
(h) Borrowing costs
Borrowing costs directly attributable to the acquisition and construction of qualifying assets, i.e., assets that necessarily take a substantial period of time to get ready for their intended use or sale, are capitalised as part of the cost of those assets. The capitalisation of such borrowing costs ceases when the assets are substantially ready for their intended use or sale. Interest is capitalised at the interest rates related to specific development project borrowings. All other borrowing costs are expensed in the period in which they are incurred. Borrowing costs consist of interest and other costs that an entity incurs in connection with the borrowing of funds.
Where funds are borrowed generally and used for the purpose of obtaining qualifying assets, a capitalisation rate ranging from 2.4% to 4.3% has been applied to the expenditure on the individual assets.
(i) Non-current assets held for sale
Non-current assets are classified as held for sale if their carrying amounts will be recovered principally through a sales transaction rather than through continuing use. For this to be the case, the asset must be available for immediate sale in its present condition subject only to terms that are usual and customary for the sale of such assets and its sale must be highly probable.
Non-current assets (other than investment properties and financial assets) classified as held for sale are measured at the lower of their carrying amounts and fair values less costs to sell. Property, plant and equipment classified as held for sale are not depreciated.
(j) Investments and other financial assets
Initial recognition and measurementFinancial assets are classified, at initial recognition, as financial assets at fair value through profit or loss, loans and receivables, available-for-sale financial investments and held-to-maturity investments, as appropriate. When financial assets are recognised initially, they are measured at fair value plus transaction costs that are attributable to the acquisition of the financial assets, except in the case of financial assets recorded at fair value through profit or loss.
All regular way purchases and sales of financial assets are recognised on the trade date, that is, the date that the Group commits to purchase or sell the asset. Regular way purchases or sales are purchases or sales of financial assets that require delivery of assets within the period generally established by regulation or convention in the marketplace.

99
Notes to Financial Statements (Cont’d)
Annual Report 2017
Subsequent measurementThe subsequent measurement of financial assets depends on their classification as follows:
Financial assets at fair value through profit or lossFinancial assets at fair value through profit or loss include financial assets held for trading, financial assets designated upon initial recognition as at fair value through profit or loss and contingent consideration receivable. Financial assets are classified as held for trading if they are acquired for the purpose of sale in the near term. Derivatives, including separated embedded derivatives, are also classified as held for trading unless they are designated as effective hedging instruments as defined by HKAS 39.
Financial assets at fair value through profit or loss are carried in the statement of financial position at fair value with net changes in fair value recognised in the statement of profit or loss. These net fair value changes do not include any dividends or interest earned on these financial assets, which are recognised in accordance with the policies set out for “Revenue recognition” below.
Financial assets designated upon initial recognition as at fair value through profit or loss are designated at the date of initial recognition and only if the criteria in HKAS 39 are satisfied.
Derivatives embedded in host contracts are accounted for as separate derivatives and recorded at fair value if their economic characteristics and risks are not closely related to those of the host contracts and the host contracts are not held for trading or designated as at fair value through profit or loss. These embedded derivatives are measured at fair value with changes in fair value recognised in the statement of profit or loss. Reassessment only occurs if there is either a change in the terms of the contract that significantly modifies the cash flows that would otherwise be required or a reclassification of a financial asset out of the fair value through profit or loss category.
Loans and receivablesLoans and receivables are non-derivative financial assets with fixed or determinable payments that are not quoted in an active market. After initial measurement, such assets are subsequently measured at amortised cost using the effective interest rate method less any allowance for impairment. Amortised cost is calculated by taking into account any discount or premium on acquisition and includes fees or costs that are an integral part of the effective interest rate. The effective interest rate amortisation and the loss arising from impairment are recognised in the statement of profit or loss.
Held-to-maturity investmentsNon-derivative financial assets with fixed or determinable payments and fixed maturity are classified as held to maturity when the Group has the positive intention and ability to hold them to maturity. Held-to-maturity investments are subsequently measured at amortised cost using the effective interest rate method less any allowance for impairment. Amortised cost is calculated by taking into account any discount or premium on acquisition and fees or costs that are an integral part of the effective interest rate. The effective interest rate amortisation and the loss arising from impairment are recognised in the statement of profit or loss.
Available-for-sale financial investmentsAvailable-for-sale financial investments are non-derivative financial assets. Equity investments classified as available for sale are those which are neither classified as held for trading nor designated as at fair value through profit or loss.

100
Notes to Financial Statements (Cont’d)
Annual Report 2017
After initial recognition, available-for-sale financial investments are subsequently measured at fair value, with unrealised gains or losses recognised as other comprehensive income in the available-for-sale investment revaluation reserve until the investment is derecognised, at which time the cumulative gain or loss is recognised in the statement of profit or loss, or until the investment is determined to be impaired, when the cumulative gain or loss is reclassified from the available-for-sale investment revaluation reserve to the statement of profit or loss. Dividends earned whilst holding the available-for-sale financial investments are reported as dividend income and are recognised in the statement of profit or loss as other income in accordance with the policy set out for “Revenue recognition” below.
When the fair value of unlisted equity investments cannot be reliably measured because (a) the variability in the range of reasonable fair value estimates is significant for that investment or (b) the probabilities of the various estimates within the range cannot be reasonably assessed and used in estimating fair value, such investments are stated at cost less any impairment losses.
The Group evaluates whether the ability and intention to sell its available-for-sale financial assets in the near term are still appropriate. When, in rare circumstances, the Group is unable to trade these financial assets due to inactive markets, the Group may elect to reclassify these financial assets if management has the ability and intention to hold the assets for the foreseeable future or until maturity.
For a financial asset reclassified from the available-for-sale category, the fair value carrying amount at the date of reclassification becomes its new amortised cost and any previous gain or loss on that asset that has been recognised in equity is amortised to profit or loss over the remaining life of the investment using the effective interest rate. Any difference between the new amortised cost and the maturity amount is also amortised over the remaining life of the asset using the effective interest rate. If the asset is subsequently determined to be impaired, then the amount recorded in equity is reclassified to the statement of profit or loss.
(k) Impairment of financial assets
The Group assesses at the end of each reporting period whether there is objective evidence that a financial asset or a group of financial assets is impaired. An impairment exists if one or more events that occurred after the initial recognition of the asset have an impact on the estimated future cash flows of the financial asset or the group of financial assets that can be reliably estimated. Evidence of impairment may include indications that a debtor or a group of debtors is experiencing significant financial difficulty, default or delinquency in interest or principal payments, the probability that they will enter bankruptcy or other financial reorganisation and observable data indicating that there is a measurable decrease in the estimated future cash flows, such as changes in arrears or economic conditions that correlate with defaults.
Financial assets carried at amortised costFor financial assets carried at amortised cost, the Group first assesses whether impairment exists individually for financial assets that are individually significant, or collectively for financial assets that are not individually significant. If the Group determines that no objective evidence of impairment exists for an individually assessed financial asset, whether significant or not, it includes the asset in a group of financial assets with similar credit risk characteristics and collectively assesses them for impairment. Assets that are individually assessed for impairment and for which an impairment loss is, or continues to be, recognised are not included in a collective assessment of impairment.

101
Notes to Financial Statements (Cont’d)
Annual Report 2017
The amount of any impairment loss identified is measured as the difference between the asset’s carrying amount and the present value of estimated future cash flows (excluding future credit losses that have not yet been incurred). The present value of the estimated future cash flows is discounted at the financial asset’s original effective interest rate (i.e., the effective interest rate computed at initial recognition).
The carrying amount of the asset is reduced through the use of an allowance account and the loss is recognised in the statement of profit or loss. Interest income continues to be accrued on the reduced carrying amount using the rate of interest used to discount the future cash flows for the purpose of measuring the impairment loss. Loans and receivables together with any associated allowance are written off when there is no realistic prospect of future recovery and all collateral has been realised or has been transferred to the Group.
If, in a subsequent period, the amount of the estimated impairment loss increases or decreases because of an event occurring after the impairment was recognised, the previously recognised impairment loss is increased or reduced by adjusting the allowance account. If a write-off is later recovered, the recovery is credited to the statement of profit or loss.
Assets carried at costIf there is objective evidence that an impairment loss has been incurred on an unquoted equity instrument that is not carried at fair value because its fair value cannot be reliably measured, or on a derivative asset that is linked to and must be settled by delivery of such an unquoted equity instrument, the amount of the loss is measured as the difference between the asset’s carrying amount and the present value of estimated future cash flows discounted at the current market rate of return for a similar financial asset. Impairment losses on these assets are not reversed.
Available-for-sale financial investmentsFor available-for-sale financial investments, the Group assesses at the end of each reporting period whether there is objective evidence that an investment or a group of investments is impaired.
If an available-for-sale financial asset is impaired, an amount comprising the difference between its cost (net of any principal payment and amortisation) and its current fair value, less any impairment loss previously recognised in the statement of profit or loss, is removed from other comprehensive income and recognised in the statement of profit or loss.
In the case of equity investments classified as available for sale, objective evidence would include a significant or prolonged decline in the fair value of an investment below its cost. “Significant” is evaluated against the original cost of the investment and “prolonged” against the period in which the fair value has been below its original cost. Where there is evidence of impairment, the cumulative loss – measured as the difference between the acquisition cost and the current fair value, less any impairment loss on that investment previously recognised in the statement of profit or loss – is removed from other comprehensive income and recognised in the statement of profit or loss. Impairment losses on equity instruments classified as available for sale are not reversed through the statement of profit or loss. Increases in their fair value after impairment are recognised directly in other comprehensive income.
The determination of what is”significant” or “prolonged” requires judgement. In making this judgement, the Group evaluates, among other factors, the duration or extent to which the fair value of an investment is less than its cost.

102
Notes to Financial Statements (Cont’d)
Annual Report 2017
(l) Derecognition of financial assets
A financial asset (or, where applicable, a part of a financial asset or part of a group of similar financial assets) is primarily derecognised (i.e., removed from the Group’s consolidated statement of financial position) when:
‧ the rights to receive cash flows from the asset have expired; or
‧ the Group has transferred its rights to receive cash flows from the asset or has assumed an obligation to pay the received cash flows in full without material delay to a third party under a “pass-through” arrangement; and either (i) the Group has transferred substantially all the risks and rewards of the asset, or (ii) the Group has neither transferred nor retained substantially all the risks and rewards of the asset, but has transferred control of the asset.
When the Group has transferred its rights to receive cash flows from an asset or has entered into a pass- through arrangement, it evaluates if and to what extent it has retained the risk and rewards of ownership of the asset. When it has neither transferred nor retained substantially all the risks and rewards of the asset nor transferred control of the asset, the Group continues to recognise the transferred asset to the extent of the Group’s continuing involvement. In that case, the Group also recognises an associated liability. The transferred asset and the associated liability are measured on a basis that reflects the rights and obligations that the Group has retained.
Continuing involvement that takes the form of a guarantee over the transferred asset is measured at the lower of the original carrying amount of the asset and the maximum amount of consideration that the Group could be required to repay.
(m) Financial liabilities
Initial recognition and measurementFinancial liabilities are classified, at initial recognition, as financial liabilities at fair value through profit or loss or loans and borrowings as appropriate.
All financial liabilities are recognised initially at fair value and, in the case of loans and borrowings, net of directly attributable transaction costs.
Subsequent measurementThe subsequent measurement of financial liabilities depends on their classification as follows:
Financial liabilities at fair value through profit or lossFinancial liabilities at fair value through profit or loss include financial liabilities held for trading.
Financial liabilities are classified as held for trading if they are acquired for the purpose of repurchasing in the near term. This category includes derivative financial instruments entered into by the Group that are not designated as hedging instruments in hedge relationships as defined by HKAS 39. Separated embedded derivatives are also classified as held for trading unless they are designated as effective hedging instruments. Gains or losses on liabilities held for trading are recognised in the statement of profit or loss. The net fair value gain or loss recognised in the statement of profit or loss does not include any interest charged on these financial liabilities.
103
Notes to Financial Statements (Cont’d)
Annual Report 2017
Loans and borrowingsAfter initial recognition, interest bearing loans and borrowings are subsequently measured at amortised cost, using the effective interest rate method unless the effect of discounting would be immaterial, in which case they are stated at cost. Gains and losses are recognised in the statement of profit or loss when the liabilities are derecognised as well as through the effective interest rate amortisation process.
Amortised cost is calculated by taking into account any discount or premium on acquisition and fees or costs that are an integral part of the effective interest rate. The effective interest rate amortisation is recognised in the statement of profit or loss.
Financial guarantee contractsFinancial guarantee contracts issued by the Group are those contracts that require a payment to be made to reimburse the holder for a loss it incurs because the specified debtor fails to make a payment when due in accordance with the terms of a debt instrument. A financial guarantee contract is recognised initially as a liability at its fair value, adjusted for transaction costs that are directly attributable to the issuance of the guarantee. Subsequent to initial recognition, the Group measures the financial guarantee contract at the higher of: (i) the amount of the best estimate of the expenditure required to settle the present obligation at the end of the reporting period; and (ii) the amount initially recognised less, when appropriate, cumulative amortisation.
Convertible bondsThe component of convertible bonds that exhibits characteristics of a liability is recognised as a liability in the statement of financial position, net of transaction costs. On issuance of convertible bonds, the fair value of the liability component is determined using a market rate for an equivalent non-convertible bond; and this amount is carried as a long term liability on the amortised cost basis until extinguished on conversion or redemption. The remainder of the proceeds is allocated to the conversion option that is recognised and included in shareholders’ equity, net of transaction costs. The carrying amount of the conversion option is not remeasured in subsequent years. Transaction costs are apportioned between the liability and equity components of the convertible bonds based on the allocation of proceeds to the liability and equity components when the instruments are first recognised.
(n) Derecognition of financial liabilities
A financial liability is derecognised when the obligation under the liability is discharged or cancelled, or expires.
When an existing financial liability is replaced by another from the same lender on substantially different terms, or the terms of an existing liability are substantially modified, such an exchange or modification is treated as a derecognition of the original liability and a recognition of a new liability, and the difference between the respective carrying amounts is recognised in the statement of profit or loss.
(o) Offsetting of financial instruments
Financial assets and financial liabilities are offset and the net amount is reported in the statement of financial position if there is a currently enforceable legal right to offset the recognised amounts and there is an intention to settle on a net basis, or to realise the assets and settle the liabilities simultaneously.

104
Notes to Financial Statements (Cont’d)
Annual Report 2017
(p) Derivative financial instruments
Initial recognition and subsequent measurementThe Group purchased derivative financial instruments such as foreign currency forward contracts for trading purpose. Such derivative financial instruments are initially recognised at fair value on the date on which a derivative contract is entered into and are subsequently remeasured at fair value. Derivatives are carried as assets when the fair value is positive and as liabilities when the fair value is negative.
Any gains or losses arising from changes in fair value of derivatives are taken directly to the statement of profit or loss.
Current versus non-current classificationDerivative instruments that are not designated as effective hedging instruments are classified as current or non-current or separated into current and non-current portions based on an assessment of the facts and circumstances (i.e., the underlying contracted cash flows).
‧ Where the Group expects to hold a derivative as an economic hedge (and does not apply hedge accounting) for a period beyond 12 months after the end of the reporting period, the derivative is classified as non-current (or separated into current and non-current portions) consistently with the classification of the underlying item.
‧ Embedded derivatives that are not closely related to the host contract are classified consistently with the cash flows of the host contract.
(q) Properties under development
Properties under development are stated at the lower of cost and net realisable value and comprise land costs, direct costs of construction, applicable borrowing costs, professional fees and other costs directly attributable to such properties incurred during the development period.
Properties under development are classified as current assets. Unless the construction period of the relevant property development project is expected to complete beyond the normal operating cycle. On completion, the properties are transferred to properties held for sale.
(r) Properties held for sale
Properties held for sale are classified as current assets and stated at the lower of cost and net realisable value on an individual property basis. Cost includes all development expenditure, applicable borrowing costs and other direct costs attributable to such properties. Net realisable value is determined by reference to the prevailing market prices.

105
Notes to Financial Statements (Cont’d)
Annual Report 2017
(s) Property, plant and equipment and depreciation
Property, plant and equipment, other than construction in progress and properties under construction, are stated at cost less accumulated depreciation and any impairment losses. When an item of property, plant and equipment is classified as held for sale, it is not depreciated and is accounted for in accordance with HKFRS 5, as further explained in the accounting policy for “Non-current assets held for sale”. The cost of an item of property, plant and equipment comprises its purchase price and any directly attributable costs of bringing the asset to its working condition and location for its intended use.
Expenditure incurred after items of property, plant and equipment have been put into operation, such as repairs and maintenance, is normally charged to the statement of profit or loss in the period in which it is incurred. In situations where the recognition criteria are satisfied, the expenditure for a major inspection is capitalised in the carrying amount of the asset as a replacement. Where significant parts of property, plant and equipment are required to be replaced at intervals, the Group recognises such parts as individual assets with specific useful lives and depreciates them accordingly.
On disposal of a revalued asset, the relevant portion of the asset revaluation reserve realised in respect of previous valuations is transferred to retained profits as a movement in reserves.
Depreciation is calculated on the straight-line basis to write off the cost of each item of property, plant and equipment to its residual value over its estimated useful life. The principal annual rates used for this purpose are as follows:
Freehold land Not depreciatedHotel land (excluding freehold land) Over the lease termsHotel buildings Over the shorter of 40 years and the remaining lease termsLeasehold properties Over the shorter of 40 years and the remaining lease termsLeasehold improvements Over the shorter of the remaining lease terms and 10% to 20%Furniture, fixtures and equipment 10% to 25%Motor vehicles 25%Aircraft Over the remaining lease terms
Where parts of an item of property, plant and equipment have different useful lives, the cost of that item is allocated on a reasonable basis among the parts and each part is depreciated separately. Residual values, useful lives and the depreciation method are reviewed, and adjusted if appropriate, at least at each financial year end.
An item of property, plant and equipment including any significant part initially recognised is derecognised upon disposal or when no future economic benefits are expected from its use or disposal. Any gain or loss on disposal or retirement recognised in the statement of profit or loss in the year the asset is derecognised is the difference between the net sales proceeds and the carrying amount of the relevant asset.
Construction in progress represents items of property, plant and equipment under construction, which is stated at cost less any impairment losses and is not depreciated. Cost comprises the direct costs of construction during the period of construction. Construction in progress is reclassified to the appropriate category of property, plant and equipment when completed and ready for use.

106
Notes to Financial Statements (Cont’d)
Annual Report 2017
Properties under construction are stated at cost less any impairment losses and are not depreciated. Cost comprises land costs, direct costs of construction and capitalised borrowing costs on related borrowed funds during the period of construction. Properties under construction are reclassified to the appropriate category of property, plant and equipment when completed and ready for use.
(t) Inventories
Inventories are stated at the lower of cost and net realisable value. Cost is determined on the first-in, first-out basis and, in the case of work in progress and finished goods, comprises direct materials, direct labour and an appropriate proportion of overheads. Net realisable value is based on the estimated selling prices less any estimated costs to be incurred to completion and disposal.
(u) Construction contracts
Contract revenue comprises the agreed contract amount and appropriate amounts from variation orders, claims and incentive payments. Contract costs incurred comprise direct materials, costs of subcontracting, direct labour and an appropriate proportion of variable and fixed construction overheads, including any related finance charges.
Revenue from short term construction contracts is recognised upon completion of the construction work.
Revenue from long term fixed price construction contracts is recognised by reference to the work certified by architects for the relevant contract. Gross construction profit is recognised when the relevant contract has been completed not less than 50% based on the percentage of completion method.
Provision is made for foreseeable losses as soon as they are anticipated by management. Where contract costs incurred to date plus recognised profits less recognised losses exceed progress billings, the surplus is treated as an amount due from contract customers. Where progress billings exceed contract costs incurred to date plus recognised profits less recognised losses, the surplus is treated as an amount due to contract customers.
(v) Revenue recognition
Revenue is recognised when it is probable that the economic benefits will flow to the Group and when the revenue can be measured reliably, on the following bases:
(i) hotel and other agency and management services income, in the period in which such services are rendered;
(ii) rental income, in the period in which the properties/aircraft are let and on the straight-line basis over the lease terms;
(iii) income from the sale of properties, when the significant risks and rewards of ownership have been transferred to the buyer, provided that the Group maintains neither managerial involvement to the degree usually associated with ownership, nor effective control over the properties sold;
(iv) fee income on short term construction contracts, on completion of the construction work;
(v) fee income on long term construction contracts, using the percentage of completion basis as further explained in note 2.4(u) above;

107
Notes to Financial Statements (Cont’d)
Annual Report 2017
(vi) interest income, on an accrual basis using the effective interest method by applying the rate that exactly discounts the estimated future cash receipts over the expected life of the financial instrument or a shorter period, when appropriate, to the net carrying amount of the financial asset;
(vii) dividend income, when the shareholders’ right to receive payment has been established;
(viii) net gain or loss from sale of investments at fair value through profit or loss, on the transaction dates when the relevant contract notes are exchanged;
(ix) consultancy and management fees, in the period in which such services are rendered;
(x) logistics and related services income, in the period in which such services are rendered;
(xi) income from the sale of food products, when the significant risks and rewards of ownership have been transferred to the buyer, provided that the Group maintains neither managerial involvement to the degree usually associated with ownership, nor effective control over the food products sold; and
(xii) income from maintenance reserves released, when the Group’s obligation to make any further reimbursements in relation to the aircraft maintenance is extinguished.
(w) Foreign currencies
These financial statements are presented in Hong Kong dollars, which is the Company’s functional currency. Each entity in the Group determines its own functional currency and items included in the financial statements of each entity are measured using that functional currency. Foreign currency transactions recorded by the entities in the Group are initially recorded using their respective functional currency rates prevailing at the dates of the transactions. Monetary assets and liabilities denominated in foreign currencies are translated at the functional currency rates of exchange ruling at the end of the reporting period. Differences arising on settlement or translation of monetary items are recognised in the statement of profit or loss. Non-monetary items that are measured in terms of historical cost in a foreign currency are translated using the exchange rates at the dates of the initial transactions.
The functional currencies of certain overseas subsidiaries and associates are currencies other than the Hong Kong dollars. As at the end of the reporting period, the assets and liabilities of these entities are translated into Hong Kong dollars at the exchange rates prevailing at the end of the reporting period and their statements of profit or loss are translated into Hong Kong dollars at the weighted average exchange rates for the year. The resulting exchange differences are recognised in other comprehensive income and accumulated in the exchange equalisation reserve. On disposal of a foreign operation, the component of other comprehensive income relating to that particular foreign operation is recognised in the statement of profit or loss.
Any goodwill arising on the acquisition of a foreign operation and any fair value adjustments to the carrying amounts of assets and liabilities arising on acquisition are treated as assets and liabilities of the foreign operation and translated at the closing rate.
For the purpose of the consolidated statement of cash flows, the cash flows of overseas subsidiaries are translated into Hong Kong dollars at the exchange rates ruling at the dates of the cash flows. Frequently recurring cash flows of overseas subsidiaries which arise throughout the year are translated into Hong Kong dollars at the weighted average exchange rates for the year.

108
Notes to Financial Statements (Cont’d)
Annual Report 2017
(x) Income tax
Income tax comprises current and deferred tax. Income tax relating to items recognised outside profit or loss is recognised outside profit or loss, either in other comprehensive income or directly in equity.
Current tax assets and liabilities are measured at the amount expected to be recovered from or paid to the taxation authorities, based on tax rates (and tax laws) that have been enacted or substantively enacted by the end of the reporting period, taking into consideration interpretations and practices prevailing in the countries/jurisdictions in which the Group operates.
Deferred tax is provided, using the liability method, on all temporary differences at the end of the reporting period between the tax bases of assets and liabilities and their carrying amounts for financial reporting purposes.
Deferred tax liabilities are recognised for all taxable temporary differences, except:
‧ when the deferred tax liability arises from the initial recognition of goodwill or an asset or liability in a transaction that is not a business combination and, at the time of the transaction, affects neither the accounting profit nor taxable profit or loss; and
‧ in respect of taxable temporary differences associated with investments in subsidiaries and associates, when the timing of the reversal of the temporary differences can be controlled and it is probable that the temporary differences will not reverse in the foreseeable future.
Deferred tax assets are recognised for all deductible temporary differences, the carryforward of unused tax credits and any unused tax losses. Deferred tax assets are recognised to the extent that it is probable that future taxable profit will be available against which the deductible temporary differences, the carryforward of unused tax credits and unused tax losses can be utilised, except:
‧ when the deferred tax asset relating to the deductible temporary differences arises from the initial recognition of an asset or liability in a transaction that is not a business combination and, at the time of the transaction, affects neither the accounting profit nor taxable profit or loss; and
‧ in respect of deductible temporary differences associated with investments in subsidiaries and associates, deferred tax assets are only recognised to the extent that it is probable that the temporary differences will reverse in the foreseeable future and future taxable profit will be available against which the temporary differences can be utilised.
The carrying amount of deferred tax assets is reviewed at the end of each reporting period and reduced to the extent that it is no longer probable that sufficient taxable profit will be available to allow all or part of the deferred tax asset to be utilised. Unrecognised deferred tax assets are reassessed at the end of each reporting period and are recognised to the extent that it has become probable that sufficient taxable profit will be available to allow all or part of the deferred tax asset to be recovered.
Deferred tax assets and liabilities are measured at the tax rates that are expected to apply to the period when the asset is realised or the liability is settled, based on tax rates (and tax laws) that have been enacted or substantively enacted by the end of the reporting period.
Deferred tax assets and deferred tax liabilities are offset if and only if the Group has a legally enforceable right to set off current tax assets and current tax liabilities and the deferred tax assets and deferred tax liabilities relate to income taxes levied by the same taxation authority on either the same taxable entity or different taxable entities which intend either to settle current tax liabilities and assets on a net basis, or to realise the assets and settle the liabilities simultaneously in each future period in which significant amounts of deferred tax liabilities or assets are expected to be settled or recovered.

109
Notes to Financial Statements (Cont’d)
Annual Report 2017
(y) Leases
Leases that transfer substantially all the rewards and risks of ownership of assets to the Group, other than legal title, are accounted for as finance leases. At the inception of a finance lease, the cost of the leased asset is capitalised at the present value of the minimum lease payments and recorded together with the obligation, excluding the interest element, to reflect the purchase and financing. Assets held under capitalised finance leases, including prepaid land lease payments under finance leases, are included in property, plant and equipment, and depreciated over the shorter of the lease terms and the estimated useful lives of the assets. The finance costs of such leases are charged to the statement of profit or loss so as to provide a constant periodic rate of charge over the lease terms.
Finance leases, which transfer to the lessee substantially all the rewards and risks incidental to ownership of a leased item, are capitalised at the inception of the lease at fair value of the leased item, or if lower, at the present value of the minimum lease payments. Lease payments receivable are apportioned between the finance income and reduction in the investment in finance lease so as to achieve a constant rate of interest on the remaining balance of the net investment in finance leases. Interest income from finance leases is credited to the statement of profit or loss.
Leases where substantially all the rewards and risks of ownership of assets remain with the lessor are accounted for as operating leases. Where the Group is the lessor, assets leased by the Group under operating leases are included in non-current assets, and rentals receivable under the operating leases are credited to the statement of profit or loss on the straight-line basis over the lease terms. Where the Group is the lessee, rentals payable under operating leases net of any incentives received from the lessor are charged to the statement of profit or loss on the straight-line basis over the lease terms.
Prepaid land lease payments under operating leases are initially stated at cost and subsequently recognised on the straight-line basis over the lease terms. When the lease payments cannot be allocated reliably between the land and buildings elements, the entire lease payments are included in the cost of the land and buildings as a finance lease in property, plant and equipment.
(z) Employee benefits
Staff retirement schemesThe Group operates a defined contribution Mandatory Provident Fund retirement benefit scheme (the “MPF Scheme”) under the Hong Kong Mandatory Provident Fund Schemes Ordinance for those employees who are eligible to participate in the MPF Scheme. Contributions are made based on a percentage of the employees’ relevant income and are charged to the statement of profit or loss as they become payable in accordance with the rules of the MPF Scheme. The assets of the MPF Scheme are held separately from those of the Group in an independently administered fund. The Group’s employer contributions vest fully with the employees when contributed into the MPF Scheme, except for the Group’s employer voluntary contributions, part or all of which are refunded to the Group when the employee leaves employment prior to the contributions vesting with the employee partly or fully, in accordance with the rules of the MPF Scheme.
The employees of the Group’s subsidiaries which operate in Mainland China are required to participate in a central pension scheme operated by the local municipal government. These subsidiaries are required to contribute certain percentages of their payroll costs to the central pension scheme. The contributions are charged to the statement of profit or loss as they become payable in accordance with the rules of the central pension scheme.

110
Notes to Financial Statements (Cont’d)
Annual Report 2017
(aa) Related parties
A party is considered to be related to the Group if:
(i) the party is a person or a close member of that person’s family and that person
(1) has control or joint control over the Group;
(2) has significant influence over the Group; or
(3) is a member of the key management personnel of the Group or of a parent of the Group;
or
(ii) the party is an entity where any of the following conditions applies:
(1) the entity and the Group are members of the same group;
(2) one entity is an associate or joint venture of the other entity (or of a parent, subsidiary or fellow subsidiary of the other entity);
(3) the entity and the Group are joint ventures of the same third party;
(4) one entity is a joint venture of a third entity and the other entity is an associate of the third entity;
(5) the entity is a post-employment benefit plan for the benefit of employees of either the Group or an entity related to the Group;
(6) the entity is controlled or jointly controlled by a person identified in (i);
(7) a person identified in (i)(1) has significant influence over the entity or is a member of the key management personnel of the entity (or of a parent of the entity); and
(8) the entity, or any member of a group of which it is a part, provides key management personnel services to the Group or to the parent of the Group.
(ab) Cash and cash equivalents
For the purpose of the consolidated statement of cash flows, cash and cash equivalents comprise cash on hand and demand deposits, and short term highly liquid investments that are readily convertible into known amounts of cash, are subject to an insignificant risk of changes in value, and have a short maturity of generally within three months when acquired, less bank overdrafts which are repayable on demand and form an integral part of the Group’s cash management.
For the purpose of the consolidated statement of financial position, cash and cash equivalents comprise cash on hand and at banks, including term deposits, and assets similar in nature to cash, which are not restricted as to use.

111
Notes to Financial Statements (Cont’d)
Annual Report 2017
(ac) Dividends
Final dividends are recognised as a liability when they are approved by the shareholders in a general meeting. Proposed final dividends are disclosed in the notes to the financial statements.
Interim dividend is simultaneously proposed and declared, because the Company’s memorandum of association and bye-laws grant the Directors the authority to declare interim dividend. Consequently, interim dividend is recognised immediately as a liability when it is proposed and declared.
(ad) Provisions
A provision is recognised when a present obligation (legal or constructive) has arisen as a result of a past event and it is probable that a future outflow of resources will be required to settle the obligation, provided that a reliable estimate can be made of the amount of the obligation.
When the effect of discounting is material, the amount recognised for a provision is the present value at the end of the reporting period of the future expenditures expected to be required to settle the obligation. The increase in the discounted present value amount arising from the passage of time is recognised in the statement of profit or loss.
3. SIGNIFICANT ACCOUNTING JUDGEMENTS AND ESTIMATES
The preparation of the Group’s financial statements requires management to make judgements, estimates and assumptions that affect the reported amounts of revenues, expenses, assets and liabilities, and their accompanying disclosures, and the disclosure of contingent liabilities. Uncertainty about these assumptions and estimates could result in outcomes that could require a material adjustment to the carrying amounts of the assets or liabilities affected in the future.
(a) Judgements
In the process of applying the Group’s accounting policies, management has made the following judgements, apart from those involving estimations, which have the most significant effect on the amounts recognised in the financial statements:
Classification of leases - Group as lessorThe Group has entered into commercial property leases on its property portfolio. The Group has determined, based on an evaluation of the terms and conditions of the arrangements, that it retains all the significant risks and rewards of ownership of these properties which are leased out on operating leases.
The Group has also entered into certain aircraft leases whereby the Group has determined that it has transferred substantially all the risks and rewards incidental to ownership of the leased aircraft to the lessees based on an evaluation of the terms and conditions of the arrangements. Accordingly, the Group has derecognised these aircraft and has recognised finance lease receivables on its consolidated statement of financial position. Otherwise, the Group classifies the aircraft under operating lease arrangements as property, plant and equipment.
112
Notes to Financial Statements (Cont’d)
Annual Report 2017
Classification between investment properties and owner-occupied propertiesThe Group determines whether a property qualifies as an investment property, and has developed criteria in making that judgement. Investment property is a property held to earn rentals or for capital appreciation or both. Therefore, the Group considers whether a property generates cash flows largely independently of the other assets held by the Group. Some properties comprise a portion that is held to earn rentals or for capital appreciation and another portion that is held for use in the production or supply of goods or services or for administrative purposes. If these portions could be sold separately or leased out separately under a finance lease, the Group accounts for the portions separately. If the portions could not be sold separately, the property is an investment property only if an insignificant portion is held for use in the production or supply of goods or services or for administrative purposes. Judgement is made on an individual property basis to determine whether ancillary services are so significant that a property does not qualify as an investment property.
Classification between investment properties and properties held for saleThe Group develops properties held for sale and properties held to earn rentals and/or for capital appreciation. Judgement is made by management on determining whether a property is designated as an investment property or a property held for sale. The Group considers its intention for holding the properties at the early development stage of the related properties. During the course of construction, the related properties under construction are accounted for as properties under development included in non-current and current assets if the properties are intended for sale after their completion, whereas, the properties are accounted for as investment properties under construction included in investment properties if the properties are intended to be held to earn rentals and/or for capital appreciation. Upon completion of the properties, the properties held for sale are transferred to completed properties held for sale and are stated at cost, while the properties held to earn rentals and/or for capital appreciation are transferred to completed investment properties. Investment properties, both under construction and completed, are subject to revaluation at the end of each reporting period.
Income taxesThe Group has exposure to income taxes in different jurisdictions. Significant judgement is involved in determining the provision for income taxes. Determining income tax provisions involves judgement on the future tax treatment of certain transactions and interpretation of tax rules. The Group carefully evaluates tax implications of transactions and tax provisions are set up accordingly. The tax treatment of such transactions is reconsidered periodically to take into account all changes in tax legislation, interpretations and practices in respect thereof.

113
Notes to Financial Statements (Cont’d)
Annual Report 2017
(b) Estimation uncertainty
The key assumptions concerning the future and other key sources of estimation uncertainty at the end of the reporting period, that have a significant risk of causing a material adjustment to the carrying amounts of assets and liabilities within the next financial year, are described below.
Impairment of goodwillThe Group determines whether goodwill is impaired at least on an annual basis. This requires an estimation of the value in use of the cash-generating units to which the goodwill is allocated. Estimating the value in use requires the Group to make an estimate of the expected future cash flows from the cash-generating unit and also to choose a suitable discount rate in order to calculate the present value of those cash flows. The carrying amount of goodwill at 31st December, 2017 was HK$261.0 million (2016 - HK$261.0 million). Further details are given in note 24 to the financial statements.
Impairment of non-financial assetsThe Group assesses whether there are any indicators of impairment for all non-financial assets at the end of each reporting period. Non-financial assets are tested for impairment when there are indicators that the carrying amounts may not be recoverable. An impairment exists when the carrying value of an asset or a cash- generating unit exceeds its recoverable amount, which is the higher of its fair value less costs of disposal and its value in use. The calculation of the fair value less costs of disposal is based on available data from binding sales transactions in an arm’s length transaction of similar assets or observable market prices less incremental costs for disposing of the asset. When value in use calculations are undertaken, management must estimate the expected future cash flows from the asset or cash-generating unit and choose a suitable discount rate in order to calculate the present value of those cash flows.
During the year, an impairment loss of HK$50.5 million (2016 - Nil) was recognised for property, plant and equipment as further disclosed in note 13 to the financial statements. The carrying amount of the Group‘s property, plant and equipment as at 31st December, 2017 was HK$22,676.2 million (2016 - HK$19,517.4 million).
Impairment of loans and receivablesThe Group assesses at the end of each reporting period whether there is objective evidence that a loan/receivable is impaired. To determine whether there is objective evidence of impairment, the Group considers factors such as the probability of insolvency or significant financial difficulties of the debtor and default or significant delay in payments. Where there is objective evidence of impairment, the amount and timing of future cash flows are estimated based on historical loss experience for assets with similar credit risk characteristics.

114
Notes to Financial Statements (Cont’d)
Annual Report 2017
The Group maintains an allowance for estimated impairment of receivables arising from the inability of its customers and debtors to make the required payments. The Group makes its estimates based on, inter alia, the ageing of its receivable balances, customers’ and debtors’ creditworthiness, past repayment history and historical write-off experience. If the financial condition of its customers and debtors was to deteriorate so that the actual impairment loss might be higher than expected, the Group would be required to revise the basis of making the allowance and its future results would be affected.
Estimation of net realisable values of properties under development and held for saleThe Group performs regular review of the carrying amounts of properties under development and held for sale with reference to prevailing market data such as most recent sale transactions and internal estimates such as future selling prices and costs to completion of properties.
Based on this review, write-down of properties will be made when the estimated net realisable value declines below their carrying amounts. Due to changes in market and economic conditions, management’s estimates may be adjusted.
Estimation of fair value of investment propertiesIn the absence of current prices in an active market for similar properties, the Group considers information from a variety of sources, including:
(a) current prices in an active market for properties of a different nature, condition or location, adjusted to reflect those differences;
(b) recent prices of similar properties on less active markets, with adjustments to reflect any changes in economic conditions since the date of the transactions that occurred at those prices; and
(c) discounted cash flow projections based on reliable estimates of future cash flows, supported by the terms of any existing lease and other contracts and (when possible) by external evidence such as current market rents for similar properties in the same location and condition, and using discount rates that reflect current market assessments of the uncertainty in the amount and timing of the cash flows.
The carrying amount of investment properties at 31st December, 2017 was HK$3,445.2 million (2016 - HK$2,395.3 million). Further details, including the key assumptions used for fair value measurement and a sensitivity analysis, are given in note 14 to the financial statements.
Deferred tax assetsDeferred tax assets are recognised for unused tax losses to the extent that it is probable that future taxable profits will be available against which the carryforward of unused tax losses can be utilised. Recognition of deferred tax assets primarily involves judgements and estimations regarding the future performance of the Group. A variety of other factors are also evaluated in considering whether there is convincing evidence that it is probable that some portions or all of the deferred tax assets will ultimately be realised, such as tax planning strategies and the periods in which estimated tax losses can be utilised. The carrying amounts of deferred tax assets and related taxable profit projections are reviewed at the end of each reporting period. The carrying value of gross deferred tax assets relating to recognised tax losses at 31st December, 2017 was HK$64.7 million (2016 - HK$95.7 million). The amount of unrecognised deferred tax assets in respect of tax losses at 31st December, 2017 was HK$835.1 million (2016 - HK$852.7 million). Further details are contained in note 37 to the financial statements.

115
Notes to Financial Statements (Cont’d)
Annual Report 2017
Allocation of construction costs on properties under developmentDevelopment costs of properties are recorded as properties under development during the construction stage and will be transferred to properties held for sale upon completion. An apportionment of these costs will be recognised in the statement of profit or loss upon the recognition of the sales of properties. Before the final settlement of the development costs and other costs relating to the sale of the properties, these costs are accrued by the Group based on management’s best estimate.
When developing properties, the Group may divide the development projects into phases. Specific costs directly related to the development of a phase are recorded as the cost of such phase. Costs that are common to phases are allocated to individual phases based on the estimated saleable area of the entire project.
Where the final settlement of costs and the related cost allocation is different from the initial estimates, any increase or decrease in the development costs and other costs would affect the profit or loss in future years.
Estimation of useful life of trademarkThe Group assesses the useful life of the trademark to be indefinite. This determination requires the Group to make assumptions and estimates of the expected future cash flows of the hotel group to which the trademark relates and the ability to renew the legal right of the trademark at insignificant cost indefinitely. The Group assesses the useful life of the trademark annually to determine whether events or circumstances continue to support the indefinite useful life of the trademark.
Depreciation of property, plant and equipment – aircraftAircraft are depreciated on the straight-line basis at rates which are calculated to write down their costs to their estimated residual values at the end of their operational lives. Certain estimates regarding the operational lives and residual values of the aircraft are made by the Group based on industry practice and internal technical valuation. The operational lives and residual values are reviewed at least on an annual basis. The carrying amount of the Group’s aircraft at 31st December, 2017 was HK$207.0 million (2016 - HK$298.9 million).

116
Notes to Financial Statements (Cont’d)
Annual Report 2017
4. OPERATING SEGMENT INFORMATION
For management purposes, the Group is organised into business units based on their products and services and has seven reportable operating segments as follows:
(a) the property development and investment segment comprises the development and sale of properties, the leasing of properties and the provision of estate agency services;
(b) the construction and building related businesses segment engages in construction works and building related businesses, including the provision of development consultancy and project management services, property management and also security systems and products and other software development and distribution;
(c) the hotel operation and management and hotel ownership segment engages in hotel operations and the provision of hotel management services, and the ownership in hotel properties for rental income;
(d) the asset management segment engages in the provision of asset management services to Regal REIT;
(e) the financial assets investments segment engages in trading of financial assets at fair value through profit or loss and other financial assets investments;
(f) the aircraft ownership and leasing segment engages in the aircraft ownership and leasing for rental and interest income; and
(g) the others segment mainly comprises the provision of financing services, travel agency services, sale of food products, operation of restaurants, operation of security storage lounge, the provision of housekeeping services, logistics and related services and development and distribution of multimedia entertainment and digital educational content and multi-platform social games.
Management monitors the results of the Group’s operating segments separately for the purpose of making decisions about resources allocation and performance assessment. Segment performance is evaluated based on reportable segment profit/(loss), which is a measure of adjusted profit/(loss) before tax. The adjusted profit/(loss) before tax is measured consistently with the Group’s profit before tax except that certain interest income, finance costs, head office and corporate gains and expenses are excluded from such measurement.
Segment assets exclude deferred tax assets, tax recoverable, restricted cash, pledged time deposits and bank balances, time deposits, cash and bank balances, and other unallocated head office and corporate assets as these assets are managed on a group basis.
Segment liabilities exclude convertible bonds, interest bearing bank borrowings, other borrowings, tax payable, deferred tax liabilities and other unallocated head office and corporate liabilities as these liabilities are managed on a group basis.
Intersegment sales and transfers are transacted with reference to the selling prices used for sales made to third parties at the then prevailing market prices.

117
Notes to Financial Statements (Cont’d)
Annual Report 2017
The
follo
win
g ta
bles
pre
sent
rev
enue
, pr
ofit/
(loss
) an
d ce
rtai
n as
set,
lia
bilit
y an
d ex
pend
iture
inf
orm
atio
n fo
r th
e G
roup
’ s o
pera
ting
segm
ents
fo
r th
e ye
ars
ende
d 31
st D
ecem
ber,
201
7 an
d 20
16:
Prope
rty
deve
lopme
ntan
d inv
estme
nt
Const
ructio
n and
build
ing re
lated
busin
esses
Hotel
opera
tion
and m
anag
emen
tan
d hote
l own
ership
Asset
mana
geme
ntFin
ancia
l asse
tsinv
estme
ntsAir
craft
owne
rship
and l
easin
gOt
hers
Elimi
natio
nsCo
nsolid
ated
2017
2016
2017
2016
2017
2016
2017
2016
2017
2016
2017
2016
2017
2016
2017
2016
2017
2016
HK$’ m
HK$’ m
HK$’ m
HK$’ m
HK$’ m
HK$’ m
HK$’ m
HK$’ m
HK$’ m
HK$’ m
HK$’ m
HK$’ m
HK$’ m
HK$’ m
HK$’ m
HK$’ m
HK$’ m
HK$’ m
Segme
nt rev
enue:
Sale
s to ex
ternal
custo
mers
1,107
.333
2.5
18.8
14.3
2,286
.62,1
53.9
– –
109.3
147.5
68
.212
7.9
30.6
28.2
– –
3,620
.82,8
04.3
Inte
rsegm
ent sa
les9.7
8.5
175.7
198.9
8.2
3.0
119.9
96.2
– –
– –
76.2
24.9
(389.7
)(33
1.5)
– –
Total
1,117
.034
1.0
194.5
213.2
2,2
94.8
2,156
.9 11
9.996
.2 10
9.314
7.5
68.2
127.9
10
6.853
.1(38
9.7)
(331.5
) 3,6
20.8
2,804
.3
Seg
ment
result
s befo
re d
epreci
ation
and a
mortis
ation
795.2
312.4
(0.
1)0.7
85
2.179
4.3
(13.3)
(11.9)
19
7.713
1.0
104.4
132.8
4.0
3.0
– –
1,940
.01,3
62.3
Depre
ciatio
n and
amort
isatio
n(24
.2)(24
.2)
(0.4)
(0.4)
(539.1
)(52
1.6)
(0.4)
(0. 4)
–
– (31
.2)(63
.9)
(12.5)
(12.7)
–
– (60
7.8)
(623.2
)
Seg
ment
result
s77
1.028
8.2
(0.5)
0.3
313.0
272.7
(13
.7)(12
.3)
197.7
131.0
73
.268
.9 (8.
5)(9.
7) –
– 1,3
32.2
739.1
Un
allocat
ed int
erest i
ncome
and
unal
locate
d non
-opera
ting a
nd c
orpora
te gai
ns57
.328
.2 Un
allocat
ed no
n-oper
ating
and
corp
orate
expens
es(17
7.3)
(200
.9)
Opera
ting p
rofit
1,212
.256
6.4
Financ
e cost
s(30
9.4)
(310.1
) Sha
re of
profits
and l
osses
of a
ssocia
tes(8.
3)–
– –
– 1.7
–
– –
– –
– (24
.4)(15
.8)
– –
(32.7)
(14.1)
Pro
fit bef
ore ta
x87
0.124
2.2
Incom
e tax
(91.5)
(4.1)
Profit
for th
e year
befor
e a
llocati
on be
tween
equit
y h
olders
of th
e pare
nt and
n
on-co
ntrolli
ng in
terest
s77
8.623
8.1
Attrib
utable
to:
Equ
ity ho
lders o
f the p
arent
381.2
136.2
N
on-co
ntrolli
ng in
terest
s39
7.410
1.9
778.6
238.1

118
Notes to Financial Statements (Cont’d)
Annual Report 2017
Prope
rty
deve
lopme
ntan
d inv
estme
nt
Const
ructio
n and
build
ing re
lated
busin
esses
Hotel
opera
tion
and m
anag
emen
tan
d hote
l own
ership
Asset
mana
geme
ntFin
ancia
l asse
tsinv
estme
ntsAir
craft
owne
rship
and l
easin
gOt
hers
Elimi
natio
nsCo
nsolid
ated
2017
2016
2017
2016
2017
2016
2017
2016
2017
2016
2017
2016
2017
2016
2017
2016
2017
2016
HK$’ m
HK$’ m
HK$’ m
HK$’ m
HK$’ m
HK$’ m
HK$’ m
HK$’ m
HK$’ m
HK$’ m
HK$’ m
HK$’ m
HK$’ m
HK$’ m
HK$’ m
HK$’ m
HK$’ m
HK$’ m
Segme
nt ass
ets15
,966.5
13,86
8.0
46.4
39.2
22,08
9.518
,865.8
52
.142
.6 2,3
65.7
1,842
.3 33
9.247
1.9
145.5
248.3
(50
.7)(41
.3)
40,95
4.235
,336.8
Inv
estme
nt in
a joint
ventu
re–
1,150
.7 –
––
––
––
––
––
––
––
1,150
.7 Inv
estme
nts in
assoc
iates
17.0
21.2
––
––
––
––
––
7.514
.1 –
–24
.535
.3 Ca
sh and
unallo
cated
assets
5,121
.85,4
59.3
Total a
ssets
46,10
0.541
,982.1
Seg
ment
liabiliti
es(3,
097.9
)(2,
575.9
) (49
.9)(41
.4)
(416.5
)(39
1.6)
(2.3)
(2.4)
(3.6)
(10.6)
(10
1.3)
(202.2
) (5.
0)(8.
1) 50
.741
.3 (3,
625.8
)(3,
190.9
) Int
erest b
earing
bank
borro
wings
and
unallo
cated
liabiliti
es(20
,326.4
) (18
,879.1
)
Tot
al liab
ilities
(23,95
2.2)
(22,07
0.0)
Other
segme
nt inf
ormati
on:
Capi
tal ex
pendit
ure*
1,925
.21,4
29.0
–1.3
3,6
92.2
73.6
0.30.1
–
–14
5.465
.6 3.2
116.7
G
ain on
barga
in pu
rchase
––
––
––
––
––
––
–(3.
1) G
ain on
dispo
sal of
subsi
diarie
s–
(403.0
) –
––
––
––
––
–(0.
2)–
Loss
/(Gain
) on d
isposa
l of
inv
estme
nt pro
pertie
s(0.
1)23
.7 –
––
––
––
––
––
– L
oss/(G
ain) o
n disp
osal o
f item
s
of pr
opert
y, plan
t and
eq
uipme
nt, ne
t(14
.4)–
–(0.
1) 0.8
––
––
–(53
.0)(19
.6)
––
Reve
rsal o
f impai
rment
of lo
ans
recei
vable
––
––
––
––
––
––
(0.1)
(0.1)
Write
-back
of imp
airme
nt of
tra
de deb
tors
––
––
––
––
––
––
(0.1)
(0.1)
Write
-back
of imp
airme
nt los
s
on pr
opert
y und
er dev
elopm
ent(57
.0)–
––
––
––
––
––
––
Imp
airme
nt los
s on p
ropert
ies
hel
d for
sale
–15
.5 –
––
––
––
––
––
– I
mpair
ment
loss o
n item
s of
pro
perty,
plant
and eq
uipme
nt–
––
––
––
––
–50
.5–
––
Imp
airme
nt of
trade
debtor
s–
––
–0.1
––
––
––
––
– F
air va
lue lo
sses/(g
ains) o
n
financ
ial ass
ets at
fair v
alue
thr
ough
profi
t or lo
ss, ne
t–
––
––
––
–(76
.5)25
.8 –
–2.1
(1.1)
Fair
value
gains
on in
vestm
ent
proper
ties, n
et(66
9.2)
(60.4
) –
–(2.
0)(9.
0) –
––
––
––
– F
air va
lue ga
in up
on
rec
lassifi
cation
of a
proper
ty
held f
or sal
e to a
n inve
stment
pro
perty
– (3
.7)
– –
– –
– –
– –
– –
– –
Inte
rest in
come
(37.4)
(0.7)
–
– –
– –
– (55
.3)(38
.4)
(13.3)
(7.4)
(4.5)
(3.2)
Main
tenanc
e rese
rves re
leased
––
––
––
––
––
(54.7)
––
–
* C
apita
l exp
endi
ture
incl
udes
inta
ngib
le a
sset
s ar
isin
g fr
om t
he a
cqui
sitio
n of
sub
sidi
arie
s.

119
Notes to Financial Statements (Cont’d)
Annual Report 2017
Geographical information
(a) Revenue from external customers
2017 2016HK$’million HK$’million
Hong Kong 2,656.2 2,578.0Mainland China 850.0 36.9Other 114.6 189.4
3,620.8 2,804.3
The revenue information above is based on the locations of the customers, except for the property development and investment segment which is based on the locations of the properties.
(b) Non-current assets
2017 2016HK$’million HK$’million
Hong Kong 27,175.0 23,282.8Mainland China 1,664.6 1,747.1Other 333.7 402.1
29,173.3 25,432.0
The non-current assets information above is based on the locations of assets and excludes financial instruments and deferred tax assets.
Information about major customer
No further information about major customer is presented as no more than 10% of the Group’s revenue was derived from sales to any single customer.

120
Notes to Financial Statements (Cont’d)
Annual Report 2017
5. REVENUE, OTHER INCOME AND GAINS, NET
Revenue, other income and gains, net are analysed as follows:
2017 2016HK$’million HK$’million
RevenueRental income: Hotel properties 41.8 44.1 Investment properties 17.1 15.2 Aircraft 54.9 120.4Construction and construction-related income 13.3 9.4Proceeds from sale of properties 1,098.9 324.2Estate management fees 5.5 4.9Net gain from sale of financial assets at fair value through profit or loss* 37.9 102.2Net gain on settlement of derivative financial instruments 12.0 3.1Interest income from financial assets at fair value through profit or loss 42.5 28.8Interest income from loans receivable 1.2 1.4Interest income from finance leases 13.3 7.5Dividend income from listed investments 16.9 13.4Hotel operations and management services 2,236.1 2,102.9Logistics and related services income 9.1 13.9Other operations 20.3 12.9
3,620.8 2,804.3
Other income and gains, netBank interest income 54.5 26.6Other interest income 54.0 12.9Dividend income from unlisted investments 3.8 1.2Gain/(Loss) on disposal of an investment property 0.1 (23.7)Gain on disposal of items of property, plant and equipment, net 66.6 19.7Fair value gain upon reclassification of a property held for sale to an investment property – 3.7Maintenance reserves released 54.7 –Others 2.7 15.7
236.4 56.1
* Inclusive of dividend income from fund investments of HK$155.9 million (2016 - Nil) and net loss on disposal of fund investments of HK$158.4 million (2016 - Nil). These fund investments were purchased and sold during the year and were considered as linked transactions. The Directors are of the opinion that offsetting of the amounts better reflects the substance of these linked transactions.

121
Notes to Financial Statements (Cont’d)
Annual Report 2017
6. PROFIT BEFORE TAX
The Group’s profit before tax is arrived at after charging/(crediting):
2017 2016HK$’million HK$’million
Cost of inventories sold and services provided 1,983.8 1,248.3
Depreciation 603.4 617.2Amortisation of intangible assets 7.8 9.2
611.2 626.4
Employee benefit expense* (exclusive of Directors’ remuneration disclosed in note 8): Salaries, wages and allowances 813.2 769.7 Staff retirement scheme contributions 38.7 37.0 Less: Forfeited contributions (1.2) (0.7)
850.7 806.0
Less: Staff costs capitalised in respect of property development projects and construction contracts: Salaries, wages and allowances (44.9) (47.7) Staff retirement scheme contributions (3.1) (3.2)
802.7 755.1
* Inclusive of an amount of HK$624.9 million (2016 - HK$578.4 million) classified under the cost of inventories sold and services provided.

122
Notes to Financial Statements (Cont’d)
Annual Report 2017
2017 2016HK$’million HK$’million
Auditor’s remuneration 13.3 12.5Impairment of trade debtors 0.1 –Write-back of impairment of trade debtors (0.1) (0.1)Reversal of impairment of loans receivable (0.1) (0.1)
Minimum lease payments under operating leases 43.9 40.2Less: Minimum lease payments capitalised in respect of construction contracts (0.4) (0.4)
43.5 39.8
Write-off of items of property, plant and equipment – 0.4Recovery of deposit paid for acquisition of a subsidiary – (14.4)
Fair value losses/(gains) on financial assets at fair value through profit or loss, net – held for trading (79.6) 30.7 – derivative instruments – transactions not qualifying as hedges 3.0 (7.1) – contingent consideration receivable 2.2 1.1
(74.4) 24.7
Direct operating expenses (including repairs and maintenance) arising from rental-earning investment properties 5.5 2.3Foreign exchange differences, net# 2.5 45.2
# Inclusive of a loss on settlement of foreign currency forward contracts of HK$3.0 million (2016 - a gain of HK$135.8 million) and net foreign exchange gain of HK$0.5 million (2016 - net loss of HK$181.0 million).

123
Notes to Financial Statements (Cont’d)
Annual Report 2017
7. FINANCE COSTS
2017 2016HK$’million HK$’million
Interest on bank loans 201.4 173.6Interest on other borrowings 268.7 230.4Interest on convertible bonds 2.5 2.1Other interest 0.8 –Amortisation of debt establishment costs 41.3 63.7
Total interest expenses on financial liabilities not at fair value through profit or loss 514.7 469.8Other loan costs 13.2 13.5
527.9 483.3
Less: Finance costs capitalised (218.5) (173.2)
309.4 310.1
8. DIRECTORS’ REMUNERATION
Directors’ remuneration for the year, disclosed pursuant to the Listing Rules, section 383(1)(a), (b), (c) and (f) of the Hong Kong Companies Ordinance and Part 2 of the Companies (Disclosure of Information about Benefits of Directors) Regulation, is as follows:
2017 2016HK$’million HK$’million
Fees 7.0 5.8
Other emoluments: Salaries, allowances and benefits in kind 30.8 29.1 Performance related/discretionary bonuses 3.9 3.7 Staff retirement scheme contributions 2.1 2.0
43.8 40.6
With effect from 1st July, 2016, the fee payable to each Director has been revised from HK$100,000 per annum to HK$150,000 per annum as approved by the shareholders at the annual general meeting of the Company held on 2nd June, 2016.

124
Notes to Financial Statements (Cont’d)
Annual Report 2017
In addition, the fees payable to the Directors for serving as members of each of the following Board Committees of the Company have also been revised with effect from 1st July, 2016:
– from HK$100,000 per annum to HK$150,000 per annum as the chairman of the Audit Committee;
– from HK$50,000 per annum to HK$100,000 per annum as a member of the Audit Committee;
– from HK$30,000 per annum to HK$50,000 per annum as a member of the Nomination Committee; and
– from HK$30,000 per annum to HK$50,000 per annum as a member of the Remuneration Committee.
(a) Independent non-executive directors
The fees paid to independent non-executive directors during the year were as follows:
2017 2016HK$’million HK$’million
Mr. Anthony Chuang 0.35 0.28Mr. Ng Siu Chan# 1.10 0.89Mr. Wong Chi Keung 1.15 0.95
2.60 2.12
# Mr. Ng Siu Chan resigned as an independent non-executive director of the Company with effect from 1st January, 2018.
– For the year ended 31st December, 2017, Directors’ fees entitled by the independent non-executive directors of the Company also included a fee for serving as members of each of the Audit Committee (HK$0.15 million per annum and HK$0.1 million per annum as its chairman and a member, respectively), the Nomination Committee (HK$0.05 million per annum) and the Remuneration Committee (HK$0.05 million per annum) of the Company, where applicable, amounted to HK$2.60 million.
– For the year ended 31st December, 2016, Directors’ fees entitled by the independent non-executive directors of the Company also included a fee for serving as members of the Audit Committee (HK$0.1 million per annum and HK$0.05 million per annum as its chairman and a member, respectively, from 1st January, 2016 to 30th June, 2016 and HK$0.15 million per annum and HK$0.1 million per annum as its chairman and a member, respectively, from 1st July, 2016 to 31st December, 2016), the Nomination Committee (HK$0.03 million per annum from 1st January, 2016 to 30th June, 2016 and HK$0.05 million per annum from 1st July, 2016 to 31st December, 2016) and the Remuneration Committee (HK$0.03 million per annum from 1st January, 2016 to 30th June, 2016 and HK$0.05 million per annum from 1st July, 2016 to 31st December, 2016) of the Company, where applicable, amounted to HK$2.12 million.
– The fees paid to Mr. Ng Siu Chan for the year ended 31st December, 2017 also included a fee for serving as (i) an independent non-executive director as well as a member of each of the audit committee, the nomination committee and the remuneration committee of PHL; and (ii) an independent non-executive director as well as a member of each of the audit committee, the nomination committee and the remuneration committee of RHIHL amounted to HK$0.70 million (2016 - HK$0.56 million).

125
Notes to Financial Statements (Cont’d)
Annual Report 2017
– The fees paid to Mr. Wong Chi Keung for the year ended 31st December, 2017 also included a fee for serving as (i) an independent non-executive director, the chairman of the audit committee as well as a member of each of the nomination committee and the remuneration committee of PHL; and (ii) an independent non-executive director, the chairman of the audit committee as well as a member of each of the nomination committee and the remuneration committee of RHIHL amounted to HK$0.80 million (2016 - HK$0.66 million).
There were no other emoluments payable to the independent non-executive directors during the year (2016 - Nil).
(b) Executive directors
Fees
Salaries,allowances
and benefitsin kind
Performancerelated/
discretionarybonuses
Staffretirement
schemecontributions
Totalremuneration
HK$’million HK$’million HK$’million HK$’million HK$’million(Notes)
2017Mr. Lo Yuk Sui 1.15 13.32 1.60 0.96 17.03Mr. Jimmy Lo Chun To 0.75 5.16 0.42 0.25 6.58Miss Lo Po Man 0.75 4.92 0.42 0.25 6.34Mr. Kenneth Ng Kwai Kai 0.85 2.82 0.50 0.24 4.41Mr. Donald Fan Tung 0.60 2.58 0.56 0.26 4.00Mr. Kelvin Leung So Po 0.30 1.96 0.41 0.19 2.86
4.40 30.76 3.91 2.15 41.22
2016Mr. Lo Yuk Sui 0.95 12.84 1.52 0.91 16.22Mr. Jimmy Lo Chun To 0.63 5.04 0.40 0.24 6.31Miss Lo Po Man 0.63 3.78 0.40 0.24 5.05Mr. Kenneth Ng Kwai Kai 0.70 3.14 0.45 0.22 4.51Mr. Donald Fan Tung 0.50 2.42 0.54 0.25 3.71Mr. Kelvin Leung So Po 0.25 1.86 0.39 0.18 2.68
3.66 29.08 3.70 2.04 38.48

126
Notes to Financial Statements (Cont’d)
Annual Report 2017
There was no arrangement under which a Director waived or agreed to waive any remuneration during the year (2016 - Nil).
Notes:
For the year ended 31st December, 2017, the fees entitled by:
– Mr. Lo Yuk Sui also included (i) a fee of HK$0.05 million per annum for serving as a member of each of the Nomination Committee and the Remuneration Committee of the Company; (ii) a fee of HK$0.15 million per annum for serving as an executive director of PHL and a fee of HK$0.05 million per annum for serving as a member of each of the nomination committee and the remuneration committee of PHL; (iii) a fee of HK$0.15 million per annum for serving as an executive director of RHIHL and a fee of HK$0.05 million per annum for serving as a member of each of the nomination committee and the remuneration committee of RHIHL; (iv) a fee of HK$0.15 million per annum for serving as an executive director of Cosmopolitan and a fee of HK$0.05 million per annum for serving as a member of each of the nomination committee and the remuneration committee of Cosmopolitan; and (v) a fee of HK$0.15 million per annum for serving as a non-executive director of Regal Portfolio Management Limited (“RPML”) (the manager of Regal REIT).
– Mr. Jimmy Lo Chun To and Miss Lo Po Man also included (i) a fee of HK$0.15 million per annum entitled by each of these Directors for serving as an executive director of PHL; (ii) a fee of HK$0.15 million per annum entitled by each of these Directors for serving as an executive director of RHIHL; (iii) a fee of HK$0.15 million per annum entitled by each of these Directors for serving as an executive director of Cosmopolitan; and (iv) a fee of HK$0.15 million per annum entitled by each of these Directors for serving as a non-executive director of RPML.
– Mr. Kenneth Ng Kwai Kai also included (i) a fee of HK$0.15 million per annum for serving as an executive director of PHL; (ii) a fee of HK$0.15 million per annum for serving as an executive director of RHIHL; (iii) a fee of HK$0.15 million per annum for serving as an executive director of Cosmopolitan; and (iv) a fee of HK$0.15 million per annum for serving as a non-executive director of RPML and a fee of HK$0.10 million per annum for serving as a member of the audit committee of RPML.
– Mr. Donald Fan Tung also included (i) a fee of HK$0.15 million per annum for serving as an executive director of PHL; (ii) a fee of HK$0.15 million per annum for serving as an executive director of RHIHL; and (iii) a fee of HK$0.15 million per annum for serving as a non-executive director of RPML.
– Mr. Kelvin Leung So Po also included a fee of HK$0.15 million per annum for serving as an executive director of Cosmopolitan.
For the year ended 31st December, 2016, the fees entitled by:
– Mr. Lo Yuk Sui also included (i) a fee of HK$0.03 million per annum from 1st January, 2016 to 30th June, 2016 and HK$0.05 million per annum from 1st July, 2016 to 31st December, 2016 for serving as a member of each of the Nomination Committee and the Remuneration Committee of the Company; (ii) a fee of HK$0.1 million per annum from 1st January, 2016 to 30th June, 2016 and HK$0.15 million per annum from 1st July, 2016 to 31st December, 2016 for serving as an executive director of PHL and a fee of HK$0.03 million per annum from 1st January, 2016 to 30th June, 2016 and HK$0.05 million per annum from 1st July, 2016 to 31st December, 2016 for serving as a member of each of the nomination committee and the remuneration committee of PHL; (iii) a fee of HK$0.1 million per annum from 1st January, 2016 to 30th June, 2016 and HK$0.15 million per annum from 1st July, 2016 to 31st December, 2016 for serving as an executive director of RHIHL and a fee of HK$0.03 million per annum from 1st January, 2016 to 30th June, 2016 and HK$0.05 million per annum from 1st July, 2016 to 31st December, 2016 for serving as a member of each of the nomination committee and the remuneration committee of RHIHL; (iv) a fee of HK$0.1 million from 1st January, 2016 to 30th June, 2016 and HK$0.15 million per annum from 1st July, 2016 to 31st December, 2016 per annum for serving as an executive director of Cosmopolitan and a fee of HK$0.03 million per annum from 1st January, 2016 to 30th June, 2016 and HK$0.05 million per annum from 1st July, 2016 to 31st December, 2016 for serving as a member of each of the nomination committee and the remuneration committee of Cosmopolitan; and (v) a fee of HK$0.1 million per annum from 1st January, 2016 to 30th June, 2016 and HK$0.15 million per annum from 1st July, 2016 to 31st December, 2016 per annum for serving as a non-executive director of RPML.

127
Notes to Financial Statements (Cont’d)
Annual Report 2017
– Mr. Jimmy Lo Chun To and Miss Lo Po Man also included (i) a fee of HK$0.1 million per annum from 1st January, 2016 to 30th June, 2016 and HK$0.15 million per annum from 1st July, 2016 to 31st December, 2016 per annum entitled by each of these Directors for serving as an executive director of PHL; (ii) a fee of HK$0.1 million per annum from 1st January, 2016 to 30th June, 2016 and HK$0.15 million per annum from 1st July, 2016 to 31st December, 2016 per annum entitled by each of these Directors for serving as an executive director of RHIHL; (iii) a fee of HK$0.1 million per annum from 1st January, 2016 to 30th June, 2016 and HK$0.15 million per annum from 1st July, 2016 to 31st December, 2016 entitled by each of these Directors for serving as an executive director of Cosmopolitan; and (iv) a fee of HK$0.1 million per annum from 1st January, 2016 to 30th June, 2016 and HK$0.15 million per annum from 1st July, 2016 to 31st December, 2016 entitled by each of these Directors for serving as a non-executive director of RPML.
– Mr. Kenneth Ng Kwai Kai also included (i) a fee of HK$0.1 million per annum from 1st January, 2016 to 30th June, 2016 and HK$0.15 million per annum from 1st July, 2016 to 31st December, 2016 for serving as an executive director of PHL; (ii) a fee of HK$0.1 million per annum from 1st January, 2016 to 30th June, 2016 and HK$0.15 million per annum from 1st July, 2016 to 31st December, 2016 for serving as an executive director of RHIHL; (iii) a fee of HK$0.1 million from 1st January, 2016 to 30th June, 2016 and HK$0.15 million per annum from 1st July, 2016 to 31st December, 2016 for serving as an executive director of Cosmopolitan; and (iv) a fee of HK$0.1 million per annum from 1st January, 2016 to 30th June, 2016 and HK$0.15 million per annum from 1st July, 2016 to 31st December, 2016 for serving as a non-executive director of RPML and a fee of HK$0.05 million per annum from 1st January, 2016 to 30th June, 2016 and HK$0.1 million per annum from 1st July, 2016 to 31st December, 2016 for serving as a member of the audit committee of RPML.
– Mr. Donald Fan Tung also included (i) a fee of HK$0.1 million per annum from 1st January, 2016 to 30th June, 2016 and HK$0.15 million per annum from 1st July, 2016 to 31st December, 2016 for serving as an executive director of PHL; (ii) a fee of HK$0.1 million per annum from 1st January, 2016 to 30th June, 2016 and HK$0.15 million per annum from 1st July, 2016 to 31st December, 2016 for serving as an executive director of RHIHL; and (iii) a fee of HK$0.1 million per annum from 1st January, 2016 to 30th June, 2016 and HK$0.15 million per annum from 1st July, 2016 to 31st December, 2016 for serving as a non-executive director of RPML.
– Mr. Kelvin Leung So Po also included a fee of HK$0.1 million per annum from 1st January, 2016 to 30th June, 2016 and HK$0.15 million per annum from 1st July, 2016 to 31st December, 2016 for serving as an executive director of Cosmopolitan.

128
Notes to Financial Statements (Cont’d)
Annual Report 2017
9. SENIOR EXECUTIVES’ EMOLUMENTS
The five highest paid individuals during the year included five (2016 - five) Directors, details of whose remuneration are disclosed in note 8 to the financial statements.
10. INCOME TAX
2017 2016HK$’million HK$’million
Current – Hong Kong Charge for the year 85.2 97.9 Underprovision/(Overprovision) in prior years (4.3) 7.4Current – Overseas Charge for the year 65.5 3.2 Overprovision in prior years – (0.2) PRC land appreciation tax 4.5 –Deferred (note 37) (59.4) (104.2)
Total tax charge for the year 91.5 4.1
The provision for Hong Kong profits tax has been calculated by applying the applicable tax rate of 16.5% (2016 - 16.5%) to the estimated assessable profits which were earned in or derived from Hong Kong during the year.
Taxes on the profits of subsidiaries operating overseas are calculated at the rates prevailing in the respective jurisdictions in which they operate.
The PRC land appreciation tax (“LAT”) is levied on the sale or transfer of state-owned land use rights, buildings and their attached facilities in Mainland China at progressive rates ranging from 30% to 60% of the appreciation value, with an exemption provided for the sale of ordinary residential properties if their appreciation values do not exceed 20% of the sum of the total deductible items.

129
Notes to Financial Statements (Cont’d)
Annual Report 2017
A reconciliation of the tax expense/(credit) applicable to profit/(loss) before tax at the statutory rates for the jurisdictions in which the Company and the majority of its subsidiaries are domiciled to the tax charge at the Group's effective tax rate is as follows:
2017
Hong Kongand others
Mainland China Total
HK$’million % HK$’million % HK$’million
Profit before tax 735.0 135.1 870.1
Tax at the statutory tax rate 121.3 16.5 33.8 25.0 155.1Adjustments in respect of current tax of previous years (4.3) – (4.3)Losses attributable to associates 5.4 – 5.4Income not subject to tax (187.7) (41.1) (228.8)Expenses not deductible for tax 110.7 1.8 112.5Tax losses utilised from previous years (40.9) (11.2) (52.1)Tax losses not recognised during the year 42.4 48.6 91.0LAT provided – 4.5 4.5Tax effect on LAT – (1.1) (1.1)Lower tax rate enacted by local authority – (5.8) (5.8)Others 13.8 1.3 15.1
Tax charge at the Group’s effective rate 60.7 30.8 91.5
2016
Hong Kongand others
Mainland China Total
HK$’million % HK$’million % HK$’million
Profit/(Loss) before tax 296.9 (54.7) 242.2
Tax at the statutory tax rate 49.0 16.5 (13.7) 25.0 35.3Adjustments in respect of current tax of previous years 7.4 (0.2) 7.2Losses attributable to associates 2.3 – 2.3Income not subject to tax (126.4) (1.5) (127.9)Expenses not deductible for tax 42.7 16.0 58.7Tax losses utilised from previous years (31.1) – (31.1)Tax losses not recognised during the year 56.6 – 56.6Others 3.0 – 3.0
Tax charge at the Group’s effective rate 3.5 0.6 4.1
No provision for tax was required for the joint venture and associates as no assessable profits were earned by the joint venture and associates during the year (2016 - Nil).

130
Notes to Financial Statements (Cont’d)
Annual Report 2017
11. DIVIDENDS
2017 2016HK$’million HK$’million
Interim - HK0.65 cent (2016 - HK0.63 cent) per ordinary share 20.8 20.2Proposed final - HK1.70 cents (2016 - HK1.37 cents) per ordinary share 54.5 43.9
75.3 64.1
The proposed final dividend for the year is subject to the approval of the Company’s shareholders at the forthcoming annual general meeting.
12. EARNINGS PER ORDINARY SHARE ATTRIBUTABLE TO EQUITY HOLDERS OF THE PARENT
(a) Basic earnings per ordinary share
The calculation of the basic earnings per ordinary share is based on the profit for the year attributable to equity holders of the parent of HK$381.2 million (2016 - HK$136.2 million), adjusted for the share of distribution related to perpetual securities of the RHIHL Group of HK$34.3 million (2016 - Nil), and on the weighted average of 3,203.8 million (2016 - 3,203.8 million) ordinary shares of the Company in issue during the year.
(b) Diluted earnings per ordinary share
No adjustment has been made to the basic earnings per ordinary share amount presented for the years ended 31st December, 2017 and 2016 as the Company had no potentially dilutive ordinary shares in issue and therefore no diluting events existed throughout the years.

131
Notes to Financial Statements (Cont’d)
Annual Report 2017
13. PROPERTY, PLANT AND EQUIPMENT
Hotelland andbuildings
Leaseholdproperties
Propertiesunder
construction
Leaseholdimprovements,
furniture,fixtures
andequipment
Motorvehicles Aircraft
Constructionin progress Total
HK$’million HK$’million HK$’million HK$’million HK$’million HK$’million HK$’million HK$’million
31st December, 2017
At 31st December, 2016 and at 1st January, 2017 Cost 19,532.3 425.2 977.6 590.9 6.1 431.5 4.4 21,968.0 Accumulated depreciation (2,039.6) (35.5) – (239.8) (3.1) (132.6) – (2,450.6)
Net carrying amount 17,492.7 389.7 977.6 351.1 3.0 298.9 4.4 19,517.4
At 1st January, 2017, net of accumulated depreciation 17,492.7 389.7 977.6 351.1 3.0 298.9 4.4 19,517.4Additions 1,329.8 – 2,445.4 108.2 0.2 138.8 2.5 4,024.9Disposal of subsidiaries (note 43(c)(i)) – – – (4.3) – – – (4.3)Surplus on revaluation 10.6 – – – – – – 10.6Reclassification – – – 4.4 – – (4.4) –Transfer to investment properties, net (61.0) – – (7.7) – – – (68.7)Transfer to aircraft held for sale – – – – – (48.5) – (48.5)Write-off/Disposals – (30.5) – (2.5) (0.2) (213.1) – (246.3)Write-back of depreciation upon write-off/disposals/transfer 7.8 7.0 – 1.7 0.2 110.7 – 127.4Depreciation provided during the year (464.5) (22.6) – (84.1) (1.0) (31.2) – (603.4)Impairment – – – – – (50.5) – (50.5)Exchange realignment 13.7 0.9 – 1.1 – 1.9 – 17.6
At 31st December, 2017, net of accumulated depreciation and impairment 18,329.1 344.5 3,423.0 367.9 2.2 207.0 2.5 22,676.2
At 31st December, 2017: Cost 20,826.2 397.1 3,423.0 690.3 6.1 261.1 2.5 25,606.3 Accumulated depreciation and impairment (2,497.1) (52.6) – (322.4) (3.9) (54.1) – (2,930.1)
Net carrying amount 18,329.1 344.5 3,423.0 367.9 2.2 207.0 2.5 22,676.2

132
Notes to Financial Statements (Cont’d)
Annual Report 2017
Hotelland andbuildings
Leaseholdproperties
Propertiesunder
construction
Leaseholdimprovements,
furniture,fixtures
andequipment
Motorvehicles Aircraft
Constructionin progress Total
HK$’million HK$’million HK$’million HK$’million HK$’million HK$’million HK$’million HK$’million
31st December, 2016
At 1st January, 2016: Cost 19,536.3 424.6 928.3 505.7 5.7 544.9 12.8 21,958.3 Accumulated depreciation (1,587.3) (22.6) – (165.1) (3.0) (88.9) – (1,866.9)
Net carrying amount 17,949.0 402.0 928.3 340.6 2.7 456.0 12.8 20,091.4
At 1st January, 2016, net of accumulated depreciation 17,949.0 402.0 928.3 340.6 2.7 456.0 12.8 20,091.4 Additions – 0.1 49.3 76.5 3.4 2.6 4.4 136.3Acquisition of subsidiaries (note 41) – – – 3.2 – – – 3.2Reclassification – 3.0 – 9.8 – – (12.8) –Transfer to properties under development (note 15) – (2.1) – – – – – (2.1) Transfer from/(to) properties held for sale, net – 1.6 – (1.1) – – – 0.5 Write-off/Disposals – – – (2.3) (3.0) (116.4) – (121.7)Write-back of depreciation upon write-off/disposals/transfer – 8.9 – 1.9 1.1 20.3 – 32.2 Depreciation provided during the year (452.5) (22.5) – (77.1) (1.2) (63.9) – (617.2)Exchange realignment (3.8) (1.3) – (0.4) – 0.3 – (5.2)
At 31st December, 2016, net of accumulated depreciation 17,492.7 389.7 977.6 351.1 3.0 298.9 4.4 19,517.4
At 31st December, 2016: Cost 19,532.3 425.2 977.6 590.9 6.1 431.5 4.4 21,968.0 Accumulated depreciation (2,039.6) (35.5) – (239.8) (3.1) (132.6) – (2,450.6)
Net carrying amount 17,492.7 389.7 977.6 351.1 3.0 298.9 4.4 19,517.4
At 31st December, 2017, the Group’s property, plant and equipment with a net carrying amount of HK$17,639.0 million (2016 - HK$13,703.9 million) were pledged to secure banking facilities granted to the Group.

133
Notes to Financial Statements (Cont’d)
Annual Report 2017
During the year, an impairment loss of HK$50.5 million (2016 - Nil) was recognised in profit or loss and included in the “Aircraft ownership and leasing” segment to write down the carrying amount of certain aircraft to their recoverable amount of HK$77.9 million. The estimates of the recoverable amount were based on the fair value less costs of disposal, using market comparison approach by reference to the estimated sales value as at 31st December, 2017. The fair value on which the recoverable amount is based on is categorised as a Level 2 measurement.
As at 31st December, 2017, certain aircraft with carrying amount of HK$18.4 million were transferred to aircraft held for sale in accordance with HKFRS 5.
In 2015, the Group entered into a development agreement (“Hotel Development Agreement”) with Urban Renewal Authority (“URA”), for a hotel development project in Tai Kok Tsui, Kowloon, Hong Kong, in the form of a joint operation. The consideration for the acquisition of the development right and all relevant costs incurred under the Hotel Development Agreement are included in the Group’s properties under construction. Pursuant to the terms of the Hotel Development Agreement, the Group will undertake the development and, after completion of the project, acquire URA’s interest in the project at no further cost.
14. INVESTMENT PROPERTIES
2017 2016HK$’million HK$’million
Completed investment properties 3,445.2 1,027.3Investment properties under construction – 1,368.0
3,445.2 2,395.3
The movements of investment properties during the year are as follows:
Carrying amount at 1st January 2,395.3 2,101.3Capital expenditure for the year 318.9 228.6Transfer from owner-occupied properties 125.8 –Transfer to owner-occupied properties (66.0) –Transfer from properties held for sale – 115.0Disposals (0.9) (119.0)Net gain from fair value adjustments 671.2 69.4Exchange realignment 0.9 –
Carrying amount at 31st December 3,445.2 2,395.3

134
Notes to Financial Statements (Cont’d)
Annual Report 2017
The Directors of the Company determined the Group’s investment properties into different classes of asset based on the nature, characteristics and risks of each property. The Group’s investment properties were revalued on 31st December, 2017 based on valuations performed by Savills Valuation and Professional Services Limited, DTZ Cushman & Wakefield Limited, Colliers International (Hong Kong) Limited and Colliers International Spain, four independent professionally qualified valuers, at HK$3,445.2 million. Each year, the Group’s management selects the external valuers to be appointed for the external valuations of the Group’s properties. Selection criteria include market knowledge, reputation, independence and whether professional standards are maintained. The Group’s management also has discussions with the valuers on the valuation assumptions and valuation results twice a year when the valuations are performed for interim and annual financial reporting. Certain of the Group’s investment properties are leased to third parties under operating leases, further summary details of which are included in note 47(a) to the financial statements.
At 31st December, 2017, the Group’s investment properties with a carrying value of HK$3,318.0 million (2016 - HK$1,586.0 million) were pledged to secure banking facilities granted to the Group.
Further particulars of the Group’s investment properties are included on pages 192 to 194.
Fair value hierarchy
The following tables illustrate the fair value measurement hierarchy of the Group’s investment properties:
Fair value measurement as at 31st December, 2017 using
Quotedprices in
active markets
Significantobservable
inputs
Significantunobservable
inputs(Level 1) (Level 2) (Level 3) Total
HK$’million HK$’million HK$’million HK$’million
Residential properties – – 864.0 864.0Commercial properties – – 2,454.0 2,454.0Hotel properties – – 126.7 126.7Industrial properties – – 0.5 0.5
– – 3,445.2 3,445.2

135
Notes to Financial Statements (Cont’d)
Annual Report 2017
Fair value measurement as at 31st December, 2016 using
Quotedprices in
active markets
Significantobservable
inputs
Significantunobservable
inputs(Level 1) (Level 2) (Level 3) Total
HK$’million HK$’million HK$’million HK$’million
Residential properties – – 808.9 808.9Commercial properties – – 218.0 218.0Commercial properties under construction – – 1,368.0 1,368.0Industrial properties – – 0.4 0.4
– – 2,395.3 2,395.3
During the year, there were no transfers of fair value measurements between Level 1 and Level 2 and no transfers into or out of Level 3 (2016 - Nil).
Reconciliation of fair value measurements categorised within Level 3 of the fair value hierarchy:
Commercialproperties
Residential Commercial under Hotel Industrialproperties properties construction properties properties
HK$’million HK$’million HK$’million HK$’million HK$’million
Carrying amount at 1st January, 2016 861.9 209.0 1,030.0 – 0.4Capital expenditure for the year 1.4 – 227.2 – –Transfer from properties held for sale 115.0 – – – –Disposals (119.0) – – – –Gain/(Loss) from fair value adjustments (50.4) 9.0 110.8 – –
Carrying amount at 31st December, 2016 and 1st January, 2017 808.9 218.0 1,368.0 – 0.4Capital expenditure for the year 4.1 1.6 313.2 – –Transfer from owner-occupied properties – – – 125.8 –Transfer to owner-occupied properties – (66.0) – – –Disposals (0.9) – – – –Gain from fair value adjustments 51.9 417.4 201.8 – 0.1Reclassification – 1,883.0 (1,883.0) – –Exchange realignment – – – 0.9 –
Carrying amount at 31st December, 2017 864.0 2,454.0 – 126.7 0.5
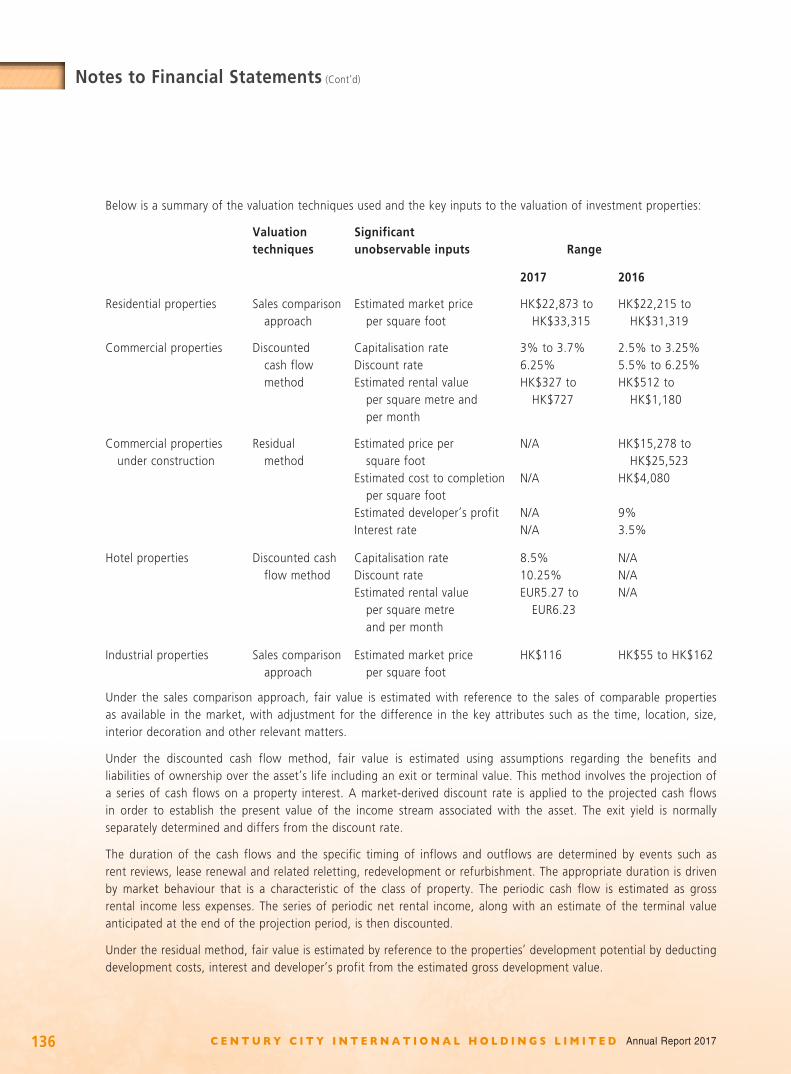
136
Notes to Financial Statements (Cont’d)
Annual Report 2017
Below is a summary of the valuation techniques used and the key inputs to the valuation of investment properties:
Valuation techniques
Significant unobservable inputs Range
2017 2016
Residential properties Sales comparison approach
Estimated market price per square foot
HK$22,873 to HK$33,315
HK$22,215 to HK$31,319
Commercial properties Discounted cash flow method
Capitalisation rateDiscount rateEstimated rental value per square metre and per month
3% to 3.7%6.25%HK$327 to HK$727
2.5% to 3.25%5.5% to 6.25%HK$512 to HK$1,180
Commercial properties under construction
Residual method
Estimated price per square foot
N/A HK$15,278 to HK$25,523
Estimated cost to completion per square foot
N/A HK$4,080
Estimated developer’s profit N/A 9%Interest rate N/A 3.5%
Hotel properties Discounted cash flow method
Capitalisation rate 8.5% N/ADiscount rateEstimated rental value per square metre and per month
10.25%EUR5.27 to EUR6.23
N/AN/A
Industrial properties Sales comparison Estimated market price HK$116 HK$55 to HK$162 approach per square foot
Under the sales comparison approach, fair value is estimated with reference to the sales of comparable properties as available in the market, with adjustment for the difference in the key attributes such as the time, location, size, interior decoration and other relevant matters.
Under the discounted cash flow method, fair value is estimated using assumptions regarding the benefits and liabilities of ownership over the asset’s life including an exit or terminal value. This method involves the projection of a series of cash flows on a property interest. A market-derived discount rate is applied to the projected cash flows in order to establish the present value of the income stream associated with the asset. The exit yield is normally separately determined and differs from the discount rate.
The duration of the cash flows and the specific timing of inflows and outflows are determined by events such as rent reviews, lease renewal and related reletting, redevelopment or refurbishment. The appropriate duration is driven by market behaviour that is a characteristic of the class of property. The periodic cash flow is estimated as gross rental income less expenses. The series of periodic net rental income, along with an estimate of the terminal value anticipated at the end of the projection period, is then discounted.
Under the residual method, fair value is estimated by reference to the properties’ development potential by deducting development costs, interest and developer’s profit from the estimated gross development value.

137
Notes to Financial Statements (Cont’d)
Annual Report 2017
A significant increase/(decrease) in the estimated market rental value and estimated price per square foot in isolation would result in a significant increase/(decrease) in the fair value of the residential, commercial, hotel and industrial properties. A significant increase/(decrease) in the capitalisation rate and the discount rate in isolation would result in a significant decrease/(increase) in the fair value of the commercial and hotel properties.
For commercial properties under construction, a significant increase/(decrease) in the estimated price per square foot in isolation would result in a significant increase/(decrease) in the fair value of the properties. A significant increase/(decrease) in the estimated cost to completion per square foot, the estimated developer’s profit and the interest rate in isolation would result in a significant decrease/(increase) in the fair value of the properties.
15. PROPERTIES UNDER DEVELOPMENT AND DEPOSITS RECEIVED
Properties under development are analysed as follows:
2017 2016HK$’million HK$’million
Balance at 1st January 7,758.5 7,661.2Additions 2,202.5 1,146.9Transfer from property, plant and equipment (note 13) – 2.1Transfer to properties held for sale (945.9) –Disposal of subsidiaries (note 43(c)(ii)) – (897.0)Write-back of impairment* 57.0 –Exchange realignment 198.1 (154.7)
Balance at 31st December 9,270.2 7,758.5Portion included in current assets (7,194.9) (6,465.5)
Non-current portion 2,075.3 1,293.0
2017 2016HK$’million HK$’million
Properties under development included under current assets expected to be completed within normal operating cycle and recovered: Within one year 6,481.5 4,898.0 After one year 713.4 1,567.5
7,194.9 6,465.5
* During the year ended 31st December, 2017, an impairment loss previously recognised of HK$57.0 million in respect of a hotel property under development located in Chengdu, the PRC was reversed due to the increase in the recoverable amount of the hotel property under development. As at 31st December, 2017, the recoverable amount of the hotel property under development was determined based on a value in use calculation (2016 - value in use calculation) using cash flow projections from financial budgets approved by senior management which have been prepared to reflect the development plan of the hotel property under development. The discount rate applied in the value in use calculation was 20.8% (2016 - 19.5%). The write-back of impairment of HK$57.0 million was recognised in the consolidated statement of profit or loss and included in the “property development and investment” segment.

138
Notes to Financial Statements (Cont’d)
Annual Report 2017
At 31st December, 2017, the Group’s properties under development with a carrying amount of HK$3,501.9 million (2016 - HK$3,261.0 million) were pledged to secure banking facilities granted to the Group.
In 2014, the Group entered into a development agreement (“Development Agreement”) with the URA, for a development project in Sham Shui Po, Kowloon, Hong Kong, in the form of a joint operation. Under the Development Agreement, the Group is mainly responsible for the construction of the development project and the relevant costs incurred are included as part of the Group’s properties under development. Sales proceeds arising from the sale of the development projects will be distributed between URA and the Group pursuant to the terms of the Development Agreement.
At 31st December, 2017, included in deposits received is an aggregate amount of HK$2,522.9 million (2016 - HK$2,194.3 million) representing sales receipts in advance from buyers in connection with sale and pre-sale of properties.
16. INVESTMENT IN A JOINT VENTURE
2017 2016HK$’million HK$’million
Share of net assets – 150.7Loan to a joint venture – 1,000.0
– 1,150.7
On 30th December, 2016, the Group disposed of 50% equity interest in Prosper Harvest Investments Limited (“Prosper Harvest”) and its subsidiaries (the “Prosper Harvest Group”) that beneficially hold a hotel development project (the “iclub Ma Tau Wai Hotel”) for a consideration of HK$150.0 million (before net assets adjustment). Immediately after the disposal, the Prosper Harvest Group became a joint venture of the Group. Further details of the disposal are included in note 43(c)(ii) to the financial statements.
The loan to a joint venture was unsecured, interest-free and had no fixed terms of repayment. In the opinion of the Directors, this loan was considered as part of the Group’s net investment in the joint venture.
On 23rd May, 2017, the Group, through P&R Holdings, re-acquired the 50% equity interest in Prosper Harvest at a consideration of HK$165.7 million and Prosper Harvest became a wholly owned subsidiary of P&R Holdings thereafter. On 29th June, 2017, P&R Holdings entered into a sale and purchase agreement with Regal REIT, a listed subsidiary of the Company, in relation to the disposal of the entire issued share capital of Prosper Harvest and the assignment of the shareholder’s loan to the purchaser for a consideration of HK$1,360.0 million, which was completed on 4th September, 2017. Prosper Harvest continues to be a subsidiary of the Group, but held through Regal REIT. In the opinion of the Directors, the repurchase of 50% equity interest in the Prosper Harvest Group represented an asset acquisition of the corresponding interest in the iclub Ma Tau Wai Hotel. After the repurchase, the Group classified the iclub Ma Tau Wai Hotel as “hotel land and buildings” under property, plant and equipment.

139
Notes to Financial Statements (Cont’d)
Annual Report 2017
Particulars of the Group’s joint venture at 31st December, 2016 were as follows:
Name
Place of incorporation and business
Particulars of issued
shares held
Percentage of equity interest
attributable to the Group
Principal activity
Prosper Harvest Investments Limited
British Virgin Islands
Ordinary shares of US$1 each 50.0
Investment holding
The above investment was indirectly held by the Company. The percentage of equity interest above represented that attributable to P&R Holdings.
Prosper Harvest was considered a material joint venture of the Group and was accounted for using the equity method.
The following table illustrated the summarised financial information in respect of the Prosper Harvest Group, as at 31st December, 2016, adjusted for any differences in accounting policies and reconciled to the carrying amount in the financial statements:
2016Prosper Harvest Group HK$’million
Non-current asset 1,300.0
Cash and cash equivalents 0.1Other current asset 1.3
Current assets 1.4
Non-current liability (1,000.0)
Net assets 301.4
Reconciliation to the Group’s interest in the joint venture:Proportion of the Group’s ownership 50%
Group’s share of net assets of the joint venture 150.7Loan to the joint venture 1,000.0
Carrying amount of the investment 1,150.7

140
Notes to Financial Statements (Cont’d)
Annual Report 2017
17. INVESTMENTS IN ASSOCIATES
2017 2016HK$’million HK$’million
Share of net liabilities (104.0) (71.5)Amounts due from associates 128.5 106.8
24.5 35.3
The amounts due from associates are unsecured, interest-free and have no fixed terms of repayment. In the opinion of the Directors, these amounts are considered as part of the Group’s net investments in the associates.
Particulars of the Group’s material associates are as follows:
Name
Place ofincorporation/
registrationand business
Issued ordinaryshare capital/
registered capital
Percentage of equity interest
attributable to the Group
Principalactivities
2017 2016
8D Matrix Limited (“8D Matrix”)
British VirginIslands
HK$2,000,000 48.0 48.0 Investment holding
8D International Limited# Hong Kong HK$500,000 48.0 48.0 Advertising and promotion
Century Innovative Technology Limited#
Hong Kong HK$1 48.0 48.0 Development and distribution of
edutainment products
深圳市世紀創意科技
有限公司*#
PRC/Mainland China
RMB63,000,000 48.0 48.0 Development and distribution of
edutainment products
* Not audited by Ernst & Young, Hong Kong or another member firm of the Ernst & Young global network.
# These are wholly owned subsidiaries of 8D Matrix.
The percentages of equity interest above represent the aggregate of the 12% (including a 2% attributable interest held by the Company through 8D International (BVI) Limited (“8D BVI”), an associate in which the Company and RHIHL holds a 10% and 30% equity interest, respectively) and the 36% (including a 6% attributable interest held by RHIHL through 8D BVI) equity interest attributable to the Company and RHIHL, respectively.
The above associates are indirectly held by the Company.
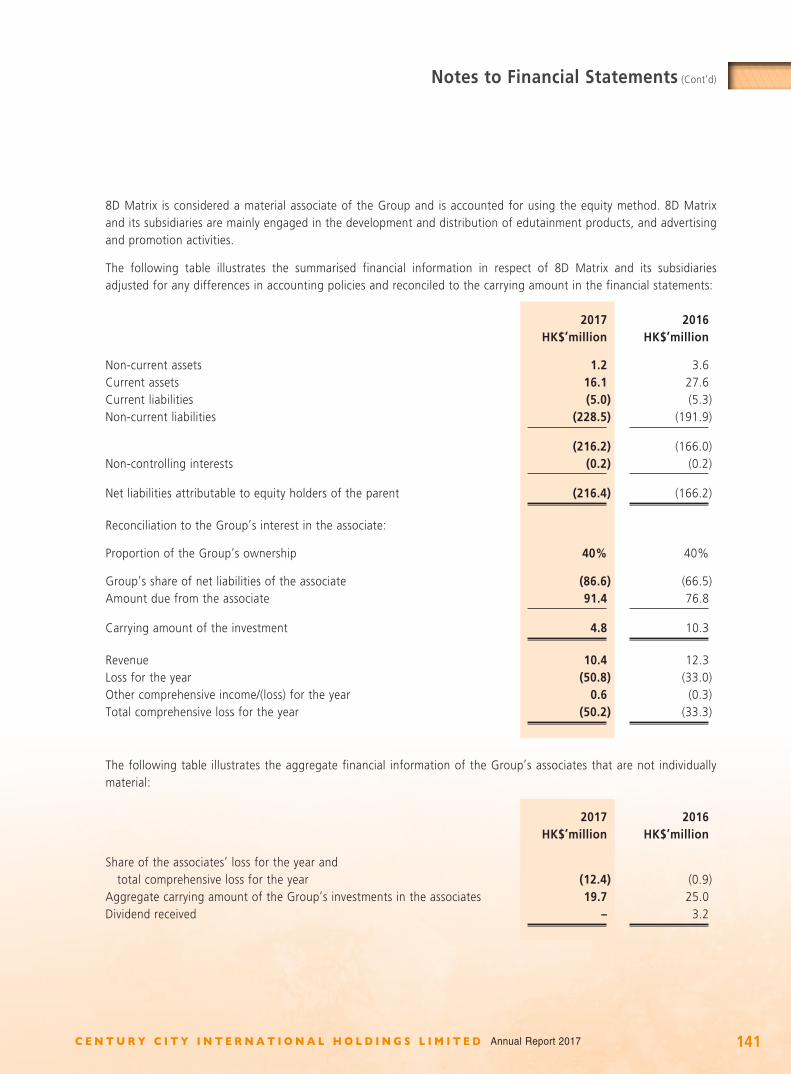
141
Notes to Financial Statements (Cont’d)
Annual Report 2017
8D Matrix is considered a material associate of the Group and is accounted for using the equity method. 8D Matrix and its subsidiaries are mainly engaged in the development and distribution of edutainment products, and advertising and promotion activities.
The following table illustrates the summarised financial information in respect of 8D Matrix and its subsidiaries adjusted for any differences in accounting policies and reconciled to the carrying amount in the financial statements:
2017 2016HK$’million HK$’million
Non-current assets 1.2 3.6Current assets 16.1 27.6Current liabilities (5.0) (5.3)Non-current liabilities (228.5) (191.9)
(216.2) (166.0)
Non-controlling interests (0.2) (0.2)
Net liabilities attributable to equity holders of the parent (216.4) (166.2)
Reconciliation to the Group’s interest in the associate:
Proportion of the Group’s ownership 40% 40%
Group’s share of net liabilities of the associate (86.6) (66.5)Amount due from the associate 91.4 76.8
Carrying amount of the investment 4.8 10.3
Revenue 10.4 12.3Loss for the year (50.8) (33.0)Other comprehensive income/(loss) for the year 0.6 (0.3)Total comprehensive loss for the year (50.2) (33.3)
The following table illustrates the aggregate financial information of the Group’s associates that are not individually material:
2017 2016HK$’million HK$’million
Share of the associates’ loss for the year and total comprehensive loss for the year (12.4) (0.9)Aggregate carrying amount of the Group’s investments in the associates 19.7 25.0Dividend received – 3.2

142
Notes to Financial Statements (Cont’d)
Annual Report 2017
18. AVAILABLE-FOR-SALE INVESTMENTS
2017 2016HK$’million HK$’million
Unlisted equity investments, at fair value 367.2 302.8Unlisted equity investments, at cost 80.5 32.8
447.7 335.6
During the year, the gross gain in respect of the Group’s available-for-sale investments recognised in other comprehensive income amounted to HK$34.2 million (2016 - gross loss of HK$3.8 million).
The above unlisted investments represent investments which were designated as available-for-sale financial assets and have no fixed maturity date or coupon rate.
At 31st December, 2017, unlisted equity investments with a carrying amount of HK$80.5 million (2016 - HK$32.8 million) were stated at cost less impairment because the range of reasonable fair value estimates is so significant that the Directors are of the opinion that their fair values cannot be measured reliably. The Group does not intend to dispose of the investments in the near future.
At 31st December, 2017, the Group’s unlisted equity investments with a carrying value of HK$23.5 million (2016 - HK$16.3 million) were pledged to secure banking facilities granted to the Group.
19. FINANCIAL ASSETS AT FAIR VALUE THROUGH PROFIT OR LOSS
2017 2016HK$’million HK$’million
Non-current asset: Structured deposit, at fair value 1.9 1.9
Current assets: Listed equity investments, at market value 602.4 428.9 Listed debt investments, at market value 1,105.3 539.4
1,707.7 968.3
The listed equity investments of HK$3.0 million (2016 - HK$5.3 million) included under current assets and a structured deposit were designated upon initial recognition as financial assets at fair value through profit or loss as they are managed and their performance is evaluated on a fair value basis, in accordance with a documented risk management and investment strategy, and information about the investments is provided on that basis to the Group’s key management personnel.
The listed equity investments of HK$599.4 million (2016 - HK$423.6 million) and listed debt investments included under current assets at 31st December, 2017 and 2016 were classified as held for trading.

143
Notes to Financial Statements (Cont’d)
Annual Report 2017
At 31st December, 2017, certain of the Group’s financial assets at fair value through profit or loss with a carrying value of HK$1,004.9 million (2016 - HK$364.5 million) were pledged to secure banking facilities granted to the Group as well as bank guarantees procured by the Group pursuant to certain lease guarantees in connection with the leasing of the hotel properties from Regal REIT.
20. HELD-TO-MATURITY INVESTMENTS
At 31st December, 2017, the amount represented unlisted certificates of deposit with fixed maturity dates. All unlisted certificates of deposit are denominated in Renminbi with fixed interest rates ranging from 3.7% to 3.8% per annum (2016 - 3.4% to 7.1% per annum, except for an amount of HK$200.0 million which was denominated in Hong Kong dollars with fixed interest rate of 1.0% per annum).
At 31st December, 2017, certain of the Group’s held-to-maturity investments with a carrying amount of HK$97.1 million (2016 - HK$466.7 million) were pledged to secure banking facilities granted to the Group as well as bank guarantees procured by the Group pursuant to certain lease guarantees in connection with the leasing of the hotel properties from Regal REIT.
21. CONTINGENT CONSIDERATION RECEIVABLE
At 31st December, 2016, the contingent consideration receivable represented a priority right to receive dividends up to an aggregate of RMB48.0 million (HK$53.4 million), before allocation of profits to the then non-controlling interests, in relation to the profits generated by the acquired companies from the acquisition of subsidiaries described in note 41. The fair value of the contingent consideration receivable as at the acquisition date of 31st May, 2016 was HK$9.2 million.
The fair value of the contingent consideration receivable as at 31st December, 2016 was based on a valuation performed by Grant Sherman Appraisal Limited, an independent firm of professionally qualified valuers, at HK$10.3 million. The valuation was determined using the discounted cash flow model and was within Level 3 fair value measurement.
As at 31st December, 2016, the contingent consideration receivable was not expected to be recovered within twelve months and, accordingly, it was classified as a non-current asset.
The priority right to receive dividends was terminated and the contingent consideration receivable was derecognised upon the completion of the disposal of subsidiaries on 30th June, 2017, further details of which are set out in note 43(c)(i) to the financial statements.
22. LOANS RECEIVABLE
2017 2016HK$’million HK$’million
Long term mortgage loans 116.4 97.1Portion included in current assets (4.5) (3.7)
Non-current portion 111.9 93.4

144
Notes to Financial Statements (Cont’d)
Annual Report 2017
The long term mortgage loans represent loans granted to purchasers in connection with the sale of the Group’s properties. The loans are secured by mortgages over the properties sold and are repayable by instalments in 15 to 25 years (2016 - 15 to 25 years). The long term mortgage loans bear interest at rates ranging from the Hong Kong dollar prime lending rate minus 2.75% to the Hong Kong dollar prime lending rate plus 2% per annum (2016 - Hong Kong dollar prime lending rate minus 2.75% to the Hong Kong dollar prime lending rate plus 2% per annum).
23. FINANCE LEASE RECEIVABLES
The Group has leased out certain aircraft under finance lease arrangements, with remaining lease terms ranging from 1 to 4 years (2016 - ranging from 1 to 5 years).
Minimum lease paymentsPresent value of
minimum lease payments
2017 2016 2017 2016HK$’million HK$’million HK$’million HK$’million
Finance lease receivables comprise:Within one year 54.9 58.3 46.0 45.0In the second to fifth years, inclusive 43.3 98.9 35.1 81.9
98.2 157.2 81.1 126.9
Less: Unearned finance income (17.1) (30.3)
Total net finance lease receivables 81.1 126.9
2017 2016HK$’million HK$’million
Analysed for reporting purposes as: Current assets 46.0 45.0 Non-current asset 35.1 81.9
81.1 126.9
The Group’s finance lease receivables are denominated in United States dollars, which is the functional currency of the relevant group entity.
Unguaranteed residual value of assets leased under finance leases at the end of the reporting period is Nil (2016 - Nil).

145
Notes to Financial Statements (Cont’d)
Annual Report 2017
24. GOODWILL
HK$’million
At 1st January, 2016, 31st December, 2016, 1st January, 2017 and 31st December, 2017: Cost 710.6 Accumulated impairment (449.6)
Net carrying amount 261.0
Impairment testing of goodwillGoodwill acquired through business combinations is allocated to the property development and investment cash- generating unit (“CGU”) for impairment testing.
The recoverable amount of the property development and investment CGU has been determined based on a value in use calculation using cash flow projections from financial budgets approved by senior management covering a five-year period. The projected cash flows have been prepared to reflect the development plan of the property development projects, comprising residential, commercial and hotel buildings. The discount rate applied to the cash flow projections is 20.8% (2016 - 19.5%).
Assumptions were used in the value in use calculation of the property development and investment CGU for the years ended 31st December, 2017 and 31st December, 2016. The following describes each key assumption on which management has based its cash flow projections to undertake impairment testing of goodwill:
Discount rate - Discount rate used is before tax and represents the current market assessment of the risks specific to the relevant CGU, taking into consideration the time value of money and individual risks of the underlying assets that have not been incorporated in the cash flow estimates. The discount rate calculation is based on the specific circumstances of the Group and its operating segments and is derived from its weighted average cost of capital (“WACC”). The WACC takes into account both debt and equity. The cost of equity is derived from the expected return on investment by the Group’s investors. The cost of debt is based on the interest bearing borrowings that the Group is obliged to service. Segment-specific risk is incorporated by applying individual beta factor. The beta factor is evaluated annually based on publicly available market data.
Property price - The basis used to determine the future selling price of the property development projects is with reference to recent market conditions and expected market development.
Construction materials price inflation - The basis used to determine the construction materials price inflation is the forecast price indices during the budget year for Mainland China from where the raw materials are sourced.
The values assigned to the key assumptions on market development of property development industry, discount rate, property price and construction materials price inflation are consistent with external information sources.

146
Notes to Financial Statements (Cont’d)
Annual Report 2017
25. TRADEMARK
2017 2016HK$’million HK$’million
Cost and carrying amount at 1st January and 31st December 610.2 610.2
Impairment testing of trademark
Trademark is allocated to the hotel operation and management and hotel ownership CGU for impairment testing.
The recoverable amount of the hotel operation and management and hotel ownership CGU has been determined based on a value in use calculation using cash flow projections from financial budgets approved by senior management covering a five-year period. The discount rates applied to the cash flow projections are 5.5% to 6.75% (2016 - 5.5% to 7.25%). The growth rates used to extrapolate the cash flows of the hotel operation and management and hotel ownership CGU are 2.6% to 40.7% (2016 - 2.7% to 14%).
Assumptions were used in the value in use calculation of the hotel operation and management and hotel ownership CGU for the years ended 31st December, 2017 and 31st December, 2016. The following describes each key assumption on which management has based its cash flow projections to undertake impairment testing of trademark:
Budgeted gross margins - The basis used to determine the value assigned to the budgeted gross margins is the average gross margins achieved in the year immediately before the budget year, increased for expected efficiency improvements, and expected market development.
Discount rate - Discount rate used is before tax and represents the current market assessment of the risks specific to the relevant CGU, taking into consideration the time value of money and individual risks of the underlying assets that have not been incorporated in the cash flow estimates. The discount rate calculation is based on the specific circumstances of the Group and its operating segments and is derived from its WACC. The WACC takes into account both debt and equity. The cost of equity is derived from the expected return on investment by the Group’s investors. The cost of debt is based on the interest bearing borrowings that the Group is obliged to service. Segment-specific risk is incorporated by applying individual beta factor. The beta factor is evaluated annually based on publicly available market data.
Growth rates - The growth rates used are with reference to the historical performance of the relevant hotels and the long term average growth rate for the hotel industry.
The values assigned to the key assumptions on market development of hotel industry, discount rates and growth rates are consistent with external information sources.

147
Notes to Financial Statements (Cont’d)
Annual Report 2017
26. OTHER INTANGIBLE ASSETS
Non-compete and
consultancy arrangements
Backlog contracts
Favourable lease
agreement TotalHK$’million HK$’million HK$’million HK$’million
31st December, 2017
At 31st December, 2016 and at 1st January 2017Cost 55.4 4.1 46.6 106.1Accumulated amortisation (4.4) (1.3) (3.3) (9.0)
Net carrying amount 51.0 2.8 43.3 97.1
Cost at 1st January, 2017, net of accumulated amortisation 51.0 2.8 43.3 97.1Amortisation provided during the year (3.7) (1.2) (2.9) (7.8)Disposal of subsidiaries (note 43(c)(i)) (47.3) (1.7) (41.8) (90.8)Exchange realignment – 0.1 1.4 1.5
At 31st December, 2017 – – – –
At 31st December, 2017: Cost – – – – Accumulated amortisation – – – –
Net carrying amount – – – –
31st December, 2016
At 1st January, 2016, net of accumulated amortisation – – – –Acquistion of subsidiaries (note 41) 55.4 4.4 49.4 109.2Amortisation provided during the year (4.4) (1.4) (3.4) (9.2)Exchange realignment – (0.2) (2.7) (2.9)
At 31st December, 2016 51.0 2.8 43.3 97.1
At 31st December, 2016 Cost 55.4 4.1 46.6 106.1 Accumulated amortisation (4.4) (1.3) (3.3) (9.0)
Net carrying amount 51.0 2.8 43.3 97.1
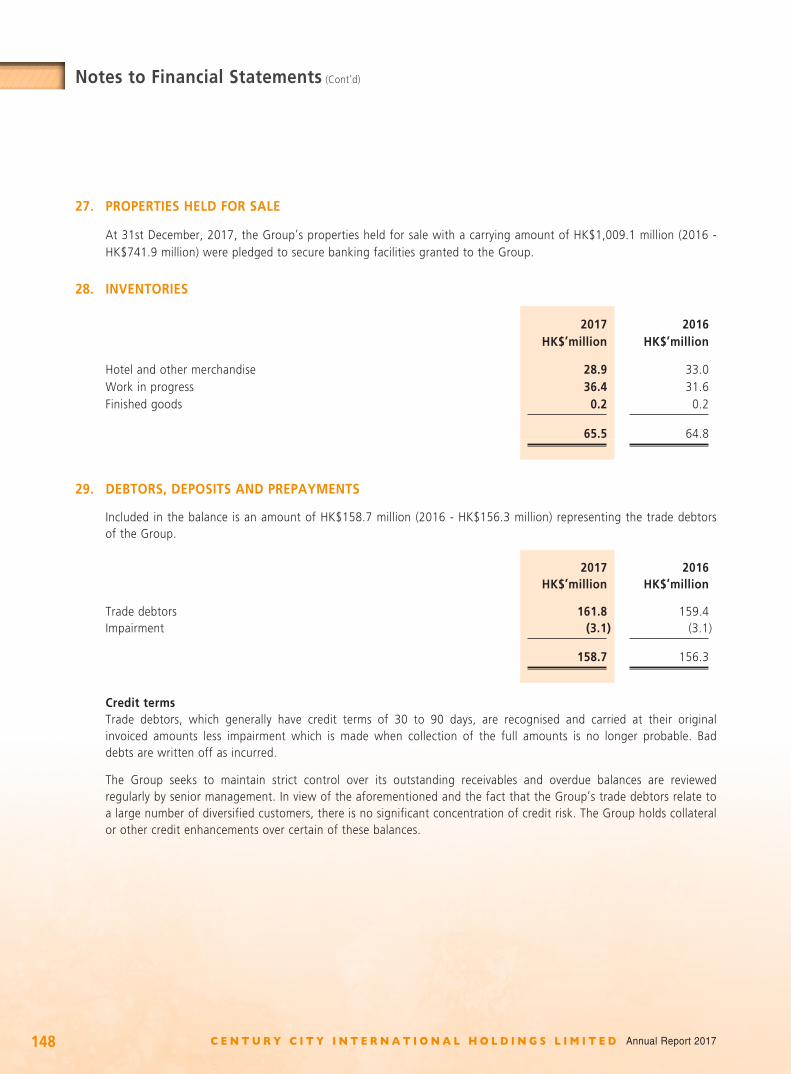
148
Notes to Financial Statements (Cont’d)
Annual Report 2017
27. PROPERTIES HELD FOR SALE
At 31st December, 2017, the Group’s properties held for sale with a carrying amount of HK$1,009.1 million (2016 - HK$741.9 million) were pledged to secure banking facilities granted to the Group.
28. INVENTORIES
2017 2016HK$’million HK$’million
Hotel and other merchandise 28.9 33.0Work in progress 36.4 31.6Finished goods 0.2 0.2
65.5 64.8
29. DEBTORS, DEPOSITS AND PREPAYMENTS
Included in the balance is an amount of HK$158.7 million (2016 - HK$156.3 million) representing the trade debtors of the Group.
2017 2016HK$’million HK$’million
Trade debtors 161.8 159.4Impairment (3.1) (3.1)
158.7 156.3
Credit termsTrade debtors, which generally have credit terms of 30 to 90 days, are recognised and carried at their original invoiced amounts less impairment which is made when collection of the full amounts is no longer probable. Bad debts are written off as incurred.
The Group seeks to maintain strict control over its outstanding receivables and overdue balances are reviewed regularly by senior management. In view of the aforementioned and the fact that the Group’s trade debtors relate to a large number of diversified customers, there is no significant concentration of credit risk. The Group holds collateral or other credit enhancements over certain of these balances.

149
Notes to Financial Statements (Cont’d)
Annual Report 2017
The ageing analysis of these debtors as at the end of the reporting period, based on the invoice date, is as follows:
2017 2016HK$’million HK$’million
Outstanding balances with ages: Within 3 months 134.1 135.1 Between 4 to 6 months 3.5 4.2 Between 7 to 12 months 7.3 5.7 Over 1 year 16.9 14.4
161.8 159.4
Impairment (3.1) (3.1)
158.7 156.3
The movements in provision for impairment of trade debtors are as follows:
2017 2016HK$’million HK$’million
At 1st January 3.1 3.8Amount written off as uncollectible – (0.6)Impairment losses recognised (note 6) 0.1 –Impairment losses written back (note 6) (0.1) (0.1)
At 31st December 3.1 3.1
The above provision for impairment of trade debtors represents a provision for individually impaired trade debtors of HK$3.1 million (2016 - HK$3.1 million) with a gross carrying amount before provision of HK$3.1 million (2016 - HK$3.1 million). The individually impaired trade debtors relate to customers that were in financial difficulties and the balances are not expected to be recovered.

150
Notes to Financial Statements (Cont’d)
Annual Report 2017
The ageing analysis of the trade debtors that are not considered to be impaired is as follows:
2017 2016HK$’million HK$’million
Neither past due nor impaired 108.9 97.5Less than 3 months past due 25.2 37.54 to 6 months past due 3.4 4.07 to 12 months past due 7.1 5.6Over 1 year past due 14.1 11.7
158.7 156.3
Trade debtors that were neither past due nor impaired relate to a number of diversified customers for whom there was no recent history of default.
Trade debtors that were past due but not impaired relate to a number of diversified independent customers that have a good track record with the Group. Based on past experience, the Directors of the Company are of the opinion that no provision for impairment is necessary in respect of these balances as there has not been a significant change in credit quality and the balances are still considered fully recoverable.
Included in the balance is an amount due from a related company of HK$1.2 million (2016 - HK$1.2 million), which is unsecured, non-interest bearing and repayable on demand.
30. RESTRICTED CASH
At 31st December, 2017, the Group had cash of approximately HK$145.6 million (2016 - HK$438.5 million) which was restricted as to use and mainly to be utilised for the purpose of servicing the finance costs and repayments on certain interest bearing bank borrowings, funding the furniture, fixtures and equipment reserve for use in the hotel buildings, deposits of certain tenants in respect of certain investment properties and guarantee deposits for the construction costs of certain pre-sold properties.

151
Notes to Financial Statements (Cont’d)
Annual Report 2017
31. CREDITORS AND ACCRUALS
Included in the balance is an amount of HK$87.0 million (2016 - HK$93.8 million) representing the trade creditors of the Group. The ageing analysis of these creditors as at the end of the reporting period, based on the invoice date, is as follows:
2017 2016HK$’million HK$’million
Outstanding balances with ages: Within 3 months 86.8 93.2 Between 4 to 6 months 0.1 0.4 Between 7 to 12 months 0.1 0.2
87.0 93.8
The trade creditors are non-interest bearing and are normally settled within 90 days.
Included in the balance under current liabilities are amounts due to an associate and a related company of HK$1.2 million (2016 - HK$1.5 million) and HK$4.3 million (2016 - HK$3.9 million), respectively, which are unsecured, non- interest bearing and have no fixed terms of repayment.
32. CONSTRUCTION CONTRACTS
2017 2016HK$’million HK$’million
Gross amount due from contract customers included in debtors, deposits and prepayments – 2.6Gross amount due to contract customers included in creditors and accruals (8.6) (5.8)
(8.6) (3.2)
Contract costs incurred plus recognised profits less recognised losses to date 1,499.1 1,374.2Less: Progress billings (1,507.7) (1,377.4)
(8.6) (3.2)
At 31st December, 2016, retentions held by customers for contract works, as included in debtors, deposits and prepayments under current assets amounted to approximately HK$0.3 million.

152
Notes to Financial Statements (Cont’d)
Annual Report 2017
33. INTEREST BEARING BANK BORROWINGS
2017 2016Maturity HK$’million Maturity HK$’million
CurrentBank loans – secured 2018 4,251.6 2017 992.8
Non-currentBank loans – secured 2019-2021 9,142.0 2018-2021 8,560.4
13,393.6 9,553.2
2017 2016HK$’million HK$’million
Analysed into: Bank loans repayable: Within one year 4,251.6 992.8 In the second year 1,736.7 2,389.7 In the third to fifth years, inclusive 7,405.3 6,170.7
13,393.6 9,553.2
On 12th September, 2016, Regal REIT group through wholly-owned subsidiaries, Bauhinia Hotels Limited and Rich Day Investments Limited, entered into a new facility agreement for a term loan facility of HK$4,500.0 million and a revolving loan facility of up to HK$1,000.0 million (the “2016 IH Facilities”), for a term of five years to September 2021. The term loan portion of the 2016 IH Facilities was wholly drawn in September 2016 to repay the previous term loan facilities of the same amount, which was originally due to mature in July 2018 and bore a higher interest margin; while the revolving loan portion was intended for general corporate funding purposes of Regal REIT group. Moreover, the 2016 IH Facilities are secured by four of the five Initial Hotels, namely, Regal Airport Hotel, Regal Hongkong Hotel, Regal Oriental Hotel and Regal Riverside Hotel. As at 31st December, 2017, the 2016 IH Facilities had an outstanding term loan facility of HK$4,500.0 million and a drawn down on the revolving loan of HK$877.0 million.
On 22nd December, 2014, a term loan facility agreement for a principal amount of HK$440.0 million (the “2014 WC Facility”) was entered into, for a term of five years to December 2019 by Sonnix Limited, a wholly owned subsidiary of Regal REIT group. The 2014 WC Facility, secured by the iclub Wan Chai Hotel, was fully drawn in December 2014. As at 31st December, 2017, the outstanding amount of the 2014 WC Facility was HK$440.0 million, representing the full amount of the term loan facility.
On 10th February, 2014, Regal REIT group, through its wholly owned subsidiary, Tristan Limited, arranged a bilateral loan facility of up to HK$790.0 million, comprised of a term loan facility of HK$632.0 million and a revolving loan facility of up to HK$158.0 million (the “2014 SW Facilities”), secured by the iclub Sheung Wan Hotel. The 2014 SW Facilities have a term of five years to February 2019. As at 31st December, 2017, the utilised 2014 SW Facilities was HK$632.0 million, representing the full amount of the term loan facility.

153
Notes to Financial Statements (Cont’d)
Annual Report 2017
On 28th July, 2014, Regal REIT group, through its wholly owned subsidiary, Wise Decade Investments Limited, arranged another bilateral loan facility of up to HK$825.0 million, comprised of a term loan facility of HK$660.0 million and a revolving loan facility of up to HK$165.0 million (the “2014 FH Facilities”), secured by the iclub Fortress Hill Hotel. The 2014 FH Facilities have a term of five years to July 2019. As at 31st December, 2017, the utilised 2014 FH Facilities was HK$660.0 million, representing the full amount of the term loan facility.
On 4th September, 2017, Regal REIT group, through its wholly owned subsidiary, Land Crown International Limited, arranged for a term loan facility of HK$748.0 million (the “2017 MTW Facility”), secured by the iclub Ma Tau Wai Hotel. The 2017 MTW Facility has a term of three years to September 2020. As at 31st December, 2017, the outstanding amount of the 2017 MTW Facility was HK$748.0 million, representing the full amount of the term loan facility.
At 31st December, 2017, the outstanding loan facilities of Regal REIT group bear interest at the Hong Kong Interbank Offered Rate (“HIBOR“) plus an interest margin ranging from 0.95% to 1.45% per annum (2016 - ranging from 1.15% to 1.45% per annum).
Bank borrowings under the 2016 IH Facilities, the 2014 WC Facility, the 2014 SW Facilities, the 2014 FH Facilities and the 2017 MTW Facility are guaranteed by Regal REIT and/or certain individual companies of the Regal REIT group on a joint and several basis.
The Regal REIT group’s interest bearing bank borrowings are also secured by, amongst others:
(i) legal charges and debentures over the corresponding properties;
(ii) an assignment of rental income and all other proceeds arising from and including all rights, titles and interests under all hotel management agreements and lease agreements, where appropriate, relating to the relevant properties;
(iii) charges over each relevant rental account, sales proceeds account and other control accounts of the Regal REIT group, if any;
(iv) a floating charge over all of the undertakings, properties, assets and rights of each of the relevant companies of the Regal REIT group; and
(v) an equitable charge over the shares in the relevant companies of the Regal REIT group.
At 31st December, 2017, the Group’s other bank borrowings bear interest at HIBOR plus an interest margin ranging from 0.75% to 1.50% per annum (2016 - HIBOR plus 1.5% to 1.75% per annum) except for a bank loan of HK$72.2 million (2016 - Nil) which bears interest at London Inter Bank Offered Rate plus an interest margin of 0.75% per annum and bank loans of HK$392.9 million (2016 - HK$18.0 million) which bear interest at the bank’s cost of fund plus an interest margin from 0.75% to 0.8% per annum (2016 - bank’s cost of fund plus 0.75% per annum).
At 31st December, 2017, all interest bearing bank borrowings are denominated in Hong Kong dollars except for bank loans of HK$310.1 million (2016 - Nil) which are denominated in United States dollars, bank loans of HK$40.9 million (2016 - HK$18.0 million) which are denominated in Euro and a bank loan of HK$7.8 million (2016 - Nil) which is denominated in Japanese Yen.
The Group’s bank borrowings are secured by a pledge over certain assets of the Group as further detailed in note 45 to the financial statements.

154
Notes to Financial Statements (Cont’d)
Annual Report 2017
34. OTHER BORROWINGS
2017 2016HK$’million HK$’million
CurrentOther borrowings - unsecured 1,945.8 2,258.5
Non-currentOther borrowings - unsecured 2,713.7 4,621.3
4,659.5 6,879.8
2017 2016HK$’million HK$’million
Analysed into: Other borrowings repayable: Within one year 1,945.8 2,258.5 In the second year – 1,933.3 In the third to fifth years, inclusive 2,713.7 2,688.0
4,659.5 6,879.8
On 5th October, 2012, RH International Finance Limited (the “MTN Issuer”), a wholly owned subsidiary of RHIHL, established a US$1,000 million medium term note programme guaranteed by RHIHL (the “MTN Programme”).
On 19th October, 2012, the MTN Issuer issued under the MTN Programme a series of United States dollar denominated senior unsecured 5-year term notes in an aggregate nominal principal amount of US$300.0 million at a coupon interest rate of 4.25% per annum. The notes were issued at a discount at 99.444% of the principal amount. The notes were fully repaid during the year.
On 20th July, 2016, the MTN Issuer issued under the MTN Programme a series of United States dollar denominated senior unsecured 5-year term notes in an aggregate nominal principal amount of US$350.0 million at a coupon interest rate of 3.875% per annum. The notes were issued at a discount at 99.663% of the principal amount.
On 11th January, 2013, R-REIT International Finance Limited (the “Regal REIT MTN Issuer”), a wholly owned subsidiary of Regal REIT, established a US$1,000 million medium term note programme (the “Regal REIT MTN Programme”).
On 22nd March, 2013, the Regal REIT MTN Issuer issued under the Regal REIT MTN Programme a series of Hong Kong dollar denominated senior unsecured 5-year term notes in the aggregate nominal principal amount of HK$775.0 million at a coupon interest rate of 4.125% per annum. The notes were issued at a discount at 99.44% of the principal amount. Subsequent to the end of the reporting period, the Regal REIT MTN Issuer repaid the notes on 22nd March, 2018 (note 52).
On 22nd May, 2013, the Regal REIT MTN Issuer issued under the Regal REIT MTN Programme a series of United States dollar denominated senior unsecured 5-year term notes in an aggregate nominal principal amount of US$150.0 million at a coupon interest rate of 4.10% per annum. The notes were issued at a discount at 99.553% of the principal amount.

155
Notes to Financial Statements (Cont’d)
Annual Report 2017
35. DERIVATIVE FINANCIAL INSTRUMENTS
ASSETS
2017 2016HK$’million HK$’million
Foreign currency forward contracts – 12.8
LIABILITIES
2017 2016HK$’million HK$’million
Foreign currency forward contracts 3.0 5.7
The Group has entered into foreign currency forward contracts which are not designated for hedge purposes and are measured at fair value through profit or loss. A fair value loss on non-hedging foreign currency forward contracts of HK$3.0 million was credited to the statement of profit or loss during the year (2016 - net fair value gain of HK$7.1 million).
36. CONVERTIBLE BONDS
As at 31st December, 2016, Cosmopolitan and its subsidiaries (the “Cosmopolitan Group”) issued two tranches of convertible bonds to a then non-controlling shareholder which were fully converted into new ordinary shares of Cosmopolitan during the year. Further details of the convertible bonds are set out as follows:
CB 2020A AND CB 2020B
On 31st May, 2016, Apex Team Limited, a wholly owned subsidiary of Cosmopolitan, issued convertible bonds with the principal amounts of HK$23.8 million (“CB 2020A”) and HK$33.3 million (“CB 2020B”) with a maturity date on 31st May, 2020 as part of the considerations for a business acquisition detailed in note 41 to the financial statements.
Both CB 2020A and CB 2020B bore no coupon interest and were unsecured.
The holders of CB 2020A and CB 2020B were entitled to convert the convertible bonds into ordinary shares of Cosmopolitan at an initial conversion price of HK$0.35 per share (subject to adjustment) at any time from 7th June, 2016 to 24th May, 2020. Based on the initial conversion price, CB 2020A and CB 2020B were convertible into a maximum of approximately 68,000,000 and 95,000,000 ordinary shares of Cosmopolitan, respectively. If any of the convertible bonds had not been converted, they would be redeemed on the maturity date at 100% of their outstanding principal amounts.
The convertible bonds contained two components: equity component and liability component. The fair value of the liability component was estimated at the issuance date using an equivalent market interest rate for a similar bond without conversion option. The residual amount was assigned as the equity component and was included in reserve. The effective interest rate of the liability component of the convertible bonds was 8.68%.
During the year ended 31st December, 2017, CB 2020B and CB 2020A were fully converted into 95,000,000 and 68,000,000 new ordinary shares of Cosmopolitan, respectively, on 17th July, 2017 and 13th November, 2017.

156
Notes to Financial Statements (Cont’d)
Annual Report 2017
The movements of the equity component and liability component of the convertible bonds are as follows:
Equity Liabilitycomponent component TotalHK$’million HK$’million HK$’million
At 1st January, 2016 – – –Issue of convertible bonds arising from acquisition of subsidiaries (note 41) 13.4 29.0 42.4Interest expenses (note 7) – 2.1 2.1
At 31st December, 2016 and 1st January, 2017 13.4 31.1 44.5Derecognition of embedded derivative upon disposal of subsidiaries (note 43(c)(i)) – 11.9 11.9Interest expenses (note 7) – 2.5 2.5Conversion during the year (13.4) (45.5) (58.9)
At 31st December, 2017 – – –
37. DEFERRED TAX
The movements in deferred tax assets and liabilities during the year are as follows:
Fair value Fair valueDepreciation Depreciation Losses adjustments adjustments
allowances in in excess of available for arising from arising fromexcess of related offsetting acquisition of revaluation of
related depreciation against future a business/ property, plantdepreciation allowances taxable profits subsidiaries and equipment TotalHK$’million HK$’million HK$’million HK$’million HK$’million HK$’million
Gross deferred tax assets/(liabilities) at 1st January, 2016 (996.3) 2.2 81.2 (1,239.2) – (2,152.1)Acquisition of subsidiaries (note 41) – – – (28.5) – (28.5)Deferred tax credited/(charged) to the statement of profit or loss during the year (note 10) 50.3 (0.3) 14.5 39.7 – 104.2Exchange differences – – – 0.5 – 0.5
Gross deferred tax assets/(liabilities) at 31st December, 2016 and at 1st January, 2017 (946.0) 1.9 95.7 (1,227.5) – (2,075.9)Disposal of subsidiaries (note 43(c)(i)) – – – 24.3 – 24.3Deferred tax credited/(charged) to the statement of profit or loss during the year (note 10) 26.7 (0.1) (31.0) 63.8 – 59.4Deferred tax charged to other comprehensive income during the year – – – – (2.5) (2.5)Exchange differences – – – (1.9) (0.2) (2.1)
Gross deferred tax assets/(liabilities) at 31st December, 2017 (919.3) 1.8 64.7 (1,141.3) (2.7) (1,996.8)

157
Notes to Financial Statements (Cont’d)
Annual Report 2017
For presentation purposes, certain deferred tax assets and liabilities have been offset in the consolidated statement of financial position. The following is an analysis of the deferred tax balances of the Group for financial reporting purposes:
2017 2016HK$’million HK$’million
Net deferred tax assets recognised in the consolidated statement of financial position 51.7 94.0Net deferred tax liabilities recognised in the consolidated statement of financial position (2,048.5) (2,169.9)
(1,996.8) (2,075.9)
The Group has unrecognised tax losses arising in Hong Kong and the United States of America amounting to HK$4,623.7 million (2016 - HK$4,733.5 million) and HK$206.2 million (2016 - HK$204.6 million), respectively, as at 31st December, 2017. The tax losses arising in Hong Kong, subject to the agreement by the Hong Kong Inland Revenue Department, are available indefinitely for offsetting against future taxable profits of the companies in which the losses arose, whilst those arising in the United States of America are available for a maximum period of twenty years. Deferred tax assets in respect of the above tax losses amounting to HK$835.1 million (2016 - HK$852.7 million) have not been recognised on account of the unpredictability of future profit streams.
Pursuant to the PRC Corporate Income Tax Law, a 10% withholding tax is levied on dividends declared to foreign investors from the foreign investment enterprises established in Mainland China. The requirement is effective from 1st January, 2008 and applies to earnings after 31st December, 2007. A lower withholding tax rate may be applied if there is a tax treaty between Mainland China and the jurisdiction of the foreign investors. For the Group, the applicable rate is 5% or 10%. The Group is therefore liable for withholding taxes on dividends distributed by those subsidiaries established in Mainland China in respect of earnings generated from 1st January, 2008.
At 31st December, 2017, no deferred tax has been recognised for withholding taxes that would be payable on the unremitted earnings that are subject to withholding taxes of the Group’s subsidiaries established in Mainland China. In the opinion of the Directors, it is not probable that these subsidiaries will distribute such earnings in the foreseeable future. The aggregate amount of temporary differences associated with investments in subsidiaries in Mainland China for which deferred tax liabilities have not been recognised totalled approximately HK$200.0 million at 31st December, 2017 (2016 - HK$24.1 million).
There are no income tax consequences attaching to the payment of dividends by the Company to its shareholders.
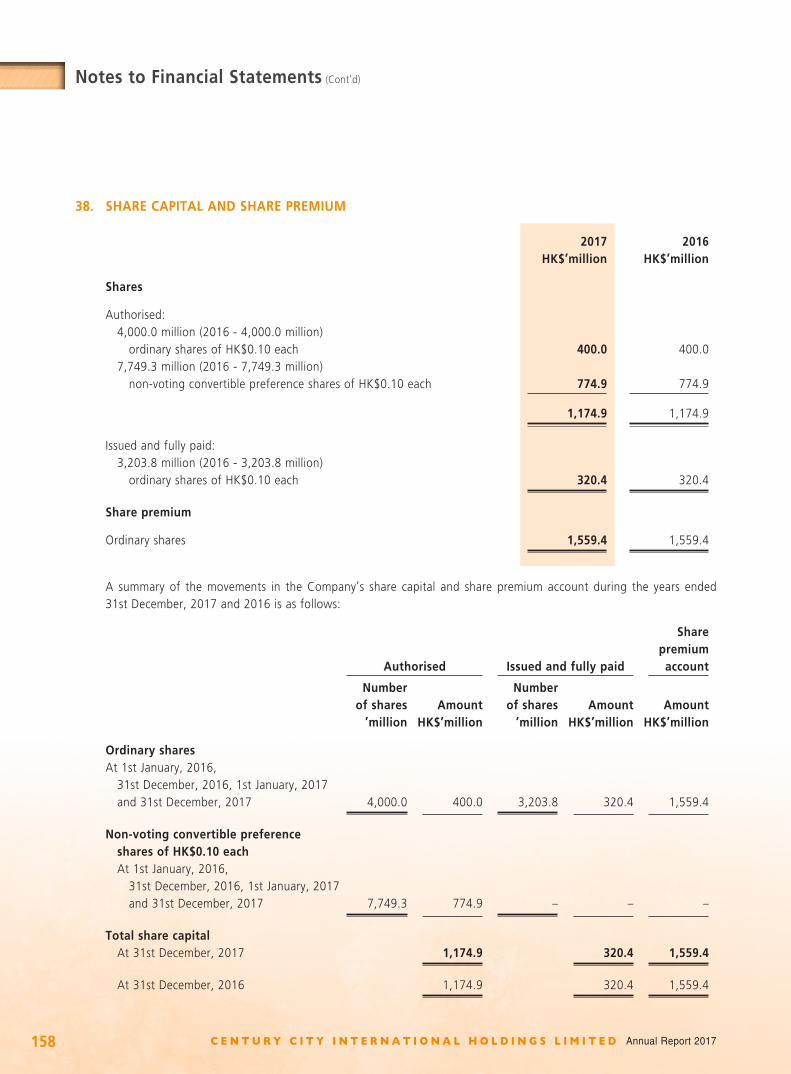
158
Notes to Financial Statements (Cont’d)
Annual Report 2017
38. SHARE CAPITAL AND SHARE PREMIUM
2017 2016HK$’million HK$’million
Shares
Authorised: 4,000.0 million (2016 - 4,000.0 million) ordinary shares of HK$0.10 each 400.0 400.0 7,749.3 million (2016 - 7,749.3 million) non-voting convertible preference shares of HK$0.10 each 774.9 774.9
1,174.9 1,174.9
Issued and fully paid: 3,203.8 million (2016 - 3,203.8 million) ordinary shares of HK$0.10 each 320.4 320.4
Share premium
Ordinary shares 1,559.4 1,559.4
A summary of the movements in the Company’s share capital and share premium account during the years ended 31st December, 2017 and 2016 is as follows:
Authorised Issued and fully paid
Sharepremium
account Number Number
of shares Amount of shares Amount Amount’million HK$’million ’million HK$’million HK$’million
Ordinary sharesAt 1st January, 2016, 31st December, 2016, 1st January, 2017 and 31st December, 2017 4,000.0 400.0 3,203.8 320.4 1,559.4
Non-voting convertible preference shares of HK$0.10 each At 1st January, 2016, 31st December, 2016, 1st January, 2017 and 31st December, 2017 7,749.3 774.9 – – –
Total share capital At 31st December, 2017 1,174.9 320.4 1,559.4
At 31st December, 2016 1,174.9 320.4 1,559.4

159
Notes to Financial Statements (Cont’d)
Annual Report 2017
39. RESERVES
The amounts of the Group’s reserves and the movements therein for the current and prior years are presented in the consolidated statement of changes in equity on pages 70 and 71.
40. PERPETUAL SECURITIES
On 13th April, 2017, RH International Finance Limited issued a series of United States dollar denominated guaranteed senior perpetual securities in an aggregate nominal principal amount of US$225.0 million (equivalent to HK$1,750.0 million) at a coupon interest rate of 6.5% per annum.
There was no movement in the number of perpetual securities during the year. The direct transaction costs attributable to the perpetual securities amounted to HK$17.1 million.
The perpetual securities are guaranteed by RHIHL. There is no maturity of the instruments and the payments of distribution can be deferred at the discretion of the issuer of the perpetual securities.
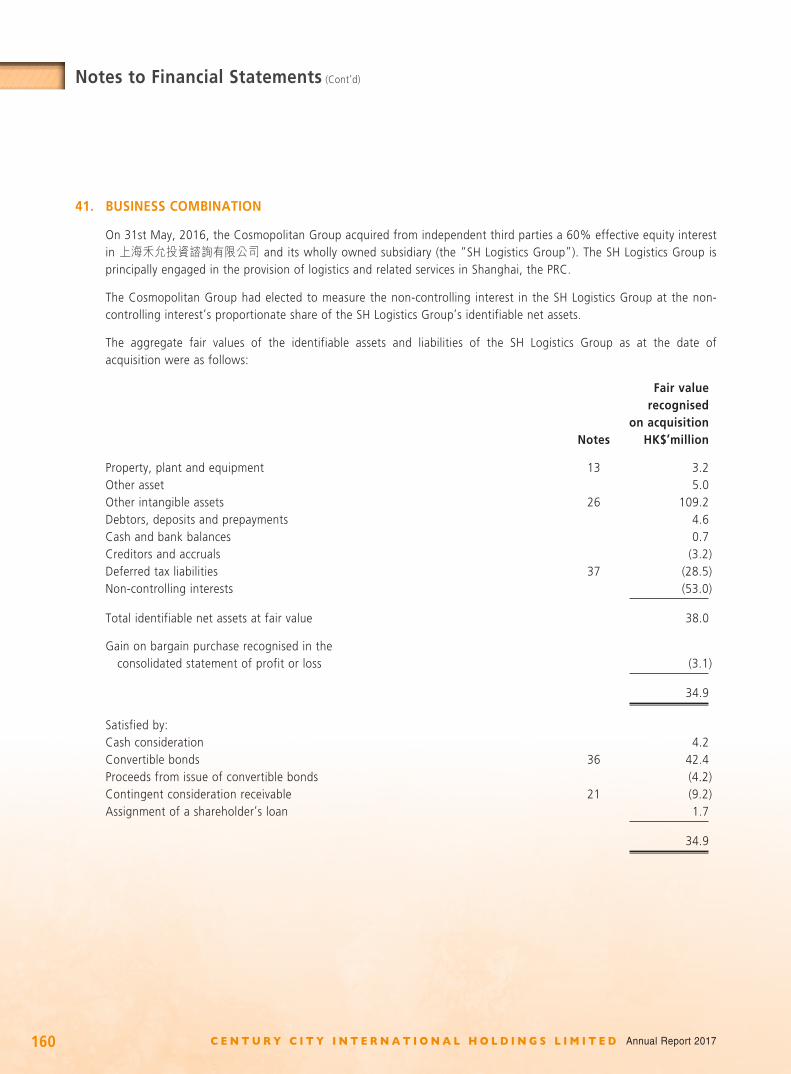
160
Notes to Financial Statements (Cont’d)
Annual Report 2017
41. BUSINESS COMBINATION
On 31st May, 2016, the Cosmopolitan Group acquired from independent third parties a 60% effective equity interest in 上海禾允投資諮詢有限公司 and its wholly owned subsidiary (the “SH Logistics Group”). The SH Logistics Group is principally engaged in the provision of logistics and related services in Shanghai, the PRC.
The Cosmopolitan Group had elected to measure the non-controlling interest in the SH Logistics Group at the non- controlling interest’s proportionate share of the SH Logistics Group’s identifiable net assets.
The aggregate fair values of the identifiable assets and liabilities of the SH Logistics Group as at the date of acquisition were as follows:
Fair valuerecognised
on acquisitionNotes HK$’million
Property, plant and equipment 13 3.2Other asset 5.0Other intangible assets 26 109.2Debtors, deposits and prepayments 4.6Cash and bank balances 0.7Creditors and accruals (3.2)Deferred tax liabilities 37 (28.5)Non-controlling interests (53.0)
Total identifiable net assets at fair value 38.0
Gain on bargain purchase recognised in the consolidated statement of profit or loss (3.1)
34.9
Satisfied by:Cash consideration 4.2Convertible bonds 36 42.4Proceeds from issue of convertible bonds (4.2)Contingent consideration receivable 21 (9.2)Assignment of a shareholder’s loan 1.7
34.9

161
Notes to Financial Statements (Cont’d)
Annual Report 2017
As the SH Logistics Group was acquired by the Cosmopolitan Group at a price below its independent market valuation, a gain on bargain purchase of HK$3.1 million was resulted and recognised in the consolidated statement of profit or loss for the year ended 31st December, 2016.
The Cosmopolitan Group issued convertible bonds - CB 2020A and CB 2020B as part of the considerations for the acquisition. Further details of CB 2020A and CB 2020B are set out in note 36 to the financial statements.
As part of the acquisition, the Cosmopolitan Group is entitled to a priority right to receive dividends up to an aggregate of RMB48.0 million (HK$53.4 million), before allocation of profits to the non-controlling interests, in relation to the profits generated by the SH Logistics Group. The initial amount of contingent consideration receivable recognised was HK$9.2 million, being the fair value of the priority right to receive dividends at the date of acquisition, which was determined using the discounted cash flow model.
The fair values (which were also the gross contractual amounts) of the trade debtors and other debtors as at the date of acquisition amounted to HK$3.6 million and HK$0.1 million, respectively, which were expected to be collectible.
The Cosmopolitan Group incurred transaction costs of HK$2.2 million for the acquisition. These transaction costs were expensed and included in administrative expenses in the consolidated statement of profit or loss.
An analysis of the cash flows in respect of the acquisition of the SH Logistics Group was as follows:
HK$’million
Cash consideration (4.2)Proceeds from issue of convertible bonds 4.2Cash and bank balances acquired 0.7
Net inflow of cash and cash equivalents included in cash flows from investing activities 0.7Transaction costs of the acquisition included in cash flows from operating activities (2.2)
(1.5)
Since the acquisition, the SH Logistics Group contributed approximately HK$13.9 million to the Group’s revenue and a loss of approximately HK$2.9 million was included in the consolidated profit for the year ended 31st December, 2016.
Had the combination taken place at the beginning of the year ended 31st December, 2016, the revenue and the profit of the Group for that year would have been HK$2,807.2 million and HK$238.5 million, respectively.
During the year, the Cosmopalitan Group disposed of its entire 60% effective equity interest in the SH Logistics Group, details of which are set out in note 43(c)(i) to the financial statements.

162
Notes to Financial Statements (Cont’d)
Annual Report 2017
42. PARTLY OWNED SUBSIDIARY WITH MATERIAL NON-CONTROLLING INTERESTS
Details of the Group’s subsidiary that has material non-controlling interests are set out below:
2017 2016
Percentage of equity interest held by non-controlling interests of PHL 37.7% 37.7%
2017 2016HK$’million HK$’million
Profit for the year allocated to non-controlling interests of the PHL Group 389.0 100.3
Dividends paid to non-controlling interests of the PHL Group 205.0 204.6
Accumulated balances of non-controlling interests of the PHL Group at the reporting date 11,400.0 11,348.0
The following table illustrates the summarised financial information of the PHL Group. The amounts disclosed are before any intra-group eliminations:
2017 2016HK$’million HK$’million
Revenue 3,588.6 2,771.8Profit for the year 718.1 235.4Total comprehensive income for the year 961.6 72.1
Non-current assets 29,729.3 25,861.3Current assets 15,903.1 15,653.7Current liabilities (9,950.7) (6,503.2)Non-current liabilities (13,978.9) (15,497.2)
Net cash flows from operating activities 40.8 1,233.2Net cash flows used in investing activities (2,790.9) (443.3)Net cash flows from financing activities 2,250.7 1,781.3
Net increase/(decrease) in cash and cash equivalents (499.4) 2,571.2
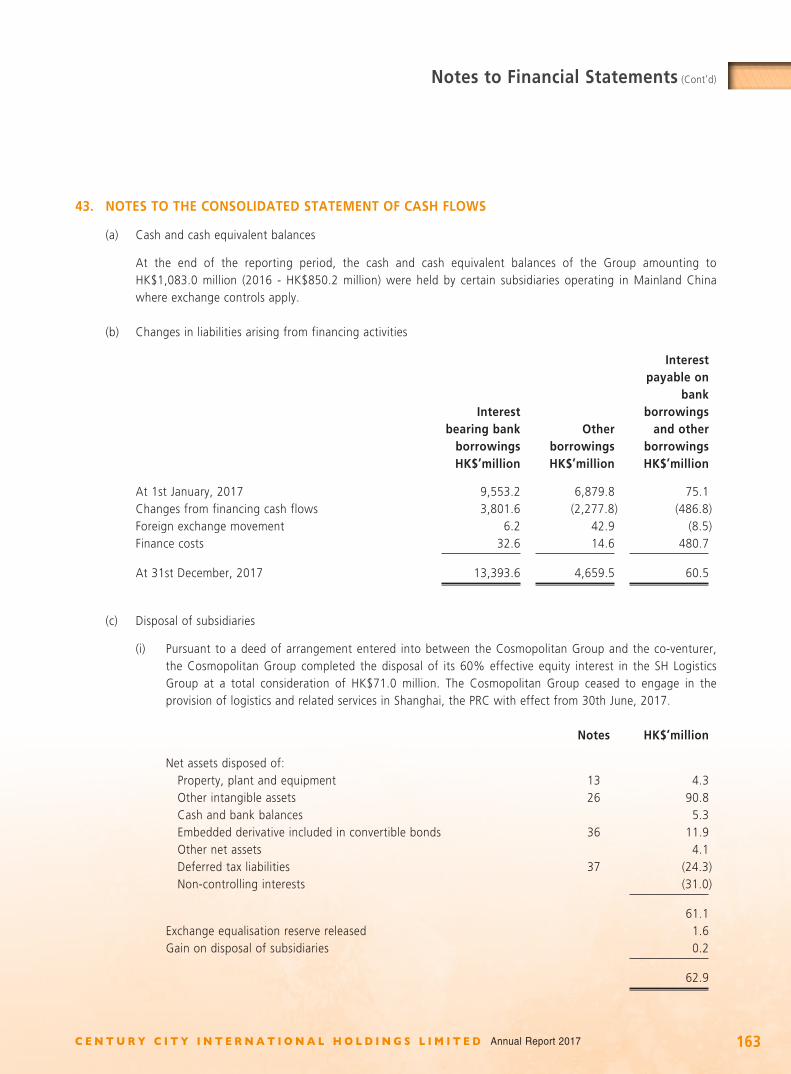
163
Notes to Financial Statements (Cont’d)
Annual Report 2017
43. NOTES TO THE CONSOLIDATED STATEMENT OF CASH FLOWS
(a) Cash and cash equivalent balances
At the end of the reporting period, the cash and cash equivalent balances of the Group amounting to HK$1,083.0 million (2016 - HK$850.2 million) were held by certain subsidiaries operating in Mainland China where exchange controls apply.
(b) Changes in liabilities arising from financing activities
Interestbearing bank
borrowingsOther
borrowings
Interest payable on
bank borrowings
and other borrowings
HK$’million HK$’million HK$’million
At 1st January, 2017 9,553.2 6,879.8 75.1Changes from financing cash flows 3,801.6 (2,277.8) (486.8)Foreign exchange movement 6.2 42.9 (8.5)Finance costs 32.6 14.6 480.7
At 31st December, 2017 13,393.6 4,659.5 60.5
(c) Disposal of subsidiaries
(i) Pursuant to a deed of arrangement entered into between the Cosmopolitan Group and the co-venturer, the Cosmopolitan Group completed the disposal of its 60% effective equity interest in the SH Logistics Group at a total consideration of HK$71.0 million. The Cosmopolitan Group ceased to engage in the provision of logistics and related services in Shanghai, the PRC with effect from 30th June, 2017.
Notes HK$’million
Net assets disposed of: Property, plant and equipment 13 4.3 Other intangible assets 26 90.8 Cash and bank balances 5.3 Embedded derivative included in convertible bonds 36 11.9 Other net assets 4.1 Deferred tax liabilities 37 (24.3) Non-controlling interests (31.0)
61.1
Exchange equalisation reserve released 1.6Gain on disposal of subsidiaries 0.2
62.9

164
Notes to Financial Statements (Cont’d)
Annual Report 2017
HK$’million
Satisfied by: Cash 71.0 Contingent consideration receivable (8.1)
62.9
An analysis of the net inflow of cash and cash equivalents in respect of the disposal of the SH Logistics Group is as follows:
HK$’million
Cash consideration 71.0Cash and bank balances disposed of (5.3)
Net inflow of cash and cash equivalents included in cash flows from investing activities 65.7
(ii) On 31st December, 2016, the Group disposed of 50% equity interest in the Prosper Harvest Group that beneficially holds a hotel development project for a consideration of HK$150.0 million (before net assets adjustment). Immediately after the disposal, the Group recognised the investment retained in the Prosper Harvest Group as a joint venture at its fair value at the date the control was lost and a gain on disposal of HK$403.0 million.
Note HK$’million
Net liabilities disposed of: Property under development 15 897.0 Deposits 1.3 Bank balances 0.1 Loan from the immediate holding company (1,000.0)
(101.6)
Fair value of retained investment (150.7)Gain on disposal of subsidiaries 403.0
150.7
Satisfied by: Cash* 150.7
* Cash consideration included net assets adjustment of HK$0.7 million.

165
Notes to Financial Statements (Cont’d)
Annual Report 2017
An analysis of the net inflow of cash and cash equivalents in respect of the disposal of subsidiaries was as follows:
HK$’million
Cash consideration 150.7Increase in debtors for unpaid cash consideration (50.7)Bank balances disposed of (0.1)
Net inflow of cash and cash equivalents in respect of the disposal of subsidiaries 99.9
(d) Major non-cash transactions
2017 2016HK$’million HK$’million
Security deposits, maintenance liabilities and other liabilities assumed in purchases of aircraft 29.5 –
Security deposits and maintenance liabilities settled upon disposals of aircraft 88.0 27.9
Finance lease receivables recognised upon the entering into of certain finance leases of aircraft – 87.8
Loan to a joint venture derecognised upon acquisition of 50% interest in the iclub Ma Tau Wai Hotel 1,000 –
44. CONNECTED AND RELATED PARTY TRANSACTIONS
(a) In addition to the transactions and balances set out elsewhere in the notes to the financial statements, the Group had the following material connected and related party transactions during the year:
2017 2016HK$’million HK$’million
An associate: Advertising and promotion fees (including cost reimbursements) (note) 7.7 10.2
Note:
The advertising and promotion fees paid to an associate comprised a retainer fee determined by reference to the estimated volume of advertising and promotional activities of the RHIHL Group and a standard fee based on total costs involved, in addition to which actual costs and out-of-pocket expenses incurred were reimbursed.
The Directors of the Company are of the opinion that the above transactions were entered into in the normal and usual course of business.

166
Notes to Financial Statements (Cont’d)
Annual Report 2017
(b) Outstanding balances with related parties:
2017 2016Notes HK$’million HK$’million
Loan to a joint venture (i) – 1,000.0Due from associates (ii) 128.5 106.8Due from a related company (iii) 1.2 1.2Due to a related company (iv) (4.3) (3.9)Due to an associate (iv) (1.2) (1.5)
Notes:
(i) The balance is included in “Investment in a joint venture” in note 16 to the financial statements.
(ii) The balance is included in “Investments in associates” in note 17 to the financial statements.
(iii) The amount is included in “Debtors, deposits and prepayments” in note 29 to the financial statements.
(iv) The amounts are included in “Creditors and accruals” in note 31 to the financial statements.
(c) Compensation of key management personnel of the Group:
2017 2016HK$’million HK$’million
Short term employee benefits 51.5 50.5Staff retirement scheme contributions 3.0 2.9
Total compensation paid to key management personnel 54.5 53.4
Further details of Directors’ emoluments are included in note 8 to the financial statements.
The related party transaction set out in note 44(a) above also constituted a continuing connected transaction as defined in Chapter 14A of the Listing Rules to the Company, but was/is exempted from relevant disclosures and other requirements, including, inter alia, independent shareholders’ approval in accordance with the Listing Rules pursuant to rule 14A.76(1)(a) of the Listing Rules.

167
Notes to Financial Statements (Cont’d)
Annual Report 2017
45. PLEDGE OF ASSETS
As at 31st December, 2017, certain of the Group’s property, plant and equipment, investment properties, properties held for sale, properties under development, available-for-sale investments, financial assets at fair value through profit or loss, held-to-maturity investments, time deposits and bank balances in the total amount of HK$27,144.0 million (2016 - HK$20,405.4 million) were pledged to secure general banking facilities granted to the Group as well as bank guarantees procured by the Group pursuant to certain lease guarantees in connection with the leasing of the hotel properties from Regal REIT. In addition, as at 31st December, 2017, certain ordinary shares in a listed subsidiary with a market value of HK$536.8 million (2016 - HK$370.7 million) were also pledged to secure general banking facilities granted to the Group.
46. CONTINGENT LIABILITIES
A subsidiary of the Cosmopolitan Group is currently a defendant in certain outstanding litigation claims relating to the re-forestation project located in Xinjiang in the PRC. Based on the advice from the Cosmopolitan Group’s legal counsel, the litigation claims are pending verification and/or the Cosmopolitan Group has good grounds of defence against the allegations. Accordingly, the Directors consider that it is appropriate to disclose such claims in an aggregate amount of approximately RMB8.2 million (HK$9.9 million) (2016 - RMB9.6 million (HK$10.6 million)) as contingent liabilities and no provision has been made in the financial statements.
In addition, at the end of the reporting period, the Cosmopolitan Group has provided guarantees to banks in connection with mortgage facilities granted to certain purchasers of it's properties amounting to approximately RMB356.0 million (HK$427.0 million) (2016 - RMB171.0 million (HK$190.1 million)). The Cosmopolitan Group’s guarantee period starts from the dates of grant of the relevant mortgage loans and ends upon the issuance of real estate ownership certificates and the completion of the proper procedures to register the mortgages under the names of the relevant purchasers, which will generally complete within one to two years after the purchasers take possession of the relevant properties.
47. OPERATING LEASE ARRANGEMENTS
(a) As lessor
The Group leases certain retail space and areas of its hotel properties, warehouse premises and aircraft under operating lease arrangements, with leases negotiated for terms ranging from 2 to 10 years. The terms of the leases generally also require the tenants to pay security deposits and, in certain cases, provide for periodic rent adjustments according to the terms under the leases.
The Group also leases certain of its investment properties under operating lease arrangements, with leases negotiated for terms ranging from 1 to 3 years. The terms of the leases generally also require the tenants to pay security deposits and, in certain cases, provide for periodic rent adjustments according to the terms under the leases.

168
Notes to Financial Statements (Cont’d)
Annual Report 2017
At 31st December, 2017, the Group had total future minimum lease receivables under non-cancellable operating leases with its tenants falling due as follows:
2017 2016HK$’million HK$’million
Within one year 87.3 80.2In the second to fifth years, inclusive 152.8 50.1After five years 9.6 6.6
249.7 136.9
(b) As lessee
The Group leases certain office, warehouse premises and shop units and office equipment under operating lease arrangements. Leases for properties are negotiated for terms ranging from 1 to 12 years. Leases for office equipment are negotiated for terms ranging from 1 to 5 years.
At 31st December, 2017, the Group had total future minimum lease payments under non-cancellable operating leases falling due as follows:
2017 2016HK$’million HK$’million
Land and buildings: Within one year 31.6 42.2 In the second to fifth years, inclusive 26.1 41.0 After five years – 0.1
57.7 83.3
Other equipment: Within one year 0.5 0.4 In the second to fifth years, inclusive 0.7 0.9
1.2 1.3
58.9 84.6
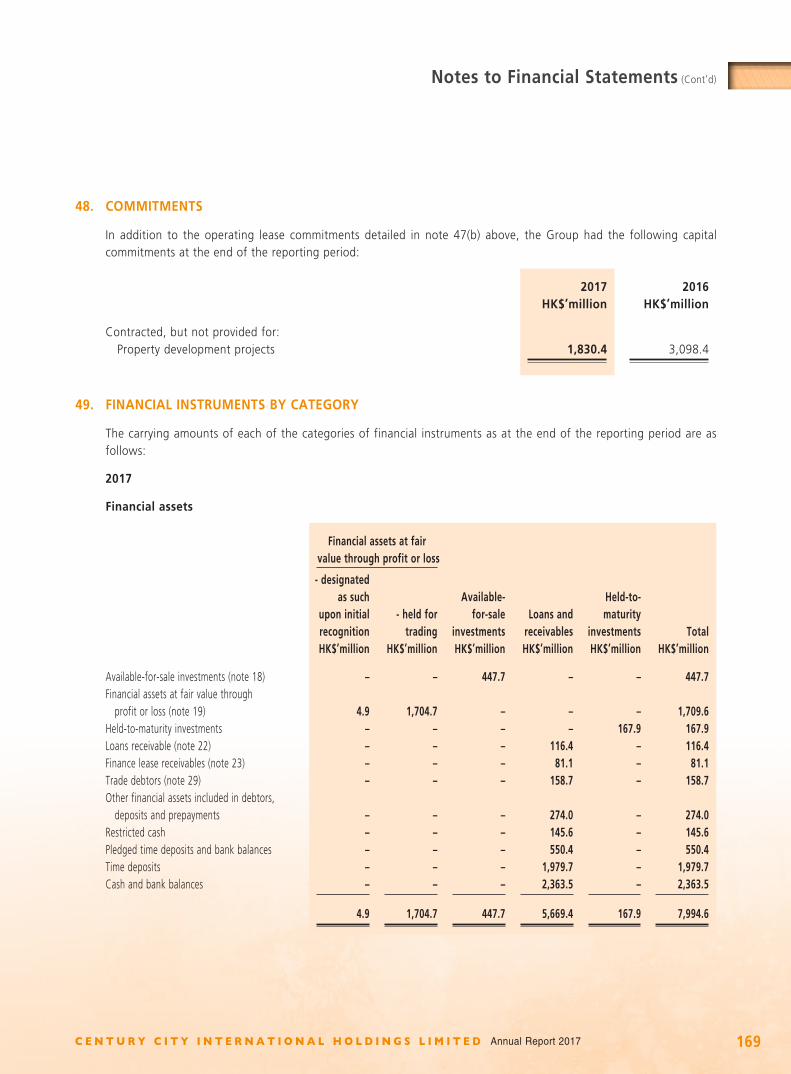
169
Notes to Financial Statements (Cont’d)
Annual Report 2017
48. COMMITMENTS
In addition to the operating lease commitments detailed in note 47(b) above, the Group had the following capital commitments at the end of the reporting period:
2017 2016HK$’million HK$’million
Contracted, but not provided for: Property development projects 1,830.4 3,098.4
49. FINANCIAL INSTRUMENTS BY CATEGORY
The carrying amounts of each of the categories of financial instruments as at the end of the reporting period are as follows:
2017
Financial assets
Financial assets at fair value through profit or loss - designated
as such Available- Held-to-upon initial - held for for-sale Loans and maturityrecognition trading investments receivables investments TotalHK$’million HK$’million HK$’million HK$’million HK$’million HK$’million
Available-for-sale investments (note 18) – – 447.7 – – 447.7Financial assets at fair value through profit or loss (note 19) 4.9 1,704.7 – – – 1,709.6Held-to-maturity investments – – – – 167.9 167.9Loans receivable (note 22) – – – 116.4 – 116.4Finance lease receivables (note 23) – – – 81.1 – 81.1Trade debtors (note 29) – – – 158.7 – 158.7Other financial assets included in debtors, deposits and prepayments – – – 274.0 – 274.0Restricted cash – – – 145.6 – 145.6Pledged time deposits and bank balances – – – 550.4 – 550.4Time deposits – – – 1,979.7 – 1,979.7Cash and bank balances – – – 2,363.5 – 2,363.5
4.9 1,704.7 447.7 5,669.4 167.9 7,994.6

170
Notes to Financial Statements (Cont’d)
Annual Report 2017
Financial liabilities
Financial liabilities
at fair value through
profit or lossFinancial
liabilities at- held for amortised
trading cost TotalHK$’million HK$’million HK$’million
Trade creditors (note 31) – 87.0 87.0Other financial liabilities included in – creditors and accruals – 877.4 877.4Deposits received – 69.9 69.9Derivative financial instruments (note 35) 3.0 – 3.0Interest bearing bank borrowings (note 33) – 13,393.6 13,393.6Other borrowings (note 34) – 4,659.5 4,659.5
3.0 19,087.4 19,090.4

171
Notes to Financial Statements (Cont’d)
Annual Report 2017
2016
Financial assets
Financial assets at fair value through profit or loss
- designatedas such - contingent Available- Held-to-
upon initial - held for consideration for-sale Loans and maturityrecognition trading receivable investments receivables investments TotalHK$’million HK$’million HK$’million HK$’million HK$’million HK$’million HK$’million
Available-for-sale investments (note 18) – – – 335.6 – – 335.6Financial assets at fair value through profit or loss (note 19) 7.2 963.0 – – – – 970.2Held-to-maturity investments – – – – – 466.7 466.7Derivative financial instruments (note 35) – 12.8 – – – – 12.8Contingent consideration receivable – – 10.3 – – – 10.3Loans receivable (note 22) – – – – 97.1 – 97.1Finance lease receivables (note 23) – – – – 126.9 – 126.9Trade debtors (note 29) – – – – 156.3 – 156.3Other financial assets included in debtors, deposits and prepayments – – – – 974.4 – 974.4Restricted cash – – – – 438.5 – 438.5Pledged time deposits and bank balances – – – – 265.1 – 265.1Time deposits – – – – 2,726.0 – 2,726.0Cash and bank balances – – – – 1,889.5 – 1,889.5
7.2 975.8 10.3 335.6 6,673.8 466.7 8,469.4

172
Notes to Financial Statements (Cont’d)
Annual Report 2017
Financial liabilities
Financial liabilities
at fair value through
profit or lossFinancial
liabilities at- held for amortised
trading cost TotalHK$’million HK$’million HK$’million
Trade creditors (note 31) – 93.8 93.8Other financial liabilities included in creditors and accruals – 754.1 754.1Deposits received – 82.7 82.7Derivative financial instruments (note 35) 5.7 – 5.7Interest bearing bank borrowings (note 33) – 9,553.2 9,553.2Other borrowings (note 34) – 6,879.8 6,879.8Convertible bonds (note 36) – 31.1 31.1
5.7 17,394.7 17,400.4
50. FAIR VALUE AND FAIR VALUE HIERARCHY OF FINANCIAL INSTRUMENTS
The carrying amounts of the Group’s financial assets and financial liabilities approximated to their fair values at the end of the reporting period.
The Group’s management is responsible for determining the policies and procedures for the fair value measurement of financial instruments. At each reporting date, management analyses the movements in the values of financial instruments and determines the major inputs applied in the valuation. Independent professional valuers are engaged for the valuation as appropriate. The valuation is reviewed and approved by management. The valuation process and results are discussed with the audit committee twice a year for interim and annual financial reporting.

173
Notes to Financial Statements (Cont’d)
Annual Report 2017
Fair value hierarchy
The following tables illustrate the fair value measurement hierarchy of the Group’s financial instruments:
Assets measured at fair value as at 31st December, 2017
Fair value measurement using Quoted prices Significant Significant
in active observable unobservablemarkets inputs inputs(Level 1) (Level 2) (Level 3) Total
HK$’million HK$’million HK$’million HK$’million
Available-for-sale investments: Unlisted equity investments – 2.6 364.6 367.2
Financial assets at fair value through profit or loss: Listed equity investments 586.1 16.3 – 602.4 Listed debt investments – 1,105.3 – 1,105.3 Structured deposit – 1.9 – 1.9
586.1 1,126.1 364.6 2,076.8
Assets measured at fair value as at 31st December, 2016
Fair value measurement using Quoted prices Significant Significant
in active observable unobservablemarkets inputs inputs(Level 1) (Level 2) (Level 3) Total
HK$’million HK$’million HK$’million HK$’million
Available-for-sale investments: Unlisted equity investments – 2.6 300.2 302.8
Financial assets at fair value through profit or loss: Listed equity investments 413.5 15.4 – 428.9 Listed debt investments – 539.4 – 539.4 Structured deposit – 1.9 – 1.9Contingent consideration receivable – – 10.3 10.3Derivative financial instruments – 12.8 – 12.8
413.5 572.1 310.5 1,296.1

174
Notes to Financial Statements (Cont’d)
Annual Report 2017
The movements in fair value measurements within Level 3 during the year are as follows:
2017 2016HK$’million HK$’million
Available-for-sale investments – unlisted:At 1st January 300.2 208.8Purchases 33.2 97.5Distributions (3.0) (2.3)Total gains/(losses) recognised in other comprehensive income/(loss) 34.2 (3.8)
At 31st December 364.6 300.2
2017 2016HK$’million HK$’million
Contingent consideration receivable:At 1st January 10.3 –Arising from acquisition of subsidiaries (note 41) – 9.2Fair value gain/(loss) recognised in profit or loss (2.2) 1.1Disposal of subsidiaries (note 43(c)(i)) (8.1) –
At 31st December – 10.3
Liabilities measured at fair value as at 31st December, 2017
Fair value measurement using Quoted prices Significant Significant
in active observable unobservablemarkets inputs inputs(Level 1) (Level 2) (Level 3) Total
HK$’million HK$’million HK$’million HK$’million
Derivative financial instruments – 3.0 – 3.0
Liabilities measured at fair value as at 31st December, 2016
Fair value measurement using Quoted prices Significant Significant
in active observable unobservablemarkets inputs inputs(Level 1) (Level 2) (Level 3) Total
HK$’million HK$’million HK$’million HK$’million
Derivative financial instruments – 5.7 – 5.7

175
Notes to Financial Statements (Cont’d)
Annual Report 2017
During the year, there were no transfers of fair value measurements between Level 1 and Level 2 and no transfers into or out of Level 3 for both financial assets and financial liabilities (2016 - Nil).
Valuation techniques
The fair values of certain listed equity investments are based on quoted market prices.
Certain unlisted equity investments are carried at net asset values provided by financial institutions or related administrators or valued by a financial institution based on quoted market price of the underlying listed security.
The fair values of the contingent consideration receivable and derivative financial instruments, including foreign currency forward contracts, are determined based on discounted cash flow models or market values provided by financial institutions.
The fair values of certain listed equity investments, listed debt investments and a structured deposit are determined based on market values provided by financial institutions.
51. FINANCIAL RISK MANAGEMENT OBJECTIVES AND POLICIES
The Group’s principal financial instruments, other than derivatives, comprise interest bearing bank borrowings, other borrowings, cash and short term deposits. The main purpose of these financial instruments is to finance the Group’s operations. The Group has various other financial assets and liabilities such as available-for-sale investments, financial assets at fair value through profit or loss, held-to-maturity investments, loans receivable, finance lease receivables, trade debtors and trade creditors, which arise directly from its operations.
The main risks arising from the Group’s financial instruments are interest rate risk, foreign currency risk, credit risk, liquidity risk and equity price risk. The Directors meet periodically to analyse and formulate measures to manage the Group’s exposure to these risks. Generally, the Group adopts prudent strategies on its risk management. The Directors review and agree policies for managing each of these risks and they are summarised below.
Interest rate risk
The Group’s exposure to interest rate risks relates primarily to the Group’s borrowings with floating interest rates. The interest rates and terms of repayment of the Group’s interest bearing bank borrowings are disclosed in note 33 to the financial statements. Interest rate risk is managed on an ongoing basis with the primary objective of limiting the extent to which net interest expense could be affected by adverse movements in interest rate.
For Hong Kong dollar borrowings, assuming the amount of bank borrowings outstanding at the end of the reporting period was outstanding for the whole year, a 100 basis point increase in interest rates would have decreased the Group’s profit before tax for the current year by HK$88.6 million (2016 - HK$67.1 million) and increased the finance costs capitalised by HK$41.4 million (2016 - HK$29.1 million). A 10 basis point decrease in interest rates would have increased the Group’s profit before tax for the current year by HK$8.9 million (2016 - HK$6.7 million) and decreased the finance costs capitalised by HK$4.1 million (2016 - HK$2.9 million).
The sensitivity to the interest rates used above is considered reasonable with the other variables held constant.

176
Notes to Financial Statements (Cont’d)
Annual Report 2017
Foreign currency risk
The Group’s operations are mainly in Hong Kong and Mainland China. Entities within the Group are exposed to foreign exchange risk from future commercial transactions and monetary assets and liabilities that are denominated in currencies that are not the entities’ functional currencies.
The Group currently does not have a foreign currency hedging policy. It manages its foreign currency risk by closely monitoring the movement of the foreign currency rates and entering into foreign currency forward contracts to reduce the exposure should the need arises.
Credit risk
The Group’s major exposure to the credit risk arises from the default of the trade debtors, with a maximum exposure equal to their carrying amounts. The Group only grants credit after making credit risk assessments. In addition, receivable balances are monitored on an ongoing basis and the Group’s exposure to bad debts is not significant.
The credit risk of the Group’s other financial assets, which comprise cash, bank balances and deposits, financial assets at fair value through profit or loss, available-for-sale investments, held-to-maturity investments, derivative financial instruments, loans receivable, finance lease receivables, contingent consideration receivable, and other financial assets included in debtors, deposits and prepayments, arises from default of the counterparty, with a maximum exposure equal to the carrying amounts of these instruments. The Group is also exposed to credit risk through the granting of guarantees to banks in connection with mortgage facilities for certain purchasers of the Group’s properties, further details of which are disclosed in note 46 to the financial statements.
There are no significant concentrations of credit risk within the Group as the customer bases of the Group’s trade debtors are widely dispersed in different sectors and industries.
Further quantitative data in respect of the Group’s exposure to credit risk arising from trade debtors are disclosed in note 29 to the financial statements.
Liquidity risk
The Group’s objective is to maintain a balance between continuity of funding and flexibility through the use of banking facilities. In the management of liquidity risk, the Group monitors and maintains a level of cash and cash equivalents deemed adequate by management to finance the Group’s operations and mitigate the effects of fluctuations in cash flows. The Group will raise funds from different sources, including through the financial market or realisation of its assets, if required.

177
Notes to Financial Statements (Cont’d)
Annual Report 2017
The maturity profile of the Group’s financial liabilities as at the end of the reporting period, based on the contractual undiscounted payments, is as follows:
2017Within
1 year or 1 to 5on demand years TotalHK$’million HK$’million HK$’million
Trade creditors 87.0 – 87.0Other financial liabilities included in creditors and accruals 825.0 52.4 877.4Deposits received 45.6 24.3 69.9Derivative financial instruments 3.0 – 3.0Interest bearing bank borrowings 4,597.4 9,607.0 14,204.4Other borrowings 2,030.8 3,052.5 5,083.3Guarantees given to banks in connection with mortgage facilities provided to certain purchasers of the Group‘s properties 427.0 – 427.0
8,015.8 12,736.2 20,752.0
2016Within
1 year or 1 to 5on demand years TotalHK$’million HK$’million HK$’million
Trade creditors 93.8 – 93.8Other financial liabilities included in creditors and accruals 606.7 147.3 754.0Deposits received 59.2 23.5 82.7Derivative financial instruments 5.7 – 5.7Interest bearing bank borrowings 1,172.0 9,059.9 10,231.9Other borrowings 2,478.4 5,098.1 7,576.5Convertible bonds – 57.1 57.1Guarantees given to banks in connection with mortgage facilities provided to certain purchasers of the Group‘s properties 190.1 – 190.1
4,605.9 14,385.9 18,991.8

178
Notes to Financial Statements (Cont’d)
Annual Report 2017
Equity price risk
Equity price risk is the risk that the fair values of equity securities decrease as a result of changes in the levels of equity indices and the value of individual securities. The Group is exposed to equity price risk arising from individual listed equity investments classified as financial assets at fair value through profit or loss (note 19) and unlisted equity investments classified as available-for-sale investments (note 18) at the end of the reporting period.
The following table demonstrates the sensitivity to a 5% change in the fair values of the equity investments that are carried at fair value, with all other variables held constant and before any impact on tax, based on their carrying amounts at the end of the reporting period. For the purpose of this analysis, for the available-for-sale investments, the impact is deemed to be on the available-for-sale investment revaluation reserve and no account is given for factors such as impairment which might impact on the statement of profit or loss.
Carryingamount of Change in
equity profit Changeinvestments before tax in equity*HK$’million HK$’million HK$’million
2017
Hong Kong listed investments: – At fair value through profit or loss 602.4 30.1 –Unlisted investments: – Available-for-sale 367.2 – 18.4
2016
Hong Kong listed investments: – At fair value through profit or loss 428.9 21.4 –Unlisted investments: – Available-for-sale 302.8 – 15.1
* Excluding retained profits
Capital management
The primary objectives of the Group’s capital management are to safeguard the Group’s ability to continue as a going concern and to maintain healthy capital ratios in order to support its business and enhance shareholders’ value.
The Group manages its capital structure and makes adjustments to it in light of changes in economic conditions and the risk characteristics of the underlying assets. Capital represents equity attributable to equity holders of the parent. To maintain or adjust the capital structure, the Group may adjust the dividend payment to shareholders, return capital to shareholders or issue new shares. The Group is not subject to any externally imposed capital requirements except for the obligation under the lease guarantees given by RHIHL in connection with the leasing of certain hotel properties from Regal REIT and the undertakings under a corporate guarantee given by PHL for banking facilities granted to certain subsidiaries to maintain a minimum consolidated tangible net worth of PHL, which has been complied with during the years. No changes were made in the objectives, policies or processes for managing capital during the years ended 31st December, 2017 and 31st December, 2016.

179
Notes to Financial Statements (Cont’d)
Annual Report 2017
The Group monitors capital using a debt to total assets ratio, which is net debt divided by the total assets. Net debt includes interest bearing bank borrowings, other borrowings and convertible bonds less cash, bank balances and deposits. The debt to total assets ratios as at the end of the reporting periods were as follows:
2017 2016HK$’million HK$’million
Interest bearing bank borrowings, other borrowings and convertible bonds 18,053.1 16,464.1Less: Cash, bank balances and deposits (5,039.2) (5,319.1)
Net debt 13,013.9 11,145.0
Total assets 46,100.5 41,982.1
Net debt to total assets ratio 28.2% 26.5%
52. EVENT AFTER THE REPORTING PERIOD
Subsequent to the end of the reporting period, Regal REIT group concluded in March 2018 a bilateral financing arrangement for a 5-year term loan in the principal amount of HK$3,000.0 million, which is principally secured by a mortgage over the Regal Kowloon Hotel. This term loan was arranged mainly for the purpose of financing the repayment of the two medium term notes due in March and May 2018, respectively. This new term loan facility bears a HIBOR-based interest margin and has a term of five years to March 2023. On 22nd March, 2018, Regal REIT group repaid the tranche of notes denominated in Hong Kong dollar, for a principal amount of HK$775.0 million.

180
Notes to Financial Statements (Cont’d)
Annual Report 2017
53. STATEMENT OF FINANCIAL POSITION OF THE COMPANY
Information about the statement of financial position of the Company at the end of the reporting period is as follows:
2017 2016HK$’million HK$’million
NON-CURRENT ASSETS
Investments in subsidiaries 5,785.1 5,855.0
CURRENT ASSETS
Deposits and prepayments 0.8 0.7
CURRENT LIABILITIES
Creditors and accruals (1.9) (2.1)
NET CURRENT LIABILITIES (1.1) (1.4)
Net assets 5,784.0 5,853.6
EQUITY
Issued capital 320.4 320.4 Reserves (note) 5,463.6 5,533.2
Total equity 5,784.0 5,853.6

181
Notes to Financial Statements (Cont’d)
Annual Report 2017
Note:
A summary of the Company’s reserves is as follows:
Share Capitalpremium Contributed redemption Retained
account surplus reserve profits TotalHK$’million HK$’million HK$’million HK$’million HK$’million
At 1st January, 2016 1,559.4 1,318.4 4.3 2,719.3 5,601.4
Loss for the year – – – (4.1) (4.1)Final 2015 dividend declared – – – (43.9) (43.9)Interim 2016 dividend – – – (20.2) (20.2)
At 31st December, 2016 and 1st January, 2017 1,559.4 1,318.4 4.3 2,651.1 5,533.2
Loss for the year – – – (4.9) (4.9)Final 2016 dividend declared – – – (43.9) (43.9)Interim 2017 dividend – – – (20.8) (20.8)
At 31st December, 2017 1,559.4 1,318.4 4.3 2,581.5 5,463.6
The contributed surplus represents reserves arising from (i) the group reorganisation in 1989, being the difference between the nominal value of the Company’s shares issued under the reorganisation scheme and the then consolidated net asset value of the acquired subsidiaries at the date of acquisition; and (ii) the Company’s capital reorganisation in 2004.
Under the Companies Act 1981 of Bermuda, the contributed surplus is distributable to shareholders under certain circumstances.
54. APPROVAL OF THE FINANCIAL STATEMENTS
The financial statements were approved and authorised for issue by the Board of Directors on 26th March, 2018.

182
Independent Auditor’s Report
Annual Report 2017
To the shareholders of Century City International Holdings Limited(Incorporated in Bermuda with limited liability)
Opinion
We have audited the consolidated financial statements of Century City International Holdings Limited (the “Company”) and its subsidiaries (the “Group”) set out on pages 66 to 181, which comprise the consolidated statement of financial position as at 31st December, 2017, and the consolidated statement of profit or loss, the consolidated statement of comprehensive income, the consolidated statement of changes in equity and the consolidated statement of cash flows for the year then ended, and notes to the consolidated financial statements, including a summary of significant accounting policies.
In our opinion, the consolidated financial statements give a true and fair view of the consolidated financial position of the Group as at 31st December, 2017, and of its consolidated financial performance and its consolidated cash flows for the year then ended in accordance with Hong Kong Financial Reporting Standards (“HKFRSs”) issued by the Hong Kong Institute of Certified Public Accountants (“HKICPA”) and have been properly prepared in compliance with the disclosure requirements of the Hong Kong Companies Ordinance.
Basis for opinion
We conducted our audit in accordance with Hong Kong Standards on Auditing (“HKSAs”) issued by the HKICPA. Our responsibilities under those standards are further described in the Auditor’s responsibilities for the audit of the consolidated financial statements section of our report. We are independent of the Group in accordance with the HKICPA’s Code of Ethics for Professional Accountants (the “Code”), and we have fulfilled our other ethical responsibilities in accordance with the Code. We believe that the audit evidence we have obtained is sufficient and appropriate to provide a basis for our opinion.
Key audit matters
Key audit matters are those matters that, in our professional judgement, were of most significance in our audit of the consolidated financial statements of the current period. These matters were addressed in the context of our audit of the consolidated financial statements as a whole, and in forming our opinion thereon, and we do not provide a separate opinion on these matters. For each matter below, our description of how our audit addressed the matter is provided in that context.
We have fulfilled the responsibilities described in the Auditor’s responsibilities for the audit of the consolidated financial statements section of our report, including in relation to these matters. Accordingly, our audit included the performance of procedures designed to respond to our assessment of the risks of material misstatement of the consolidated financial statements. The results of our audit procedures, including the procedures performed to address the matters below, provide the basis for our audit opinion on the accompanying consolidated financial statements.

183
Independent Auditor’s Report (Cont’d)
Annual Report 2017
Key audit matter How our audit addressed the key audit matter
Impairment assessment of goodwill and certain other non-financial assets
The Group holds several property development projects, hotel properties and aircraft in Hong Kong, Mainland China and overseas. As at 31st December, 2017, properties under development/construction and goodwill with an aggregate carrying amount of HK$12,954.2 million, hotel properties and trademark with an aggregate carrying amount of HK$18,939.3 million, and aircraft with a carrying amount of HK$207.0 mil l ion were al located to the “property development and investment” cash-generating unit, the “hotel operation and management and hotel ownership” cash-generating unit and the “aircraft ownership and leasing” cash-generating unit, respectively.
The impairment assessment of these non-financial assets is significant to our audit due to (i) the significance of the carrying amounts as at 31st December, 2017; and (ii) the determination of the recoverable amounts of the relevant cash-generating units is dependent on a range of estimates, such as estimated selling prices and development costs of the property development projects, estimated rental values, estimated room rates, estimated occupancy rates, estimated future cash flows, discount rates, interest rates, and estimated economic useful lives and residual values of aircraft.
The Group’s accounting pol ic ies and disc losures on impairment assessment of goodwill and certain other non-financial assets are included in notes 3, 13, 15, 24 and 25 to the consolidated financial statements.
With the assistance from our internal valuation specialists, we assessed the methodologies and assumptions adopted in the determination of the recoverable amounts of the cash-generating units (which is the higher of its fair value less costs of disposal and its value in use), using discounted cash flow projections prepared by management or valuations performed by external valuers. In addition, we assessed the independence, objectivity and competence of the external valuers.

184
Independent Auditor’s Report (Cont’d)
Annual Report 2017
Key audit matter How our audit addressed the key audit matter
Estimation of fair value of investment properties
The Group owns a portfolio of investment properties in Hong Kong and Spain measured at an aggregate fair value of HK$3,445.2 million as at 31st December, 2017.
The fair value estimation is significant to our audit due to (i) the significance of the carrying amount as at 31st December, 2017; and (ii) the inherently subjective valuation process involved, which is dependent on a number of estimates such as estimated selling prices and rental values of the properties, discount rates, capitalisation rates and interest rates.
The Group’s accounting policies and disclosures on the valuation of investment properties are disclosed in notes 3 and 14 to the consolidated financial statements.
Our internal valuation specialists assisted us in evaluating the valuation methodologies and assumptions, adopted by the external valuers, in the valuation of the investment properties. In addition, we benchmarked the fair values of investment properties to comparable market transactions. We have also assessed the independence, objectivity and competence of the external valuers.

185
Independent Auditor’s Report (Cont’d)
Annual Report 2017
Other information included in the Annual Report
The directors of the Company are responsible for the other information. The other information comprises the information included in the Annual Report, other than the consolidated financial statements and our auditor’s report thereon.
Our opinion on the consolidated financial statements does not cover the other information and we do not express any form of assurance conclusion thereon.
In connection with our audit of the consolidated financial statements, our responsibility is to read the other information and, in doing so, consider whether the other information is materially inconsistent with the consolidated financial statements or our knowledge obtained in the audit or otherwise appears to be materially misstated. If, based on the work we have performed, we conclude that there is a material misstatement of this other information, we are required to report that fact. We have nothing to report in this regard.
Responsibilities of the directors for the consolidated financial statements
The directors of the Company are responsible for the preparation of the consolidated financial statements that give a true and fair view in accordance with HKFRSs issued by the HKICPA and the disclosure requirements of the Hong Kong Companies Ordinance, and for such internal control as the directors determine is necessary to enable the preparation of consolidated financial statements that are free from material misstatement, whether due to fraud or error.
In preparing the consolidated financial statements, the directors of the Company are responsible for assessing the Group’s ability to continue as a going concern, disclosing, as applicable, matters related to going concern and using the going concern basis of accounting unless the directors of the Company either intend to liquidate the Group or to cease operations or have no realistic alternative but to do so.
The directors of the Company are assisted by the Audit Committee in discharging their responsibilities for overseeing the Group’s financial reporting process.
Auditor’s responsibilities for the audit of the consolidated financial statements
Our objectives are to obtain reasonable assurance about whether the consolidated financial statements as a whole are free from material misstatement, whether due to fraud or error, and to issue an auditor’s report that includes our opinion. Our report is made solely to you, as a body, in accordance with section 90 of the Bermuda Companies Act 1981, and for no other purpose. We do not assume responsibility towards or accept liability to any other person for the contents of this report.
Reasonable assurance is a high level of assurance, but is not a guarantee that an audit conducted in accordance with HKSAs will always detect a material misstatement when it exists. Misstatements can arise from fraud or error and are considered material if, individually or in the aggregate, they could reasonably be expected to influence the economic decisions of users taken on the basis of these consolidated financial statements.
As part of an audit in accordance with HKSAs, we exercise professional judgement and maintain professional scepticism throughout the audit. We also:
‧ Identify and assess the risks of material misstatement of the consolidated financial statements, whether due to fraud or error, design and perform audit procedures responsive to those risks, and obtain audit evidence that is sufficient and appropriate to provide a basis for our opinion. The risk of not detecting a material misstatement resulting from fraud is higher than for one resulting from error, as fraud may involve collusion, forgery, intentional omissions, misrepresentations, or the override of internal control.
186
Independent Auditor’s Report (Cont’d)
Annual Report 2017
‧ Obtain an understanding of internal control relevant to the audit in order to design audit procedures that are appropriate in the circumstances, but not for the purpose of expressing an opinion on the effectiveness of the Group’s internal control.
‧ Evaluate the appropriateness of accounting policies used and the reasonableness of accounting estimates and related disclosures made by the directors.
‧ Conclude on the appropriateness of the directors’ use of the going concern basis of accounting and, based on the audit evidence obtained, whether a material uncertainty exists related to events or conditions that may cast significant doubt on the Group’s ability to continue as a going concern. If we conclude that a material uncertainty exists, we are required to draw attention in our auditor’s report to the related disclosures in the consolidated financial statements or, if such disclosures are inadequate, to modify our opinion. Our conclusions are based on the audit evidence obtained up to the date of our auditor’s report. However, future events or conditions may cause the Group to cease to continue as a going concern.
‧ Evaluate the overall presentation, structure and content of the consolidated financial statements, including the disclosures, and whether the consolidated financial statements represent the underlying transactions and events in a manner that achieves fair presentation.
‧ Obtain sufficient appropriate audit evidence regarding the financial information of the entities or business activities within the Group to express an opinion on the consolidated financial statements. We are responsible for the direction, supervision and performance of the group audit. We remain solely responsible for our audit opinion.
We communicate with the Audit Committee regarding, among other matters, the planned scope and timing of the audit and significant audit findings, including any significant deficiencies in internal control that we identify during our audit.
We also provide the Audit Committee with a statement that we have complied with relevant ethical requirements regarding independence and to communicate with them all relationships and other matters that may reasonably be thought to bear on our independence, and where applicable, related safeguards.
From the matters communicated with the Audit Committee, we determine those matters that were of most significance in the audit of the consolidated financial statements of the current period and are therefore the key audit matters. We describe these matters in our auditor’s report unless law or regulation precludes public disclosure about the matter or when, in extremely rare circumstances, we determine that a matter should not be communicated in our report because the adverse consequences of doing so would reasonably be expected to outweigh the public interest benefits of such communication.
The engagement partner on the audit resulting in this independent auditor’s report is Yen Kai Shun, Catherine.
Ernst & YoungCertified Public Accountants
22/F, CITIC Tower 1 Tim Mei AvenueCentral, Hong Kong
26th March, 2018

187
Schedule of Principal Properties
Annual Report 2017
As at 31st December, 2017
PROPERTIES FOR DEVELOPMENT AND/OR SALE
Description Use Approx. area
Stage of completion (completion date of development project)
Percentage of interest
attributableto the
Company
(1) Nos.5-7 Bonham Strand Westand Nos.169-171Wing Lok Street,Sheung Wan,Hong Kong
Hotel Site area -approx. 345 sq. m.(3,710 sq. ft.)
Gross floor area -approx. 5,236 sq. m.(56,360 sq. ft.) andcovered floor area -approx. 6,420 sq. m.(69,120 sq. ft.)(98 guestroomsand suites)
Superstructure worksin progress
(expected to be completed in 2019)
52.4
(2) Domus and Casa RegaliaNos.65-89 Tan KwaiTsuen Road,Yuen Long,New Territories,Hong Kong
Residential Site area for the wholedevelopment atNos.65-89 Tan KwaiTsuen Road -approx. 11,192 sq. m.(120,470 sq. ft.)
Gross floor area -approx. 6,268 sq. m.(67,471 sq. ft.)(1 unit and 25 houses)
Occupation permitissued inNovember 2015
Certificate ofcomplianceobtained inApril 2016
52.4
(3) Sha Tin Town Lot No.578,Area 56A,Kau To,Sha Tin,New Territories,Hong Kong
Residential Site area -approx. 17,476 sq. m.(188,100 sq. ft.)
Gross floor area -approx. 32,474 sq. m.(349,547 sq. ft.)(approx. 136 units,24 houses and197 carparking spaces)
Superstructure worksin progress
(expected to becompleted in 2018)
52.4

188
Schedule of Principal Properties(Cont’d)
Annual Report 2017
As at 31st December, 2017
Description Use Approx. area
Stage of completion (completion date of development project)
Percentage of interest
attributableto the
Company
(4) The AscentNo.83 Shun Ning Road,Sham Shui Po,Kowloon,Hong Kong
Commercial/residential
Site area -approx. 824.9 sq. m.(8,879 sq. ft.)
Gross floor area -approx. 7,159 sq. m.(77,059 sq. ft.)(157 residential units,2 storeys of shopsand 1 storey ofbasement carpark)
Occupation permit issued in March 2018
52.4
(5) iclub Mong Kok HotelKowloon Inland Lot No.11234Junction of Anchor Street andFuk Tsun Street,Tai Kok Tsui,Kowloon,Hong Kong
Hotel Site area -approx. 725.5 sq. m.(7,809 sq. ft.)
Gross floor area -approx. 6,529 sq. m.(70,278 sq. ft.) andcovered floor area -approx. 9,355 sq. m.(100,697 sq. ft.)(288 guestrooms)
Superstructureworks nearingcompletion
(scheduled to becompleted in 3rd quarter of 2018)
52.4
(6) Certain apartment units andcar and motorcycleparking spaces atLarvotto,8 Praya Road,Ap Lei Chau,Hong Kong
Primarilyresidential
Site area for wholedevelopment -approx. 16,770 sq. m.(180,511 sq. ft.)
Gross floor area of12 remainingapartment units held -approx. 1,460 sq. m.(15,715 sq. ft.)
Completed inMarch 2011
18.7

189
Schedule of Principal Properties (Cont’d)
Annual Report 2017
As at 31st December, 2017
Description Use Approx. area
Stage of completion (completion date of development project)
Percentage of interest
attributableto the
Company
(7) Certain luxury residentialhouses at Regalia Bay,88 Wong Ma Kok Road,Stanley,Hong Kong
Residential Site area for thewhole development -approx. 53,126 sq. m.(571,848 sq. ft.)
Gross areaof 3 remaininghouses held -approx. 1,433 sq. m.(15,420 sq. ft.)
Completed inMarch 2004
42.6
(8) Site A1a of SKYCITY(Chek Lap Kok Lot No.3)Hong Kong International Airport,Chek Lap Kok,New Territories,Hong Kong
Hotel Site area -approx. 6,650 sq. m.(71,580 sq. ft.)
Gross floor area - approx. 33,700 sq. m.(362,750 sq. ft.)(1,203 guestrooms)
Foundation works commenced
(expected to be completed in 2020)
42.6
(9) Certain properties at Nos.150-158 and 160-162 Queen’s Road West, Hong Kong
Commercial/residential
Site area -approx. 667 sq. m.(7,190 sq. ft.)
Planning for redevelopment atthe combined site
42.6

190
Schedule of Principal Properties(Cont’d)
Annual Report 2017
As at 31st December, 2017
Description Use Approx. area
Stage of completion (completion date of development project)
Percentage of interest
attributableto the
Company
(10) Development site atsouth of Xindu MainRoad and both sides ofXingle Road,Banqiao Village,Xindu County,Xindu District,Chengdu,Sichuan Province, PRC
Hotel/officeandcommercialcomplex/residential
Site area forthe wholedevelopment -approx. 111,869 sq. m.(1,204,148 sq. ft.)
Total gross floorarea - approx.497,000 sq. m.(5,350,000 sq. ft.)
First stage‧ a 317-room hotel‧ 3 residential towers having 339 residential units with car parking spaces and ancillary commercial accommodation (Total gross floor area - approx. 45,500 sq. m. (490,000 sq. ft.))
Stage two‧ 6 residential towers having 957 units with total gross floor area of approx. 94,500 sq. m. (1,017,200 sq. ft.)
Stage three‧ commercial and office accommodations with total gross floor area of approx. 140,798 sq. m. (1,515,600 sq. ft.)
‧ 10 residential towers having 1,555 units with total gross floor area
of approx. 175,540 sq. m. (1,889,500 sq. ft.)
First stage‧ Construction works for 3 residential towers completed in 4th quarter of 2017
‧ Hotel portion scheduled to be opened in phases from early 2019
Stage two‧ Construction works for 6 residential towers completed in 4th quarter of 2017
Stage three‧ Planning approval of
commercial and office accommodations obtained and construction works expected to commence in early 2019
(expected to be completed in 2022)
‧ Planning approval of 10 residential towers obtained and construction works scheduled to commence shortly (expected to be completed in 2021)
42.8

191
Schedule of Principal Properties (Cont’d)
Annual Report 2017
As at 31st December, 2017
Description Use Approx. area
Stage of completion (completion date of development project)
Percentage of interest
attributableto the
Company
(11) Development site atthe intersection betweenWeiguo Road and Xinkai Road,Hedong District,Tianjin, PRC
Commercial/office/residential
Site area for the wholedevelopment - approx. 31,700 sq. m.(341,000 sq. ft.)
Total gross floor area - approx. 145,000 sq. m.(1,561,000 sq. ft.)
Residential towers,commercial complex andresidential car parkingspaces completed in1st quarter of 2018
Superstructure worksof two office towersto be resumed
42.8

192
Schedule of Principal Properties(Cont’d)
Annual Report 2017
As at 31st December, 2017
PROPERTIES FOR INVESTMENT
Description Use Lease
Percentageof interest
attributableto the
Company
(1) 11 luxury residentialhouses at Regalia Bay,88 Wong Ma Kok Road,Stanley,Hong Kong
Residential Medium term 42.6
(2) Regal Airport Hotel9 Cheong Tat Road,Hong Kong International Airport,Chek Lap Kok,New Territories,Hong Kong
Hotel Medium term 31.8
(3) Regal Hongkong Hotel88 Yee Wo Street,Causeway Bay,Hong Kong
Hotel Long term 31.8
(4) Regal Kowloon Hotel71 Mody Road,Tsimshatsui,Kowloon,Hong Kong
Hotel Long term 31.8
(5) Regal Oriental Hotel30-38 Sa Po Road andShops 3-11 on G/Fincluding Cockloft of Shops 5-7and the whole of 1/F,Po Sing Court,21-25 Shek Ku Lung Road,40-42 Sa Po Road and15-29 Carpenter Road,Kowloon City,Kowloon,Hong Kong
Hotel Medium term 31.8
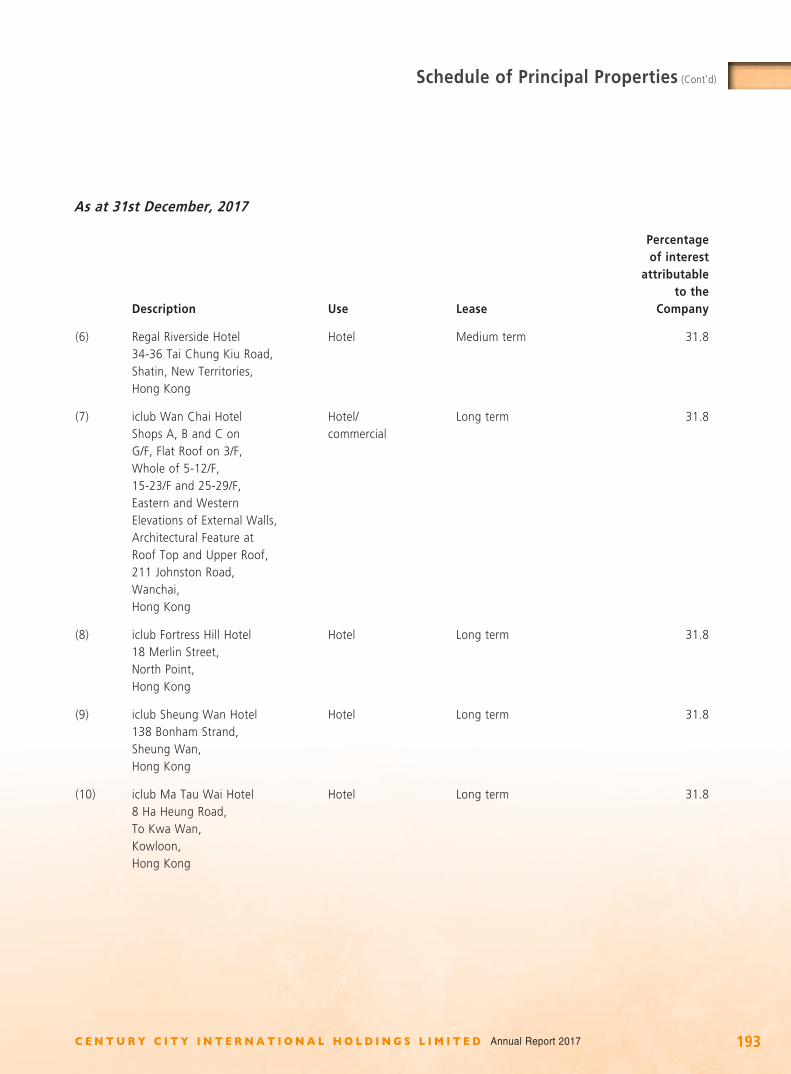
193
Schedule of Principal Properties (Cont’d)
Annual Report 2017
As at 31st December, 2017
Description Use Lease
Percentageof interest
attributableto the
Company
(6) Regal Riverside Hotel34-36 Tai Chung Kiu Road,Shatin, New Territories,Hong Kong
Hotel Medium term 31.8
(7) iclub Wan Chai HotelShops A, B and C onG/F, Flat Roof on 3/F,Whole of 5-12/F,15-23/F and 25-29/F,Eastern and WesternElevations of External Walls,Architectural Feature atRoof Top and Upper Roof,211 Johnston Road,Wanchai,Hong Kong
Hotel/commercial
Long term 31.8
(8) iclub Fortress Hill Hotel18 Merlin Street,North Point,Hong Kong
Hotel Long term 31.8
(9) iclub Sheung Wan Hotel138 Bonham Strand,Sheung Wan,Hong Kong
Hotel Long term 31.8
(10) iclub Ma Tau Wai Hotel8 Ha Heung Road,To Kwa Wan,Kowloon,Hong Kong
Hotel Long term 31.8

194
Schedule of Principal Properties(Cont’d)
Annual Report 2017
Description Use Lease
Percentageof interest
attributableto the
Company
(11) Campus La Mola (formerly known asLa Mola Hotel & Conference Centre),Cami dels Plans de Can Bonvilar s/n,08227 - Terrassa,Barcelona,Spain
Hotel Freehold land 42.6
(12) We Go MALLNo.16 Po Tai Street,Ma On Shan,Sha Tin,New Territories,Hong Kong
Commercial Medium 52.4

195
Published Five Year Financial Summary
Annual Report 2017
A summary of the results and of the assets, liabilities, perpetual securities and non-controlling interests of the Group for the last five financial years, as extracted from the published audited financial statements, is set out below.
RESULTS
Year ended 31st December,
2017 2016 2015 2014 2013HK$’million HK$’million HK$’million HK$’million HK$’million
Revenue 3,620.8 2,804.3 2,934.0 2,330.4 3,630.5
Operating profit 1,212.2 566.4 291.2 676.0 755.3Finance costs (309.4) (310.1) (229.4) (236.0) (260.5)Share of profits and losses of: Joint ventures – – – – 0.3 Associates (32.7) (14.1) (24.8) (22.0) 40.2
Profit before tax 870.1 242.2 37.0 418.0 535.3Income tax (91.5) (4.1) (16.1) 18.7 (84.9)
Profit for the year before allocation between equity holders of the parent and non-controlling interests 778.6 238.1 20.9 436.7 450.4
Attributable to: Equity holders of the parent 381.2 136.2 4.6 196.6 202.0 Non-controlling interests 397.4 101.9 16.3 240.1 248.4
778.6 238.1 20.9 436.7 450.4

196
Published Five Year Financial Summary (Cont’d)
Annual Report 2017
ASSETS, LIABILITIES, PERPETUAL SECURITIES AND NON-CONTROLLING INTERESTS
31st December,
2017 2016 2015 2014 2013HK$’million HK$’million HK$’million HK$’million HK$’million
Property, plant and equipment 22,676.2 19,517.4 20,091.4 19,793.9 19,459.0Investment properties 3,445.2 2,395.3 2,101.3 1,946.6 1,715.4Properties under development 2,075.3 1,293.0 1,297.3 1,305.1 1,308.6Investment in a joint venture – 1,150.7 – – –Investments in associates 24.5 35.3 23.3 29.9 32.8Available-for-sale investments 447.7 335.6 215.3 159.6 38.1Financial asset at fair value through profit or loss 1.9 1.9 1.9 1.9 10.2Contingent consideration receivable – 10.3 – – –Loans receivable 111.9 93.4 9.4 1.7 8.4Finance lease receivables 35.1 81.9 – – –Debtors, deposits and prepayments 101.4 80.3 81.2 89.4 64.8Deferred tax assets 51.7 94.0 79.1 62.4 –Other assets 0.2 5.2 0.2 0.2 0.2Goodwill 261.0 261.0 261.0 261.0 261.0Trademark 610.2 610.2 610.2 610.2 610.2Other intangible assets – 97.1 – – –Current assets 16,258.2 15,919.5 12,967.2 13,129.9 11,907.7
Total assets 46,100.5 41,982.1 37,738.8 37,391.8 35,416.4
Current liabilities (9,971.3) (6,516.5) (2,605.9) (2,203.6) (2,283.5)Creditors and deposits received (76.7) (170.8) (177.2) (62.9) (45.0)Interest bearing bank borrowings (9,142.0) (8,560.4) (8,247.6) (7,770.8) (5,599.8)Other borrowings (2,713.7) (4,621.3) (4,218.7) (4,211.2) (4,200.5)Derivative financial instruments – – – – (4.1)Convertible bonds – (31.1) – – –Deferred tax liabilities (2,048.5) (2,169.9) (2,231.2) (2,296.2) (2,322.4)
Total liabilities (23,952.2) (22,070.0) (17,480.6) (16,544.7) (14,455.3)
Perpetual securities (1,732.9) – – – –
Non-controlling interests (11,400.1) (11,354.6) (11,756.7) (12,327.1) (13,036.7)