TECTONICS, VOL. 19, NO. 1, PAGES 1-24 FEBRUARY 2000 Present-day motion of the Sierra Nevada block and sometectonic implications for the Basin and Range province, North American Cordillera Timothy H. Dixon, • Meghan Miller, 2 Frederic Farina, • Hongzhi Wang • and Daniel Johnson 2 Abstract. Global Positioning System (GPS) data from five sites on the stable interior of the Sierra Nevada block are inverted to describe its angular velocity relative to stable North America. The velocity data for the five sites fit the rigid block model with rms misfits of 0.3 mm/yr (north)and 0.8 mm/yr (east), smaller than independently estimated data uncertainty, indicatingthat the rigid block model is appropriate. The new Euler vector, 17.0øN, 137.3øW, rotation rate 0.28 degrees per million years, predicts that the block is translating to the northwest, nearly parallel to the plate motion direction, at 13-14 mm/yr,faster thanprevious estimates. Using the predicted Sierra Nevada block velocity as a kinematic boundary conditionand GPS, VLBI and other data from the interior and margins of the Basin and Range, we estimate the velocitiesof some major boundaryzone faults. For a transect approximatelyperpendicular to plate motion through northern Owens Valley, the eastern California shear zone(westem boundary of the Basin and Rangeprovince) accommodates 11+1 mm/yr of right-lateral shearprimarily on two faults, the Owens Valley-White Mountain (3+2 mm/yr) and Fish Lake Valley (8+2 mm/yr) fault zones, based on a viscoelastic coupling model that accounts for the effects of the 1872 Owens Valley earthquake and the rheology of the lower crust. Together these two faults, separated by less than 50 km on this transect,define a region of high surface velocity gradienton the eastern boundary of the Sierra Nevada block. The Wasatch Fault zone accommodates less than 3+1 mm/yr of east-west extension on the eastern boundary of the Basin and Range province. Remainingdeformation within the Basin and Range interioris alsoprobably less than3 mm/yr. 1. Introduction Plate boundaries within continents are often characterized by diffuse zones of deformation, quite distinct from the narrow plate boundaries that characterize oceanic lithosphere anddefine large rigid plates. However, at least • Rosenstiel School of Marine and Atmospheric Science, University of Miami, Miami, Florida. 2 Department of Geology, Central Washington University, Ellensburg, Washington. Copyright 2000 by the American Geophysical Union. Paper number 1998TC001088. 0278-7407/00/1998TC001088512.00 some continental areasappearto behave like oceanic lithosphere in one important respect:deformation is occasionally concentrated in narrow fault zones that accommodate relative motion between rigid blocks. The Sierra Nevada block in the western United States is probably a goodexample of a rigid continental block [Wright, 1976]. Seismicity around its margins delineates an aseismic region east of the SanAndreas faultand west of the Basin and Rangeextensional province (Figure 1). However, a rigorous testof the rigidity of this blockhas never been performed (nor, to ourknowledge, for anyother continental block or microplate). Perhaps the Sierra Nevadablock is not rigid at all, and the absence of seismicity indicates a weak block undergoing diffuse aseismic deformation, or strain accumulationon a few locked faults cutting the block, previouslyassumed inactive or activeat low strain rates (e.g., the Kern Canyon fault), to bereleased in future large earthquakes. Space geodesy can rigorously testthe concept of rigid continental blocks, just as it can measure the angular velocity andtestthe rigidityof larger plates [Argus and Gordon,1996; Dixon et al., 1996]. Since the motions of rigid blocks orplates ona sphere can be described by Euler (angular velocity) vectors [e.g.,Chase, 1978; Minster and Jordan, 1978; DeMetset al., 1990], we can test whether velocity data fromsites on a continental block are well fit by a given Euler vector, and whether velocity predictions onthemargins of the block based on this Eulervector are consistent with other observations. An accurate estimate of Sierra Nevada block motion also holds the key to understanding certain aspects of Pacific-North American plate interaction [e.g., Atwater, 1970;1989; Dixon et al., 1995; Wells et al., 1998; Hearn andHumphreys, 1998]. Minsterand Jordan [1987] first appliedspace geodetic data to estimate motion of the Sierra Nevada block, defining northwest motionof the blockat a velocityof -10+2 mm/yr. Argus and Gordon [1991] estimated an Euler vector for the block, defining counterclockwise rotation of the block abouta pole located closeto and southwest of the block, and northwestto north-northwest motion of the blockat 9-11 mm/yr, depending on location. Both of these pioneering studies used very long baseline interferometry (VLBI) data from a few sites near the deforming eastern margin of the block. The small number of sites available at the time precluded a test of the rigid block hypothesis, while the site locations limited the accuracy of the relative motion estimates for the Sierra Nevada block, since they are not actually located on the stable block(Figure 1). New Global Positioning System (GPS)data fromsites onthe stable interior andmargins of the block are now available, enablingus to perform a
Transcript
TECTONICS, VOL. 19, NO. 1, PAGES 1-24 FEBRUARY 2000
Present-day motion of the Sierra Nevada block and some tectonic implications for the Basin and Range province, North American Cordillera
Timothy H. Dixon, • Meghan Miller, 2 Frederic Farina, • Hongzhi Wang • and Daniel Johnson 2
Abstract. Global Positioning System (GPS) data from five sites on the stable interior of the Sierra Nevada block
are inverted to describe its angular velocity relative to stable North America. The velocity data for the five sites fit the rigid block model with rms misfits of 0.3 mm/yr (north) and 0.8 mm/yr (east), smaller than independently estimated data uncertainty, indicating that the rigid block model is appropriate. The new Euler vector, 17.0øN, 137.3øW, rotation rate 0.28 degrees per million years, predicts that the block is translating to the northwest, nearly parallel to the plate motion direction, at 13-14 mm/yr, faster than previous estimates. Using the predicted Sierra Nevada block velocity as a kinematic boundary condition and GPS, VLBI and other data from the interior and margins of the Basin and Range, we estimate the velocities of some major boundary zone faults. For a transect approximately perpendicular to plate motion through northern Owens Valley, the eastern California shear zone (westem boundary of the Basin and Range province) accommodates 11+1 mm/yr of right-lateral shear primarily on two faults, the Owens Valley-White Mountain (3+2 mm/yr) and Fish Lake Valley (8+2 mm/yr) fault zones, based on a viscoelastic coupling model that accounts for the effects of the 1872 Owens Valley earthquake and the rheology of the lower crust. Together these two faults, separated by less than 50 km on this transect, define a region of high surface velocity gradient on the eastern boundary of the Sierra Nevada block. The Wasatch Fault zone accommodates less than 3+1 mm/yr of east-west extension on the eastern boundary of the Basin and Range province. Remaining deformation within the Basin and Range interior is also probably less than 3 mm/yr.
1. Introduction
Plate boundaries within continents are often
characterized by diffuse zones of deformation, quite distinct from the narrow plate boundaries that characterize oceanic lithosphere and define large rigid plates. However, at least
• Rosenstiel School of Marine and Atmospheric Science, University of Miami, Miami, Florida. 2
Department of Geology, Central Washington University, Ellensburg, Washington.
Copyright 2000 by the American Geophysical Union.
Paper number 1998TC001088. 0278-7407/00/1998TC001088512.00
some continental areas appear to behave like oceanic lithosphere in one important respect: deformation is occasionally concentrated in narrow fault zones that accommodate relative motion between rigid blocks. The Sierra Nevada block in the western United States is
probably a good example of a rigid continental block [Wright, 1976]. Seismicity around its margins delineates an aseismic region east of the San Andreas fault and west of the Basin and Range extensional province (Figure 1). However, a rigorous test of the rigidity of this block has never been performed (nor, to our knowledge, for any other continental block or microplate). Perhaps the Sierra Nevada block is not rigid at all, and the absence of seismicity indicates a weak block undergoing diffuse aseismic deformation, or strain accumulation on a few locked faults cutting the block, previously assumed inactive or active at low strain rates (e.g., the Kern Canyon fault), to be released in future large earthquakes.
Space geodesy can rigorously test the concept of rigid continental blocks, just as it can measure the angular velocity and test the rigidity of larger plates [Argus and Gordon, 1996; Dixon et al., 1996]. Since the motions of rigid blocks or plates on a sphere can be described by Euler (angular velocity) vectors [e.g., Chase, 1978; Minster and Jordan, 1978; DeMets et al., 1990], we can test whether velocity data from sites on a continental block are well fit by a given Euler vector, and whether velocity predictions on the margins of the block based on this Euler vector are consistent with other observations. An accurate estimate of Sierra Nevada block motion also holds the key to understanding certain aspects of Pacific-North American plate interaction [e.g., Atwater, 1970; 1989; Dixon et al., 1995; Wells et al., 1998; Hearn and Humphreys, 1998].
Minster and Jordan [1987] first applied space geodetic data to estimate motion of the Sierra Nevada block, defining northwest motion of the block at a velocity of -10+2 mm/yr. Argus and Gordon [1991] estimated an Euler vector for the block, defining counterclockwise rotation of the block about a pole located close to and southwest of the block, and northwest to north-northwest motion of the block at 9-11 mm/yr, depending on location. Both of these pioneering studies used very long baseline interferometry (VLBI) data from a few sites near the deforming eastern margin of the block. The small number of sites available at the time precluded a test of the rigid block hypothesis, while the site locations limited the accuracy of the relative motion estimates for the Sierra Nevada block, since they are not actually located on the stable block (Figure 1). New Global Positioning System (GPS) data from sites on the stable interior and margins of the block are now available, enabling us to perform a
2 DIXON ET AL ß PRESENT-DAY SIERRA NEVADA MOTION
40 ø
• o
Z 38
_• 36 ø
120 ø
Longitude (W) 116 ø 112 ø
PA ß
NA
i.
%.
34 ø
236 ø 238 ø 240 ø 242 ø 244 ø 246 ø 248 ø 250 ø
Longitude (E) Figure 1. Regional neotectonic map for the western US, and (inset) major bounding plates: PA, Pacific plate, JF, Juan de Fuca plate, NA, stable North America. Active faults on margins of Sierra Nevada block (SNB) are from Jennings and Saucedo [1994]: bsf, Bartlett Springs fault; dvfcf, Death Valley-Furnace Creek fault zone; gf, Garlock fault; gvf, Green Valley fault; hcf, Hunting Creek fault; hlf, Honey Lake fault; hmpvf, Hunter Mountain-Panamint Valley fault zone; mf, Maacama fault zone; mvf, Mohawk Valley fault zone; rcf, Rogers Creek fault zone; ovf, Owens Valley fault zone; saf, San Andreas fault. CNSB, Central Nevada seismic belt. Faults in eastern Basin and Range (BAR) are from Smith and Arabasz [1991] and include active faults and Late Cenozoic faults that are possibly active; wf, Wasatch fault zone. Seismicity from the University of California, Berkeley catalog at http://quake.geo.berkeley.edu/cnss/catalog-search.html shows all events after 1960 with magnitude >4.5 and depth less than 30 km. Note paucity of events within SNB. Space geodetic sites within the seismically active eastern boundary of SNB and Basin and Range interior shown as open triangles with four letter identifiers. Sites on SNB are omitted for clarity here, but are shown in Figure 3 (location outlined by light solid line).
rigorous test of the rigid block hypothesis, and refine our understanding of Sierra Nevada motion and associated crustal deformation. These data, and the new interpretations they afford, are the focus of this paper.
2. Observations and Data Analysis
The data used in this study were obtained in several ways:
1. Annual campaigns were conducted in August- September between 1993 and 1998, although not all sites were occupied each year. Most sites were observed for 24 hours per day for 3-5 days, in campaigns in 1993, 1994, 1995 and 1998 (Figure 2). Where available, the resulting 5 year time series provide accurate site velocity data, as GPS velocity errors depend strongly on the total time span of observations [Mao et al., 1999]. These sites are located on
the interior of the Sierra Nevada block, on its eastern margin, and in the interior of the Basin and Range province (Figures 1 and 3; Table 1);
2. Observations were made at semi-permanent, continuously recording stations in California, on or near the Sierra Nevada block, including Quincy (QUIN), part of the International GPS Service (IGS) network, operating for more than 5 years; Columbia (CMBB) in California, part of the Bay Area Regional Deformation (BARD) network, operating for about 5 years; ORVB, UCD1 and SUTB, also part of the BARD network, operating for about 2 years. Stations operating for less than 2 years (as of March 1999) are not considered in this report;
3. Observations were made at 16 semi-permanent, continuously recording stations widely distributed through eastern and central North America, operated by various agencies, used to define a stable regional reference frame for
Year Figure 2. GPS positions (relative to ITRF-96) as a function of time, with an arbitrary constant removed. Error bars (Table 3) omitted for clarity. Slope of best fit line from weighted least squares gives velocities in Table I.
4 DIXON ET AL.: PRESENT-DAY SIERRA NEVADA MOTION
5O
-5O
5O
-5O
5O
E -50 I::: 50
(" o o
ß -5o 0 50
-5o
50-
_
-50 -
5O
0
-50 ,
ß
ß
* i
**
i i I i i i i 1 i I i i r [ i i I i '
: I
WMTN Noah • WMTN East • WMTN Height '''1'''1'''1'''1'''1'''1'''1'''1'''1'''1'''1'''1'''1'''1'''1'''1'''1'''1
b Vertical rate based on post-April, 1998 data because of antenna change.
the Sierra Nevada data. These stations provide time series that are longer than 3 years.
Data were analyzed at the University of Miami following Dixon et al. [1997]. Briefly, we used the GIPSY software developed at the Jet Propulsion Laboratory [JPL] and satellite ephemeris and clock files provided by JPL [Zumberge et al., 1997]. These procedures resulted in site velocities defined in global reference frame ITRF-96 [Sillard et al., 1998] (Table 1). Errors are estimated following Mao et al. [1999] and account for the influence of both white and colored noise (see section 2.1). A formal inversion procedure [Ward, 1990] is used to derive site velocities relative to stable North America and generate an Euler vector describing motion of the Sierra Nevada block relative to stable North America. The method is described
in detail by Mao [1998]. We first define best fitting ITRF- 96 Euler vectors for eight Sierran stations (CEDA, CMBB, KMED, ORVB, SPRN, SUTB, TIOG, UCD1) or some subset, and the 16 stations on stable North America [Dixon et al., 1996; DeMets and Dixon, 1999]. These two Euler vectors are then used to define a relative Euler vector
describing rotation of the Sierra Nevada block with respect to North America. The 16 North American stations are
sufficient to ensure a robust regional reference frame (stable North America), such that reference frame "noise" is much smaller than the velocity error of any individual Sierran station, allowing us to def'me the velocities of the Sierran sites relative to stable North America (Table 2) with high accuracy. Subsets of data from the Sierran sites can be used to test block rigidity and to assess the level of
Table 2. Site Velocities Relative to Stable North America
possible "edge" effects from elastic strain accumulation. Similar procedures are used to define the velocities of sites within the Basin and Range province or on its deforming margins (GFLD, ELYA, OASI, OVRO, QUIN, WGRD and WMTN) relative to stable North America.
2.1. Uncertainties
Unless specifically stated, all uncertainties in the tables and text represent one standard error, while all error ellipses in figures represent two-dimensional 95% confidence regions (1.7 times the two-dimensional one standard error). Here we describe the procedures used to estimate these uncertainties.
GPS velocity errors may be estimated assuming that measurement noise is uncorrelated in time ("white"). If time-correlated ("colored")noise is present, the true velocity uncertainty will be underestimated if pure white noise is assumed [Johnson and Agnew, 1995]. Possible sources of colored noise in GPS include monument motion
unrelated to the larger tectonic motions of interest [Langbein and Johnson, 1997], uncertainty in the satellite orbit parameters, and atmospheric and local environmental effects [Mao et al., 1999]. Zhang et al. [1997] and Mao et al. [1999] demonstrate that GPS velocity errors may be underestimated by factors of 2-11 if pure white noise is assumed. Mao et al. present a simple model for estimating the GPS rate error (Or) for individual velocity components (north, east and vertical) for coordinate time series in the presence of combined white and colored noise:
Gr 2 12aw 2 aGf2 Grw 2 ---•+ br 2 +• (1) gT 3 g gT where g is the number of measurements per year, T is the total time span of observations (2-5 years in this study), a and b are empirical constants (a = 1.78 and b=0.22), (Sw and (5i are the white and "flicker" noise magnitudes in mm, and Orw is "random walk" noise in mm/x/yr. Flicker noise and random walk noise are different types of colored noise, distinguished by their time-dependence (Mao et al. give a complete discussion). Briefly, flicker ("pink") noise has spectral power that is inversely proportional to frequency, while random walk ("red")noise has spectral power that is inversely proportional to frequency squared. Monument noise has been characterized as a random walk process [Langbein and Johnson, 1997] and is likely to be more significant for sites in unconsolidated alluvium than for sites in bedrock. From (1) it can be seen that if random walk noise is small, velocity error depends strongly on the total time span of observations (T) and weakly on sampling frequency (g). Mao et al. suggest that white noise and flicker noise dominate the GPS noise spectrum for coordinate time series of the type used here, i.e., random walk noise is relatively small. Thus, our 5 year time series for Sierran stations set into bedrock and occupied in periodic campaigns (CEDA, KMED, SPRN and TIOG) should def'me accurate site velocities, even though they are sampled much less frequently than semi-permanent, continuously recording stations such as CMBB, ORVB, SUTB and UCD1. The importance of our noise model is that it allows the velocities from these diverse data sets
(campaign or continuous, with various time spans) to be correctly weighted in the inversion to derive Euler vectors.
Equation (1) is strictly valid only for evenly sampled position time series. Our campaign measurements yield very uneven sampling, typically several consecutive days every year or two (Figure 2). Numerical experiments suggest that approximating an unevenly sampled time series such as this by an equivalent evenly sampled time series yields rate error estimates that differ by less than 1 mm/yr from actual values (usually much less). We make the even sampling approximation in this study. As an example, for station CEDA, with a total of 19 observation days over 5 years (Figure 2), we set g equal to 3.8 samples per year.
Application of (1) also requires estimates for white, flicker, and random walk noise. These can vary from station to station, as they depend in part on local station characteristics. Mao et al. [1999] list noise values for a number of North American stations including QUIN and CMBB. For the remaining stations, we must estimate noise values using other criteria. Mao et al.'s data show a good correlation between the weighted root-mean-square (WRMS) scatter of an individual time series and corresponding magnitudes of white and flicker noise. These correlations can be used to estimate white and
colored noise magnitudes for individual GPS time series, provided that sufficient samples (observation days) are available to ensure that WRMS is a reliable indicator of
data quality. GFLD, OASI, and OVRO have anomalously low (optimistic) WRMS values, probably reflecting the small number of observations (Figure 2); their noise estimates are instead based on the average WRMS of all stations in the region with equivalent antenna type and sufficient observations to be representative, listed in the footnote to Table 3. Table 3 also lists the WRMS by component for stations analyzed in this report, and corresponding white and flicker noise estimates based on these correlations (relevant equations are given in footnotes to the table). Our estimates of velocity uncertainty are based on these values, equation (1), and the assumptions stated above.
2.2. Accuracy
One way to assess the accuracy of our derived velocities is to compare results to independent data. This also provides a means to assess the error estimates: if they are reasonable, our expectation is that most velocities reported for the same location should overlap within errors, depending on the confidence level quoted. OVRO and QUIN each have very long baseline interferometry (VLBI) and/or very long baseline array (VLBA) data available for comparison. Table 4 lists published velocities for these sites relative to stable North America, from the compilation of Hearn and Humphreys [1998], updated to reflect the latest VLBI/VLBA data, solution GLB 1102 [Ma and Ryan, 1998], and our own GPS data. The VLBI results listed are not independent, as they all rely on essentially the same data for the early part of their respective time series, but the manner in which stable North America is
DIXON ET AL.' PRESENT-DAY SIERRA NEVADA MOTION 7
Table 3. Uncertainties
WRMS White N0is½ Flicker Noise • North East Vertical North a East b Vertical c North d East e Vertical f
No AmJ 3.8 4.9 12.8 2.6 4.6 8.6 4.4 6.3 13.5 All uncertainties given in millimeters. WRMS is weighted root-mean-square.
a White noise (N) = 0.613[WRMS(N)] + 0.259. b
White noise (E) = 0.767[WRMS(E)] - 0.182.
c White noise (V) = 0.843[WRMS(V)] - 1.772. d
Flicker noise (N) = 1. i 39[WRMS(N)] + 0.117.
e Flicker noise (E) = 1.041 [WRMS(E)] - 0.342. f Flicker noise (V) = 0.668[WRMS(V)] + 5.394. g Vertical component time series at this site has unexplained offset associated with equipment change and may
not give a reliable estimate of vertical velocity averaged over the entire time interval. h Noise values for these stations are based on means of CEDA, KMED, ORVB, QU1N, SUTB, TIOG, and UCD 1. i Vertical noise values at UCD 1 are based on time series after April 1997 to avoid antenna change effects. J Mean value for North America [Mao et al., 1999].
defined can differ significantly, so the comparisons are still useful. The various VLBI results for a given site often differ by much more than two standard deviations, implying that errors for some of these results may be underestimated. Our GPS estimate for QUIN should be well resolved, as it is based on a large number of data spanning 5 years (Figure 2). QUIN's GPS-based horizontal rate estimate (11 mm/yr) lies in the middle of the range of published VLBI values (9-13 mm/yr). The GPS rate, azimuth, and vertical estimates for QUIN all lie within one standard error of the most recent VLBI result, probably the most accurate estimate available at this site. Our GPS rate
estimate for OVRO is based on far fewer data (Figure 2) and thus is less reliable, which is reflected in its larger velocity error (Tables 1, 2 and 4). OVRO's GPS-based rate estimate (9 mm/yr) lies at the low end of the range of available values (9-12 mm/yr). The GPS horizontal rate estimate lies within two standard errors of the recent VLBA
result, probably the most accurate estimate available at this site, while the GPS azimuth and vertical estimates for OVRO both lie within one standard error of the VLBA
result. The VLBI and VLBA results at OVRO, from
locations several hundred meters apart, themselves differ by 1 mm/yr in rate and 9 ø in azimuth, which is much larger than quoted errors (Table 4). This discrepancy may reflect underestimation of error or real variation reflecting local complexities in the velocity field, since the sites are located within a right step in the Owens Valley-White Mountain fault zone [Dixon et al., 1995]. The weighted means of recent independent results in Table 4 probably best represent the velocities of OVRO and QUIN. Unless specifically noted, these mean values are used in the remainder of the paper. To avoid overweighting in calculation of the mean, VLBI/VLBA errors were increased by a factor of 2. At OVRO this procedure gives essentially the VLBA result owing to its very high precision, but at QUIN the weighted mean is intermediate between the GPS result and the most recent VLBI result.
3. Results
The GPS velocity data are listed in Tables 1 and 2, and displayed in Figures 2 and 3. Before using these data to assess the rigidity of the Sierra Nevada block or describe its
8 DIXON ET AL.' PRESENT-DAY SIERRA NEVADA MOTION
Table 4. Comparison of OVRO and QUIN Velocities Relative to Stable North America
Rate, Azimuth, Up, mm/yr deg W of N mm/yr
OVRO
VLBI a 11 + 1 332 + 3 -- VLBI b 12.0 + 0.3 316 + 1 -2.7 + 0.9 VLBI c 10.1 + 0.5 322 + 2 -- VLBI d 11.7 + 0.2 323 + 1 -2.4 + 0.8 VLBA d 10.6 + 0.1 314 + 1 -5.9 + 0.3 GPS e 8.7 + 1.5 313 + 9 -5.8 + 3.4 Mean f 10.7 + 0.7 316 + 5 -5.5 + 1.4
QUIN VLBI a 11 + 1 310 + 5 -- VLBI b 12.8 + 0.5 303 + 2 -4.5 + 3.6 VLBI c 8.9 + 0.5 294 + 2 -- VLBI d 12.3 + 0.5 309 + 2 0.4 + 3.4 GPS e 11.0 + 0.9 313 + 4 -4.0 + 2.2 Mean f 11.6 + 0.9 311 + 3 -3.6 + 1.8
Argus and Gordon [ 1991 ]. Ma et al. [ 1994]. Dixon et al. [1995]. Ma and Ryan [ 1998]. This study. Weighted mean and repeatability of recent independent data: GPS (this study) and VLBI/VLBA data of Ma and Ryan [1998], with VLBI/VLBA error scaled up by 2.
present-day motion, we first address the relation between measured GPS velocities and longer-term motions.
3.1. Short-Term Versus Long-Term Velocities
In the discussion below, we assume that the short-term, interseismic site velocities measured by GPS can be related to longer-term geologic motions (e.g., fault slip rates and block motions) that average over many seismic cycles, either directly or through simple mechanical models. There are at least two effects to consider. First, the crust and upper mantle have a postseismic response to stresses released in large earthquakes [Pollitz and Sacks, 1992; Pollitz, 1997; Pollitz and Dixon, 1998]. Time-dependent postseismic effects decrease with time after a major event, and may not be significant after many decades. Large earthquakes on the major faults bounding the Sierra Nevada
faults of interest here, several times the 10-15 km thickness of the elastic, brittle upper crust. In this case, "far-field" sites (i.e., those farther than 50-100 km from the fault, which includes most of our Sierran sites), should experience small elastic strain effects, at or below the noise level of the observations (-1 mm/yr). If a simple elastic half-space model applies to the Sierras, our expectation is that most of the measured GPS velocities on the stable
block interior should be broadly representative of longer- term motions, since our Sierran sites are located far from active faults and our measurements occurred long after major earthquakes on bounding faults.
However, for a more realistic layered rheology, with an elastic layer overlying viscoelastic material, present-day elastic strain effects due to locked faults may be influenced by past earthquakes, and these effects can extend far from the fault and persist long after the last earthquake, depending on earthquake history, fault depth, and crust and upper mantle rheology [Savage and Lisowski, 1998]. This is especially important for kinematic studies of continental blocks with space geodesy, since the smaller size of these blocks compared to larger plates means that it may be difficult to find sites whose velocities are uncontaminated
by edge effects. The generally smaller size of continental blocks compared to plates also makes it difficult to obtain geographic "spread" in space geodetic site location, which is important for accurate Euler vector estimation, especially if the block boundaries need to be avoided. Together, these effects may limit accurate Euler vector estimates for continental blocks based on space geodesy, unless accurate site velocities can be defined for the interior of the block, appropriate models are available to "calibrate" the edge effects, and statistical tests are available to evaluate results. The present study takes a first step in addressing these issues.
One way to assess the influence of strain accumulation and earthquake history on the measured site velocities is to compare the Euler vector based on velocities at all the Sierran sites to an Euler vector based on a subset of sites
on the block interior likely to be less affected by strain accumulation and earthquakes. If the fit of the velocity data to a rigid block model is significantly improved by elimination of suspect sites, this would suggest that the effects are important, and the resulting Euler vector based on interior sites would presumably be a more accurate representation of long-term Sierra Nevada block motion.
We use the reduced Z 2 statistic to assess the fit of the velocity data to a given rigid block model:
Z2 = • (Oi- Ci)2 /2N 3 (2) i=l O'• --
where O• is a velocity observation (north or east), Ci is the occurred in 1857 and 1906 on the San Andreas fault, and in • calculated velocity at the same site based on a given Euler 1872 on the Owens Valley fault. The other major process vector, c•i is the velocity error, N is the number of sites is elastic strain accumulation on and near locked faults, ' used in the inversion (5,7, or 8), and 2N-3 is the number of which may reduce the relative velocity of sites across the degrees of freedom (number of sites, with two data points fault compared to the long-term geologic slip rate. For each, minus number of adjustable parameters). The simple elastic half-space models of strain accumulation minimum Z 2 indicates the best fit model. Values of [Savage and Burford, 1973; Okada, 1992], the critical reduced Z2-1.0 indicate a good fit of data to model and distance is of order 50-100 km for the vertical strike-slip suggest that error estimates are reasonable. Reduced
DIXON ET AL.: PRESENT-DAY SIERRA NEVADA MOTION 9
40 ø
39 ø
'• 38 ø
37 ø
36 ø
122 ø W 120 ø W 118 ø W
OVRO
M
EDA •
237 ø 238 ø 239 ø 240 ø 241 ø 242 ø
Longitude (E) Figure 3. GPS site velocities (arrows)with respect to stable North America (Table 2) and their two- dimensional 95% confidence ellipses. Faults and fault names are same as Figure 1, except dsf, Deep Springs Fault; flf, Fish Lake Valley fault zone. Star shows the location of shallow pressure source at Long Valley Caldera [Langbein et al., 1995b]. Arrows without ellipses show predicted velocities for sites on stable Sierra Nevada block using GPS-based Euler vector in Table 6 (5 station solution). Note that velocities of all sites on the stable block interior fit the predicted velocity within uncertainty ellipse, while sites on the block margin (QUIN, OVRO, WMTN and OASI) do not. WGRD omitted for clarity, ELYA and GFLD are off this map (see Figure 1 for location of these sites).
Z2<l.0 suggest that errors are overestimated, while reduced Z2>l.0 suggest either that errors are underestimated or that a given model poorly fits the data. These rules of thumb assume that errors are normally distributed and that sample size is sufficiently large to be statistically representative; neither criteria is particularly well satisfied here, so caution is warranted. Table 6 lists an Euler vector based on the
velocities of all 8 sites located on the Sierra Nevada block, with reduced Z 2 = 0.44, indicating that the data fit the rigid
block model quite well and that errors may be overestimated.
For comparison, we also list an Euler vector based on elimination of the three sites most likely to be affected by elastic strain accumulation: TIOG, because it is affected by deformation at Long Valley Caldera and is also close to the Sierra Nevada range front; KMED, because it lies only 18 km west of the Owens Valley fault zone; and UCD1, because it is the closest of the eight sites to the San
10 DIXON ET AL.: PRESENT-DAY SIERRA NEVADA MOTION
Andreas fault, and only -45 km east of the Green Valley fault, part of the active Calaveras - Concord - Hunting Creek- Bartlett Springs fault system (Figures 1 and 3). An Euler vector describing Sierra Nevada block motion based on the remaining five sites on the stable Sierra Nevada block interior has reduced Z2=0.23, a factor of 2 improvement compared to the Euler vector based on all 8 sites including ones near the block margins. This suggests that elastic strain effects may be important, may be detectable in our data, and that the Euler vector based on the subset of GPS sites closer to the block interior gives a more reliable estimate of long-term block motion. It also suggests that errors may be overestimated. Reducing average velocity error by a factor of 2 for the five site solution gives reduced •Z2-1.0. This may reflect the fact that the regressions used to estimate the errors (Table 3) are based on data from across North America, encompassing a wide range of climate zones, soil or bedrock locations, and monument styles. In contrast, most of the Sierran sites are located at high altitude in a dry environment (minimizing tropospheric noise) and set into glaciated bedrock (minimizing ground noise). Given the small number of data (10 versus 16), we cannot preclude the possibility that some of the improvement in fit between the 5 site and 8 site solution is due to chance. Note that the 5 station and 8 station Euler vectors are indistinguishable within uncertainties, suggesting that the magnitude of strain effects is near the error level of our data. This partly reflects the relatively long distance between known active faults and most of our sites (minimizing strain effects), and may also reflect the fact that the strain corrections for the San Andreas fault system and eastern California shear zone are opposite in sign and thus partly cancel.
3.2. Correcting for Elastic Strain Accumulation With a Coupling Model
Given the apparent improvement in fit when sites most likely to be affected by strain accumulation are eliminated, we also investigated strain effects in a more quantitative way, as follows. TIOG is omitted from the calculations, as it may be influenced by deformation at Long Valley Caldera which is time-varying through our measurement period. For the remaining 7 sites, we use the viscoelastic coupling model of Savage and Lisowski [1998], with an elastic layer overlying a Maxwell viscoelastic half-space. The elastic layer corresponds to the upper crust, and the viscoelastic half-space corresponds to the more ductile lower crust. The boundary between them, at depth H, corresponds to the lower limit of brittle faulting and the maximum depth of crustal earthquakes, typically 10-15 km. For this model the surface velocity v is
v = Z (bn / zr)[arctan{x/((2n - 1)H)}- arctan{x/((2n + 1)H)}] (3a) n=l
where x is the horizontal distance from the fault, t is the time since the last earthquake, T is the earthquake
recurrence interval, and expressions for ak are given in the appendix to Savage and Lisowski. The time constant Xo is related to the earthquake recurrence interval and relaxation time for the viscoelastic half-space, Xo=[tT/2•l, where it is the rigidity of the half-space (set here to 3x10•øPa), and rl is the viscosity (set here to 2x10¹⁹ Pa-sec). These values for rigidity and viscosity are equivalent to a relaxation time (rl/g) of-20 years, intermediate among the range of values found by other authors [e.g., Thatcher, 1983; Li and Rice, 1987]. Each fault segment is assumed to be long and vertical, and local strain effects at the end of fault segments are ignored. Each of the Sierran sites is assumed to be influenced by both the San Andreas fault system to the west and the eastern California shear zone to the east
(Figure 1). The direction of velocity increment for these two fault systems is assumed to be parallel to plate motion. Strain effects from the San Andreas system are such that measured Sierran site velocities are mainly faster compared to the long-term average, while strain effects from the eastern California shear zone are such that
measured Sierran site velocities are mainly slower than the long-term average. In and north of the San Francisco Bay area we explicitly include the effects of the San Andreas fault (sensu stricto), the Calaveras fault, the Hayward- Rogers Creek- Maacama fault system, and the Concord - Green Valley- Hunting Creek- Bartlett Springs fault system. Effects from the 1989 Loma Prieta earthquake are ignored, as are the effects of creeping sections of faults. For the three southernmost sites only (CEDA, KMED, and SPRN) we also include the effect of the Garlock fault.
We approximate the effects of the eastern California shear zone to the east by considering only the effect of the westernmost fault (i.e., the fault closest to our sites) in the strain accumulation model, and assuming that this fault carries approximately half of the total -11 mm/yr of slip that needs to be accommodated. For example, south of 37 ø N latitude, we consider only the Owens Valley fault zone, whose slip rate is taken to be 6 mm/yr. North of 38 ø N latitude, the main bounding fault or faults for the Sierra Nevada block have not been determined. We assume that
one of the main boundary faults follows the band of seismicity that, from south to north, begins near Mono Lake, California, continues northwest near the California- Nevada border to Lake Tahoe, and then continues with a small right step (i.e., Lake Tahoe may be a pull-apart basin) northwest along the Mohawk Valley fault zone [Goter et al., 1994] (Figures 1 and 3). A single throughgoing fault with clear surface expression is not developed in this region, but Thatcher et al. [1999] observe a strong gradient in GPS site velocities near here. A change in northwest velocity of-6-8 mm/yr occurs between the center of the Sierra Nevada block, moving at -14 mm/yr northwest relative to North America (this study) and the region immediately west of the central Nevada seismic belt, moving at-6-8 mm/yr northwest relative to North America [Thatcher et al., 1999]. In addition to the Mohawk Valley fault zone, the Honey Lake fault zone (Figure 1) may accommodate part of this motion. Wills and Borchardt [1993] estimate a Holocene slip rate of 1.1-2.6 mm/yr for the Honey Lake fault zone
DIXON ET AL.: PRESENT-DAY SIERRA NEVADA MOTION 11
Table 5. Fault Parameters Used in Viscoelastic Coupling Model
CEDA KMED SPRN CMBB UCD 1 SUTB ORVB
Fault SAF SAF SAF SAF SAF SAF SAF
Distance, km 119 171 142 167 109 146 191
Slip Rate, mm/yr 34 a'b 34 a'b 34 a'b 17 a 17 c 17 c 17 c Last Rupture, Year 185 7 185 7 1857 1906 1906 1906 1906
Recurrence, years 206 b 206 b 206 b 400 210 210 210 Depth, km 12 12 12 14 12 12 12
Fault - - - CLV RGC MAC MAC
Distance, km - - - 143 7 5 108 15 0
Slip Rate, mm/yr - - - 15 a 14 c 14 c 14 c Last Rupture, Year - - - 1979 ? ? ? Recurrence, years - - - 3 3 222 22 0 2 20 Depth, km - - - 5 10 12 12
Fault GAR GAR GAR - GVL BSP BSP
Distance, km 7 2 7 6 108 - 4 5 6 2 106
Slip Rate, mm/yr 6 d 6 d 6 d - 8 c 8 c 8 c Last Rupture, Year ? ? ? - ? ? ? Recurrence, years 1000 1000 1000 - 176 194 218 Depth, km 12 12 12 - 12 12 15
Fault OWV OWV OWV Unnamed MHK MHK MHK
Distance, km 63 17 6 7 100 166 145 7 0
Slip Rate, mm/yr 6 e 6 e 6 e 5 f 5 f 5 f 5 f Last Rupture, Year g (-) (-) (-) ? ? ? ? Recurrence, years 1000 h 1000 h 1000 h ? ? ? ? Depth km 13 13 13 12 15 15 15
a California Division of Mines and Geology [1996]. b
Working Group on California Earthquake Probabilities [1995].
c Freyrnueller et al. [1999]. d
McGill and Sieh [1993].
e 50% of total 11 mm/yr of integrated deformation across eastern California shear zone, augmented by 0.5 mm/yr to account for far-field effects of Death Valley-Furnace Creek fault zone.
f Based on assumed relation to Owens Valley fault zone slip rate, kinematic consistency, and data from this study and Thatcher et al. [1999].
g The Owens Valley fault last ruptured in 1872. However, CEDA, KMED and SPRN are near or beyond the southern limit of surface rupture. We have assumed that the last rupture occurred such that we are midway through the earthquake cycle.
h Based on time to accumulate 1872-1ike slip (-6 m) at a rate of 6 mm/yr.
(preferred value 2.0 mm/yr). We therefore assume a total of model are taken from the compilation by the California 7 mm/yr, with 5 mm/yr accommodated on the seismically ' Division of Mines and Geology [1996], and the time and active Mohawk Valley fault zone. New GPS data from location of surface slip from the last major earthquake are QUIN are consistent with this model of slip distribution taken (rom Jennings and Saucedo [1994]. In cases where (Section 4.3). fault depth is unknown we arbitrarily set it to 12 km. If
Unless noted, all slip rates, earthquake recurrence earthquake recurrence and time of last earthquake are intervals, and fault depths for the viscoelastic coupling unknown, we arbitrarily set these values to 500 years and
12 DIXON ET AL ß PRESENT-DAY SIERRA NEVADA MOTION
Table 6. Best Fitting Euler Vectors
Latitude,
deg N
Longitude, to, Error Ellipse a (5•o, Z 2b deg E deg/my (Smax Omin •max deg/my
North America (ITRF-96) c - 1.2 Sierra Nevada (ITRF-96)
All sites, uncorrected d 13.3 7 sites, velocity correction e 15.8 Northern block f 17.3
Southern block g 13.4
Interior sites, uncorrected h 10.9 ß
Sierra Nevada-North America •
Argus and Gordon [ 1991 ]J 32 Hearn and Humphreys [ 1998] k - 13.4 All sites, uncorrected d 19.8 7 sites, velocity correction e 22.5 Northern block f 24.0
Southern block g 19.9
Interior sites. uncorrected h 17.0
279.8 0.193 2.7 0.9 -1 0.005 0.80
245.6 0.44 6.0 0.4 -lO 0.07 0.44
244.8 0.48 7.3 0.5 -9 O.11 0.95
244.8 0.52 12.3 0.5 -12 0.20 0.65
245.5 0.45 8.4 0.4 -9 O.11 0.34
246.1 0.41 6.8 0.4 -11 0.07 0.23
232 0.61 6 1 51 0.15
205.6 0.13
224.0 0.31 8.1 1.0 -37 0.07
225.1 0.35 9.2 1.2 -39 0.11
226.7 0.39 13.8 1.1 -34 0.20
224.2 0.32 11.4 1.0 -38 0.11
222.7 0.28 9.9 1.1 -34 0.07
a •max is orientation of long axis, degrees clockwise from north. Axes are two-dimensional one standard error; for 95% confidence, multiply by 1.7.
b Z 2 is squared sum of residuals (observed data minus calculated model) divided by standard deviation squared (observation error from equation 1 and noise values in Table 3), normalized by 2N-3, where N is number of sites used in inversion (5,7 or 8) (equation 2, text).
c Based on velocities of 16 sites described in DeMets and Dixon [ 1999], updated with additional data. d
Based on horizontal velocities of 8 sites, CEDA, CMBB, KMED, ORVB, SPRN, SUTB, TIOG and UCD1, uncorrected for strain accumulation.
e Based on horizontal velocities of 7 sites, CEDA, CMBB, KMED, ORVB, SPRN, SUTB and UCD1 (i.e., TIOG omitted) with velocities corrected for strain accumulation as described in text and Table 5.
f Based on horizontal velocities of CMBB, ORVB, SUTB, TIOG and UCD 1.
g Based on horizontal velocities of CEDA, CMBB, KMED, SPRN and TIOG. h Preferred (minimum Z 2) model, based on horizontal velocities of 5 sites on stable interior of Sierra Nevada
block, CEDA, CMBB, ORVB, SPRN and SUTB, uncorrected for strain accumulation. i Sierra Nevada rotates relative to North America. J Based on VLBI velocities of OVRO and QU1N relative to stable North America, and deweighted VLBI
velocity for Mammoth Lakes. k
Based on a regional kinematic model.
250 years ago, respectively. If recurrence interval is known but the time of last earthquake is unknown, we arbitrarily set the latter to a time before present equal to one-half the recurrence interval, i.e., the fault is assumed to be in the middle of its earthquake cycle. The most recent surface rupture for the central Garlock fault occurred sometime after 1490 A.D. [McGill, 1992]. We arbitrarily assume it to be midway between that date and the present time (i.e., 1745). Model parameter values and data sources are summarized in Table 5.
The velocity increments estimated from the coupling model, to be added to or subtracted from the observed site velocities, are generally less than 2 mm/yr, near the level of the measurement error. The largest correction is at CMBB, with a rate correction of 2 mm/yr. The Euler vector based on "corrected" site velocities is equivalent within errors to the Euler vectors based on uncorrected velocities, but misfits the data (Z 2= 0.95) significantly more than either
2
of the uncorrected Euler vectors (Z = 0.23 and 0.44; Table 6). This may reflect our simplistic application of the
DIXON ET AL.: PRESENT-DAY SIERRA NEVADA MOTION 13
coupling model (e.g., ignoring the effect of finite fault length) or uncertainty about key parameters in the model, such as earthquake recurrence interval or time of last rupture, both of which can have a big effect on the magnitude and even the sign of the correction. In the remaining discussion, we use the Euler vector based on the five interior sites, with velocities uncorrected for strain accumulation ("Solution h, Preferred" in Table 6), as it is the best fit (minimum •2) solution. This solution predicts northwest motion of the Sierra Nevada block at 13-14
mm/yr, close to an estimate of present day motion based on regional kinematic considerations (N50øW+5 ø at 12.7+ 1.5 mm/yr)[Hearn and Humphreys, 1998]) and close to the geological average motion since 8-10 Ma (NW-NNW at 15 mm/yr)[Wernicke and Snow, 1998]. Thus Sierra Nevada motion appears to have been remarkably steady over the last 8-10 Ma.
3.3. Vertical Motion, Data Quality, Monument Noise, and Local Effects
3.3.1. Uplift, subsidence, and data quality. With a time span of observations totaling 5 years at many of our sites, the vertical component of velocity is sufficiently precise for some applications. To minimize vertical errors at the campaign sites, we took four steps. First, we employed the same antenna design for most observations, a Dom- Margolin antenna with choke ring back plane, a design
-.:with good multipath rejection. (CMBB had a different antenna design through mid-1997 and underwent an antenna change in August 1997. This may be related to the offset in the vertical time series about this time (Figure 2), and the vertical velocity from this site is omitted in the following discussion). Second, for most campaign observations we used fixed height "spike" antenna mounts, designed to eliminate the uncertainty associated with measurement of variable tripod height that often plagues this type of measurement (a picture of our spike mount set- up is visible on the World Wide Web at www.geodesy.miami.edu). Third, we were able to locate many of the sites on bare hill tops far from obstructions, reducing multipath and giving good sky visibility. Finally, all of our campaign observations occurred in the fall (September-October), minimizing the influence of annual or seasonal effects on the time series. In addition, many of the sites, and all four S ierran campaign sites, are located at relatively high altitude, reducing the influence of a variable lower troposphere on the height estimates. These sites therefore have high-quality data, especially in the vertical component. For example, all 4 Sierran campaign sites have vertical WRMS values less than 10 mm, which is lower than the corresponding values at most other sites (Table 3).
All 4 Sierran campaign sites, including the two near the range front (KMED and TIOG) have vertical velocities that are zero within one standard error. Thus there is no
evidence for rapid uplift along the eastern Sierra range front fault, or anywhere else in the block, within uncertainties. The GPS data at OVRO and QUIN suggest marginally significant subsidence, 6+3 and 4+2 mm/yr, respectively.
Both of these sites are located in alluvial valleys. Subsidence is also observed at both the VLBI and VLBA
sites at OVRO, but not at the VLBI site at QUIN (Table 4), so only OVRO's subsidence may be real. Subsidence at OVRO may be related to range front normal faulting near the stations, or it may be due to alluvial compaction. All three OVRO stations are located on unconsolidated
alluvium in Owens Valley, where ground water levels have declined in the past due to diversion of eastern Sierra ran- off into the Los Angeles aqueduct. The resulting loss of pore pressure can lead to compaction of unconsolidated alluvium in the region above the declining water table and consequent surface subsidence. Local compaction might compromise the utility of this site for regional tectonic studies, as it may also affect the horizontal velocity components. However, we see no evidence of this in our data: OVRO's velocity fits regional fault models within uncertainty, as shown in a subsequent section.
3.3.2. Monument noise. If the Sierra Nevada block were
perfectly rigid, the residuals (difference between observed velocity and velocity calculated from our Euler vector; Table 7) would reflect the root-sum-square (rss) of all error
sources, including monument noise. North residuals are smaller than east residuals, suggesting that the residuals likely reflect error sources unique to GPS (east errors are generally larger than north errors for GPS results where carrier phase biases are not fixed, as in this analysis), and do not reflect monument noise, which should be random in direction. The effect of monument noise on the velocity estimates is thus likely of the order of or smaller than the largest north residual (0.6 mm/yr; Table 7). While the permanent sites (CMBB, ORVB, SUTB and UCD1) have relatively large monuments, our campaign sites on the Sierra Nevada block or near its eastern margin consist of small, inexpensive stainless steel pins or brass plaques set in bedrock, from the surface to a depth of-•15 cm. The high quality of the data from these marks (e.g., Tables 1, 6, and 7; Figures 2 and 3) suggests that when unweathered bedrock is available, such inexpensive marks are adequate for most GPS experiments. Deeply drilled monuments [e.g., Langbein et al., 1995a] which reduce the effect of monument noise in unconsolidated alluvium, are thus not required in the glaciated Sierran bedrock environment.
3.3.3. Effect of Long Valley. TIOG's velocity is slightly faster (by 1 mm/yr) than the predicted velocity at this location. This may reflect the influence of local deformation from the resurgent dome at Long Valley Caldera, located-40 km to the southeast (Figure 3). During the period of our measurements, the dome was inflating due to a pressure source at 5-7 km depth, possibly a magma chamber, with the center of the dome uplifting by a total of-15 cm during this 5 year period [Langbein et al., 1995b; Dixon et al., 1997; unpublished University of Miami Geodesy Laboratory data, 1999.]. Simple elastic half-space models suggest that strain propagation from this center of inflation will add a northwest velocity component at TIOG relative to stable Sierra Nevada. Marshall et al.
[1997] show detectable velocity effects near this location for a period when Long Valley Caldera was less active. However, the magnitude of this local volcanic effect may be partially offset by elastic strain accumulation associated
14 DIXON ET AL.: PRESENT-DAY SIERRA NEVADA MOTION
Table 7. Misfits for Best Fit Sierra Nevada Euler Vector Relative to ITRF-96
North Velocity, mm/yr East Velocity, mm/yr Observed Predicteda Residual Observed Predicteda Residual
CEDA -3.60 -3.74 0.14 -19.3 -19.11 -0.19
CMBB -5.10 -5.15 0.05 -19.40 -20.66 1.26
ORVB -6.60 -6.02 -0.58 -21.90 -21.66 -0.24
SPRN -3.90 -3.85 -0.05 -20.20 -19.42 -0.78
SUTB -5.90 -6.27 0.37 -22.20 -21.40 -0.80
b Mean .... 0.24 .... 0.65
RMS .... 0.32 .... 0.77
a Prediction is from best fit Euler vector in Table 6 (solution h, 5 stations, uncorrected). b
Mean of absolute value.
with right-lateral strike-slip faulting along the eastern California shear zone, which would tend to slow TIOG's velocity relative to the Sierra Nevada block interior. TIOG's velocity data are included in the Euler vector determination based on all of the "uncorrected" data (solution "d", Table 6), but omitted in the other two Euler vector estimates for the whole block (solutions "e" and "h", Table 6) including the best fit vector.
4. Discussion
4.1. Rigidity of the Sierra Nevada Block
Velocity data from the five GPS sites on the stable interior of the Sierra Nevada block are very well fit by a single Euler vector, to much better than one standard error (Figure 3, Tables 1, 6 and 7). The root-mean-square (rms) values of the residuals are quite small, 0.3 mm/yr (north) and 0.8 mm/yr (east), considerably smaller than the independently estimated GPS velocity errors, with rms values 1.0 mm/yr (north) and 1.6 mm/yr (east) ( Table 1). The maximum rate residual is 1.3 mm/yr, and the mean rate residual is 0.8 mm/yr, compared to the mean rate error, 1.5 mm/yr. These residuals are smaller than the residuals for similar data and models for major plates [e.g., Dixon et at., 1996, Dixon and Mao, 1997; DeMets and Dixon, 1999; Norabuena et at., 1999]. The residuals reflect either the magnitude of non-rigid block behavior or, more likely, the effect of observational errors. Thus we cannot conclude that the Sierra Nevada block is as rigid or more rigid than major plates; it could be less rigid, but the level of non- rigidity in each case is well below the current GPS detection limit. The relative magnitudes of the residuals and independently estimated velocity errors suggest that our error estimates may be conservative, consistent with the inference from the Z 2 tests. If the residuals were significantly larger than the error estimates, this would imply either that we had underestimated the errors or that the Sierra Nevada block is not rigid. Similar conclusions
are reached if we use the larger, 8 station data set. Thus, we conclude that the GPS velocities for all sites on the
Sierra Nevada block are consistent with the rigid block model within observational error. In other words, the kinematics of the Sierra Nevada block can be adequately described by rotation of a rigid block on a sphere, analogous to the motion of larger rigid plates.
The above arguments also suggest that any velocity anomalies due to non-rigid block behavior at our southern sites (SPRN, KMED and CEDA) associated with motion on the Kern Canyon fault, or long-term postseismic effects associated with the 1952 earthquake on the White Wolf fault, are small and below our data uncertainty. We cannot preclude the possibility that such effects are present and coincidentally conspire to produce a rigid block model that is biased, but this seems unlikely. If such were the case, we might expect that the northern Sierra Nevada block would behave differently from the southern Sierra Nevada block; such is not the case (see next paragraph). Bowden et at. [1997] note that postseismic effects associated with the 1952 Kern County earthquake were high in the decade following the earthquake and then dropped significantly in the following decades, consistent with our observations.
We split the stations into two groups, defining separate Euler vectors for the northern block (CMBB, ORVB, SUTB, TIOG and UCD1) and southern block (CEDA, CMBB, KMED, SPRN and TIOG)to investigate possible differential motion. The data are insufficient to der'me these blocks with completely independent data, so CMBB and TIOG near the center of the block (Figure 3) are common to each group. The 95% confidence regions for the two Euler poles have significant overlap, and the rotation rates agree within one standard error (Table 6), suggesting that the entire region behaves as a single rigid block within observational error.
The GPS residuals for the best fit Sierra Nevada block Euler vector (Table 7) are similar to or smaller than the velocity residuals for the old, cold continental lithosphere comprising stable North America [DeMets and Dixon, 1999]. Seismic data [Wernicke et al., 1996] as well as
DIXON ET AL.: PRESENT-DAY SIERRA NEVADA MOTION 15
geothermometry from xenoliths in Cenozoic volcanics [Ducea and Saleeby, 1996] have suggested the presence of hot asthenosphere near the base of thinned eastern Sierran crust. Apparently the rigidity of the Sierra Nevada block has not yet been affected by the additional heat by amounts greater than our observational error. Perhaps crustal thinning and basal heating on the eastern margin are recent phenomena, such that there has not yet been sufficient time for the strong, brittle upper crust to warm and weaken significantly.
4.2. Block Rotation and "Missing" Motion
Rotation of continental blocks about vertical axes within
or near the blocks is an important component of continental deformation, as documented by numerous paleomagnetic studies. Argus and Gordon [1991] suggested that the Sierra Nevada block undergoes counterclockwise rotation about a proximal vertical axis, located-•10 ø from the southwest margin of the block. The new GPS data do not support rotation of the block about a proximal axis, rather, the block undergoes slow counterclockwise rotation, with the pole of rotation relatively far from the block boundary (Table 6). Our new rotation rate (0.28ø/Myr) is intermediate between the rotation rates proposed by Argus and Gordon (0.61ø/Myr) and Hearn and Humphreys [1998] (0.13ø/Myr). Most of the Sierran site velocity azimuths lie close to the azimuth of present-day Pacific- North America motion [DeMets and Dixon, 1999] calculated at the respective site locations. The northern stations on the block interior (ORVB and SUTB) have velocity azimuths ---10 ø more westerly relative to southern interior stations (CEDA and SPRN), perhaps reflecting the kinematic consequences of faster east-west extension in the northern Basin and Range compared to the southern Basin and Range [e.g., Shen-Tu et al., 1998; Bennett et al., 1999]. This results in a small component of convergence normal to the San Andreas fault, depending on latitude. We can calculate this using the new Sierra Nevada Euler vector, the new estimate of Pacific-North America motion [DeMets and Dixon, 1999] and known motion on the San Andreas fault (e.g., Table 5). At 36øN on the San Andreas fault, we calculate 4+2 mm/yr of fault-normal convergence, as well as an additional 3+2 mm/yr of right lateral slip, some of which is likely accommodated west of the San Andreas fault based on the distribution of seismicity and mapped faults (Figure 1).
4.3. Deformation in the Basin and Range Province
Motion of the Sierra Nevada block relative to stable
North America is a measure of integrated Basin and Range deformation, and should be equivalent to the vector sum of slip rates on individual faults and other deformation sources across the Basin and Range [Minster and dordan, 1987; Humphreys and Weldon, 1994; Holt and Haines, 1995]. Of course, some motion may be missed because it occurs on unrecognized faults, or is accommodated via diffuse aseismic deformation or as magmatic strain [e.g., Parsons et al., 1998]. Vector summation, with Sierra
Nevada motion providing the kinematic boundary condition, is one way to quantify such missing motion, and more generally provides a test of kinematic models. We illustrate this here with several examples.
A simple transect approximately perpendicular to a small circle describing Pacific-North America motion passes from the center of the stable Sierra Nevada block, across northern Owens Valley near OVRO, south of the central Nevada seismic belt, through Ely Nevada, and across the Wasatch fault zone near Salt Lake City to the Colorado Plateau (Figure 1). A more northern transect through central Nevada encounters a different style of deformation partitioning, in particular the central Nevada seismic belt [Pezzopane and Weldon, 1993; Bennett et al., 1998; Thatcher et al., 1999] (Figure 1) but the same kinematic boundary condition (Sierra Nevada motion) should apply. The Wasatch fault zone and the faults comprising the eastern California shear zone (e.g., Owens Valley and Fish Lake Valley fault zones; Figures 1 and 3) are the only two major active fault systems crossed in the more southern transect. Deformation accommodating northwest motion of the Sierra Nevada is partitioned on a regional scale between these two zones, respectively the eastern and western boundaries of the Basin and Range province, with east-west extension on the north-south striking Wasatch fault zone, and dominantly right-lateral strike-slip on the northwest striking eastern California shear zone [Dokka and Travis, 1990; Savage et al., 1990; Dixon et al., 1995; Hearn and Humphreys, 1998]. Dixon et al. [1995] compared regional VLBI and SLR (satellite laser ranging) data to local deformation data and suggested that Basin and Range deformation was largely restricted at present to these two marginal zones. Subsequent geodetic studies have both refuted this simple picture [Bennett et al., 1998] and confirmed it [Thatcher et al., 1999]. Part of the problem is that the nature of partitioning is almost certainly not constant throughout the province. Also, partitioning of extensional (-east-west) motion and strike- slip motion associated with the eastern California shear zone need to be considered separately (extension could be diffuse, while strike-slip motion could be concentrated in the shear zone; e.g., Bennett et al., [1998]). Finally, it has been difficult to accurately account for the effects of time- correlated error inherent in any space geodetic technique, leading to conflicting interpretations of the same data [e.g., Savage, 1998]. Since even small amounts of deformation can have important tectonic and natural hazard implications [Wernicke et al., 1998; Connor et al., 1998], we revisit this issue using vector summation and the new data and error model. We will show that Sierra Nevada block
motion supplies a useful kinematic boundary condition for models of interior Basin and Range deformation, that the current data suggest that deformation is largely restricted to the eastern and western boundary zones, but that up to 3 mm/yr of interior deformation is allowed by the vector summation approach within uncertainties, a value that is consistent with background seismicity in the interior (e.g., Figure 1).
Implicit in the vector summation approach as used here is the assumption that the site velocity relative to stable North America is a monotonically increasing function of
16 DIXON ET AL.: PRESENT-DAY SIERRA NEVADA MOTION
distance from the craton, with no changes in the sign of the velocity gradient. In other words, given only the kinematic boundary condition (Sierra Nevada motion), we cannot preclude the possibility that the velocity "signal" associated with a zone of convergence is coincidentally cancelled by an adjacent region of extension in the sparsely sampled interior of the Basin and Range, with correspondingly higher total deformation than that estimated from our simple vector summation approach. However, available kinematic data for the interior [Bennett et al., 1998; Thatcher et al., 1999] currently show no evidence of such velocity reversals beyond 95% confidence intervals. Also we are aware of no significant thrust fault earthquakes in the historic record for the region.
4.3.1. Deformation near the eastern boundary of the Basin and Range province. Dixon et al. [1995] estimated 4.94-1.3 mm/yr of motion at Ely Nevada in the central Basin and Range relative to stable North America, on the basis of a limited number of VLBI experiments conducted between 1984 and 1990. This site is sufficiently far from the Wasatch fault zone and nearby faults that localized elastic strain effects can be ignored for purposes of estimating long-term slip rate from the geodetic data, but slip on possible additional faults near the Wasatch fault would also be reflected in this site's velocity. The new GPS data for Ely (ELYA in Tables 1-3) indicate 3.44-1.2 mm/yr of westward motion relative to stable North America. Our new velocity is similar to the value of 2.5 mm/yr of west directed extension for the eastern province estimated by Hearn and Humphreys [1998] on the basis of minimum strain energy considerations.
The velocity of ELYA probably represents an upper limit for the rate of horizontal extension across the Wasatch fault zone. Published extension rates across local networks
spanning the Wasatch fault zone near 41 ø N include 2.64-0.6 mm/yr from trilateration [Savage et a/.,[1992] and 2.74-1.3 mm/yr from GPS [Martinez et al., 1998]. The small difference between the ELYA velocity and local rate estimates (0.84-1.3 mm/yr using the local rate estimate of Savage et al. [1992]) may reflect the influence of elastic strain accumulation on the fault zone and/or the
contribution of additional faults outside the local networks; in either case the sum of these effects is apparently quite small. Based on the similarity between our regional extension estimate from ELYA and the two independent local extension rate estimates for the Wasatch fault zone
[Savage et al., 1992; Martinez et al., 1998], we suggest that the Wasatch fault zone is the only significant presently active extensional structure between Ely Nevada and eastern North America. Dixon et al. [1995] suggested the same thing using less precise data. Thatcher et al. [1999] reached a somewhat different conclusion based on a GPS
transect near 39 ø N, distributing slip between the Wasatch fault zone and the Drum Mountain fault 100 km to the
west. This may indicate a change in the partitioning of deformation along strike, but distinguishing among the possibilities is probably near the resolving power of current data.
Our estimate of the azimuth of ELYA's velocity relative to stable North America, 80ø4-14 ø west of north (Table 2) is
equivalent within errors to the VLBI-based value given by Dixon et al. [ 1995] (98øñ 12øwest of north). Since the two azimuths are derived by independent techniques and with independently defined reference frames, we take the indicated westerly motion of the site to be a robust estimate, and note that it differs significantly (95% confidence) from the direction of overall plate motion and the direction of Sierra Nevada motion, both northwest within small uncertainties. This is consistent with models
that drive Basin and Range extension by stresses other than or in addition to plate boundary traction [Sonder et al., 1986; Jones et al., 1996; Thatcher et al., 1999; Sonder and Jones, 1999]. However, our data do not require such models, as the displacement (or strain) direction does not uniquely define the stress direction. ELYA's westward velocity azimuth probably does define the mean extension direction across the Wasatch fault zone, essentially perpendicular to the local, north-south trend of the range front (Figure 1). Thus, there is no evidence for oblique extension.
The similarity between the local and regional velocity estimates across the Wasatch fault also places some constraints on the magnitude of elastic strain effects on the fault and fault geometry. Savage et al. [1992] fit trilateration data from the local Wasatch network to a
standard (fully locked) elastic strain model to estimate long-term (far-field) fault slip rates. They obtained 5.64-2.0 mm/yr of fault slip assuming a 60 ø dipping planar fault geometry, equivalent to 2.7 mm/yr of horizontal east-west extension, and 7.64-1.6 mm/yr of fault slip for a listric fault geometry, equivalent to 7.54-1.6 mm/yr of horizontal east- west extension. The new velocity data for ELYA are not permissive of the high far-field rates implied by the latter model, suggesting either that a listtic model is inappropriate, or if the fault is listtic, that a simple fully locked model is inappropriate, i.e., some motion may occur aseismically.
4.3.2. Integrated deformation across the western boundary of the Basin and Range province. The eastern California shear zone [Dokka and Travis, 1990; Savage et al., 1990] accommodates 124-2 mm/yr of right-lateral slip in the Mojave Desert, oriented N39øW4-5 ø [Sauber et al., 1994]. North of the Garlock fault this motion is accommodated on
two or three active strike-slip faults, whose total slip rate sums to 114-2 mm/yr, based on VLBI and SLR observations at OVRO and a simple elastic strain model [Dixon et al., 1995]. Our new data refine this estimate.
The vector difference between the motion of the Sierra
Nevada block, defined by our Euler vector, and the motion of ELYA is an estimate of integrated eastern California shear zone deformation plus any additional deformation in the interior of the Basin and Range west of ELYA (Figure 4). This vector difference (114-1 mm/yr oriented N37øW) is equivalent within errors to the local estimate of Sauber et al. [1994] (12 mm/yr, N39øW), implying that additional motion in the interior of the Basin and Range is small. The same conclusion was reached by Dixon et al. [1995] by comparing VLBI and SLR regional deformation data to local deformation data, and by Thatcher et al. [1999] based on a GPS transect across the Basin and Range near latitude
DIXON ET AL.: PRESENT-DAY SIERRA NEVADA MOTION 17
[ I ] I [ I ] I [ I
- -10
. ? E xx 6
-- 2 Z
- \ % %, •,,, •.// ' I ' I ! I ' I ' I '
- 12 - 10 -8 -6 -4 -2 0
West Velocity (mm/yr) Figure 4. Velocity vector diagram, illustrating predicted motion of the Sierra Nevada block relative to stable North America (solid line, SIERRA) for a transect perpendicular to plate motion near OVRO. Measured motion at ELYA (dashed line, EBR; Table 2) represents motion of the eastern Basin and Range relative to stable North America, mainly extension across the Wasatch fault zone. Vector difference between SIERRA and EBR represents motion on the eastern California shear zone (ECSZ)plus any additional deformation in the Basin and Range interior. ECSZ deformation includes right lateral shear on the Fish Lake Valley fault zone (dashed line, FLVF) at 8.4 mm/yr, and right-lateral shear on the Owens Valley fault zone (OVF) at 3.0 mm/yr (Figure 5). Measured motion on these two faults closely matches total motion between the central Sierra Nevada and ELYA, implying that no significant motion is "missed" on this transect.
39 ø N. A velocity profile through northern Owens Valley (next section) directly measures eastern California shear zone deformation, and gives an equivalent result.
4.3.3. Partitioning of deformation within the eastern California shear zone. The slip rates of many of the individual faults comprising the eastern California shear zone are not well known. In this section we show how the
new Euler vector can place constraints on these slip rates at certain locations, even where local data are limited (of course uncertainties are reduced if additional local data are
available). We also show that accurate fault slip rate estimates in this region based on geodesy require some knowledge of past earthquake history due to time- dependent viscoelastic effects in the lower crust.
Figure 3 shows the GPS-based velocities relative to stable North America for OVRO, QUIN, and other stations near the eastern margin of the Sierra Nevada block, together
with the velocity predicted by the new Euler vector, i.e., the velocity expected if these stations were located on the stable block interior. In all cases, sites within the block have velocities that match the Euler vector prediction within the 95% confidence region, including those not used to generate the best fitting Euler vector (TIOG, KMED and UCD 1), while sites on the margin (QUIN, OVRO, WGRD, WMTN and OASI) have velocities that are significantly slower than the predicted velocity. This is not surprising; all of the latter group of sites are located within the seismically active boundary zone (Figure 1). An Euler vector for the Sierra Nevada block based mainly on data from OVRO and QUINCY would therefore predict a Sierra Nevada velocity that is biased to slow values, as these sites do not lie on the block interior and are affected by elastic strain accumulation on its eastern margin. We can take this one step further: the difference between observed motion at
18 DIXON ET AL ß PRESENT-DAY SIERRA NEVADA MOTION
these sites and motion predicted by our new Euler vector can be used to estimate slip rates on the major nearby faults, as described below.
4.3.3.1. Deformation near QUIN: At Quincy, California, the difference vector between predicted Sierra Nevada velocity and the observed velocity at QUIN (e.g., 3.1+1.1 mm/yr northwest using the GPS result in Table 2), requires a minimum of several mm/yr of right-lateral strike-slip motion on northwest striking faults near QUIN. One candidate is the Honey Lake fault zone, -50 km northeast of QUIN, with a Holocene slip rate of 2 mm/yr [Wills and Borchardt, 1993]. Another candidate is the Mohawk Valley fault zone, the linear valley with intense microseismicity where QUIN is located [Goter et al., 1994]. A magnitude 6 earthquake is believed to have occurred on the Mohawk Valley fault zone in 1888 [Toppozada et al., 1981 ]. Hill et al. [1991] show two focal mechanisms northwest of Lake Tahoe near Truckee, California that are consistent with right lateral strike-slip events on a northwest-striking fault in this area, with magnitudes of 5.4 (1980) and 6.0 (1966) (see also Tsai and Aki [ 1970] and Hawkins et al. [ 1986]). Goter et al. [ 1994]
show a total of 5 M>_5.5 events on this fault since 1836. Although Holocene slip rates are not published for this fault, one segment (the Indian Valley fault) is known to have experienced Holocene displacement [Jennings and Saucedo, 1994]. Assuming that the velocity difference at QUIN is due to slip only on these two faults, we can solve for the slip rate of the Mohawk Valley fault assuming the geological slip rate for the Honey Lake fault, using the new Euler vector to predict the motion of a "pseudosite" on the block interior, far from the fault (Figure 5a). Earthquake history and recurrence interval are not known here, so we revert to the simple elastic half-space model [Savage and Burford, 1973] in place of the viscoelastic coupling model, linearly superposing results to represent two parallel faults [e.g., Dixon et at., 1995]. The limited data are fit by a model that has the Mohawk Valley fault zone slipping at 6+3 mm/yr (Figure 5a). Models that distribute 6-8 mm/yr of slip equally on the Mohawk Valley and Honey Lake fault zones fit the data nearly as well. Thatcher et at. [1999] show a velocity change of 6-7 mm/yr near this region, consistent with either type of model.
Deformation across the central Nevada seismic belt (Figure 1) can also be estimated by comparing total Sierra Nevada motion near QUIN to the vector sum of motion in
14 12
•1o
El0
I I I
:• • c!:_ -r • • mm/yr rJ3 rJ3 0 •• -
_1 I • 6 mm/yr , Stable Sierra x
9 mm/yr
I I VF •HLF -100 -50 0 5O
I I
SNEV OVRO
I I
I FLF=6 mm/yrJ -
' WGRD
•WMTN
,OASI
GFLD mm/yr-
ELYA
m m/yr••x,-- mm/yr
-100 0 100 200 300 400
Distance (km)
Figure 5. Simple strain accumulation models for two parallel strike-slip faults in an elastic half-space [Dixon et at., 1995] or an elastic layer over a viscoelastic half space [Savage and Lisowski, 1999] compared to fault-parallel velocity components (triangles, one standard error bar) on transects perpendicular to major faults on the eastern boundary of the Sierra Nevada block near (a) Quincy, California, and (b,c) Owens Valley, California. In Figure 5a, elastic half space model only is used, and major faults are Mohawk Valley fault zone (MVF)and Honey Lake fault zone (HLF). HLF slip rate fixed at 2 mm/yr [Wills and Borchardt, 1993] and MVF slip rate varied (3, 6 and 9 mm/yr). Velocity for central Sierra Nevada (SNEV) near Briggs, California (39.4øN, 121.7øW) calculated from Euler vector or site velocity data at SUTB, ORVB and QUIN (Tables 2, 6 and 8). In Figures 5b and 5c, similar models are shown for the Owens Valley (OVF) and Fish Lake Valley (FLF) fault zones. 5b: FLF rate is fixed at 6 mm/yr [Dixon et at., 1995; Reheis and Dixon, 1996; Bennett et aL, 1997] (see text), and OVF slip rate is varied (3 and 7 mm/yr, dashed lines, and 5 mm/yr, solid line). SNEV rate calculated for a point east of Fresno (36.8øN, 119.5øW). In this model, no active faults are assumed between FLF and ELYA. Figure 5c shows a close up of data in central part of Figure 5b, with additional strain accumulation models. First number shows slip rate on OVF, second number shows slip rate on FLF. Heat flow data (small circles) from Blackwell et al. [1991]. Note coincidence of high lateral gradients in heat flow and surface velocity. Thin solid lines show elastic half- space (EHS) models with equivalent summed slip rate (11 mm/yr) but different partitioning of slip between OVF and FLF. No EHS model fits all data within one standard error. Viscoelastic coupling (VEC)model for 3.0 mm/yr slip on OVF, 8.4 mm/yr slip on FLF (heavy solid line is summed rate, dashed lines are individual fault rates), with viscosity 10 20 Pa-sec, and locking depth, recurrence interval and date of last earthquake for OVF and FLF of 8 km, 1200 years and 1872 AD, and 12 km, 900 years and 1400 AD, respectively.
DIXON ET AL ß PRESENT-DAY SIERRA NEVADA MOTION 19
12
E10 E
• 8
I I I I
VEC (3/8)
..... FLF- . _
o o
.... OVF.
o
7/4 0
60 -40 -20 0 20
Distance (km)
Figure 5. (continued)
4O 6O
90
80
60.• •
50 •-
40
3O
the eastern Basin and Range (from ELYA) and motion across the Mohawk Valley-Honey Lake fault zone, if we assume no intervening deformation sources (i.e., our estimate is a maximum). Taking the motion across the Mohawk Valley-Honey Lake fault zone at 6-8 mm/yr (from the model in Figure 5a) at an azimuth 320 ø (from a map) we estimate 44-2 mm/yr at 300ø4.10 ø for motion across the central Nevada seismic belt (e.g., extension roughly perpendicular to the trend of major normal faults), equivalent within uncertainties to the direct measurement of Thatcher et al. [ 1999].
4.3.3.2. Deformation near OVRO: OVRO's velocity is also deficient compared to the central Sierra Nevada block, in large part because it is located within the Owens Valley- White Mountain fault zone and thus is affected by strain accumulation on both this fault zone and the Fish Lake
Valley fault zone immediately to the east (Figures 1 and 3). Here we distinguish between the Owens Valley-White Mountain fault zone slip rate south and north of 37øN, the latitude of the valley's intersection with the Deep Springs fault, and close to the latitude (37.2øN) where the Owens Valley fault transitions to the White Mountain fault via a right step. The Deep Springs fault acts to transfer right- lateral slip from the Owens Valley fault zone to the south, across the Deep Springs normal fault, to the Fish Lake Valley fault zone to the north [Reheis and Dixon, 1996]. Recent work on the Deep Springs fault suggests that its long-term horizontal slip rate is -1 mm/yr [Lee et al., 2000]. Thus we expect the slip rate of the Owens Valley fault zone south of 37øN to be -1 mm/yr faster than the rate to the north.
It is useful to resolve the velocity components of sites near the eastern California shear zone into components that are parallel and perpendicular to the mean shear zone trend
(Table 8). Figures 5b and 5c show a velocity transect perpendicular to the mean shear zone trend, comparing the fault-parallel rate component of sites within 50 km of the transect (all sites except ELYA actually lie within 15 km of the transect) with models for two parallel strike-slip faults, the Owens Valley-White Mountain fault zone and the Fish Lake Valley fault zone, the two fault zones comprising the shear zone in this region. The two faults differ in strike by -•20 ø, but given data and model uncertainties, the parallel fault approximation is probably adequate. The transect begins at a point in the central Sierra Nevada (36.8øN, 119.5øW), passes through our site near Goldfield, Nevada (GOLD), and ends near ELYA (Figure 1), passing between sites WMTN and WGRD on the White Mountain block, and passing 10 km north of OVRO. The data constrain the slip rate of the Owens Valley-White Mountain fault zone north of 37øN and the Fish Lake Valley fault zone immediately to the northeast. We have no site on the stable Sierra Nevada block near this transect, but the new Euler vector allows an accurate estimate of the velocity at arbitrary locations on the block. Our data are sensitive to the integrated slip rate across the Owens Valley-White Mountain fault zone and the Fish Lake Valley fault zone, but are less sensitive to the partitioning of slip between the two fault zones, separated by only about 40 km on this transect. The integrated slip rate from these data (114.1 mm/yr, Figures 5b and 5c) is equivalent to the estimate based on vector difference (Figure 4) that included a component of deformation in the interior of the Basin and Range. Thus the fault-parallel component of any additional deformation between the Fish Lake Valley fault zone and ELYA is small and possibly zero. At 95% confidence, the maximum integrated fault-parallel slip rate across the interior Basin and Range allowed by our data is 3 mm/yr.
20 DIXON ET AL.: PRESENT-DAY SIERRA NEVADA MOTION
The strong gradient in surface velocity across this part of the western Basin and Range (Figure 5b) is striking. This velocity gradient is incompatible with models requiring a more or less constant strain rate across the Basin and Range between stable North America and stable Sierra Nevada.
Instead, it suggests that most of the present-day deformation in the Basin and Range province that accommodates northwest motion of the Sierra Nevada is
concentrated in the western boundary of the province, at least for this transect (see next paragraph for the limitations of this argument). In the vicinity of the transect, essentially all of this deformation appears to be concentrated in a zone of mainly strike-slip faulting less than 50 km wide on the Sierra Nevada block's eastern
boundary. This region of high surface velocity gradient coincides with a region of rapid change in heat flow between the eastern Sierra margin and the western Basin and Range (Figure 5c), as well as high lateral gradients in electrical resistivity in the middle crust [Park et al., 1996] and P wave velocity in the upper mantle [Humphreys and Dueker, 1994; Dueker, 1998]. These correlations suggest that the surface velocity distribution closely reflects deep- seated processes or structure, and not simply local variation in upper crustal structure.
This narrow zone of deformation and correspondingly high velocity gradient has implications for contemporary strain rate estimates for the Basin and Range province. These rates are sometimes calculated by taking estimated Sierra Nevada motion, and dividing by the width of the entire Basin and Range province (-103 km) or an assumed width for the actively deforming boundary zone, often taken as several hundred km. The data in Figure 5b and 5c indicate that, at least for this location, the zone of active deformation is restricted to a few 10's of km in width.
However, the width of the actively deforming zone, as indicated by the location of active faults and seismicity, widens considerably both north and south of this particular location (e.g., Figure 1). This suggests that strain rates in the region may exhibit a high degree of spatial variability, and mean strain rate estimates for the entire Basin and
Range province, as well as generalizations concerning the width of the deforming boundary zones, may not be particularly meaningful. Mapping the spatial variability in deformation, and understanding its origins, is an important future goal for Basin and Range studies.
Why is the deformation zone associated with the eastern California shear zone so narrow at the north end of Owens
Valley compared to regions north and south? One possibility is that Long Valley Caldera, part of a long-lived volcanic center active for the last few million years, has locally heated and weakened the crust, focussing deformation in this particular area (Figures 1 and 3).
Slip rate estimates for the individual faults comprising the shear zone can be estimated as follows. South of 37øN, the eastern California shear zone consists of three sub-
parallel faults. From east to west these are the Death Valley-Furnace Creek, Hunter Mountain-Panamint Valley, and Owens Valley-White Mountain fault zones, all northwest to north-northwest striking faults (Figure 1). GPS data fit to an elastic half-space model suggest that the
summed slip rate across the Death Valley-Furnace Creek and Hunter Mountain-Panamint Valley fault zones is 5+1 mm/yr [Bennett et al., 1997]. By differencing our new estimate of total slip rate across the eastern California shear zone (11+ 1 mm/yr)and the published slip rate estimate for the Death Valley and Hunter Mountain systems (5+1 mm/yr), the slip rate of the Owens Valley fault zone south of 37øN would be 6+ 1 mm/yr. Published estimates for the slip rate on the Owens Valley fault zone include 7+1 mm/yr from trilateration data fit to an elastic strain model [Savage and Lisowski, 1995], 4+1 mm/yr from VLBI and SLR data at OVRO and an elastic strain model [Dixon et al., 1995], and 2+1 mm/yr based on geological data [Beanland and Clark, 1994]. Thus the published estimates differ significantly.
North of 37.3øN, the Hunter Mountain-Panamint Valley fault zone disappears in a series of north striking normal faults, near the intersection of the Death Valley- Furnace Creek fault zone and the Fish Lake Valley fault zone (e.g., Figure 1 of Dixon et al., 1995]. Kinematic arguments suggest that essentially all of the motion on the combined Hunter Mountain-Panamint Valley plus Death Valley- Furnace Creek fault zones is transferred into the Fish Lake
Valley fault zone [Dixon et al., 1995; Reheis and Dixon, 1996; Reheis and Sawyer, 1997]. In addition, north of its intersection with the Deep Springs fault (the location of our transect), the Fish Lake Valley fault zone acquires an additional 1 mm/yr of slip, suggesting a total of 6+1 mm/yr if we assume the elastic half-space model of Bennett et al., [1997]. This would suggest that the Owens Valley- White Mountain fault zone north of 37øN slips at a rate of about 5+1 mm/yr (11+1 mm/yr - 6+lmm/yr; Figure 5b). If the Fish Lake Valley fault zone instead slips at 4 mm/yr, which is allowed by available data within 95% confidence, then the slip on this segment of the Owens Valley fault zone would be correspondingly higher, 7 mm/yr, an estimate consistent with the available GPS data if we use
an elastic half-space model (Figure 5c) but inconsistent with available geologic data and inconsistent with the GPS data if we instead use a viscoelastic coupling model (see next paragraph and Figu•'e 5c). For the data in Figure 5b, the best fit (minimum Z ) estimate for the elastic half-space solution is 6+2 mm/yr for the Owens Valley-White Mountain fault zone and 5+2 mm/yr for the Fish Lake Valley fault zone, with reduced Z 2= 0.5. This is essentially identical to the estimate of Savage and Lisowski [1995] for the Owens Valley fault zone south of 37øN based on terrestrial geodetic data and an elastic half space model (7+ 1 mm/yr), recalling the expected rate differential of 1 mm/yr north and south of 37øN.
Our fault slip rate estimate for the Owens Valley-White Mountain fault zone using an elastic half-space model (6+2 mm/yr, or 7+2 mm/yr south of 37øN) is faster than the geologic estimate of 2+ 1 mm/yr [Beanland and Clark, 1994]. Part of this difference could reflect the fact that the geodetic estimate integrates motion across the entire fault zone and is indicative of the overall differential motion at
depth, while the geologic estimate reflects motion on well- developed strands of the fault with surface expression. Dixon et al. [1995] suggested that the Owens Valley fault
DIXON ET AL.: PRESENT-DAY SIERRA NEVADA MOTION 21
is a relatively young feature. Such faults may not have yet developed a clear, throughgoing surface expression, and hence the difference between geodetic and geologic slip rate estimates could be significant.
However, the long-term viscoelastic effects of the 1872 Owens Valley earthquake may also explain part of the discrepancy between the geologic rate and geodetic rates based on an elastic half-space model. We can use the viscoelastic coupling model (equation 3) to investigate this. Rather than use the default parameter values listed in Table 5 to constrain the model, we can exploit the relatively high data density in our transect to estimate some of the poorly determined parameters. Specifically, we fix the date of the last earthquake on the Owens Valley fault zone to 1872, fix the locking depths on the Owens Valley and Fish Lake Valley fault zones to 8 and 12 km [Dixon et al., 1995], and adjust the remaining six parameters to obtain best fit values (two slip rates, two earthquake recurrence intervals, date of last event on the Fish Lake
Valley fault zone, and lower crustal viscosity•. The best fit model is shown in Figure 5c, with reduced Z = 0.65. We obtain slip rates of 3.0+1.9 mm/yr and 8.4+2.0 mm/yr for the Owens Valley and Fish Lake Valley fault zones, respectively. Best estimates for the other parameters are listed in the figure caption. Total right lateral slip rate across both faults in this model, 11.4+ 1.1 mm/yr, is better constrained than the individual fault slip rates, as with the elastic half space model. The velocity profiles for the two faults (Figure 5c) differ greatly, because the Owens Valley fault zone is in the early stages of its earthquake cycle, while the Fish Lake Valley fault zone apparently is in the late stages of its cycle. Applying an elastic half-space model in this case would cause the slip rate of the Owens Valley fault to be over-estimated (due to the "additional" velocity near the fault), and the slip rate on the Fish Lake Valley fault zone to be slightly underestimated. Note also that the summed velocity profile for the two faults is quite asymmetric, and that the Fish Lake Valley fault zone causes significant strain accumulation well east of the fault due to its late stage in the earthquake cycle. For example, 50 km from the fault, a geodetic network spanning a 25 km aperture would experience about 0.5 mm/yr of differential velocity due solely to strain accumulation on the Fish Lake Valley fault zone (see also Savage et al., [1999]). Accurate estimation of slip rates for minor faults in the Basin and Range interior near the western boundary will therefore require an accurate accounting of such viscoelastic effects and the earthquake cycle.
The fault slip rate estimates from our viscoelastic coupling model are in reasonable agreement with geological estimates. The geological estimate for slip on the Owens Valley fault zone south of 37øN (2+1 mm/yr; Beanland and Clark, 1994) is equivalent to our estimate (3.0+1.9 mm/yr + 1 mm/yr = 4+2 mm/yr) within one standard error. Reheis and Sawyer [ 1997] give a detailed slip rate history for various segments of the Fish Lake Valley fault zone. For the main, straight section of the fault zone (Oasis section), the average rate after 620,000 years BP is 9.5+2.2 mm/yr, equivalent to our estimate of present day rate (8.4+2.0 mm/yr) within one standard error. Reheis and
Table 8. Velocity Components Perpendicular and Parallel to Eastern California Shear Zone
Veloci _ty, mm/yr . ab Parallel a'b Perpendicular '
a Velocity relative to stable North America, Table 2. b
Assumed fault azimuth is 333 ø , mean of Owens Valley and Fish Lake Valley fault zones
c Predicted value is from Sierra Nevada Euler vector at a point 36.8øN, 119.5øW.
d Mean velocity from Table 4.
Sawyer note that the slip rate may have varied with time, and may be slower at later times.
The three-dimensional geometry of the faults has been ignored in our simple coupling model. That geometry, as well as better data on earthquake history to constrain the viscoelastic response of the lower crust and reduce the number of adjustable parameters, needs to be incorporated in future models to improve the accuracy of fault slip rate estimates derived from geodetic data. Since the model has some sensitivity to earthquake recurrence interval and date of last earthquake, it is also possible that a dense array of high quality geodetic data could provide useful constraints on these parameters independent of estimates from paleoseismic studies.
Figure 4 is a vector diagram, showing motion of the Sierra Nevada block from our Euler vector (equivalent to integrated Basin and Range deformation), compared to the sum of deformation across major known faults: eastern Basin and Range deformation (velocity of ELYA, essentially representing extension across the Wasatch fault) and strike-slip motion on the Fish Lake Valley and Owens Valley-White Mountain fault zones. The equivalence of the Sierra Nevada vector and the summed deformation vectors (the fit is almost as good if we instead use the fault slip rates estimated from the elastic half space model) suggests that no significant deformation has been missed in this path, equivalent to the statement that there is no significant deformation within the interior of the Basin and Range on this transect, within observational error. However, given error propagation in this vector summation approach, this is not a strong constraint on interior Basin and Range deformation, especially the extensional (east-west) component. Also, as noted above, it assumes a monotonic velocity profile; only dense profiles [Bennett et al., 1998; Thatcher et al., 1999] can test this assumption.
22 DIXON ET AL.: PRESENT-DAY SIERRA NEVADA MOTION
A small amount of extension perpendicular to the trend of the eastern California shear zone is suggested by the difference in fault-perpendicular velocities between ELYA and the central Sierra Nevada (1.8+1.4 mm/yr; Table 8). Most of this extension is accommodated between the Sierra
Nevada and OASI, just east of the Fish Lake Valley fault zone, i.e., extension is likely accommodated on normal faults within Owens Valley and Fish Lake Valley (Figure 3; Table 8). Savage and Lisowski [1995] estimated 1.0+0.3 mm/yr of horizontal extension across Owens Valley using leveling data and an elastic strain model for a dip-slip fault. Active extension here is consistent with the valley's relief, the observed dip-slip component of motion on the Owens Valley fault during the 1872 earthquake [Beanland and Clark, 1994], and observed dip-slip motion on the nearby Independence fault, an active normal fault on the west side of Owens Valley. A small amount of extension (few tenths of mm/yr) also likely occurs across Fish Lake Valley based on geological studies [Reheis and Sawyer, 1997].
We can estimate the amount of net extension between
Fish Lake Valley and ELYA by subtracting extension across Owens Valley (1.0+0.3 mm/yr) and Fish Lake Valley (taken as 0.2-½0.2 mm/yr) from total extension between the Sierra Nevada and ELYA (1.8-½1.4 mm/yr). This gives 0.6+1.4 mm/yr, permissive of the -1 mm/yr of east-west extension across the proposed nuclear waste repository at Yucca Mountain, Nevada estimated by Wernicke et al. [1998].
5. Conclusions
We have derived the first Euler vector describing present-day motion of the Sierra Nevada block using geodetic data from sites located on the stable interior of the block. The data indicate that the block is rigid within velocity uncertainties. Our Euler vector predicts northwest motion of the block relative to stable North America at
faster rates than previous estimates. We see no vertical motion within uncertainties, except at a site within Owens Valley east of the Sierra Nevada block, which may be subsiding. We see no evidence of rapid rotation of the Sierra Nevada block about a proximal pole; rather, it translates nearly parallel to overall plate motion, indicating a distal Euler pole. The new Euler vector can be used as a kinematic constraint for regional tectonic problems. For
example, near Quincy, California, summed right-lateral slip across the Mohawk Valley and Honey Lake fault zones is 8+3 mm/yr, based on the velocity of Quincy and a geologic slip rate estimate for the Honey Lake fault zone. Integrated right lateral slip across the eastern California shear zone in the vicinity of OVRO is 11.4+1.1 mm/yr, based on a velocity transect and a viscoelastic coupling model. Of this total, 3+2 mm/yr is accommodated across the Owens Valley-White Mountain fault zone north of 37øN, and 8+2 mm/yr is accommodated across the Fish Lake Valley fault zone, consistent with geological estimates. Together, these two faults define a region of steep velocity gradient on the eastern boundary of the Sierra Nevada block, spatially coincident with steep gradients in other geophysical parameters such as heat flow. Earthquake history and viscoelastic effects need to be considered in order to obtain
accurate fault slip rate estimates from geodetic data in this region. Vector summation and the kinematic constraint from our Sierra Nevada Euler vector suggest little deformation in the interior of the Basin and Range on one particular transect approximately perpendicular to plate motion through northern Owens Valley, assuming a monotonic velocity profile across the region.
Acknowledgments. We are grateful to the many students and colleagues who contributed to the field campaigns described in this report, including Steve Fisher, Bjom Johns and Karl Feaux of Unavco. High-quality data from permanent stations within the BARD, CORS and IGS networks, and access to archives at JPL, SIO and GSFC were critical to this study. We thank the operators of those networks and archives for generously sharing these data. Measurements between 1993 and 1996 were supported by NASA's Dynamics of the Solid Earth program. The 1998 observations were performed with help from Peter La Femina, Ron Martin and Lena Krutikov, Center for Nuclear Waste Regulatory Analyses, and support of John Trapp and Phil Justus at the U.S. Nuclear Regulatory Commission (NRC), under contract NRC-02-97-009. This paper is an independent product and does not necessarily reflect the views or regulatory position of NRC. Todd Williams and Edmundo Norabuena helped construct several figures. We thank Jim Savage for discussions on viscoelasticity, and Wayne Thatcher, Tom Parsons, Don Argus and Editor Dave Scholl for comments on the manuscript.
References
Argus, D. F., and R. G. Gordon, Current Sierra Nevada-North America motion from very long baseline interferometry: Implications for the kinematics of the western United States, Geology, 19, 1085-1088, 1991.
Argus, D. F., and R. G. Gordon, Tests of the rigid plate hypothesis and bounds on intraplate deformation using geodetic data from very long baseline interferometry, J. Geophys. Res., 101, 13,555-13,572, 1996.
Atwater, T., Implications of plate tectonics for the Cenozoic evolution of western North
Atwater, T., Plate tectonic history of the northeast Pacific and western North
America, Geology of North America, vol. N: Eastern Pacific Ocean and Hawaii, edited by E. L. Winterer, D. M. Hussong, and R. W. Decker, Geol. Soc. Am., Boulder, Colorado, 21-72, 1989.
Beanland, S., and M. M. Clark, The Owens Valley fault zone, eastern California, and surface faulting associated with the 1872
earthquake, U.S. Geol. Surv. Bull., 1982, 29p., 1994.
Bennett, R. A., B. Wernicke, J. Davis, P. Elosgui, J. Snow, M. Abolins, M. House, G. Stirewalt, and D. Ferrill, Global Positioning System constraints on fault slip rates in the Death Valley region, California and Nevada, Geophys. Res. Lett., 24, 3073-3076, 1997.
Bennett, R. A., B. Wernicke, and J. Davis, Continuous GPS measurements of contemporary deformation across the
DIXON ET AL.: PRESENT-DAY SIERRA NEVADA MOTION 23
northern Basin and Range province, Geophys. Res. Lett., 25, 563-566, 1998.
Bennett, R. A., J. Davis, and B. Wernicke, Present-day pattern of Cordilleran deformation in the western United States, Geology, 27, 371-374, 1999.
Blackwell, D.D., J.C. Steele and L.S. Carter, Heat flow patterns of the North American continent; a discussion of the geothermal map of North America, in: Neotectonics of North America, edited by D.B. Stemmons, M.D. Zoback, and D.D. Blackwell, Geol. Soc. Am., Boulder, Colorado, 1991.
Bowden, G. W., A. Donnellan, L. H. Kellogg, D. Dong, and J. B. Rundle, Geodetic measurements of horizontal strain near the
White Wolf fault, Kern County, California, 1926-1993, d. Geophys. Res., 102, 4957- 4967, 1997.
California Division of Mines and Geology, California fault parameters, DMG Open File Report, 96-08, Sacramento, California, 1996.
Chase, C. G., Plate kinematics: The Americas, East Africa, and the rest of the world, Earth Planet Sci. Lett., 37, 355-368, 1978.
Connor, C., Stamatakos, J. A., D. A. Ferril, B. E. Hill, Detecting strain in the Yucca Mountain area, Nevada: Comment, Science, 282, 1007b,1998.
DeMets C., and T. H. Dixon, New kinematic models for Pacific North America motion
from 3 Ma to present: Evidence for steady motion and biases in the NUVEL-1A model, Geophys. Res. Lett., 26, 1921-1924, 1999.
DeMets, C., R. G. Gordon, D. F. Argus, and S. Stein, Current plate motions, Geophys. d. Int., 101,425-478, 1990.
Dixon, T. H., and A. Mao, A GPS estimate of relative motion between North and South
America, Geophys. Res. Lett., 24, 535-538, 1997.
Dixon, T. H., S. Robaudo, J. Lee, and M. Reheis, Constraints on present-day Basin and Range deformation from space geodesy, Tectonics, 14, 755-772, 1995.
Dixon, T. H., A. Mao, and S. Stein, How rigid is the stable continental interior of the North
American plate, Geophys. Res. Lett., 23, 3035-3038, 1996.
Dixon, T. H., A. Mao, M. Bursik, M. Heftin, J. Langbein, R. Stein, and F. Webb, 1997, Continuous monitoring of surface deformation at Long Valley caldera, California, with GPS, d. Geophys. Res., 102, 12,017-12,034, 1997.
Dokka, R. K. and C. J. Travis, Role of the Eastern California shear zone in
Ducea, M. N., and J. B. Saleeby, Buoyancy sources for a large, unrooted mountain range, the Sierra Nevada, California: evidence from xenolith thermobarometry, d. Geophys. Res., 101, 8229-8244, 1996.
Ducker, K., New velocity image of the western US upper mantle: is heat input from below the lithosphere required? Eos Trans. AGU, 79 (45), Fall Meet. Suppl., F-559, 1998.
Freymueller, J. T., M. Murray, P. Segall, D. Castillo, Kinematics of the Pacific-North America plate boundary zone, northern California, d. Geophys. Res., 104, 7419- 7441, 1999.
Goter, S. K., D. Oppenheimer, J. Mori, M. Savage, and R. Masse, Earthquakes in California and Nevada, U.S. Geol. Surv., Open File Rep. 94-967, 1994.
Hawkins, F. F., R. LaForge and R. A. Hansen, Seismotectonic study of the Truckee/Lake Tahoe are, northeastern Sierra Nevada, California, U.S. Bureau Reclamation Seismotectonic Rept., 85-4, 210p., 1986.
Hearn, E. H., and E. D. Humphreys, Kinematics of the southern Walker Lane
Belt and motion of the Sierra Nevada block, California, d. Geophys. Res., 103, 27,033- 27,049, 1998.
Hill, D. P., J.P. Eaton, W. L. Ellsworth, R. S. Cockerham, F. W. Lester, and E. J. Corbett, The seismotectonic fabric of central
California, in The Geology of North America, eds. D. B. Slemmons, E. R. Engdahl, M.D. Zoback and D. D. Blackwell, Geol. Soc. Am., Decade Map Volume 1, 107-132, 1991.
Holt, W. E., and A. J. Haines, The kinematics of northern South Island, New Zealand, determined from geologic strain rates, d. Geophys. Res., 100, 17,991-18,010, 1995.
Humphreys, E. D., and K. G. Ducker, Western U.S. upper mantle structure, d. Geophys. Res., 99, 9615-9634, 1994.
Humphreys, E. D., and R. J. Weldon, Deformation across the western United States: A local estimate of Pacific-North
America transform motion, d. Geophys. Res., 99, 19,975-20,010, 1994.
Jennings, C. W., and G. J. Saucedo, Fault Activity Map of California and Adjacent Regions, With Locations and Ages of Recent Volcanic Eruptions, scale 1:750,000, Calif. Geol. Data Map Ser., map 6, Calif. Div. Of Mines and Geol., Sacramento, California, 1994.
Johnson, H. O., and D.C. Agnew, Monument motion and measurement of crustal
Jones, C. H., J. R. Unruh, and L. J. Sonder, The role of gravitational potential energy in active deformation in the southwestern US, Nature, 381, 37-41, 1996.
Langbein, J. and H. Johnson, Correlated errors in geodetic time series: implications for time dependent deformation, d. Geophys. Res., 102, 591-603, 1997.
Langbein, J., F. Wyatt, H. Johnson, D. Hamann, and P. Zimmer, Improved stability of a deeply anchored geodetic monument for deformation monitoring, Geopbys. Res. Lett., 22, 3533-3536, 1995a.
Langbein, J. O., D. Dzurisin, G. Marshall, R. Stein, J. Rundle, Shallow and peripheral volcanic sources of inflation revealed by modeling two-color geodimeter and leveling data from Long Valley caldera, California, 1988-1992, J. Geopbys. Res., 100, 12,487- 12495, 1995b.
Lee, J., C. M. Rubin, A. Blythe, P. Gans, and A. Calvert, Quaternary faulting history along the Deep Springs fault, California, Geol. Soc. Am. Bull. (in press, 2000).
Li, V. C., and J. R. Rice, Crustal deformation in great California earthquakes, d. Geophys. Res., 92, 11,533-11,551, 1987.
Ma, C., and J. W. Ryan, NASA Space Geodesy Program, GSFC data analysis, VLBI geodetic results, 1979-1998, 1998.
Ma, C., J. W. Ryan, and D. S. Caprette, NASA Space Geodesy Program, GSFC data analysis, 1993, VLBI geodetic results, 1979- 1992, NASA Tech. Memo. TM-104605, 1994.
Mao, A., Geophysical applications of the Global Positioning System, Ph.D. thesis, Univ. Miami, Miami, Florida, 1998.
Mao, A., C. G. A. Harrison, and T. H. Dixon, Noise in GPS coordinate time series, d. Geophys. Res., 104, 2797-2816, 1999.
Marshall, G., J. Langbein, R. Stein, M. Lisowski, and J. Svarc, Inflation of Long Valley caldera, California, Basin and Range strain, and possible Mono Craters dike opening from 1990-1994 GPS surveys, Geophys. Res. Lett., 24, 1003-1006, 1997.
Martinez, L. J., C. Meertens, and R. B. Smith, Rapid deformation rates along the Wasatch fault zone, Utah, from GPS measurements with implications for seismic hazard, Geophys. Res. Lett., 25, 567-570, 1998.
McGill, S., Paleoseismology and neotectonics of the central and eastern Garlock fault, Ph.D. thesis, Calif. Inst. Tech., Pasadena, California, 1992.
McGill, S., and K. Sieh, Holocene slip rate of the central Garlock fault in southeastern
Searles Valley, California, d. Geophys. Res., 98, 14,217-14,231, 1993.
Minster, J. B., and T. H. Jordan, Present-day plate motions, d. Geophys. Res., 83, 5331- 5354, 1978.
Minster, J. B., and T. H. Jordan, Vector constraints on western U.S. deformation
from space geodesy, neotectonics and plate motions, d. Geophys. Res., 92, 4798-4804, 1987.
Moore, J. G., and C. A. Hopson, The Independence dike swarm in eastern California, Am. d. Sci., 259, 24-259, 1961.
Norabuena, E. O., T. H. Dixon, S. Stein, and C. G. A. Harrison, Decelerating Nazca-South America and Nazca-Pacific plate motions, Geophys. Res. Lett., 26, 3405-3408, 1999.
Okada, Y., Internal deformation due to shear and tensile faults in a half-space, Bull. Seismol. Soc. Am., 82, 1018-1040, 1992.
Park, S. K., B. Hirasuna, G. R. Jiracek, and C. Kinn, Magnetotelluric evidence of lithospheric mantle thinning beneath the southern Sierra Nevada, d. Geophys. Res., 101, 16,241-16,255, 1996.
Parsons, T., G. A. Thompson, and R. B. Smith, More than one way to stretch: A tectonic model for extension along the plume track of the Yellowstone hotspot and adjacent Basin and Range province, Tectonics, 17, 221-234, 1998.
Pezzopane, S. K., and R. Weldon, Tectonic role of active faulting in central Oregon, Tectonics, 12, 1140-1169, 1993.
Pollitz, F. F., Gravitational visco-elastic postseismic relaxation on a layered spherical Earth, d. Geophys. Res., 102, 17,921-17,941, 1997.
Pollitz, F. F., and T. H. Dixon, GPS measurements across the northern
Caribbean plate boundary: Impact of postseismic relaxation following historic earthquakes, Geophys. Res. Lett., 25, 2233- 2236, 1998.
Pollitz, F.F., and I.S. Sacks, Modeling of postseismic relaxation following the great
Reheis, M. C., and T. H. Dixon, Kinematics of the eastern California shear zone: Evidence
for slip transfer from Owens and Saline Valley fault zones to Fish Lake Valley fault zone, Geology, 24, 339-342, 1996.
Reheis, M. C., and T. L. Sawyer, Late Cenozoic history and slip rates of the Fish Lake Valley, Emigrant Peak and Deep Springs fault zones, Nevada and California, Geol. Soc. Am. Bull., 109, 280-299, 1997.
Ross, D.C., Correlation of granitic plutons across faulted Owens Valley, California, U.S. Geol. Survey, Pro•ssional Paper 450- D, D-86-D-88, 1962.
Sauber, J., W. Thatcher, S. Solomon, and M. Lisowski, Geodetic slip rate for the eastern California shear zone and the recurrence
time of Mojave Desert earthquakes, Nature, 367, 264-266, 1994.
Savage, J. C., Detecting strain in the Yucca Mountain area, Nevada: Comment, Science 282, 1007, 1998.
Savage, J. C., and R.O. Burfurd, Geodetic determination of relative plate motion in central California, d. Geophys. Res., 78, 832-845, 1973.
Savage, J. C., and M. Lisowski, Strain accumulation in Owens Valley, Bull. Seismol. Soc. Am., 85, 151-158, 1995.
Savage, J. C., and M. Lisowski, Viscoelastic coupling model of the San Andreas Fault along the big bend, southern California, d. Geophys. Res., 103, 7281-7292, 1998.
Savage, J. C., M. Lisowski, and W. H. Prescott, An apparent shear zone trending north- northwest across the Mojave Desert into Owens Valley, Geophys. Res. Lett., 17, 2113-2116, 1990.
Savage, J. C., M. Lisowski, and W. H. Prescott, Strain accumulation across the Wasatch
fault near Ogden, Utah, d. Geophys. Res., 97, 2071-2083, 1992.
Savage, J. C., J. L. Svarc, and W. H. Prescott, Strain accumulation at Yucca Mountain, Nevada, d. Geophys. Res., 104, 17,627- 17,631, 1999.
Shen-Tu, B., W. E. Holt, and A. J. Haines, Contemporary kinematics of the western
United States determined t¾om earthquake moment tensors, very long baseline interferometry, and GPS observations, d. Geophys. Res., 103, 18,087-18,117, 1998.
Sillard, P., Z. Altamimi, and C. Boucher, The ITRF96 realization and its associated
Smith, R. B., and W. J. Arabasz, Seismicity of the Intermontane seismic belt, in Decade Map., vol. 1, Neotectonics of North America, edited by D. B. Slemmons et al., pp. 185-228, Geol. Soc. Am., Boulder, Colorado, 1991.
Sonder, L. J., and C. H. Jones, Western United States extension: How the west was
widened, Ann. Rev. Earth Planet Sci., 27, 417-462, 1999.
Sonder, L. J., P. C. England, and G. A. Houseman, Continuum calculations of continental deformation in transcurrent
environments, d. Geophys. Res., 91, 4797- 4810, 1986.
Thatcher, W., Nonlinear strain buildup and the earthquake cycle on the San Andreas fault, d. Geophys. Res., 88, 5893-5902, 1983.
Thatcher, W., G. R. Foulger, B. R. Julian, J. Svarc, E. Quilty, and G. W. Bawden, Present-day deformation across the Basin and Range province, western United States, Science, 283, 1714-1718, 1999.
Toppozada, T. R., C. R. Real, and D. L. Parke, Preparation of isoseismal maps and summaries of reported effects for pre- 1900 California earthquakes, Open File Report 81-11, 182 p., Calif. Div. Of Mines and Geol., Sacramento, California, 1981.
Tsai, Y., and K. Aki, Source mechanism of the Truckee, California, earthquake of September 12, 1966, Bull. Seismol. Soc. Am., 60, 1199-1280, 1970.
Ward, S. N., Pacific-North America plate motions: New results from very long baseline interferometry, d. Geophys. Res., 95, 21,965-21,981, 1990.
Wells, R. E., C. S. Weaver, and R. J. Blakely, Fore-arc migration in Cascadia and its neotectonic significance, Geology, 26, 759- 762, 1998.
Wemicke, B. and J. K. Snow, Cenozoic tectonism in the central Basin and Range:
Motion of the Sierran-Great Valley block, Int. Geol. Rev., 40, 403-410, 1998.
Wernicke, B., et al., Origin of high mountains in the continents: The southern Sierra Nevada, Science, 271, 190-193, 1996.
Wemicke, B., J. Davis, R. Bennett, P. Elosegui, M. Abolins, R. Brady, M. House, N. Niemi, and J. Snow, Anomalous strain accumulation in the Yucca Mountain area, Nevada, Science, 2 79, 2096-2100, 1998.
Wessel, P., and W. H. F. Smith, New version of generic mapping tools released, Eos Trans. AGU, 76, 329, 1995.
Wills, C. J., and G. Borchardt, Holocene slip rate and earthquake recurrence on the Honey Lake fault zone, northeastern California, Geology, 21, 853-856, 1993.
Working Group on California Earthquake Probabilities, Seismic hazards in southern California earthquakes, 1994-2024, Bull. Seismol. Soc. Am., 85, 379-439, 1995.
Wright, L. Late Cenozoic fault patterns and stress fields in the Great Basin and westward
displacement of the Sierra Nevada block, Geology, 4, 489-494, 1976.
Zhang, J. Y. Bock, H. Johnson, P. Fang, S. Williams, J. Genrich, S. Wdowinski, and J. Behr, Southern California permanent GPS geodetic array: Error analysis of daily position estimates and site velocities, d. Geophys. Res., 102, 18,035-18,055, 1997.
Zumberge, J., M. Heftin, D. Jefferson, M. Watkins, F. Webb, Precise point positioning for efficient and robust analysis of GPS data from large networks, d. Geophys. Res., 102, 5005-5017, 1997.
T. H. Dixon, F. Farina, and H. Wang, Rosenstiel School of Marine and Atmospheric Science, University of Miami, 4600 Rickenbacker Causeway, Miami, FL 33149- 1098. (tdixon•rsmas.miami.edu).
D. Johnson and M. Miller, Department of Geology, Central Washington University, Ellensburg, WA 98926.
(Received November 23, 1998; revised September 13, 1999; accepted October 27, 1999.)


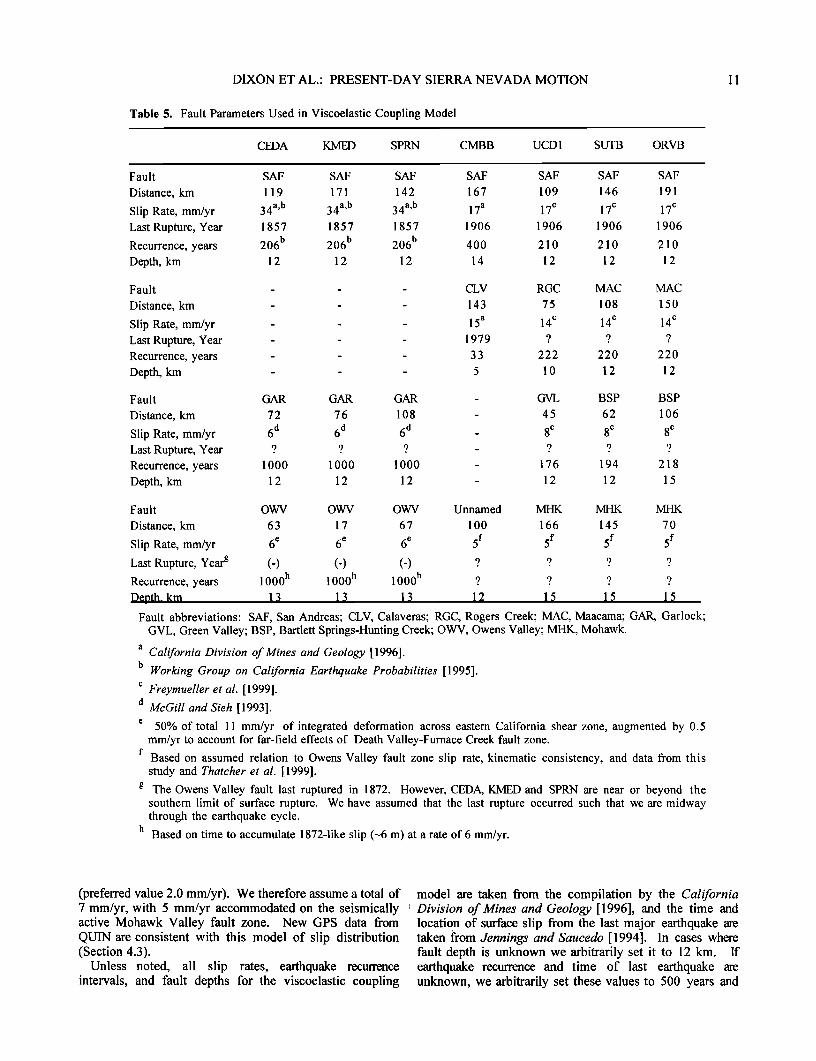


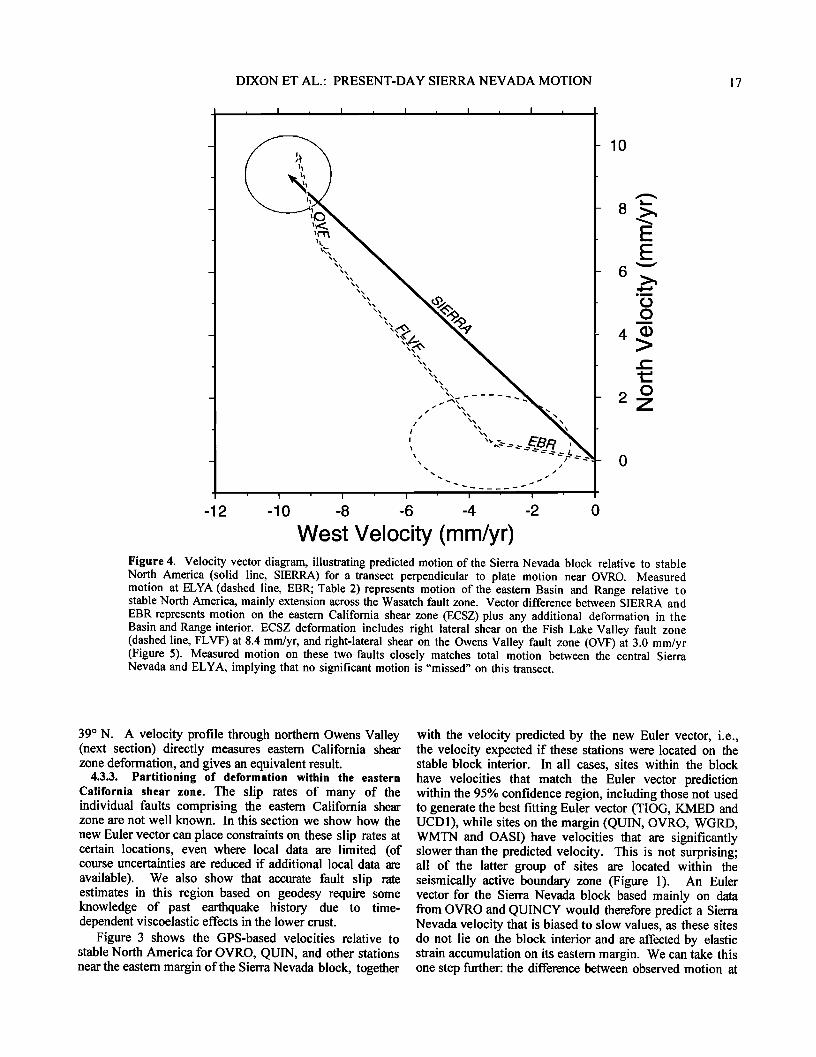
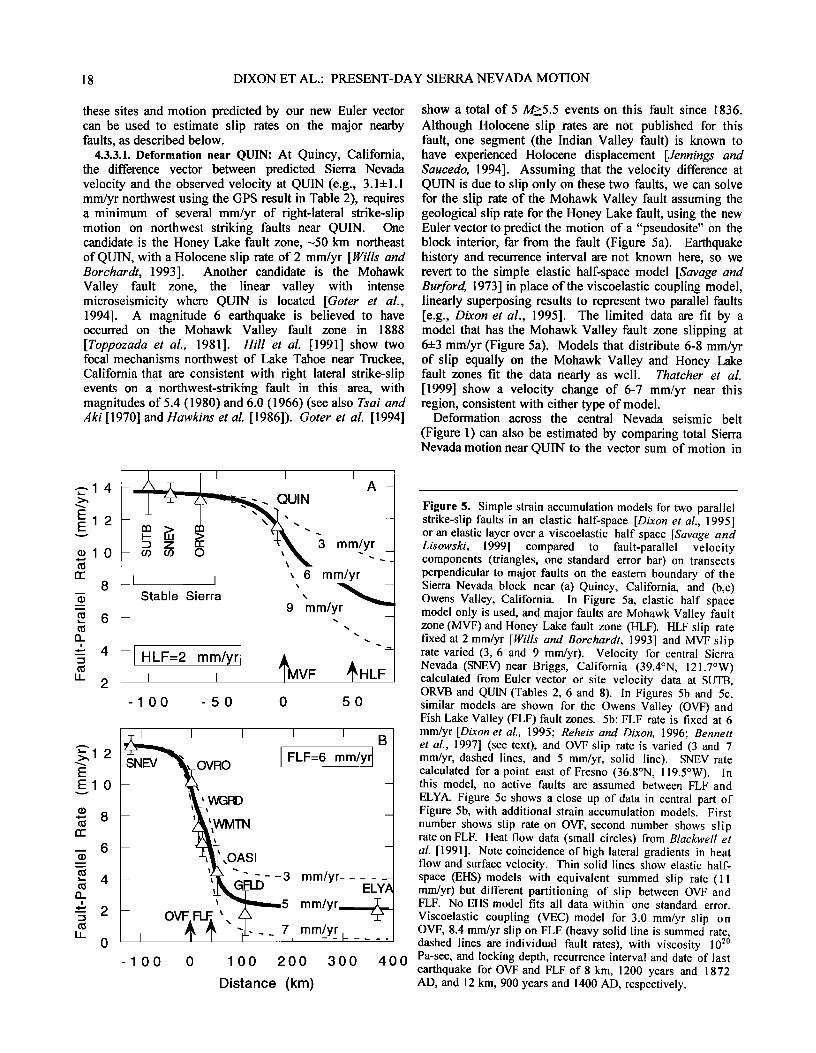


![1 & Measurements Basic Mathematics€¦ · mr 2 2 p / S = mvr Smr2 h I Ø ºŒ ø ßœ = Ø º Œ ø ß œ=-[LT ] - L [T ] 1 1 =Frequency Option (a) is correct. 20. vat b tc = + +](https://static.documents.pub/doc/80x56/5f6226f2a9e371557e19a7f1/1-measurements-basic-mathematics-mr-2-2-p-s-mvr-smr2-h-i-.jpg)


