MARKET VIEW The Quaker Oats Company — The Significant Cost of Valuation Errors The Quaker Oats Company’s $1.7 billion purchase of Snapple in late 1994 stands as one of that decade’s worst acquisitions. With Snapple’s poor oper- ating performance dragging the consolidated operating results down, Quak- er’s stock price stagnated while the Dow Jones industrial average moved up by more than 70 percent. So now that Quaker has sold the beverage company, should Quaker shareholders celebrate? Mourning would be more appropriate. The price Quaker paid for its soft- drink misadventure goes well beyond the $1.4 billion in losses directly asso- ciated with the sale of Snapple to Triarc Company for just $300 million. In addition, Quaker absorbed more than $100 million in cash losses and charges related to Snapple from 1994 to 1997. And since the deal damaged its balance sheet, Quaker’s credit rating suffered, raising its cost of capital. Another cost: Quaker helped pay for the acquisition by selling its petfood and candy businesses that had given it a larger scale, steady earnings, and in- ternational reach. It also paid punishing capital-gains taxes on those sales. The total losses associated with the Snapple acquisition may well exceed the original acquisition price. Adapted from G. Burns, “What Price the Snapple Debacle?” Business Week, 14 April 1997, 42. • • • Financial Review and Pro Forma Analysis 2 15 02-P2013 12/19/2001 5:19 PM Page 15
Transcript
MARKET VIEWThe Quaker Oats Company—The Significant Cost of Valuation ErrorsThe Quaker Oats Company’s $1.7 billion purchase of Snapple in late 1994stands as one of that decade’s worst acquisitions. With Snapple’s poor oper-ating performance dragging the consolidated operating results down, Quak-er’s stock price stagnated while the Dow Jones industrial average moved upby more than 70 percent. So now that Quaker has sold the beverage company,should Quaker shareholders celebrate?
Mourning would be more appropriate. The price Quaker paid for its soft-drink misadventure goes well beyond the $1.4 billion in losses directly asso-ciated with the sale of Snapple to Triarc Company for just $300 million. Inaddition, Quaker absorbed more than $100 million in cash losses and chargesrelated to Snapple from 1994 to 1997. And since the deal damaged its balancesheet, Quaker’s credit rating suffered, raising its cost of capital.
Another cost: Quaker helped pay for the acquisition by selling its petfoodand candy businesses that had given it a larger scale, steady earnings, and in-ternational reach. It also paid punishing capital-gains taxes on those sales.
The total losses associated with the Snapple acquisition may well exceedthe original acquisition price.Adapted from G. Burns, “What Price the Snapple Debacle?” Business Week, 14 April1997, 42.
Why did more than 50 percent of the major mergers and acquisitions inthe United States completed in the 1990s, according to Business Weekmagazine, erode shareholder value? And why did more than 77 percentof those transactions, according to Forbes magazine, not earn a rate ofreturn at least equivalent to the cost of the capital necessary to financethem? The answer to both questions is often the same: overestimation oftarget firm value.
The process of valuing a firm presents innumerable opportunities forerror, and analysts and executives frequently tend to err on the positiveside when assessing firm value. This predisposition to “focus on the goodside of things” has been referred to as the winner’s curse, in that winninga bidding war for an acquisition target may actually mean losing.1
This chapter begins our exploration of the process of valuing a firm.We assume that a target company has been identified and that the ac-quisition appears desirable from a strategic standpoint. Hence, we enterthe valuation process at the point when the question is raised, “Whatdoes the future hold for the target company?” The answer necessitatesa review of the recent past and the development of various scenariosabout the future. In this chapter, we formalize the historical review of anacquisition target by means of financial review, and we articulate the al-ternative future scenarios by means of pro forma analysis.
Specifically, this chapter addresses the following key questions:
• How should the historical financial review of a target company beorganized?
• Which financial ratios should be calculated?
• How can forward-looking pro forma financial statements bedeveloped?
• How can the sensitivity of the pro forma scenarios to key forecastassumptions be evaluated?
Financial Review
Financial review is the process of analyzing, evaluating, and describingthe financial history of a company; it is a key element of the process ofdue diligence that precedes any acquisition offer. Financial review serves
16 Valuation: Avoiding the Winner’s Curse
02-P2013 12/19/2001 5:19 PM Page 16
Financial Review and Pro Forma Analysis 17
four key functions when an acquisition candidate is being valued. First,it provides the necessary information for an acquirer to confirm that atarget company is a financially appropriate and desirable acquisition.Second, it identifies the target company’s financial strengths and weak-nesses, and hence those factors that will enhance or detract from futureconsolidated results. Third, it helps the executive or analyst gain an un-derstanding of the fundamental business model of a target and identifythe key revenue and cost drivers of the business. Finally, it provides a setof benchmark relationships the analyst needs to build a realistic set of proforma financial statements. As we will see below, the common-size state-ments and ratios developed as part of the historic financial review oftenprovide the key percentage estimates and relationships used for buildingpro forma financial statements.
The techniques of financial review are many and varied, hence, welimit our consideration to those techniques most relevant to the valua-tion process: ratio analysis and cash flow analysis. (For further details,see Lev 1974; Ferris, Tennant, and Jerris 1992; Stickney and Brown 1999;and Haskins, Ferris, and Selling 2000.)
Ratio analysis is the process of investigating the relationship be-tween various balance sheet, income statement, and cash flow statementaccounts. Analysts may use ratios to investigate these relationships acrossmultiple time periods through what is commonly called trend analysis orbetween various alternative target companies in what is traditionally la-beled cross-section analysis. In addition to comparing ratios over timefor a given target, or between alternative targets, it is often advisable foran analyst to compare a target company’s ratios to industrywide indices.Standard & Poor’s, Moody’s Investors Service, Value Line, Dun & Brad-street, and The Financial Times, among others, provide industry statis-tics that permit comparisons of a company’s performance against theaverage performance of all companies within a given industry. This typeof comparison enables the executive or valuation analyst to assess therelative performance of a target candidate against a set of comparablecompanies.
Cash flow analysis refers to the process of identifying the varioussources and uses of cash flows of a target company. This analysis enablesthe following questions to be addressed:
• Is the target company generating a positive cash flow from oper-ations (CFFO), and if so, is it generating a positive discretionarycash flow? 2
02-P2013 12/19/2001 5:19 PM Page 17
18 Valuation: Avoiding the Winner’s Curse
• How has the target company been using its available cash re-sources—to retire debt, to repurchase shares, to pay dividends, orto replace property, plant, and equipment?
• How has the target company been financing its capital expendi-tures—from debt, equity placements, operations, or the liquida-tion of noncurrent assets?
• Is the target company likely to need a cash infusion after theacquisition?
As cash is the primary investment attribute of interest to investors, theanalysis of cash flows is particularly significant in the process of financialreview.
Ratio AnalysisProfessional analysts have always faced the problem of deciding how
to organize a financial review of a target company. It is commonly ac-knowledged that the five key areas of interest are firm profitability, ef-fective asset management, liquidity, solvency, and shareholders’ returns.But a coherent framework linking these key areas has been elusive. (Foran international perspective, see Choi et al. 1985.)
One framework that has been successfully implemented is theDuPont Model, so named for the company in which it was developed.This model successfully integrates the areas of profitability and assetmanagement, featuring a company’s return on assets (ROA) as the quin-tessential measure of firm and managerial performance. One advantageof the DuPont Model (see Exhibit 2.1) is that it highlights the importantinterplay between effective asset management and firm profitability,namely, that a company’s ROA can be positively affected by
• increasing the net profit margin on each individual sale transaction,
• increasing the volume of sales transactions (i.e., increasing turn-over), or
• some combination of increasing profit margins and increasingturnover.
In essence, the DuPont Model focuses on evaluating earnings and acompany’s investment in assets—that is, its business or operational risk.It focuses on the income statement and the asset side of the balance sheet.Unfortunately, the model ignores the important issue of how a companyhas financed its investment in assets (i.e., its financial risk)—with debt orequity, and if with debt, whether short-term or long-term debt.
02-P2013 12/19/2001 5:19 PM Page 18
Financial Review and Pro Forma Analysis 19
To overcome this limitation, many analysts have turned to an exten-sion of the DuPont Model known as the ROE Model, or the return onshareholders’ equity model. The strength of the ROE Model is that notonly does it integrate all five areas of analysis, but it is also premised onthe widely held notion that the principal goal of management is to maxi-
Exhibit 2.1 The DuPont Model
Measures of the effectivenesswith which acompany’sassets are usedto producerevenues.
Measures of acompany’s investment in working capital assets necessaryfor sustaining ongoing operations.
Measures of a company’sinvestment inlong-term, revenue-producing assets.
Net Income
Cost ofGoods Sold
S, G, & A*Expenses
InterestExpense
IncomeTaxes
Cash
AccountsReceivable
Inventories
MarketableSecurities
Other
Land
Buildings
Machinery &Equipment
Intangibles
CurrentAssets
TotalAssets
TotalCost
Sales
Sales
Sales
Total AssetTurnover
Return onAssets
Net ProfitMargin
NoncurrentAssets
+
x
÷
÷
–
*S, G, & A expenses are selling, general, and administrative expenses.
02-P2013 12/19/2001 5:19 PM Page 19
20 Valuation: Avoiding the Winner’s Curse
mize shareholder wealth. In essence, the ROE Model is broader in scopethan the DuPont Model, considering the operating, investing, and finan-cial decisions of a business.
The cornerstone of the ROE Model is a single shareholder-focusedindex of firm performance called the return on equity, or ROE:
ROE measures the rate of return generated by a company for its own-ers—the voting (or common) shareholders.3 This return largely dependson two factors: (1) How profitably a company is able to use the assetsthat it has at its disposal, and (2) the relative size of the owners’ invest-ment in the firm. Clearly, the more profitably a company uses its assets,the greater the returns to the owners. A second way that the owners’ re-turns can be maximized, however, is through the use of financial lever-age, or borrowing. If a company can generate a return on its borrowedassets that exceeds its cost of borrowing, then the company can enhanceits ROE by leveraging the owners’ investment. Thus, the ROE Modelhighlights the fact that corporate management can affect shareholderwealth through both its operating decisions and its financing decisions.
These relationships become apparent by decomposing ROE into itstwo principal components—profitability and financial leverage:4
Notice that the first component of ROE is nothing more than a com-pany’s ROA, the cornerstone of the DuPont Model. ROA tells us abouta firm’s profitability, whereas the second component, financial leverage,tells us how the company has been financed and how successfully man-agement has been able to lever the owners’ investment. It is importantto observe that leverage, or the extent to which a company is able to bor-row, is a double-edged sword: Leverage will enhance a company’s ROEonly as long as the cost of borrowing is less than the returns generatedon the borrowed assets; thereafter, leverage will reduce a firm’s ROEand destroy shareholder value.
�Average Total Assets
Average Common Shareholders’ Equity
�Net Income after TaxesAverage Total Assets
ROE � Profitability � Financial Leverage
ROE �Net Income after Taxes � Preferred Stock Dividends
Average Common Shareholders’ Equity
02-P2013 12/19/2001 5:19 PM Page 20
Financial Review and Pro Forma Analysis 21
ROE can be further decomposed by examining the individual factorsthat contribute to a company’s profitability. Firm profitability, as mea-sured by ROA, can be seen to depend on two factors: (1) the relativeprofitability of each sale that a company generates—that is, its net profitmargin, and (2) the number of sales, or turnover, that a company is ableto generate given its existing asset base. These relationships are observ-able by decomposing ROA into its component elements—net profit mar-gin and asset turnover:5
Decomposing ROA into its individual components highlights thetwo principal ways that management can enhance shareholders’ returnsthrough its operating decisions. The above equation reveals, for example,that shareholders’ returns can be positively affected either by increasinga company’s net profit margin or by increasing the number (or volume)of its sales transactions. That is, the higher a company’s net profit mar-gin, the greater will be the shareholders’ returns on any given sale; andthe higher the number of sales that are generated for a given investmentin assets, the greater a firm’s overall profitability.
Returning to our cornerstone ratio and incorporating these latestconcepts yields the following equation:
This equation reveals that the three principal drivers of shareholders’ re-turns are (1) the relative profitability of each sale transaction, (2) thenumber of sale transactions generated given a company’s investment inoperating assets, and (3) the extent to which a company has been ableto successfully lever the shareholders’ investment. Exhibit 2.2 presentsan illustration of how the ROE Model both builds on and extends theDuPont Model.
To illustrate the relationship of these performance drivers, considerthe financial data for Nokia Corporation, one of the world’s leading tele-communications companies, headquartered in Finland. Using data fromthe company’s summary of selected financial information, performanceratios for the period 1994�1997 can be calculated to reveal the trend inNokia’s shareholders’ returns (see the shaded area in Exhibit 2.3). In
Profitability � Net Profit Margin � Asset Turnover
02-P2013 12/19/2001 5:19 PM Page 21
22 Valuation: Avoiding the Winner’s Curse
Exhibit 2.2 The Return on Shareholders’ Equity (ROE) Model
ROE
Return onAssets
FinancialLeverage
Net ProfitMargin
NetIncome
Sales TotalAssets
Sales
TotalCost
Sales NoncurrentAssets
CurrentAssets
Cost of Goods Sold
Interest Expense
Income Taxes
Selling, General &Administrative
Research &Development
Total AssetTurnover
Liquidity
Solvency
Cash
Inventory
Other
AccountsReceivables
MarketableSecurities
Land
Equipment
Building
Intangibles
�
�
��
� �
Exhibit 2.3 Nokia Corporation Return on Equity Analysis
Performance Measure 1994 1995 1996 1997
Net profit margin 8.6% 3.2% 6.5% 10.4%
Asset turnover 1.20� 1.21� 1.19� 1.40�
ROA 10.3% 3.9% 7.8% 14.6%
Financial leverage 2.67� 2.31� 2.22� 2.00�
ROE 27.5% 9.0% 17.2% 29.3%
ROA is return on assets; and ROE, return on equity.
1997, Nokia’s ROE was 29.3 percent, up from 9.0 percent in 1995 and17.2 percent in 1996. (See Appendix 2A for the Nokia data used in thisanalysis.)
To understand the causal factors of this growth, Nokia’s ROE for1997 can be decomposed as follows:
02-P2013 12/19/2001 5:19 PM Page 22
Financial Review and Pro Forma Analysis 23
Considering the company’s trend data in Exhibit 2.3, we see that thegrowth in Nokia’s ROE has largely come from its increasing net profitmargin, up from 3.2 percent in 1995 to 10.4 percent in 1997, and its assetturnover, which increased from 1.21 times in 1995 to 1.40 times in 1997.The company’s financial leverage declined from its 1994 high of 2.67times to 2.00 times in 1997.
Decomposition AnalysisJust as it is possible to decompose ROE into its three key drivers of
profit margin, asset turnover, and financial leverage, so is it possible todecompose each of these three key drivers into their subcomponents.Decomposition analysis is the process of segmenting a component ofROE into its principal subcomponents and in so doing enabling the an-alyst to begin the process of identifying the specific causes of change ineach of the key ROE drivers.
Decomposing Profit Margin. A company’s net profit margin re-veals the relative profitability of its basic operating activity. For the val-uation analyst to be able to identify just which components of operationswere responsible for generating an increase (or decrease) in profitabil-ity, it is instructive for him or her to decompose the net profit margin intothe various subratios that, collectively, comprise this ratio.
The most effective way of decomposing a company’s net profit mar-gin into its subcomponents is by means of common-size income state-ments. In common-size financial statements, all amounts are expressedas a percentage of some base financial statement item. For example, incommon-size income statements all amounts are expressed as a per-centage of net sales. (In common-size balance sheets, all amounts are
ROE29.3%
Return on Assets14.6%
Financial Leverage2.00�
Net Profit Margin10.4%
Asset Turnover1.40�
02-P2013 12/19/2001 5:19 PM Page 23
24 Valuation: Avoiding the Winner’s Curse
Exhibit 2.4 Nokia Corporation Common-Size Income Statements
1994 1995 1996 1997
Net sales 100.0% 100.0% 100.0% 100.0%Cost of goods sold (67.1) (67.1) (69.6) (63.1)
Gross profit 32.9 32.9 30.4 36.9Research and development expense (5.9) (5.0) (6.2) (6.7)Selling, general, and administrative expense (11.8) (9.3) (7.7) (8.9)
Operating profit 15.2 18.6 16.5 21.3Share of results of associated companies 0.1 0.2 0.1 0.1Net financial income 1.7 1.6 1.4 1.5Exchange gains and losses 1.5 0.0 0.1 0.2
expressed as a percentage of total assets.) Trend analysis of common-size income statements permits an analyst to assess how a company’s in-come statement accounts are changing over time relative to sales, andthus how the various income statement items contribute to the net profitmargin. Exhibit 2.4, for example, presents the common-size incomestatement data for Nokia Corporation, 1994�1997.
The data in Exhibit 2.4 reveal the following:
• Nokia’s net income as a percentage of net sales grew from 3.2 per-cent in 1995 to 10.4 percent in 1997.
• Nokia’s cost of goods sold declined from 67.1 percent to 63.1 per-cent over the four years, accounting for most of the company’s in-crease in profitability.
• Research and development costs increased slightly from 5.0 per-cent in 1995 to 6.7 percent in 1997.
02-P2013 12/19/2001 5:19 PM Page 24
Financial Review and Pro Forma Analysis 25
• Selling, administrative, and general expenses declined from 11.8percent in 1994 to 8.9 percent in 1997, accounting for approxi-mately 21 percent of Nokia’s increase in profitability.
• Interest expense generally increased over the four years until1997 when it declined to 1.9 percent, whereas income taxes in-creased from 3.1 to 4.3 percent.
As the above analysis of Nokia’s common-size income statementdata reveals, decomposing the net profit margin enables the analyst toaddress the following questions:
• Is the target company’s net profit margin changing over time? Ifso, what factors are causing the changes: cost of goods sold, re-search and development outlays, selling and administrative costs,interest costs, income taxes, or what?
• How well is the target company management managing its cost ofdoing business? Has the company reached sufficient volume lev-els to gain any economies of scale? In what areas, if any, does thecompany seem to be overspending?
Decomposing Asset Turnover. Asset turnover, or what is some-times called “asset management,” refers to the degree of productivitythat a company is able to achieve with respect to its operating assets. Itis a measure of the effectiveness with which a company’s management isable to employ the valuable resources provided by creditors and ownersalike. Not surprisingly, a strong link exists between the effective use of acompany’s assets and the degree of profitability that a company is ableto achieve. Whereas the net profit margin focuses on the rate at whichprofit is generated from each unit of sales, the asset turnover ratio fo-cuses on the volume of sales generated from a given investment in oper-ating assets. Thus, in Exhibit 2.3, we see that in 1997 Nokia Corporationgenerated 0.104 Finnish markka (FIM) in net profit from each markkaof sales revenue, while generating 1.40 FIM in sales revenue from eachmarkka invested in operating assets. It can be readily seen from this datathat Nokia can increase its return to shareholders either by increasingthe rate of profit per markka of sales or by increasing the number of salesmarkkas generated from its existing investment in operating assets.
The decomposition of asset turnover traditionally focuses on twogroups of assets that are closely linked to the operations of a company:
02-P2013 12/19/2001 5:19 PM Page 25
26 Valuation: Avoiding the Winner’s Curse
the working capital assets, which include cash, trade receivables, and in-ventory; and the noncurrent revenue-producing assets such as property,plant, and equipment. For most companies, analysts usually calculatethe following ratios when determining how effectively corporate man-agement has used a company’s key operating assets:
Working Capital Ratios:
A measure of the value of netsales generated from a given in-vestment in current assets.
A measure of the number ofreceivable collection cycles (i.e.,credit sale S accounts receivableS cash collection) occurring in agiven period of time (usually onequarter or one year).
A measure of the number ofdays, on average, required forcollecting an outstanding accountreceivable, calculated on an an-nual (or quarterly) basis.
A measure of the number ofproduction cycles (i.e., inventoryproduction S sale) occurring in a given period of time (usuallyone quarter or one year).
Inventory Turnover �Cost of Goods Sold
Average Ending Inventory
Receivable Collection Period �365 Days
Receivable Turnover
Accounts Receivable Turnover �Net Sales
Average Accounts Receivable
Current Asset Turnover �Net Sales
Average Current Assets
02-P2013 12/19/2001 5:19 PM Page 26
Financial Review and Pro Forma Analysis 27
A measure of the quantity ofinventory on hand, expressed interms of the number of daysneeded to sell the existing inven-tory, calculated on an annual (orquarterly) basis.
A measure of the number of ac-count payment cycles (i.e., buy in-ventory on credit sell inven-tory payment on account)occurring in a given period of time(usually one quarter or one year).
A measure of the number of days,on average, required for payingan outstanding account payable,calculated on an annual (or quar-terly) basis.
Noncurrent Asset Ratios:
A measure of the value of netsales generated for a given invest-ment in noncurrent assets.
A measure of the value of net salesgenerated for a given investmentin property, plant, and equipment.
Property, Plant, andEquipment Turnover
�Net Sales
Average Property, Plant,and Equipment
Noncurrent Asset Turnover �Net Sales
Average Noncurrent Assets
Days’ Payable Period �365 Days
Payable Turnover
SS
Accounts Payable Turnover �Cost of Goods Sold
Average Accounts Payable
Days’ Inventory on Hand �365 Days
Inventory Turnover
02-P2013 12/19/2001 5:19 PM Page 27
28 Valuation: Avoiding the Winner’s Curse
Exhibit 2.5 Nokia Corporation Asset Turnover Decomposition Analysis
Property, plant, and equipment turnover 6.12� 6.57� 6.68� 8.84�
Several observations about the preceding ratios are noteworthy. First,in most cases, the denominator of each ratio is an average. The purposeof averaging a beginning-of-period and an end-of-period balance is to tryto eliminate the effects of any significant increases or decreases in a givenaccount. For example, it would distort the inventory turnover ratio to di-vide a company’s cost of goods sold by its ending inventory if the firmhad experienced either a dramatic increase or decrease in inventory atyear end; in either case, the inventory turnover ratio would be biased bythe end-of-period contraction/expansion in inventory. Second, not all ofthe above ratios are relevant for all companies. For example, an enter-prise such as The McDonald’s Company, a worldwide chain of fast-foodrestaurants, maintains an insignificant balance in accounts receivable.Few, if any, of the company’s customer sales are undertaken on a creditbasis. Thus, the analysis of receivable turnover for a company like Mc-Donald’s is unnecessary. Third, some of the ratios are merely transfor-mations of other ratios. For example, the days’ inventory-on-hand ratiois merely a transformation of the inventory turnover ratio. It is often un-necessary for analysts to calculate both ratios, although many do. Fourth,it is probably obvious that in almost all cases a high rate of turnover is tobe preferred to a lower rate.6 This generality will hold except in thosecases in which management is liquidating its revenue-producing assets—a dangerous situation for any company in the long term. Finally, theabove set of ratios should not be considered to be exhaustive; analystsfrequently add to and subtract from the above list.
To illustrate the use of these ratios, consider Exhibit 2.5, which showsthe asset turnover ratios for Nokia. The data in Exhibit 2.5 reveal thefollowing:
02-P2013 12/19/2001 5:19 PM Page 28
Financial Review and Pro Forma Analysis 29
• In 1997, Nokia generated 1.84 FIM in net sales for each markkainvested in current assets, up 14 percent from 1.62 FIM in 1996.
• Nokia’s receivable turnover cycle vacillated from a low of 3.85times in 1996 to a high of 4.45 times in 1997. This increase in thenumber of receivable collection cycles is reflected in Nokia’s de-clining receivable collection period, which was down nearly thir-teen days between 1996 and 1997.
• Nokia’s inventory turnover cycle count remained relatively stable(i.e., 2.94 times to 3.39 times) from 1994 to 1996 but increasedmarkedly in 1997 to 4.83 times. The higher the rate of inventoryturnover, the higher the returns to shareholders, unless the higherturnover is achieved by means of price reductions (and hencereduced profit margins). Although Nokia’s 4.83 inventory turnsis quite respectable, it lags the industry average of 6.2 turns, in-dicating that there is still room for improvement. The increasein inventory turnover count is also reflected in a reduced days’inventory-on-hand ratio, which declined from a high of 124 daysin 1995 to 76 days in 1997. This 48-day reduction undoubtedlycontributed to Nokia’s improved profitability in 1997.
• Nokia’s accounts payable turnover declined from 2.88 times in1994 to 2.64 times in 1997. This decline is reflected in an increasein Nokia’s accounts payable period from 127 days to 138 days.When contrasted with Nokia’s average receivable collection pe-riod of 82 days in 1997, this suggests that Nokia is managing itsworking capital flows very efficiently.
• Nokia’s property, plant, and equipment (PP&E) turnover grewsteadily from 6.12 FIM for each markka invested in PP&E in 1994to 8.84 FIM in 1997. This indicates that Nokia increased its effi-ciency with respect to PP&E: The company was able to generatea 44 percent higher volume of sales for an equivalent investmentin PP&E.
The decomposition analysis of Nokia’s asset turnover suggests thatthe increase in the company’s asset turnover from 1994 to 1997 almostcertainly resulted from an improvement in the company’s managementof all key operating asset categories: receivables, inventory, and PP&E.
Decomposing Financial Leverage. Financial leverage refers tothe ability of a company to increase its asset base through borrowing.
02-P2013 12/19/2001 5:19 PM Page 29
30 Valuation: Avoiding the Winner’s Curse
Financial leverage can be a powerful tool for enhancing shareholders’returns, but the effectiveness of leverage in maximizing shareholders’returns is directly linked to the spread between a company’s cost ofborrowing and the returns on those borrowed funds. As this spread de-clines, the ability of financial leverage to enhance shareholders’ returnsalso declines.
The ability of financial leverage to enhance shareholders’ returnscan thus be seen to be a function of a firm’s cost of borrowing and itsreturn on borrowed assets (which we ignore for the moment). Further-more, a firm’s cost of borrowing is directly linked to its ability to ser-vice its existing debt—what is commonly called financial risk. A com-pany with low financial risk (i.e., a high ability to repay debt and debtservice charges) will be able to borrow at a lower cost than a companywith higher financial risk. For this type of company, increases in theamount of leverage will be more effective in enhancing shareholders’returns than will increases in leverage for a company with high finan-cial risk. Hence, one way that analysts evaluate the extent and effective-ness of financial leverage is by evaluating a company’s current financialriskiness.
The analysis of financial leverage usually focuses on two dimensionsof financial riskiness: short-term risk, or liquidity, and long-term risk, orsolvency. For most companies, the following ratios are calculated whenfinancial risk is analyzed:
Short-Term Risk:
A measure of the highly liquidcurrent assets available for re-paying short-term liabilities.
A measure of the cash flow fromoperations available for repayingshort-term liabilities.
Operating Cash Flow Ratio �Cash Flow from Operations
A measure of the relative invest-ment of creditors versus com-mon shareholders in a company.
A measure of the relative invest-ment of long-term creditors ver-sus common shareholders in acompany.
A measure of the extent to whichcurrent operations can supportcurrent debt service charges.
Two observations about the above ratios are useful. First, a com-pany’s short-term obligations can be repaid with cash generated from avariety of sources: future operations, existing liquid assets (as reflectedby the current asset section of the balance sheet), the sale of assets, thesale of stock, or new borrowings. The short-term liquidity ratios focus onthe two sources of liquid resources that are immediately available tomanagers: cash from operations and cash (or other highly liquid currentassets) on hand. Second, the long-term solvency ratios themselves focuson two separate aspects of risk: (1) the ability of a company to cover thecurrent cost of debt from the income generated by existing operations,and (2) the existing level of financial leverage that currently character-izes a company. If a company is already highly leveraged (i.e., already hasa high proportion of assets from creditors), then further financial lever-age will not be as effective in enhancing shareholders’ returns. As statedabove, as the degree of leverage increases, so too does a firm’s riskiness,and lenders will charge commensurately higher interest costs, therebyreducing the utility of additional leverage.
Interest Coverage Ratio �
Income before Taxes� Interest Expense
Interest Expense
Long-TermDebt–to–Equity Ratio �
Long-Term Debt
Common Shareholders’ Equity
Total Liabilities–to–Equity Ratio �Total Liabilities
Common Shareholders’ Equity
02-P2013 12/19/2001 5:19 PM Page 31
32 Valuation: Avoiding the Winner’s Curse
Exhibit 2.6 Nokia Corporation Financial Leverage Decomposition Analysis
Performance Measure 1994 1995 1996 1997
Financial leverage 2.67� 2.31� 2.22� 2.00�
Short-term liquidityQuick ratio 115.8% 86.1% 123.7% 135.9%Operating cash flow ratio 22.5% �4.0% 55.8% 55.5%
Long-term solvencyTotal liabilities–to–equity ratio 119.8% 134.2% 108.8% 93.0%Long-term debt–to–equity ratio 28.6% 18.7% 15.2% 7.6%Interest coverage ratio 6.90� 6.62� 4.04� 8.32�
To illustrate the use of these ratios, consider Exhibit 2.6, which showsa decomposition analysis of Nokia Corporation’s financial leverage ra-tios. The data in Exhibit 2.6 reveal the following:
• Nokia’s use of financial leverage steadily declined from its high of2.67 times in 1994 to 2.00 times in 1997. This decline in the use offinancial leverage is reflected in the significant increases in Nokia’sliquidity and solvency over the same period.
• With respect to liquidity, the quick ratio increased from 115.8 per-cent in 1994 to 135.9 percent in 1997, and the operating cash flowratio increased from �4.0 percent in 1995 to 55.5 percent in 1997.Both ratios indicate improved levels of liquidity, and hence a re-duced use of short-term leverage.
• With respect to solvency, the total liabilities–to–equity ratio de-clined from 119.8 percent in 1994 to 93.0 percent in 1997, and thelong-term debt–to–equity ratio declined from 28.6 percent in1994 to 7.6 percent in 1997. The interest coverage ratio gener-ally increased from 6.90 times in 1994 to 8.32 times in 1997. Thedecline in Nokia’s debt–to–equity ratios and the significant im-provement in the interest coverage ratio indicate a material de-cline in Nokia’s reliance on long-term leverage.
Overall, the decomposition analysis of Nokia’s financial leverage in-dicates a dramatic reduction (i.e., more than 25 percent) in the use of fi-nancial leverage.
Analytical Framework: Putting It All TogetherExhibit 2.7 presents a composite framework for the ratio analysis of
a target company. The framework is premised on the notion that the prin-cipal goal of corporate management is to maximize shareholders’ wealth.
02-P2013 12/19/2001 5:19 PM Page 32
Financial Review and Pro Forma Analysis 33
Exhibit 2.7 ROE Model for Financial Review
• Cost of goods sold ÷ revenues• Gross profit ÷ revenues• S, G, & A ÷ revenues• R & D expense ÷ revenues• Interest expense ÷ revenues• Income before taxes ÷ revenues• Income taxes ÷ revenues
• Quick ratio• Operating cash flow ratio• Total liabilities–to–equity ratio• Long-term debt–to–equity ratio• Interest coverage ratio
Profitability Asset Turnover
Return on Equity
Financial Leverage
S, G, & A is selling, general, and administrative; and R & D, research and development.
As such, the cornerstone of the model is the return on common share-holders’ equity, or ROE. As discussed above, ROE can be decomposedinto the three key drivers of profitability, asset turnover, and financialleverage. And each of the three key drivers can themselves be decom-posed into various subcomponents, as depicted in Exhibit 2.7.
Cash Flow AnalysisWith the exception of the operating cash flow ratio, all of the ratios
discussed thus far are derived from income statement and balance sheetdata. Given that cash is the one asset that a company cannot operatewithout, and that it is the investment attribute of principal interest to in-vestors, the analysis of cash flows is an important component of any finan-cial review. Since the demand for cash flow data has become widespread,most countries now require the presentation of a statement of cash flows(SCF). Where an SCF is not presented, the valuation analyst must havethe necessary skills to prepare one. (Appendix 2B presents a methodol-ogy for the preparation of an SCF from balance sheet and income state-ment data.)
The structure of the SCF worldwide has evolved into a fairly consis-tent presentation composed of three categories:
02-P2013 12/19/2001 5:19 PM Page 33
34 Valuation: Avoiding the Winner’s Curse
• Cash flows from operating activities (CFFO)
• Cash flows from investing activities (CFFI)
• Cash flows from financing activities (CFFF)
The CFFO represents the cash generated from the sale of goods orthe provision of services, less the cash paid for operations— in essence,net income on a modified cash basis. The CFFI, on the other hand, repre-sents the cash paid for intercorporate investments (both short- and long-term), the cash paid for new capital investments, and the cash receivedfrom the sale or disposal of noncurrent assets. Finally, the CFFF repre-sents the cash generated from the sale of stock and from long- and short-term borrowings, less the cash paid for retiring outstanding debt, repur-chasing treasury stock, or paying dividends.
Cash flow analysis enables the analyst to address a variety of keyquestions, such as the following:
• Is the target company generating a positive CFFO, and if so, is italso generating a positive discretionary cash flow?
• What types of strategic investments has the target company beenmaking?
• How has the target company been financing its operations and itsstrategic investments?
• How has the target company financed its dividend payments?
To illustrate this type of analysis, consider Exhibit 2.8, which con-tains the SCF for the Nokia Corporation for 1995�1997; this data re-veals the following:
• Nokia generated a positive CFFO of 10.201 billion FIM in 1997,an increase of about 23 percent over 1996. The company also gen-erated a positive discretionary cash flow of 3.782 billion FIM, cal-culated as follows:
CFFO 10.201 billionLess Dividend payments (1.061)
Debt retirements (2.007)Capital and research and development expenditures (3.351)
Discretionary cash flow 3.782 billion
• Nokia’s 1997 CFFI was a negative 2.972 billion FIM. The com-pany made significant investments in new PP&E (2.402 billion),
02-P2013 12/19/2001 5:19 PM Page 34
Financial Review and Pro Forma Analysis 35
research and development (0.949), and key equity investments(0.552) such as Ipsilon Networks, Inc. These investment outlayswere partially offset by the proceeds generated from disposing ofselect investments (0.425) and certain fixed assets (0.506).
• Nokia’s 1997 CFFF was a negative 2.641 billion FIM, largely be-cause of the company’s continuing program of debt reduction(2.007 billion) and dividend payments (1.061 billion).
Exhibit 2.8 Nokia Corporation Cash Flow Analysis: Consolidated Statements of Cash Flows*
1995 1996 1997
Operating activitiesNet income 1,747 3,263 6,259Depreciation/amortization 1,825 2,236 2,762Deferred income taxes (333) 195 640Equity income, net of dividends (85) (37) (54)Other items 1,566 (331) (283)Net change in operating assets and liabilities 5,351 2,993 877
Net cash provided by operating activities (631) 8,319 10,201
Investing activitiesAcquisitions and investments (96) (175) (552)Proceeds from disposals of investments and
other assets 2,305 (277) 425Purchases of property, plant, and equipment (3,299) (2,028) (2,402)Proceeds from disposals of property, plant,
and equipment 396 293 506Capitalized research and development costs (742) (677) (949)
Net cash used in investing activities (1,436) (2,864) (2,972)
Financing activitiesRetirement of debt (short- and long-term) 1,222 (433) (2,007)Payment from affiliates 145 (605) 355Share issuances 37 — 72Purchases of treasury shares — (210) —Dividends (789) (901) (1,061)
Net cash used in financing activities 615 (2,149) (2,641)
Effect of exchange rate changes on cash and cash equivalents (87) 25 114
Net increase (decrease) during the year (1,452) 3,306 4,588Balance at beginning of year 5,268 4,214 7,545
Balance at end of year 3,729 7,545 12,247
*This data has been reformatted. Values are for year ended 31 December, in millions ofFinnish markka.
02-P2013 12/19/2001 5:19 PM Page 35
36 Valuation: Avoiding the Winner’s Curse
As we shall see in Chapter 3, the link between the SCF and firmvalue will take on particular meaning as we define a company’s free cashflows in terms of its CFFO. With the historical financial review complete,we now turn to the task of generating realistic scenarios about a com-pany’s future operating performance.
Pro Forma Analysis
After completing the historical financial review, the valuation analyst isready to begin developing forward-looking pro forma financial state-ments. Pro forma financial statements are an analyst’s best guess as tohow a target company will perform in the future. These estimates reflectthe likely cost reductions and synergies, as well as revenue enhancements,that an acquiring company can reasonably expect once an acquisition iscompleted.8 Inherent in the process of developing pro forma financialstatements is the necessity of the analyst making numerous assumptionsabout events that have yet to occur. If the valuation analyst is to avoidthe winner’s curse—that is, overpricing a successful acquisition— it is im-perative that he or she base all assumptions on sound logic and reason-ing. When such assumptions are not well conceived, the cost to an ac-quiring firm can be quite significant, as the Quaker Oats vignette at thebeginning of this chapter reveals.
The preparation of pro forma statements is typically a six-stepprocess:
1. Forecast revenues for the target company. The projection of fu-ture revenues is, without question, the single most importantstep in the pro forma process. As this is the starting point, a mis-estimation at this stage will be compounded into a multitude ofother forecasted values. In general, sales are usually forecastedfor three to five years, and possibly as long as ten years. Mostprofessional analysts, however, are considerably reluctant toforecast beyond five years, in large measure because of the highprobability of error in such long-term forecasts.9 As most busi-nesses will have a continuing value beyond the final forecastyear, the analyst must also project a value of the business for allyears subsequent to the final forecast year. This value is knownas the continuing, terminal, or exit value, and the process of es-timating this value is discussed in Chapter 3.
02-P2013 12/19/2001 5:19 PM Page 36
Financial Review and Pro Forma Analysis 37
2. Forecast operating expenses (excluding acquisition financingcosts). The projection of operating expenses includes the prep-aration of forecasts for cost of goods sold, research and devel-opment costs, selling and administrative expenses, and othercontinuing income and expense items. These forecasts shouldinclude the effects of any anticipated cost reductions or econo-mies of scale expected to arise as a consequence of an acquisi-tion. Some operating expenses are relatively easy for an analystto forecast because they are either fixed in amount or vary as afunction of revenues, whereas others are more difficult to pro-ject because they are neither strictly fixed nor strictly variable.A good source of information for help in forecasting operatingexpenses is the historical common-size income statements (seeExhibit 2.4). For those operating expenses that vary in a rela-tively constant relationship with sales, as revealed by a multiyearcommon-size statement analysis, the common-size percentagemay be a useful way for an analyst to forecast these expenses infuture periods.
3. Forecast the change and composition of total assets on the balancesheet. There are two approaches to forecasting assets: (1) Fore-cast total assets and then allocate this total among the individ-ual asset accounts using common-size balance sheet relation-ships (and potentially other assumptions), and (2) forecast theindividual asset accounts and then sum the accounts to arrive ata value for total assets. The first approach is most frequentlyused largely because of its ease in application. It is usually un-dertaken by assuming that most companies maintain a rela-tively constant relation between revenues and total assets (i.e.,a constant total asset turnover ratio). The individual asset ac-counts are then forecasted by reference to various assumptionsabout the growth (or decline) in the various asset accounts andto a target company’s most recent common-size balance sheet.
The second approach to forecasting assets is more complexbut somewhat more refined. For example, it is reasonable to ex-pect that the PP&E turnover ratio would decline with small in-creases in revenues, whereas the current asset turnover ratiowould remain relatively fixed. These expected relationships aremore easily incorporated in the pro forma balance sheet withthe second approach.
02-P2013 12/19/2001 5:19 PM Page 37
38 Valuation: Avoiding the Winner’s Curse
4. Set total equities equal to total assets (from step 3) and forecast thecost of financing the acquisition transaction and the target com-pany’s long-term financing in general. As part of this step, theanalyst will need to forecast any net proceeds from the issuanceand repurchase of capital stock, any net proceeds from the is-suance and retirement of long-term debt, any changes in non�
interest-bearing liabilities (i.e., accounts payable and accruedexpenses), and the target company’s future dividend policy, ifany. At this juncture, it is also appropriate for the analyst todeal with the question of cash surpluses (deficits) relative to thebalance forecasted in step 3. As most companies maintain banklines of credit, one useful assumption is adjusting the amount ofshort-term interest-bearing debt for any cash deficit (or sur-plus) relative to the step 3 forecast.10
5. Complete the pro forma income statement and balance sheet byforecasting interest costs and income taxes.
6. Derive the pro forma SCF from the pro forma income statementsand balance sheets.
Embedded in the above six-step process are a number of subtle decisionsthat are best illustrated by considering an actual situation—to which wenow turn. (Appendix 2D contains alternative approaches to forecastingthe various income statement and balance sheet accounts.)
Developing Pro Forma Financial Statements: An IllustrationTo illustrate the types of forecasting and modeling decisions inher-
ent in the preparation of pro forma financial statements, we begin withExhibit 2.9, which contains the condensed historical income statementsand balance sheets of Nokia Corporation for 1996 and 1997. The task athand is the development of projected financial statements for 1998.
Nokia’s annual report discloses that the company’s five-year annualaverage growth rate for revenues has been approximately 24 percent,although the growth rate from 1996 to 1997 was 34 percent. Standard& Poor’s forecast for growth in the global communications equipmentindustry was 13 percent, whereas BT Alex.Brown, Inc., forecasted netoperating revenue growth for Nokia of 25 percent in 1998.11 BTAlex.Brown’s higher growth rate reflects the company’s “global leader-ship, strong management, and financial flexibility.” 12 For the purposes ofour illustration, we begin by adopting BT Alex.Brown’s operating rev-enue forecast for 1998 and apply it to the data in Exhibit 2.9 (see the
02-P2013 12/19/2001 5:19 PM Page 38
Financial Review and Pro Forma Analysis 39
Exhibit 2.9 Nokia Corporation Historical and Projected Financial StatementsForecasting Revenues, Operating Expenses, and Asset Mix
Historical Projected*
1996 % 1997 % 1998
Income statementNet sales 39,321 100.0 52,612 100.0 65,765 (Step 1)Cost of goods sold (27,360) (69.6) (33,194) (63.1) (41,493) (Step 2)
Gross profit 11,961 30.4 19,418 36.9 24,273
Research and development expenses (2,446) (6.2) (3,539) (6.7) (4,424) (Step 2)
Selling, general, and administra-tive expenses (3,013) (7.7) (4,663) (8.9) (5,829) (Step 2)
Operating profit 6,502 16.5 11,216 21.3 14,020Share of results of associated
Total assets 33,275 100.0 41,738 100.0 52,173 (Step 3)
(continued)
02-P2013 12/19/2001 5:19 PM Page 39
40 Valuation: Avoiding the Winner’s Curse
shaded area, which presents the forecasted outcomes from steps 1, 2, and3 above). To forecast Nokia’s operating expenses (i.e., step 2), we use thecommon-size income statement percentages from 1997. Although thisassumption is likely to be incorrect in that it presumes that all of Nokia’soperating expenses move in a constant proportion to changes in net rev-enues, it is valid for at least some of Nokia’s operating expenses. For thepurposes of step 3, we use the common-size percentages from the 1997balance sheet after assuming that total assets will change in direct pro-portion to net revenues (i.e., a constant total asset turnover ratio); thus,total assets were first projected at a growth rate of 25 percent, and thenthe individual asset account balances were distributed on the basis ofNokia’s 1997 common-size percentages.
For forecasting Nokia’s long-term financing (step 4), the followingassumptions were adopted:
• The company’s 1998 dividend payments remain approximatelythe same amount (1,061 million FIM) as in 1997.
Exhibit 2.9 Nokia Corporation Historical and Projected Financial StatementsForecasting Revenues, Operating Expenses, and Asset Mix (continued)
Short-term borrowing 3,404 3,008Current portion of long-term debt 555 285Accounts payable and accrued
expenses 10,610 14,541Advance payments 338 542
Total current liabilities 14,907 18,376
Total liabilities 17,321 20,019
Total equities 33,275 41,738
Values are in millions of Finnish markka.*All values are rounded to the nearest whole number.
02-P2013 12/19/2001 5:19 PM Page 40
Financial Review and Pro Forma Analysis 41
• The company issues no new shares; any new financing will be un-dertaken with lower costing debt.
• The balance of treasury shares remains unchanged.
• The company’s 1998 non�interest-bearing debt remains the samepercentage of total equities (i.e., 34.8 percent) as in 1997.
• The company maintains constant levels of advance payments,current portion of long-term debt, long-term debt, and otherlong-term liabilities.
For completion of Nokia’s pro forma income statement (step 5), twofinal items need to be forecasted— interest expense and income taxes.The company’s annual report reveals that income taxes average approx-imately 27 percent, and hence this figure is used to forecast 1998 incometaxes (unless a higher or lower rate is anticipated). With respect to in-terest expense, an equation is needed to calculate this expense, as follows:
where ISt is short-term average cost of debt, ILt is long-term average costof debt, STD is short-term debt, and LTD is long-term debt (includingcurrent maturities).
This equation assumes that Nokia’s interest expense is a function ofthe company’s beginning and ending balances of debt, which are aver-aged in the above equation. Nokia’s annual report indicates that thecompany’s weighted average cost of debt was 7.2 and 6.5 percent forshort-term and long-term debt, respectively, during 1997. Given fore-casts of relatively stable interest rates for 1998, these same rates wereadopted for the 1998 forecast. Plugging this data into the equation abovefor the 1998 interest expense yields
and reveals that the year-end balance of short-term debt (STDE) is stillunknown.13 Finding STDE and the interest expense that satisfy the aboveequation with sufficient precision can be conveniently handled by the it-erative calculation feature on a spreadsheet program. (See Appendix 2Cfor the EXCEL™ spreadsheet formulas associated with Exhibit 2.10.)
Exhibit 2.10 presents the final results of our pro forma analysis for1998 for Nokia.14 With an expected revenue growth of 25 percent, our
Interest Expense � 7.2% a 3,008 � STDE
2b � 6.5% a 1,633 � 1,633
2b
Interest Expense � ISt a STDB � STDE
2b � ILt aLTDB � LTDE
2b
02-P2013 12/19/2001 5:19 PM Page 41
42 Valuation: Avoiding the Winner’s Curse
projected results reveal a 33 percent increase in Nokia’s after-tax income,reflecting the presence of certain economies of scale at these highervolume levels. Nokia’s ROE for 1998 is forecasted to increase slightlyto 30.1 percent. The ratios indicate a continuing decline in Nokia’s useof financial leverage, whereas the ROA is projected to be up slightly at
Exhibit 2.10 Nokia Corporation Historical and Projected Financial StatementsForecasting Net Income and Shareholders’ Equity
Historical Projected*
1997 % 1998
Income statementNet sales 52,612 100.0 65,765 (Step 1)Cost of goods sold (33,194) (63.1) (41,493) (Step 2)
Gross profit 19,418 36.9 24,273Research and development expenses (3,539) (6.7) (4,424) (Step 2)Selling, general, and administrative
expenses (4,663) (8.9) (5,829) (Step 2)
Operating income 11,216 21.3 14,020Share of results of associated companies 54 0.1 68 (Step 2)Net financial income 763 1.5 954 (Step 2)Exchange gains 106 0.2 133 (Step 2)
Profit before interest, taxes, deprecia- tion, and minority interest 12,139 23.1 15,174
16.1 percent because of a modest increase in the net profit margin to11.5 percent. The total asset turnover remains constant as a consequenceof our assumptions at step 3.
Having completed the preparation of Nokia’s 1998 pro forma incomestatement and balance sheet, it is now possible for a pro forma SCF to
ROE30.1%
Return on Assets16.1%
Financial Leverage1.87�
Net Profit Margin11.5%
Asset Turnover1.40�
Exhibit 2.10 Nokia Corporation Historical and Projected Financial StatementsForecasting Net Income and Shareholders’ Equity (continued)
Values are in millions of Finnish markka.Shaded areas are forecasted figures for the pro formas.*All values are rounded to the nearest whole number.
02-P2013 12/19/2001 5:19 PM Page 43
44 Valuation: Avoiding the Winner’s Curse
be prepared. Some analysts prefer to actually project a company’s SCF;we believe that it is preferable to develop the statement from existingpro forma income statement and balance sheet data. The latter approacheliminates the need for separately forecasting the effects of exchangerate movements and acquisitions/divestitures. Exhibit 2.11 presents No-kia’s 1998 pro forma SCF and reveals that
• Pro forma 1998 CFFO should total approximately 10.230 billionFIM, providing discretionary cash flows of 4.289 billion FIM:
CFFO 10.230 billionLess Dividend payments (1.061)
Debt retirements —Capital expenditures (4.880)
Discretionary cash flow 4.289 billion
• Pro forma CFFI is expected to be a negative 7.955 billion FIM,and pro forma CFFF is projected to be a negative 1.554 billion
Exhibit 2.11 Nokia Corporation 1998 Pro Forma Statement of Cash Flows
Operating activitiesNet profit 8,354Depreciation/amortization 3,320Equity income (68)Accounts receivables (3,183)Inventories (1,829)Accounts payable and accrued expenses 03,635
FIM, largely because of the assumption of continued dividendpayments.
Although Exhibit 2.11 presents the CFFO and CFFI separately, some an-alysts combine the two cash flow categories for the purposes of preparingthe pro forma SCF. Two arguments are usually cited for not distinguish-ing between operating and investing cash flows. First, the distinction be-tween the CFFO and CFFI is not always informative. For example, thefixed asset investments needed for maintaining a company’s existing pro-ductive capacity are arguably an operating cash flow. Second, there maynot be sufficient information for a clear distinction to be made betweenthe two values in the pro forma SCF. For example, in the developmentof pro forma data, we often do not estimate the depreciation or amorti-zation expense. Consequently, these values are often unavailable for ad-justing either the CFFO or the CFFI.15 Hence, the analyst has two rea-sonable alternatives: (1) Combine the CFFO with the CFFI and not worryabout projecting these noncash items, or (2) project the noncash itemswhen individual values for the CFFO and CFFI are desired. The latteralternative was followed in the Nokia illustration.
As we will see in Chapter 3, separately forecasting the CFFO andCFFI makes the calculation of free cash flows a relatively straightfor-ward exercise and hence is the option we prefer.
Sensitivity Analysis: Alternative Scenarios
Nokia’s 1998 pro forma results presented in Exhibit 2.10 reflect a set ofassumptions about a series of events that have yet to occur. Given thatan analyst cannot know with certainty what the future will hold, it is of-ten instructive for him or her to develop a series of alternative pro formascenarios. For example, for the purposes of Exhibit 2.10, we used the BTAlex.Brown forecast of net operating revenues of 25 percent. If this es-timate proves incorrect, our projected 1998 value for Nokia also will beincorrect. As a consequence, most valuation analysts try to build a rangeof probable values for an acquisition target based on a series of proforma scenarios. For example, we might want to recalculate our proforma analysis using a forecast of operating revenues that is somewhatlower and higher than 25 percent, perhaps 13 percent for a lower bound-ary (Standard & Poor’s forecast) and 34 percent for a higher boundary(the growth achieved between 1996 and 1997). Rerunning the spread-
02-P2013 12/19/2001 5:19 PM Page 45
46 Valuation: Avoiding the Winner’s Curse
sheet program enables the valuation analyst to assess the effect of thesealternative rates of sales growth:
Rate of Growth Pro Forma Pro Formain Sales Sales Net Income
13% 59,452 7,597
20% 63,134 8,038
25% 65,765 8,354
30% 68,396 8,669
34% 70,500 8,921
Thus, we can see that for each 1 percent change in the rate of sales growth,there is an approximate 526 million FIM change in sales and 63 millionFIM change in net income.
It is also instructive to revisit some of the other key assumptions in-herent in our original pro forma analysis to assess the sensitivity of thecompany’s valuation to alternative assumptions. For example, our equa-tion for the estimation of Nokia’s interest expense for 1998 was premisedon the assumption that short- and long-term interest rates from 1997would persist through 1998. The valuation analyst might reestimate thecompany’s pro forma results assuming an interest rate increase of, say,fifty basis points (i.e., one-half of 1 percent), and for a similar decrease.Rerunning the spreadsheet analysis reveals that there is an approximate11 million FIM decline in net income for each fifty-basis-point increasein the short-term interest rate, and only a 6 million FIM decline in netincome for a similar increase in the long-term rate.
Rerunning the pro forma analysis for multiple values of the variouskey assumptions can be time-consuming. As a consequence, some ana-lysts prepare only three separate scenarios involving the key assump-tions: a “most likely” scenario, an “optimistic” scenario, and a “pessi-mistic” scenario. This strategy is certainly less time intensive in that itrequires only three iterations of the forecast model; however, it is not al-ways costless, in that the dynamic interaction of the key assumptionscannot be rigorously explored. For this reason, analysts are increasinglyturning to Monte Carlo simulation analysis to fully explore the effect ofthe key pro forma assumptions. Let’s illustrate how we can simulate ourforecast with @Risk, a widely used simulation package.
The key assumptions of our model are the sales growth and the short-term and long-term interest rates. In our sensitivity analysis, we chose13 percent as a lower boundary and 34 percent as an upper boundary for
02-P2013 12/19/2001 5:19 PM Page 46
Financial Review and Pro Forma Analysis 47
the growth rate, and we assumed that interest rates could increase (or de-crease) by fifty basis points. We might want to investigate how net salesand net profits change when the sales growth rate varies between 13 and34 percent and, simultaneously, the short-term and long-term interestrates increase or decrease by fifty basis points.
Before simulating, the distributions of the sales growth rate andthe short-term and long-term interest rates must be defined. For salesgrowth, we choose a triangular distribution, with a minimum of 13 per-cent, a most likely value of 25 percent, and a maximum of 34 percent. Forthe short-term interest rate, we use a uniform distribution, with a mini-mum of 6.7 percent and a maximum of 7.7 percent. Similarly, for the long-term interest rate, we choose a uniform distribution, with a minimum of6 percent and a maximum of 7 percent.16 The results of the Monte Carlosimulation reveal that
• Nokia’s net sales varies between 59,570 and 70,441 million FIM,whereas net profits vary between 7,608 and 8,915 million FIM.
• The tornado graph17 (not presented) indicates that the effect ofthe growth in sales on forecasted sales and profit is high, as the cor-relation is close to 1. On the other hand, the effect of short-termand long-term interest rates on forecasted sales and profit is low.It is positive for sales, whereas it is negative for profit (an increasein interest rates leads to a decrease in profit).
Although reviewing the sensitivity of assumptions inherent in a proforma analysis can be tedious, it provides the valuation analyst with crit-ical insight regarding the relative importance of each of his or her as-sumptions. The exercise also enables the analyst to build a range of proforma values that will have the highest likelihood of occurring and, in sodoing, will provide the highest probability of the analyst avoiding thewinner’s curse.
Summary
In this chapter we considered the related processes of financial review andpro forma analysis. Financial review refers to the process of analyzing,evaluating, and describing the financial history of a target and is an inte-gral part of the due diligence investigation that should precede any ac-quisition. Financial review also provides essential inputs for the prepa-
02-P2013 12/19/2001 5:19 PM Page 47
48 Valuation: Avoiding the Winner’s Curse
ration of pro forma financial statements that are necessary for firm valueto be assessed. Although much is made about selecting an appropri-ate valuation multiple or discount rate, nothing is more important in as-sessing firm value than a complete and accurate modeling of a target’soperations.
In Chapter 3, we link the construction of pro forma financial state-ments to our ultimate goal of assessing firm value.
Notes1. See Varaiya and Ferris (1989). The winner’s curse has also been referred
to as the “performance extrapolation hypothesis,” which suggests that biddersoverextrapolate past performance when assessing the value of a potentialacquiree.
2. Discretionary cash flows (DCF) are defined as follows:
DCF � CFFO � Dividend Payments � Debt Retirement � Capital Expenditures to Replace Used-Up Capacity
In essence, a company’s DCF is that amount remaining from the cash flow fromoperations (CFFO) after all required cash outflows are deducted. It representsthe surplus cash flow that management has at its disposal to undertake some dis-cretionary act—retire debt early, retire stock, acquire another company—with-out relying on incremental external funding. We differentiate between a firm’sdiscretionary cash flows and its free cash flow, which will be defined in Chapter 3.
3. Preferred stock dividend distributions are not tax deductible in mostcountries. In those countries (e.g. Germany) in which preferred stock dividends(PD) are tax deductible, a tax adjustment of 1 minus the effective tax rate (tx)must be incorporated into the calculation of ROE as follows:
4. For convenience, we assume from this point forward that our samplefirm has only common stock outstanding, and hence preferred stock dividendsare ignored.
5. Some analysts question the internal consistency of ROA as a measure ofprofitability. Their concern stems from the fact that the traditional accountingincome statement deducts an opportunity cost for debt capital (i.e., “interest ex-pense”) but makes no similar deduction for the opportunity cost of equity capi-tal. These analysts believe that a more consistent measure of firm profitability isgiven by unlevered ROA, or UROA:
where tx is effective tax rate.
UROA �Net Income After Taxes � Interest Expense 11 � tx 2
Average Total Assets
ROE �Net Income After Taxes � PD 11 � tx 2Average Common Shareholders’ Equity
02-P2013 12/19/2001 5:19 PM Page 48
Financial Review and Pro Forma Analysis 49
UROA is a measure of firm profitability before interest charges. The ad-justment for taxes is designed to recognize the tax benefit resulting from the in-terest expense deduction. Another refinement some analysts use is to replaceaverage total assets with the sum of shareholders’ equity and interest-bearingdebt—that is, to eliminate those assets obtained through non�interest-bearingdebt. This refinement creates a measure called return on net assets (RONA):
6. It is not true, however, that a high rate of payable turnover is always pre-ferred to a lower rate.
7. A close variant of the quick ratio is the current ratio, measured as cur-rent assets divided by current liabilities. The quick ratio is generally preferredto the current ratio because the current ratio includes all current assets, some ofwhich (e.g., inventory and prepaid expenses) are not always liquid.
8. For most acquirers, the preparation of pro forma financial statements isexecuted in two phases: Phase one involves the preparation of a “base case”forecast of a target, ignoring any cost reductions, synergies, or revenue en-hancements that are likely to result as a consequence of the merger. This bench-mark forecast is usually a simple extrapolation of recent operating results, onan “as is” basis. Phase two involves the preparation of pro formas for any value-enhancing consequences related to cost reductions, synergies, and/or revenueenhancements that the acquirer hopes to realize after the successful acquisitionand integration of the target. Total firm value is then the aggregate of the twoseparate forecasts.
9. HOLT Value Associates, Inc., a valuation consulting company, preparesforecasts of up to forty years for potential acquisitions. The company hasachieved considerable success using a mean-reversion model for its forecast pe-riods beyond ten years.
10. Forecasting the balance sheet is usually more challenging than the in-come statement because it rarely balances. For instance, forecasted total assetsexceeding the sum of forecasted total liabilities and shareholders’ equity indi-cates a need for additional financing for covering a forecasted growth in assets.The easiest way for coping with this imbalance is to create a “line-of-credit”account— in essence, a plug figure. If the line-of-credit account requires a posi-tive (credit) balance for balancing the balance sheet, it implies that the companyneeded additional financing; on the other hand, if the line-of-credit account re-quires a negative (debit) balance, the company will presumably produce excessliquid funds that can be used to pay off other interest-bearing debt. In either case,it will be necessary for the analyst to include the line-of-credit account in calcu-lating interest charges in step 5 of the pro forma development process to ensurea correct forecast of interest charges.
11. Standard & Poor’s, Industry Surveys: Communications Equipment,16 October 1997.
RONA �Net Income After Taxes � Interest Expense 11 � tx 2
Shareholders’ Equity � Debt
02-P2013 12/19/2001 5:19 PM Page 49
50 Valuation: Avoiding the Winner’s Curse
12. BT Alex.Brown, “The Information Age Goes Wireless,” 18 September1997.
13. Nokia’s long-term debt of 1,633 is the sum of the company’s “currentposition of long-term debt” (285) and “long-term debt” (1,348).
14. As a reality check for our pro forma financial statements, Nokia re-ported the following actual results for 1998:
Net sales 79,231
Net profits 10,408
Total assets 59,660
CFFO 10,029
Thus, with the exception of the CFFO, our 1998 forecast was quite conservative.15. Projecting the depreciation and amortization expense can be easily un-
dertaken although several additional assumptions are required. For example, itis necessary to assume an average remaining life for the asset category, a methodof depreciation and amortization (usually straight-line), salvage value (usuallyzero), and the acquisition date for any additions to the asset category (usually ahalf-year convention).
16. As we do not know what the distributions for sales growth and short-term and long-term interest rates are, we prefer to use a distribution that doesnot require strong assumptions, such as the normal distribution. The triangulardistribution seems appropriate for sales growth as it assumes that the possiblevalues range between a minimum (13 percent) and a maximum (34 percent),with a high probability for the most likely value (25 percent) to be observed. Theuniform distribution seems more appropriate for the short-term and long-terminterest rates, as they are allowed to vary between a minimum and a maximum,with equal probability.
17. A tornado graph allows one to study the effect of each input on theoutput.
02-P2013 12/19/2001 5:19 PM Page 50
Consolidated Profit and Loss Account*
1993 1994 1995 1996 1997
Net sales 23,697 30,177 36,810 39,321 52,612Cost of goods sold (16,662) (20,234) (24,703) (27,360) (33,194)
Gross profit 7,035 9,943 12,107 11,961 19,418Research and development expense (1,332) (1,766) (1,834) (2,446) (3,539)Selling, general, and administrative
expense (3,242) (3,572) (3,436) (3,013) (4,663)
Operating profit before interest, tax, and depreciation 2,461 4,605 6,837 6,502 11,216Share of results of associated
Shares (as of 31 December 1997):Common Number 78,687,000
Price per share 390 FIMPreferred Number 221,165,000
Price per share 387 FIMEarnings per share 21.17 FIMDividend per share 7.50 FIM
*Data were prepared using international accounting standards (IAS) and have been reformatted.Values are for year ended 31 December, in millions of Finnish markka.
Total current liabilities 11,520 11,319 15,955 14,907 18,376
Total liabilities 15,600 14,876 18,533 17,321 20,019
Total equities 22,647 27,849 32,761 33,275 41,738
†Includes preferred share capital 556 777 951 999 1,106
*Prepared using international accounting standards (IAS). Values are for year ended 31 Decem-ber, in millions of Finnish markka.
52 Valuation: Avoiding the Winner’s Curse
02-P2013 12/19/2001 5:19 PM Page 52
Appendix 2BPreparation of Statement of Cash Flows
53
The demand for cash flow data has become so prevalent that most countries nowrequire a statement of cash flows (SCF). Some countries, however, require thepresentation of an SCF only for publicly traded companies (i.e., Argentina, Den-mark, and Japan) or for large companies (Finland, Hong Kong, Ireland, Norway,Singapore, Sweden, and the U.K.), and the list of countries not requiring an SCF(i.e., Belgium, France, Germany, India, Italy, Luxembourg, The Netherlands,and Switzerland) is dwindling. Nonetheless, the valuation analyst must be pre-pared to develop an SCF from available financial data either when an SCF is notpresented or when a statement of fund flows (SFF) is presented instead. In thisappendix, a methodology for coping with these situations is presented.
Cash Flow Fundamentals
To prepare an SCF, the analyst needs the following data: (1) an income state-ment for the current period, and (2) the balance sheets as of the beginning andthe end of the accounting period. With only these three financial statements, theanalyst can prepare an approximate SCF using the four-step process outlinedbelow. A more complete SCF is possible where detailed data are given in thefootnotes to the financial statements.
To begin, recall that the fundamental accounting equation for the balancesheet is given as
Assets � Liabilities � Owners’ Equity, or
A � L � OE
Substituting the major components of a company’s assets, liabilities, andshareholders’ equity into this equation yields the following:
CA � NCA � CL � NCL � CS � RE
02-P2013 12/19/2001 5:19 PM Page 53
54 Valuation: Avoiding the Winner’s Curse
where CA is current assets, NCA is noncurrent assets, CL is current liabilities,NCL is noncurrent liabilities, CS is capital stock, and RE is retained earnings.
Decomposing the current asset category into cash (C) and all other currentassets (OCA) yields yet another version of the fundamental accounting equation:
C � OCA � NCA � CL � NCL � CS � RE (2B.1)
At this juncture, it is helpful to recognize that an SCF is nothing more thana formal explanation of the positive and negative changes to a company’s cashaccount. The SCF merely lists where a company’s cash inflows came from andhow the various cash amounts were used. Having access to a company’s internalaccounting records would make the preparation of an SCF a simple exercise;it would involve merely listing the various inflows and outflows to the company’scash account. Such access is rarely available, however, and thus a methodol-ogy is needed so that the analyst can estimate this data from available financialinformation.
Because an SCF is merely a listing of the various changes in a company’scash account, it can be expressed in its simplest form by the following equation:
CashE � CashB � �Cash (2B.2)
where B is the beginning of the accounting period, E is the end of the account-ing period, and � is change.
Using a few basic algebraic concepts, it is possible to redefine Equation2B.2 in terms of Equation 2B.1. Putting the subscripts B and E on the elementsof Equation 2B.1 yields
CB � OCAB � NCAB � CLB � NCLB � CSB � REB
and
CE � OCAE � NCAE � CLE � NCLE � CSE � REE
Isolating CB and CE on the left-hand side of these two equations yields
CE � CLE � NCLE � CSE � REE � (OCAE � NCAE)
and
CB � CLB � NCLB � CSB � REB � (OCAB � NCAB)
Subtracting the second from the first equation above yields
Equation 2B.3 is a more explicit, formalized version of Equation 2B.2, andthus both are representations of the SCF. More importantly, Equation 2B.3 pro-vides a very simple approach to the preparation of an SCF: In words, it tells usthat an SCF can be prepared by merely listing the changes in all of the balancesheet accounts.
02-P2013 12/19/2001 5:19 PM Page 54
Financial Review and Pro Forma Analysis 55
From this observation, we can now formulate a four-step procedure for cre-ation of a basic but instructive SCF:
1. Identify the change in the cash and cash equivalents account.* This fig-ure represents the “bottom line” of the SCF: All increases and de-creases in cash must net to this figure. It is a check figure for verifyingthe accuracy of the cash flow analysis.
2. Calculate the change in all balance sheet accounts by subtracting thebeginning balance from the ending balance.
3. Identify each balance sheet account with the activity most closely re-lated to it: operations (O), investing (I), or financing (F). As a generalrule, the following associations are usually made, although exceptionswill exist:
Operations: RE, OCA, CL
Investing: NCA
Financing: NCL, CS
4. Place each of the individual balance sheet accounts (except cash) un-der one of three activity categories and identify whether the change inthe account balance involved a cash inflow or outflow. (Recall that thetotal sources and uses of cash must aggregate to the check figure iden-tified in step 1.)
An Illustration
To illustrate the four-step process for building an SCF, we consider the financialstatements of Worldwide Enterprises, Inc. (WWE), presented in Exhibits 2B.1and 2B.2. Exhibit 2B.1 presents WWE’s comparative balance sheets for 1999and 2000, and Exhibit 2B.2 presents WWE’s income statement for 2000.
1. The check figure for WWE’s SCF is a decrease of 45.6 million (i.e.,34.5 � 80.1). Thus, WWE’s cash outflows must have exceeded its in-flows by 45.6 million.
2. Calculate the change in all balance sheet accounts by subtracting thebeginning (1999) balance from the ending (2000) balance; these valuesare presented in Exhibit 2B.1 under the column headed by the �.
3. Identify the activity category associated with each individual balancesheet account (this is done in the far right column of Exhibit 2B.1). Itis important to note that judgment calls are necessary at this step. Forexample, even though most current liabilities, such as accounts payable
*Cash equivalents are short-term (i.e., three months or less), risk-free (i.e., local govern-ment– issued) securities.
02-P2013 12/19/2001 5:19 PM Page 55
56 Valuation: Avoiding the Winner’s Curse
Exhibit 2B.1 Worldwide Enterprises, Inc., Comparative Balance Sheets (in millions)
As of 31 DecemberActivity
2000 1999 � Category*
AssetsCash and cash equivalents 34.5 80.1 (45.6)Marketable securities 100.8 0.9 99.9 IReceivables 299.7 240.3 59.4 OInventories 286.2 765.9 (479.7) O
Liabilities and shareholders’ equityNotes payable and current long-term debt 162.6 435.3 (272.7) FOther current liabilities 457.5 828.3 (370.8) O
Total current liabilities 620.1 1,263.6
Long-term debt 1,090.2 1,752.6 (662.4) FDeferred income taxes 148.8 107.1 41.7 OOther debt 24.6 27.3 (2.7) F
Total noncurrent liabilities 1,263.6 1,887.0
Shareholders’ capital 883.8 862.2 21.6 FRetained earnings 307.8 37.8 270.0 O
Total shareholders’ equity 1,191.6 900.0
Total equities 3,075.3 4,050.6
*O is operations; I, investing; and F, financing.
Exhibit 2B.2 Worldwide Enterprises, Inc., 2000 Income Statement (in millions)
Net revenues 1,737.9Less operating expenses* (1,341.9)
Income from continuing operations 396.0Equity in loss of unconsolidated subsidiary (75.0)
Net income 321.0Less dividends paid (51.0)
Transferred to retained earnings 270.0
*Includes depreciation expense of 30.
02-P2013 12/19/2001 5:19 PM Page 56
Financial Review and Pro Forma Analysis 57
and accrued liabilities payable, are typically associated with a com-pany’s operations, some current liabilities (e.g., the current portion oflong-term debt) are more correctly considered to be related to financ-ing. Similarly, marketable securities, a current asset, may be consideredrelated to operations in some company settings but related to invest-ing in others. Without specific knowledge of the transactions that gaverise to a particular account, it is difficult to be certain of an account’sproper classification. A misclassification of an account will not lead toan unbalanced SCF but merely a misspecification of the relative totalsof the three activity categories.
4. Exhibit 2B.3 contains the preliminary SCF, derived from changes in thebalance sheet accounts organized under the three activity categories.Remember that an increase (decrease) of an asset is a use (source) ofcash, whereas an increase (decrease) of a liability is a source (use) ofcash. Note that the total of the three activity categories equals thechange in the cash account (i.e., a decrease of 45.6 million), and thisensures that the analysis was performed correctly.
Exhibit 2B.3 Worldwide Enterprises, Inc., Preliminary Statement of Cash Flows (in millions)*
Operating activitiesRetained earnings 270.0Receivables (59.4)Inventories 479.7Other current liabilities (370.8)Deferred income taxes 41.7
Financing activitiesNotes payable and current long-term debt (272.7)Long-term debt (662.4)Other debt (2.7)Contributed capital 21.6
Cash flow for financing (916.2)
Change in cash and cash equivalents (45.6)
*Figures in parentheses denote a cash outflow.
02-P2013 12/19/2001 5:19 PM Page 57
58 Valuation: Avoiding the Winner’s Curse
We can conclude from the preliminary SCF in Exhibit 2B.3 that WWE gen-erated cash flows from operations (CFFO) of 361.2 million and cash flows frominvesting (CFFI) of 509.4 million, while spending 916.2 million on financing ac-tivities (principally the retirement of debt). For many financial analyses, the pre-liminary SCF will be sufficient; however, in other circumstances, a more exactingestimate of a company’s SCF is desirable and can be prepared using other avail-able information. In the preparation of Exhibit 2B.3, only WWE’s balance sheetdata were used, and this SCF can be refined by incorporating the income state-ment data from Exhibit 2B.2. For example, Exhibit 2B.2 reveals that WWE’s2000 net income was 321.0 million and dividends paid amounted to 51.0 million.Note that these two amounts net to the change in the retained earnings accounton the balance sheet (i.e., 321.0 � 51.0 � 270.0). Thus, by substituting these twonew figures for the retained earnings figure in our initial SCF in Exhibit 2B.3, weare able to produce a refined measure of the company’s cash flows. The restatedfigures are as follows:
Original Adjustment Revised
Operations 361.2 �270.0 in retained earnings�321.0 2000 net income 412.2
Observe that the inclusion of the additional income statement data did notchange the check figure—a decrease in cash of 45.6 —but did result in a restate-ment of the CFFO and the cash flows from financing (CFFF). Our restated figuressuggest that the CFFO was actually 412.2 million, as opposed to 361.2 million,and the CFFF was a negative 967.2 million instead of a negative 916.2 million.This refinement did not change the CFFI.
Another common refinement that the analyst should undertake involves de-preciation and amortization. It is well known that depreciation is an accrual ac-counting concept in which the original cost for acquiring a depreciable asset isallocated over the many periods that one is expected to benefit from the asset.Thus, depreciation expense is the portion of an asset’s cost allocated to a givenaccounting period; it represents neither a current cash inflow nor a current cashoutflow but merely an allocation of a cash expenditure made in a prior period.
Since depreciation is one of the largest expense items deducted in arrivingat periodic net income, it is usually necessary for the analyst to adjust net in-come for this item in order to avoid understating the actual cash flow from op-erations. Exhibits 2B.1 and 2B.2 reveal the change in property and equipment,net of accumulated depreciation, and current depreciation expense, respectively.Using T-accounts to help visualize the events that led to these ending balances,we can assess the cash flow effects of these accounts as follows:
02-P2013 12/19/2001 5:19 PM Page 58
Financial Review and Pro Forma Analysis 59
Property and 2000Equipment (net) Depreciation Expense
12/31/99 Balance 571.230.0
2000 Purchases 41.430.0
12/31/00 Balance 582.6
Without reference to the current depreciation charge of 30.0 million, ourinitial conclusion from Exhibit 2B.3 was that 11.4 million was spent for newproperty and equipment (i.e., an outflow of cash). By including the depreciationexpense, we see that the actual cash expended for new capital equipment was41.4 million, and with these two figures we are able to further refine our prelim-inary SCF from Exhibit 2B.3:
The inclusion of the depreciation expense does not change the bottom-linecheck figure of 45.6 but does result in a modification of the CFFO and the CFFI.Our restated figures suggest that the CFFO was 442.2 and the CFFI was 479.4.This refinement did not affect the CFFF.
A final modification to our preliminary SCF is possible by incorporating thefact that WWE’s 2000 net income of 321.0 million includes 75.0 million repre-senting WWE’s “equity in loss of unconsolidated subsidiary.” To obtain an ac-curate estimate of only WWE’s CFFO, analysts frequently remove those incomeor loss items relating to affiliated or associated companies. In this instance, the75.0 million reduction in WWE’s net income should be removed and transferredto the investing activities section as an adjustment to the “investments account.”This modification produces the following restated amounts:
Adjustment Revised
Operations 442.2 �75.0 equity in subsidiary loss 517.2Investing 479.4 �75.0 adjustment to “investments” 404.4Financing (967.2) (967.2)
Change in cash (45.6) 0 (45.6)
02-P2013 12/19/2001 5:19 PM Page 59
60 Valuation: Avoiding the Winner’s Curse
Exhibit 2B.4 Worldwide Enterprises, Inc., Statement of Cash Flows (in millions)
Operating activitiesNet income 426.01
Receivables (59.4)Inventories 479.7Other current liabilities (370.8)Deferred income taxes 41.7
Incorporating these three modifications into Exhibit 2B.3 provides the final ver-sion of WWE’s SCF, which is presented in Exhibit 2B.4.
The above three examples involving retained earnings (net income and div-idends), property and equipment (depreciation and purchases), and equity inthe earnings of a subsidiary readily illustrate the benefit of extending the prelimi-nary SCF when additional data are available. The inclusion of income statementand footnote data enables the analyst to build a relatively accurate estimate of acompany’s SCF.
Direct versus Indirect Methods. Although no additional informationis available for further refinement of WWE’s SCF, a final consideration involvesthe presentation format of the operations section of the SCF. Two alternativeapproaches exist for presenting the CFFO: the direct method and the indirectmethod.
Although these two approaches to formatting the operations section of theSCF originated in the United States, they have gained widespread acceptance in
02-P2013 12/19/2001 5:19 PM Page 60
Financial Review and Pro Forma Analysis 61
those countries that require the presentation of an SCF as a basic financial state-ment. Most companies that present an SCF usually prefer the indirect method,which is the format adopted in Exhibit 2B.4; however, most professional ana-lysts prefer to use the direct method because of the additional insights that thisformat provides regarding a company’s operations.
To illustrate how a direct-method version of the CFFO would be con-structed, we begin with the major elements of WWE’s income statement (seeExhibit 2B.2) and then adjust these elements for the various balance sheet ac-counts that relate to them. Thus, for example, operating revenues would be ad-justed for the change in receivables, and operating expenses for the change ininventory, deferred income taxes, other current liabilities, and, of course, de-preciation expense:
AccrualIncome Direct
Statement Adjustment Method
Net revenues 1,737.9(59.4) Increase in receivables
Cash flow from operating revenues 1,678.5Operating expenses 1,341.9
(479.7) Decrease in inventory370.8 Decrease in other current liabilities(41.7) Increase in deferred income taxes(30.0) Depreciation expense
Cash flow for operating expenses (1,161.3)Cash flow from
operations 517.2
Note that under either the direct or the indirect method, WWE’s CFFO re-mains the same (i.e., 517.2 million); however, under the direct method, the re-arrangement of data allows us to identify two additional cash flow items: cashflow from operating revenues (1,678.5) and cash flow for operating expenses(�1,161.3). These two figures can be quite revealing about a company’s internaloperations. For example, the relationship of cash operating revenues to accrualoperating revenues (i.e., 1,678.5/1,737.9) reveals the rate at which cash is pro-duced for each dollar of sales— in this case, about 96.6 percent. Analysts oftenuse this ratio to assess the quality of a company’s revenue recognition policy.In general, the higher the relationship between cash and accrual revenues, thehigher the quality of a company’s revenue recognition policy. In this case, the re-lationship is quite strong— it approaches 100 percent—and thus we would con-clude that WWE’s revenue recognition policies were appropriate and could berelied upon in forecasts of future revenues. When the relation is low (i.e., ap-
02-P2013 12/19/2001 5:19 PM Page 61
62 Valuation: Avoiding the Winner’s Curse
proaching 70 percent or less), it often indicates that the company is using an ag-gressive revenue recognition policy and consequently may be recording accrualsales in advance of the receipt of cash on those sales. When this occurs, it is re-ferred to as front-end loading and may indicate that current revenues are an in-appropriate basis for forecasting future revenues.
The relationship between cash operating expenses and accrual operatingexpenses can similarly be used for evaluation of a company’s expense recogni-tion policy. For most companies, the relation of its cash to accrual operating ex-penses (i.e., 1,161.3/1,341.9) will be less than 1, in large measure because of theadjustment for such noncash expenses as depreciation, amortization, and thechange in deferred income taxes; however, where this relation is substantiallygreater than 1, it may be indicative of rear-end loading. Rear-end loading oc-curs when a company incurs significant cash expenditures that are accountedfor as assets rather than expenses. In some instances, the capitalization of suchexpenditures to the balance sheet is justified, whereas in others it may not be.In any case, when the relation of cash operating expenses to accrual operatingexpenses is large, most professional analysts see a “red flag” requiring furtherinvestigation.
The topics of front-end loading and rear-end loading are important due dili-gence considerations as the valuation analyst reviews the accounting policies anacquisition target uses. We will return to these issues again in Chapter 5.
Converting the SFF
In a number of countries, accepted accounting practice calls for the presentationof a statement of fund flows (SFF) instead of an SCF. This is not problematic forthe valuation analyst because the SFF frequently contains all of the necessaryinformation for preparation of an SCF. Whereas the SCF presents and reconcilesthe various changes to a company’s cash account, the SFF presents and recon-ciles the various changes to a company’s net working capital (i.e., current assetsminus current liabilities) or some similar measure of “funds.” The SFF is, thus,just a more broadly defined financial statement; the SCF is more narrowly de-fined, considering only cash flows. Since the SFF considers a broader definitionof “funds flow,” a company’s cash flows are captured within this broader defini-tion, and the analyst’s task is to “tease” the cash flow information from the SFF.
To illustrate the conversion of an SFF to an SCF, we consider the data pre-sented in Exhibit 2B.5. Part A of this exhibit presents the consolidated state-ment of sources and applications of funds for Pirelli S.p.A., an Italian manufac-turer of vehicle tires; Part B presents the same information reorganized into anindirect-method SCF. As always, the preparation of Pirelli’s SCF requires thatcertain assumptions be made (e.g., the “changes in other provisions” relates tooperating activities), and the transformation from an SFF to an SCF requires areinterpretation of the sign of certain account balances (e.g., the decrease in in-
02-P2013 12/19/2001 5:19 PM Page 62
Financial Review and Pro Forma Analysis 63
ventories is reported as a negative balance in Part A but a positive balance inPart B). The preparation of Pirelli’s SCF requires only a reorganization of ex-isting figures.
Pirelli’s SCF in Part B shows several new facts that were disguised by theSFF presentation in Part A:
• Despite net losses in both 1992 and 1993, Pirelli generated a positiveCFFO in both years.
• The debt reduction (short- and long-term) observable in both Parts Aand B was financed by a combination of cash flow from new share is-suances and from operations.
• The proceeds from Pirelli’s disposal of investments and fixed assets waslargely used to fund new capital investment.
Exhibit 2B.5 Pirelli S.p.A.
A. Consolidated Statement of Sources and Applications of Funds (in millions of lire) 1993 1992
SourcesNet loss for the year (95,839) (154,008)Depreciation and amortization 557,099 531,080Changes in provisions relating to personnel 36,832 (57,190)Disposal of investments 424,171 292,854Net book value of fixed assets disposed of 203,728 231,685Changes in other provisions (115,840) (19,570)
Total sources 1,010,151 824,851
ApplicationsIncrease in property, plant, and equipment 358,964 293,847Increase in intangible assets 15,602 35,576Increase in financial assets — 4,978Increase (decrease) in inventories (86,810) (172,837)Increase (decrease) in trade and other accounts
Financed byShare capital increase 117,369 518,621Increase (decrease) in short-term financial payables (366,343) (366,488)Increase (decrease) in long-term financial payables (602,477) (789,779)Decrease (increase) in cash and cash equivalents 310,749 363,036
(540,702) (274,610)
(continued)
02-P2013 12/19/2001 5:19 PM Page 63
64 Valuation: Avoiding the Winner’s Curse
Exhibit 2B.5 Pirelli S.p.A. (continued)
B. Statement of Cash Flows (in millions of lire) 1993 1992
Cash flows from operating activitiesNet loss for the year (95,839) (154,008)Depreciation and amortization 557,099 531,080Increase (decrease) in inventories 86,810 172,837Increase (decrease) in trade and other accounts
receivable/payable (142,914) (277,240)Changes in provisions relating to personnel 36,832 (57,190)Changes in other provisions (115,840) (19,570)
Cash flow from operations 326,148 195,909
Cash flows from investing activitiesDisposal of investments 424,171 292,854Net book value of fixed assets disposed of 203,728 231,685Increase in property, plant, and equipment (358,964) (293,847)Increase in intangible assets (15,602) (35,576)Increase in financial assets 0 (4,978)Other applications (including exchange differences) (38,779) (111,437)
Cash flow from investing 214,554 78,701
Cash flow from financingShare capital increase 117,369 518,621Increase (decrease) in short-term financial payables (366,343) (366,488)Increase (decrease) in long-term financial payables (602,477) (789,779)
Cash flow from financing (851,451) (637,646)
Decrease (increase) in cash and cash equivalents (310,749) (363,036)
• The positive CFFO in 1992 and 1993 resulted largely from the add-backof depreciation and a net decrease in trade and other receivables, andnot from the company’s basic operations. (Pirelli reported a net lossfrom operations in both years.)
Summary
The purpose of this appendix has been to present a simple four-step process tohelp analysts prepare an SCF. A thorough financial analysis would be incom-plete without a review of a company’s cash flows. Valuation analysts must havethe skill to prepare a pro forma SCF from pro forma balance sheet and incomestatement data as the pro forma cash flow data will be central to any target firmvaluation, as we will see in Chapter 3.
D52 � D5351 Current maturities 285 � B5152 Accounts payable 14,541 � B52/B56 � C52 # D3853 Advance payment 542 � B5354 Total current 18,376 � SUM(D50:D53)55 Total debt 20,019 � D49 � D5456 Total equities 41,738 � D38
R&D is research and development; S, G, & A, selling, general, and adminstrative; EBITDA,earnings before interest, taxes, depreciation, and amortization; and PP&E, property, plant, andequipment.
66 Valuation: Avoiding the Winner’s Curse
02-P2013 12/19/2001 5:19 PM Page 66
Account Basis for Forecast
• Sales revenue • Historical trend; third-party forecast; historical trendadjusted for industry outlook and/or inflation rate.
• Cost of goods sold • Constant percentage of sales revenue (i.e., fromcommon-size income statement); percentage of salesrevenue adjusted for expected economies (or dis-economies) of scale; historical growth rate adjusted forinflation.
• Depreciation expense • Constant (i.e., a fixed cost); gross PP&E divided by aver-age expected life (see footnotes to the financial state-ments) plus one-half of new capital expenditures forPP&E divided by average expected life (i.e., assumingstraight-line depreciation and half-year convention).
• Amortization expense • Constant (i.e., a fixed cost); gross intangible assets di-vided by average expected life plus one-half of new intan-gible asset investment divided by average expected life.
• Selling, general, and • Constant percentage of sales revenue; percentage of administrative expenses sales revenue adjusted for expected decrease (increase)
in spending, as revealed in annual report or other publicsources of information; historic growth rate adjusted forinflation.
• Interest expense • Weighted-average cost of short-term debt times averageoutstanding balance of short-term debt plus weighted-average cost of long-term debt times average outstand-ing balance of long-term debt.
• Income tax expense • Net income before taxes times statutory tax rate (i.e.,federal, state, and local); net income before taxes timesaverage effective tax rate as revealed in annual report orother public sources.
• Cash • Constant percentage of total assets; historical growthrate.
• Trade receivables • Constant percentage of total assets; historical receiv-able turnover or historical growth rate (if forecastedindividually).
• Inventory • Constant percentage of total assets; historical inventoryturnover.
• Prepaid and other • Constant percentage of total assets.current assets
• Investments • Constant; constant percentage of total assets; constantadjusted for any publicly disclosed future acquisitions ordivestitures.
• Property, plant, and • Constant; constant percentage of total assets; constant equipment PP&E turnover ratio; constant adjusted for any publicly
disclosed capital expenditures or divestitures.
• Intangible assets • Constant; constant percentage of total assets.
• Total assets • Constant total asset turnover; constant adjusted forpublicly disclosed expenditures (divestitures) of specificassets; historic growth rate.
• Trade payables • Constant percentage of total assets; historic payableturnover.
• Short-term debt • Constant percentage of total assets; a plug for balancingforecasted balance sheet.
• Current maturities of • Constant; constant adjusted for repayment schedule if long-term debt revealed in footnotes to the financial statements.
• Accrued expenses • Constant; constant percentage of total assets or total payable current assets.
• Long-term debt • Constant; constant adjusted for change in current matu-rities; a plug for balancing forecasted balance sheet(when short-term debt is not plug).
• Contributed capital • Constant; constant adjusted for publicly disclosed stockplacements; historic growth rate.
• Retained earnings • Beginning balance plus forecasted earnings less fore-(ending) casted dividends.
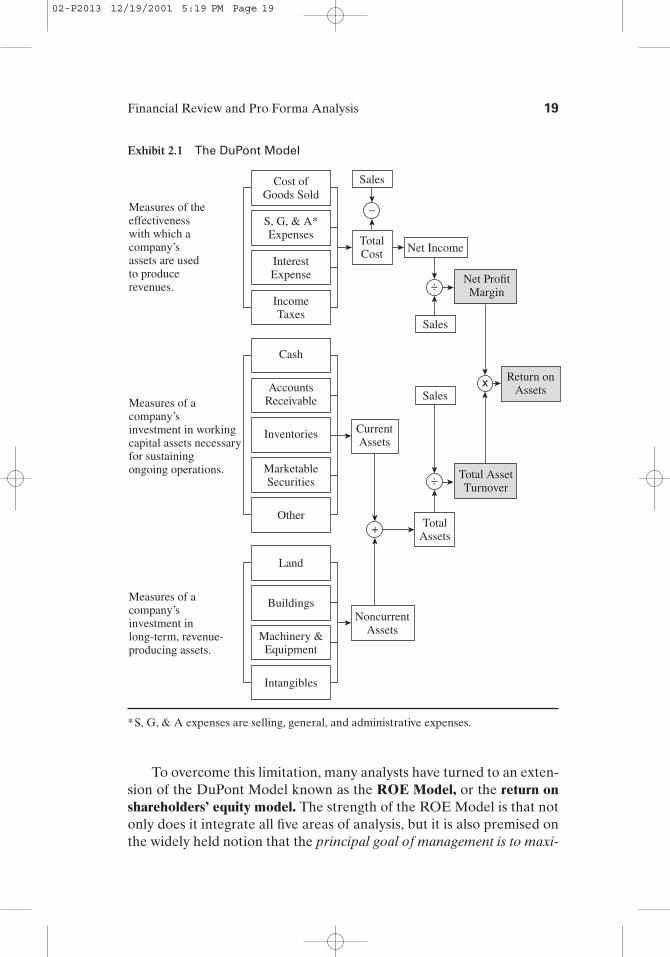

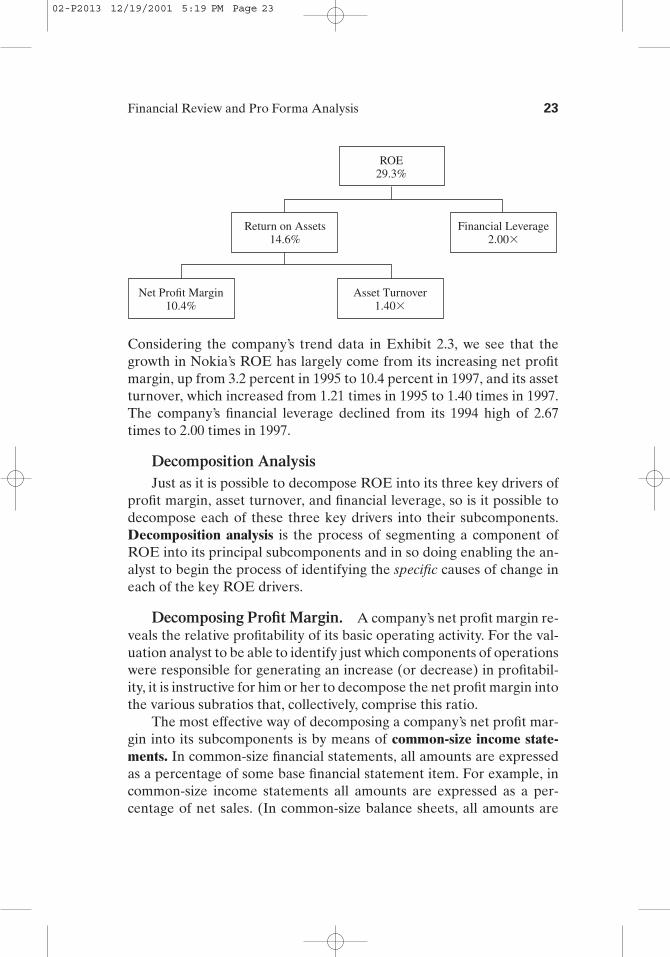
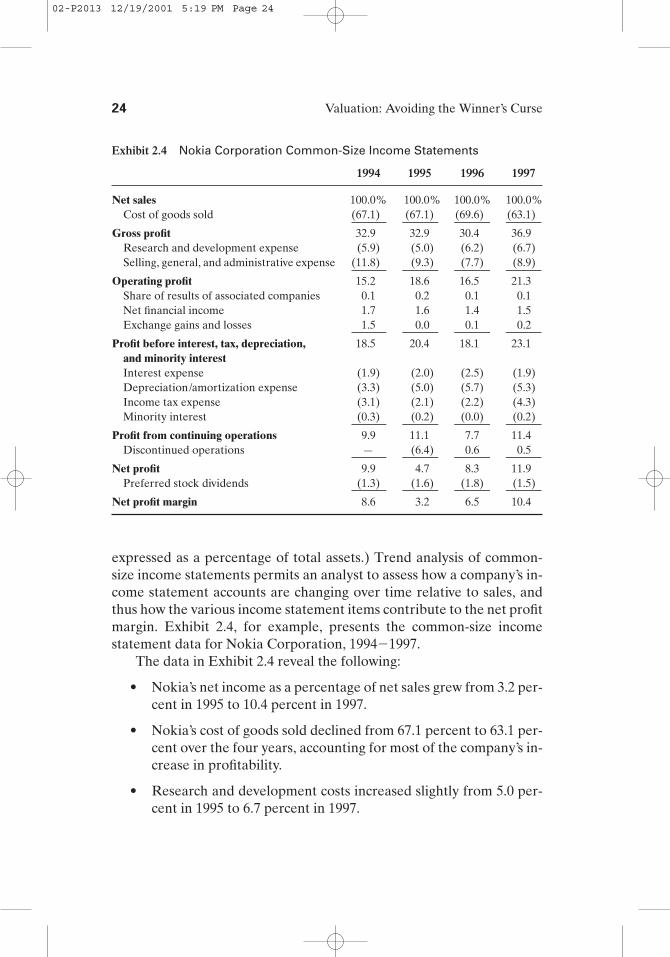
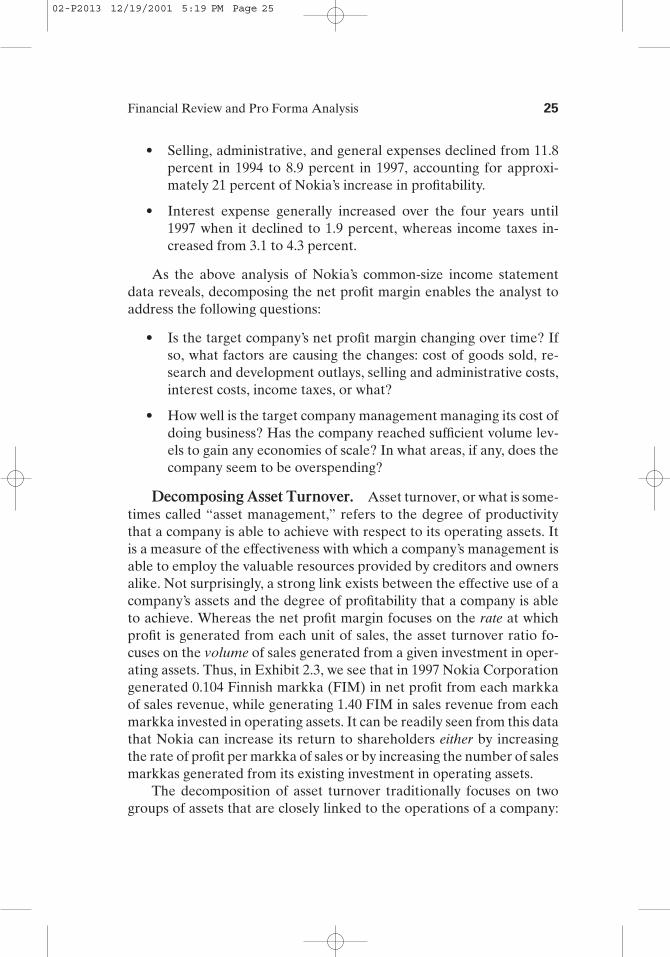
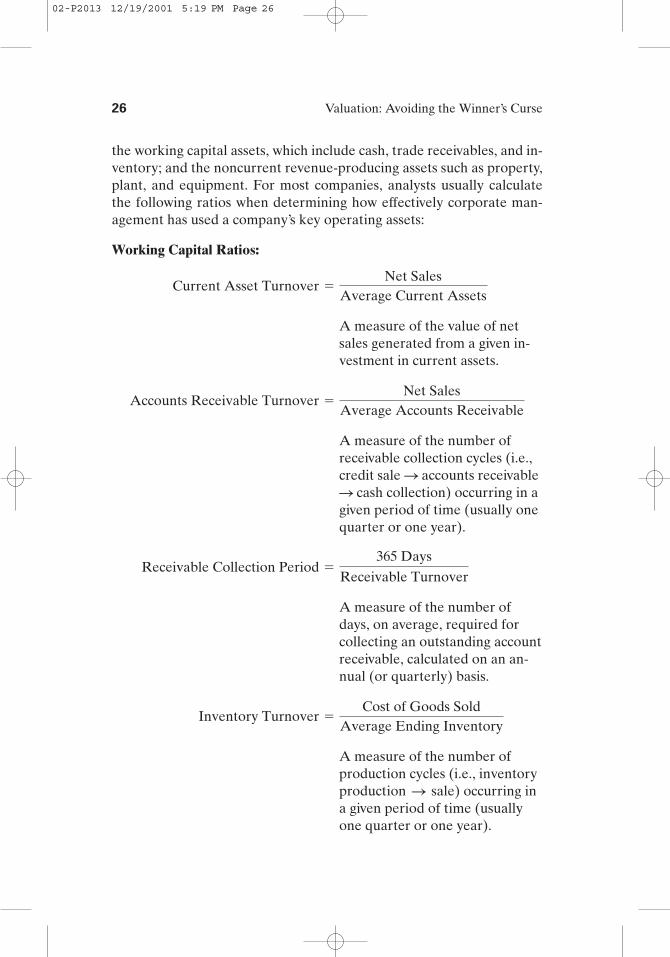
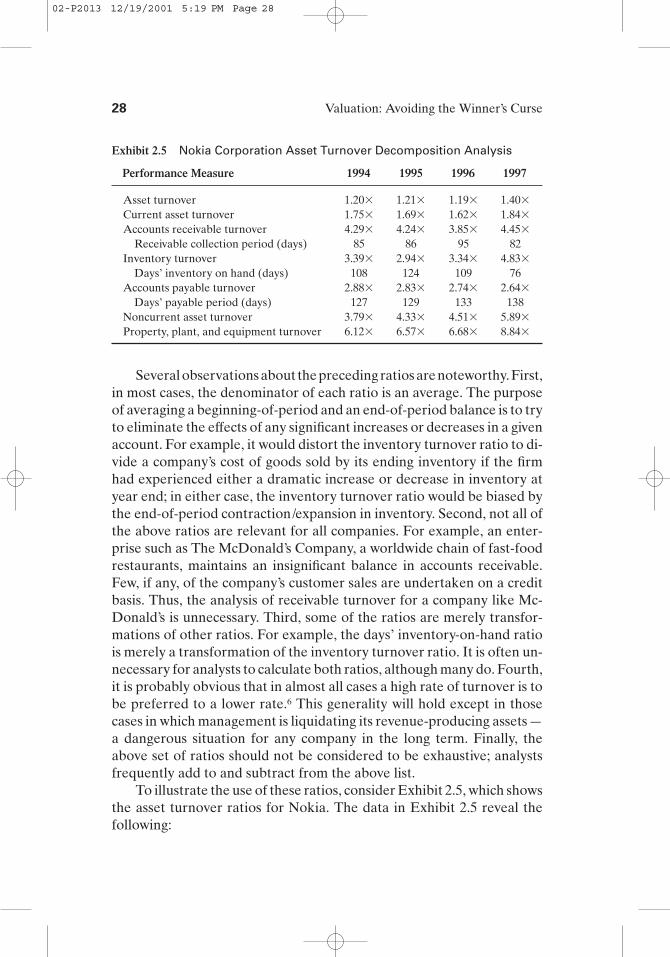
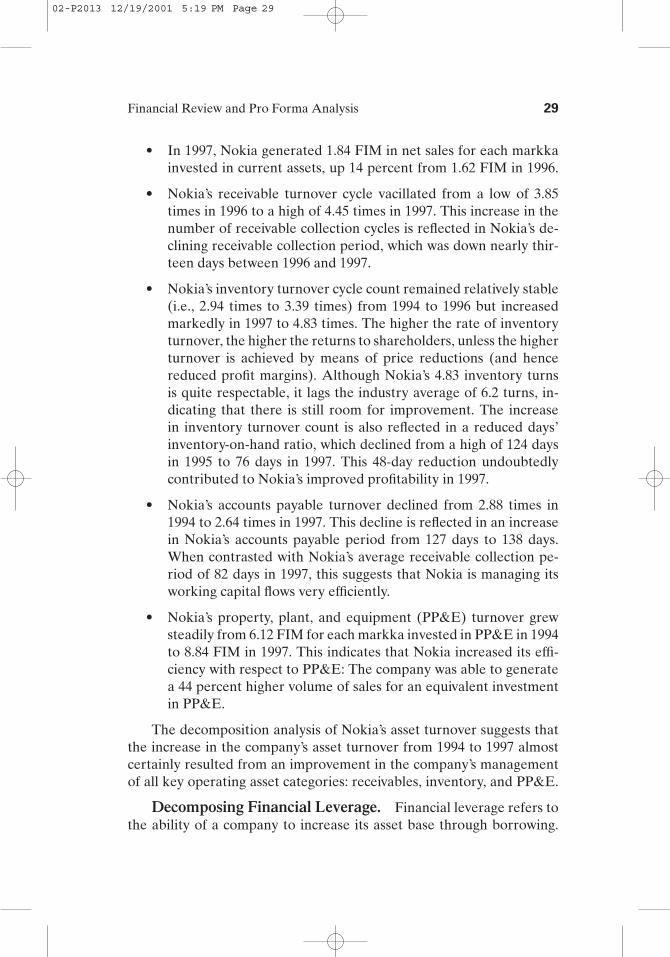
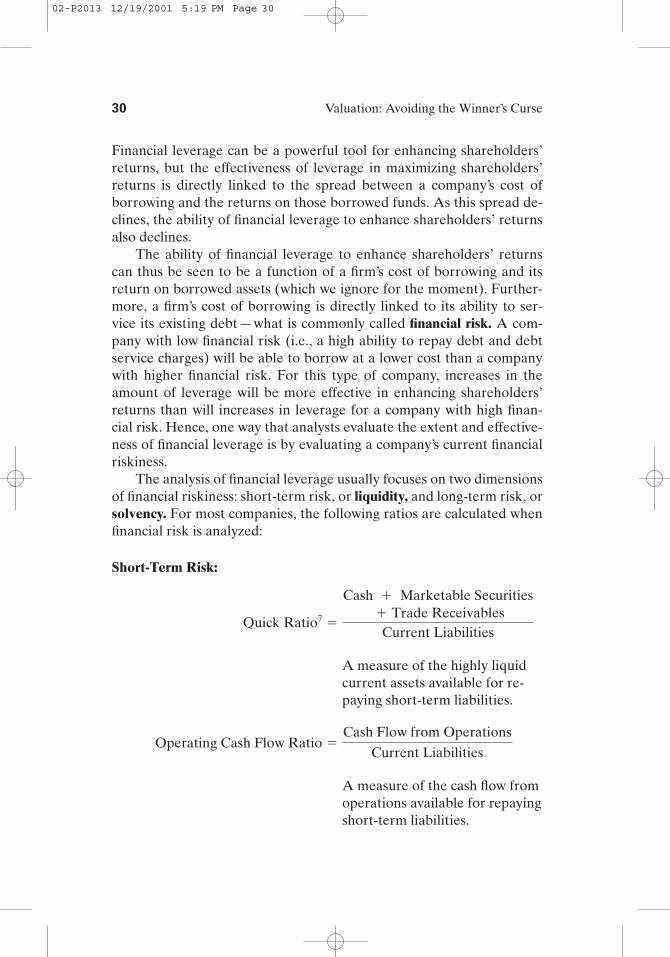
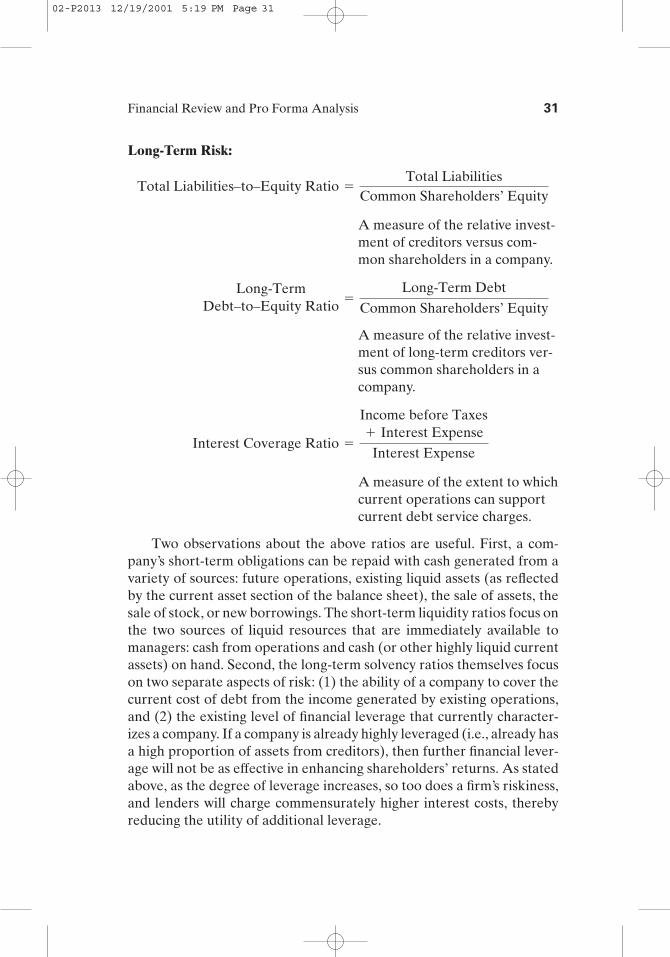
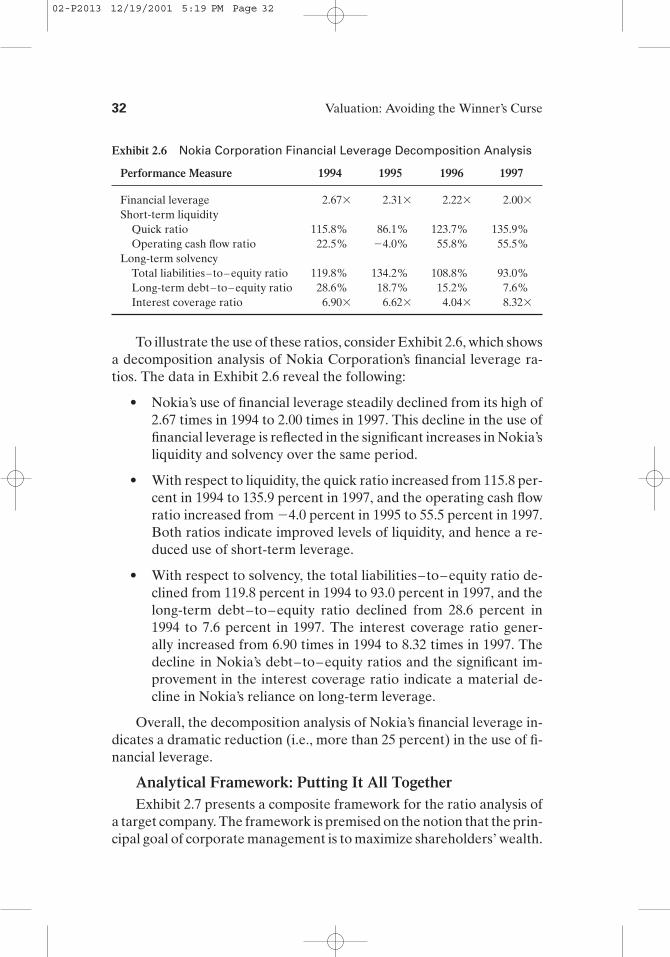
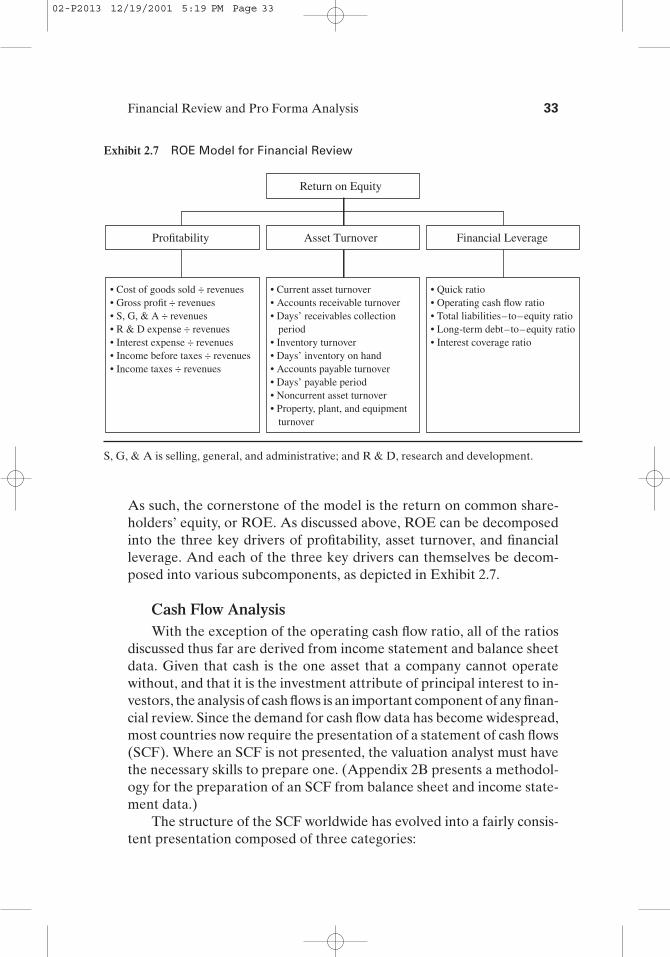
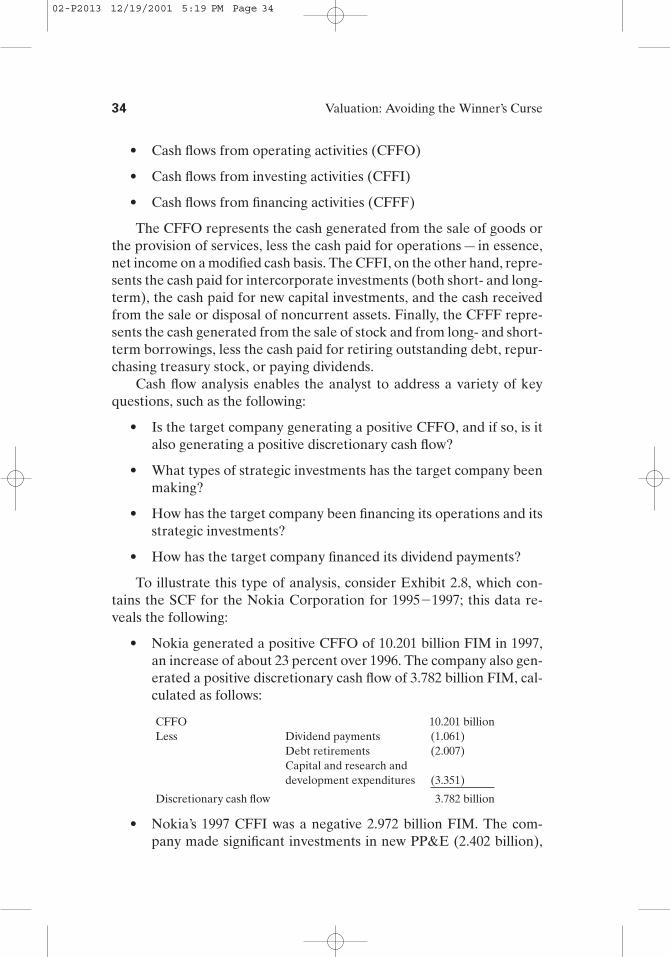
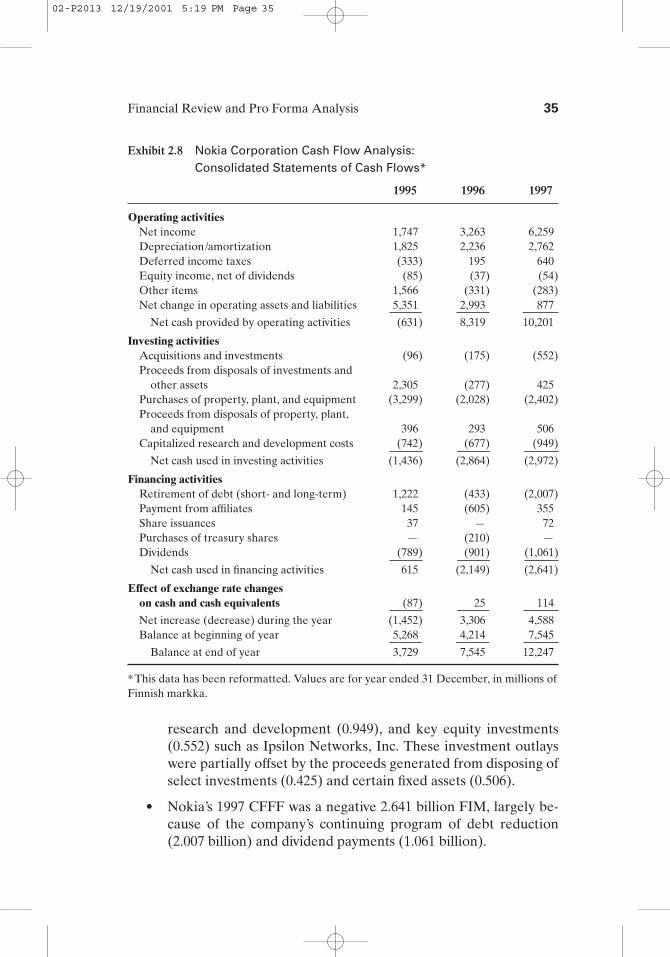
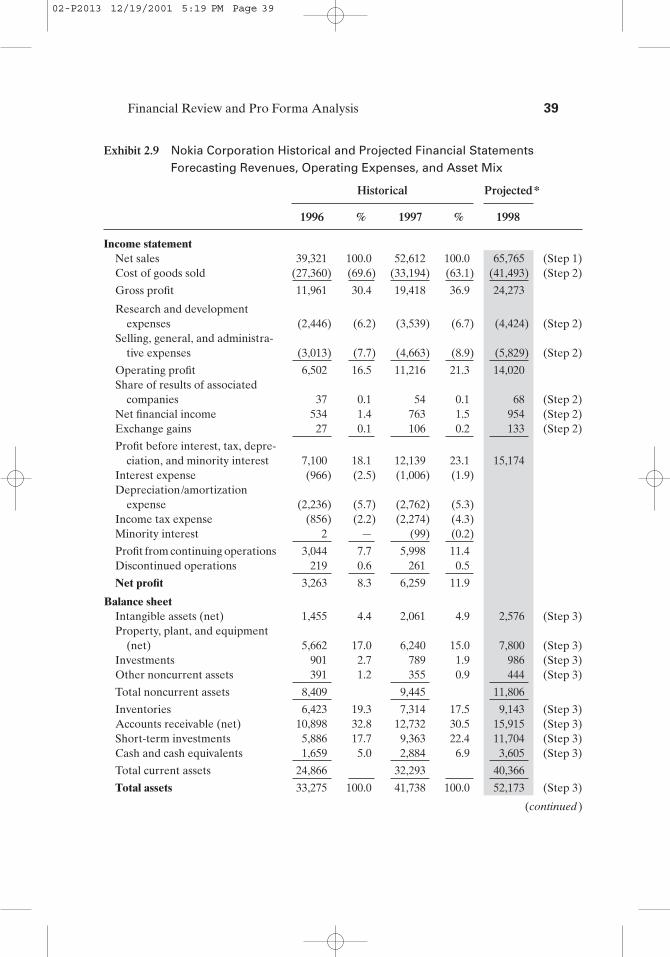
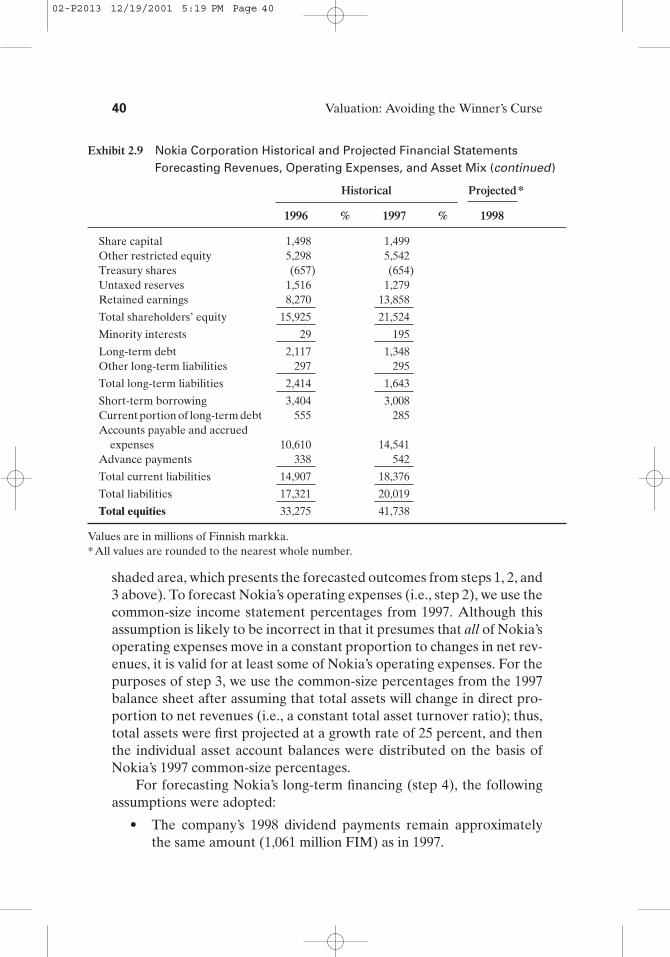
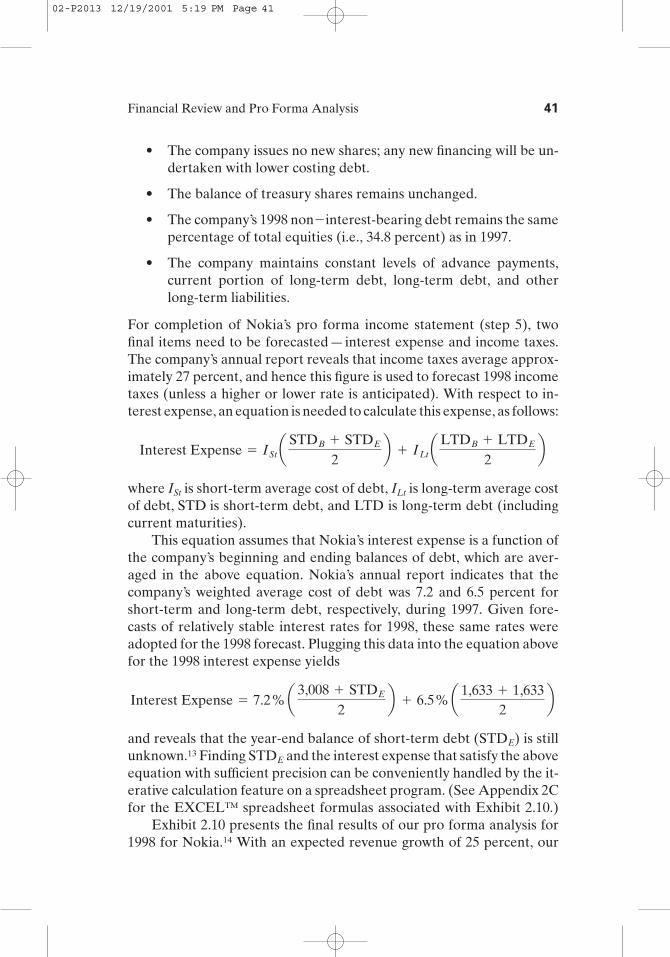
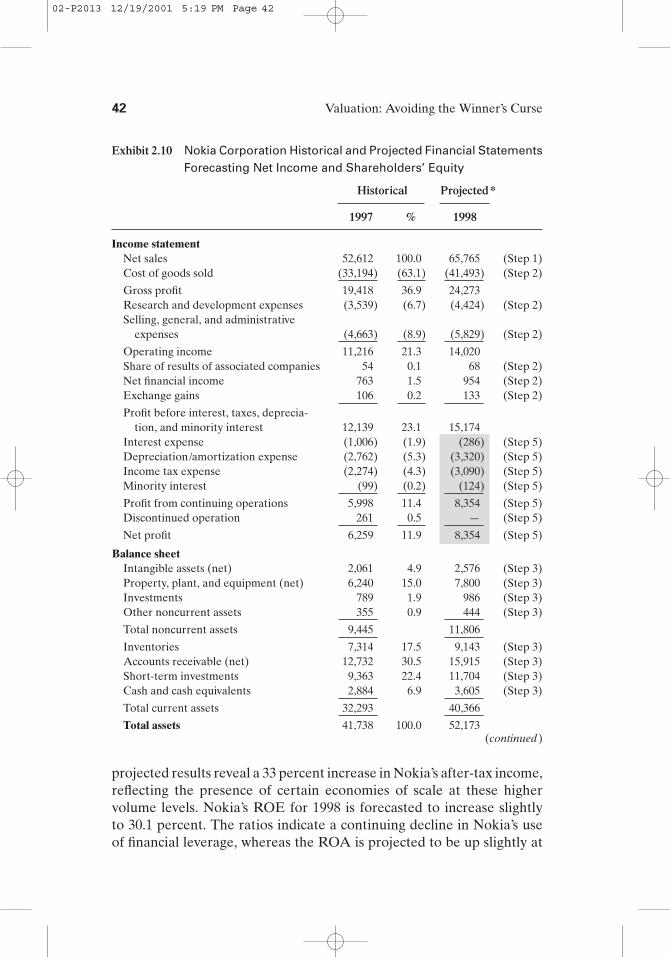
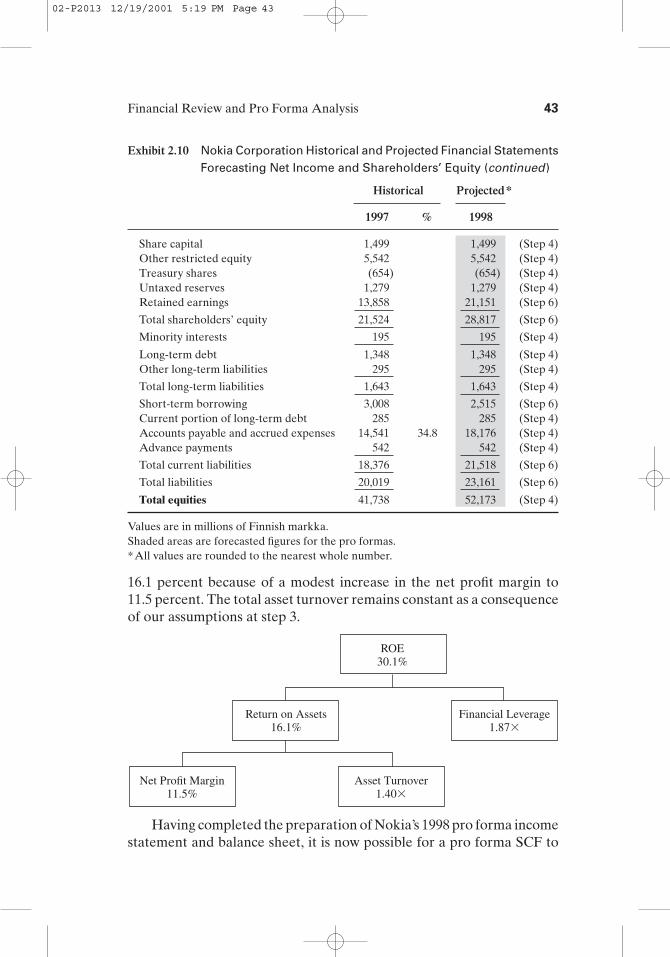
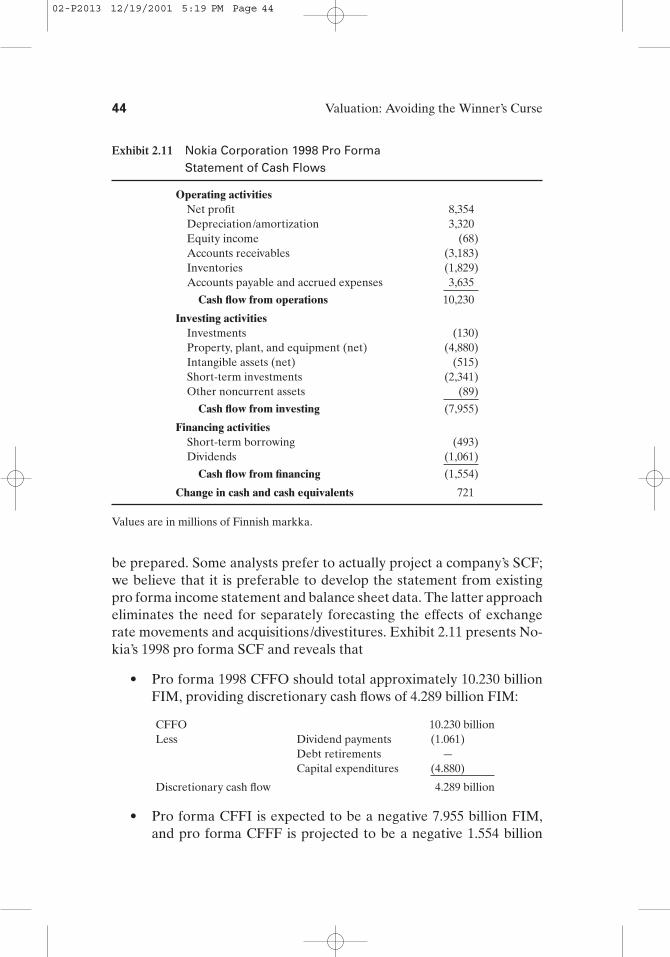
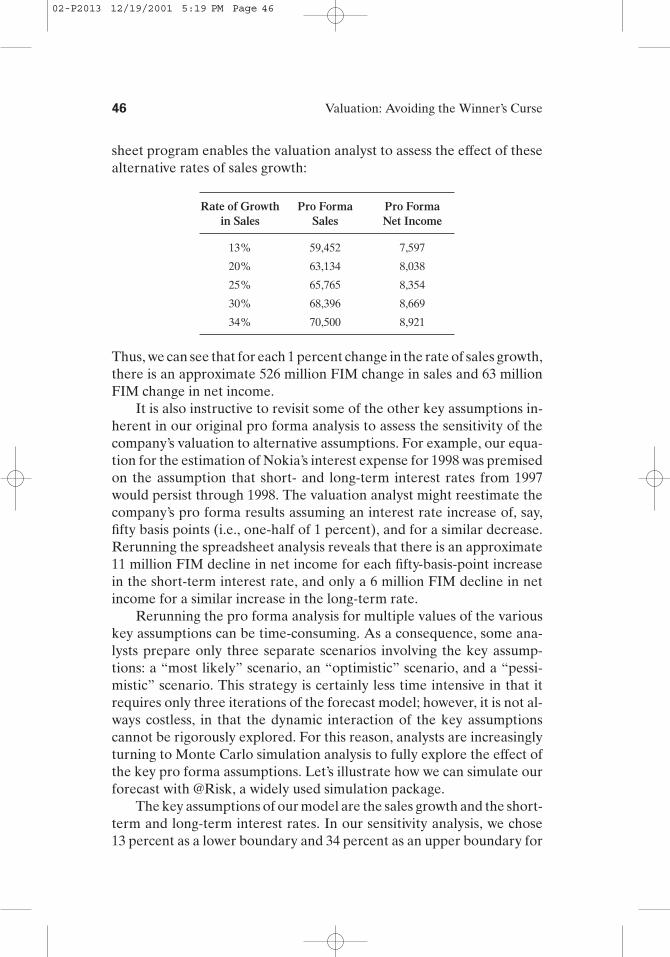
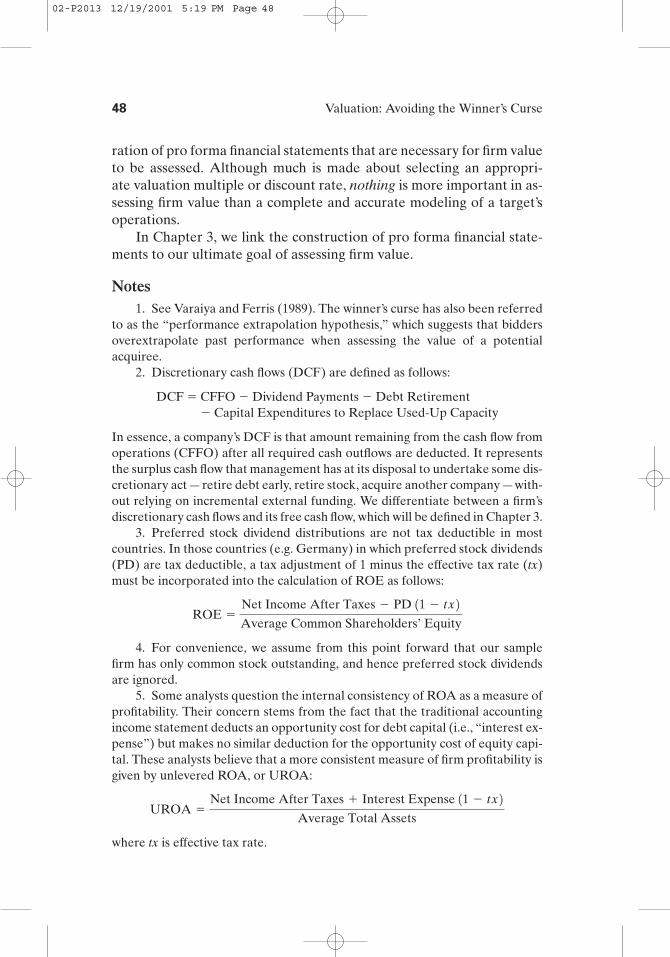
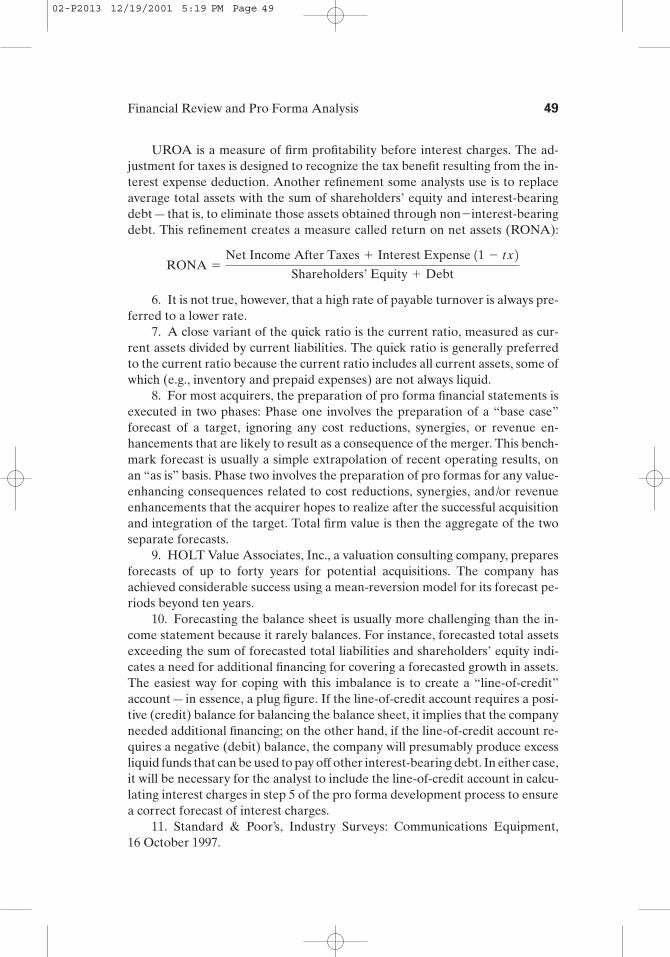
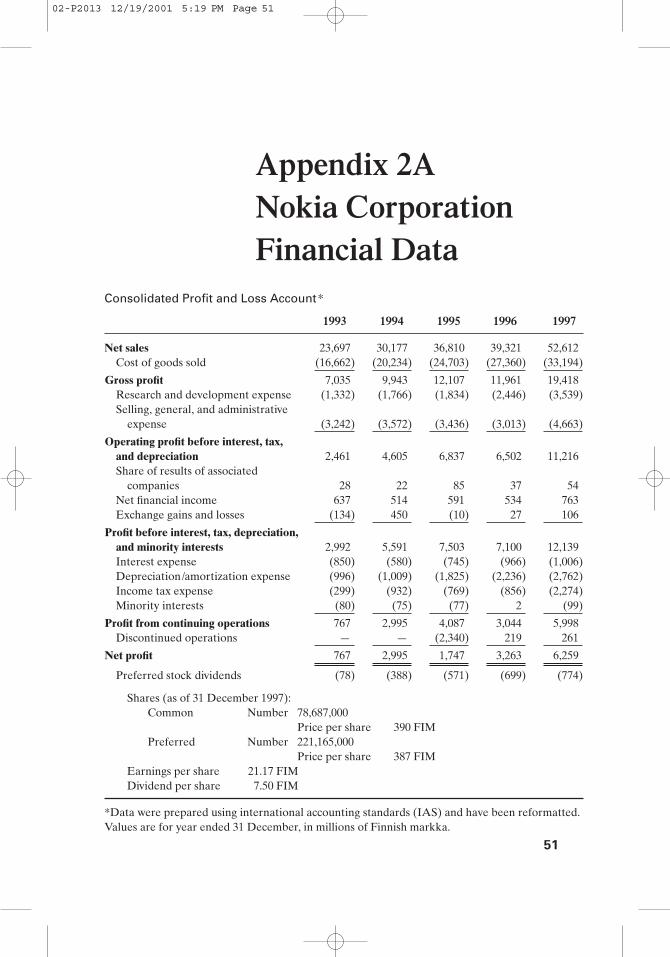
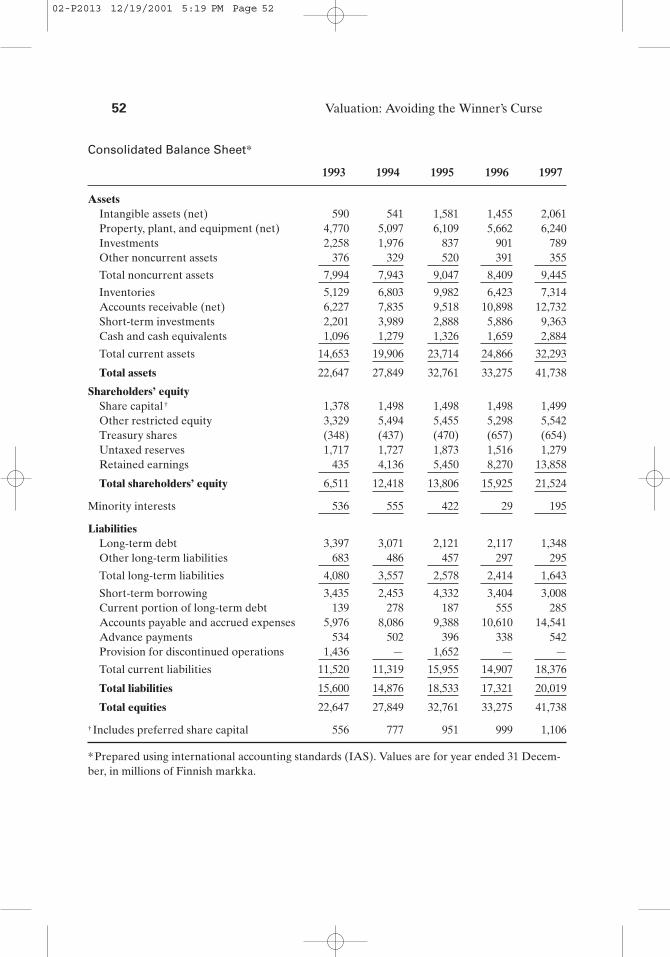
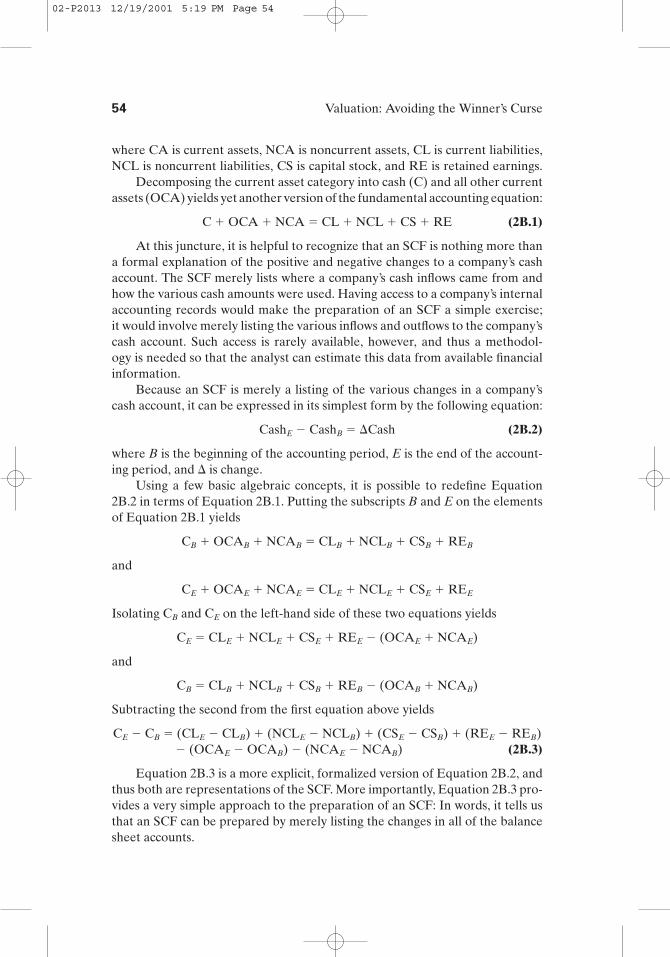
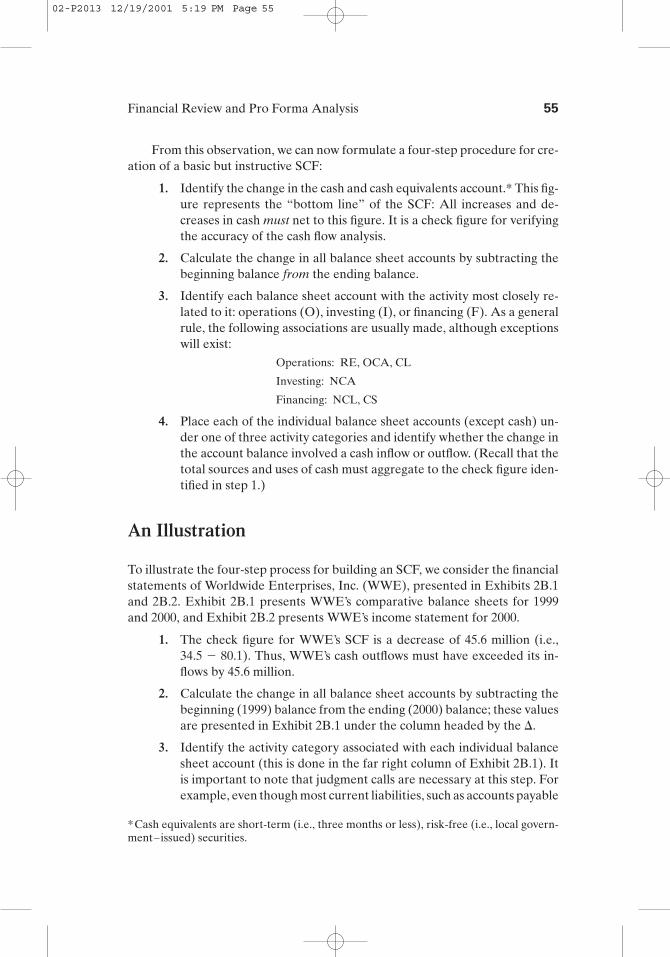
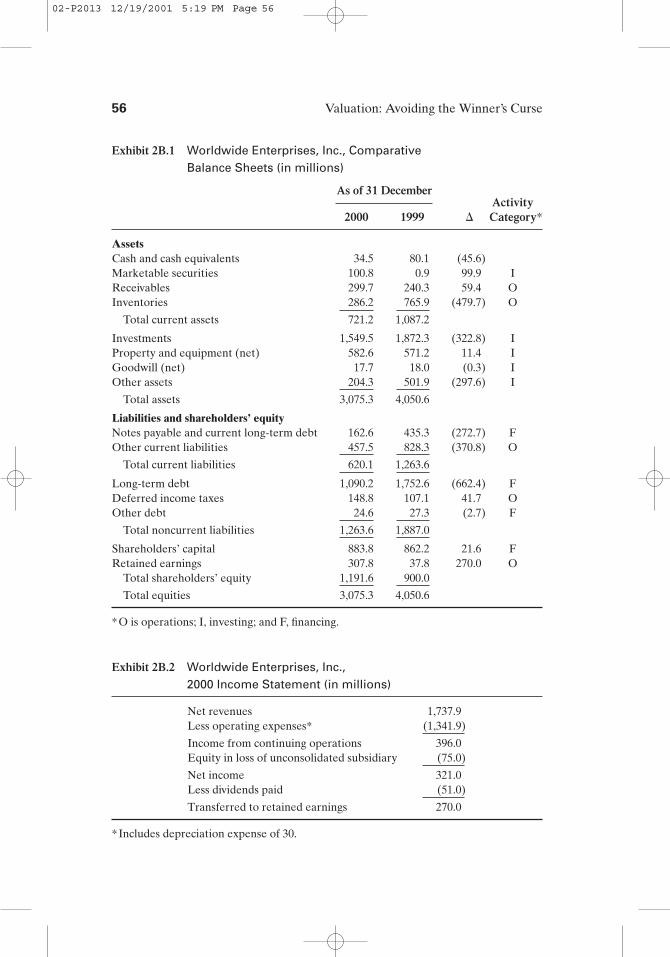
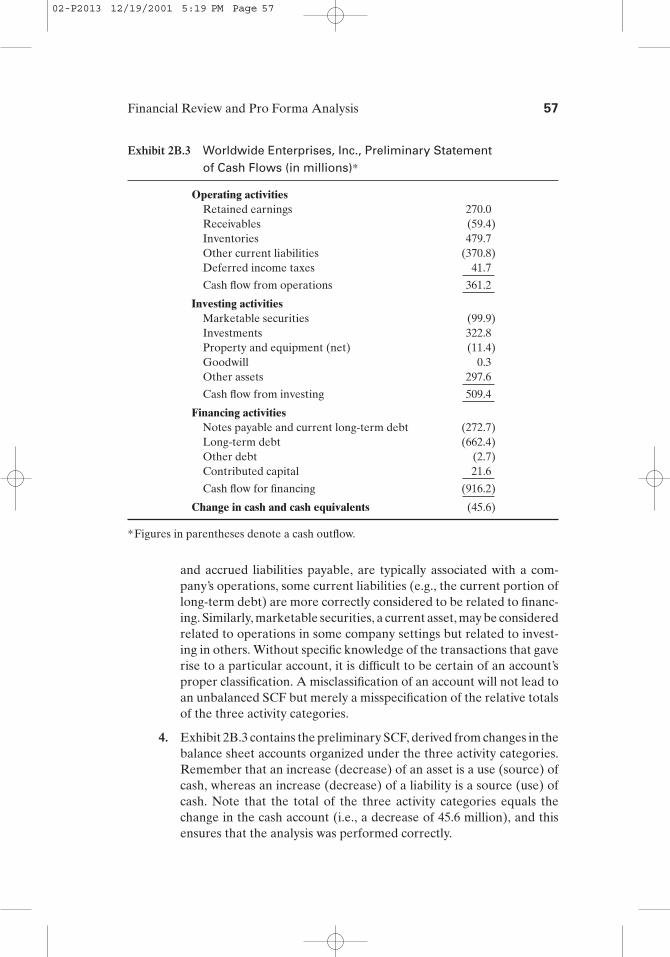

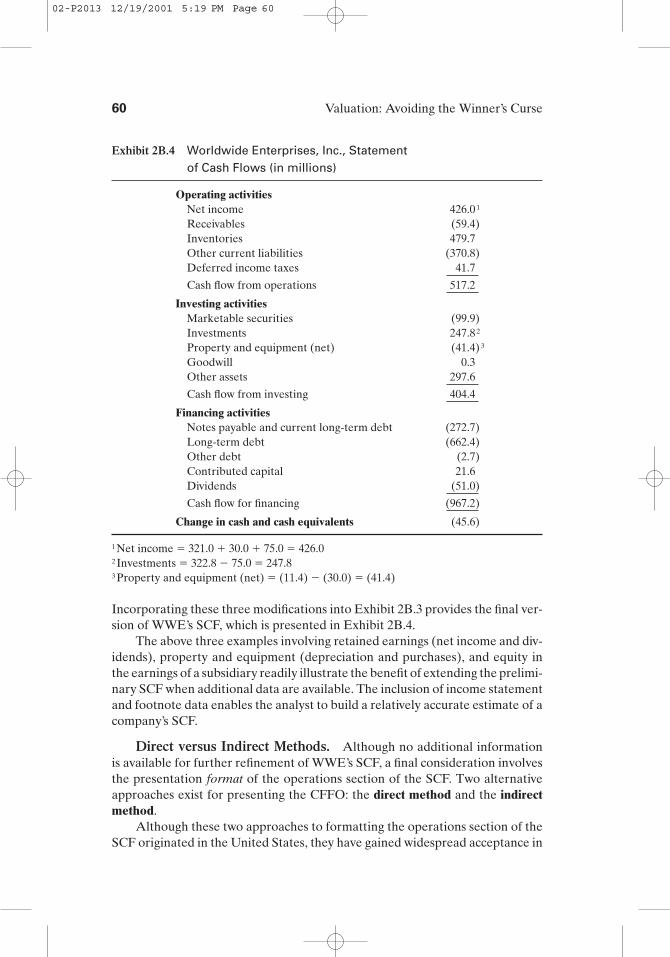

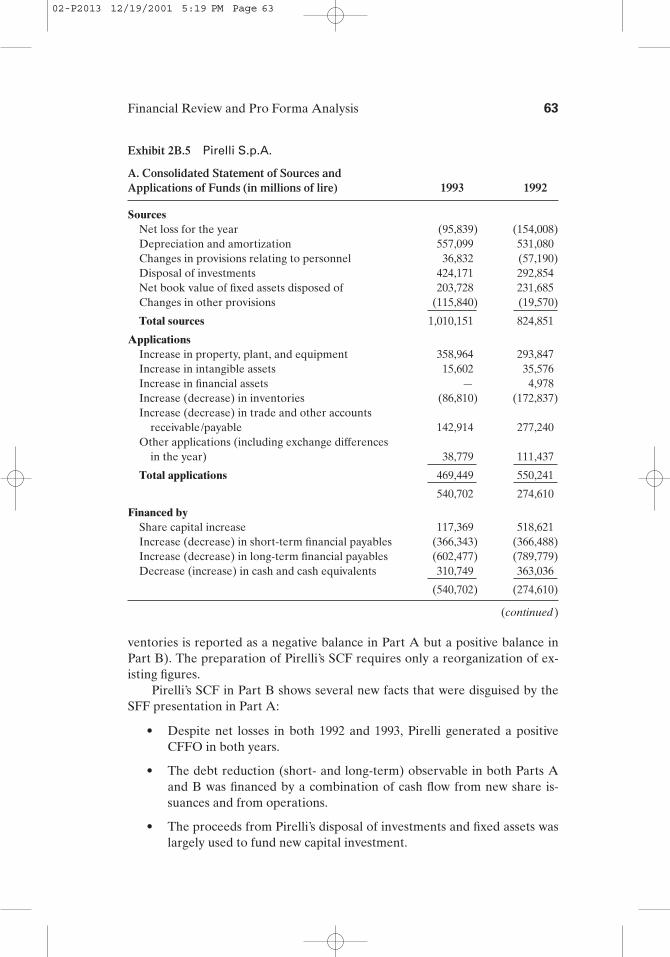
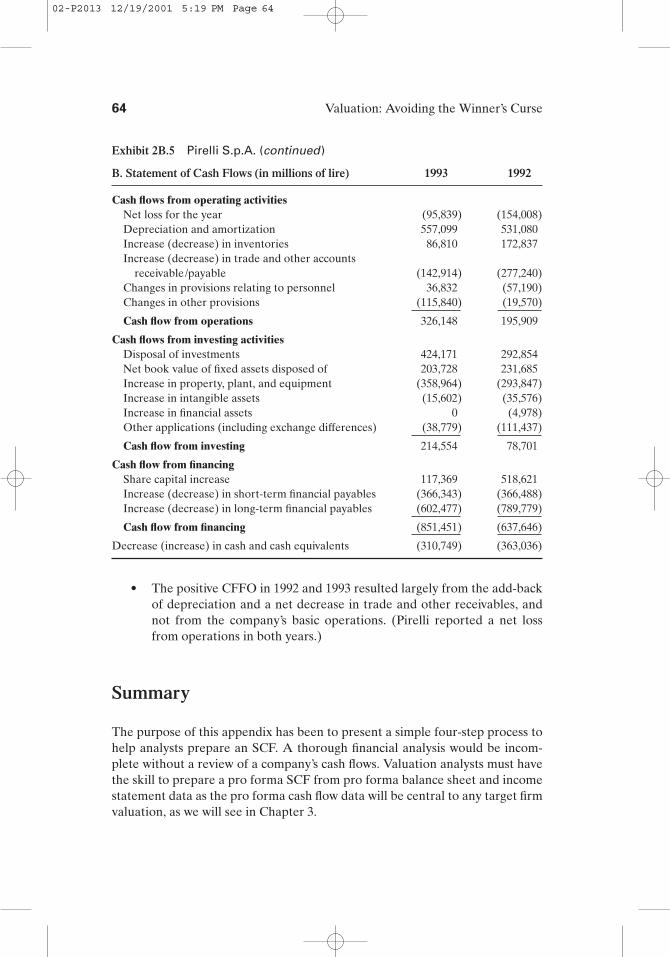
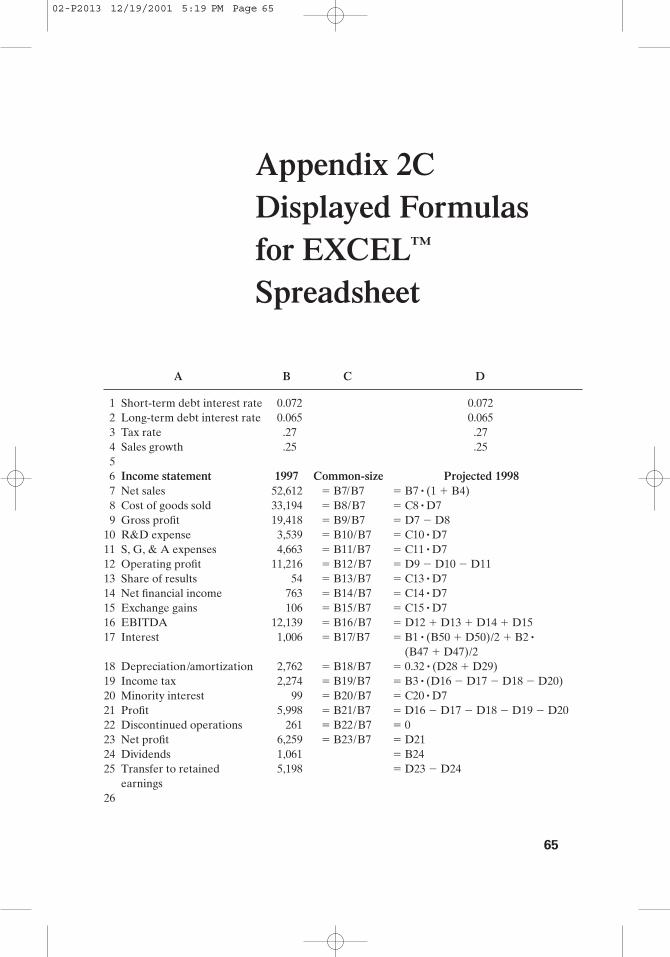

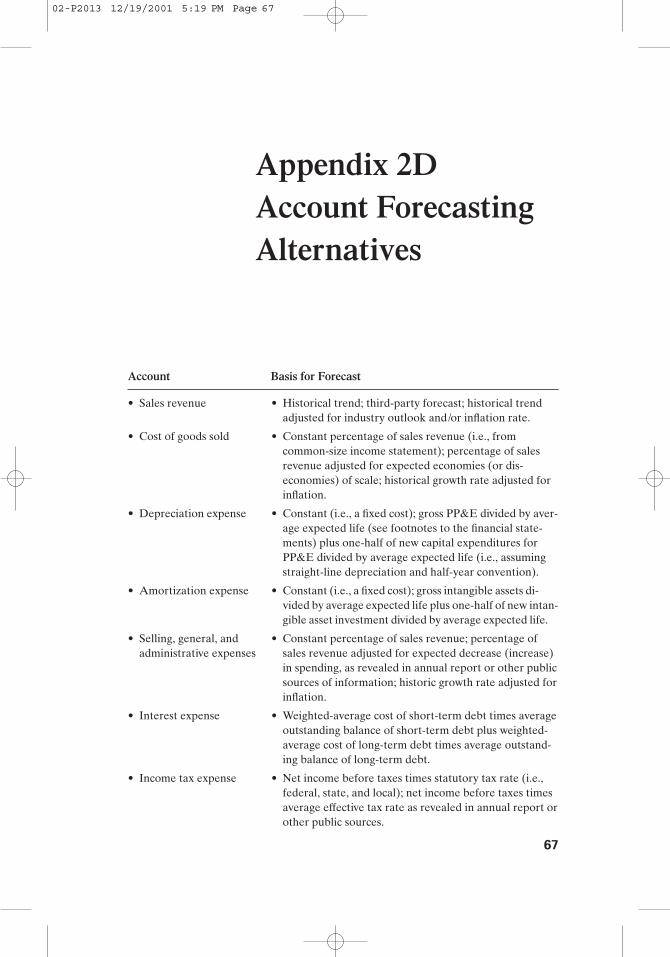
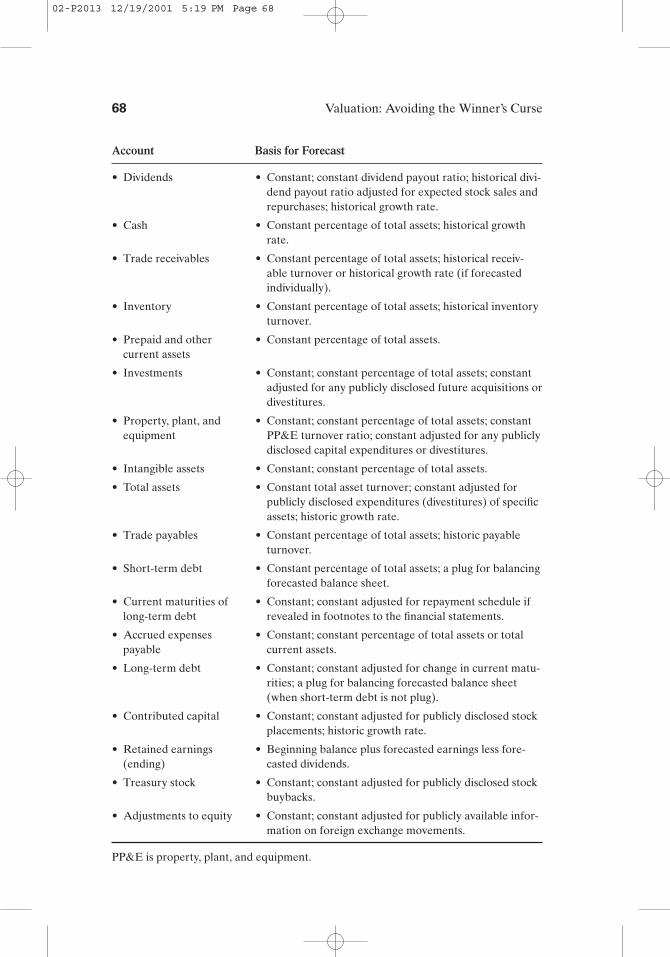


![Clinical Pharmacokinetics Samplechapter[1]](https://static.documents.pub/doc/80x56/577d34e41a28ab3a6b8f1c1d/clinical-pharmacokinetics-samplechapter1.jpg)


