Page 1
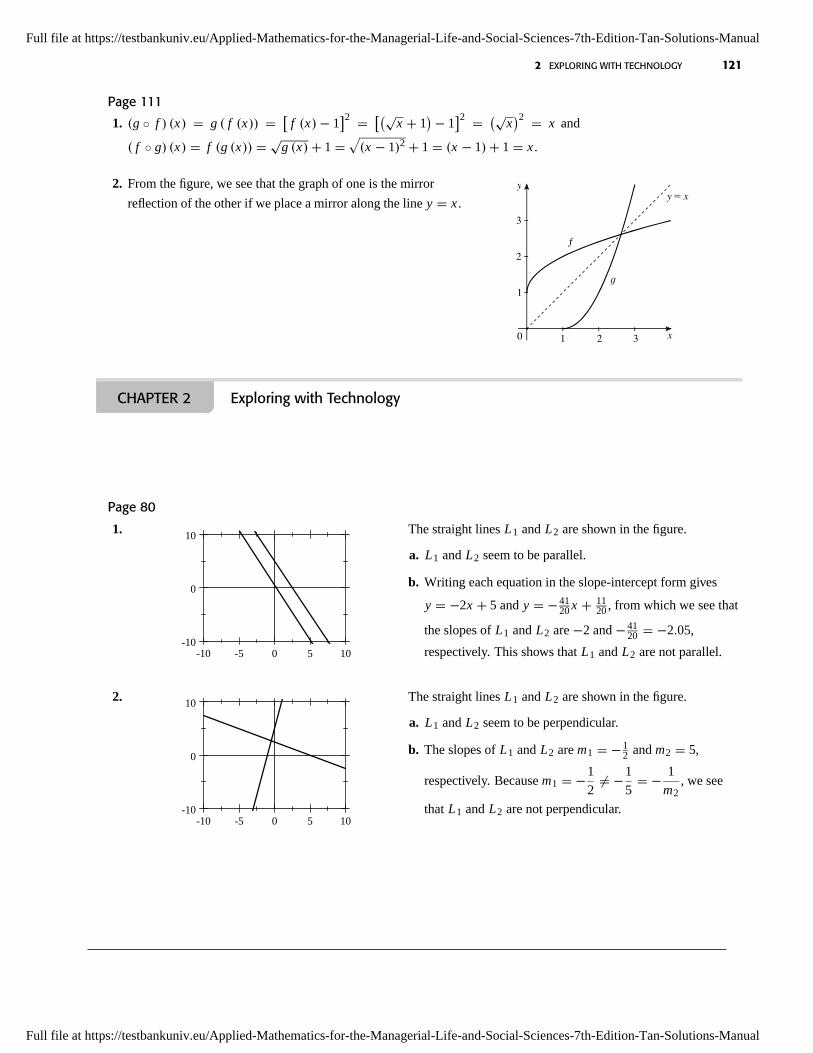
2 FUNCTIONS AND THEIR GRAPHS
2.1 The Cartesian Coordinate System and Straight Lines
Concept Questions page 76
1. a. a 0 and b 0. b. a 0 and b 0. c. a 0 and b 0.
2. The slope of a nonvertical line is m y2 y1
x2 x1, where P x1 y1 and P x2 y2 are any two distinct points on the
line. The slope of a vertical line is undefined.
Exercises page 77
1. The coordinates of A are 3 3 and it is located in Quadrant I.
2. The coordinates of B are 5 2 and it is located in Quadrant II.
3. The coordinates of C are 22 and it is located in Quadrant IV.
4. The coordinates of D are 2 5 and it is located in Quadrant II.
5. The coordinates of E are 46 and it is located in Quadrant III.
6. The coordinates of F are 82 and it is located in Quadrant IV.
7. A 8. 5 4 9. E , F , and G 10. E 11. F 12. D
For Exercises 13–20, refer to the following figure.
x
1
y
0
13. (_2, 5)
14. (1, 3)
15 (3, _1)
20. (1.2, _3.4) 16. (3, _4)
19. (4.5, _4.5)
18. 32( )5
2_ ,
17. 72( )8, _
1
21. Referring to the figure shown in the text, we see that m 2 0
0 4 1
2.
22. Referring to the figure shown in the text, we see that m 4 0
0 2 2.
51
Full file at https://testbankuniv.eu/Applied-Mathematics-for-the-Managerial-Life-and-Social-Sciences-7th-Edition-Tan-Solutions-Manual
Full file at https://testbankuniv.eu/Applied-Mathematics-for-the-Managerial-Life-and-Social-Sciences-7th-Edition-Tan-Solutions-Manual
Page 2
52 2 FUNCTIONS AND THEIR GRAPHS
23. This is a vertical line, and hence its slope is undefined.
24. This is a horizontal line, and hence its slope is 0.
25. m y2 y1
x2 x1 8 3
5 4 5. 26. m y2 y1
x2 x1 8 5
3 4 3
1 3.
27. m y2 y1
x2 x1 8 3
4 2 5
6. 28. m y2 y1
x2 x1 4 2
4 2 2
6 1
3.
29. m y2 y1
x2 x1 d b
c a, provided a c.
30. m y2 y1
x2 x1 b b 1
a 1 a 1 b b 1
a 1 a 1 1 2b
2a.
31. Because the equation is already in slope-intercept form, we read off the slope m 4.
a. If x increases by 1 unit, then y increases by 4 units.
b. If x decreases by 2 units, then y decreases by 4 2 8 units.
32. Rewrite the given equation in slope-intercept form: 2x 3y 4, 3y 4 2x , and so y 23 x 4
3 .
a. Because m 23 , we conclude that the slope is negative.
b. Because the slope is negative, y decreases as x increases.
c. If x decreases by 2 units, then y increases by2
3
2 4
3 units.
33. The slope of the line through A and B is10 2
3 1 8
4 2. The slope of the line through C and D is
1 5
1 1 4
2 2. Because the slopes of these two lines are equal, the lines are parallel.
34. The slope of the line through A and B is2 3
2 2. Because this slope is undefined, we see that the line is vertical.
The slope of the line through C and D is5 4
2 2. Because this slope is undefined, we see that this line is also
vertical. Therefore, the lines are parallel.
35. The slope of the line through the point 1 a and 42 is m1 2 a
4 1and the slope of the line through
2 8 and 7 a 4 is m2 a 4 8
7 2. Because these two lines are parallel, m1 is equal to m2. Therefore,
2 a
3 a 4
9, 9 2 a 3 a 4, 18 9a 3a 12, and 6a 30, so a 5.
36. The slope of the line through the point a 1 and 5 8 is m1 8 1
5 aand the slope of the line through 4 9 and
a 2 1 is m2 1 9
a 2 4. Because these two lines are parallel, m1 is equal to m2. Therefore,
7
5 a 8
a 2,
7 a 2 8 5 a, 7a 14 40 8a, and a 26.
37. Yes. A straight line with slope zero (m 0) is a horizontal line, whereas a straight line whose slope does not exist
(m cannot be computed) is a vertical line.
Full file at https://testbankuniv.eu/Applied-Mathematics-for-the-Managerial-Life-and-Social-Sciences-7th-Edition-Tan-Solutions-Manual
Full file at https://testbankuniv.eu/Applied-Mathematics-for-the-Managerial-Life-and-Social-Sciences-7th-Edition-Tan-Solutions-Manual
Page 3
2.2 EQUATIONS OF LINES 53
2.2 Equations of Lines
Concept Questions page 84
1. a. y y1 m x x1 b. y mx b
c. ax by c 0, where a and b are not both zero.
2. a. m1 m2 b. m2 1
m1
3. a. Solving the equation for y gives By Ax C , so y A
Bx C
B. The slope of L is the coefficient of x , A
B.
b. If B 0, then the equation reduces to Ax C 0. Solving this equation for x , we obtain x C
A. This is an
equation of a vertical line, and we conclude that the slope of L is undefined.
Exercises page 84
1. (e) 2. (c) 3. (a) 4. (d) 5. (f) 6. (b)
7. The slope of the line through A and B is2 5
4 2 3
6 1
2. The slope of the line through C and D is
6 2
3 1 8
4 2. Because the slopes of these two lines are the negative reciprocals of each other, the lines are
perpendicular.
8. The slope of the line through A and B is2 0
1 2 2
1 2. The slope of the line through C and D is
4 2
8 4 2
12 1
6. Because the slopes of these two lines are not the negative reciprocals of each other, the
lines are not perpendicular.
9. An equation of a horizontal line is of the form y b. In this case b 3, so y 3 is an equation of the line.
10. An equation of a vertical line is of the form x a. In this case a 0, so x 0 is an equation of the line.
11. We use the point-slope form of an equation of a line with the point 34 and slope m 2. Thus
y y1 m x x1 becomes y 4 2 x 3. Simplifying, we have y 4 2x 6, or y 2x 10.
12. We use the point-slope form of an equation of a line with the point 2 4 and slope m 1. Thus
y y1 m x x1, giving y 4 1 x 2 y 4 x 2, and finally y x 6.
13. Because the slope m 0, we know that the line is a horizontal line of the form y b. Because the line passes
through 3 2, we see that b 2, and an equation of the line is y 2.
14. We use the point-slope form of an equation of a line with the point 1 2 and slope m 12 . Thus
y y1 m x x1 gives y 2 12 x 1, 2y 4 x 1 2y x 5, and y 1
2 x 52 .
15. We first compute the slope of the line joining the points 2 4 and 3 7, obtaining m 7 4
3 2 3. Using the
point-slope form of an equation of a line with the point 2 4 and slope m 3, we find y 4 3 x 2, or
y 3x 2.
Full file at https://testbankuniv.eu/Applied-Mathematics-for-the-Managerial-Life-and-Social-Sciences-7th-Edition-Tan-Solutions-Manual
Full file at https://testbankuniv.eu/Applied-Mathematics-for-the-Managerial-Life-and-Social-Sciences-7th-Edition-Tan-Solutions-Manual
Page 4
54 2 FUNCTIONS AND THEIR GRAPHS
16. We first compute the slope of the line joining the points 2 1 and 2 5, obtaining m 5 1
2 2. Because this slope
is undefined, we see that the line must be a vertical line of the form x a. Because it passes through 2 5, we see
that x 2 is the equation of the line.
17. We first compute the slope of the line joining the points 1 2 and 32, obtaining m 2 2
3 1 4
4 1.
Using the point-slope form of an equation of a line with the point 1 2 and slope m 1, we find y 2 x 1, or
y x 1.
18. We first compute the slope of the line joining the points 12 and 34, obtaining
m 4 2
3 1 2
4 1
2. Using the point-slope form of an equation of a line with the point 12 and
slope m 12 , we find y 2 1
2 [x 1], y 2 12 x 1, and finally y 1
2 x 52 .
19. We use the slope-intercept form of an equation of a line: y mx b. Because m 3 and b 4, the equation is
y 3x 4.
20. We use the slope-intercept form of an equation of a line: y mx b. Because m 2 and b 1, the equation
is y 2x 1.
21. We use the slope-intercept form of an equation of a line: y mx b. Because m 0 and b 5, the equation is
y 5.
22. We use the slope-intercept form of an equation of a line:y mx b. Because m 12 , and b 3
4 , the equation is
y 12 x 3
4 .
23. We first write the given equation in the slope-intercept form: x 2y 0, so 2y x , or y 12 x . From this
equation, we see that m 12 and b 0.
24. We write the equation in slope-intercept form: y 2 0, so y 2. From this equation, we see that m 0 and
b 2.
25. We write the equation in slope-intercept form: 2x 3y 9 0, 3y 2x 9, and y 23 x 3. From this
equation, we see that m 23 and b 3.
26. We write the equation in slope-intercept form: 3x 4y 8 0, 4y 3x 8, and y 34 x 2. From this
equation, we see that m 34 and b 2.
27. We write the equation in slope-intercept form: 2x 4y 14, 4y 2x 14, and y 24 x 14
4 12 x 7
2 .
From this equation, we see that m 12 and b 7
2 .
28. We write the equation in the slope-intercept form: 5x 8y 24 0, 8y 5x 24, and y 58 x 3. From
this equation, we conclude that m 58 and b 3.
29. We first write the equation 2x 4y 8 0 in slope-intercept form: 2x 4y 8 0, 4y 2x 8, y 12 x 2.
Now the required line is parallel to this line, and hence has the same slope. Using the point-slope form of an
equation of a line with m 12 and the point 2 2, we have y 2 1
2 [x 2] or y 12 x 3.
Full file at https://testbankuniv.eu/Applied-Mathematics-for-the-Managerial-Life-and-Social-Sciences-7th-Edition-Tan-Solutions-Manual
Full file at https://testbankuniv.eu/Applied-Mathematics-for-the-Managerial-Life-and-Social-Sciences-7th-Edition-Tan-Solutions-Manual
Page 5
2.2 EQUATIONS OF LINES 55
30. The slope of the line passing through 23 and 2 5 is m 5 3
2 2 8
4 2. Thus, the required equation
is y 3 2 [x 1], y 2x 2 3, or y 2x 5.
31. We first write the equation 3x 4y 22 0 in slope-intercept form: 3x 4y 22 0, so 4y 3x 22
and y 34 x 11
2 Now the required line is perpendicular to this line, and hence has slope 43 (the negative
reciprocal of 34 ). Using the point-slope form of an equation of a line with m 4
3 and the point 2 4, we have
y 4 43 x 2, or y 4
3 x 43 .
32. The slope of the line passing through 21 and 4 3 is given by m 3 1
4 2 3 1
4 2 4
6 2
3, so
the slope of the required line is m 32 and its equation is y 2 3
2 x 1, y 32 x 3
2 2, or
y 32 x 1
2 .
33. A line parallel to the x-axis has slope 0 and is of the form y b. Because the line is 6 units below the axis, it passes
through 06 and its equation is y 6.
34. Because the required line is parallel to the line joining 2 4 and 4 7, it has slope m 7 4
4 2 3
2. We also know
that the required line passes through the origin 0 0. Using the point-slope form of an equation of a line, we find
y 0 32 x 0, or y 3
2 x .
35. We use the point-slope form of an equation of a line to obtain y b 0 x a, or y b.
36. Because the line is parallel to the x-axis, its slope is 0 and its equation has the form y b. We know that the line
passes through 3 4, so the required equation is y 4.
37. Because the required line is parallel to the line joining 3 2 and 6 8, it has slope m 8 2
6 3 6
9 2
3. We
also know that the required line passes through 54. Using the point-slope form of an equation of a line, we
find y 4 23 [x 5], y 2
3 x 10³ 4, and finally y 2
3 x 23 .
38. Because the slope of the line is undefined, it has the form x a. Furthermore, since the line passes through a b,
the required equation is x a.
39. Because the point 3 5 lies on the line kx 3y 9 0, it satisfies the equation. Substituting x 3 and y 5
into the equation gives 3k 15 9 0, or k 8.
40. Because the point 23 lies on the line 2x ky 10 0, it satisfies the equation. Substituting x 2 and
y 3 into the equation gives 2 2 3 k 10 0, 4 3k 10 0, 3k 6, and finally k 2.
Full file at https://testbankuniv.eu/Applied-Mathematics-for-the-Managerial-Life-and-Social-Sciences-7th-Edition-Tan-Solutions-Manual
Full file at https://testbankuniv.eu/Applied-Mathematics-for-the-Managerial-Life-and-Social-Sciences-7th-Edition-Tan-Solutions-Manual
Page 6
56 2 FUNCTIONS AND THEIR GRAPHS
41. 3x 2y 6 0. Setting y 0, we have 3x 6 0
or x 2, so the x-intercept is 2. Setting x 0, we
have 2y 6 0 or y 3, so the y-intercept is 3
x
y
2
4
0
42. 2x 5y 10 0. Setting y 0, we have 2x 10 0
or x 5, so the x-intercept is 5. Setting x 0, we
have 5y 10 0 or y 2, so the y-intercept is 2
x
y
2
4
0_2_4
2
_2
_6
43. x 2y 4 0. Setting y 0, we have x 4 0 or
x 4, so the x-intercept is 4. Setting x 0, we have
2y 4 0 or y 2, so the y-intercept is 2
x
y4
0
_2
2
2 4 6_2
44. 2x 3y 15 0. Setting y 0, we have
2x 15 0, so the x-intercept is 152 . Setting x 0,
we have 3y 15 0, so the y-intercept is 5.
x
y
4
0
_2
2
84_4
6
12
45. y 5 0. Setting y 0, we have 0 5 0, which
has no solution, so there is no x-intercept. Setting
x 0, we have y 5 0 or y 5, so the
y-intercept is 5.
x
y
0
_2
2 4_2
_4
_4
_6
2
46. 2x 8y 24 0. Setting y 0, we have
2x 24 0 or x 12, so the x-intercept is 12.
Setting x 0, we have 8y 24 0 or y 3, so the
y-intercept is 3.
x
y4
0
_2
2
4 8 12_4 16
Full file at https://testbankuniv.eu/Applied-Mathematics-for-the-Managerial-Life-and-Social-Sciences-7th-Edition-Tan-Solutions-Manual
Full file at https://testbankuniv.eu/Applied-Mathematics-for-the-Managerial-Life-and-Social-Sciences-7th-Edition-Tan-Solutions-Manual
Page 7
2.2 EQUATIONS OF LINES 57
47. Because the line passes through the points a 0 and 0 b, its slope is m b 0
0 a b
a. Then, using the
point-slope form of an equation of a line with the point a 0, we have y 0 b
ax a or y b
ax b,
which may be written in the formb
ax y b. Multiplying this last equation by
1
b, we have
x
a y
b 1.
48. Using the equationx
a y
b 1 with a 3 and b 4, we have
x
3 y
4 1. Then 4x 3y 12, so 3y 12 4x
and thus y 43 x 4.
49. Using the equationx
a y
b 1 with a 2 and b 4, we have x
2 y
4 1. Then 4x 2y 8,
2y 8 4x , and finally y 2x 4.
50. Using the equationx
a y
b 1 with a 1
2 and b 34 , we have
x
12 y
34 1, 3
4 x 12 y
1
2
34
,
12 y 3
4 x 38 , and finally y 2
34 x 3
8
3
2 x 34 .
51. Using the equationx
a y
b 1 with a 4 and b 1
2 , we havex
4 y
12 1, 1
4 x 2y 1, 2y 14 x 1,
and so y 18 x 1
2 .
52. The slope of the line passing through A and B is m 2 7
2 1 9
3 3, and the slope of the line passing
through B and C is m 9 2
5 2 7
3. Because the slopes are not equal, the points do not lie on the same line.
53. The slope of the line passing through A and B is m 7 1
1 2 6
3 2, and the slope of the line passing through
B and C is m 13 7
4 1 6
3 2. Because the slopes are equal, the points lie on the same line.
54. The slope of the line L passing through P1 12904 and P2 23596 is m 596 904
23 12 28, so an
equation of L is y 904 28 x 12 or y 28x 124.
Substituting x 48 into this equation gives y 28 48 124 104. This shows that the point P3 48 104
lies on L. Next, substituting x 72 into the equation gives y 28 72 124 776, which shows that the
point P4 72 776 also lies on L . We conclude that John’s claim is valid.
55. The slope of the line L passing through P1 18644 and P2 24572 is m 572 644
24 18 12, so an
equation of L is y 644 12 x 18 or y 12x 86.
Substituting x 50 into this equation gives y 12 5 86 26. This shows that the point P3 50272
does not lie on L, and we conclude that Alison’s claim is not valid.
Full file at https://testbankuniv.eu/Applied-Mathematics-for-the-Managerial-Life-and-Social-Sciences-7th-Edition-Tan-Solutions-Manual
Full file at https://testbankuniv.eu/Applied-Mathematics-for-the-Managerial-Life-and-Social-Sciences-7th-Edition-Tan-Solutions-Manual
Page 8
58 2 FUNCTIONS AND THEIR GRAPHS
56. a.
_200
20
40
_20 20 C
60F b. The slope is 9
5 . It represents the change in F per unit change in C.
c. The F-intercept of the line is 32. It corresponds to 0 in C, so it is
the freezing point in F.
57. a.
20406080
10 t (years)1550
100
y (% of total capacity) b. The slope is 19467 and the y-intercept is 70082.
c. The output is increasing at the rate of 19467% per year. The
output at the beginning of 1990 was 70082%.
d. We solve the equation 19467t 70082 100, obtaining
19467t 29918 and t 1537. We conclude that the plants were
generating at maximum capacity during April 2005.
58. a. y 00765x b. $00765 c. 00765 65,000 497250, or $497250
59. a. y 055x b. Solving the equation 1100 055x for x , we have x 1100
055 2000
60. a. Substituting L 80 into the given equation, we have
W 351 80 192 2808 192 888, or 888 Britishtons.
b.
0
40
80
W (tons)
20 40 60 80 L (feet)
61. Using the points 0 068 and 10 080, we see that the slope of the required line is
m 080 068
10 0 012
10 0012. Next, using the point-slope form of the equation of a line, we have
y 068 0012 t 0 or y 0012t 068. Therefore, when t 14, we have y 0012 14 068 0848,
or 848%. That is, in 2004 women’s wages were 848% of men’s wages.
62. a, b.
00.20.40.60.81.01.21.4
2 4 6 81 3 5 7
y (millions)
x (yr)
c. The slope of L is m 056 130
5 0 0148, so an equation
of L is y 13 0148 x 0 or y 0148x 13.
d. The number of pay phones in 2012 is estimated to be
0148 8 13, or approximately 116,000.
Full file at https://testbankuniv.eu/Applied-Mathematics-for-the-Managerial-Life-and-Social-Sciences-7th-Edition-Tan-Solutions-Manual
Full file at https://testbankuniv.eu/Applied-Mathematics-for-the-Managerial-Life-and-Social-Sciences-7th-Edition-Tan-Solutions-Manual
Page 9
2.2 EQUATIONS OF LINES 59
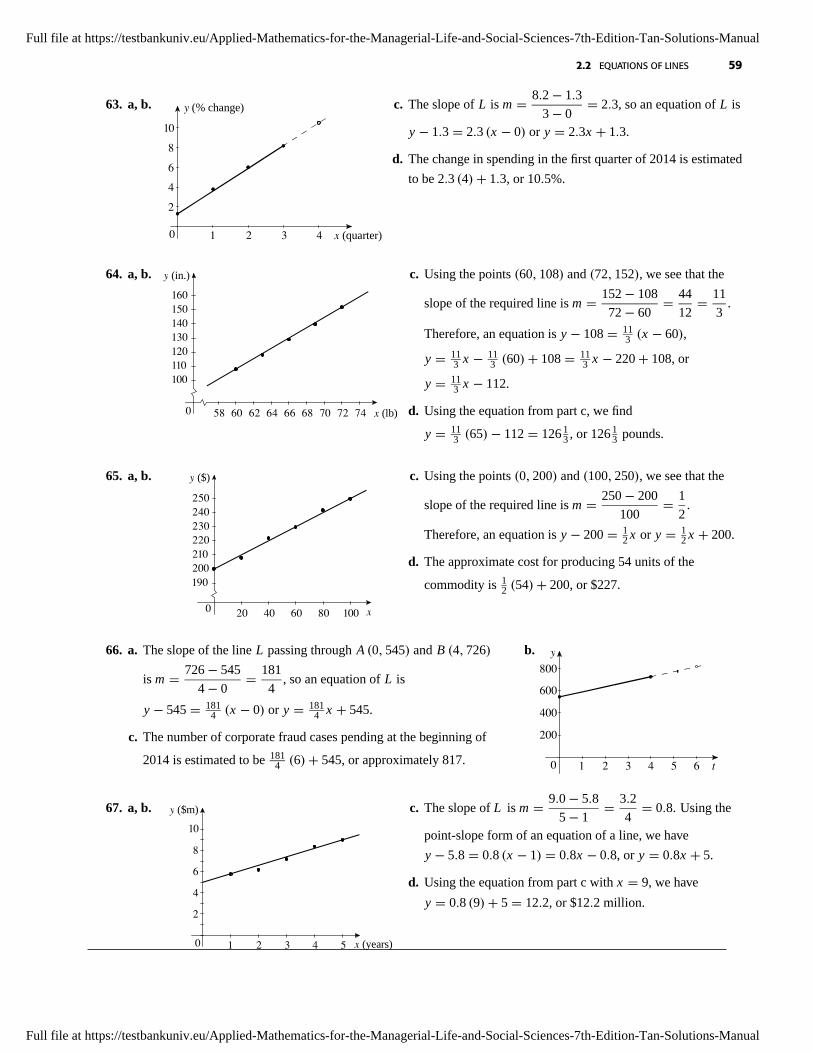
63. a, b.
0
2468
10
1 2 3 4
y (% change)
x (quarter)
c. The slope of L is m 82 13
3 0 23, so an equation of L is
y 13 23 x 0 or y 23x 13.
d. The change in spending in the first quarter of 2014 is estimated
to be 23 4 13, or 105%.
64. a, b.
100110120130140150160
58 60 62 64 66 68 70 72 740 x (lb)
y (in.) c. Using the points 60 108 and 72 152, we see that the
slope of the required line is m 152 108
72 60 44
12 11
3.
Therefore, an equation is y 108 113 x 60,
y 113 x 11
3 60 108 113 x 220 108, or
y 113 x 112.
d. Using the equation from part c, we find
y 113 65 112 126 1
3 , or 126 13 pounds.
65. a, b.
190200210220230240250
0 20 40 60 80 100 x
y ($) c. Using the points 0 200 and 100 250, we see that the
slope of the required line is m 250 200
100 1
2.
Therefore, an equation is y 200 12 x or y 1
2 x 200.
d. The approximate cost for producing 54 units of the
commodity is 12 54 200, or $227.
66. a. The slope of the line L passing through A 0 545 and B 4 726
is m 726 545
4 0 181
4, so an equation of L is
y 545 1814 x 0 or y 181
4 x 545.
c. The number of corporate fraud cases pending at the beginning of
2014 is estimated to be 1814 6 545, or approximately 817.
b.
t0
200400600
1 2 3 4 5 6
800y
67. a, b.
0
2468
1 2 3 4 5
10
x (years)
y ($m) c. The slope of L is m 90 58
5 1 32
4 08. Using the
point-slope form of an equation of a line, we have
y 58 08 x 1 08x 08, or y 08x 5.
d. Using the equation from part c with x 9, we have
y 08 9 5 122, or $122 million.
Full file at https://testbankuniv.eu/Applied-Mathematics-for-the-Managerial-Life-and-Social-Sciences-7th-Edition-Tan-Solutions-Manual
Full file at https://testbankuniv.eu/Applied-Mathematics-for-the-Managerial-Life-and-Social-Sciences-7th-Edition-Tan-Solutions-Manual
Page 10
60 2 FUNCTIONS AND THEIR GRAPHS
68. a. The slope of the line passing through P1 0 27 and P2 1 29 is m1 29 27
1 0 2, which is equal to the slope
of the line through P2 1 29 and P3 2 31, which is m2 31 29
2 1 2. Thus, the three points lie on the line L.
b. The percentage is of moviegoers who use social media to chat about movies in 2014 is estimated to be
31 2 2, or 35%.
c. y 27 2 x 0, so y 2x 27. The estimate for 2014 (t 4) is 2 4 27 35, as found in part (b).
69. True. The slope of the line is given by 24 1
2 .
70. True. If 1 k lies on the line, then x 1, y k must satisfy the equation. Thus 3 4k 12, or k 94 .
Conversely, if k 94 , then the point 1 k
1 9
4
satisfies the equation. Thus, 3 1 4
94
12, and so the
point lies on the line.
71. True. The slope of the line Ax By C 0 is A
B. (Write it in slope-intercept form.) Similarly, the slope of the
line ax by c 0 is a
b. They are parallel if and only if A
B a
b, that is, if Ab aB, or Ab aB 0.
72. False. Let the slope of L1 be m1 0. Then the slope of L2 is m2 1
m1 0.
73. True. The slope of the line ax by c1 0 is m1 a
b. The slope of the line bx ay c2 0 is m2 b
a.
Because m1m2 1, the straight lines are indeed perpendicular.
74. True. Set y 0 and we have Ax C 0 or x CA, and this is where the line intersects the x-axis.
75. Writing each equation in the slope-intercept form, we have y a1
b1x c1
b1(b1 0) and y a2
b2x c2
b2
(b2 0). Because two lines are parallel if and only if their slopes are equal, we see that the lines are parallel if and
only if a1
b1 a2
b2, or a1b2 b1a2 0.
76. The slope of L1 is m1 b 0
1 0 b. The slope of L2 is m2 c 0
1 0 c. Applying the Pythagorean theorem to
O AC and OC B gives O A2 12 b2 and O B2 12 c2. Adding these equations and applying the
Pythagorean theorem to O B A gives AB2 O A2 O B2 12 b2 12 c2 2 b2 c2. Also,
AB2 b c2, so b c2 2 b2 c2, b2 2bc c2 2 b2 c2, and 2bc 2, 1 bc. Finally,
m1m2 b c bc 1, as was to be shown.
Full file at https://testbankuniv.eu/Applied-Mathematics-for-the-Managerial-Life-and-Social-Sciences-7th-Edition-Tan-Solutions-Manual
Full file at https://testbankuniv.eu/Applied-Mathematics-for-the-Managerial-Life-and-Social-Sciences-7th-Edition-Tan-Solutions-Manual
Page 11
2.2 EQUATIONS OF LINES 61
Technology Exercises page 92
Graphing Utility
1.
-10 -5 0 5 10-10
-5
0
5
10 2.
-10 -5 0 5 10-10
-5
0
5
10
3.
-10 -5 0 5 10-10
-5
0
5
10 4.
-10 -5 0 5 10-10
-5
0
5
10
5. a.
-10 -5 0 5 10-10
-5
0
5
10 b.
-10 -5 0 5 10-10
0
10
20
6. a.
-10 -5 0 5 10-10
-5
0
5
10 b.
-10 0 10 20-10
-5
0
5
10
Full file at https://testbankuniv.eu/Applied-Mathematics-for-the-Managerial-Life-and-Social-Sciences-7th-Edition-Tan-Solutions-Manual
Full file at https://testbankuniv.eu/Applied-Mathematics-for-the-Managerial-Life-and-Social-Sciences-7th-Edition-Tan-Solutions-Manual
Page 12
62 2 FUNCTIONS AND THEIR GRAPHS
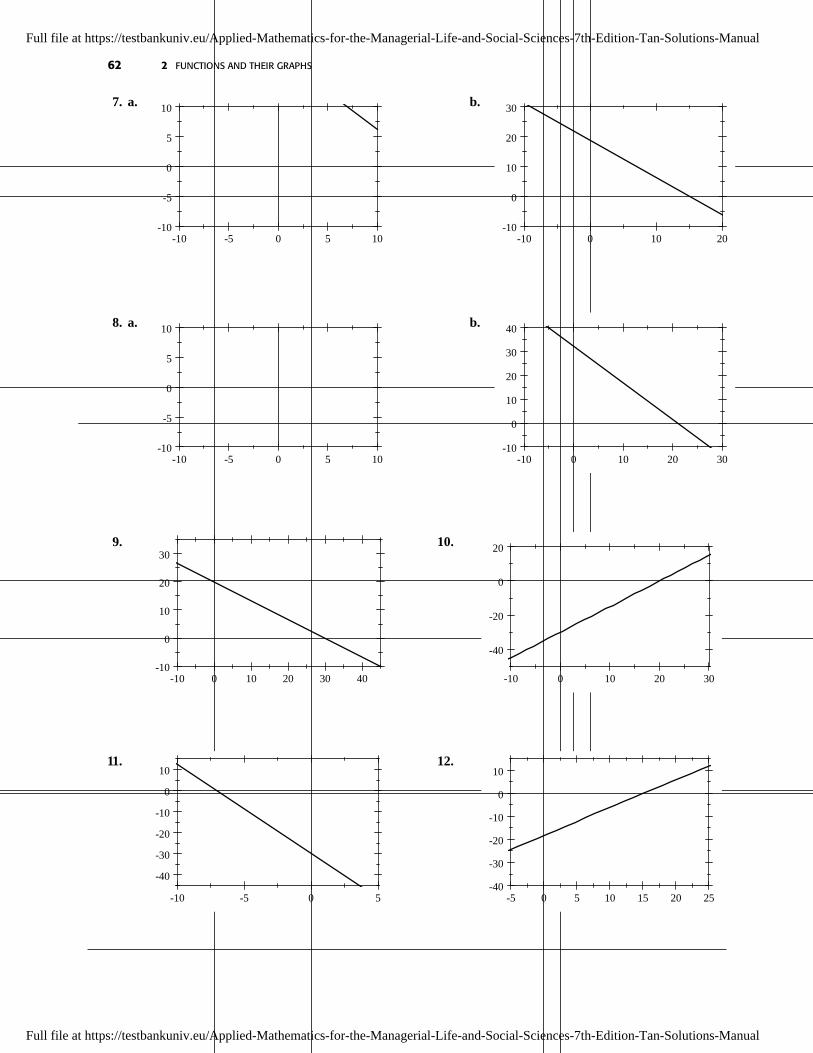
7. a.
-10 -5 0 5 10-10
-5
0
5
10 b.
-10 0 10 20-10
0
10
20
30
8. a.
-10 -5 0 5 10-10
-5
0
5
10 b.
-10 0 10 20 30-10
0
10
20
30
40
9.
-10 0 10 20 30 40-10
0
10
20
3010.
-10 0 10 20 30
-40
-20
0
20
11.
-10 -5 0 5
-40
-30
-20
-10
0
1012.
-5 0 5 10 15 20 25-40
-30
-20
-10
0
10
Full file at https://testbankuniv.eu/Applied-Mathematics-for-the-Managerial-Life-and-Social-Sciences-7th-Edition-Tan-Solutions-Manual
Full file at https://testbankuniv.eu/Applied-Mathematics-for-the-Managerial-Life-and-Social-Sciences-7th-Edition-Tan-Solutions-Manual
Page 13
2.2 EQUATIONS OF LINES 63
Excel
1. 3.2x + 2.1y - 6.72 = 0
-15
-10
-5
0
5
10
15
20
-15 -10 -5 0 5 10 15
x
y
2. 2.3x - 4.1y - 9.43 = 0
-10
-8
-6
-4
-2
0
2
4
-15 -10 -5 0 5 10 15
x
y
3. 1.6x + 5.1y = 8.16
-2
-1
0
1
2
3
4
5
6
-15 -10 -5 0 5 10 15
x
y
4. -3.2x + 2.1y = 6.72
-15
-10
-5
0
5
10
15
20
-15 -10 -5 0 5 10 15
x
y
5. 12.1x + 4.1y = 49.61
-30
-20
-10
0
10
20
30
40
50
-15 -10 -5 0 5 10 15
x
y
6. 4.1x - 15.2y = 62.32
-8
-6
-4
-2
0
2
-20 -10 0 10 20 30
x
7. 20x + 16y = 300
-10
0
10
20
30
40
-20 -10 0 10 20 30
x
y
8. 32.2x + 21y = 676.2
-20
-10
0
10
20
30
40
50
60
-20 -10 0 10 20 30 40
x
y
Full file at https://testbankuniv.eu/Applied-Mathematics-for-the-Managerial-Life-and-Social-Sciences-7th-Edition-Tan-Solutions-Manual
Full file at https://testbankuniv.eu/Applied-Mathematics-for-the-Managerial-Life-and-Social-Sciences-7th-Edition-Tan-Solutions-Manual
Page 14
64 2 FUNCTIONS AND THEIR GRAPHS
9. 20x + 30y = 600
-10
-5
0
5
10
15
20
25
30
-20 0 20 40 60
x
y
10. 30x - 20y = 600
-50
-40
-30
-20
-10
0
10
20
-20 -10 0 10 20 30 40
x
y
11. 22.4x + 16.1y = 352
-10
0
10
20
30
40
-20 -10 0 10 20 30
x
y
12. 18.2x - 15.1y = 274.8
-35
-30
-25
-20
-15
-10
-50
5
10
-20 -10 0 10 20 30
x
y
2.3 Functions and Their Graphs
Concept Questions page 100
1. a. A function is a rule that associates with each element in a set A exactly one element in a set B.
b. The domain of a function f is the set of all elements x in the set such that f x is an element in B. The range of
f is the set of all elements f x whenever x is an element in its domain.
c. An independent variable is a variable in the domain of a function f . The dependent variable is y f x.
2. a. The graph of a function f is the set of all ordered pairs x y such that y f x, x being an element in the
domain of f .
[ ]Domain
x
y
y=f(x)
0
Full file at https://testbankuniv.eu/Applied-Mathematics-for-the-Managerial-Life-and-Social-Sciences-7th-Edition-Tan-Solutions-Manual
Full file at https://testbankuniv.eu/Applied-Mathematics-for-the-Managerial-Life-and-Social-Sciences-7th-Edition-Tan-Solutions-Manual
Page 15
2.3 FUNCTIONS AND THEIR GRAPHS 65
b. Use the vertical line test to determine if every vertical line intersects the curve in at most one point. If so, then
the curve is the graph of a function.
3. a. Yes, every vertical line intersects the curve in at most one point.
b. No, a vertical line intersects the curve at more than one point.
c. No, a vertical line intersects the curve at more than one point.
d. Yes, every vertical line intersects the curve in at most one point.
4. The domain is [1 3 and [3 5 and the range is
12 2
and 2 4].
Exercises page 100
1. f x 5x 6. Therefore f 3 5 3 6 21, f 3 5 3 6 9, f a 5 a 6 5a 6,
f a 5 a 6 5a 6, and f a 3 5 a 3 6 5a 15 6 5a 21.
2. f x 4x 3. Therefore, f 4 4 4 3 16 3 13, f
14
4
14
3 1 3 2,
f 0 4 0 3 3, f a 4 a 3 4a 3, f a 1 4 a 1 3 4a 1.
3. g x 3x2 6x 3, so g 0 3 0 6 0 3 3, g 1 3 12 6 1 3 3 6 3 6,
g a 3 a2 6 a 3 3a2 6a 3, g a 3 a2 6 a 3 3a2 6a 3, and
g x 1 3 x 12 6 x 1 3 3x2 2x 1
6x 6 3 3x2 6x 3 6x 9 3x2 6.
4. h x x3 x2 x 1, so h 5 53 52 5 1 125 25 5 1 154,
h 0 03 02 0 1 1, h a a3 a2 a 1 a3 a2 a 1, and
h a a3 a2 a 1 a3 a2 a 1.
5. f x 2x 5, so f a h 2 a h 5 2a 2h 5, f a 2 a 5 2a 5,
fa2 2
a2 5 2a2 5, f a 2h 2 a 2h 5 2a 4h 5, and
f 2a h 2 2a h 5 4a 2h 5
6. g x x2 2x , g a h a h2 2 a h a2 2ah h2 2a 2h,
g a a2 2 a a2 2a a a 2, g
a a
2 2
a a 2
a,
a g a a a2 2a a2 3a a a 3, and1
g a 1
a2 2a 1
a a 2.
7. s t 2t
t2 1. Therefore, s 4 2 4
42 1 8
15, s 0 2 0
02 1 0,
s a 2 a
a2 1 2a
a2 1 s 2 a 2 2 a
2 a2 1 2 2 a
a2 4a 4 1 2 2 a
a2 4a 3, and
s t 1 2 t 1
t 12 1 2 t 1
t2 2t 1 1 2 t 1
t t 2.
8. g u 3u 232. Therefore, g 1 [3 1 2]32 132 1, g 6 [3 6 2]32 1632 43 64,
g
113
3
113
232 932 27, and g u 1 [3 u 1 2]32 3u 132.
Full file at https://testbankuniv.eu/Applied-Mathematics-for-the-Managerial-Life-and-Social-Sciences-7th-Edition-Tan-Solutions-Manual
Full file at https://testbankuniv.eu/Applied-Mathematics-for-the-Managerial-Life-and-Social-Sciences-7th-Edition-Tan-Solutions-Manual
Page 16
66 2 FUNCTIONS AND THEIR GRAPHS
9. f t 2t2
t 1
. Therefore, f 2 222
2 1
8, f a 2a2
a 1
, f x 1 2 x 12x 1 1
2 x 12x
,
and f x 1 2 x 12x 1 1
2 x 12x 2
.
10. f x 2 2
5 x . Therefore, f 4 2 2
5 4 2 2
9 2 2 3 8,
f 1 2 2
5 1 2 2
4 2 4 6, f
114
2 2
5 11
4
12 2 2
94
12 2 2
32
5,
and f x 5 2 2
5 x 5 2 2x .
11. Because x 2 0, we calculate f 2 22 1 4 1 5. Because x 0 0, we calculate
f 0 02 1 1. Because x 1 0, we calculate f 1 1 1.
12. Because x 2 2, g 2 12 2 1 1 1 2. Because x 0 2, g 0 1
2 0 1 0 1 1.
Because x 2 2, g 2 2 2 0. Because x 4 2, g 4 4 2 2.
13. Because x 1 1, f 1 12 12 3 5
2 . Because x 0 1, f 0 12 0
2 3 3. Because
x 1 1, f 1 212 1 3. Because x 2 1, f 2 2
22 1 9.
14. Because x 0 1, f 0 21 0 2 1 3. Because x 1 1, f 1 21 1 2 0 2.
Because x 2 1, f 2 1
1 2 1
1 1.
15. a. f 0 2.
b. (i) f x 3 when x 2. (ii) f x 0 when x 1.
c. [0 6]
d. [2 6]
16. a. f 7 3. b. x 4 and x 6. c. x 2; 0. d. [1 9]; [2 6].
17. g 2 22 1 3, so the point
2
3
lies on the graph of g.
18. f 3 3 132 7
2 416 2 4
4 2 3, so the point 3 3 lies on the graph of f .
19. f 2 2 12 1
31
3, so the point 23 does lie on the graph of f .
20. h 3 3 133 1
2
27 1 2
26 1
13, so the point
3 1
13
does lie on the graph of h.
21. Because the point 1 5 lies on the graph of f it satisfies the equation defining f . Thus,
f 1 2 12 4 1 c 5, or c 7.
22. Because the point 2 4 lies on the graph of f it satisfies the equation defining f . Thus,
f 2 2
9 22 c 4, or c 4 2
5.
23. Because f x is a real number for any value of x , the domain of f is .
Full file at https://testbankuniv.eu/Applied-Mathematics-for-the-Managerial-Life-and-Social-Sciences-7th-Edition-Tan-Solutions-Manual
Full file at https://testbankuniv.eu/Applied-Mathematics-for-the-Managerial-Life-and-Social-Sciences-7th-Edition-Tan-Solutions-Manual
Page 17
2.3 FUNCTIONS AND THEIR GRAPHS 67
24. Because f x is a real number for any value of x , the domain of f is .
25. f x is not defined at x 0 and so the domain of f is 0 and 0.
26. g x is not defined at x 1 and so the domain of g is 1 and 1.
27. f x is a real number for all values of x . Note that x2 1 1 for all x . Therefore, the domain of f is .
28. Because the square root of a number is defined for all real numbers greater than or equal to zero, we have x 5 0
or x 5, and the domain is [5.
29. Because the square root of a number is defined for all real numbers greater than or equal to zero, we have 5 x 0,
or x 5 and so x 5. (Recall that multiplying by1 reverses the sign of an inequality.) Therefore, the domain
of f is 5].
30. Because 2x2 3 is always greater than zero, the domain of g is .
31. The denominator of f is zero when x2 1 0, or x 1. Therefore, the domain of f is 1, 1 1, and
1.
32. The denominator of f is equal to zero when x2 x 2 x 2 x 1 0; that is, when x 2 or x 1.
Therefore, the domain of f is 2, 2 1, and 1.
33. f is defined when x 3 0, that is, when x 3. Therefore, the domain of f is [3.
34. g is defined when x 1 0; that is when x 1. Therefore, the domain of f is [1.
35. The numerator is defined when 1 x 0, x 1 or x 1. Furthermore, the denominator is zero when x 2.
Therefore, the domain is the set of all real numbers in 2 and 2 1].
36. The numerator is defined when x 1 0, or x 1, and the denominator is zero when x 2 and when x 3. So
the domain is [1 3 and 3.
37. a. The domain of f is the set of all real numbers.
b. f x x2 x 6, so
f 3 32 3 6 9 3 6 6,
f 2 22 2 6 4 2 6 0,
f 1 12 1 6 1 1 6 4,
f 0 02 0 6 6,
c.
0
10
_4 _2 2 4 x
y
5
_5
f
12
12
2
12
6 1
4 24 24
4 254 , f 1 12 1 6 6,
f 2 22 2 6 4 2 6 4, and f 3 32 3 6 9 3 6 0.
Full file at https://testbankuniv.eu/Applied-Mathematics-for-the-Managerial-Life-and-Social-Sciences-7th-Edition-Tan-Solutions-Manual
Full file at https://testbankuniv.eu/Applied-Mathematics-for-the-Managerial-Life-and-Social-Sciences-7th-Edition-Tan-Solutions-Manual
Page 18
68 2 FUNCTIONS AND THEIR GRAPHS
38. f x 2x2 x 3.
a. Because f x is a real number for all values of x , the domain of f
is .b.
x 3 2 1 12 0 1 2 3
y 12 3 2 3 3 0 7 18
c.
_4
0
4
8y
_3 _2 _1 1 2 x
39. f x 2x2 1 has domain and range
[1.
0
10
20
_3 _2 _1 1 2 x
y
40. f x 9 x2 has domain and range
9].
_8
_40
4
8
_4 _2 2 x
y
41. f x 2x has domain [0 and range
[2.
0
2
4
y
4 8 12 x
42. g x 4x has domain [0 and range
4].
0
2
4
1020
y
x
43. f x 1 x has domain 1] and range
[0
0
2
4
_10 1 x
y
44. f x x 1 has domain 1 and range
[0.
0
2
4
1 10 x
y
Full file at https://testbankuniv.eu/Applied-Mathematics-for-the-Managerial-Life-and-Social-Sciences-7th-Edition-Tan-Solutions-Manual
Full file at https://testbankuniv.eu/Applied-Mathematics-for-the-Managerial-Life-and-Social-Sciences-7th-Edition-Tan-Solutions-Manual
Page 19
2.3 FUNCTIONS AND THEIR GRAPHS 69
45. f x x 1 has domain and range
[1.
_2
0
2
_2 2 x
y
46. f x x 1 has domain and range
[1
0
2
4
_2 2 x
y
47. f x
x if x 0
2x 1 if x 0has domain
and range 0 and [1.
_4
0
4
_2 2 x
y
48. For x 2, the graph of f is the half-line y 4 x .
For x 2, the graph of f is the half-line y 2x 2.
f has domain and range [2.
_20
2
4
6
_4 _2 2 4 x
y
49. If x 1, the graph of f is the half-line y x 1.
For x 1, we calculate a few points: f 2 3,
f 3 8, and f 4 15. f has domain and range [0.
0
4
8
12
_4 _2 2 4 x
y
50. If x 1 the graph of f is the half-line
y x 1. For 1 x 1, the graph consists of
the line segment y 0. For x 1, the graph is the
half-line y x 1. f has domain and
range [0.
0
2
4
_3 _2 _1 1 2 3 x
y
51. Each vertical line cuts the given graph at exactly one point, and so the graph represents y as a function of x .
52. Because the y-axis, which is a vertical line, intersects the graph at two points, the graph does not represent y as a
function of x .
53. Because there is a vertical line that intersects the graph at three points, the graph does not represent y as a function
of x .
54. Each vertical line intersects the graph of f at exactly one point, and so the graph represents y as a function of x .
55. Each vertical line intersects the graph of f at exactly one point, and so the graph represents y as a function of x .
Full file at https://testbankuniv.eu/Applied-Mathematics-for-the-Managerial-Life-and-Social-Sciences-7th-Edition-Tan-Solutions-Manual
Full file at https://testbankuniv.eu/Applied-Mathematics-for-the-Managerial-Life-and-Social-Sciences-7th-Edition-Tan-Solutions-Manual
Page 20
70 2 FUNCTIONS AND THEIR GRAPHS
56. The y-axis intersects the circle at two points, and this shows that the circle is not the graph of a function of x .
57. Each vertical line intersects the graph of f at exactly one point, and so the graph represents y as a function of x .
58. A vertical line containing a line segment comprising the graph cuts it at infinitely many points and so the graph does
not define y as a function of x .
59. The circumference of a circle with a 5-inch radius is given by C 5 2π 5 10π, or 10π inches.
60. V 21 43π 21
3 3879, V 2 43π 8 3351, and so V 21 V 2 3879 3351 528 is the
amount by which the volume of a sphere of radius 21 exceeds the volume of a sphere of radius 2.
61. S r 4πr2.
62. a. The slope of the straight line passing through 0 061 and 10 059 is m1 059 061
10 0 0002
Therefore, an equation of the straight line passing through the two points is y 061 0002 t 0 or
y 0002t 061. Next, the slope of the straight line passing through 10 059 and 20 060 is
m2 060 059
20 10 0001, and so an equation of the straight line passing through the two points is
y 059 0001 t 10 or y 0001t 058. The slope of the straight line passing through 20 060 and
30 066 is m3 066 060
30 20 0006, and so an equation of the straight line passing through the two points is
y 060 0006 t 20 or y 0006t 048. The slope of the straight line passing through 30 066 and
400 078 is m4 078 066
40 30 0012, and so an equation of the straight line passing through the two points
is y 0012t 030. Therefore, a rule for f is f t
0002t 061 if 0 t 10
0001t 058 if 10 t 20
0006t 048 if 20 t 30
0012t 030 if 30 t 40
b. The gender gap was expanding between 1960 and 1970 and shrinking between 1970 and 2000.
c. The gender gap was expanding at the rate of 0002yr between 1960 and 1970, shrinking at the rate of 0001yr
between 1970 and 1980, shrinking at the rate of 0006yr between 1980 and 1990, and shrinking at the rate of
0012yr between 1990 and 2000.
63. a. The slope of the straight line passing through the points 0 058 and 20 095 is m1 095 058
20 0 00185,
so an equation of the straight line passing through these two points is y 058 00185 t 0
or y 00185t 058. Next, the slope of the straight line passing through the points 20 095
and 30 11 is m2 11 095
30 20 0015, so an equation of the straight line passing through
the two points is y 095 0015 t 20 or y 0015t 065. Therefore, a rule for f is
f t
00185t 058 if 0 t 20
0015t 065 if 20 t 30
b. The ratios were changing at the rates of 00185yr from 1960 through 1980 and 0015yr from 1980 through
1990.
Full file at https://testbankuniv.eu/Applied-Mathematics-for-the-Managerial-Life-and-Social-Sciences-7th-Edition-Tan-Solutions-Manual
Full file at https://testbankuniv.eu/Applied-Mathematics-for-the-Managerial-Life-and-Social-Sciences-7th-Edition-Tan-Solutions-Manual
Page 21
2.3 FUNCTIONS AND THEIR GRAPHS 71
c. The ratio was 1 when t 203. This shows that the number of bachelor’s degrees earned by women equaled the
number earned by men for the first time around 1983.
64. The projected number in 2030 is P 20 00002083 203 00157 202 0093 20 52 79536, or
approximately 8 million.
The projected number in 2050 is P 40 00002083 403 00157 402 0093 40 52 132688, or
approximately 133 million.
65. N t t3 6t2 15t . Between 8 a.m. and 9 a.m., the average worker can be expected to assemble
N 1 N 0 1 6 15 0 20, or 20 walkie-talkies. Between 9 a.m. and 10 a.m., we expect that
N 2 N 1 23 622 15 2
1 6 15 46 20 26, or 26 walkie-talkies can be assembled
by the average worker.
66. When the proportion of popular votes won by the Democratic presidential candidate is 060, the
proportion of seats in the House of Representatives won by Democratic candidates is given by
s 06 063
063 1 063 0216
0216 0064 0216
0280 077.
67. The amount spent in 2004 was S 0 56, or $56 billion. The amount spent in 2008 was
S 4 003 43 02 42 023 4 56 78, or $78 billion.
68. a.Year 2006 2007 2008
Rate 9675 10084 10669
b.
9698
100102104106108
0 1 2 3 t
f(t)
69. a. The assets at the beginning of 2002 were $06 trillion. At the beginning of 2003, they were f 1 06, or
$06 trillion.
b. The assets at the beginning of 2005 were f 3 06 3043 096, or $096 trillion. At the beginning of 2007,
they were f 5 06 5043 120, or $12 trillion.
70. a. The median age of the U.S. population at the beginning of 1900
was f 0 229, or 229 years; at the beginning of 1950 it was
f 5 07 52 72 5 115 30, or 30 years; and at the
beginning of 2000 it was f 10 26 10 94 354, or
354 years.
b.
24
28
32
36
0 5 10 t
f(t)
Full file at https://testbankuniv.eu/Applied-Mathematics-for-the-Managerial-Life-and-Social-Sciences-7th-Edition-Tan-Solutions-Manual
Full file at https://testbankuniv.eu/Applied-Mathematics-for-the-Managerial-Life-and-Social-Sciences-7th-Edition-Tan-Solutions-Manual
Page 22
72 2 FUNCTIONS AND THEIR GRAPHS
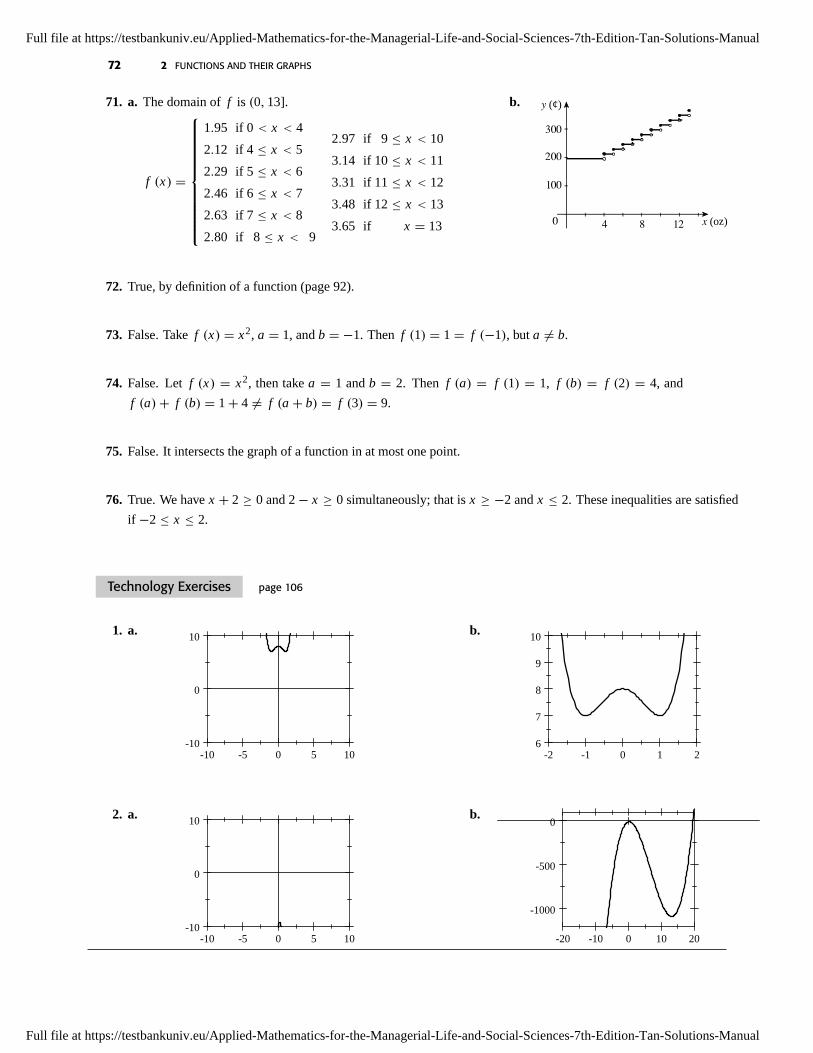
71. a. The domain of f is 0 13].
f x
195 if 0 x 4
212 if 4 x 5
229 if 5 x 6
246 if 6 x 7
263 if 7 x 8
280 if 8 x 9
297 if 9 x 10
314 if 10 x 11
331 if 11 x 12
348 if 12 x 13
365 if x 13
b.
0
100
200
4 8 12 x (oz)
300
y (¢)
72. True, by definition of a function (page 92).
73. False. Take f x x2, a 1, and b 1. Then f 1 1 f 1, but a b.
74. False. Let f x x2, then take a 1 and b 2. Then f a f 1 1, f b f 2 4, and
f a f b 1 4 f a b f 3 9.
75. False. It intersects the graph of a function in at most one point.
76. True. We have x 2 0 and 2 x 0 simultaneously; that is x 2 and x 2. These inequalities are satisfied
if 2 x 2.
Technology Exercises page 106
1. a.
-10 -5 0 5 10-10
0
10 b.
-2 -1 0 1 26
7
8
9
10
2. a.
-10 -5 0 5 10-10
0
10 b.
-20 -10 0 10 20
-1000
-500
0
Full file at https://testbankuniv.eu/Applied-Mathematics-for-the-Managerial-Life-and-Social-Sciences-7th-Edition-Tan-Solutions-Manual
Full file at https://testbankuniv.eu/Applied-Mathematics-for-the-Managerial-Life-and-Social-Sciences-7th-Edition-Tan-Solutions-Manual
Page 23
2.3 FUNCTIONS AND THEIR GRAPHS 73
3. a.
-10 -5 0 5 10-10
0
10 b.
-3 -2 -1 0 1 2 3-2
-1
0
1
2
4. a.
-10 -5 0 5 10-10
0
10 b.
-4 -2 0 2 4
-4
-2
0
2
4
5.
-2 0 2 40
100
200 6.
-2 -1 0 1 2-20
-10
0
10
7.
-2 -1 0 1 2-4
-2
0
2
4 8.
-4 -2 0 2 4-10
0
10
20
30
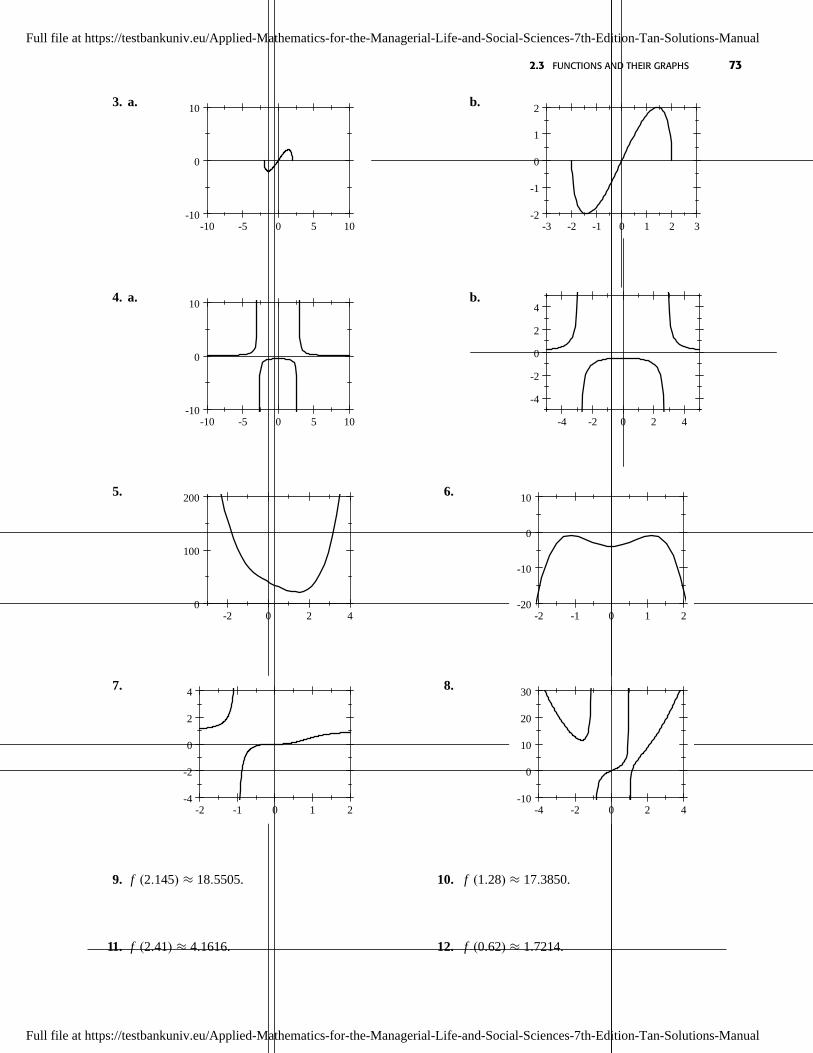
9. f 2145 185505. 10. f 128 173850.
11. f 241 41616. 12. f 062 17214.
Full file at https://testbankuniv.eu/Applied-Mathematics-for-the-Managerial-Life-and-Social-Sciences-7th-Edition-Tan-Solutions-Manual
Full file at https://testbankuniv.eu/Applied-Mathematics-for-the-Managerial-Life-and-Social-Sciences-7th-Edition-Tan-Solutions-Manual
Page 24
74 2 FUNCTIONS AND THEIR GRAPHS
13. a.
0 1 2 3 4 5 60
5
10
15
b. The amount spent in the year 2005 was
f 2 942, or approximately $94 billion. In
2009, it was f 6 1388, or approximately
$139 billion.
14. a.
20 30 40 50 60 70 800
2
4
6
8
b. f 18 33709, f 50 0971, and
f 80 44078.
15. a.
6 7 8 9 10 11
50
100
150
b. f 6 447, f 8 527, and
f 11 1292.
2.4 The Algebra of Functions
Concept Questions page 112
1. a. P x1 R x1 C x1 gives the profit if x1 units are sold.
b. P x2 R x2 C x2. Because P x2 0, R x2 C x2 [R x2 C x2] gives the loss
sustained if x2 units are sold.
2. a. f g x f x g x, f g x f x g x, and f g x f x g x; all have domain A B.
fg x f x
g xhas domain A B excluding x A B such that g x 0.
b. f g 2 f 2 g 2 3 2 1, f g 2 f 2 g 2 3 2 5,
f g 2 f 2 g 2 3 2 6, and fg 2 f 2
g 2 3
2 3
2
3. a. y f g x f x g x b. y f g x f x g x
c. y f g x f x g x d. y
f
g
x f x
g x
4. a. The domain of f g x f g x is the set of all x in the domain of g such that g x is in the domain of f .
The domain of g f x g f x is the set of all x in the domain of f such that f x is in the domain of g.
Full file at https://testbankuniv.eu/Applied-Mathematics-for-the-Managerial-Life-and-Social-Sciences-7th-Edition-Tan-Solutions-Manual
Full file at https://testbankuniv.eu/Applied-Mathematics-for-the-Managerial-Life-and-Social-Sciences-7th-Edition-Tan-Solutions-Manual
Page 25
2.4 THE ALGEBRA OF FUNCTIONS 75
b. g f 2 g f 2 g 3 8. We cannot calculate f g 3 because f g 3 f g 3 f 8,
and we don’t know the value of f 8.
5. No. Let A , f x x , and g x x . Then a 1 is in A, but
g f 1 g f 1 g 1 1 is not defined.
6. The required expression is P g f p.
Exercises page 112
1. f g x f x g x x3 5 x2 2
x3 x2 3.
2. f g x f x g x x3 5 x2 2
x3 x2 7.
3. f g x f x g x x3 5
x2 2 x5 2x3 5x2 10.
4. g f x g x f x x2 2
x3 5 x5 2x3 5x2 10.
5.f
gx f x
g x x3 5
x2 2.
6.f g
hx f x g x
h x x3 5 x2 2
2x 4
x3 x2 7
2x 4.
7.f g
hx f x g x
h xx3 5
x2 2
2x 4
x5 2x3 5x2 10
2x 4.
8. f gh x f x g x h x x3 5
x2 22x 4 x5 2x3 5x2 10
2x 4
2x6 4x4 10x3 20x 4x5 8x3 20x2 40 2x6 4x5 4x4 2x3 20x2 20x 40.
9. f g x f x g x x 1x 1.
10. g f x g x f x x 1 x 1 x 1 x 1.
11. f g x f x g x x 1
x 1. 12. g f x g x f x x 1 x 1.
13.g
hx g x
h x
x 1
2x3 1. 14.
h
gx h x
g x 2x3 1
x 1.
15.f g
hx x 1
x 1
2x3 1
. 16.f h
gx x 1
2x3 1
x 1 2x4 2x3 x 1
x 1.
17.f h
gx x 1 2x3 1
x 1 x 2x3
x 1
. 18.gh
g fx
x 1
2x3 1
x 1 x 1
x 12x3 1
x 1 x 1.
19. f g x x2 5 x 2 x2 x 3, f g x x2 5 x 2 x2 x 7,
f g x x2 5
x 2, and
f
g
x x2 5
x 2.
Full file at https://testbankuniv.eu/Applied-Mathematics-for-the-Managerial-Life-and-Social-Sciences-7th-Edition-Tan-Solutions-Manual
Full file at https://testbankuniv.eu/Applied-Mathematics-for-the-Managerial-Life-and-Social-Sciences-7th-Edition-Tan-Solutions-Manual
Page 26
76 2 FUNCTIONS AND THEIR GRAPHS
20. f g x x 1 x3 1, f g x x 1 x3 1, f g x x 1x3 1
, and
f
g
x
x 1
x3 1.
21. f g x x 3 1
x 1 x 1
x 3 1
x 1, f g x x 3 1
x 1 x 1
x 3 1
x 1,
f g x x 3
1
x 1
x 3
x 1, and
f
g
x 3 x 1.
22. f g x 1
x2 1 1
x2 1 x2 1 x2 1
x2 1
x2 1 2x2
x2 1
x2 1 ,
f g x 1
x2 1 1
x2 1 x2 1 x2 1
x2 1
x2 1 2
x2 1
x2 1 , f g x 1
x2 1
x2 1 , and
f
g
x x2 1
x2 1.
23. f g x x 1
x 1 x 2
x 2 x 1 x 2 x 2 x 1
x 1 x 2 x2 x 2 x2 x 2
x 1 x 2
2x2 4
x 1 x 2 2
x2 2
x 1 x 2
,
f g x x 1
x 1 x 2
x 2 x 1 x 2 x 2 x 1
x 1 x 2 x2 x 2 x2 x 2
x 1 x 2
2x
x 1 x 2,
f g x x 1 x 2
x 1 x 2, and
f
g
x x 1 x 2
x 1 x 2.
24. f g x x2 1 x 1, f g x x2 1 x 1, f g x x2 1
x 1, andf
g
x x2 1
x 1.
25. f g x f g x fx2
x22 x2 1 x4 x2 1 and
g f x g f x gx2 x 1
x2 x 12
.
26. f g x f g x 3g x
2 2g x 1 3 x 32 2 x 3 1 3x2 20x 34 and
g f x g f x f x 3 3x2 2x 1 3 3x2 2x 4.
27. f g x f g x fx2 1
x2 1 1 and
g f x g f x g
x 1 x 1
2 1 x 2
x 1 1 x 2
x .
28. f g x f g x 2
g x 3 2
x2 1 3 and
g f x g f x f x2 1 2x 3
2 1 4x 12
x 10.
Full file at https://testbankuniv.eu/Applied-Mathematics-for-the-Managerial-Life-and-Social-Sciences-7th-Edition-Tan-Solutions-Manual
Full file at https://testbankuniv.eu/Applied-Mathematics-for-the-Managerial-Life-and-Social-Sciences-7th-Edition-Tan-Solutions-Manual
Page 27
2.4 THE ALGEBRA OF FUNCTIONS 77
29. f g x f g x f
1
x
1
x
1
x2 1
1
x x2
x2 1 x
x2 1and
g f x g f x g
x
x2 1
x2 1
x.
30. f g x f g x f
1
x 1
x
x 1and
g f x g f x g
x 1 1
x 1 1
x 1 1x 1 1
x 1 1
x.
31. h 2 g f 2. But f 2 22 2 1 7, so h 2 g 7 49.
32. h 2 g f 2. But f 2 22 113 313, so h 2 g
313
3313
3 1 3 3 1 10.
33. h 2 g f 2. But f 2 1
2 2 1 1
5, so h 2 g
1
5
1
5
5
5.
34. h 2 g f 2. But f 2 1
2 1 1, so g 1 12 1 2.
35. f x 2x3 x2 1, g x x5. 36. f x 3x2 4, g x x3.
37. f x x2 1, g x x . 38. f x 2x 3, g x x32.
39. f x x2 1, g x 1
x. 40. f x x2 4, g x 1
x.
41. f x 3x2 2, g x 1
x32. 42. f x 2x 1, g x 1
x x .
43. f a h f a [3 a h 4] 3a 4 3a 3h 4 3a 4 3h.
44. f a h f a 12 a h 3
1
2a 3 1
2a 12h 3 1
2a 3 12 h.
45. f a h f a 4 a h2 4 a2 4 a2 2ah h2 4 a2 2ah h2 h 2a h.
46. f a h f a a h2 2 a h 1 a2 2a 1
a2 2ah h2 2a 2h 1 a2 2a 1 h 2a h 2.
47.f a h f a
ha h2 1
a2 1
h a2 2ah h2 1 a2 1
h 2ah h2
h
h 2a h
h 2a h.
48.f a h f a
h2 a h2 a h 1
2a2 a 1
h
2a2 4ah 2h2 a h 1 2a2 a 1
h 4ah 2h2 h
h 4a 2h 1.
Full file at https://testbankuniv.eu/Applied-Mathematics-for-the-Managerial-Life-and-Social-Sciences-7th-Edition-Tan-Solutions-Manual
Full file at https://testbankuniv.eu/Applied-Mathematics-for-the-Managerial-Life-and-Social-Sciences-7th-Edition-Tan-Solutions-Manual
Page 28
78 2 FUNCTIONS AND THEIR GRAPHS
49.f a h f a
ha h3 a h
a3 a
h a3 3a2h 3ah2 h3 a h a3 a
h
3a2h 3ah2 h3 h
h 3a2 3ah h2 1.
50.f a h f a
h2 a h3 a h2 1
2a3 a2 1
h
2a3 6a2h 6ah2 2h3 a2 2ah h2 1 2a3 a2 1
h
6a2h 6ah2 2h3 2ah h2
h 6a2 6ah 2h2 2a h.
51.f a h f a
h
1
a h 1
ah
a a h
a a hh
1
a a h.
52.f a h f a
h
a h a
h
a h aa h a
a h a
h
a h a 1
a h a.
53. F t represents the total revenue for the two restaurants at time t .
54. F t represents the net rate of growth of the species of whales in year t .
55. f t g t represents the dollar value of Nancy’s holdings at time t .
56. f t g t represents the unit cost of the commodity at time t .
57. g f is the function giving the amount of carbon monoxide pollution from cars in parts per million at time t .
58. f g is the function giving the revenue at time t .
59. C x 06x 12,100.
60. a. h t f t g t 3t 69 02t 138 32t 552, 0 t 5.
b. f 5 3 5 69 84, g 5 02 5 138 128, and h 5 32 5 552 712.
Since f 5 g 5 84 128 712, we see that h 5 is indeed equal to f 5 g 5.
61. D t D2 D1 t D2 t D1 t 0035t2 021t 024
00275t2 0081t 007
00075t2 0129t 017.
The function D gives the difference in year t between the deficit without the $160 million rescue package and the
deficit with the rescue package.
62. a. g f 0 g f 0 g 064 26, so the mortality rate of motorcyclists in the year 2000 was 26 per
100 million miles traveled.
b. g f 6 g f 6 g 051 42, so the mortality rate of motorcyclists in 2006 was 42 per
100 million miles traveled.
c. Between 2000 and 2006, the percentage of motorcyclists wearing helmets had dropped from 64 to 51, and as a
consequence, the mortality rate of motorcyclists had increased from 26 million miles traveled to 42 million miles
traveled.
Full file at https://testbankuniv.eu/Applied-Mathematics-for-the-Managerial-Life-and-Social-Sciences-7th-Edition-Tan-Solutions-Manual
Full file at https://testbankuniv.eu/Applied-Mathematics-for-the-Managerial-Life-and-Social-Sciences-7th-Edition-Tan-Solutions-Manual
Page 29
2.4 THE ALGEBRA OF FUNCTIONS 79
63. a. g f 1 g f 1 g 406 23. So in 2002, the percentage of reported serious crimes that end in arrests
or in the identification of suspects was 23.
b. g f 6 g f 6 g 326 18. In 2007, 18% of reported serious crimes ended in arrests or in the
identification of suspects.
c. Between 2002 and 2007, the total number of detectives had dropped from 406 to 326 and as a result, the
percentage of reported serious crimes that ended in arrests or in the identification of suspects dropped from 23 to
18.
64. a. C x 0000003x3 003x2 200x 100,000.
b. P x R x C x 01x2 500x 0000003x3 003x2 200x 100,000
0000003x3 007x2 300x 100,000.
c. P 1500 0000003 15003 007 15002 300 1500 100,000 182,375, or $182,375.
65. a. C x V x 20000 0000001x3 001x2 50x 20000 0000001x3 001x2 50x 20,000.
b. P x R x C x 002x2 150x 0000001x3 001x2 50x 20,000
0000001x3 001x2 100x 20,000.
c. P 2000 0000001 20003 001 20002 100 2000 20,000 132,000, or $132,000.
66. a. D t R t S t
0023611t3 019679t2 034365t 242 0015278t3 011179t2 002516t 264
0038889t3 030858t2 031849t 022, 0 t 6.
b. S 3 3309084, R 3 2317337, and D 3 0991747, so the spending, revenue, and deficit are
approximately $331 trillion, $232 trillion, and $099 trillion, respectively.
c. Yes: R 3 S 3 2317337 3308841 0991504 D 3.
67. a. h t f t g t 4389t3 47833t2 37449t 2390 13222t3 132524t2 7579t 7481
17611t3 180357t2 113239t 9871, 1 t 7.
b. f 6 3862976 and g 6 10,113488, so f 6 g 6 13,976464. The worker’s contribution was
approximately $386298, the employer’s contribution was approximately $10,11349, and the total contributions
were approximately $13,97646.
c. h 6 13,976 f 6 g 6, as expected.
68. a. N r t 7
1 002
5t 75
t 10
2.
Full file at https://testbankuniv.eu/Applied-Mathematics-for-the-Managerial-Life-and-Social-Sciences-7th-Edition-Tan-Solutions-Manual
Full file at https://testbankuniv.eu/Applied-Mathematics-for-the-Managerial-Life-and-Social-Sciences-7th-Edition-Tan-Solutions-Manual
Page 30
80 2 FUNCTIONS AND THEIR GRAPHS
b. N r 0 7
1 002
5 0 75
0 10
2 7
1 002
75
10
2 329, or 329 million units.
N r 12 7
1 002
5 12 75
12 10
2 7
1 002
135
22
2 399, or 399 million units.
N r 18 7
1 002
5 18 75
18 10
2 7
1 002
165
28
2 413, or 413 million units.
69. a. The occupancy rate at the beginning of January is r 0 1081 0
3 103 0
2 2009 0 55 55, or 55%.
r 5 1081 5
3 103 5
2 2009 5 55 982, or approximately 982%.
b. The monthly revenue at the beginning of January is R 55 35000 553 9
50 552 44468, or
approximately $444,700.
The monthly revenue at the beginning of June is R 982 35000 9823 9
50 9822 11676, or
approximately $1,167,600.
70. N t 142 x t 142 7 t 102
t 102 2 t 152 994 t 102
t 102 2 t 152. The number of jobs created 6 months
from now will be N 6 994 162
162 2 212 224, or approximately 224 million jobs. The number of jobs created
12 months from now will be N 12 994 222
222 2 272 248, or approximately 248 million jobs.
71. a. s f g h f g h f g h. This suggests we define the sum s by
s x f g h x f x g x h x.
b. Let f , g, and h define the revenue (in dollars) in week t of three branches of a store. Then its total revenue (in
dollars) in week t is s t f g h t f t g t h t.
72. a. h g f x h g f x
b. Let t denote time. Suppose f gives the number of people at time t in a town, g gives the number of cars as a
function of the number of people in the town, and H gives the amount of carbon monoxide in the atmosphere.
Then h g f t h g f t gives the amount of carbon monoxide in the atmosphere at time t .
73. True. f g x f x g x g x f x g f x.
74. False. Let f x x 2 and g x x . Then g f x x 2 is defined at x 1, But
f g x x 2 is not defined at x 1.
75. False. Take f x x and g x x 1. Then g f x x 1, but f g x x 1.
76. False. Take f x x1. Then f f x f f x x2, but f 2 x f x2 x 12 x22x1.
77. True. h g f x h g f x h g f x and h g f x h g f x h g f x.
78. False. Take h x x , g x x , and f x x2. Then
h g f x hx x2
x x2 h g h f x h g x h f x x x2.
Full file at https://testbankuniv.eu/Applied-Mathematics-for-the-Managerial-Life-and-Social-Sciences-7th-Edition-Tan-Solutions-Manual
Full file at https://testbankuniv.eu/Applied-Mathematics-for-the-Managerial-Life-and-Social-Sciences-7th-Edition-Tan-Solutions-Manual
Page 31
2.5 LINEAR FUNCTIONS AND MATHEMATICAL MODELS 81
2.5 Linear Functions and Mathematical Models
Concept Questions page 123
1. a. A linear function is a function of the form f x mx b, where m and b are constants. For example,
f x 2x 3 is a linear function.
b. The domain and range of a linear function are both .c. The graph of a linear function is a straight line.
2. c x cx F ,R x sx , P x s cx F
3.
x
y=C(x)
y=R(x)
y
0
P(xü, yü)
xü
yü
4. a. The initial investment was V 0 50,000 4000 0 50,000, or $50,000.
b. The rate of growth is the slope of the line with the given equation, that is, $4000 per year.
Exercises page 124
1. Yes. Solving for y in terms of x , we find 3y 2x 6, or y 23 x 2.
2. Yes. Solving for y in terms of x , we find 4y 2x 7, or y 12 x 7
4 .
3. Yes. Solving for y in terms of x , we find 2y x 4, or y 12 x 2.
4. Yes. Solving for y in terms of x , we have 3y 2x 8, or y 23 x 8
3
5. Yes. Solving for y in terms of x , we have 4y 2x 9, or y 12 x 9
4 .
6. Yes. Solving for y in terms of x , we find 6y 3x 7, or y 12 x 7
6
7. y is not a linear function of x because of the quadratic term 2x2.
8. y is not a linear function of x because of the nonlinear term 3
x .
9. y is not a linear function of x because of the nonlinear term 3y2.
10. y is not a linear function of x because of the nonlinear term
y.
11. a. C x 8x 40,000, where x is the number of units produced.
b. R x 12x , where x is the number of units sold.
c. P x R x C x 12x 8x 40,000 4x 40,000.
Full file at https://testbankuniv.eu/Applied-Mathematics-for-the-Managerial-Life-and-Social-Sciences-7th-Edition-Tan-Solutions-Manual
Full file at https://testbankuniv.eu/Applied-Mathematics-for-the-Managerial-Life-and-Social-Sciences-7th-Edition-Tan-Solutions-Manual
Page 32
82 2 FUNCTIONS AND THEIR GRAPHS
d. P 8000 4 8000 40,000 8000, or a loss of $8,000. P 12,000 4 12,000 40,000 8000, or a
profit of $8000.
12. a. C x 14x 100,000.
b. R x 20x .
c. P x R x C x 20x 14x 100,000 6x 100,000.
d. P 12,000 6 12,000 100,000 28,000, or a loss of $28,000.
P 20,000 6 20,000 100,000 20,000, or a profit of $20,000.
13. f 0 2 gives m 0 b 2, or b 2. Thus, f x mx 2. Next, f 3 1 gives m 3 2 1, or
m 1.
14. The fact that the straight line represented by f x mx b has slope 1 tells us that m 1 and so
f x x b. Next, the condition f 2 4 gives f 2 1 2 b 4, or b 6.
15. We solve the system y 3x 4, y 2x 14. Substituting the first equation into the second yields
3x 4 2x 14, 5x 10, and x 2. Substituting this value of x into the first equation yields y 3 2 4, so
y 10. Thus, the point of intersection is 2 10.
16. We solve the system y 4x 7, y 5x 10. Substituting the first equation into the second yields
4x 7 5x 10, 4x 7 5x 10, and x 3. Substituting this value of x into the first equation, we
obtain y 4 3 7 12 7 5. Therefore, the point of intersection is 3 5.
17. We solve the system 2x 3y 6, 3x 6y 16. Solving the first equation for y, we obtain 3y 2x 6 ,
so y 23 x 2 Substituting this value of y into the second equation, we obtain 3x 6
23 x 2
16,
3x 4x 12 16, 7x 28, and x 4. Then y 23 4 2 2
3 , so the point of intersection is
4 23
.
18. We solve the system 2x 4y 11, 5x 3y 5. Solving the first equation for x , we find x 2y 112 .
Substituting this value into the second equation of the system, we have 52y 11
2
3y 5, so
10y 552 3y 5, 20y 55 6y 10, 26y 65, and y 5
2 . Substituting this value of y into the first equation,
we have 2x 4
52
11, so 2x 1 and x 1
2 . Thus, the point of intersection is
12
52
.
19. We solve the system y 14 x 5, 2x 3
2 y 1. Substituting the value of y given in the first equation into the
second equation, we obtain 2x 32
14 x 5
1, so 2x 3
8 x 152 1, 16x 3x 60 8, 13x 52, and
x 4. Substituting this value of x into the first equation, we have y 14 4 5 1 5, so y 6.
Therefore, the point of intersection is 46.
20. We solve the system y 23 x 4, x 3y 3 0 . Substituting the first equation into the second equation, we
obtain x 3
23 x 4
3 0, so x 2x 12 3 0, 3x 9, and x 3. Substituting this value of x into the
first equation, we have y 23 3 4 2. Therefore, the point of intersection is 32.
Full file at https://testbankuniv.eu/Applied-Mathematics-for-the-Managerial-Life-and-Social-Sciences-7th-Edition-Tan-Solutions-Manual
Full file at https://testbankuniv.eu/Applied-Mathematics-for-the-Managerial-Life-and-Social-Sciences-7th-Edition-Tan-Solutions-Manual
Page 33
2.5 LINEAR FUNCTIONS AND MATHEMATICAL MODELS 83
21. We solve the equation R x C x, or 15x 5x 10,000, obtaining 10x 10,000, or x 1000. Substituting
this value of x into the equation R x 15x , we find R 1000 15,000. Therefore, the break-even point is
1000 15000.
22. We solve the equation R x C x, or 21x 15x 12,000, obtaining 6x 12,000, or x 2000. Substituting
this value of x into the equation R x 21x , we find R 2000 42,000. Therefore, the break-even point is
2000 42000.
23. We solve the equation R x C x, or 04x 02x 120, obtaining 02x 120, or x 600. Substituting this
value of x into the equation R x 04x , we find R 600 240. Therefore, the break-even point is 600 240.
24. We solve the equation R x C x or 270x 150x 20,000, obtaining 120x 20,000 or x 5003 167.
Substituting this value of x into the equation R x 270x , we find R 167 45,090. Therefore, the break-even
point is 167 45090.
25. Let V be the book value of the office building after 2008. Since V 1,000,000 when t 0, the line passes through
0 1000000. Similarly, when t 50, V 0, so the line passes through 50 0. Then the slope of the line is
given by m 0 1,000,000
50 0 20,000 Using the point-slope form of the equation of a line with the point
0 1000000, we have V 1,000,000 20,000 t 0, or V 20,000t 1,000,000.
In 2013, t 5 and V 20,000 5 1,000,000 900,000, or $900,000.
In 2018, t 10 and V 20,000 10 1,000,000 800,000, or $800,000.
26. Let V be the book value of the automobile after 5 years. Since V 34,000 when t 0, and V 0 when t 5, the
slope of the line L is m 0 34,000
5 0 6800. Using the point-slope form of an equation of a line with the point
0 5, we have V 0 6800 t 5, or V 6800t 34,000. If t 3, V 6800 3 34,000 13,600.
Therefore, the book value of the automobile at the end of three years will be $13,600.
27. a. y I x 1033x , where x is the monthly benefit before adjustment and y is the adjusted monthly benefit.
b. His adjusted monthly benefit is I 1220 1033 1220 126026, or $126026.
28. C x 8x 48,000.
b. R x 14x .
c. P x R x C x 14x 8x 48,000 6x 48,000.
d. P 4000 6 4000 48,000 24,000, a loss of $24,000.
P 6000 6 6000 48,000 12,000, a loss of $12,000.
P 10,000 6 10,000 48,000 12,000, a profit of $12,000.
29. Let the number of tapes produced and sold be x . Then C x 12,100 060x , R x 115x , and
P x R x C x 115x 12,100 060x 055x 12,100.
Full file at https://testbankuniv.eu/Applied-Mathematics-for-the-Managerial-Life-and-Social-Sciences-7th-Edition-Tan-Solutions-Manual
Full file at https://testbankuniv.eu/Applied-Mathematics-for-the-Managerial-Life-and-Social-Sciences-7th-Edition-Tan-Solutions-Manual
Page 34
84 2 FUNCTIONS AND THEIR GRAPHS
30. a. Let V denote the book value of the machine after t years.
Since V 250,000 when t 0 and V 10,000 when
t 10, the line passes through the points 0 250000 and
10 10000. The slope of the line through these points is
given by m 10,000 250,000
10 0 240,000
10 24,000.
Using the point-slope form of an equation of a line with the
b.
0
50,000100,000150,000200,000250,000
2 4 6 8 10 12 t
V
(10, 10000)
point 10 10000, we have V 10,000 24,000 t 10, or V 24,000t 250,000.
c. In 2014, t 4 and V 24,000 4 250,000 154,000, or $154,000.
d. The rate of depreciation is given by m, or $24,000yr.
31. Let the value of the workcenter system after t years be V . When t 0, V 60,000 and when t 4, V 12,000.
a. Since m 12,000 60,000
4 48,000
4 12,000, the
rate of depreciation m is $12,000yr.
b. Using the point-slope form of the equation of a line with the
point 4 12000, we have V 12,000 12,000 t 4,
or V 12,000t 60,000.
d. When t 3, V 12,000 3 60,000 24,000, or
$24,000.
c.
010,00020,00030,00040,00050,00060,000
1 2 3 4 5 6 t
V
32. The slope of the line passing through the points 0C and N S is m S C
N 0 S C
N C S
N. Using the
point-slope form of an equation of a line with the point 0C, we have V C C S
Nt , or V C C S
Nt .
33. The formula given in Exercise 32 is V C C S
Nt . When C 1,000,000, N 50, and
S 0, we have V 1,000,000 1,000,000 0
50t , or V 1,000,000 20,000t . In 2013, t 5 and
V 1,000,00020,000 5 900,000, or $900,000. In 2018, t 10 and V 1,000,00020,000 10 800,000,
or $800,000.
34. The formula given in Exercise 32 is V C C S
Nt . When C 34,000, N 5, and S 0, we have
V 34,000 34,000 0
5t 34,000 6800t . When t 3, V 34,000 6800 3 13,600, or $13,600.
35. a. D S Sa
17. If we think of D as having the form D S mS b, then m a
17, b 0, and D is a linear
function of S.
b. D 04 500 04
17 117647, or approximately 11765 mg.
36. a. D t t 1
24a a
24t a
24. If we think of D as having the form D t mt b, then m a
24, b a
24, and
D is a linear function of t .
b. If a 500 and t 4, D 4 4 1
24500 104167, or approximately 1042 mg.
Full file at https://testbankuniv.eu/Applied-Mathematics-for-the-Managerial-Life-and-Social-Sciences-7th-Edition-Tan-Solutions-Manual
Full file at https://testbankuniv.eu/Applied-Mathematics-for-the-Managerial-Life-and-Social-Sciences-7th-Edition-Tan-Solutions-Manual
Page 35
2.5 LINEAR FUNCTIONS AND MATHEMATICAL MODELS 85
37. a. The graph of f passes through the points P1 0 175 and P2 10 103. Its slope is103 175
10 0 072.
An equation of the line is y 175 072 t 0 or y 072t 175, so the linear function is
f t 072t 175.
b. The percentage of high school students who drink and drive at the beginning of 2014 is projected to be
f 13 072 13 175 814, or 814%.
38. a. The function is linear with y-intercept 144 and slope 0058, so we have f t 0058t 144, 0 t 9.
b. The projected spending in 2018 will be f 9 0058 9 144 1962, or $1962 trillion.
39. a. The median age was changing at the rate of 03 yearsyear.
b. The median age in 2011 was M 11 03 11 379 412 (years).
c. The median age in 2015 is projected to be M 5 03 15 379 424 (years).
40. a. The slope of the graph of f is a line with slope 132 passing through the point 0 400, so an equation of the
line is y 400 132 t 0 or y 132t 400, and the required function is f t 132t 400.
b. The emissions cap is projected to be f 2 132 2 400 3736, or 3736 million metric tons of carbon
dioxide equivalent.
41. The line passing through P1 0 61 and P2 4 51 has slope m 61 51
0 4 25, so its equation is
y 61 25 t 0 or y 25t 61. Thus, f t 25t 61.
42. a. The graph of f is a line through the points P1 0 07 and P2 20 12, so it has slope12 07
20 0 0025. Its
equation is y 07 0025 t 0 or y 0025t 07. The required function is thus f t 0025t 07.
b. The projected annual rate of growth is the slope of the graph of f , that is, 0025 billion per year, or 25 million
per year.
c. The projected number of boardings per year in 2022 is f 10 0025 10 07 095, or 950 million
boardings per year.
43. a. Since the relationship is linear, we can write F mC b, where m and b are constants. Using the condition
C 0 when F 32, we have 32 b, and so F mC 32. Next, using the condition C 100 when F 212,
we have 212 100m 32, or m 95 . Therefore, F 9
5C 32.
b. From part a, we have F 95C 32. When C 20, F 9
5 20 32 68, and so the temperature equivalent to
20 C is 68 F.
c. Solving for C in terms of F , we find 95C F 32, or C 5
9 F 1609 . When F 70, C 5
9 70 1609 190
9 ,
or approximately 211 C.
44. a. Since the relationship between T and N is linear, we can write N mT b, where m and b are constants. Using
the points 70 120 and 80 160, we find that the slope of the line joining these points is160 120
80 70 40
10 4.
If T 70, then N 120, and this gives 120 70 4 b, or b 160. Therefore, N 4T 160.
b. If T 102, we find N 4 102 160 248, or 248 chirps per minute.
Full file at https://testbankuniv.eu/Applied-Mathematics-for-the-Managerial-Life-and-Social-Sciences-7th-Edition-Tan-Solutions-Manual
Full file at https://testbankuniv.eu/Applied-Mathematics-for-the-Managerial-Life-and-Social-Sciences-7th-Edition-Tan-Solutions-Manual
Page 36
86 2 FUNCTIONS AND THEIR GRAPHS
45. a.
0
20406080
100120
2 4 6 8 10 12 14 x (thousands)
y ($thousand)140
C(x)
R(x)
c.
x (thousands)
y ($thousand)
P(x)
_60_40_20
0
2040
2 4 6 8 10 12 14
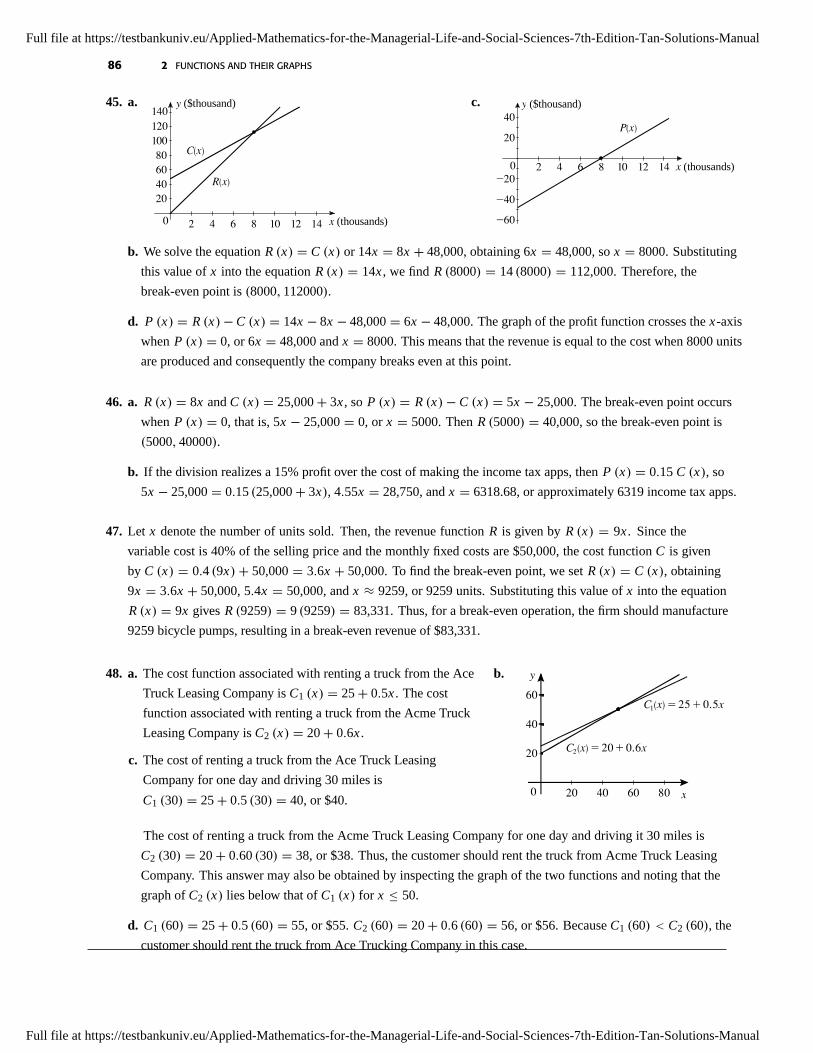
b. We solve the equation R x C x or 14x 8x 48,000, obtaining 6x 48,000, so x 8000. Substituting
this value of x into the equation R x 14x , we find R 8000 14 8000 112,000. Therefore, the
break-even point is 8000 112000.
d. P x R xC x 14x 8x 48,000 6x 48,000. The graph of the profit function crosses the x-axis
when P x 0, or 6x 48,000 and x 8000. This means that the revenue is equal to the cost when 8000 units
are produced and consequently the company breaks even at this point.
46. a. R x 8x and C x 25,000 3x , so P x R x C x 5x 25,000. The break-even point occurs
when P x 0, that is, 5x 25,000 0, or x 5000. Then R 5000 40,000, so the break-even point is
5000 40000.
b. If the division realizes a 15% profit over the cost of making the income tax apps, then P x 015 C x, so
5x 25,000 015 25,000 3x, 455x 28,750, and x 6318.68, or approximately 6319 income tax apps.
47. Let x denote the number of units sold. Then, the revenue function R is given by R x 9x . Since the
variable cost is 40% of the selling price and the monthly fixed costs are $50,000, the cost function C is given
by C x 04 9x 50,000 36x 50,000. To find the break-even point, we set R x C x, obtaining
9x 36x 50,000, 54x 50,000, and x 9259, or 9259 units. Substituting this value of x into the equation
R x 9x gives R 9259 9 9259 83,331. Thus, for a break-even operation, the firm should manufacture
9259 bicycle pumps, resulting in a break-even revenue of $83,331.
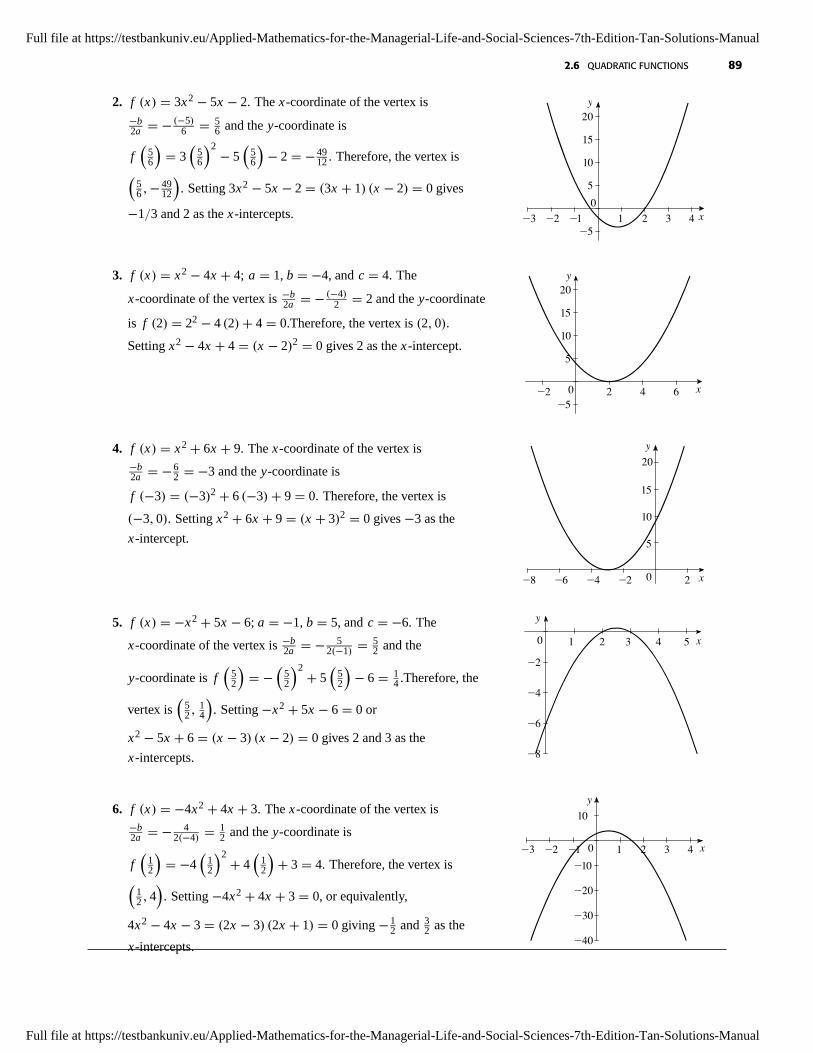
48. a. The cost function associated with renting a truck from the Ace
Truck Leasing Company is C1 x 25 05x . The cost
function associated with renting a truck from the Acme Truck
Leasing Company is C2 x 20 06x .
c. The cost of renting a truck from the Ace Truck Leasing
Company for one day and driving 30 miles is
C1 30 25 05 30 40, or $40.
b.
0
20
40
60
20 40 60 80 x
CÁ(x)=25+0.5x
Cª(x)=20+0.6x
y
The cost of renting a truck from the Acme Truck Leasing Company for one day and driving it 30 miles is
C2 30 20 060 30 38, or $38. Thus, the customer should rent the truck from Acme Truck Leasing
Company. This answer may also be obtained by inspecting the graph of the two functions and noting that the
graph of C2 x lies below that of C1 x for x 50.
d. C1 60 25 05 60 55, or $55. C2 60 20 06 60 56, or $56. Because C1 60 C2 60, the
customer should rent the truck from Ace Trucking Company in this case.
Full file at https://testbankuniv.eu/Applied-Mathematics-for-the-Managerial-Life-and-Social-Sciences-7th-Edition-Tan-Solutions-Manual
Full file at https://testbankuniv.eu/Applied-Mathematics-for-the-Managerial-Life-and-Social-Sciences-7th-Edition-Tan-Solutions-Manual
Page 37
2.5 LINEAR FUNCTIONS AND MATHEMATICAL MODELS 87
49. a, b.
0
400
800
1200
1600
1 2 3 4 5 t (yr)
y ($millions) c. The slope of L is1251 887
2 0 182, so an equation of L is
y 887 182 t 0 or y 182t 887.
d. The amount consumers are projected to spend on Cyber
Monday, 2014 (t 5) is 182 5 887, or $1797 billion.
e. The rate of change in the amount consumers spent on Cyber
Monday from 2009 through 2011 was $182 millionyear.
50. a. The cost function associated with using machine I is
C1 x 18,000 15x . The cost function associated with
using machine II is C2 x 15,000 20x .
c. Comparing the cost of producing 450 units on each machine,
we find C1 450 18,000 15 450 24,750 or $24,750
on machine I, and C2 450 15,000 20 450 24,000 or
$24,000 on machine II. Therefore, machine II should be used
b.
CÁ(x)
Cª(x)
0
10,000
20,000
30,000
40,000
200 400 600 800 x
yR(x)
in this case. Next, comparing the costs of producing 550 units on each machine, we find
C1 550 18,000 15 550 26,250 or $26,250 on machine I, and C2 550 15,000 20 550 26,000,
or $26,000 on machine II. Therefore, machine II should be used in this instance. Once again, we compare the
cost of producing 650 units on each machine and find that C1 650 18,000 15 650 27,750, or $27,750
on machine I and C2 650 15,000 20 650 28,000, or $28,000 on machine II. Therefore, machine I
should be used in this case.
d. We use the equation P x R xC x and find P 450 50 450 24,000 1500, indicating a loss of
$1500 when machine II is used to produce 450 units. Similarly, P 550 50 550 26,000 1500, indicating
a profit of $1500 when machine II is used to produce 550 units. Finally, P 650 50 650 27,750 4750,
for a profit of $4750 when machine I is used to produce 650 units.
51. First, we find the point of intersection of the two straight lines. (This gives the time when the sales of both
companies are the same). Substituting the first equation into the second gives 23 04t 12 06t , so 11 02t
and t 1102 55. From the observation that the sales of Cambridge Pharmacy are increasing at a faster rate than
that of the Crimson Pharmacy (its trend line has the greater slope), we conclude that the sales of the Cambridge
Pharmacy will surpass the annual sales of the Crimson Pharmacy in 5 12 years.
52. We solve the two equations simultaneously, obtaining 18t 134 12t 88, 30t 746, and t 2486, or
approximately 25 years. So shipments of LCDs will first overtake shipments of CRTs just before mid-2003.
53. a. The number of digital cameras sold in 2001 is given by f 0 305 0 685 685, or 685 million. The
number of film cameras sold in 2001 is given by g 0 185 0 1658, or 1658 million. Therefore, more
film cameras than digital cameras were sold in 2001.
b. The sales are equal when 305t 685 185t 1658, 49t 973, or t 97349 1986, approximately
2 years. Therefore, digital camera sales surpassed film camera sales near the end of 2003.
Full file at https://testbankuniv.eu/Applied-Mathematics-for-the-Managerial-Life-and-Social-Sciences-7th-Edition-Tan-Solutions-Manual
Full file at https://testbankuniv.eu/Applied-Mathematics-for-the-Managerial-Life-and-Social-Sciences-7th-Edition-Tan-Solutions-Manual
Page 38
88 2 FUNCTIONS AND THEIR GRAPHS
54. a.
0
102030405060
1 2 3 4 5 6 7 8 9 10 t
y b. We solve the two equations simultaneously,
obtaining 113 t 23 11
9 t 43, 449 t 20,
and t 409. Thus, electronic transactions first
exceeded check transactions in early 2005.
55. True. P x R x C x sx cx F s c x F . Therefore, the firm is making a profit if
P x s c x F 0; that is, if x F
s c(s c).
56. True. The slope of the line is a.
Technology Exercises page 131
1. 22875 2. 30125 3. 2880952381 4. 07875
5. 72851648352 6. 2682928836 7. 24680851064 8. 124375
2.6 Quadratic Functions
Concept Questions page 137
1. a. . b. It opens upward. c.
b
2a f
b
2a
. d. b
2a.
2. a. A demand function defined by p f x expresses the relationship between the unit price p and the quantity
demanded x . It is a decreasing function of x .
A supply function defined by p f x expresses the relationship between the unit price p and the quantity
supplied x . It is an increasing function of x .
b. Market equilibrium occurs when the quantity produced is equal to the quantity demanded.
c. The equilibrium quantity is the quantity produced at market equilibrium. The equilibrium price is the price
corresponding to the equilibrium quantity. These quantities are found by finding the point at which the demand
curve and the supply curve intersect.
Exercises page 137
1. f x x2 x 6; a 1, b 1, and c 6. The x-coordinate
of the vertex is b2a 1
21 12 and the y-coordinate is
f 1
2
1
2
2 1
2
6 25
4 . Therefore, the vertex is1
2 254
. Setting x2 x 6 x 3 x 2 0 gives 3
and 2 as the x-intercepts._10_5
0
5
1520
_6 _4 _2 2 4 6 x
y
10
Full file at https://testbankuniv.eu/Applied-Mathematics-for-the-Managerial-Life-and-Social-Sciences-7th-Edition-Tan-Solutions-Manual
Full file at https://testbankuniv.eu/Applied-Mathematics-for-the-Managerial-Life-and-Social-Sciences-7th-Edition-Tan-Solutions-Manual
Page 39
2.6 QUADRATIC FUNCTIONS 89
2. f x 3x2 5x 2. The x-coordinate of the vertex isb2a 5
6 56 and the y-coordinate is
f
56
3
56
2 5
56
2 49
12 . Therefore, the vertex is56 49
12
. Setting 3x2 5x 2 3x 1 x 2 0 gives
13 and 2 as the x-intercepts._5
05
10
15
20
_3 _2 _1 1 2 3 4 x
y
3. f x x2 4x 4; a 1, b 4, and c 4. The
x-coordinate of the vertex is b2a 4
2 2 and the y-coordinate
is f 2 22 4 2 4 0.Therefore, the vertex is 2 0.
Setting x2 4x 4 x 22 0 gives 2 as the x-intercept.
_50
5
10
15
20
_2 2 4 6 x
y
4. f x x2 6x 9. The x-coordinate of the vertex isb2a 6
2 3 and the y-coordinate is
f 3 32 6 3 9 0. Therefore, the vertex is
3 0. Setting x2 6x 9 x 32 0 gives 3 as the
x-intercept.
0
5
10
15
_8 _6 _4 _2 2 x
20y
5. f x x2 5x 6; a 1, b 5, and c 6. The
x-coordinate of the vertex is b2a 5
21 52 and the
y-coordinate is f
52
52
2 5
52
6 1
4 .Therefore, the
vertex is
52
14
. Setting x2 5x 6 0 or
x2 5x 6 x 3 x 2 0 gives 2 and 3 as the
x-intercepts. _8
_6
_4
_2
0 1 2 3 4 5 x
y
6. f x 4x2 4x 3. The x-coordinate of the vertex isb2a 4
24 12 and the y-coordinate is
f
12
4
12
2 4
12
3 4. Therefore, the vertex is
12 4
. Setting 4x2 4x 3 0, or equivalently,
4x2 4x 3 2x 3 2x 1 0 giving 12 and 3
2 as the
x-intercepts. _40
_30
_20
_100
10
_3 _2 _1 1 2 3 4 x
y
Full file at https://testbankuniv.eu/Applied-Mathematics-for-the-Managerial-Life-and-Social-Sciences-7th-Edition-Tan-Solutions-Manual
Full file at https://testbankuniv.eu/Applied-Mathematics-for-the-Managerial-Life-and-Social-Sciences-7th-Edition-Tan-Solutions-Manual
Page 40
90 2 FUNCTIONS AND THEIR GRAPHS
7. f x 3x2 5x 1; a 3 b 5 and c 1; The
x-coordinate of the vertex is b2a 5
23 56 and the
y-coordinate is f
56
3
56
2 5
56
1 13
12 . Therefore,
the vertex is
56 13
12
. Next, solving 3x2 5x 1 0, we use
the quadratic formula and obtain
x 552 4 3 1
2 3 513
6and so the
x-intercepts are 023241 and 143426.
_50
5
15
_1 1 2 3 x
y
10
8. f x 2x2 6x 3. The x-coordinate of the vertex isb2a 6
22 32 and the y-coordinate is
f
32
2
32
2 6
32
3 3
2 .Therefore, the vertex is32
32
. Next, solving 2x2 6x 3 0 using the quadratic
formula, we find
x 662 4 2 3
2 2 612
4 3
2
3
2and so
the x-intercepts are 063397 and 236603.
_15
_50
5
_1 1 2 3 4 5 x
y
_10
9. f x 2x2 3x 3; a 2, b 3, and c 3.The
x-coordinate of the vertex is b2a 3
22 34 and the
y-coordinate is f
34
2
34
2 3
34
3 15
8 . Therefore, the
vertex is
34
158
. Next, observe that the discriminant of the
quadratic equation 2x2 3x 3 0 is
32 4 2 3 9 24 15 0 and so it has no real roots.
In other words, there are no x-intercepts.
0
10
20
_3 _2 _1 1 2 3 4 5 x
y
10. f x 3x2 4x 2. The x-coordinate of the vertex isb2a 4
23 23 and the y-coordinate is
f
23
3
23
2 4
23
2 2
3 . Therefore, the vertex is
23
23
.
Next, observe that the discriminant of the quadratic equation
3x2 4x 2 0 is 42 4 3 2 16 24 8 0 and
so it has no real roots. Therefore, the parabola has no x-intercepts. 0
5
10
15
20
_2 _1 1 2 3 4
y25
x
Full file at https://testbankuniv.eu/Applied-Mathematics-for-the-Managerial-Life-and-Social-Sciences-7th-Edition-Tan-Solutions-Manual
Full file at https://testbankuniv.eu/Applied-Mathematics-for-the-Managerial-Life-and-Social-Sciences-7th-Edition-Tan-Solutions-Manual
Page 41
2.6 QUADRATIC FUNCTIONS 91
11. f x x2 4; a 1, b 0, and c 4. The x-coordinate of
the vertex is b2a 0
21 0 and the y-coordinate is f 0 4.
Therefore, the vertex is 04. The x-intercepts are found by
solving x2 4 x 2 x 2 0 giving x 2 or x 2.
_50
5101520
_6 _4 _2 2 4 6 x
y
12. f x 2x2 3. The x-coordinate of the vertex isb2a 0
22 0 and the y-coordinate is f 0 3. Therefore, the
vertex is 0 3. Since 2x2 3 3 0, we see that there are no
x-intercepts.
_10_5
0
5
1520
_3 _2 _1 1 2 3 x
10
y
13. f x 16 x2; a 1, b 0, and c 16. The x-coordinate of
the vertex is b2a 0
21 0 and the y-coordinate is f 0 16.
Therefore, the vertex is 0 16. The x-intercepts are found by
solving 16 x2 0, giving x 4 or x 4.
_10
0
20
_6 _4 _2 2 4 6 x
y
10
14. f x 5 x2. The x-coordinate of the vertex isb2a 0
21 0 and the y-coordinate is f 0 5. Therefore,
the vertex is 0 5. The x-intercepts are found by solving
5 x2 0, giving x 5 223607.
_20
_10
0
10
_6 _4 _2 2 4 6 x
y
15. f x 38 x2 2x 2; a 3
8 , b 2, and c 2. The
x-coordinate of the vertex is b2a 2
2
38
83 and the
y-coordinate is f
83
3
8
83
2 2
83
2 2
3 . Therefore,
the vertex is
83 2
3
. The equation f x 0 can be written
3x2 16x 16 3x 4 x 4 0 giving x 43 or x 4
and so the x-intercepts are 43 and 4.
_4_2
0
2468
1012
_2 2 4 6 8 x
y
Full file at https://testbankuniv.eu/Applied-Mathematics-for-the-Managerial-Life-and-Social-Sciences-7th-Edition-Tan-Solutions-Manual
Full file at https://testbankuniv.eu/Applied-Mathematics-for-the-Managerial-Life-and-Social-Sciences-7th-Edition-Tan-Solutions-Manual
Page 42
92 2 FUNCTIONS AND THEIR GRAPHS
16. f x 34 x2 1
2 x 1. The x-coordinate of the vertex is
b2a
12
2
34
13 , and the y-coordinate is
f
13
3
4
13
2 12
13
1 11
12 . Therefore, the vertex is13
1112
. The discriminant of the equation f x 0 is
12
2 4
34
1 11
4 0 and this shows that there are no
x-intercepts.
_20
2468
1012
_4 _2 2 4 x
y
17. f x 12x2 32x 12, so a 12, b 32, and c 12.
The x-coordinate of the vertex is b2a 32
212 43 and the
y-coordinate is
f 4
3
12
4
3
2 324
3
1 12 10
3 . Therefore,
the vertex is4
3 103
. Next, we solve f x 0 using the
quadratic formula, obtaining
x 32322 4 12 12
2 12 3216
2 12 32 4
2 12 3
or 13 . Therefore, the x-intercepts are 3 and 1
3 .
0
10
20
_6 _4 _2 2 4 x
y
18. f x 23x2 41x 3. The x-coordinate of the vertex isb2a 41
223 0891304 and the y-coordinate is
f 0891304 23 0891304241 08913043 1172826.
Therefore, the vertex is 08913 11728. The discriminant of the
equation f x 0 is 412 4 23 3 1079 0 and so
it has no real roots. Therefore, there are no x-intercepts.0
5
10
15
20
_2 _1 1 2 3 4
y
x
19. a. a 0 because the parabola opens upward.
b. b
2a 0 because the x-coordinate of the vertex is positive. We find b 0 (upon multiplying by 2a 0), and
so b 0.
c. f
b
2a
0 because the vertex of the parabola has a positive y-coordinate.
d. b2 4ac 0 because the parabola does not intersect the x-axis, and so the equation ax2 bx c 0 has no
real root.
20. a. a 0 because the parabola opens downward.
b. b
2a 0 because the x-coordinate of the vertex is negative. We find b 0 (since 2a 0), and so b 0.
c. f
b
2a
0 because the vertex of the parabola has a positive y-coordinate.
Full file at https://testbankuniv.eu/Applied-Mathematics-for-the-Managerial-Life-and-Social-Sciences-7th-Edition-Tan-Solutions-Manual
Full file at https://testbankuniv.eu/Applied-Mathematics-for-the-Managerial-Life-and-Social-Sciences-7th-Edition-Tan-Solutions-Manual
Page 43
2.6 QUADRATIC FUNCTIONS 93
d. b2 4ac 0 because the parabola intersects the x-axis at two points, and so the equation ax2 bx c 0 has
two real roots.
21. a. a 0 because the parabola opens upward.
b. b
2a 0 because the x-coordinate of the vertex is positive. We find b 0 (since 2a 0), and so b 0.
c. f
b
2a
0 because the vertex of the parabola has a negative y-coordinate.
d. b2 4ac 0 because the parabola intersects the x-axis at two points, and so the equation ax2 bx c 0 has
two real roots.
22. a. a 0 because the parabola opens downward.
b. b
2a 0 because the x-coordinate of the vertex is negative. We find b 0 (since 2a 0), and so b 0.
c. f
b
2a
0 because the vertex of the parabola has a negative y-coordinate.
d. b2 4ac 0 because the parabola does not intersect the x-axis, and so the equation ax2 bx c 0 has no
real root.
23. We solve the equation x2 4 x 2. Rewriting, we have x2 x 6 x 3 x 2 0, giving x 3 or
x 2. Therefore, the points of intersection are 35 and 2 0.
24. We solve x2 5x 6 12 x 3
2 or x2 112 x 9
2 0. Rewriting, we obtain 2x2 11x 9 2x 9 x 1 0
giving x 1 or 92 . Therefore, the points of intersection are 1 2 and
92
154
.
25. We solve x2 2x 6 x2 6, or 2x2 2x 12 0. Rewriting, we have x2 x 6 x 3 x 2 0,
giving x 2 or 3. Therefore, the points of intersection are 22 and 3 3.
26. We solve x2 2x 2 x2 x 1, or 2x2 x 3 2x 3 x 1 0 giving x 1 or 32 . Therefore, the
points of intersection are 1 1 and
32 11
4
.
27. We solve 2x2 5x 8 3x2 x 5, or 5x2 6x 13 0. Using the quadratic
formula, we obtain x 662 4 5 13
2 5 6296
10 112047 or
232047. Next, we find f 112047 2 1120472 5 112047 8 011326 and
f 232047 2 2320472 5 232047 8 88332. Therefore, the points of intersection are
11205 01133 and 2320588332.
28. We solve 02x2 12x 4 03x2 07x 8.2, or 05x2 19x 122 0. Using the quadratic
formula, we find x 19192 4 05 122
2 05 19 2801 339245 or
719245. Next, we find f 339245 02 3392452 12 339245 4 237268 and and
f 719245 02 7192452 12 719245 4 228467. Therefore, the points of intersection are
33925 23727 and 7192522847.
Full file at https://testbankuniv.eu/Applied-Mathematics-for-the-Managerial-Life-and-Social-Sciences-7th-Edition-Tan-Solutions-Manual
Full file at https://testbankuniv.eu/Applied-Mathematics-for-the-Managerial-Life-and-Social-Sciences-7th-Edition-Tan-Solutions-Manual
Page 44
94 2 FUNCTIONS AND THEIR GRAPHS
29. We solve the equation f
b
2a
16. Here a 2, and we have f
b
2 2
f
b
4
16, or
2
b
4
2
b
b
4
8 16. Thus, b2
8 b2
4 8,
b2
8 8, b2 64, and so b 8.
30. Since f is to have a minimum value, a 0. We want f
b
2a
f
8
2a
f
4
a
24, so
a
4
a
2
8
4
a
8 24,
16
a 32
a 16, 16
a 16, and a 1.
31. Here a 3 and b 4. We want f
b
2a
f
4
2 3
f
2
3
2
3, so
32
3
2 42
3
c 2
3 , 43 8
3 c 23 , and c 2.
32. First a 0. Next, we want f
2
2a
f
1
a
4, so a
1
a
2
2
1
a
c 4,
1
a 2
a c 4,
1
a 4 c, and a 1
c 4. Since a 0, we see that c 4 0, so c 4. We conclude that a and c must satisfy
the two conditions a 1
c 4and c 4.
33. We want b2 4ac 0; that is, 32 4 1 c 0, so c 94 .
34. We want b2 4ac 0; that is, 42 4 a 1 0, so a 4.
35. We want b2 4ac 0; that is, b2 4 2 5 0, b2 40, and so b 2
10 or b 2
10.
36. We require that b2 4ac 0; that is, 22 4 a 4 0, 4 16a 0, and so a 14 .
37. a.
0
10
20
30
40
1 2 3 4 5 6 x (thousands)
p ($)
b. If p 11, we have 11 x2 36, or x2 25, so
that x 5. Therefore, the quantity demanded
when the unit price is $11 is 5000 units.
38. a.
0
5
10
_4 _2 2 4 x (thousands)
p ($)
b. If p 7, we have 7 x2 16, or x2 9, so that
x 3. Therefore, the quantity demanded when
the unit price is $7 is 3000 units.
Full file at https://testbankuniv.eu/Applied-Mathematics-for-the-Managerial-Life-and-Social-Sciences-7th-Edition-Tan-Solutions-Manual
Full file at https://testbankuniv.eu/Applied-Mathematics-for-the-Managerial-Life-and-Social-Sciences-7th-Edition-Tan-Solutions-Manual
Page 45
2.6 QUADRATIC FUNCTIONS 95
39. a.
0
10
20
30
40
50
_4 _2 2 4 x (thousands)
p ($)
b. If x 2, then p 2 22 18 26, or $26.
40. a.
_200
20406080
100
_20 _15 _10 _5 5
p ($)
x (thousands)
b. If x 2, then p 22 16 2 40 76, or $76.
41. We solve the equation 2x2 80 15x 30, or 2x2 80 15x 30, or 2x2 15x 50 0, for x . Thus,
2x 5 x 10 0, so x 52 or x 10. Rejecting the negative root, we have x 5
2 . The corresponding
value of p is p 2
52
2 80 675. We conclude that the equilibrium quantity is 2500 and the equilibrium
price is $6750.
42. We solve the system of equations
p x2 2x 100
p 8x 25Thus, x2 2x 100 8x 25, or
x2 10x 75 0. Factoring the left-hand side, we have x 15 x 5 0, so x 15 or x 5. We reject
the negative root, so x 5 and the corresponding value of p is p 8 5 25 65. We conclude that the
equilibrium quantity is 5000 and the equilibrium price is $65.
43. Solving both equations for x , we have x 113 p 22 and x 2p2 p 10. Equating the right-hand sides of
these two equations, we have 113 p 22 2p2 p 10, 11p 66 6p2 3p 30, and 6p2 14p 96 0.
Dividing this last equation by 2 and then factoring, we have 3p 16 p 3 0, so discarding the negative root
p 163 , we conclude that p 3. The corresponding value of x is 2 32 3 10 11. Thus, the equilibrium
quantity is 11,000 and the equilibrium price is $3.
44. We solve the system
p 60 2x2
p x2 9x 30Equating the right-hand-sides of the two equations, we have
x2 9x 30 60 2x2, so 3x2 9x 30 0, x2 3x 10 0, and x 5 x 2 0. Thus, x 5
(which we discard) or x 2. The corresponding value of p is 52. Therefore, the equilibrium quantity is 2000 and
the equilibrium price is $52.
45. a. N 0 36, or 36 million people; N 25 00031 252 016 25 36 9.5375, or approximately
95 million people.
b. N 30 00031 302 016 30 36 1119, or approximately 112 million people.
Full file at https://testbankuniv.eu/Applied-Mathematics-for-the-Managerial-Life-and-Social-Sciences-7th-Edition-Tan-Solutions-Manual
Full file at https://testbankuniv.eu/Applied-Mathematics-for-the-Managerial-Life-and-Social-Sciences-7th-Edition-Tan-Solutions-Manual
Page 46
96 2 FUNCTIONS AND THEIR GRAPHS
46. a.
_50
0
50
100
150
1 2 3 4 5 t (sec)
h (ft) b. The time at which the stone reaches the highest point is given
by the t-coordinate of the vertex of the parabola. This isb2a 64
216 2, so the stone it reaches its maximum height
2 seconds after it was thrown. Its maximum height is given by
h 2 16 22 64 2 80 144, or 144 ft.
47. P x 004x2 240x 10,000. The optimal production level is given by the x-coordinate of the vertex of
parabola; that is, by b2a 240
2004 3000, or 3000 cameras.
48. The optimal number of units to be rented out is given by the x-coordinate of the vertex of
the parabola; that is, by b2a 1760
210 88, or 88 units. The maximum profit is given by
P 88 10 882 1760 88 50,000 27,440, or $27,440 per month.
49. a. R p 12 p2 30p.
0
100
200
300
400
10 20 30 40 50 60 p ($)
R ($hundreds)
b. The monthly revenue is maximized when
p 30
2 1
2
30; that is, when the unit price is
$30.
50. a. P x 18 x2 7x 30
0
20406080
100120140
10 20 30 40 50
P ($thousands)
x ($thousands)
b. The required advertising expenditure is given by the
x-coordinate of the vertex of the parabola; that is by
b
2a 7
2 1
8
28, or $28,000 per quarter.
51. a. The amount of Medicare benefits paid out in 2010 is B 0 025, or $250 billion.
b. The amount of Medicare benefits projected to be paid out in 2040 is
B 3 009 32 0102 3 025 1366, or $1366 trillion.
52. a. The graph of a P is a parabola that opens upward because a 91667 0. Since the x-coordinate of the vertex
is b
2a 12133333
2 91667 0, we see that P is increasing for t 0; that is, the price was increasing from 2006
(t 0) through 2014 (t 8).
b. We solve P t 35,000; that is, 91667t2 12133333t 30,000 35,000,
obtaining 91667t2 12133333t 5000 0, and so
t 12133333121333332 4 91667 5000
2 91667 13636 or 4. We conclude that the median price
first reached $35,000 in 2010 (t 4).
Full file at https://testbankuniv.eu/Applied-Mathematics-for-the-Managerial-Life-and-Social-Sciences-7th-Edition-Tan-Solutions-Manual
Full file at https://testbankuniv.eu/Applied-Mathematics-for-the-Managerial-Life-and-Social-Sciences-7th-Edition-Tan-Solutions-Manual
Page 47
2.6 QUADRATIC FUNCTIONS 97
53. a. The graph of a N is a parabola that opens upward because a 00125 0. Since the x-coordinate of the vertex
is b
2a 0475
2 00125 0, we see that N is increasing for t 0; that is, the number of adults diagnosed with
diabetes was increasing from 2010 (t 0) through 2014 (t 4).
b. We solve 00125t2 0475t 207 217, obtaining 00125t2 0475t 1 0, and so
t 047504752 4 00125 1
2 00125 40 or 2. We conclude that the number of adults diagnosed with
diabetes first reached 216 million in 2012 (t 2).
54. p 01x2 05x 15
0
10
20
_6 _4 _2 2 4 6 8 10
30
x (thousands)
p ($)
If x 5, then p 01 52 05 5 15 20, or $20.
55. Equating the right-hand sides of the two equations, we have 01x2 2x 20 01x2 x 40, so
02x2 3x 20 0, 2x2 30x 200 0, x2 15x 100 0, and x 20 x 5 0. Thus,
x 20 or x 5. Discarding the negative root and substituting x 5 into the first equation, we obtain
p 01 25 5 40 325. Therefore, the equilibrium quantity is 500 tents and the equilibrium price is
$3250.
56. Equating the right-hand sides of the two equations, we have 144 x2 48 12 x2, so 288 2x2 96 x2,
3x2 192, and x2 64. We discard the negative root and take x 8. The corresponding value of p is
144 82 80. We conclude that the equilibrium quantity is 8000 tires and the equilibrium price is $80.
57. a.
_100
10
20
30
40
0.05 0.1 0.15 0.2 r (cm)
v (cm/sec) b. r 1000r2 40. Its graph is a parabola, as shown in
part a. r has a maximum value at r 021000 0 and a
minimum value at r 02 (r must be nonnegative). Thus the
velocity of blood is greatest along the central artery (where
r 0) and smallest along the wall of the artery (where
r 02). The maximum velocity is 0 40 cmsec and the
minimum velocity is 02 0 cmsec.
58. The graph of s t 16t2 128t 4 is a parabola that opens downward. The vertex of the parabola is is b2a f
b2a
. Here a 16 and b 128. Therefore, the t-coordinate of the vertex is t 128
216 4 and the
s-coordinate is s 4 16 42 128 4 4 260. So the ball reaches the maximum height after 4 seconds; its
maximum height is 260 ft.
Full file at https://testbankuniv.eu/Applied-Mathematics-for-the-Managerial-Life-and-Social-Sciences-7th-Edition-Tan-Solutions-Manual
Full file at https://testbankuniv.eu/Applied-Mathematics-for-the-Managerial-Life-and-Social-Sciences-7th-Edition-Tan-Solutions-Manual
Page 48
98 2 FUNCTIONS AND THEIR GRAPHS
59. We want the window to have the largest possible area given the constraints. The
area of the window is A 2xy 12πx2. The constraint on the perimeter dictates
that 2x 2y πx 28. Solving for y gives y 28 2x πx
2. Therefore,
A 2x
28 2x πx
2
1
2πx2 56x 4x2 2πx2 πx2
2 π 4 x2 56x
2. A is maximized at
x b
2a 56
2 π 4 28
π 4and y 28 56
4 284
2 28π 112 56 28π
2 π 4 28
π 4, or
28
π 4ft.
60. x2 2y h y2 4y h y 4y2 4hy. The maximum of f y 4y2 4hy is attained when
y b2a 4h
24 h2 . So the hole should be located halfway up the tank. The maximum value of x is
x 2 h
2
h h
2
2
h2
4 h.
61. True.b b2 4ac
2ais a root of the equation ax2 bx c 0, and therefore f
b b2 4ac
2a
0.
62. False. It has two roots if b2 4ac 0.
63. True. If a and c have opposite signs then b2 4ac 0 and the equation has 2 roots.
64. True. If b2 4ac, then x b2a is the only root of the equation ax2 bx c 0, and the graph of the function f
touches the x-axis at exactly one point.
65. True. The maximum occurs at the vertex of the parabola.
66. f x a
x2 b
ax c
a
a
x2
b
a
x
b
2a
2
c
a
b
2a
2 a
x b
2a
2
c
a b2
4a2
a
x b
2a
2
4ac b2
4a.
Technology Exercises page 142
1. 30414 01503, 30414 74497. 2. 53852 98007, 5385242007.
3. 23371 24117, 6051425015. 4. 2586303586, 6186345694.
5. 1105565216 and 1105518784
6. 00484 20608 and 14769 28453.
Full file at https://testbankuniv.eu/Applied-Mathematics-for-the-Managerial-Life-and-Social-Sciences-7th-Edition-Tan-Solutions-Manual
Full file at https://testbankuniv.eu/Applied-Mathematics-for-the-Managerial-Life-and-Social-Sciences-7th-Edition-Tan-Solutions-Manual
Page 49
2.7 FUNCTIONS AND MATHEMATICAL MODELS 99
7. a.
0 5 10 150
50
100
b. 438 wall clocks; $4092.
8. a.
0 5 10 15 200
50
100
b. 1000 cameras; $6000.
2.7 Functions and Mathematical Models
Concept Questions page 149
1. See page 142 of the text. Answers will vary.
2. a. P x anxn an1xn1 a0, where an 0 and n is a positive integer. An example is
P x 4x3 3x2 2.
b. R x P x
Q x, where P and Q are polynomials with Q x 0. An example is R x 3x4 2x2 1
x2 3x 5.
Exercises page 149
1. f is a polynomial function in x of degree 6.
2. f is a rational function.
3. Expanding G x 2x2 3
3, we have G x 2x6 18x4 54x2 54, and we see that G is a polynomial
function in x of degree 6.
4. We can write H x 2
x3 5
x2 6 2 5x 6x3
x3, and we see that H is a rational function.
5. f is neither a polynomial nor a rational function.
6. f is a rational function.
7. a.
0
10
20
30
40
1 2 3 4 5 6
y
t
b. The projected revenue in 2010 is projected to be
f 6 219 6 2712 4026, or $4026 billion.
c. The rate of increase is the slope of the graph of f , that is,
219 (billion dollars per year).
8. a. The amount paid out in 2010 was S 0 072, or $072 trillion (or $720 billion).
Full file at https://testbankuniv.eu/Applied-Mathematics-for-the-Managerial-Life-and-Social-Sciences-7th-Edition-Tan-Solutions-Manual
Full file at https://testbankuniv.eu/Applied-Mathematics-for-the-Managerial-Life-and-Social-Sciences-7th-Edition-Tan-Solutions-Manual
Page 50
100 2 FUNCTIONS AND THEIR GRAPHS
b. The amount paid out in 2030 is projected to be S 3 01375 32 05185 3 072 3513, or
$3513 trillion.
9. a. The average time spent per day in 2009 was f 0 2176 (minutes).
b. The average time spent per day in 2013 is projected to be
f 4 225 42 1341 4 2176 1114 (minutes).
10. a. The GDP in 2011 was G 0 15, or $15 trillion.
b. The projected GDP in 2015 is G 4 0064 42 0473 4 150 17916, or $17916 trillion.
11. a. The GDP per capita in 2000 was f 10 186251 102 2808043 10 884 7894467, or $78945.
b. The GDP per capita in 2030 is projected to be f 40 186251 402 2808043 40 884 27407988, or
$274080.
12. The U.S. public debt in 2005 was f 0 8246, or $8246 trillion. The public debt in 2008 was
f 3 003817 33 04571 32 01976 3 8246 1073651, or approximately $1074 trillion.
13. The percentage who expected to work past age 65 in 1991 was f 0 11, or 11%. The percentage in 2013 was
f 22 0004545 223 01113 222 1385 22 11 3599596, or approximately 36%.
14. N 0 07 per 100 million vehicle miles driven. N 7 00336 73 0118 72 0215 7 07 79478 per
100 million vehicle miles driven.
15. a. Total global mobile data traffic in 2009 was f 0 006, or 60,000 terabytes.
b. The total in 2014 will be f 5 0021 53 0015 52 012 5 006 366, or 366 million terabytes.
16. L 1 005D
D.
a. If D 20, then L 1 005 20
20 010, or 10%.
b. If D 10, then L 1 005 10
10 015, or 15%.
17. a. We first construct a table.
t N t
1 52
2 75
3 93
4 109
5 122
t N t
6 135
7 146
8 157
9 167
10 1770
4080
120160
2 4 6 8 10 t (years)
N (million)
180
b. The number of viewers in 2012 is given by N 10 52 100531 17661, or approximately 177 million
viewers.
Full file at https://testbankuniv.eu/Applied-Mathematics-for-the-Managerial-Life-and-Social-Sciences-7th-Edition-Tan-Solutions-Manual
Full file at https://testbankuniv.eu/Applied-Mathematics-for-the-Managerial-Life-and-Social-Sciences-7th-Edition-Tan-Solutions-Manual
Page 51
2.7 FUNCTIONS AND MATHEMATICAL MODELS 101
18. a.
0
40
80
120
1 2 3
160
t
R R 1 1628 13025 1628, R 2 1628 23025 200,
and R 3 1628 33025 59.
b. The infant mortality rates in 1900, 1950, and 2000 are 1628, 200,
and 59 per 1000 live births, respectively.
19. N 5 00018425 1025 058265, or approximately 0583 million. N 13 00018425 1825 25327, or
approximately 25327 million.
20. a. S 0 43 0 2094 824967, or approximately $825 billion.
b. S 8 43 8 2094 3745, or approximately $3745 billion.
21. a. The given data imply that R 40 50, that is,100 40
b 40 50, so 50 b 40 4000, or b 40. Therefore, the
required response function is R x 100x
40 x.
b. The response will be R 60 100 60
40 60 60, or approximately 60 percent.
22. a.
0
40
80
120
5 10
g
f
x
160
y b. 5x2 5x 30 33x 30, so 5x2 28x 0, x 5x 28 0,
and x 0 or x 285 56, representing 56 mi/h.
g x 11 56 10 716, or 71.6 mLlbmin.
c. The oxygen consumption of the walker is greater than that of therunner.
23. a. We are given that f 1 5240 and f 4 8680. This leads to the system of equations a b 5240,
11a b 8680. Solving, we find a 344 and b 4896.
b. From part (a), we have f t 344t 4896, so the approximate per capita costs in 2005 were
f 5 344 5 4896 6616, or $6616.
24. a. f 0 3173 gives c 3173, f 4 6132 gives 16a 4b c 6132, and f 6 7864 gives
36a 6b c 1864. Solving, we find a 210417, b 6555833, and c 3173.
b. From part (a), we have f t 210417t2 6555833t 3173, so the number of farmers’ markets in 2014 is
projected to be f 8 210417 82 6555833 8 3173 97643352, or approximately 9764.
25. a. We have f 0 c 1547, f 2 4a 2b c 1802, and f 4 16a 4b c 2403. Solving this
system of equations gives a 4325, b 41, and c 1547.
b. From part (a), we have f t 4325t2 41t 1547, so the number of craft-beer breweries in 2014 is projected
to be f 6 4325 62 41 6 1547 3350.
Full file at https://testbankuniv.eu/Applied-Mathematics-for-the-Managerial-Life-and-Social-Sciences-7th-Edition-Tan-Solutions-Manual
Full file at https://testbankuniv.eu/Applied-Mathematics-for-the-Managerial-Life-and-Social-Sciences-7th-Edition-Tan-Solutions-Manual
Page 52
102 2 FUNCTIONS AND THEIR GRAPHS
26. a.
0
40
80
120
160
10 20 30 t
y b. f 0 837 0 744 744, or $744kilo.
f 20 284 20 5168 10848, or $10848kilo.
27. The total cost by 2011 is given by f 1 5, or $5 billion. The total cost by 2015 is given by
f 5 0527853 3012
52 4923 5 10329 152185, or approximately $152 billion.
28. a.
0
12345
10 20 30 t (years)
y b. At the beginning of 2005, the ratio will be
f 10 003 10 425 395. At the beginning of
2020, the ratio will be f 25 0075 25 4925 305.
c. The ratio is constant from 1995 to 2000.
d. The decline of the ratio is greatest from 2010 through 2030. It
isf 35 f 15
35 15 23 38
20 0075.
29. a.
0
10
20
30
2 4 6 8 x
p ($)
Units of a thousand
b. Substituting x 10 into the demand function, we have
p 30
002 102 1 30
3 10, or $10.
30. Substituting x 10,000 and p 20 into the given equation yields
20 a
10,000 b 100a b. Next, substituting x 62,500
and p 35 into the equation yields
35 a
62,500 b 250a b. Subtracting the first equation
from the second yields 15 150a, or a 110 . Substituting this
value of a into the first equation gives b 10. Therefore, the
required equation is p 110
x 10. Substituting x 40,000 into
the supply equation yields p 110
40,000 10 30, or $30.
0
10
20
30
20 40 60 x
p ($)
Units of a thousand
Full file at https://testbankuniv.eu/Applied-Mathematics-for-the-Managerial-Life-and-Social-Sciences-7th-Edition-Tan-Solutions-Manual
Full file at https://testbankuniv.eu/Applied-Mathematics-for-the-Managerial-Life-and-Social-Sciences-7th-Edition-Tan-Solutions-Manual
Page 53
2.7 FUNCTIONS AND MATHEMATICAL MODELS 103
31. Substituting x 6 and p 8 into the given equation gives 8 36a b, or 36a b 64. Next,
substituting x 8 and p 6 into the equation gives 6 64a b, or 64a b 36. Solving the system36a b 64
64a b 36for a and b, we find a 1 and b 100. Therefore the demand equation is p x2 100.
When the unit price is set at $750, we have 75 x2 100, or 5625 x2 100 from which we deduce that
x 6614. Thus, the quantity demanded is approximately 6614 units.
32. a. We solve the system of equations p cx d and p ax b. Substituting the first equation into the
second gives cx d ax d, so c a x b d and x b d
c a. Because a 0 and c 0,
c a 0 and x is well-defined. Substituting this value of x into the second equation, we obtain
p a
b d
c a
b ab ad bc ab
c a bc ad
c a. Therefore, the equilibrium quantity is
b d
c aand the
equilibrium price isbc ad
c a.
b. If c is increased, the denominator in the expression for x increases and so x gets smaller. At the same time, the
first term in the first equation for p decreases and so p gets larger. This analysis shows that if the unit price for
producing the product is increased then the equilibrium quantity decreases while the equilibrium price increases.
c. If b is decreased, the numerator of the expression for x decreases while the denominator stays the same.
Therefore, x decreases. The expression for p also shows that p decreases. This analysis shows that if the
(theoretical) upper bound for the unit price of a commodity is lowered, then both the equilibrium quantity and the
equilibrium price drop.
33. Because there is 80 feet of fencing available, 2x 2y 80, so x y 40 and y 40 x . Then the area of the
garden is given by f xy x 40 x 40x x2. The domain of f is [0 40].
34. The area of Juanita’s garden is 250 ft2. Therefore xy 250 and y 250
x. The amount of fencing needed is given
by 2x 2y. Therefore, f 2x 2
250
x
2x 500
x. The domain of f is x 0.
35. The volume of the box is given by area of the base times the height of the box. Thus,
V f x 15 2x 8 2x x .
36. Because the volume of the box is the area of the base times the height of the box, we have V x2y 20. Thus, we
have y 20
x2. Next, the amount of material used in constructing the box is given by the area of the base of the box,
plus the area of the four sides, plus the area of the top of the box; that is, A x2 4xy x2 Then, the cost of
constructing the box is given by f x 030x2 040x 20
x2 020x2 05x2 8
x, where f x is measured in
dollars and f x 0.
Full file at https://testbankuniv.eu/Applied-Mathematics-for-the-Managerial-Life-and-Social-Sciences-7th-Edition-Tan-Solutions-Manual
Full file at https://testbankuniv.eu/Applied-Mathematics-for-the-Managerial-Life-and-Social-Sciences-7th-Edition-Tan-Solutions-Manual
Page 54
104 2 FUNCTIONS AND THEIR GRAPHS
37. Because the perimeter of a circle is 2πr , we know that the perimeter of the semicircle is πx . Next, the perimeter of
the rectangular portion of the window is given by 2y 2x so the perimeter of the Norman window is πx 2y 2x
and πx 2y 2x 28, or y 12 28 πx 2x. Because the area of the window is given by 2xy 1
2πx2, we
see that A 2xy 12πx2. Substituting the value of y found earlier, we see that
A f x x 28 πx 2x 12πx2 1
2πx2 28x πx2 2x2 28x 2 x2 2x2
28x π
2 2
x2.
38. The average yield of the apple orchard is 36 bushelstree when the density is 22 treesacre. Let x be the
unit increase in tree density beyond 22. Then the yield of the apple orchard in bushelsacre is given by
22 x 36 2x.
39. xy 50 and so y 50
x. The area of the printed page is A x 1 y 2 x 1
50
x 2
2x5250
x,
so the required function is f x 2x 52 50
x. We must have x 0, x 1 0, and
50
x 2 2. The last
inequality is solved as follows:50
x 4, so
x
50 1
4, so x 50
4 252 . Thus, the domain is
1 25
2
.
40. a. Let x denote the number of bottles sold beyond 10,000 bottles. Then
P x 10,000 x 5 00002x 00002x2 3x 50,000.
b. He can expect a profit of P 6000 0000260002
3 6000 50,000 60,800, or $60,800.
41. a. Let x denote the number of people beyond 20 who sign up for the cruise. Then the revenue is
R x 20 x 600 4x 4x2 520x 12,000.
b. R 40 4402 520 40 12,000 26,400, or $26,400.
c. R 60 4602 520 60 12,000 28,800, or $28,800.
42. a. f r πr2.
b. g t 2t .
c. h t f g t f g t πg t
2 4πt2.
d. h 30 4π302 3600π, or 3600π ft2.
43. False. f x 3x34 x12 1 is not a polynomial function. The powers of x must be nonnegative integers.
44. True. If P x is a polynomial function, then P x P x
1and so it is a rational function. The converse is false.
For example, R x x 1
x 1is a rational function that is not a polynomial.
45. False. f x x12 is not defined for negative values of x .
46. False. A power function has the form xr , where r is a real number.
Full file at https://testbankuniv.eu/Applied-Mathematics-for-the-Managerial-Life-and-Social-Sciences-7th-Edition-Tan-Solutions-Manual
Full file at https://testbankuniv.eu/Applied-Mathematics-for-the-Managerial-Life-and-Social-Sciences-7th-Edition-Tan-Solutions-Manual
Page 55
2.7 FUNCTIONS AND MATHEMATICAL MODELS 105
Technology Exercises page 155
1. a. f t 185t 169.
b.
1 2 3 4 5 60
10
20
30
c.t y
1 188
2 206
3 225
4 243
5 262
6 280
These values are close to the given data.
d. f 8 185 8 169 317 gallons.
2. a. f t 00128t2 0109t 050.
b.
0 2 4 60
1
2
c.t y
0 050
3 094
6 161
7 189
These values are close to the given data.
3. a. f t 0221t2 414t 648.
b.
0 1 2 3 40
20
40
60
80
c. 778 million
4. a. f t 225x2 1341x 2176.
b.
0 1 2 30
50
100
5. a. f t 24t2 15t 314.
b.
0 1 2 3 40
50
100
6. a. f t 0038167t3 045713t2
019758t 82457.
b.
0 2 4 60
5
10
15
Full file at https://testbankuniv.eu/Applied-Mathematics-for-the-Managerial-Life-and-Social-Sciences-7th-Edition-Tan-Solutions-Manual
Full file at https://testbankuniv.eu/Applied-Mathematics-for-the-Managerial-Life-and-Social-Sciences-7th-Edition-Tan-Solutions-Manual
Page 56
106 2 FUNCTIONS AND THEIR GRAPHS
7. a. f t 000081t300206t20125t169.
b.
0 2 4 6 8 100
2
4
c.t y
1 18
5 27
10 42
The revenues were $18 trillion in 2001,
$27 trillion in 2005, and $42 trillion in 2010.
8. a. y 44,560t389,394t2234,633t273,288.
b.
0 1 2 30
5e+5
1e+6
1.5e+6
c.t f t
0 273,288
1 463,087
2 741,458
3 1,375,761
9. a. f t 00056t3 0112t2 051t 8.
b.
0 1 2 3 4 5 60
5
10
15
c.t 0 3 6
f t 8 104 139
10. a. f t 02t3 045t2 175t 226.
b.
0 1 2 3 4 50
5
10
15
c.t 0 1 2 3 4
f t 23 38 56 89 149
Full file at https://testbankuniv.eu/Applied-Mathematics-for-the-Managerial-Life-and-Social-Sciences-7th-Edition-Tan-Solutions-Manual
Full file at https://testbankuniv.eu/Applied-Mathematics-for-the-Managerial-Life-and-Social-Sciences-7th-Edition-Tan-Solutions-Manual
Page 57
2.7 FUNCTIONS AND MATHEMATICAL MODELS 107
11. a. f t 000125t4 00051t3
00243t2 0129t 171.
b.
0 1 2 3 4 50
1
2
c.t 0 1 2 3 4 5
f t 171 181 185 184 183 189
d. The average amount of nicotine in 2005 is
f 6 2128, or approximately
213 mgcigarette.
12. A t 0000008140t4 000043833t3 00001305t2 002202t 2612.
Full file at https://testbankuniv.eu/Applied-Mathematics-for-the-Managerial-Life-and-Social-Sciences-7th-Edition-Tan-Solutions-Manual
Full file at https://testbankuniv.eu/Applied-Mathematics-for-the-Managerial-Life-and-Social-Sciences-7th-Edition-Tan-Solutions-Manual
Page 58
108 2 FUNCTIONS AND THEIR GRAPHS
2.8 The Method of Least Squares
Concept Questions page 162
1. a. A scatter diagram is a graph showing the data points that describe the relationship between the two variables x
and y.
b. The least squares line is the straight line that best fits a set of data points when the points are scattered about a
straight line.
2. See page 158 of the text.
Exercises page 162
1. a. We first summarize the data.
x y x2 xy
1 4 1 4
2 6 4 12
3 8 9 24
4 11 16 44
Sum 10 29 30 84
b.
0
2468
10
1 2 3 4
12y
x
The normal equations are 4b 10m 29 and 10b 30m 84. Solving this system of equations, we obtain
m 23 and b 15, so an equation is y 23x 15.
2. a. We first summarize the data.
x y x2 xy
1 9 1 9
3 8 9 24
5 6 25 30
7 3 49 21
9 2 81 18
Sum 25 28 165 102
b.
0
2468
10
2 4 6 8 10x
y
The normal equations are 165m 25b 102 and 25m 5b 28. Solving, we find m 095 and b 1035,
so the required equation is y 095x 1035.
Full file at https://testbankuniv.eu/Applied-Mathematics-for-the-Managerial-Life-and-Social-Sciences-7th-Edition-Tan-Solutions-Manual
Full file at https://testbankuniv.eu/Applied-Mathematics-for-the-Managerial-Life-and-Social-Sciences-7th-Edition-Tan-Solutions-Manual
Page 59
2.8 THE METHOD OF LEAST SQUARES 109
3. a. We first summarize the data.
x y x2 xy
1 45 1 45
2 5 4 10
3 3 9 9
4 2 16 8
4 35 16 14
6 1 36 6
Sum 20 19 82 515
b.
0
1234567
1 2 3 4 5 6 x
y
The normal equations are 6b 20m 19 and 20b 82m 515. The solutions are m 07717 and
b 57391, so the required equation is y 0772x 5739.
4. a. We first summarize the data:
x y x2 xy
1 2 1 2
1 3 1 3
2 3 4 6
3 35 9 105
4 35 16 14
4 4 16 16
5 5 25 25
Sum 20 24 72 765
b.
0
12345
1 2 3 4 5
y
x
The normal equations are 72m 20b 765 and 20m 7b 24. Solving, we find m 053 and b 191. The
required equation is y 053x 191.
5. a. We first summarize the data:
x y x2 xy
1 3 1 3
2 5 4 10
3 5 9 15
4 7 16 28
5 8 25 40
Sum 15 28 55 96
b.
0
2468
1 2 3 4 5 x
y
The normal equations are 55m 15b 96 and 15m 5b 28. Solving, we find m 12 and b 2, so the
required equation is y 12x 2.
Full file at https://testbankuniv.eu/Applied-Mathematics-for-the-Managerial-Life-and-Social-Sciences-7th-Edition-Tan-Solutions-Manual
Full file at https://testbankuniv.eu/Applied-Mathematics-for-the-Managerial-Life-and-Social-Sciences-7th-Edition-Tan-Solutions-Manual
Page 60
110 2 FUNCTIONS AND THEIR GRAPHS
6. a. We first summarize the data:
x y x2 xy
1 8 1 8
2 6 4 12
5 6 25 30
7 4 49 28
10 1 100 10
Sum 25 25 179 88
b.
0
2
4
6
8
2 4 6 8 10 x
y
The normal equations are 5b 25m 25 and 25b 179m 88. The solutions are m 068519 and
b 84259, so the required equation is y 0685x 8426.
7. a. We first summarize the data:
x y x2 xy
1 436 1 436
2 438 4 876
3 428 9 1284
4 430 16 1720
5 426 25 2138
Sum 15 2158 55 6446
The normal equations are 5b 15m 2158 and
15b 55m 6446. Solving this system, we find m 28 and
b 440. Thus, the equation of the least-squares line is
y 28x 440.
b.
415420425430435440
y
0 1 2 3 4 5 x (years)
c. Two years from now, the average SAT
verbal score in that area will bey 28 7 440 4204, or
approximately 420.
8. a. We first summarize the data:
x y x2 xy
1 426 1 426
2 437 4 874
3 460 9 1380
4 473 16 1892
5 477 25 2385
Sum 15 2273 55 6957
The normal equations are 55m 15b 6957 and
15m 5b 2273. Solving, we find m 138 and b 4132, so
the required equation is y 138x 4132.
b.
420430440450460470480
0 1 2 3 4 5 x (years)
y ($million)
c. When x 6,
y 138 6 4132 496, so the
predicted net sales for the upcoming
year are $496 million.
Full file at https://testbankuniv.eu/Applied-Mathematics-for-the-Managerial-Life-and-Social-Sciences-7th-Edition-Tan-Solutions-Manual
Full file at https://testbankuniv.eu/Applied-Mathematics-for-the-Managerial-Life-and-Social-Sciences-7th-Edition-Tan-Solutions-Manual
Page 61
2.8 THE METHOD OF LEAST SQUARES 111
9. a.x y x2 xy
0 1545 0 0
1 3818 1 3818
2 6545 4 1309
3 845 9 2535
Sum 6 20358 14 42258
The normal equations are 4b 6m 20358 and
6b 14m 42258. The solutions are m 23442 andb 15732, so the required equation is y 2344x 1573.
b. The projected number of Facebook users is
f 7 2344 7 1573 17981, or approximately
17981 million.
10. a. We first summarize the data:
x y x2 xy
1 21 1 21
2 24 4 48
3 27 9 81
Sum 6 72 14 150
The normal equations are 3b 6m 72 and 6b 14m 15.
Solving the system, we find m 03 and b 18. Thus, the
equation of the least-squares line is y 03x 18.
b. The amount of money that
Hollywood is projected to spend in
2015 is approximately
03 5 18 33, or $33 billion.
11. a.x y x2 xy
0 253 0 0
1 334 1 334
2 395 4 79
3 50 9 150
4 596 16 2384
Sum 10 2078 30 5008
The normal equations are 5b 10m 2078 and
10b 30m 5008. The solutions are m 852 andb 2452, so the required equation is y 852x 2452.
b. The average rate of growth of the number of e-book readers
between 2011 and 2015 is projected to be approximately
852 million per year.
12. a.x y x2 xy
0 262 0 0
1 268 1 268
2 275 4 550
3 283 9 849
4 287 16 1148
Sum 10 1375 30 2815
The normal equations are 5b 10m 1375 and
10b 30m 2815. Solving this system, we find m 065
and b 262. Thus, an equation of the least-squares line is
y 065x 262.
b. The percentage of the population enrolled in college in 2014 is
projected to be 065 7 262 3075, or 3075 million.
Full file at https://testbankuniv.eu/Applied-Mathematics-for-the-Managerial-Life-and-Social-Sciences-7th-Edition-Tan-Solutions-Manual
Full file at https://testbankuniv.eu/Applied-Mathematics-for-the-Managerial-Life-and-Social-Sciences-7th-Edition-Tan-Solutions-Manual
Page 62
112 2 FUNCTIONS AND THEIR GRAPHS
13. a.x y x2 xy
1 261 1 261
2 272 4 544
3 289 9 867
4 311 16 1244
5 326 25 1630
Sum 15 1459 55 4546
The normal equations are 5b 15m 1459 and
15b 55m 4546. Solving this system, we find m 169
and b 2411. Thus, the required equation is
y f x 169x 2411.
b. The predicted global sales for 2014 are given by
f 8 169 8 2411 3763, or 376 billion.
14. a.x y x2 xy
1 959 1 959
2 917 4 1834
3 838 9 2514
4 782 16 3128
5 735 25 3675
Sum 15 4231 55 12110
The normal equations are 5b 15m 4231 and
15b 55m 1211. Solving this system, we find m 583
and b 10211. Thus, an equation of the least-squares line is
y 583x 10211.
b. The volume of first-class mail in 2014 is projected to be
583 8 10211 5547, or approximately 5547 billion
pieces.
15.x y x2 xy
0 820 0 0
1 847 1 847
2 868 4 1736
3 897 9 2691
4 918 16 3672
Sum 10 435 30 8946
The normal equations are 5b 10m 435 and
10b 30m 8946. The solutions are m 246 andb 8208, so the required equation is y 246x 821.
b. The estimated number of credit union members in 2013 isf 5 246 5 821 944, or approximately
944 million.
16. a.x y x2 xy
0 20 0 0
1 31 1 31
2 45 4 90
3 63 9 189
4 78 16 312
5 93 25 465
Sum 15 330 55 1087
The normal equations are 6b 15m 33 and
15b 55m 1087. Solving this system, we find m 150
and b 176, so an equation of the least-squares line is
y 15x 176.
b. The rate of growth of video advertising spending between
2011 and 2016 is approximated by the slope of the
least-squares line, that is $15 billionyr.
Full file at https://testbankuniv.eu/Applied-Mathematics-for-the-Managerial-Life-and-Social-Sciences-7th-Edition-Tan-Solutions-Manual
Full file at https://testbankuniv.eu/Applied-Mathematics-for-the-Managerial-Life-and-Social-Sciences-7th-Edition-Tan-Solutions-Manual
Page 63
2.8 THE METHOD OF LEAST SQUARES 113
17. a.x y x2 xy
0 64 0 0
1 68 1 68
2 71 4 142
3 74 9 222
4 76 16 304
Sum 10 353 30 736
The normal equations are 5b 10m 353 and
10b 30m 736. The solutions are m 03 and b 646,
so the required equation is y 03x 646.
b. The rate of change is given by the slope of the least-squares
line, that is, approximately $03 billionyr.
18. a.x y x2 xy
0 129 0 0
1 139 1 139
2 1465 4 293
3 1525 9 4575
4 1585 16 634
Sum 10 7255 30 15235
The normal equations are 5b 10m 7255 and
10b 30m 15235. The solutions are m 0725 andb 1306, so the required equation is y 0725x 1306.
b. y 0725 5 1306 16685, or approximately
$16685 million.
19. a.x y x2 xy
0 60 0 0
2 74 4 148
4 90 16 360
6 106 36 636
8 118 64 944
10 128 100 1280
12 150 144 1800
Sum 42 726 364 5168
The normal equations are 7b 42m 726 and
42b 364m 5168. The solutions are m 725 andb 6021, so the required equation is y 725x 6021.
b. y 725 11 6021 13996, or $13996 billion.
c. $725 billionyr.
20. a.t y t2 t y
0 138 0 0
1 144 1 144
2 149 4 298
3 156 9 468
4 161 16 644
5 167 25 835
6 174 36 1044
7 178 49 1246
Sum 28 1267 140 4679
The normal equations are 8b 28m 1267 and
28b 140 4679. The solutions are m 0058 andb 138, so the required equation is y 0058t 138.
b. The rate of change is given by the slope of the least-squares
line, that is, approximately $0058 trillionyr, or
$58 billionyr.
c. y 0058 10 138 196, or $196 trillion.
Full file at https://testbankuniv.eu/Applied-Mathematics-for-the-Managerial-Life-and-Social-Sciences-7th-Edition-Tan-Solutions-Manual
Full file at https://testbankuniv.eu/Applied-Mathematics-for-the-Managerial-Life-and-Social-Sciences-7th-Edition-Tan-Solutions-Manual
Page 64
114 2 FUNCTIONS AND THEIR GRAPHS
21. False. See Example 1 on page 159 of the text.
22. True. The error involves the sum of the squares of the form
f xi yi2
, where f is the least-squares function
and yi is a data point. Thus, the error is zero if and only if f xi yi for each 1 i n.
23. True.
24. True.
Technology Exercises page 166
1. y 23596x 38639 2. y 14068x 21241
3. y 11948x 35525 4. y 207715x 523847
5. a. y 25t 612 b. 487%
6. a. y 0305x 019 b. $0305 billionyr c. $324 billion
CHAPTER 2 Concept Review Questions page 168
1. ordered, abscissa (x-coordinate), ordinate (y-coordinate)
2. a. x-, y- b. third
3. a.y2 y1
x2 x1b. undefined c. zero d. positive
4. m1 m2, m1 1
m2
5. a. y y1 m x x1, point-slope form b. y mx b, slope-intercept
6. a. Ax ByC 0, where A and B are not both zero b. ab
7. domain, range, B 8. domain, f x, vertical, point
9. f x g x, f x g x,f x
g x, A B, A B, 0 10. g f x, f , f x, g
11. ax2 bx c, parabola, upward, downward, vertex, b2a , x b
2a .
12. a. P x anxn an1xn1 a1x a0, where an 0 and n is a positive integer
b. linear, quadratic c. quotient, polynomials d. xr , where r is a real number
Full file at https://testbankuniv.eu/Applied-Mathematics-for-the-Managerial-Life-and-Social-Sciences-7th-Edition-Tan-Solutions-Manual
Full file at https://testbankuniv.eu/Applied-Mathematics-for-the-Managerial-Life-and-Social-Sciences-7th-Edition-Tan-Solutions-Manual
Page 65
2 REVIEW 115
CHAPTER 2 Review Exercises page 168
1. An equation is x 2.
2. An equation is y 4.
3. The slope of L is m 72 4
3 2
782
5 1
10and an equation of L is y 4 1
10 [x 2] 110 x 1
5 , or
y 110 x 19
5 .
4. The line passes through the points 3 0 and 2 4, so its slope is m 4 0
2 3 4
5. An equation is
y 0 45 x 3, or y 4
5 x 125 .
5. Writing the given equation in the form y 52 x 3, we see that the slope of the given line is 5
2 . Thus, an equation is
y 4 52 x 2 , or y 5
2 x 9.
6. Writing the given equation in the form y 43 x 2, we see that the slope of the given line is 4
3 . Therefore, the
slope of the required line is 34 and an equation of the line is y 4 3
4 x 2 , or y 34 x 11
2 .
7. Using the slope-intercept form of the equation of a line, we have y 12 x 3.
8. Rewriting the given equation in slope-intercept form, we have 5y 3x 6, or y 35 x 6
5 . From this equation,
we see that the slope of the line is 35 and its y-intercept is 6
5 .
9. Rewriting the given equation in slope-intercept form, we have 4y 3x 8, or y 34 x 2, and we conclude
that the slope of the required line is 34 . Using the point-slope form of the equation of a line with the point 2 3
and slope 34 , we obtain y 3 3
4 x 2, so y 34 x 6
4 3 34 x 9
2 .
10. The slope of the line joining the points 3 4 and 2 1 is m 1 4
2 3 3
5. Using the point-slope
form of the equation of a line with the point 1 3 and slope 35 , we have y 3 3
5 [x 1], so
y 35 x 1 3 3
5 x 125 .
11. Rewriting the given equation in the slope-intercept form y 23 x 8, we see that the slope of the line with this
equation is 23 . The slope of the required line is 3
2 . Using the point-slope form of the equation of a line with the
point 24 and slope 32 , we have y 4 3
2 [x 2], or y 32 x 7.
Full file at https://testbankuniv.eu/Applied-Mathematics-for-the-Managerial-Life-and-Social-Sciences-7th-Edition-Tan-Solutions-Manual
Full file at https://testbankuniv.eu/Applied-Mathematics-for-the-Managerial-Life-and-Social-Sciences-7th-Edition-Tan-Solutions-Manual
Page 66
116 2 FUNCTIONS AND THEIR GRAPHS
12. 3x 4y 24. Setting x 0 gives y 6 as the
y-intercept. Setting y 0 gives x 8 as the
x-intercept.
_6
_4
_20
2
_2 2 4 6 8 10
y
x
13. 2x 5y 15. Setting x 0 gives 5y 15, or
y 3. Setting y 0 gives 2x 15, or x 152 .
_10
12
4
_10 _8 _6 _4 _2 2 4 x
y
3
14. 9 x 0 gives x 9, and the domain is 9].
15. 2x2 x 3 2x 3 x 1, and x 32 or 1. Because the denominator of the given expression is zero
at these points, we see that the domain of f cannot include these points and so the domain of f is 1,1 3
2
, and
32
.
16. a. f 2 3 22 5 2 2 0.
b. f a 2 3 a 22 5 a 2 2 3a2 12a 12 5a 10 2 3a2 17a 20.
c. f 2a 3 2a2 5 2a 2 12a2 10a 2.
d. f a h 3 a h2 5 a h 2 3a2 6ah 3h2 5a 5h 2.
17. a. From t 0 to t 5, the graph for cassettes lies above that for CDs, so from 1985 to 1990, the value of
prerecorded cassettes sold was greater than that of CDs.
b. Sales of prerecorded CDs were greater than those of prerecorded cassettes from 1990 onward.
c. The graphs intersect at the point with coordinates x 5 and y 35, and this tells us that the sales of the two
formats were the same in 1990 at the sales level of approximately $35 billion.
18. a.
_2
0
2y
_1 1 2 3 x
b. For each value of x 0, there are two values of y. We conclude
that y is not a function of x . (We could also note that the function
fails the vertical line test.)
c. Yes. For each value of y, there is only one value of x .
19.
0
2
y
_2 _1 1 2 3 x
3
1
20. a. f x g x 2x 3
x.
b.f x
g x 1
x 2x 3.
c. f g x 1
2x 3.
d. g f x 2
1
x
3 2
x 3.
Full file at https://testbankuniv.eu/Applied-Mathematics-for-the-Managerial-Life-and-Social-Sciences-7th-Edition-Tan-Solutions-Manual
Full file at https://testbankuniv.eu/Applied-Mathematics-for-the-Managerial-Life-and-Social-Sciences-7th-Edition-Tan-Solutions-Manual
Page 67
2 REVIEW 117
21. y 6x2 11x 10. The x-coordinate of the vertex is 1126 11
12
and the y-coordinate is 6
1112
2 11
1112
10 361
24 .
Therefore, the vertex is
1112 361
24
. Next, solving
6x2 11x 10 3x 2 2x 5 0 gives 23 and 5
2 as the
x-intercepts._10
0
10
_1 1 2 3 x
y
22. y 4x2 4x 3. The x-coordinate of the vertex is 424 1
2
and the y-coordinate is 4
12
2 4
12
3 4. Therefore, the
vertex is
12 4
. Next, solving 4x2 4x 3 0, we find
4x2 4x 3 2x 3 2x 1 0, so the x-intercepts are 12
and 32 . _15
_10
_50
5
_1 1 2 x
y
23. We solve the system 3x 4y 6, 2x 5y 11. Solving the first equation for x , we have 3x 4y 6
and x 43 y 2. Substituting this value of x into the second equation yields 2
4
3 y 2 5y 11, so
83 y 4 5y 11, 7
3 y 7, and y 3. Thus, x 43 3 2 4 2 2, so the point of intersection is
23.
24. We solve the system y 34 x 6, 3x 2y 3. Substituting the first equation into the second equation, we
have 3x 2
34 x 6
3, 3x 3
2 x 12 3, 32 x 9, and x 6. Substituting this value of x into the first
equation, we have y 34 6 6 21
2 . Therefore, the point of intersection is
6 212
.
25. We solve the system 7x 9y 11, 3x 6y 8. Multiplying the second equation by 13 , we have x 2y 8
3 .
Substituting this value of x into the first equation, we have 7
2y 83
9y 11. Solving this equation for y,
we have 14y 563 9y 11, 69y 33 56, and y 23
69 13 . Thus, x 2
13
8
3 2. The lines
intersect at2 1
3
.
26. Setting C x R x, we have 12x 20,000 20x , 8x 20,000, and x 2500. Next,
R 2500 20 2500 50,000, and we conclude that the break-even point is 2500 50000.
27. The slope of L2 is greater than that of L1. This tells us that if the manufacturer lowers the unit price for each model
clock radio by the same amount, the additional demand for model B radios will be greater than that for model A
radios.
28. The slope of L2 is greater than that of L1. This tells us that if the unit price for each model clock radio is raised by
the same amount, the manufacturer will make more model B than model A radios available in the market.
29. C 0 6, or 6 billion dollars; C 50 075 50 6 435, or 435 billion dollars; and
C 100 075 100 6 81, or 81 billion dollars.
Full file at https://testbankuniv.eu/Applied-Mathematics-for-the-Managerial-Life-and-Social-Sciences-7th-Edition-Tan-Solutions-Manual
Full file at https://testbankuniv.eu/Applied-Mathematics-for-the-Managerial-Life-and-Social-Sciences-7th-Edition-Tan-Solutions-Manual
Page 68
118 2 FUNCTIONS AND THEIR GRAPHS
30. Let x denote the time in years. Since the function is linear, we know that it has the form f x mx b.
a. The slope of the line passing through 0 24 and 5 74 is m 74 24
5 1. Since the line passes through
0 24, we know that the y-intercept is 24. Therefore, the required function is f x x 24.
b. In 2013 (when x 3), the sales were f 3 3 24 54, or $54 million.
31. Let x denote the number of units produced and sold.
a. The cost function is C x 6x 30,000.
b. The revenue function is R x 10x .
c. The profit function is P x R x C x 10x 30,000 6x 4x 30,000.
d. P 6000 4 6000 30,000 6,000, a loss of $6000; P 8000 4 8000 30,000 2,000, a profit of
$2000; and P 12,000 4 12,000 30,000 18,000, a profit of $18,000.
32. Let V denote the value of the building after t years.
a. The rate of depreciation is V
t 6,000,000
30 200,000, or $200,000year.
b. From part a, we know that the slope of the line is 200,000. Using the point-slope form of the equation of a line,
we have V 0 200,000 t 30, or V 200,000t 6,000,000. In the year 2018 (when t 10), we have
V 200,000 10 6,000,000 4,000,000, or $4,000,000.
33. The slope of the demand curve isp
x 10
200 005. Using the
point-slope form of the equation of a line with the point 0 200, we
have p 200 005 x, or p 005x 200.
0
50100150200
1000 2000 3000 4000 5000 x
y
34. The slope of the supply curve isp
x 100 50
2000 200 50
1800 1
36. Using the point-slope form of the equation of a
line with the point 200 50, we have p 50 136 x 200, so p 1
36 x 20036 50 1
36 x 160036 1
36 x 4009 .
35. D a
150. The given equation can be expressed in the form y mx b, where m a
150and b 0. If
a 500 and 35, D 35 500150 35 116 2
3 , or approximately 117 mg.
36. R 30 12 302 30 30 450, or $45,000.
37. a. The number of passengers in 1995 was N 0 46 (million).
b. The number of passengers in 2010 was N 15 0011 152 0521 15 46 1489 (million).
38. a. The life expectancy of a male whose current age is 65 is
f 65 00069502 652 16357 65 9376 1680, or approximately 168 years.
b. The life expectancy of a male whose current age is 75 is
f 75 00069502 752 16357 75 9376 1018, or approximately 1018 years.
Full file at https://testbankuniv.eu/Applied-Mathematics-for-the-Managerial-Life-and-Social-Sciences-7th-Edition-Tan-Solutions-Manual
Full file at https://testbankuniv.eu/Applied-Mathematics-for-the-Managerial-Life-and-Social-Sciences-7th-Edition-Tan-Solutions-Manual
Page 69
2 REVIEW 119
39. The life expectancy of a female whose current age is 65 is
C 65 00053694 652 14663 65 9274 201 (years).
The life expectancy of a female whose current age is 75 is
C 75 00053694 752 14663 75 9274 130 (years).
40. N 0 200 4 012 400, and so there are 400 members initially. N 12 200 4 1212 800, and so
there are 800 members after one year.
41. The population will increase by P 9 P 0 50,000 30 932 20 9 50,000, or 990, during the next
9 months. The population will increase by P 16 P 0 50,000 30 1632 20 16 50,000, or
2240 during the next 16 months.
42. T f n 4n
n 4. f 4 0, f 5 20
1 20,
f 6 24
2 339, f 7 28
3 485,
f 8 32
4 64, f 9 36
5 805, f 10 40
6 98,
f 11 44
7 116, and f 12 48
8 1358.
0
40
80
120
2 4 6 8 10 12 n
T
43. a. f t 267 and g t 2t2 46t 733.
b. h t f g t f t g t 267 2t2 46t 733 2t2 46t 1000.
c. h 13 2 132 46 13 1000 1936, or 1936 tons.
44. We solve 11x2 15x 40 01x2 05x 15, obtaining 12x2 x 25 0, 12x2 10x 250 0,
6x2 5x 125 0, and x 5 6x 25 0. Therefore, x 5. Substituting this value of x into the second
supply equation, we have p 01 52 05 5 15 20. So the equilibrium quantity is 5000 and the equilibrium
price is $20.
45. a. V 43πr3, so r3 3V
4πand r f V 3
3V
4π.
b. g t 92πt .
c. h t f g t f g t
3g t
4π
13
3 9πt
4π 2
13
32
3
t .
d. h 8 32
3
8 3, or 3 ft.
46. a. P 0 598, P 1 03 1 586 589,
P 2 5679 2006 592, P 3 5679 3006 607, and
P 4 5679 4006 617.
c. P 3 607, or 607%.
b.
58
60
62
0 1 2 3 4 t (year)
P (%)
Full file at https://testbankuniv.eu/Applied-Mathematics-for-the-Managerial-Life-and-Social-Sciences-7th-Edition-Tan-Solutions-Manual
Full file at https://testbankuniv.eu/Applied-Mathematics-for-the-Managerial-Life-and-Social-Sciences-7th-Edition-Tan-Solutions-Manual
Page 70
120 2 FUNCTIONS AND THEIR GRAPHS
47. Measured in inches, the sides of the resulting box have length 20 2x and its height is x , so its volume is
V x 20 2x2 in3.
48. Let h denote the height of the box. Then its volume is V x 2x h 30, so that h 15
x2 . Thus, the cost is
C x 30 x 2x 15 [2xh 2 2x h] 20 x 2x
60x2 15 6xh 40x2 100x2 15 6 x
15
x2
100x2 1350
x.
CHAPTER 2 Before Moving On... page 171
1. m 5 2
4 1 7
5, so an equation is y 2 7
5 [x 1]. Simplifying, y 75 x 7
5 2, or y 75 x 3
5 .
2. m 13 and b 4
3 , so an equation is y 13 x 4
3 .
3. a. f 1 2 1 1 3. b. f 0 2. c. f
32
32
2 2 174 .
4. a. f g x f x g x 1
x 1 x2 1. b. f g x f x g x x2 1
x 1.
c. f g x f g x 1
g x 1 1
x2 2. d. g f x g f x f x
2 1
1
x 12 1.
5. 4x h 108, so h 108 4x . The volume is V x2h x2 108 4x 108x2 4x3.
CHAPTER 2 Explore & Discuss
Page 75
Refer to the accompanying figure. Observe that triangles P1Q1 P2 and
P3Q2 P4 are similar. From this we conclude that
m y2 y1
x2 x1 y4 y3
x4 x3. Because P3 and P4 are arbitrary, the conclusion
follows.
x0
PÁ
y
P£
P¢Pª
QªQÁ
Page 82
In Example 7, we are told that the object is expected to appreciate in value at a given rate for the next five years, and the
equation obtained in that example is based on this fact. Thus, the equation may not be used to predict the value of the
object very much beyond five years from the date of purchase.
Full file at https://testbankuniv.eu/Applied-Mathematics-for-the-Managerial-Life-and-Social-Sciences-7th-Edition-Tan-Solutions-Manual
Full file at https://testbankuniv.eu/Applied-Mathematics-for-the-Managerial-Life-and-Social-Sciences-7th-Edition-Tan-Solutions-Manual
Page 71
2 EXPLORING WITH TECHNOLOGY 121
Page 111
1. g f x g f x f x 1
2 x 1
12
x2 x and
f g x f g x g x 1 x 12 1 x 1 1 x .
2. From the figure, we see that the graph of one is the mirror
reflection of the other if we place a mirror along the line y x .
0
1
2
3
y
1 2 3 x
f
g
y=x
CHAPTER 2 Exploring with Technology
Page 80
1.
-10 -5 0 5 10-10
0
10 The straight lines L1 and L2 are shown in the figure.
a. L1 and L2 seem to be parallel.
b. Writing each equation in the slope-intercept form gives
y 2x 5 and y 4120 x 11
20 , from which we see that
the slopes of L1 and L2 are 2 and 4120 205,
respectively. This shows that L1 and L2 are not parallel.
2.
-10 -5 0 5 10-10
0
10 The straight lines L1 and L2 are shown in the figure.
a. L1 and L2 seem to be perpendicular.
b. The slopes of L1 and L2 are m1 12 and m2 5,
respectively. Because m1 1
2 1
5 1
m2, we see
that L1 and L2 are not perpendicular.
Full file at https://testbankuniv.eu/Applied-Mathematics-for-the-Managerial-Life-and-Social-Sciences-7th-Edition-Tan-Solutions-Manual
Full file at https://testbankuniv.eu/Applied-Mathematics-for-the-Managerial-Life-and-Social-Sciences-7th-Edition-Tan-Solutions-Manual
Page 72
122 2 FUNCTIONS AND THEIR GRAPHS
Page 81
1.
-10 -5 0 5 10-10
0
10
The straight lines with the given equations are shown
in the figure. Changing the value of m in the equation
y mx b changes the slope of the line and thus
rotates it.
2.
-10 -5 0 5 10-10
0
10
The straight lines of interest are shown in the figure.
Changing the value of b in the equation y mx b
changes the y-intercept of the line and thus translates it
(upward if b 0 and downward if b 0).
3. Changing both m and b in the equation y mx b both rotates and translates the line.
Page 971.
-3 -2 -1 0 1 2 3
-2
0
2
4
6 2.
-4 -2 0 2 4
0
2
4
6
83.
-4 -2 0 2 4
-5
0
5
4. The graph of f x c is obtained by translating the graph of f along the y-axis by c units. The graph of f x c
is obtained by translating the graph of f along the x-axis by c units. Finally, the graph of c f is obtained from that of
f by “expanding”(if c 1) or “contracting”(if 0 c 1) that of f . If c 0, the graph of c f is obtained from that
of f by reflecting it with respect to the x-axis as well as expanding or contracting it.
Page 120
1.
-10 -5 0 5 10-10
0
10
Plotting the straight lines L1 and L2 and using
TRACE and ZOOM repeatedly, you will see that the
iterations approach the answer 1 1. Using the
intersection feature of the graphing utility gives the
result x 1 and y 1 immediately.
2. Substituting the first equation into the second yields
3x 2 2x 3, so 5x 5 and x 1.
Substituting this value of x into either equation gives
y 1.
3. The iterations obtained using TRACE and ZOOM
converge to the solution 1 1. The use of the
intersection feature is clearly superior to the first
method. The algebraic method also yields the
desired result easily.
Full file at https://testbankuniv.eu/Applied-Mathematics-for-the-Managerial-Life-and-Social-Sciences-7th-Edition-Tan-Solutions-Manual
Full file at https://testbankuniv.eu/Applied-Mathematics-for-the-Managerial-Life-and-Social-Sciences-7th-Edition-Tan-Solutions-Manual
Page 73
2 EXPLORING WITH TECHNOLOGY 123
Page 123
1.
-10 -5 0 5 10-10
0
10
The lines seem to be parallel to each other and do
not appear to intersect.
2.
-100 -50 0 50 100-100
0
100
They appear to intersect. But finding the point
of intersection using TRACE and ZOOM with any
degree of accuracy seems to be an impossible
task. Using the intersection feature of the
graphing utility yields the point of intersection
4081 immediately.
3. Substituting the first equation into the second gives 2x 1 21x 3, 4 01x , and thus x 40. The
corresponding y-value is 81.
4. Using TRACE and ZOOM is not effective. The intersection feature gives the desired result immediately. The algebraic
method also yields the answer with little effort and without the use of a graphing utility.
Full file at https://testbankuniv.eu/Applied-Mathematics-for-the-Managerial-Life-and-Social-Sciences-7th-Edition-Tan-Solutions-Manual
Full file at https://testbankuniv.eu/Applied-Mathematics-for-the-Managerial-Life-and-Social-Sciences-7th-Edition-Tan-Solutions-Manual